Abstract
This study presents a comprehensive techno-economic assessment of offshore wind projects in the Colombian Caribbean, emphasizing the impact of site-specific parameters on development costs and performance. Wind resource conditions were evaluated in four coastal regions (La Guajira, Magdalena, Atlántico, and Bolívar) using hourly meteorological data from 2015 to 2024, adjusted to 100 m above ground level through logarithmic and power law wind profile models. The analysis included wind speed, bathymetry, distance to shore, distance to substation, foundation type, wind power density (WPD), and capacity factor (Cf). Based on these parameters, annual energy generation was estimated, and both capital expenditures (CAPEX) and operational expenditures (OPEX) were calculated, considering the technical and cost differences between fixed and floating foundations. Results show that La Guajira combines excellent wind conditions (WPD of 796 W/m2 and Cf of 61.5%) with favorable construction feasibility (bathymetry of −32 m), resulting in the lowest CAPEX among the studied regions. In contrast, Magdalena and Atlántico, with bathymetries exceeding 200 m, require floating foundations that more than double the investment costs. Bolívar presents an intermediate profile, offering solid wind potential and fixed foundation feasibility at a moderate cost. The findings confirm that offshore wind project viability depends not only on wind resource quality but also on physical site constraints, which directly influence the cost structure and energy yield. This integrated approach supports more accurate project prioritization and contributes to strategic planning for the sustainable deployment of offshore wind energy in Colombia.
1. Introduction
Offshore wind energy has become a key component of the global energy transition due to its high generation potential and reduced land use impact compared with onshore wind farms [1,2]. With onshore wind resources already extensively exploited, offshore development offers significant advantages such as higher wind speeds and greater stability, which improve wind turbine efficiency [3]. In Europe, countries including the United Kingdom, Denmark, and the Netherlands have led offshore wind farm deployment, supported by substantial investments in technology and regulatory frameworks that enhance competitiveness [4,5]. Despite economic and technological challenges, offshore wind power offers a valuable opportunity to diversify national energy mixes and reduce greenhouse gas emissions in line with global decarbonization goals. Recent work underscores that offshore deployment in emerging economies depends not only on physical resource quality but also on policy, finance, and technology transfer frameworks that shape feasibility and timelines [6].
Several studies across Europe, the United States, China, and the Mediterranean have analyzed wind speed patterns, interannual variability, and capacity factors using reanalysis datasets and numerical models. These studies confirm the stability and viability of offshore wind resources and have helped identify high potential areas for project development, supporting more accurate planning and reduced environmental impacts [7,8,9,10]. This study builds on this literature by providing new insights into offshore wind resource characteristics and their implications for project feasibility in an emerging market context.
In Latin America, Colombia stands out as one of the countries with significant offshore wind potential. The Colombian Caribbean, in particular, exhibits favorable climatic and geographic conditions, with an estimated potential of 109 GW, of which approximately 50 GW are located in designated exploration zones across the departments of La Guajira, Magdalena, Atlántico, and Bolívar [11]. Several studies have highlighted the technical feasibility of offshore wind projects in these areas and their relevance for clean energy generation [12,13,14,15].
Prior work in Colombia and the broader region has emphasized wind climatology, resource mapping, or multicriteria screening, which is useful for delineating candidate offshore zones but rarely quantifies how hub height variability at 100 m propagates to turbine performance and to costs conditioned by bathymetry and export distance. In Colombia, many assessments still focus on onshore development and site identification [16]. Offshore focused studies confirm promising conditions along the Caribbean coast, for example, the evaluation at four strategic locations in [14] and GIS/FAHP-based screening that prioritizes La Guajira, Magdalena, and Atlántico [15,17], yet these studies remain at the screening stage and provide limited evidence on expected capacity factor or annual generation at the department level that would support techno-economic comparison. Meanwhile, international studies increasingly apply machine learning and hybrid time series models to improve offshore wind reconstruction and forecasting, reporting error reductions over baseline reanalysis or single-model approaches [18,19,20], but their application to the Colombian Caribbean is still limited.
Complementary statistical studies report wind persistence and power density in La Guajira [21,22], and comparative analyses from other regions offer useful external benchmarks [23,24]. A review of wind speed probability distributions refines parameterization for yield estimation [25], and sectoral roadmaps acknowledge the relevance of offshore wind in broader energy transition strategies [26]. Nevertheless, prior work in Colombia has emphasized onshore alternatives in planning and policy, and comprehensive feasibility assessments for offshore deployments remain limited, reinforcing the need to integrate resource characterization with techno-economic analysis before large-scale initiatives are launched [27,28]. In particular, few studies couple bathymetry and distance to shore with foundation selection and transmission choice or compare departments within a unified framework that links 100 m resource variability to capacity factor, energy yield, CAPEX, and OPEX.
Against this backdrop, the study addresses key gaps by quantitatively linking hub height wind variability to turbine performance and to a cost structure conditioned by site parameters. Hub height winds are derived from ERA5 at 100 m, resource metrics are computed with a consistent Weibull-based approach, and energy yield and capacity factor are modeled using a documented turbine specification. Bathymetry and distance to shore are translated into foundation selection and HVAC transmission, and these choices are linked to differentiated CAPEX and OPEX. The resulting comparison across La Guajira, Magdalena, Atlántico, and Bolívar provides a unified, reproducible baseline that identifies tradeoffs between resource potential and investment costs and supports spatial prioritization, with assumptions and cost sensitivities kept transparent and transferable to similar Latin American coastlines.
The literature on offshore wind has advanced resource characterization, forecasting, and cost evaluation across multiple regions. For example, studies report measurable gains in reconstruction and forecasting skill and examine siting and system implications at regional scales [29,30]. This study complements this body of research by coupling hub height (100 m) wind characterization with turbine performance modeling and an explicit cost layer that links bathymetry and export distance to technology choice (foundation type and HVAC). In contrast to screening-focused approaches, the analysis provides department-level evidence that connects Weibull parameters, wind power density, capacity factor, and annual generation to CAPEX and OPEX within a single workflow for an emerging market.
The remainder of this paper is organized as follows. Section 2 describes the study area, the ERA5 reanalysis adjusted to 100 m, the methods used for wind characterization and for modeling energy yield and capacity factor, and the techno-economic setup (site constraints, foundation typology, and CAPEX and OPEX scenarios). Section 3 presents the results by department and a comparative analysis. Section 4 concludes with implications for spatial prioritization and planning, and outlines limitations and future work.
2. Materials and Methods
The methodological framework adopted in this study integrates wind resource characterization, energy estimation, cost modeling, and techno-economic assessment. As depicted in Figure 1, the process begins with the acquisition of ERA5 reanalysis data, from which a Reference Wind Year (RWY) is constructed to represent the long-term wind conditions in the study area. After extrapolating 10 m winds to 100 m using logarithmic and power law profiles and adjusting for air density, the Weibull distribution parameters were estimated from the hub height wind time series. These parameters enable the calculation of key performance indicators such as gross wind turbine output (Gw,t), capacity factor (Cf), and wind power density (WPD).
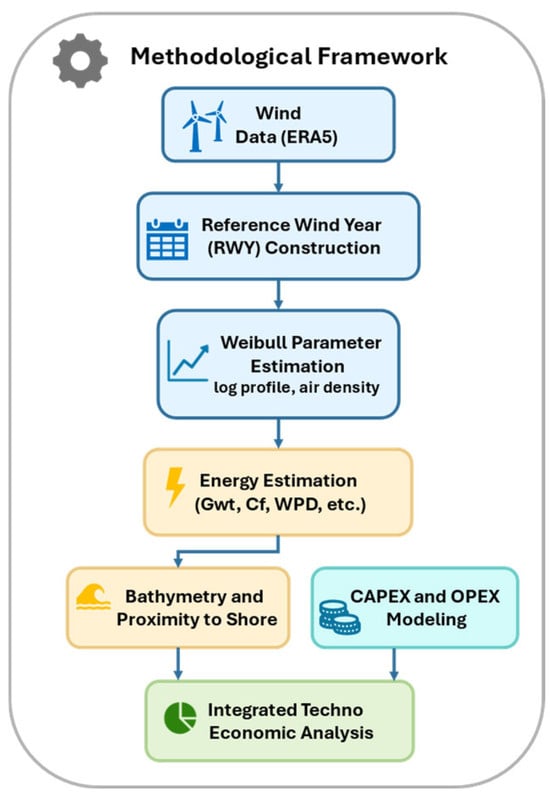
Figure 1.
Methodological framework for the techno-economic assessment of offshore wind projects.
This energy estimation is complemented by the characterization of site-specific constraints, including bathymetry and distance to shore, as well as capital and operational expenditures (CAPEX and OPEX) derived from parametric models. Finally, these inputs are integrated into a techno-economic assessment to evaluate the feasibility of offshore wind deployment in the selected regions. The framework ensures a consistent and reproducible approach that can be adapted to different geographic contexts and technological configurations.
2.1. Study Area and Datasets
This study focuses on four departments in the Colombian Caribbean region (La Guajira, 12.325° N, 72.067° W; Magdalena, 11.210° N, 74.371° W; Atlántico, 10.999° N, 75.196° W; and Bolívar, 10.906° N, 75.456° W), previously identified as high potential zones for offshore wind development [11,31]. These locations were selected based on a geospatial prioritization framework tailored to the region and aligned with national and regional planning instruments that support prefeasibility studies in these areas [17,32].
Meteorological data were obtained from the ERA5 reanalysis database (European Centre for Medium-Range Weather Forecasts, Copernicus Climate Data Store), covering the period from 2015 to 2024 at 10 m height and hourly resolution [33,34]. The selected variables include wind speed (Ws,t), wind direction (Wd,t), air temperature (T), and surface pressure (p). These parameters are essential for offshore wind resource assessment. Wind speed and direction govern turbine power generation, while temperature and pressure are required to compute air density, a key variable in energy yield calculations.
ERA5 was selected for its hourly, multiyear coverage over offshore and near-coastal grids and its documented skill in reproducing coastal wind climatologies in the Colombian Caribbean. Where comparable coastal station records exist, prior studies report small mean biases and high correlations at monthly scales, supporting the use of ERA5 for climatological screening of offshore wind resources in this region [32]. In the absence of consistent offshore in situ measurements at the selected sites, ERA5 serves as the primary wind field; aggregation and quality control steps are applied to mitigate local biases. Figure 2 presents the daily average wind speeds across the four departments. While 10 m data provide a consistent climatological overview, the 100 m hub-height wind field used for energy yield estimates is described in Section 2.2.
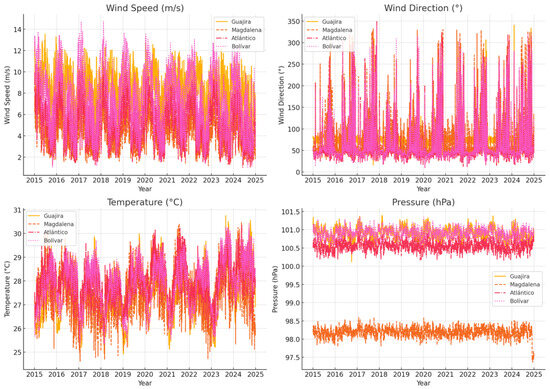
Figure 2.
Average daily climatological data at 10 m (2015–2024) for wind speed, wind direction, temperature, and pressure at coastal points in La Guajira, Magdalena, Atlántico, and Bolívar.
The time series were processed using the Reference Wind Year (RWY) approach to generate a statistically representative year for downstream modeling [31,35]. For each calendar month, the year that minimized the Finkelstein and Schafer (FS) distance to the multiyear empirical distribution was selected. The twelve selected months together define the RWY, as summarized in Table 1.

Table 1.
Year selected for each calendar month in the Reference Wind Year (RWY), 2015–2024.
2.2. Hub Height Winds and Performance Modeling
The instantaneous wind power output, Gw,t, was computed using Equation (1) [36,37]. In this expression, ρ is the air density (affected by altitude and temperature), S is the rotor swept area, and Ws,t is the wind speed at time t. To obtain the turbine output, electrical and mechanical loss coefficients of 11% (Le) and 6% (Lm) were applied to the theoretical power curve derived from the wind power equation [38]. These coefficients act as correction factors to account for transmission, generator, and mechanical friction losses, allowing the model to reproduce the actual wind generation performance of the turbine. This procedure is consistent with the methodology adopted in CFD and analytical studies where mechanical power is first estimated and subsequently corrected to obtain the electrical power curve [39,40,41]. The power coefficient Cp typically ranges from 0.40 to 0.50 [42], and XW denotes the rated power of the wind turbine.
The calculation requires the cut in, rated, and cut out wind speeds (Ws,min, Ws,nom, and Ws,max), as specified by the manufacturer (see Table 2). Figure 3 presents the characteristic power curve of the NREL 5 MW offshore reference turbine, which is used to convert wind speed to hourly electrical output [43,44,45].

Table 2.
NREL 5 MW offshore reference turbine parameters used in the study.
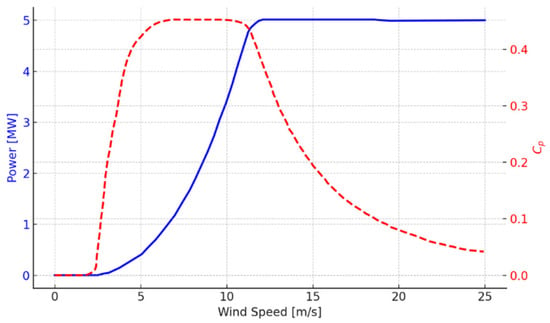
Figure 3.
Power curve and power coefficient of the NREL 5 MW offshore reference wind turbine.
The NREL 5 MW reference turbine was selected because its aerodynamic and structural parameters are representative of commercial-scale offshore units widely used for feasibility and comparative assessments. With a rated wind speed of 11.4 m/s and a rotor diameter of 126 m, this turbine operates efficiently in the 8 to 13 m/s range that characterizes the most frequent wind speed intervals in the Colombian Caribbean. The corresponding mean wind power densities (400 to 600 W/m2) are consistent with IEC Class I to II conditions typically assumed for this reference design. Similar applications of this reference model in preliminary site evaluations for emerging offshore markets confirm its suitability as a baseline for both technical and economic analysis [46,47].
Consequently, meteorological data at typical wind turbine hub heights (100 to 160 m) were adjusted to account for stronger and more stable wind regimes, thereby maximizing Gw,t [48,49,50]. To extrapolate wind speeds Ws,t to the 100 m hub height, both the logarithmic and the power law (exponential) profiles were applied, following approaches validated in coastal and offshore studies. The logarithmic formulation, grounded in Monin Obukhov similarity theory, provides a physically consistent description of the marine surface layer and has been confirmed through long-term observations at the Høvsøre coastal site [51]. The power law model, originally proposed by Hsu for marine and coastal conditions [52,53], remains a practical alternative when stability parameters are not available, using a shear exponent α typically between 0.10 and 0.16. Comparative assessments for Mediterranean and tropical coastal environments show that, when local roughness and shear are characterized, both models provide consistent results up to 100 m with deviations below 5% [54,55]. This evidence supports the combined application of both formulations under the coastal atmospheric regime of the Colombian Caribbean.
The roughness exponent α, defined in Equation (2), is a key parameter in the logarithmic wind profile model. It governs how wind speed varies with height over a given surface, depending on atmospheric stability and terrain characteristics. In this equation, Uref denotes the wind speed at the reference height Zref. The values obtained for each region were: La Guajira (α = 0.165), Magdalena (α = 0.195), Atlántico (α = 0.149), and Bolívar (α = 0.186).
The roughness length Z0, which quantifies terrain irregularities and their effect on the vertical wind profile, was computed using Equation (3), where Z denotes the target height and Zref denotes the reference height:
Wind speed data at 10 m were extrapolated to 100 m height using both logarithmic and power law profiles. For this purpose, the surface roughness length (Z0) and the wind shear exponent (α) were estimated for each region based on near-surface wind data. These parameters support consistent vertical profiling of wind speed across all sites.
The adjusted wind speed at height Z was then computed using Equation (4), which transforms wind speed data from a known reference height Zref based on the logarithmic profile model. This step is critical in wind energy assessments as turbine power output is highly sensitive to wind speed at hub height.
To estimate the air density (ρ) at different heights, Equation (5) was applied, incorporating atmospheric pressure (p) and temperature (T) [56,57]. These parameters are essential for accurately characterizing the wind resource and refining turbine performance models under varying environmental conditions.
where R is the specific gas constant for dry air (287 J kg−1 K−1). The constant 3.4837 arises from expressing R with pressure in kPa and temperature in K.
Atmospheric pressure at height z(m) was estimated using a second-order polynomial derived from the International Standard Atmosphere, which represents the nonlinear decrease in pressure with increasing altitude and is suitable for coastal elevations [58,59]:
Air density ρ was computed using Equation (5) with ERA5 temperature and pressure. Relative humidity was not included explicitly because, under typical tropical marine conditions in the study area (RH 70 to 85% and T ≈ 26 to 28 °C), the moist air correction changes ρ by about 0.5 to 1% relative to the dry air value, which is smaller than the variability driven by temperature and pressure and does not affect the comparative results across departments. This simplified approach provides adequate accuracy for regional-scale offshore wind assessments, as confirmed by comparative analyses in coastal studies [60,61,62].
Temperature at different heights was estimated using Equation (7), based on a regression model developed specifically for the Colombian Caribbean region [63]. This equation assumes a vertical thermal gradient of 5.89 °C per km, which reflects the average atmospheric lapse rate observed in the area. In this model, Y represents the annual mean temperature (°C), and X is the altitude in meters.
To characterize wind speed variability and support energy production modeling, the Weibull distribution was applied. This probabilistic model is widely used in wind resource assessments due to its ability to represent wind speed distributions across different terrains and climatic conditions [64,65]. The probability density function is given by Equation (8), and the cumulative distribution function is given by Equation (9), where k is the shape parameter and c is the scale parameter of the distribution.
The Maximum Likelihood Method (MLM) was selected for estimating the Weibull parameters (k and c) as it provides a statistically consistent and unbiased fit of wind speed distributions. In practice, this method yields lower root mean square error (RMSE) between observed and theoretical frequencies and produces stable estimates for large datasets, regardless of the range or variability of wind speeds [64,66]. Comparative assessments conducted in the Colombian Caribbean [66] and other international studies showed that iterative numerical approaches such as MLM and its modified form (MMLM) achieve lower χ2 and relative RMSE values (typically <10%) and higher coefficients of determination (R2 > 0.99) compared with empirical and graphical methods [64,67,68,69,70]. These findings support the use of MLM for wind resource characterization in coastal and offshore environments with variable wind conditions.
To mitigate known biases when applying MLM to intermittent hourly records, parameters were estimated using multiyear hourly samples rather than binned histograms, and goodness of fit was checked against the empirical cumulative distribution, with an emphasis on the upper tail that drives energy yield. As a robustness check, alternative estimators such as the method of moments and least squares were also considered; the resulting parameter differences do not alter the interdepartment capacity factor comparisons. The MLM estimators for k and c are given in Equations (10) and (11), where N is the number of observations. This estimation procedure minimizes the root mean square error between empirical and modeled distributions and improves agreement in the upper tail.
Wind Power Density (WPD), which quantifies the available wind energy per unit area, was calculated from the fitted Weibull parameters (Equation (12)). This indicator is widely used for comparing wind energy potential across sites. In this expression, Γ denotes the gamma function.
Table 3 summarizes the standard WPD classification reported in the literature, at a reference height of 50 m above ground level. This classification provides a qualitative interpretation of the wind resource based on WPD values [12,71,72].

Table 3.
Standard wind power density (WPD) classification at 50 m above ground level.
This classification helps identify the most suitable areas for wind turbine deployment, emphasizing locations with WPD values above 400 W/m2 as highly favorable for offshore wind projects.
The capacity factor (Cf) is a key metric for evaluating wind turbine performance. It is defined as the ratio of the actual energy generated over a period to the rated energy output of the turbine. This indicator is essential for assessing both the technical and economic feasibility of wind power projects, guiding the selection of turbine models based on site-specific wind conditions [73]. A Cf above 30% is generally considered acceptable, while values exceeding 40% are desirable to ensure economic viability [74,75].
Reported Cf values show considerable geographical variation. According to WindEurope [76], projected values include 42% in Spain, 27.3% in France, 48.7% in Germany, 26.1% in the Netherlands, and 35.7% in Denmark. On a global scale, IRENA [77] reports average capacity factors of 41% in the United States, 50% in Norway, 40% in South Korea, and 30% in Japan. In the United Kingdom, Lorentzen et al. [78] estimate an average of 37%, while Fernández [79] proposes a global mean of 41%, reinforcing the competitiveness of offshore wind within the global energy mix.
Given this variability, accurate estimation methods are required. Among the available approaches, the quadratic model in Equation (13) is recommended because it balances accuracy and simplicity and provides a reliable fit to turbine power curves [80]. In this equation, γ denotes the incomplete gamma function.
These performance metrics (WPD and Cf) provide a robust basis for evaluating the technical feasibility of offshore wind projects. However, a comprehensive assessment also requires linking wind resource variability to economic performance. In particular, site-specific parameters such as bathymetry, distance to shore, and foundation type directly influence capital expenditures (CAPEX) and operational expenditures (OPEX). The next section integrates wind resource characterization with cost modeling to examine the techno-economic viability of offshore wind deployment in the Colombian Caribbean.
2.3. Integrated Techno-Economic Assessment
From a techno-economic perspective, capital expenditures (CAPEX) per installed megawatt (MW) in offshore wind projects depend primarily on three factors: wind farm size, the high voltage transmission technology employed (alternating current, HVAC, or direct current, HVDC), and site-specific conditions such as water depth and distance to shore [45].
The selection between fixed and floating foundations is primarily driven by bathymetry. Fixed structures, including monopiles and jackets, are typically viable at depths up to 50 m. Beyond this depth, floating platforms such as semisubmersibles or tension leg platforms (TLPs) are required, as fixed solutions become structurally or economically infeasible [81,82]. Figure 4 summarizes the technical boundary conditions adopted in this study, which shows the feasibility zones for fixed and floating installations along the Colombian coastline.
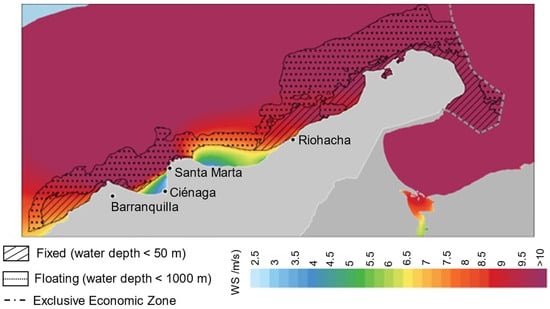
Figure 4.
Technical estimation of fixed and floating offshore wind foundations in Colombia.
In terms of transmission systems, HVAC is commonly used for nearshore projects (less than or equal to 100 km), while HVDC is preferred for longer distances (greater than 100 km) or higher capacities (greater than 300 MW), owing to its lower energy losses [83]. Since all sites considered in this analysis are located within 30 km of the coastline, HVAC configurations are assumed for CAPEX estimation purposes. In shallow nearshore routes typical of this study (≤30 km and depths < 50 m), recent offshore engineering benchmarks indicate that wave- and current-driven installation constraints can add about 3–5% to the export cable supply, laying, burial, and weather standby costs for HVAC systems. This increment lies within the ±20% CAPEX sensitivity adopted here, so no additional uplift was applied [83,84].
Reference cost data for offshore wind farms were compiled from the literature and adjusted to Colombian bathymetric conditions. These values are presented in Table 4 and are used as baseline inputs in the CAPEX model to distinguish between fixed and floating foundation types. Operating expenditures (OPEX), including maintenance, administration, insurance, and royalties, were assumed to represent 2% of CAPEX per year, consistent with established practices in offshore wind development [45].

Table 4.
Capital cost inputs (CAPEX) for offshore wind projects using HVAC transmission.
For deepwater sites requiring floating foundations, several references indicate higher operation and maintenance needs due to moorings, dynamic export and array cables, and tow to port interventions, with indicative annual OPEX in the range of 2.5 to 3.5% of CAPEX [45,46,47,77]. Given that the cross-regional differences reported here are dominated by CAPEX and capacity factor, modest OPEX uplifts within this range do not change the comparative ordering of sites. A formal sensitivity analysis is identified as future work and is noted in Section 4 (Conclusions).
The cost model uses internationally recognized benchmarks for offshore wind, primarily NREL’s 2024 Cost of Wind Energy Review and BVG Associates’ Guide to an Offshore Wind Farm [46,47]. To ensure representativeness for nearshore Colombian deployments, benchmark values are mapped to site conditions typical of the study areas, that is, bathymetry within fixed-bottom and early floating thresholds and export distances under approximately 30 km, which are consistent with HVAC transmission in the benchmark sources. Potential local deviations relative to North American and European contexts (labor and installation costs, logistics and transport given limited domestic manufacturing, early-stage development, and contingency items) are handled through a targeted sensitivity screening rather than fixed multipliers. Specifically, CAPEX is varied by ±20%, and OPEX is set between 1% and 3% of CAPEX around the benchmark values, which reflects plausible Colombian adjustments while preserving cross-regional comparability [46,47]. Costs are reported in constant 2024 USD, and all items assume HVAC given export distances below 30 km in the study sites.
Regulatory Assumptions and Modeling Boundaries
The techno-economic scenarios are framed by Colombia’s current instruments for offshore wind, including environmental governance under Law 99/1993 [90], the promotion and integration of non-conventional renewables under Law 1715/2014 [91] as amended by Law 2099/2021 [92], the procedure for maritime area allocation under Resolution 174/2021 [93], and the consolidated norms in Decrees 1076/2015 and 1079/2015 [94,95]. Sites are limited to designated exploration zones within approximately 30 km from the coast, consistent with the HVAC transmission assumption and the national offshore roadmap [11]. The analysis excludes explicit permitting fees, lease payments, and schedule-delay risk premia; development and contingency are represented through the soft cost share embedded in CAPEX. Results should therefore be interpreted as a baseline that reflects site-driven differences (bathymetry, distance to shore, foundation choice) under the current regulatory context while acknowledging that project timelines and pre-construction costs may vary during permitting.
3. Results and Discussion
As a starting point for the vertical extrapolation of wind data, near-surface atmospheric conditions were analyzed using 10 m climatological records. La Guajira exhibits the strongest near-surface winds, with speeds ranging from 1.61 to 13.54 m/s and a prevailing northeasterly direction (approximately 16° to 341°). Magdalena, Atlántico, and Bolívar show lower wind speeds (1.18–8.99, 1.30–9.24, and 1.25–9.15 m/s, respectively), with wind directions generally within 20° to 335°. Temperatures across all sites vary between 24.83 °C and 32.45 °C, and surface pressure ranges from 99.78 to 101.39 kPa. These values are consistent with the climatological patterns shown in Figure 1 and provide the basis for subsequent extrapolation to hub height.
Based on the observed wind speed profiles, the roughness exponent (α) was determined for each region using Equation (2). The resulting values were as follows: La Guajira (α = 0.165), Magdalena (α = 0.195), Atlántico (α = 0.149), and Bolívar (α = 0.186). These values reflect the surface induced variation in wind speed with height, and were used to extrapolate from 10 m to 100 m. In addition, the corresponding surface roughness lengths (Z0) were estimated, yielding 0.0005 m for La Guajira, 0.0035 m for Magdalena, 0.0014 m for Atlántico, and 0.0021 m for Bolívar. These parameters are consistent with typical marine and coastal conditions and were validated by comparing the extrapolated profiles with RWY-based data at hub height.
3.1. Offshore Wind Conditions Based on RWY Data
The offshore wind resource in the Colombian Caribbean region was evaluated using the Reference Wind Year (RWY) constructed from ERA5 data at 100 m height. Figure 5 displays the monthly variations in wind speed, wind direction, temperature, and pressure for four key departments: La Guajira, Magdalena, Atlántico, and Bolívar.
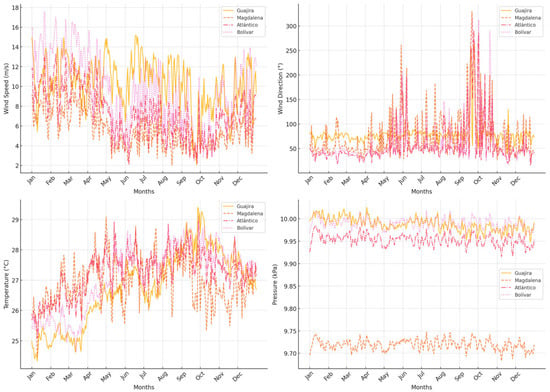
Figure 5.
Daily average values of wind speed, wind direction, temperature, and pressure at 100 m, derived from the RWY in four departments of the Colombian Caribbean.
La Guajira exhibits the most favorable wind conditions, with an average wind speed of 10.31 m/s, peaking at 15.17 m/s, and a standard deviation of 2.47 m/s, reflecting a stable and reliable wind resource. The predominant wind direction is 78.2° with moderate variability (±23.4°). Temperature and pressure remain relatively constant, averaging 26.76 °C and 99.9 kPa, respectively. In contrast, Magdalena shows a lower average wind speed of 7.33 m/s, with a maximum of 10.73 m/s, and greater directional dispersion (±50.8°). The average temperature is 26.92 °C, slightly above that of La Guajira, which could impact the air density and consequently the energy yield.
Atlántico presents intermediate wind conditions, with an average speed of 8.73 m/s and a peak of 13.38 m/s. Wind direction is relatively stable (mean 54.87°, ±42.6°). The mean temperature of 27.26 °C is the highest among the four regions, possibly affecting the site’s wind power density (WPD). Bolívar stands out with an average wind speed of 9.61 m/s and the highest recorded peak (17.57 m/s), although it also displays the largest variability (standard deviation 3.5 m/s). The average wind direction is 64.1° (±49.9°), and the temperature averages 27.10 °C. Despite its variability, Bolívar exhibits promising potential for offshore wind project deployment due to its high wind intensity.
3.2. Influence of Air Density Variation on Wind Power Potential
Air density (ρ) is a critical factor in wind power generation as it directly influences the kinetic energy available in the wind and, consequently, the performance of wind turbines. Figure 6 illustrates the daily average air density at 100 m throughout the year for the four departments under study. La Guajira consistently exhibits the highest air density values, ranging from 1.157 to 1.170 kg/m3, which reflects its lower average temperatures and higher atmospheric pressures. These conditions enhance wind power output, reinforcing the department’s strong potential for large-scale offshore wind development.
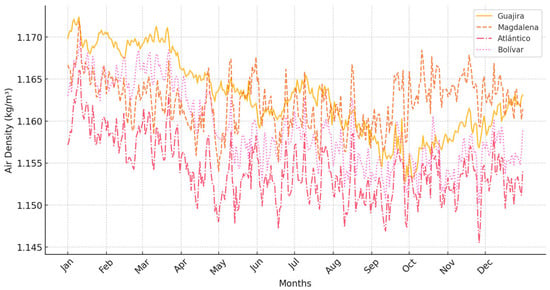
Figure 6.
Daily average air density at 100 m height estimated from RWY data.
Atlántico records the lowest air density levels (1.149–1.158 kg/m3), primarily due to its higher temperatures, which reduce the mass of air per unit volume. This factor may slightly diminish the energy production potential, even when wind speeds are favorable. Magdalena and Bolívar show intermediate air density profiles. Magdalena fluctuates between 1.150 and 1.168 kg/m3, while Bolívar ranges from 1.150 to 1.164 kg/m3. These variations are influenced by seasonal changes in temperature and pressure, particularly during transitional periods (April–May and September–October), which may introduce moderate variability in annual energy estimates.
Although differences in air density across the region are relatively small, they must be considered during wind resource assessments and turbine performance modeling. Even minor variations can significantly impact energy yield calculations.
3.3. Wind Speed Distribution Analysis and Weibull Characterization
A more detailed assessment of the wind resource was conducted by analyzing the annual wind speed distribution and fitting Weibull probability density functions for each coastal department in the Colombian Caribbean: La Guajira, Magdalena, Atlántico, and Bolívar. As shown in Figure 7, the histograms and Weibull curves highlight a predominance of moderate to high wind speeds, with a notable occurrence of strong winds, particularly in La Guajira and Bolívar.
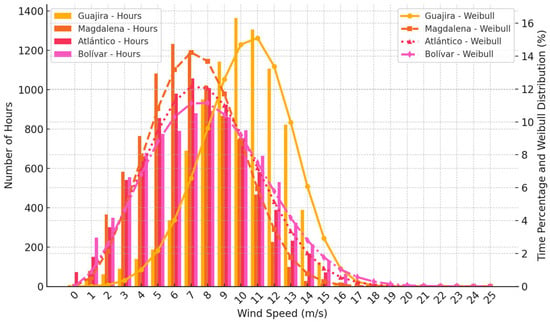
Figure 7.
Annual distribution of wind speed and fitted Weibull functions in the Caribbean region.
For wind speeds below 3 m/s, La Guajira shows the lowest frequency (1.22%), indicating minimal periods of non-generating conditions. In contrast, Magdalena, Atlántico, and Bolívar show higher frequencies of low wind speeds at 5.08%, 5.97%, and 6.87%, respectively. Within the optimal range for wind power generation (3 to 11 m/s), the most stable wind conditions are found in Magdalena (90.74%), followed by Atlántico (84.02%), Bolívar (78.63%), and La Guajira (70.84%). Despite having a lower percentage in this range, La Guajira remains the most promising site due to its elevated wind power density (WPD) and the frequency of high-speed wind events.
In terms of frequency counts by interval, La Guajira registers 1806 and 2805 observations in the 5.70 to 8.80 m/s and 8.80 to 11.10 m/s ranges, respectively, and 3693 observations for wind speeds greater than or equal to 11.10 m/s, highlighting its high wind potential. Magdalena shows a more balanced distribution, with 2825 records in the 3.60 to 5.70 m/s band and 2868 in the 5.70 to 8.80 m/s range. However, it also exhibits 634 and 1339 observations in the lower 0.50 to 2.10 m/s and 2.10 to 3.60 m/s ranges, respectively. Atlántico records 3454 and 1798 observations in the 5.70 to 8.80 m/s and 8.80 to 11.10 m/s ranges, respectively, and smaller counts in lower bands. Bolívar shows a high frequency of strong winds, with 3363 records at or above ≥11.10 m/s and 2018 observations in the 5.70 to 8.80 m/s range.
Notably, no wind speeds above 25 m/s were observed in any department, therefore mitigating concerns regarding potential mechanical damage to wind turbines. These findings corroborate the region’s substantial wind energy potential and emphasize the importance of accounting for wind speed variability in offshore planning.
3.4. Wind Direction Analysis Based on Wind Rose Patterns
The analysis of wind direction in the four main coastal departments of the Colombian Caribbean reveals consistent and well-defined patterns, as shown in Figure 8. Predominant winds originate from the northeast and east, which reflects the influence of the regional trade wind system. In La Guajira, the most frequent wind directions are east (E) with 32.1% and east-northeast (ENE) with 26.0%, together accounting for 58.1% of observations across the NE–E–SE sector. This strong directional consistency supports efficient wind energy capture, particularly for turbines with fixed orientations.
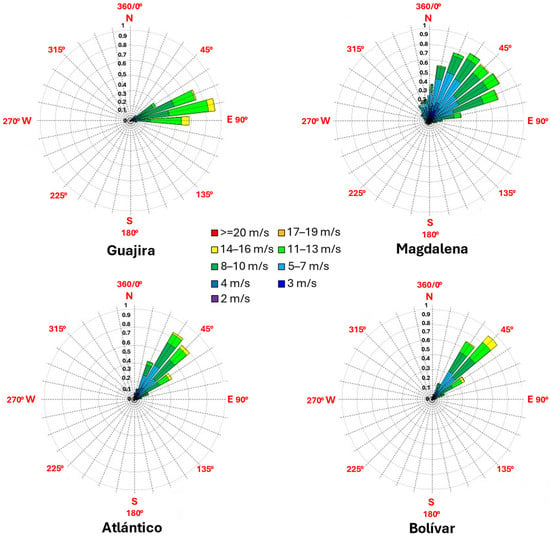
Figure 8.
Annual wind rose plots for the Colombian Caribbean coastal departments based on RWY data.
In Magdalena, the directional distribution is broader but still concentrated in the northern sector. The most common directions are northeast-north (NE-N) at 11.8%, northeast (NE) at 11.3%, and northeast-east (NE-E) at 11.6%, which together exceed 45% of observations from north through ENE. Atlántico exhibits a similar concentration of wind directions, with NE-N at 24.9%, NE at 22.8%, and NE-E at 13.5%, representing over 61% of annual wind records. This high directional predictability is advantageous for offshore wind projects aiming to minimize wake effects and structural stress. Bolívar stands out with the most concentrated directional pattern. The NE sector alone accounts for 32.3%, followed by NE-N at 26.0% and NE-E at 14.1%. Together, these directions comprise more than 72% of the annual wind distribution. This strong alignment significantly reduces yaw system activity and contributes to stable turbine operation.
Winds from the west and south are rare, with frequencies below 5% across all regions. This reinforces a predominantly single sector wind regime, which simplifies the design and layout of offshore wind farms. These findings are essential for optimizing turbine orientation, minimizing energy losses due to misalignment, and enhancing the reliability of energy generation. The clear and consistent wind direction patterns observed, particularly in La Guajira and Bolívar, enhance the technical feasibility of large-scale offshore wind development in the Colombian Caribbean.
3.5. Offshore Wind Generation Potential and Temporal Variability
Figure 9 presents a comparative analysis of offshore wind electricity generation Gw,t and capacity factor (Cf) for the four coastal departments. La Guajira consistently outperforms the other regions, with an average capacity factor of 61.5% and an estimated annual generation of 29,190 MWh. Bolívar, Atlántico, and Magdalena follow with average capacity factors of 41.7%, 41.8%, and 35.2%, and annual productions of 17,979 MWh, 16,450 MWh, and 13,665 MWh, respectively. In La Guajira, the highest monthly output occurs in February (3758 MWh) with a Cf of 75.17%. Other favorable months include June, July, and August, with Cf values ranging from 69.70% to 75.27%. Conversely, September through November show lower generation (below 2671 MWh) and capacity factors between 33.78% and 39.93%.
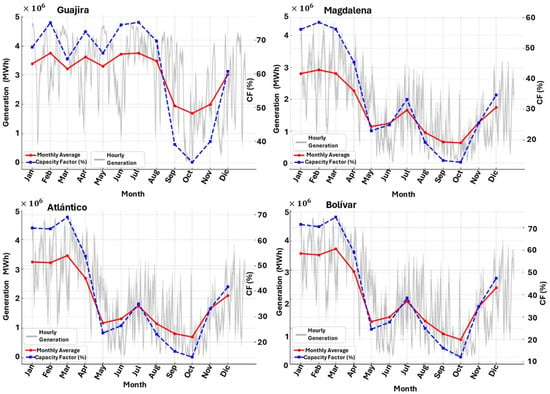
Figure 9.
Offshore wind electricity generation and capacity factor per department.
Magdalena reaches its peak in February with 2459 MWh and a Cf of 60.76%. January and March also perform well (Cf above 58%), while production drops below 1200 MWh in August, September, and October, with capacity factors ranging from 13.55% to 20.52%. In Atlántico, March exhibits the highest performance (3451 MWh and a Cf of 73.58%), followed by January and February (Cf above 69%). Lower values are recorded from August to November, with production below 1800 MWh and Cf ranging from 14.07% to 35.58%. Bolívar shows a similar seasonal pattern, with maximum values in March (3529 MWh and Cf of 74.65%). January and February also exceed 70%, while minimums are observed from September to November, with production under 1500 MWh and Cf between 12.15% and 34.82%.
These results highlight the importance of scheduling maintenance and backup energy systems during months with reduced generation and maximizing wind energy utilization during periods of high performance.
Figure 10 illustrates the seasonal and diurnal variability of offshore wind generation through hourly heat maps. La Guajira displays consistent values above 3.5 MWh during January to March and June to August, predominantly at night between 22:00 and 03:00. Generation drops below 2.0 MWh during September to November, particularly between 10:00 and 17:00. In Magdalena, peak values (approximately 1.0 MWh) are limited to January and February, also during nighttime hours (00:00 to 05:00). From March onward, the region experiences a sharp decline, with several months recording values below 0.2 MWh.
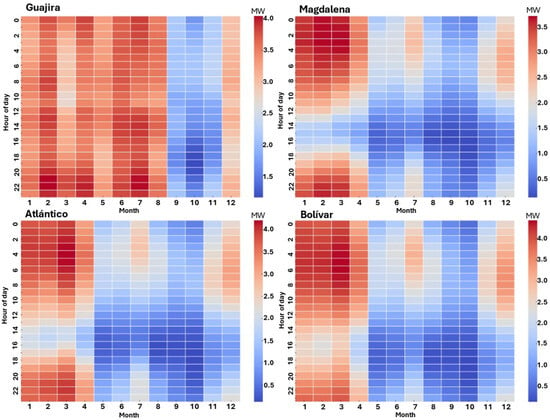
Figure 10.
Hourly heat maps of offshore wind generation (MWh) by department and month.
Atlántico shows production exceeding 3.0 MWh during January to March. A steady decline is observed until reaching minimum levels (approximately 1.0 MWh) between July and September, with partial recovery in the final months of the year. Bolívar follows a similar trend, with values above 3.0 MWh concentrated in the first quarter and minimums values (≤1.0 MWh) in August and September.
Overall, the results demonstrate the combined influence of seasonal and hourly dynamics on wind energy availability. These patterns underscore the need for hybrid systems, energy storage solutions, and smart grid strategies to ensure a reliable electricity supply throughout the year.
3.6. Techno-Economic Assessment by Region
A comprehensive comparison was performed across the four selected regions by integrating wind resource availability, site-specific technical constraints, and associated capital and operational costs. Table 5 summarizes the key technical and economic parameters for each location, including bathymetry, average wind speed, distance to shore, and investment estimates. Figure 11 and Figure 12 present a visual synthesis of the most critical indicators, enabling a clearer comparison of expected performance and cost-effectiveness across region.

Table 5.
Technical and economic parameters of offshore wind projects by region in the Colombian Caribbean.
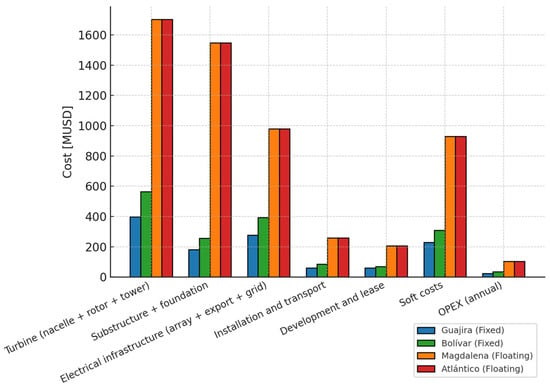
Figure 11.
Component-wise CAPEX and annual OPEX by region.
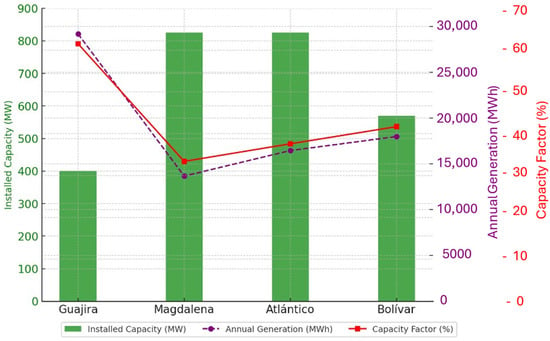
Figure 12.
Installed capacity (MW), capacity factor (%), and annual generation (GWh) by region.
Capital expenditure (CAPEX) and operational expenditure (OPEX) estimates reflect the strong influence of site-specific conditions, particularly bathymetry and the resulting foundation type. Projects in Magdalena and Atlántico require floating foundations due to deep waters (−421 m and −216 m, respectively), resulting in the highest investment costs, approximately USD 5.156 billion per project. By contrast, in La Guajira and Bolívar, where fixed foundations are feasible (−32 m and −41 m), CAPEX requirements are significantly lower, at USD 1.202 billion and USD 1.713 billion, respectively (see Table 5). These values align with those reported in prior studies on shallow water offshore installations using HVAC transmission systems [85,88].
The disaggregated CAPEX in Table 6 shows how each subsystem contributes to total investment across the four departments. In fixed foundation projects (La Guajira and Bolívar), turbines represent about one third of total CAPEX, followed by electrical infrastructure (about 23%) and soft costs (about 19%). Foundation-related expenses remain moderate (about 15%) because monopiles or jackets are feasible in shallow waters (less than 50 m). Totals are approximately USD 1.20 billion in La Guajira and USD 1.71 billion in Bolívar, consistent with Table 5.

Table 6.
Disaggregation of CAPEX by major components for offshore wind projects in the Colombian Caribbean (MUSD, constant 2024 USD).
In floating projects (Magdalena and Atlántico), the cost distribution shifts toward substructure-related items. The floater, mooring system, and dynamic power cable package rise to about 30% of CAPEX, while turbines remain at about 33% and electrical infrastructure at about 19%. Installation and development shares are smaller fractions of the total. This configuration results in investments of roughly USD 5.16 billion per site, reflecting the impact of deep water conditions (greater than 200 m). Overall, the results confirm that foundation typology and water depth are the main cost determinants in offshore wind deployment. Floating systems exhibit higher structural and installation complexity, with substructure-related items representing about 25–35% of total CAPEX compared with 10–15% for fixed bottom concepts, consistent with benchmark ranges reported by NREL and BVG Associates [46,47].
Annual OPEX, computed as 2% of CAPEX, follows the same pattern: Magdalena and Atlántico exceed USD 103 million per year, whereas La Guajira and Bolívar remain below USD 35 million per year (Figure 11). The CAPEX bars in Figure 11 also highlight the step change from fixed to floating foundations. Regarding performance, La Guajira shows the highest capacity factor (61.5%) and an annual generation of 29,190 MWh despite the lowest installed capacity (400 MW). Bolívar follows with a 41.7% capacity factor and 17,979 MWh/year from 570 MW. Atlántico and Magdalena, although each at 825 MW, produce 16,450 MWh and 13,665 MWh per year, respectively (Figure 12).
These results demonstrate that high installed capacity does not necessarily translate to better performance. In La Guajira, superior wind conditions compensate for its lower nominal capacity, while Magdalena’s deepwater site and low Cf result in the least favorable techno-economic profile. Bolívar emerges as a promising intermediate case, combining relatively high efficiency with moderate investment requirements. Overall, these findings confirm that the feasibility of offshore wind projects in the Colombian Caribbean should be assessed using an integrated approach. Beyond investment volume, project prioritization should account for wind speed, foundation feasibility, Cf, and expected generation to ensure efficient resource allocation and long-term sustainability.
Beyond seasonal variability, rare metocean extremes can affect structural design loads and restrict O&M access. Results of qualitative risk screening by department are summarized in Table 7, covering metocean exposure, foundation complexity, port and staging capacity, specialized vessel availability, grid connection readiness, permitting timeline risk, O&M access windows, and supply chain localization. The CAPEX and OPEX values reported in this study represent a baseline for average site conditions; at sites with tighter access windows and more complex offshore operations, these risks can increase insurance, contingency, and vessel standby costs and drive OPEX upward over time. As shown in Table 7, deepwater floating sites (Magdalena and Atlántico) present higher implementation risk than nearshore fixed sites (La Guajira and Bolívar), framing the regulatory and scheduling differences discussed below.

Table 7.
Qualitative risk matrix by department.
Department-level differences translate into distinct timelines and soft costs. Nearshore fixed sites (La Guajira and Bolívar) generally face fewer surveys and simpler approvals, thereby shortening schedules, whereas deepwater floating sites (Magdalena and Atlántico) require longer surveys and more complex engineering, lengthening permitting timelines and raising soft costs. These items are not included in CAPEX or OPEX, so results should be interpreted as a site-driven baseline; schedule risk can be mitigated via marine spatial planning, defined interconnection milestones, and early stakeholder engagement.
This assessment reports gross energy output without micrositing or wake flow modeling. Given the prevailing NE–E sector, turbine strings are normally oriented approximately perpendicular to this direction, with typical intra-row and cross-row spacing on the order of 7–9D and 3–5D to reduce wake superposition [96,97]. Standard engineering wake models, including the Jensen/Park and Gaussian formulations, indicate typical offshore array losses of approximately 5–12%, depending on wind sector frequency, ambient turbulence, and spacing strategy [98]. Incorporating a directional wake analysis based on the department-specific wind roses is therefore a logical next step to translate the gross annual energy presented here into net yield and to refine the techno-economic comparison.
Building on these comparative results, nearshore fixed foundation sites such as La Guajira and Bolívar combine lower CAPEX with higher or midrange capacity factors (CFs), which can support early deployment and capability building. Integrating variable offshore generation into the National Interconnected System (SIN) will require targeted upgrades at coastal points of interconnection, coordinated transmission to major demand centers, and clear grid code provisions for inverter-based resources (IBRs), including frequency response, fault ride through (FRT), and voltage control. A staged buildout that prioritizes projects with fixed foundations while readying ports, vessels, and supply chains for future floating phases is advisable. Complementary measures include colocation with storage or flexible demand (demand response) to reduce curtailment risk, hybridization with solar PV to smooth diurnal profiles, and procurement mechanisms that value availability, deliverability, and ancillary services in addition to energy.
Beyond reanalysis-driven characterization, complementary data-driven methods can refine site-level estimates. Recent studies show that machine learning models can bias correct or downscale ERA5 winds in coastal settings, outperforming baseline reanalysis and capturing spatial patterns in wind profiles and low-level jets from single-level ERA5 inputs [99]. For forecasting and energy yield prediction, hybrid deep learning architectures (e.g., a CNN followed by an LSTM with attention) and decomposition plus DL pipelines have achieved lower errors than single model baselines in offshore applications and complex terrain [100,101]. A focused benchmark for the Colombian Caribbean, combining coastal station data, satellite winds, and ML-based bias correction, remains a valuable avenue for future work.
4. Conclusions
The integrated analysis of wind resources and associated costs in the Colombian Caribbean indicates that the techno-economic feasibility of offshore wind projects varies significantly across regions. This variation is driven by a combination of technical factors such as wind speed, bathymetry, distance to shore, and foundation type, which directly affect both capital expenditure (CAPEX) and operating expenditure (OPEX). La Guajira emerges as the most favorable region, not only because of its excellent wind resource conditions (wind power density of 796 W per square meter and a capacity factor of 61.5%), but also because fixed foundations are feasible and cost effective. This results in the lowest CAPEX among the evaluated regions, approximately USD 1.202 billion, along with high energy yield per unit of investment. Additionally, La Guajira exhibits the highest estimated annual energy generation, despite having the lowest installed capacity. The combination of superior technical performance and cost efficiency leads to one of the most favorable economic profiles in the study.
In contrast, Magdalena and Atlántico, despite having similar installed capacities of 825 MW, face significantly higher investment requirements of USD 5.156 billion each due to the need for floating structures, because water depths exceed 200 m. These site conditions also lead to the highest operating costs, approximately USD 103 million per year, which compromise long-term financial viability. The situation is particularly critical in Magdalena, where the capacity factor is only 33.4%. Bolívar represents an intermediate case: with a water depth of about 41 m and the use of fixed foundations, it benefits from a solid wind resource (wind power density of 511 W per square meter and a capacity factor of 41.7%) while maintaining relatively low investment costs of USD 1.713 billion. These features make it a competitive location for medium-scale offshore development.
The findings confirm that no single variable determines the feasibility of offshore wind projects. A comprehensive methodology that links wind resource quality, site conditions, and technical requirements with economic implications is essential. This reinforces the importance of techno-economic multicriteria approaches when prioritizing offshore wind investments. Such an approach enables identification of regions with high return potential, supports risk informed planning, and fosters more efficient deployment of offshore wind energy in Colombia.
A key limitation is the lack of offshore in situ measurements at or near the proposed sites; therefore, results should be interpreted as climatological screening results. As data access improves, integrating station and satellite data with machine learning bias correction benchmarks will be a priority. Future work will include a sensitivity analysis to assess how variations in key parameters such as CAPEX, discount rate, and capacity factor affect economic outcomes. This extension, using probabilistic approaches, will strengthen the robustness of the techno-economic results presented for offshore wind development in Colombia.
Author Contributions
Conceptualization, A.O.-C., C.R.-A. and J.W.V.C.; Data curation, J.W.V.C.; Formal analysis, A.O.-C. and C.R.-A.; Funding acquisition, A.O.-C.; Investigation, A.O.-C.; Methodology, A.O.-C., C.R.-A. and J.W.V.C.; Software, A.O.-C.; Validation, A.O.-C., C.R.-A. and J.W.V.C.; Visualization, C.R.-A.; Writing—original draft, A.O.-C.; Writing—review and editing, C.R.-A. All authors have read and agreed to the published version of the manuscript.
Funding
This research was funded by the Ministerio de Ciencia, Tecnología e Innovación—Fondo Francisco José de Caldas and the Agencia Nacional de Hidrocarburos (ANH), through the Contrato de Financiamiento de Recuperación Contingente No. 112721-053-2025, within the project “Herramientas tecnológicas y prototipos para caracterizar, identificar y optimizar el potencial eólico en zonas costeras de Colombia” (Project Code 111983).
Data Availability Statement
The original contributions presented in this study are included in the article. Further inquiries can be directed to the corresponding authors.
Acknowledgments
The authors express their gratitude to the Universidad de la Costa and the Universidad del Magdalena for the support provided during this research.
Conflicts of Interest
The authors declare no conflicts of interest.
Abbreviations
The following abbreviations are used in this manuscript:
| CAPEX | Capital Expenditure |
| Cf | Capacity Factor |
| ERA5 | ECMWF Reanalysis v5 |
| ECMWF | European Centre for Medium-Range Weather Forecasts |
| FAHP | Fuzzy Analytic Hierarchy Process |
| FRT | Fault Ride Through |
| FS | Finkelstein–Schafer distance |
| GIS | Geographic Information System |
| HVAC | High-Voltage Alternating Current |
| HVDC | High-Voltage Direct Current |
| IBRs | Inverter Based Resources |
| IRENA | International Renewable Energy Agency |
| MLM | Maximum Likelihood Method |
| NREL | National Renewable Energy Laboratory |
| OPEX | Operational Expenditure |
| RMSE | Root Mean Square Error |
| RWY | Reference Wind Year |
| TLPs | Tension Leg Platforms |
References
- Saleh, H.M.; Hassan, A.I. The Challenges of Sustainable Energy Transition: A Focus on Renewable Energy. Appl. Chem. Eng. 2024, 7, 2084. [Google Scholar] [CrossRef]
- Osman, A.I.; Chen, L.; Yang, M.; Msigwa, G.; Farghali, M.; Fawzy, S.; Rooney, D.W.; Yap, P.-S. Cost, Environmental Impact, and Resilience of Renewable Energy under a Changing Climate: A Review. Environ. Chem. Lett. 2023, 21, 741–764. [Google Scholar] [CrossRef]
- Decastro, M.; Salvador, S.; Gómez-Gesteira, M.; Costoya, X.; Carvalho, D.; Sanz-Larruga, F.J.; Gimeno, L. Europe, China and the United States: Three Different Approaches to the Development of Offshore Wind Energy. Renew. Sustain. Energy Rev. 2019, 109, 55–70. [Google Scholar] [CrossRef]
- Kosek, W.; Woźniak, W.; Chamier-Gliszczynski, N.; Staniuk, W. Offshore Wind Farm Supply Chains and Regional Development: The Role of Ports in Economic and Logistical Growth in the Central Baltic Region. Energies 2025, 18, 2599. [Google Scholar] [CrossRef]
- von Jouanne, A.; Agamloh, E.; Yokochi, A. A Review of Offshore Renewable Energy for Advancing the Clean Energy Transition. Energies 2025, 18, 4798. [Google Scholar] [CrossRef]
- Urban, F. China’s Rise: Challenging the North-South Technology Transfer Paradigm for Climate Change Mitigation and Low Carbon Energy. Energy Policy 2018, 113, 320–330. [Google Scholar] [CrossRef]
- Majidi Nezhad, M.; Neshat, M.; Piras, G.; Astiaso Garcia, D. Sites Exploring Prioritisation of Offshore Wind Energy Potential and Mapping for Wind Farms Installation: Iranian Islands Case Studies. Renew. Sustain. Energy Rev. 2022, 168, 112791. [Google Scholar] [CrossRef]
- Wen, Y.; Kamranzad, B.; Lin, P. Assessment of Long-Term Offshore Wind Energy Potential in the South and Southeast Coasts of China Based on a 55-Year Dataset. Energy 2021, 224, 120225. [Google Scholar] [CrossRef]
- Görmüş, T.; Aydoğan, B.; Ayat, B. Offshore Wind Power Potential Analysis for Different Wind Turbines in the Mediterranean Region, 1959–2020. Energy Convers. Manag. 2022, 274, 116470. [Google Scholar] [CrossRef]
- Carreno-Madinabeitia, S.; Ibarra-Berastegi, G.; Sáenz, J.; Ulazia, A. Long-Term Changes in Offshore Wind Power Density and Wind Turbine Capacity Factor in the Iberian Peninsula (1900–2010). Energy 2021, 226, 120364. [Google Scholar] [CrossRef]
- The Renewables Consulting Group & ERM. Hoja de Ruta Para El Despliegue de La Energía Eólica Costa Afuera En Colombia; The Renewables Consulting Group: London, UK, 2022. [Google Scholar]
- Gil Ruiz, S.A.; Cañón Barriga, J.E.; Martínez, J.A. Assessment and Validation of Wind Power Potential at Convection-Permitting Resolution for the Caribbean Region of Colombia. Energy 2022, 244, 123127. [Google Scholar] [CrossRef]
- Arce, L. Analysis of Offshore Wind Energy in Colombia: Current Status and Future Opportunities. Int. J. Eng. Res. 2020, 9, 610–619. [Google Scholar] [CrossRef]
- Rueda-Bayona, J.G.; Guzmán, A.; Eras, J.J.C.; Silva-Casarín, R.; Bastidas-Arteaga, E.; Horrillo-Caraballo, J. Renewables Energies in Colombia and the Opportunity for the Offshore Wind Technology. J. Clean. Prod. 2019, 220, 529–543. [Google Scholar] [CrossRef]
- Ospino-Castro, A.; Robles-Algarín, C.; Mangones-Cordero, A.; Romero-Navas, S. An Analytic Hierarchy Process Based Approach for Evaluating Feasibility of Offshore Wind Farm on the Colombian Caribbean Coast. Int. J. Energy Econ. Policy 2023, 13, 64–73. [Google Scholar] [CrossRef]
- Maldonado, M.D.L.A.; Calderon, J.K.M.; Maldonado, Y.A.M.; Ospino, A. Technical and Economic Evaluation of a Small-Scale Wind Power System Located in Berlin, Colombia. TECCIENCIA 2019, 13, 63–72. [Google Scholar] [CrossRef]
- Pabón Hernández, S.M. Geospatial Assessment of the Wind Energy for an Onshore Project in the Caribbean Region of Colombia. Master’s Thesis, Hochschule für Angewandte Wissenschaften Hamburg, Hamburg, Germany, 2019. [Google Scholar]
- Dong, Z.; Zhao, Y.; Wang, A.; Zhou, M. Wind-Mambaformer: Ultra-Short-Term Wind Turbine Power Forecasting Based on Advanced Transformer and Mamba Models. Energies 2025, 18, 1155. [Google Scholar] [CrossRef]
- Yang, M.; Jiang, Y.; Che, J.; Han, Z.; Lv, Q. Short-Term Forecasting of Wind Power Based on Error Traceability and Numerical Weather Prediction Wind Speed Correction. Electronics 2024, 13, 1559. [Google Scholar] [CrossRef]
- Kovalnogov, V.N.; Fedorov, R.V.; Chukalin, A.V.; Klyachkin, V.N.; Tabakov, V.P.; Demidov, D.A. Applied Machine Learning to Study the Movement of Air Masses in the Wind Farm Area. Energies 2024, 17, 3961. [Google Scholar] [CrossRef]
- Martinez G, R.J.; Ballesteros M, C.A.; Valencia O, G.E.; Ch, M.C.V.; Polanco P, G. Study of Wind Persistence and Density of Wind Power in La Guajira-Colombia. Contemp. Eng. Sci. 2017, 10, 963–971. [Google Scholar] [CrossRef]
- Villegas, J.F.; Ochoa, G.V.; Chamorro, M.V. Statistical Analysis of Wind Power and Analytical Methods for Wind Persistence in Magdalena and Cesar Departments in Colombia. Indian J. Sci. Technol. 2017, 10, 1–09. [Google Scholar] [CrossRef][Green Version]
- Hernández-Escobedo, Q.; Saldaña-Flores, R.; Rodríguez-García, E.R.; Manzano-Agugliaro, F. Wind Energy Resource in Northern Mexico. Renew. Sustain. Energy Rev. 2014, 32, 890–914. [Google Scholar] [CrossRef]
- Rodriguez-Caviedes, A.; Gil-García, I.C. Multifactorial Analysis to Determine the Applicability of Wind Power Technologies in Favorable Areas of the Colombian Territory. Wind 2022, 2, 357–393. [Google Scholar] [CrossRef]
- Carta, J.A.; Ramírez, P.; Velázquez, S. A Review of Wind Speed Probability Distributions Used in Wind Energy Analysis. Renew. Sustain. Energy Rev. 2009, 13, 933–955. [Google Scholar] [CrossRef]
- Portillo Diaz, C.D.; Montiel Hoyos, C.C.; Montes Páez, E.G.; Guerrero Martin, C.A. Wind Potencial as an Oportunity for Energy Transition in Oil and Gas Industry: Colombian Caribbean Offshore Case of Study. In Proceedings of the Offshore Technology Conference, Houston, TX, USA, 25 April 2022; p. OTC-31911-MS. [Google Scholar]
- Moreno, C.; Ospino-Castro, A.; Robles-Algarín, C. Decision-Making Support Framework for Electricity Supply in Non-Interconnected Rural Areas Based on FAHP. Int. J. Energy Econ. Policy 2022, 12, 79–87. [Google Scholar] [CrossRef]
- Haghighat Mamaghani, A.; Avella Escandon, S.A.; Najafi, B.; Shirazi, A.; Rinaldi, F. Techno-Economic Feasibility of Photovoltaic, Wind, Diesel and Hybrid Electrification Systems for off-Grid Rural Electrification in Colombia. Renew. Energy 2016, 97, 293–305. [Google Scholar] [CrossRef]
- Raza, M.A.; Aman, M.M.; Rajpar, A.H.; Bashir, M.B.A.; Jumani, T.A. Towards Achieving 100% Renewable Energy Supply for Sustainable Climate Change in Pakistan. Sustainability 2022, 14, 16547. [Google Scholar] [CrossRef]
- Ji, R.; Zheng, J.; Xue, M.; Sun, K.; Ye, Y.; Zhu, R.; Fernandez-Rodriguez, E.; Zhang, Y. Investigations on the Performance and Wake Dynamics of a Tidal Stream Turbine under Different Yaw-Offset Conditions. Phys. Fluids 2025, 37, 015192. [Google Scholar] [CrossRef]
- Castro, A.O.; Robles-Algarín, C.; Hernández-Callejo, L.; Muñoz Maldonado, Y.; Cordero, A.M. Feasibility Analysis of Offshore Wind Power Projects in the Caribbean Region of Colombia: A Case Study Using FAHP–GIS. Sustainability 2023, 15, 16620. [Google Scholar] [CrossRef]
- Bastidas-Salamanca, M.; Rueda-Bayona, J.G. Pre-Feasibility Assessment for Identifying Locations of New Offshore Wind Projects in the Colombian Caribbean. Int. J. Sustain. Energy Plan. Manag. 2021, 32, 139–154. [Google Scholar] [CrossRef]
- Hersbach, H.; Bell, B.; Berrisford, P.; Hirahara, S.; Horányi, A.; Muñoz--Sabater, J.; Nicolas, J.; Peubey, C.; Radu, R.; Schepers, D.; et al. The ERA5 Global Reanalysis. Q. J. R. Meteorol. Soc. 2020, 146, 1999–2049. [Google Scholar] [CrossRef]
- Copernicus Climate Change Service (C3S) ERA5 Hourly Data on Single Levels from 1940 to Present. Available online: https://cds.climate.copernicus.eu/datasets/reanalysis-era5-single-levels?tab=overview (accessed on 21 September 2025).
- Pusat, S.; Karagöz, Y. A New Reference Wind Year Approach to Estimate Long Term Wind Characteristics. Adv. Mech. Eng. 2021, 13, 16878140211021268. [Google Scholar] [CrossRef]
- Zhao, Y.; Ding, C. Wind Power Generator Output Model Based on the Statistical Wind Speed Distribution Derived from the Historical Data. In Proceedings of the 2018 2nd IEEE Conference on Energy Internet and Energy System Integration (EI2), Beijing, China, 20–22 October 2018; pp. 1–5. [Google Scholar]
- Viteri, J.P.; Henao, F.; Cherni, J.; Dyner, I. Optimizing the Insertion of Renewable Energy in the Off-Grid Regions of Colombia. J. Clean. Prod. 2019, 235, 535–548. [Google Scholar] [CrossRef]
- ABB Cuaderno de Aplicaciones Técnicas n.° 12: Plantas Eólicas. Available online: https://library.e.abb.com/public/ac764cb1be081128c1257a30003c70d7/Cuaderno%20Tecnico_num%2012_Plantas%20eolicas.pdf (accessed on 24 October 2025).
- Escudero López, J.M. Manual de Energía Eólica; Ediciones Mundi-Prensa: Madrid, Spain, 2008. [Google Scholar]
- Rodríguez, E.; Castro, L.L.; Santamaría, G.; Lezama, U. Obtención de la Curva de Potencia de un Aerogenerador de 2 mw, Mediante un Modelo CFD (Obtainment of the Power Curve of a Wind Turbine 2 mw, Through a CFD Model); Pistas Educativas: Celaya, Mexico, 2018; Volume 40. [Google Scholar]
- Namiranian, A. 3D Simulation of a 5MW Wind Turbine. Master’s Thesis, Blekinge Institute of Technology, Karlskrona, Sweden, 2011. [Google Scholar]
- González-Hernández, J.G.; Salas-Cabrera, R. Representation and Estimation of the Power Coefficient in Wind Energy Conversion Systems. Rev. Fac. Ing. 2019, 28, 77–90. [Google Scholar] [CrossRef]
- Sahroni, T.R. Modeling and Simulation of Offshore Wind Power Platform for 5 MW Baseline NREL Turbine. Sci. World J. 2015, 2015, 819384. [Google Scholar] [CrossRef] [PubMed]
- Nejad, A.R.; Guo, Y.; Gao, Z.; Moan, T. Development of a 5 MW Reference Gearbox for Offshore Wind Turbines. Wind. Energy 2016, 19, 1089–1106. [Google Scholar] [CrossRef]
- Ioannou, A.; Angus, A.; Brennan, F. A Lifecycle Techno-Economic Model of Offshore Wind Energy for Different Entry and Exit Instances. Appl. Energy 2018, 221, 406–424. [Google Scholar] [CrossRef]
- Stehly, T.; Duffy, P.; Mulas Hernando, D. Cost of Wind Energy Review: 2024 Edition. Available online: https://docs.nrel.gov/docs/fy25osti/91775.pdf (accessed on 20 October 2025).
- BVG Associates Guide to an Offshore Wind Farm: Wind Farm Costs. Available online: https://guidetoanoffshorewindfarm.com/wind-farm-costs/ (accessed on 22 October 2025).
- Guo, Y.; Wang, H.; Lian, J. Review of Integrated Installation Technologies for Offshore Wind Turbines: Current Progress and Future Development Trends. Energy Convers. Manag. 2022, 255, 115319. [Google Scholar] [CrossRef]
- de Montera, L.; Berger, H.; Husson, R.; Appelghem, P.; Guerlou, L.; Fragoso, M. High-Resolution Offshore Wind Resource Assessment at Turbine Hub Height with Sentinel-1 Synthetic Aperture Radar (SAR) Data and Machine Learning. Wind. Energy Sci. 2022, 7, 1441–1453. [Google Scholar] [CrossRef]
- Bilgili, M.; Alphan, H.; Ilhan, A. Potential Visibility, Growth, and Technological Innovation in Offshore Wind Turbines Installed in Europe. Environ. Sci. Pollut. Res. 2022, 30, 27208–27226. [Google Scholar] [CrossRef] [PubMed]
- Peña, A.; Floors, R.; Sathe, A.; Gryning, S.-E.; Wagner, R.; Courtney, M.S.; Larsén, X.G.; Hahmann, A.N.; Hasager, C.B. Ten Years of Boundary-Layer and Wind-Power Meteorology at Høvsøre, Denmark. Bound. Layer. Meteorol. 2016, 158, 1–26. [Google Scholar] [CrossRef]
- Hsu, S.A. A Dynamic Roughness Equation and Its Application to Wind Stress Determination at the Air-Sea Interface. J. Phys. Ocean. 1974, 4, 116–120. [Google Scholar] [CrossRef]
- Wu, L.; Sahlée, E.; Nilsson, E.; Rutgersson, A. A Review of Surface Swell Waves and Their Role in Air–Sea Interactions. Ocean Model 2024, 190, 102397. [Google Scholar] [CrossRef]
- Hasani-Marzooni, M.; Hosseini, S.H. Dynamic Model for Market-Based Capacity Investment Decision Considering Stochastic Characteristic of Wind Power. Renew. Energy 2011, 36, 2205–2219. [Google Scholar] [CrossRef]
- Guevara Díaz, J.M. Cuantificación Del Perfil Del Viento Hasta 100 m de Altura Desde La Superficie y Su Incidencia En La Climatología Eólica. Terra 2013, 29, 81–101. [Google Scholar]
- Bäckbro, H. A Study of Potential Approaches to Simulate Power Output as Well as Identifying Anomalous Operation of Wind Turbines. Master’s Thesis, Uppsala University, Uppsala, Sweden, 2014. [Google Scholar]
- Jalalvand, M.; Almassi, M.; Bakhoda, H. Statistical Wind Data Analysis Based on Weibull Distribution Function for Partial Utility in Agricultural Application (Case Study: Broujerd Province, Iran). J. Agric. Mech. 2021, 6, 67–75. [Google Scholar]
- Batran, S.; Jama, M.; Yousaf, J.; Hassan, T.; Ghazal, M.; Mokhlis, H. Bin Assessment of Wind Energy Resource in the Western Region of Somaliland. Heliyon 2024, 10, e32500. [Google Scholar] [CrossRef] [PubMed]
- Negash, T.; Möllerström, E.; Ottermo, F. An Assessment of Wind Energy Potential for the Three Topographic Regions of Eritrea. Energies 2020, 13, 1846. [Google Scholar] [CrossRef]
- Ulazia, A.; Nafarrate, A.; Ibarra-Berastegi, G.; Sáenz, J.; Carreno-Madinabeitia, S. The Consequences of Air Density Variations over Northeastern Scotland for Offshore Wind Energy Potential. Energies 2019, 12, 2635. [Google Scholar] [CrossRef]
- Ulazia, A.; Sáenz, J.; Ibarra-Berastegi, G.; González-Rojí, S.J.; Carreno-Madinabeitia, S. Global Estimations of Wind Energy Potential Considering Seasonal Air Density Changes. Energy 2019, 187, 115938. [Google Scholar] [CrossRef]
- Salih, A.-K.M.; Hatem Kamil, M. Assessment of Relative Humidity Effect on Wind Power for Electricity Production in Al-Samawa City-Southern Iraq. Am. Sci. Res. J. Eng. Technol. Sci. 2020, 68, 74–84. [Google Scholar]
- Pérez Rendón, E.P.; Ramírez Builes, V.H.; Peña Quiñones, A.J. Variabilidad Espacial y Temporal de La Temperatura Del Aire En La Zona Cafetera Colombiana. Investig. Geográficas 2016, 89, 23–40. [Google Scholar] [CrossRef][Green Version]
- Tizgui, I.; El Guezar, F.; Bouzahir, H.; Benaid, B. Comparison of Methods in Estimating Weibull Parameters for Wind Energy Applications. Int. J. Energy Sect. Manag. 2017, 11, 650–663. [Google Scholar] [CrossRef]
- Guenoukpati, A.; Salami, A.A.; Kodjo, M.K.; Napo, K. Estimating Weibull Parameters for Wind Energy Applications Using Seven Numerical Methods: Case Studies of Three Costal Sites in West Africa. Int. J. Renew. Energy Dev. 2020, 9, 217–226. [Google Scholar] [CrossRef]
- Vega-Zuñiga, S.; Rueda-Bayona, J.G.; Ospino-Castro, A. Evaluation of Eleven Numerical Methods for Determining Weibull Parameters for Wind Energy Generation in the Caribbean Region of Colombia. Math. Model. Eng. Probl. 2022, 09, 194–199. [Google Scholar] [CrossRef]
- Chang, T.P. Performance Comparison of Six Numerical Methods in Estimating Weibull Parameters for Wind Energy Application. Appl. Energy 2011, 88, 272–282. [Google Scholar] [CrossRef]
- Mohammadi, K.; Alavi, O.; Mostafaeipour, A.; Goudarzi, N.; Jalilvand, M. Assessing Different Parameters Estimation Methods of Weibull Distribution to Compute Wind Power Density. Energy Convers. Manag. 2016, 108, 322–335. [Google Scholar] [CrossRef]
- Shoaib, M.; Siddiqui, I.; Ahmed, F.; Rehman, S.U.; Tanveer, M.R.; Jilani, S.U. Weibull Distribution Function for Wind Energy Estimation of Gharo (Sindh). J. Basic Appl. Sci. 2015, 11, 106–114. [Google Scholar] [CrossRef]
- Belabes, B.; Youcefi, A.; Guerri, O.; Djamai, M.; Kaabeche, A. Evaluation of Wind Energy Potential and Estimation of Cost Using Wind Energy Turbines for Electricity Generation in North of Algeria. Renew. Sustain. Energy Rev. 2015, 51, 1245–1255. [Google Scholar] [CrossRef]
- Yancachajlla Tito, U.; Vilca Huayta, O.A. Caracterización Del Viento Con La Función de Weibull Para Una Zona Altoandina, Laraqueri-Perú. Rev. De Investig. Altoandinas. 2022, 24, 190–198. [Google Scholar] [CrossRef]
- Kalmikov, A. Wind Power Fundamentals. In Wind Energy Engineering; Elsevier: Amsterdam, The Netherlands, 2017; pp. 17–24. [Google Scholar]
- Sedaghat, A.; Alkhatib, F.; Eilaghi, A.; Mehdizadeh, A.; Borvayeh, L.; Mostafaeipour, A.; Hassanzadeh, A.; Jahangiri, M. Optimization of Capacity Factors Based on Rated Wind Speeds of Wind Turbines. Energy Sources Part A Recovery Util. Environ. Eff. 2024, 46, 6104–6125. [Google Scholar] [CrossRef]
- Gugliani, G.K.; Sarkar, A.; Ley, C.; Mandal, S. New Methods to Assess Wind Resources in Terms of Wind Speed, Load, Power and Direction. Renew. Energy 2018, 129, 168–182. [Google Scholar] [CrossRef]
- Xu, J.; Zou, J.; Ziegler, A.D.; Wu, J.; Zeng, Z. What Drives the Change of Capacity Factor of Wind Turbine in the United States? Environ. Res. Lett. 2023, 18, 064009. [Google Scholar] [CrossRef]
- Wind Europe Capacity Factors. Available online: https://windeurope.org/about-wind/daily-wind/capacity-factors (accessed on 22 September 2025).
- IRENA. Floating Offshore Wind Outlook; International Renewable Energy Agency: Abu Dhabi, United Arab Emirates, 2024; ISBN 978-92-9260-612-1. [Google Scholar]
- Lorentzen, S.; Osmundsen, P.; Lu, L. Immature Offshore Wind Technology: UK Life Cycle Capacity Factor Analysis. Wind. Energy 2024, 27, 1095–1110. [Google Scholar] [CrossRef]
- Fernández, L. Global Offshore Wind Capacity Factor 2010–2023. Available online: https://www.statista.com/statistics/1368679/global-offshore-wind-capacity-factor/ (accessed on 22 September 2025).
- Chang, T.-P.; Liu, F.-J.; Ko, H.-H.; Cheng, S.-P.; Sun, L.-C.; Kuo, S.-C. Comparative Analysis on Power Curve Models of Wind Turbine Generator in Estimating Capacity Factor. Energy 2014, 73, 88–95. [Google Scholar] [CrossRef]
- Effiom, S.O.; Nwankwojike, B.N.; Abam, F.I. Economic Cost Evaluation on the Viability of Offshore Wind Turbine Farms in Nigeria. Energy Rep. 2016, 2, 48–53. [Google Scholar] [CrossRef]
- Papi, F.; Bianchini, A. Technical Challenges in Floating Offshore Wind Turbine Upscaling: A Critical Analysis Based on the NREL 5 MW and IEA 15 MW Reference Turbines. Renew. Sustain. Energy Rev. 2022, 162, 112489. [Google Scholar] [CrossRef]
- Rogeau, A.; Vieubled, J.; de Coatpont, M.; Affonso Nobrega, P.; Erbs, G.; Girard, R. Techno-Economic Evaluation and Resource Assessment of Hydrogen Production through Offshore Wind Farms: A European Perspective. Renew. Sustain. Energy Rev. 2023, 187, 113699. [Google Scholar] [CrossRef]
- Marcollo, H.; Efthimiou, L. Floating Offshore Wind Dynamic Cables: Overview of Design and Risks; World Forum Offshore Wind (WFO): Singapore, 2024. [Google Scholar]
- Kucuksari, S.; Erdogan, N.; Cali, U. Impact of Electrical Topology, Capacity Factor and Line Length on Economic Performance of Offshore Wind Investments. Energies 2019, 12, 3191. [Google Scholar] [CrossRef]
- Dicorato, M.; Forte, G.; Pisani, M.; Trovato, M. Guidelines for Assessment of Investment Cost for Offshore Wind Generation. Renew. Energy 2011, 36, 2043–2051. [Google Scholar] [CrossRef]
- Kim, J.-Y.; Oh, K.-Y.; Kang, K.-S.; Lee, J.-S. Site Selection of Offshore Wind Farms around the Korean Peninsula through Economic Evaluation. Renew. Energy 2013, 54, 189–195. [Google Scholar] [CrossRef]
- Caputo, A.C.; Federici, A.; Pelagagge, P.M.; Salini, P. Offshore Wind Power System Economic Evaluation Framework under Aleatory and Epistemic Uncertainty. Appl. Energy 2023, 350, 121585. [Google Scholar] [CrossRef]
- Gonzalez-Rodriguez, A.G. Review of Offshore Wind Farm Cost Components. Energy Sustain. Dev. 2017, 37, 10–19. [Google Scholar] [CrossRef]
- Congreso de Colombia Ley 99 de 1993. Available online: https://www.funcionpublica.gov.co/eva/gestornormativo/norma.php?i=297 (accessed on 22 October 2025).
- Congreso de Colombia Ley 1715 de 2014. Available online: https://www.funcionpublica.gov.co/eva/gestornormativo/norma.php?i=57353 (accessed on 22 October 2025).
- Congreso de Colombia Ley 2099 de 2021. Available online: https://www.funcionpublica.gov.co/eva/gestornormativo/norma.php?i=166326 (accessed on 22 October 2025).
- CREG Resolución 174 DE 2021. Available online: https://gestornormativo.creg.gov.co/gestor/entorno/docs/resolucion_creg_0174_2021.htm (accessed on 22 October 2025).
- Ministerio de Transporte Decreto 1079 de 2015 Sector Transporte. Available online: https://www.funcionpublica.gov.co/eva/gestornormativo/norma.php?i=77889 (accessed on 22 October 2025).
- Ministerio de Ambiente y Desarrollo Sostenible Decreto 1076 de 2015 Sector Ambiente y Desarrollo Sostenible. Available online: https://www.funcionpublica.gov.co/eva/gestornormativo/norma.php?i=78153 (accessed on 22 October 2025).
- Bastankhah, M.; Porté-Agel, F. A New Analytical Model for Wind-Turbine Wakes. Renew. Energy 2014, 70, 116–123. [Google Scholar] [CrossRef]
- Katic, I.; Højstrup, J.; Jensen, N.O. A Simple Model for Cluster Efficiency; APA: Washington, DC, USA, 1987; Volume 1. [Google Scholar]
- Barthelmie, R.J.; Hansen, K.; Frandsen, S.T.; Rathmann, O.; Schepers, J.G.; Schlez, W.; Phillips, J.; Rados, K.; Zervos, A.; Politis, E.S.; et al. Modelling and Measuring Flow and Wind Turbine Wakes in Large Wind Farms Offshore. Wind. Energy 2009, 12, 431–444. [Google Scholar] [CrossRef]
- Hallgren, C.; Aird, J.A.; Ivanell, S.; Körnich, H.; Vakkari, V.; Barthelmie, R.J.; Pryor, S.C.; Sahlée, E. Machine Learning Methods to Improve Spatial Predictions of Coastal Wind Speed Profiles and Low-Level Jets Using Single-Level ERA5 Data. Wind. Energy Sci. 2024, 9, 821–840. [Google Scholar] [CrossRef]
- Zhang, S.; Chen, Y.; Xiao, J.; Zhang, W.; Feng, R. Hybrid Wind Speed Forecasting Model Based on Multivariate Data Secondary Decomposition Approach and Deep Learning Algorithm with Attention Mechanism. Renew. Energy 2021, 174, 688–704. [Google Scholar] [CrossRef]
- Sun, Y.; Zhou, Q.; Sun, L.; Sun, L.; Kang, J.; Li, H. CNN–LSTM–AM: A Power Prediction Model for Offshore Wind Turbines. Ocean Eng. 2024, 301, 117598. [Google Scholar] [CrossRef]
Disclaimer/Publisher’s Note: The statements, opinions and data contained in all publications are solely those of the individual author(s) and contributor(s) and not of MDPI and/or the editor(s). MDPI and/or the editor(s) disclaim responsibility for any injury to people or property resulting from any ideas, methods, instructions or products referred to in the content. |
© 2025 by the authors. Licensee MDPI, Basel, Switzerland. This article is an open access article distributed under the terms and conditions of the Creative Commons Attribution (CC BY) license (https://creativecommons.org/licenses/by/4.0/).