Abstract
This study aims to provide a detailed analysis of the design choices and economic sustainability aspects associated with the implementation of shore-to-ship electrification, commonly known as “cold ironing”, in port docks, pertaining to the Italian context. This innovative technological solution aims to reduce the environmental impact of port operations by allowing docked ships to turn off their engines and connect directly to the shore-side power supply. A detailed analysis of present standards and applicable legislation is presented and implemented. Therefore, the objective of this work is to determine the conditions that make shore-side power supply economically sustainable and to study the most plausible future scenarios of greatest interest through the definition of possible management models integrated into the national and EU fiscal system. This enables a quantitative and reliable assessment of the current cold ironing incentive policies in promoting this technology, with some guidelines provided for the future promotion of this sector.
1. Introduction
Extreme weather events and environmental changes in recent years have been a growing cause for concern globally. Among the main events and trends observed is a general increase in global average temperatures caused by the accumulation of greenhouse gases in the atmosphere. This is mainly due to human activities such as the use of fossil fuels and deforestation. Another significant factor is the increasing occurrence of extreme weather events, such as heat waves, tropical cyclones, floods, and forest fires, which have become more frequent and intense.
Over the years, there have been significant efforts to address climate change globally. One of the first political steps in this direction was the Kyoto Protocol, an international agreement to combat climate change by reducing greenhouse gas emissions. The Protocol established binding targets for reducing greenhouse gas emissions, based on 1990 levels, with the aim of reducing participating countries’ overall greenhouse gas emissions by 5.2%. It also introduced the emissions trading scheme known as the Emissions Trading System (ETS).
On 11 December 2020, the European Commission approved the “FitFor55” package, with the ambitious goal of reducing greenhouse gas emissions by at least 55% by 2030 (compared to 1990 levels) and then aiming to achieve net-zero emissions by 2050. These proposals reflect the European Union’s commitment to fighting climate change through a series of concrete measures and actions, starting with the introduction of the ETS reform. This has been further strengthened and expanded to include new sectors, such as aviation and maritime transport, to reduce greenhouse gas emissions from the most polluting sectors and discourage the emission of pollutants [1].
In this regard, the shipping sector plays a significant role. Shipping traffic to and from ports belonging to the European Economic Area accounts for approximately 11% of the EU’s transport-related CO2 emissions and 3–4% of the EU’s total CO2 emissions [2]. In view of these figures, FuelEU Maritime [3] was introduced between 2020 and 2021 to promote the use of renewable and low-carbon fuels in maritime transport and European ports. It specifies the obligation for ships to use cold ironing systems in European ports from 2030. In March 2023, the Council and the European Parliament reached an agreement on this proposal, defining the exemptions (see Article 5 [4]).
This is where cold ironing, also known as “shore power”, “shore-side electricity”, or “Alternative Maritime Power (AMP)”, i.e., the supply of electricity from land to docked ships, comes into play as an alternative to the traditional on-board generation system, thus reducing harmful gas emissions into the atmosphere, improving air quality in ports, and reducing local noise pollution [5,6]. Figure 1 shows the general architecture of On-shore Power Supply (OPS) systems, as proposed in [7].

Figure 1.
General architecture of OPSs [7].
The energy balance advantage is based on the assumption that the electricity supplied by the port is generated with higher efficiency and from cleaner sources than traditional ship diesel engines. Traditional on-board generation emits pollutants, the most significant of which are SOX, NOX, PM10, and CO2. These agents cause significant damage within specific impact categories. Moreover, this form of pollution is largely local, with a significant impact on port areas and the quality of life of workers and residents. In Italy, a total of EUR 700 million has been allocated to electrify 34 ports for cold ironing alone.
To date, there are no functioning cold ironing systems in Italy. Therefore, the objective of this research is to analyse in detail the factors that affect economic sustainability by examining national and international laws as well as business model alternatives and trends in electricity and marine fuel markets. The application of the model to a specific plant allows for determining whether, and under what conditions, the OPS is economically sustainable in Italy. The ultimate goal, therefore, is to assess and quantify the importance of current cold ironing incentive policies in promoting this technology.
2. High-Voltage Shore Connection (HVSC) Systems
In the case of HVSC systems, i.e., systems dedicated to ships requiring at least 1 [MVA], the technical standard IEC 80005-1 [8] introduces the block diagram depicted in Figure 2.
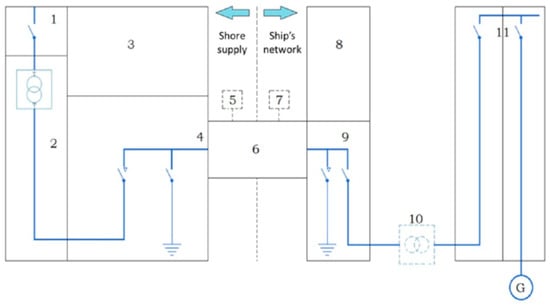
Figure 2.
Block diagram of a typical HVSC system arrangement (IEC 80005-1). 1: Shore supply system; 2: Shore-side transformer; 3: Shore-side protection relaying; 4: Shore-side circuit-breaker and earth switch; 5: Control shore; 6: Shore-to-ship connection and interface equipment; 7: Control ship; 8: On-board protection relaying; 9: On-board shore connection switchboard; 10: On-board transformer (where applicable); 11: On-board receiving switchboard.
Table 1 lists the main types of vessels, along with the rated Alternating Current (AC) voltage and power levels reported in the annexes to IEC 80005-1. The powers indicated are the maximum theoretical values for which the system should be designed.

Table 1.
Voltages and powers of various vessels, according to the annexes of standard IEC 80005-1.
Surveys conducted among major shipping companies show that most vessels require less power than what is reported in Table 1. According to the data shared, the maximum power required by a cruise ship does not exceed 15 [MW] and is often between 8 [MW] and 12 [MW], with a theoretical Delay Power Factor (DPF) of around 0.9, as shown in Figure 3, which reports actual operating data.
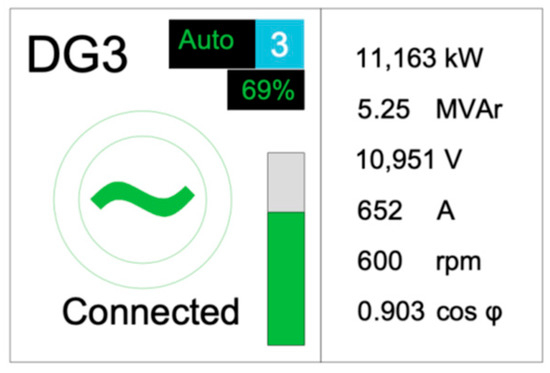
Figure 3.
Operation of a cruise ship docking at an Italian port.
Finally, the same annexes to IEC 80005-1 also contain information on connections, summarised in Table 2. It should be noted that in order to connect the Junction Box (JB), which is commonly located on the ground, a connection system (fixed or mobile) called a Cable Management System (CMS) is required, which connects the ground system to the ship’s on-board system.

Table 2.
Additional requirements for various vessels, imposed by IEC standards.
3. Determining the Cost of a Stopover with Cold Ironing
The following section introduces the most influential factors in determining the cost per MWh of electricity and shows various possible management models for the port system.
3.1. ARERA
In Italy, the Regulatory Authority for Energy, Networks and Environment (ARERA), as the competent body, regulates and controls the energy sector and sets the tariffs for access to electrical infrastructure, including the costs associated with the transmission, distribution, and metering of electricity. It also allocates general system charges to end customers. Each of these parameters is, in turn, divided into components proportional to the power of the system, the energy required, or the number of points of delivery present.
In particular, the tariffs envisaged by ARERA [9] are as follows:
- Transmission (TRAS): “The TRAS tariff covers the costs of transporting electricity on the national transmission grid. It is applied to all end customers, with the exception of low-voltage domestic users. The TRAS tariff consists of a component expressed in euro cents/kWh (TRASE) and a component expressed in euro cents/kW of committed power capacity (TRASP), the latter applied only to high or very high voltage users.” [10].
- Distribution (DISTR): “The mandatory tariff for distribution services covers the costs of transporting electricity on distribution networks. It applies to all end customers, with the exception of low-voltage domestic users. The tariff has a three-part structure and is expressed in euro cents per point of delivery per year (fixed charge), euro cents per kW per year (power charge) and euro cents per kWh consumed (energy charge).” [11].
- Measurement (MIS): “The MIS tariff is intended to cover the costs of installing and maintaining the meter, as well as the costs of reading and recording the measurements. It is applied to all end customers, with the exception of low-voltage domestic users. The tariff is expressed in euro cents per kWh consumed for public lighting and low-voltage users supplying public electric vehicle charging infrastructure, and in euro cents per withdrawal point per year for all other uses” [12].
- General system charges: “In addition to sales services (raw materials, marketing and sales), network services (transport, distribution, meter management) and taxes, electricity bills also include certain components to cover costs for activities of general interest to the national electricity system: these are known as general system charges, introduced over time by specific regulatory measures. In recent years, general system charges have represented a growing and increasingly significant share of end users’ total annual electricity expenditure. Starting in 2018 (Resolutions 481/2017/R/eel and 922/2017/R/eel), the rates of general charges to be applied to all types of contracts are divided into:
- ○
- ASOS: general costs relating to the support of renewable energy and cogeneration;
- ○
- ARIM: remaining general expenses;
- ○
- UC3: to cover imbalances in the compensation systems for electricity transmission costs on transmission and distribution networks, as well as integration mechanisms, expressed in euro cents/kWh.
- ○
- UC6: to cover recognised costs arising from service quality improvements. It is expressed in euro cents/kW and euro cents/kWh for domestic users, while for other users it is expressed in euro cents/pp and euro cents/kWh.” [13].
As briefly reported in Figure 4, on 28 May 2024, the Authority published the document for consultation, “[Orientamenti dell’Autorità per l’attuazione di quanto disposto dall’art.34-bis del decreto-legge 30 dicembre 2019, n. 162 e s.m.i., in tema di agevolazioni per la fornitura di energia elettrica alle infrastrutture di cold ironing] Guidelines from the Authority for the implementation of what defined by article 34-bis of decree-law no. 162 of 30 December 2019, as amended and supplemented, on incentives for the supply of electricity to cold ironing infrastructures” [14], in which it referred back to the European Union’s decision on the amount of discount to be applied to cold ironing systems (initially introduced by Article 48 of Decree 76, paragraph 7-bis [15] of 16 July 2020) to be included in the general system charges.
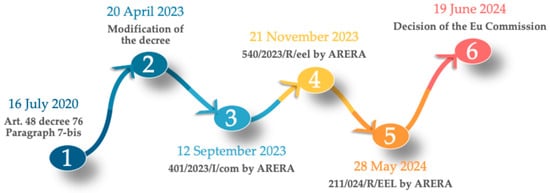
Figure 4.
Summary of reforms issued concerning general system charges.
In addition, this measure presented two possible methods for applying the tariffs:
- Discounts are directly applied to electricity bills from the POD to which the Cold Ironing (IdC) infrastructure is connected. The discounted values of the OGS tariff components would then be applied to the bill (ex-ante approach, similar to what already happens today under the current subsidy scheme for energy-intensive businesses). This approach would be easily applicable by ARERA only where the POD is dedicated exclusively to powering IdC.
- The Cold Ironing Infrastructure Manager (GdI) would pay the OGSs the ‘full’ rate in the bill and recover the discounts to which it is entitled through a periodic refund received from CSEA, based on reports prepared by the GdI (ex-post approach, similar to what happened under the first mechanism for facilitating energy-intensive companies, pursuant to Ministerial Decree 5/4/2013). This approach would allow ARERA to discount only the portion of energy sold to the ship, leaving the plant operator to bear the general system charges for the portion of energy withdrawn but not exchanged.
On 19 June 2024, several national newspapers [16,17,18,19] finally reported that the European Commission had approved EUR 570 million in aid to encourage ships to use electricity supplied by Italian cold ironing facilities from land-based electricity grids when docked in seaports. The scheme will remain in force until 31 December 2033, and the aid will initially take the form of a reduction of up to 100% of the so-called “general system charges”.
3.2. Gestore Mercati Energetici (GME)—Energy Market Operator
Another factor to consider is the ‘net’ price of electricity. When we talk about the ‘Italian power exchange’, we are referring to the Gestore Mercati Energetici (GME).
The electricity market in Italy, as we know it today, was created by Legislative Decree No. 79 of 16 March 1999 (Legislative Decree No. 79/99), otherwise known as the Bersani Decree. This legal framework enabled the privatisation of energy, allowing all interested companies to produce, purchase, and sell electricity and gas, thereby promoting competition and lowering costs for end customers.
The GME, which brings together energy producers and suppliers, is divided into two main types:
- The Forward Electricity Market (MTE), where contracts for the future delivery of electricity are traded. In this particular market, participants (producers, distributors, and industrial and institutional consumers) can enter into agreements to buy or sell a specific quantity of electricity at a predetermined price for a future date. This type of market is often used for risk management, energy cost stabilisation and long-term planning purposes.
- The Spot Market (MPE) is divided into the Day-Ahead Market (MGP), the Intra-Day Market (MI), the Daily Products Market (MPEG), and the integrated scheduling process (MSD). Most energy is traded on the MGP through hourly auctions (managed by Euphemia, a centralised European algorithm) and delivered the following day. These auctions stipulate the following:
- Sales bids are ordered by ascending price, thus creating the supply curve;
- Purchase bids are ordered by descending price, thus producing the demand curve.
The intersection of the two curves determines the total quantity traded and the unit price per MWh, known as the National Single Price—Prezzo Unico Nazionale (PUN).
It is therefore clear that, once self-production is excluded, part of the electricity cost depends on this parameter. The graph in Figure 5 shows the monthly average PUN values in [EUR/MWh] from January 2017 to September 2025. Its spot value varies widely, from zero to almost 1000 euros per MWh (in particular due to COVID, wars and other international tensions), but the average value has remained within a characteristic range for over 14 years. However, as it is directly linked to the price of gas relative to the energy mix used for electricity production in Italy, this value has increased enormously in recent years, reaching a record high in 2022 and subsequently stabilising at levels still higher than the pre-2021 averages.
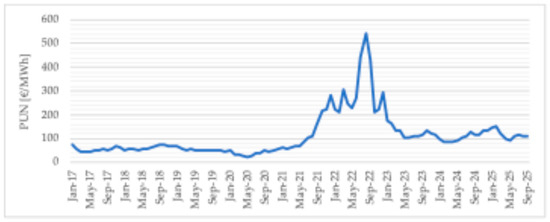
Figure 5.
Trend of the monthly average PUN from January 2017 to September 2025.
The cost the operator of a shore-to-ship plant must cover to procure electricity for resale to ships will therefore be directly linked to the average PUN; the cost of participating in the electricity market or the additional fee charged by an energy trader must then be added to this.
3.2.1. Cost of Participating in the Italian Electricity Market
Table 3 and Table 4 show the tariffs required by the GME for participation in the Italian electricity market.

Table 3.
Fixed amounts required by the GME.

Table 4.
Variable amounts required by the GME.
3.2.2. Amount Requested by an Italian Electricity Trader
Below, by way of example, is the offer of an Italian electricity trader, issued specifically for this analysis, for industrial users at different voltage levels:
where the following applies:
P = PUN(1 + λ) + α
- PUN is the monthly arithmetic mean published by the GME [EUR/MWh];
- λ is the fee requested by the trader and, according to the offer referred to, amounts to 30 [EUR/MWh];
 Table 5. Network losses established by ARERA, applicable to electricity traders (valid from 1 January 2023).
3.3. Management Models
Another factor that strongly affects the final price of energy is the operator managing the plant, the costs it incurs, and its purpose. To account for this significant yet highly variable factor, various management models were implemented in the analysis, as summarised in Figure 6.

Figure 6.
Basic scheme of the models.
3.3.1. Model No. 1
The plant is managed by an authority that pays an annual fee to operate it, relies on an energy trader, and sells with the aim of generating a profit. The energy share, consisting of each individual value proportional to the MWh absorbed, will be increased, generating the selling price of the electricity. The surcharge will allow the operator to cover all expenses and losses incurred by the plant and generate a profit. Obviously, this model will lead to a higher final selling price per MWh, as several parties are involved, each contributing to higher costs to maintain their own profit margins.
3.3.2. Model No. 2
The plant is managed by an energy trader, again, in return for a concession fee. In this case, the management cost is the same, but the supply cost decreases, as it only has to cover the PUN, network losses, and the share of participation in the electricity market. With regard to this share, it should be noted that when developing the calculation model, the following choices were made:
- The “one-off” fee, already paid in advance by the trader in order to carry out their activity, was disregarded.
- Only part of the annual fixed cost (totalling EUR 10,000) was imposed on the management of the cold ironing plant; this is in accordance with the following equation, where E1 represents the energy purchased on the electricity market by the supplier to be resold/used in the “traditional” course of its business [TWh/year], and E2 is the energy purchased only for the management of the cold ironing system alone [TWh/year]:
3.3.3. Model No. 3
The plant is managed by an authority (e.g., the Port System Authority, AdSP, terminal operators, or directly by a shipowner) that participates directly in the electricity market, pays no additional annual fees for system management, and sells without generating a direct profit. The electricity is therefore sold to ships at a price that allows the operator to cover all costs safely, but without generating a direct profit. In this model, therefore, a heavily subsidised sale is assumed in order to promote the port and increase the number of berths, thus generating an indirect profit for the AdSP or, in the case of direct management by a shipowner, to minimise berthing costs.
The selling price will always be obtained by adding to the expenses incurred, but in the latter model, a margin of almost zero is assumed, although this is sufficient to ensure that the managing authority does not suffer a financial loss if, for example, the annual energy supplied to the vessels has been overestimated or the costs underestimated.
3.4. Additional Expenditure Items
The costs of routine and extraordinary maintenance, staff salaries, insurance, and other items (such as consultancy fees) are costs that are independent of the authority that will manage the plant.
Another very important aspect for this analysis is taxation. Electricity is subject to excise duties that vary depending on the user, use, and amount of energy consumed. With European approval [21], Italy has introduced significantly reduced excise duties on cold ironing systems [22] in an effort to promote their development, dissemination, and sustainability. Table 6 shows the different amounts required in Italy.

Table 6.
Italian excise duties on electricity, depending on usage.
Finally, another important factor is the technical efficiency of the plant, which allows for electrical losses and the consumption of auxiliary systems to be taken into account, a topic that will be discussed in detail later in this article. Finally, it should be noted that the analysis did not consider the costs of designing, constructing, and testing the plant, as these were fully financed by national and international investments.
4. Cost of a Standard Stopover
The cost of a standard stopover depends on three macro factors: the vessel’s specific fuel consumption, the net price of fuel, and the cost of emissions.
4.1. Specific Fuel Oil Consumption (SFOC)
Specific Fuel Oil Consumption (SFOC) indicates the amount of fuel oil needed to produce a certain amount of energy on board. It is generally expressed in grams of fuel oil consumed per kilowatt hour produced [g/kWh] or in kilograms per megajoule [kg/MJ]. The value of 175 [g/kWh] is often quoted in the literature and in the technical data sheets of engine manufacturers, as shown, for example, in Figure 7 taken from a technical data sheet for a Wärtsilä S.p.A. engine (model 46F IMO Tier II). Further clarifications will be provided below.

Figure 7.
Excerpt from a Wärtsilä S.p.A. marine engine technical data sheet (model 46F IMO Tier II).
4.1.1. Influence of the Lower Calorific Value of the Fuel and Construction Tolerance
The SFOC declared by the engine manufacturer refers to standard ISO environmental conditions (as shown in Figure 7) and the use of fuel with an ISO Lower Calorific Value (LCV) of 10,200 kcal/kg (compared to 9400–9800 kcal/kg for commercially available heavy fuel oil). In addition, the manufacturer guarantees consumption with a margin of tolerance of ±5% (in some cases, 3%). Since experience shows that the engine never consumes less than the declared value, the tolerance must always be assumed to be positive. The actual SFOC is assumed to be equal to:
4.1.2. Influence of Temperature and Load
Specific fuel consumption is strongly influenced by the load at which the engine operates and the environmental conditions in which it operates, as reported in the study “Performance Analysis of Turbocharged 2-Stroke Diesel Engine” on the MAN 7K98ME-C7-TII engine [23]. In the case of ships, the engines are located in the “active part” of the ship, in a closed, controlled room; therefore, the external temperature should not have a significant impact, but consumption will certainly differ from ISO conditions. However, dependence on the engine load remains a relevant factor. Obviously, the engine will have been chosen to operate regularly at the load that minimises SFOC, but since this parameter is a function of highly variable users (e.g., air conditioners, heat pumps, other cabin services, and the number of passengers on board), it cannot remain constant and equal to the optimal percentage.
4.1.3. Other Influencing Factors
Consumption is also influenced by the following factors:
- Engine ageing;
- Performance of the various devices downstream of the engine;
- Type of engine [24];
- Distribution losses in the ship’s internal network.
4.1.4. SFOC Assessment
Given the impossibility of knowing exactly all the elements that influence SFOC, in particular, the type of engine used by each individual ship, the efficiency of on-board systems, the level of maintenance that is upheld, and all other influencing factors, it was decided to adopt a much more direct method for determining SFOC for the analysis, based on actual measured values.
Some companies contacted directly by the authors provided data on the power required in “Cold Areas” and “Warm Areas” and an estimate of the gallons consumed [p/h] to meet the above power requirements. The responses received are shown in Table 7.

Table 7.
Data provided to the authors through interviews.
By knowing the gallons saved per hour, associating maximum fuel consumption with the highest power required and minimum consumption with the lowest, it was possible to obtain the results shown in Table 8, according to the following formula:

Table 8.
Calculation of specific fuel consumption based on the data received.
As shown in Table 8, the actual quantities differ greatly from the theoretical 175 [g/kWh] cited before.
4.2. Fuel Price
There are various types of marine fuel on the market, differentiated mainly by their sulphur content, which leads to the release of sulphur dioxide (SO2) into the atmosphere, in accordance with the approximate relationship below:
With the IMO Sulphur 2020 regulation, the International Maritime Organisation (IMO) has required shipowners to use low sulphur fuel oil (LSFO) with S% ≤ 0.50% (compared to the previous global limit of 3.5%) since 1 January 2020. In addition, there are currently four Emission Control Areas (ECAs) worldwide where the use of ultra-low sulphur fuel (S% ≤ 0.1%) is required. IMO Resolution MEPC 176 clarified that the purpose of these areas is to prevent, reduce, and monitor air pollution from substances such as nitrogen oxides (NOX), SOX, and particulate matter (PM).
On 15 December 2022, during the session on marine environment protection, the IMO established that, as of 1 May 2025, the Mediterranean Sea would become the fifth area in the world to be a sulphur oxide and particulate matter emission control area [25,26,27,28].
The main fuels currently on the market are presented below:
- Marine Gas Oil—MGO (S% ≤ 0.1%);
- Very Low Sulphur Fuel Oil—VLSFO (S% ≤ 0.5%);
- Intermediate Fuel Oil—IFO (S% ≤ 1%).
As explained, each type of fuel has different characteristics and, consequently, different costs. Figure 8 [29] shows the price trends for the different types of fuel. The graph shows considerable volatility in the price of various bunker oils, as they are inextricably linked to the cost of crude oil, which is subject to global politics and events. This is confirmed by Figure 9 [30], which shows the trend in the price per barrel of oil. The two grey areas highlight the variability of the price.
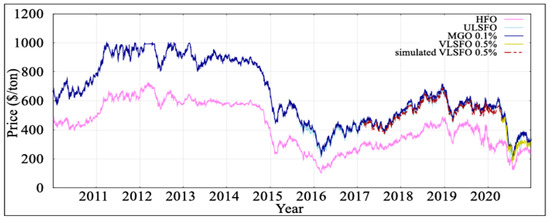
Figure 8.
Historical prices of marine fuel.
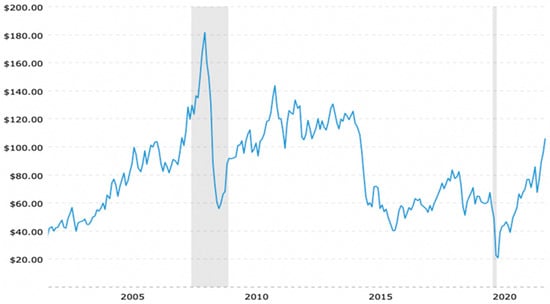
Figure 9.
Trend in the price per barrel of oil.
4.3. Cost of Emissions
In February 2018, the European Parliament approved the reform of the EU-ETS market, leading to a significant increase in prices, as can be seen from the graphs in Figure 10 and Figure 11 [31].
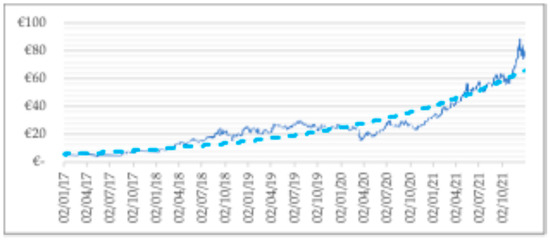
Figure 10.
Daily prices of emission allowances from 2017 to 2021; source: SENDECO2.
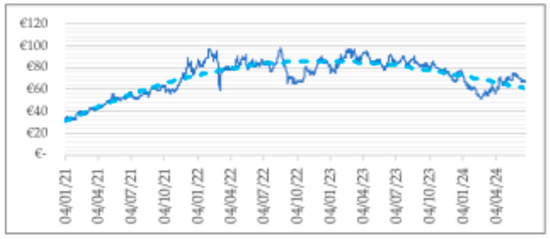
Figure 11.
Daily prices of emission allowances from 2021 to the second quarter of 2024; source: SENDECO2.
Following the European reform, prices have risen almost exponentially since 2018 (blue curve in Figure 10) and have remained between EUR 50 and 100, as shown in Figure 11. According to some analyses [32], the amount of emission allowances is set to rise (moderately) in the future, reaching an average value of EUR 100 in 2030.
According to the new version of the emissions trading scheme [33], shipowners will have to purchase allowances in order to offset their emissions, calculated (in tonnes) on the basis of the communication pursuant to Regulation (EU) 2015/757 as follows:
where the following applies:
- CO2(V) indicates the aggregate CO2 emissions of all journeys made between ports under the jurisdiction of a Member State;
- CO2(S) indicates emissions occurring at berth in ports under the jurisdiction of a Member State;
- CO2(P) indicates the aggregate CO2 emissions of all legs of the journey, departing from ports under the jurisdiction of a Member State;
- CO2(A) indicates the aggregate CO2 emissions of all legs of the journey to ports under the jurisdiction of a Member State.
To ensure a smooth transition, shipping companies will only need to give up allowances for a portion of their emissions during an initial phase-in period:
- For 2025: A total of 40% of their emissions reported in 2024;
- For 2026: A total of 70% of their emissions reported in 2025;
- For 2027 onwards: A total of 100% of their reported emissions [34].
The relationship between tonnes of carbon dioxide emitted and tonnes of fuel used has been the subject of various studies and is expressed differently in the literature [35]. For the current analysis, we have chosen to consider 3.1144 tonnes of CO2 emitted for each tonne of fuel burned, in accordance with the study “How emissions from cruise ships in the port of Naples changed in the COVID-19 lockdown period” [36]. With this parameter, knowing the SFOC, it is possible to calculate the amount of carbon dioxide emitted, which is valued at the unit cost of emitting 1 tonne equivalent of carbon dioxide (an input parameter of the problem, as detailed numerically in the following case study). This cost item, linked purely to carbon dioxide emissions, is added to the mere cost of purchasing the fuel (SFOC multiplied by the corresponding fuel price) to determine the total cost of a unit of electricity generated on board the ship.
5. Case Study
To provide numerical data, the mechanisms described above were applied to a cold ironing system located in Italy, the design of which was supervised by the authors. The plant consists of an HV/MV station with a dedicated connection to the national electricity grid at 150 [kV], which is expected to be located near the MV substation (called CEB) serving the port cold ironing system. In the HV/MV station, the grid voltage is reduced to 20 [kV]. In the CEB substation, the grid voltage and frequency are adjusted to the values required by the ships using input transformers, frequency converters, and output transformers. Since the system will be entirely dedicated to supply cruise ships, it is appropriate to apply the ex-ante approach proposed by ARERA in the analysis. The project envisages the use of six Junction Boxes (JBs) distributed across two different port docks, capable of powering a maximum of two ships simultaneously.
5.1. Assessment of Energy Demand
To assess the energy requirements of ships and calculate the plant’s efficiency, the 2025 mooring schedule was analysed. According to this document, shared by the terminal operators of the port that manages the two quays, 217 moorings are planned for dock 1 and 165 moorings for dock 2 during this year, for a total of 382 moorings, equivalent to 3783 h of mooring, for an average duration of 9 h and 54 min each. The used database, including data of over 120 vessels, was made available to the authors. It was therefore possible to analyse 254 berthing operations divided into the various moorings. For dock 1, exact data was available for 179 of the 217 berthing operations (82%), while for dock 2, exact data was available for 75 of the 165 berthing operations (45%).
According to the analysis, as shown in Figure 12, the average peak power of the ships to which the 254 analysable berthing operations refer corresponds to 10.5138 [MW].

Figure 12.
Power required by ships moored at quay 1 and quay 2, expected for 2025.
Assuming that the 128 moorings carried out by ships for which insufficient data is available are similar to the rest, it is reasonable to state that the average peak power corresponds to 10.50 [MW] for all moorings. Given that the average power in cruise ships, due to their particular use, should not differ greatly from the maximum value, for the analysis, it was decided to assume an average power per berthing of 10 [MW], i.e., it was assumed that the average power corresponds to over 95% of the peak power.
The study also included the time required for connection/disconnection between the ship and the mainland, as well as the time required to conduct electrical checks on board. This time interval is acknowledged to be less than half an hour on average, so, compared to the arithmetic average duration of 9 h and 54 min, it was decided to consider an average duration of 9 h and 30 min for connection at berth.
Finally, for the analysis, the following was assumed:
- In 2026, only 80% of ships will be equipped with the necessary systems for connection;
- In 5% of cases, the connection will not be established for various reasons (e.g., unavailability of ship or shore-side equipment, operational requirements decided by the Captain, maintenance activities, etc.);
- Given the ongoing increase in cruise traffic, it is estimated that there will be a 2% increase in moorings compared to 2025.
As a result of the assumptions, the total electricity consumption equals the value calculated using Formula (7).
5.2. Plant Performance
Based on the mooring schedule, it can be seen that in 21% of cases, only quay 1 will be used, in 8% of cases, only quay 2 will be used, and in 71% of cases, both quays will be used simultaneously. Considering the type of on-board electrical system of the vessels, all berths require a power supply of 11 [kV] with a frequency of 60 [Hz], with the exception of three berths on quay 2, where the required voltage is lower (6.6 [kV], still at a frequency of 60 [Hz]) in 2025. A statistical analysis was therefore carried out, as shown in Table 9, Table 10 and Table 11.

Table 9.
Calculation hypothesis.

Table 10.
Moorings (2026).

Table 11.
Voltage and load frequency (2026).
Table 12 summarises the six possible operating scenarios, taking the 2025 calendar as a starting point to establish the distribution of this load between the docks.

Table 12.
System operating scenarios (2026).
Furthermore, it should be noted that the furthest power outlet on dock 1 is approximately 800 m from the CEB cabin, while the furthest outlet on dock 2 is 900 m away. As a precautionary measure, these distances have been taken into account in calculating efficiency. Finally, among the most energy-intensive auxiliary equipment in the substation are two chillers dedicated to cooling, each with a power rating of 210 [kVA], which will be assumed to be always switched on and operating at 100% of their power rating when the branch associated with them is active.
Figure 13 shows the plant layout of one of the six operating configurations detailed in the table above. Configuration 5 was chosen, as it is the most diverse, with simultaneous power supply to both platforms at different voltage levels.
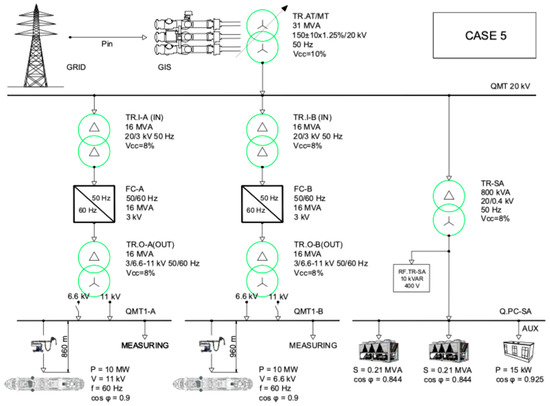
Figure 13.
Operation of the cold ironing system (case 5).
Table 13 shows the results of the analysis carried out. Based on the information provided (e.g., transformer type and size, cable length, etc.), the system efficiency is calculated to be 89.69%, as shown in Table 13. In subsequent calculations, the authors considered it prudent to use a reduced value of 88.5% as the average annual efficiency of the system. This reduction of approximately 1.2% allows for various factors to be included, such as variations in the efficiency of machines operating at partial loading, ageing of the system, operation at high temperatures, changes that the project may undergo during execution/construction (e.g., choice of cheaper and less efficient equipment), etc.

Table 13.
Average plant performance.
5.3. Summary of the Data Supporting the Analysis
Once the technical characteristics of the system were defined in relation to the connection requests of vessels to the port facility, Table 14, Table 15 and Table 16 were constructed and briefly report the main hypotheses considered in the economic analysis of the case study. In detail, key values underlying the cost computation of a cold ironing stopover are summarised in Table 14. While the business Models 1 and 2 assume a 15% profit margin, Model 3 considers a 3% safety margin, i.e., a highly subsidised model that could be comparable to public asset management. Key values underlying the cost computation of traditional parking are summarised in Table 15, and other relevant parameters are collected in Table 16.

Table 14.
Key values underlying the calculations for the cost of a cold ironing stopover.

Table 15.
Key values underlying calculations for the cost of traditional parking.

Table 16.
Summary of the main values underlying the case study.
5.4. Additional Relevant Aspects
There are several advantages (ship-side) to adopting cold ironing systems instead of traditional on-board generation systems, such as the following:
- Switching off the engine;
- Reduced noise and vibrations for passengers and crew;
- Better air quality;
- A reduction in localised pollution.
In particular, the first benefit mentioned has a direct economic impact. Using shore power obviously reduces fuel consumption and, therefore, the costs associated with its purchase, as well as pollutant emissions. The main purpose of this analysis is to determine whether purchasing electricity is more advantageous than the cost of using the traditional on-board fuel system. For the sake of completeness, this paragraph will outline four additional factors that have an economic impact on the use of cold ironing systems, even though these will then be disregarded in subsequent economic assessments for the reasons outlined below.
5.4.1. Reduced Maintenance
Turning off the engine while moored not only reduces fuel consumption but also decreases the use of power generation systems, resulting in savings on the maintenance of these machines.
The study “Port of Trieste—Action plan for a sustainable, low CO2 emissions port” [40] reports that a Roll-on/roll-off ship with a power requirement of 1.5 MVA, which docks in a port 30 times a year (for a total of 720 h of mooring), has an annual saving in avoided maintenance costs of EUR 3456.
This means that each hour (of the 720) spent in port results in an average saving of EUR 4.80. If we were to blindly apply the study’s findings to the case in question, where ships dock for an average of 9.5 h, the savings on the ship side would be close to EUR 45.60 per docking. As this amount has little influence on the economic analysis, it was decided to disregard it.
5.4.2. Reduction in Fuel Required for the Journey
Fuel consumption is directly proportional to the weight to be transported; this relationship generally holds for any vehicle that uses fuel for propulsion. To estimate the impact of this factor, it was assumed that the fuel not used during mooring is a simple commodity that implies an additional consumption during the journey, based on its weight and the distance travelled. In particular, as summarized in Table 17,

Table 17.
Parameters for estimating the reduction in fuel requirements along the route.
- The amount of fuel needed to power the ship while moored was calculated in tonnes (T1);
- The amount of fuel required for the ship to move 1 tonne for 1 kilometre was calculated in tonnes (T2);
- The quantity calculated in the previous point is multiplied by the number of kilometres travelled by the ship from a generic port of departure to the port under analysis;
- The calculated fuel quantity is multiplied by the fuel price.
Using the previous assumptions, the following is obtained:
Considering the use of the most expensive fuel (MGO), this results in a saving of EUR 12.01 per trip. This saving is also insignificant compared to the economic factors considered in the analysis and was, therefore, disregarded.
5.4.3. Cost of Implementing the Ship-Side Electrification System
The report “Port of Trieste—Action plan for a sustainable, low CO2 emission port” [40] provides an estimate of the costs, shown in Table 18, that a ferry must bear in order to implement the systems necessary for electrical connection to the port.

Table 18.
Estimated costs for the on-board implementation of the systems necessary for electrical connection to the port.
The total investment is therefore EUR 455,000. The authors have chosen to disregard this amount in the economic analysis, since, as mentioned in the introduction, every ship will have to be equipped with this system from 2034 onwards. As this is a legal requirement rather than a free choice, it was decided not to include such a significant figure in the comparison of the two different ship propulsion systems.
5.4.4. Penalty for Failure to Connect
Since connection to the port system is mandatory by law, it is reasonable to assume that a financial penalty will be introduced if the shipowner decides not to connect. This penalty could be significant enough to have a real impact. However, given that the obligation will only come into force in 2030 (the analysis presented here focuses on the year 2026) and that, to date, there is no official information regarding this possible penalty, it has been decided to disregard this factor as well.
6. Results of the Analysis
The article aims to analyse the technical and economic configuration of a cold ironing system in relation to current legislation, and to assess its methodological and quantitative adequacy with respect to the traditional scenario of on-board electricity generation on ships. The following extreme scenarios are proposed:
- Analysis 1: The occurrence of all conditions favourable to the sustainability of the plant (Section 6.1);
- Analysis 2: The complete absence of cold ironing incentive policies (Section 6.2).
Data for an effective ex-post analysis are not available, but it is reasonable to assume that it would fall within the extreme scenarios studied in Section 6.1 and Section 6.2, depending on whether the application of cold ironing incentive policies is more or less effective.
6.1. Analysis 1—Existing Regulatory Framework
The first analysis corresponds to the reference scenario, with the results shown in Figure 14. It focuses on the “status quo”, i.e., it considers all the factors and reforms presented above based on the data shown in Table 14, Table 15 and Table 16.
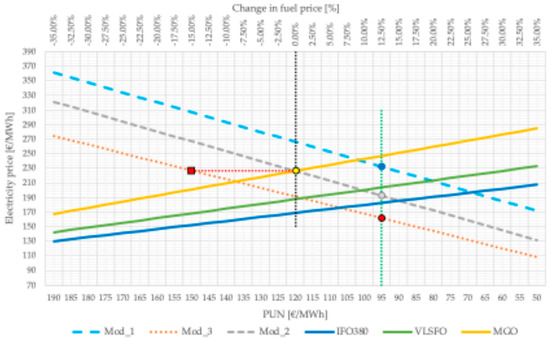
Figure 14.
Case study results—Analysis 1 (existing regulatory framework). Cold ironing electricity costs in the three considered management models (dotted lines) compared with the cost of on-board electricity generation with three different fuels (solid lines).
The dotted lines represent the prices for supplying electricity from the cold ironing port facility under the three management models introduced and detailed in Section 3.3 above. The electricity price on the market (PUN) is considered to be in the range 50–190 [EUR/MWh] (bottom horizontal axis, in descending order to show decreasing trends). It is confirmed that the cold ironing electricity price decreases linearly as PUN decreases. From the perspective of the vessels’ owners, Model No. 3 is confirmed to be the most interesting in terms of cold ironing electricity tariffs.
The solid lines represent the cost of electricity generated by on-board generators. In this case, the three types of fuel introduced in Section 4.2 (IFO380, VLSFO, and MGO) are considered, with a range of variation in fuel cost between −35% and +35% of the present reference price, which is used as the benchmark (upper horizontal axis). MGO is confirmed to be the most expensive fuel, whereas IFO380 reduces the cost for on-board electricity generation.
Therefore, Figure 14 allows for identifying the economic trade-off of cold ironing by graphically comparing the following:
- The three dotted lines (which represent the cost of electricity supplied from the port to the ship). This cost depends on the cost of electricity on the market (PUN) and the specific characteristics of the economic models considered for the provision of the cold ironing service (the management models are represented by three different colours);
- The three solid lines (which represent the cost of self-producing electricity on board the ship, in relation to the type of fuel and the variation in its cost).
For example, considering a PUN of 95 [EUR/MWh] (as indicated in Figure 14 by the vertical dotted green line, compared to the annual average of 103 [EUR/MWh] recorded by the GME in 2024), the electricity supply cost should be 161.74 EUR/MWh for Model No. 3 (red dot), 192.62 EUR/MWh for Model No. 2 (grey dot), and 232.46 EUR/MWh for Model No. 1 (blue dot). If the reference fuel price is considered (vertical dotted black line in Figure 14) and the ship does not use scrubbers (and was, therefore, obliged to burn MGO to generate energy on board), the on-board generation price should be 226.09 EUR/MWh (yellow dot). Therefore, in this case, it is confirmed that the cold ironing system would be the most economical choice for the shipowner if it were managed in accordance with Model No. 2 and Model No. 3, while the use of the port connection would be economically equivalent if the system were administered in accordance with Model No. 1.
Similarly, it can be concluded that, taking the use of MGO at the current fuel price as the benchmark (horizontal dotted red line passing through the yellow point), business Model no. 3 remains more cost-effective up to a PUN of around 150 EUR/MWh (red square marker).
However, if the vessel were equipped with on-board abatement systems and could therefore use fuel with a higher sulphur content, such as IFO380, only the third management model would guarantee the economic advantage of shore power over the traditional on-board generation system.
It is interesting to note that, with PUN aligned with pre-2020 values (pre-COVID and with less international geopolitical tension) and equal to 60 [EUR/MWh], shore power would be the best economic choice for the shipowner, regardless of the management model, even in the event of a 25% reduction in the cost of marine fuel.
From an environmental perspective, an estimate of avoided emissions over a 10-year period was carried out, considering MGO as the fuel used and the actual Italian generation mix. The overall reduction in CO2 emissions is estimated at approximately 64,000 tonnes. In addition, NOx emissions are expected to be reduced by 3.19 thousand tonnes and particulate emissions by approximately 74 tonnes.
6.2. Analysis 2—Absence of Cold Ironing Incentive Policies
The second analysis examines the economic sustainability of the cold ironing system under study, taking into account the net effect of various Italian and European reforms, both to its advantage and to its disadvantage relative to the traditional on-board power supply system.
We therefore chose to analyse the price that could be charged by port facility operators if both the excise duty relief and the general system charges were to be abolished (but still considering the cost of designing and building the facility to be zero), comparing it with the cost of on-board generation if shipowners were no longer obliged to participate in the ETS market. The results of this analysis are shown in the graph in Figure 15, which uses the same legend as Figure 14.
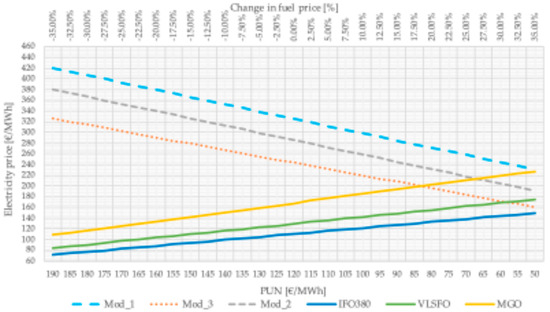
Figure 15.
Case study results—Analysis 2 (absence of cold ironing incentive policies).
Taking VLSFO as a reference, i.e., the fuel most commonly used in the Mediterranean Sea prior to European reforms, it appears that even if the PUN fell below 60 [EUR/MWh], the cold ironing plant would only be economically viable if managed in accordance with Model No. 3 and only if the fuel price increased by more than 25% of the considered base price. This analysis demonstrates the strategic importance of European reforms and incentives for cold ironing plants, without which their economic sustainability would be very precarious and highly uncertain.
6.3. Analysis 3—Influence of the Amount of Electricity Sold for Cold Ironing
The final analysis, having established the importance of national and international incentives, investigates the variation in the sale price of electricity requested by port operators as sales volume increases, with the PUN set at 95 [EUR/MWh] (trade-off value considered in Analysis 1).
The results, shown in Figure 16, confirm that stimulating connection and increasing the number of connected vessels, and therefore the amount of energy supplied to vessels for cold ironing, possibly through discounts or additional incentives, allows for a better allocation of fixed costs and therefore a reduction in the unit cost of the electricity supplied. The trend is similar across all three management models analysed, while the absolute values depend on the specific assumptions underlying each model.
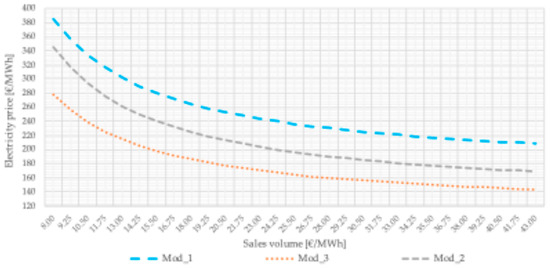
Figure 16.
Case study results—Analysis 3.
7. Conclusions
In view of the transition of energy towards sustainability, cold ironing undoubtedly represents an excellent investment for reducing polluting emissions and thus contributing to the achievement of EU targets. However, it is necessary to distinguish the technical and economic aspects as accurately as possible, as proposed in this article, in order to arrive at optimised configurations in relation to the demand for boat mooring, ensuring that the cost of supplying electricity to boats is not disadvantageous compared to the traditional use of on-board engines.
The costs of designing, building, and testing port infrastructure are considerable. Still, they are justified and incentivisable when considering improvements to air quality and reductions in pollution in all its forms. OPS, if used regularly, guarantees a reduction in pollutant emissions, both globally and especially locally, and also allows for the redevelopment of urban areas and an improvement in quality of life.
The economic analysis conducted indicates that there is no absolute certainty regarding the economic sustainability of the plants, as this is heavily influenced by the incentive policies applied and the high degree of uncertainty surrounding the market prices of both marine fuel and electricity. To address the latter issue, where compatible with land-use planning, local renewable energy generation facilities (e.g., photovoltaic systems) could be developed to serve the port area, with clear benefits for the average price of electricity supplied to vessels. This option was considered in [42,43] as an interesting alternative from both economic and financial perspectives.
Furthermore, this article demonstrates how different management models can have a significant impact on the price of electricity supplied to ships and, consequently, on the economic sustainability of the port facility for supplying electricity to ships.
In conclusion, through the approach proposed in this article, it is possible to better visualise the power costs of vessels in cold ironing mode, with the aim of identifying and directing investments wisely towards installations that maximise both economic and environmental benefits. This can be achieved if a cold ironing power supply is able to offer shipowners a more economical alternative to traditional on-board generation systems, considering the existing regulatory framework. This study emphasises and quantifies the importance of extending cold ironing incentive policies into the future with the aim of providing economic stability in the economic management of enrolled entities. From another perspective, however, it is also necessary to consider the impact of these regulations on the strategic choices of logistics carriers in order to prevent the introduction of a new regulatory framework (taxation, penalties, and mandatory participation in the ETS market, resulting in increases in transport costs) from adversely affecting the routes travelled and the degree of use of port facilities.
In a broader view, therefore, cold ironing is not only a means of achieving the EU’s 2050 targets or reducing local pollution (noise, port water, and air), but it could also be a valuable opportunity to sustainably redevelop port areas in terms of energy efficiency, computerisation, and competitiveness at national and international levels.
Author Contributions
Conceptualization, F.B., D.D.P., C.A. and N.F.; methodology, F.B. and M.V.; software, M.V.; validation, F.B., D.D.P., C.A. and N.F.; writing—original draft preparation, M.V. and F.B.; writing—review and editing, F.B.; supervision, D.D.P., C.A. and N.F. All authors have read and agreed to the published version of the manuscript.
Funding
This research received no external funding.
Data Availability Statement
The original contributions presented in this study are included in the article. Further inquiries can be directed to the corresponding author.
Conflicts of Interest
Author M.V., D.D.P., C.A. and N.F. were employed by the company DBA S.p.A. The remaining author declare that the research was conducted in the absence of any commercial or financial relationships that could be construed as a potential conflict of interest.
Abbreviations
The following abbreviations are used in this manuscript:
| AC | Alternating Current |
| AdSP | Italian acronym of “Autorità di Sistema Portuale”—Port System Authority |
| AMP | Alternative Maritime Power |
| ARERA | Italian acronym of “Autorità di Regolazione per Energia Reti e Ambiente”—Regulatory Authority for Energy, Networks, and Environment |
| CEB | Italian acronym of “Cabina Elettrica di Banchina”—MV Substation |
| CMS | Cable Management System |
| CSEA | Italian acronym of “Cassa per i Servizi energetici e Ambientali”—Fund for Energy and Environmental Services |
| DPF | Delay Power Factor |
| ECA | Emission Control Area |
| ETS | Emissions Trading System |
| GdI | Italian acronym of “Gestore di Infrastruttura di Cold Ironing”—OPS’s Infrastructure Manager |
| GME | Italian acronym of “Gestore Mercati Energetici”—Energy Market Operator |
| HVSC | High-Voltage Shore Connection |
| IdC | Italian acronym of “Infrastruttura di Cold Ironing”—OPS’s Infrastructure |
| IFO | Intermediate Fuel Oil |
| IMO | International Maritime Organisation |
| JB | Junction Box |
| LCV | Lower Calorific Value |
| LVSC | Low Voltage Shore Connection |
| MGO | Marine Gas Oil |
| MGP | Italian acronym of “Mercato del giorno prima”—Day-Ahead Market |
| MI | Italian acronym of “Mercato infragiornaliero”—Intra-Day Market |
| MPE | Italian acronym of “Mercato a pronti”—Spot Market |
| MPEG | Italian acronym of “Mercato dei prodotti giornalieri”—Daily Products Market |
| MSD | Italian acronym of “Mercato del servizio di dispacciamento”—Integrated Scheduling Process |
| MTE | Italian acronym of “Mercato a termine”—Forward Electricity Market |
| OPS | On-shore Power Supply |
| OGS | Italian acronym of “Oneri Generali di Sistema”—General System Charges |
| PUN | Italian acronym of “Prezzo Unico Nazionale”—National Single Price |
| SFOC | Specific Fuel Oil Consumption |
| VLSFO | Very Low Sulphur Fuel Oil |
References
- Vaca-Cabrero, J.; González-Cancelas, N.; Quijada-Alarcón, J. Bayesian Networks Applied to the Maritime Emissions Trading System: A Tool for Decision-Making in European Ports. Inventions 2025, 10, 28. Available online: https://www.mdpi.com/2411-5134/10/2/28 (accessed on 17 April 2025). [CrossRef]
- CO2 Emissions from Shipping–Encouraging the Use of Low-Carbon Fuels. Available online: https://ec.europa.eu/info/law/better-regulation/have-your-say/initiatives/12312-CO2-emissions-from-shipping-encouraging-the-use-of-low-carbon-fuels_en (accessed on 2 January 2025).
- Fit for 55: Increasing the Uptake of Greener Fuels in the Aviation and Maritime Sectors. Available online: https://www.consilium.europa.eu/en/infographics/fit-for-55-refueleu-and-fueleu/ (accessed on 12 December 2024).
- European Parliament, Committee on Transport and Tourism, Provisional Agreement Resulting from Interinstitutional Negotiations. Article 5. pp. 56–61. Available online: https://www.europarl.europa.eu/meetdocs/2014_2019/plmrep/COMMITTEES/TRAN/AG/2023/05-24/1278138EN.pdf (accessed on 26 April 2023).
- Canepa, M.; Ballini, F.; Dalaklis, D.; Frugone, G.; Sciutto, D. Cold Ironing: Socio-Economic Analysis in the Port of Genoa. Logistics 2023, 7, 28. Available online: https://www.mdpi.com/2305-6290/7/2/28 (accessed on 13 April 2025). [CrossRef]
- Nigro, M.; De Domenico, M.; Murgia, T.; Stimilli, A. The Port Sector in Italy: Its Keystones for Energy-Efficient Growth. Energies 2024, 17, 1788. Available online: https://www.mdpi.com/1996-1073/17/7/1788 (accessed on 25 February 2025). [CrossRef]
- European Commission, Entec UK Ltd. Directorate General Environment, Service Contract on Ship Emissions: Assignment, Abatement and Market-Based Instruments—Task 2a: Shore-Side Electricity. Final Report. August 2005. Available online: https://sustainableworldports.org/wp-content/uploads/EU-Commission-Directorate-General-Enviroment.pdf (accessed on 15 September 2025).
- IEC/IEEE 80005-1; Utility Connections in Port—Part 1: High Voltage Shore Connection (HVSC) Systems—General Requirements. IEC/IEEE: Geneva, Switzerland, 2019.
- ARERA, Area Operatori Operators Login—Prezzi e Tariffe Prices and Fees. Available online: https://www.arera.it/area-operatori/prezzi-e-tariffe (accessed on 23 June 2025).
- ARERA, Area Operatori—Tariffa per il Servizio di Trasmissione Transmission service tariff. Available online: https://www.arera.it/area-operatori/prezzi-e-tariffe/tariffa-per-il-servizio-di-trasmissione (accessed on 23 June 2025).
- ARERA, Area operatori—Tariffe di Distribuzione Distribution Service Charges. Available online: https://www.arera.it/area-operatori/prezzi-e-tariffe/distr (accessed on 23 June 2025).
- ARERA, Area Operatori—Tariffa per il Servizio di Misura Metering Service Charge. Available online: https://www.arera.it/area-operatori/prezzi-e-tariffe/tariffa-per-il-servizio-di-misura (accessed on 23 June 2025).
- ARERA, Area Operatori—Oneri Generali di Sistema e Ulteriori Componenti General System Charges and Other Elements. Available online: https://www.arera.it/area-operatori/prezzi-e-tariffe/oneri-generali-di-sistema-e-ulteriori-componenti (accessed on 23 June 2025).
- ARERA, Consultazione Accessed 28 Maggio 2024—211/2024/R/eel. Available online: https://www.arera.it/atti-e-provvedimenti/dettaglio/24/211-24 (accessed on 21 June 2024).
- Gazzetta Ufficiale, Art. 48 del Decreto 76 al Comma 7-bis del 16 Luglio 2020 Official Journal, Article 48, Paragraph 7-bis of Decree-Law n. 76 of July 16, 2020. Available online: https://www.gazzettaufficiale.it/atto/serie_generale/caricaArticolo?art.versione=1&art.idGruppo=11&art.flagTipoArticolo=0&art.codiceRedazionale=20A04997&art.idArticolo=48&art.idSottoArticolo=1&art.idSottoArticolo1=10&art.dataPubblicazioneGazzetta=2020-09-29&art.progressivo=0 (accessed on 18 November 2024).
- De Forcade, R. Ok dell’Ue al Piano Italiano da 570 Milioni per Ridurre le Emissioni delle Navi EU Approves Italy’s €570 Million Plan to Reduce Ship Emissions. Il sole 24 ore 2024. Available online: https://www.ilsole24ore.com/art/ok-dell-ue-piano-italiano-570-milioni-ridurre-emissioni-navi-AG5nuub?refresh_ce=1# (accessed on 18 November 2024).
- Ue: Ok Aiuti per 570 Milioni Destinati a Incentivare il Cold Ironing nei Porti Italiani EU: €570 million in aid approved to promote cold ironing in Italian Ports. La Repubblica 2024. Available online: https://www.repubblica.it/economia/rapporti/energitalia/trasformazione/2024/06/19/news/ue_ok_aiuti_per_570_milioni_destinati_a_incentivare_il_cold_ironing_nei_porti_italiani-423256927/ (accessed on 17 November 2024).
- Commissione Ue: Ok per Aiuti di Stato a Cold Ironing EU Commission: Green Light for State Aid for Cold Ironing. AdriaPorts 2024. Available online: https://www.adriaports.com/it/logistica/commissione-ue-ok-per-aiuti-di-stato-a-cold-ironing/ (accessed on 17 November 2024).
- La Commissione Europea Approva il Regime di Sussidi per il “Cold Ironing” del Nostro Paese: Riduzione Fino al 100% Degli Oneri Generali di Sistema per Gli Operatori Navali Che Si Riforniscono dalle Reti Elettriche Terrestri The European Commission Approves Italy’s Subsidy Scheme for Cold Ironing: Up to 100% Reduction in General System Charges for Shipping Operators Who Connect to Shore-Side Electricity Networks. QualEnergia.it 2024. Available online: https://www.qualenergia.it/articoli/elettrificazione-porti-ue-via-libera-piano-italiano-570-milioni/#:~:text=La%20Commissione%20europea%20approva%20il,riforniscono%20dalle%20reti%20elettriche%20terrestri (accessed on 17 November 2024).
- ARERA, Deliberazione 22 Marzo 2022 Resolution of-117/2022/R/EEL. Table 4, pp. 15–16. Available online: https://www.arera.it/fileadmin/allegati/docs/22/117-22.pdf (accessed on 23 March 2025).
- Gazzetta Ufficiale Dell’unione Europea, Decisione di Esecuzione (UE) 2021/2058 del consiglio del 23 November 2021 Official Journal of the European Union, Council Implementing Decision (EU) 2021/2058 of 23 November 2021. Available online: https://eur-lex.europa.eu/legal-content/IT/TXT/HTML/?uri=CELEX:32021D2058&from=IT#d1e139-1-1 (accessed on 27 March 2025).
- Gazzetta Ufficiale, Art. 34-Bis Della Legge 8/2020 Official Journal, art. 34-bis of Law 8/2020. Available online: https://www.gazzettaufficiale.it/atto/serie_generale/caricaArticolo?art.versione=1&art.idGruppo=2&art.flagTipoArticolo=0&art.codiceRedazionale=20A01353&art.idArticolo=34&art.idSottoArticolo=2&art.idSottoArticolo1=10&art.dataPubblicazioneGazzetta=2020-02-29&art.progressivo=0 (accessed on 27 March 2025).
- Gunes, U.; Ust, Y.; Sinan Karakurt, A. Performance Analysis of Turbocharged 2-Stroke Diesel Engine; ResearchGate GmbH: Berlin, Germany, 2015; Available online: https://www.researchgate.net/publication/281203659_Performance_Analysis_of_Turbocharged_2-Stroke_Diesel_Engine (accessed on 13 November 2024).
- Jalkanen, J.-P.; Johansson, L.; Kukkonen, J.; Brink, A. Extension of an Assessment Model of Ship Traffic Exhaust Emissions for Particulate Matter and Carbon Monoxide; ResearchGate GmbH: Berlin, Germany, 2011; Available online: https://www.researchgate.net/publication/252392578_Extension_of_an_assessment_mode_of_ship_traffic_exhaust_emissions_for_particulate_matter_and_carbon_monoxide (accessed on 11 November 2024).
- Il Mediterraneo Raggiunge un Traguardo Storico Nell’impegno per una Navigazione Meno Inquinante The Mediterranean Reaches a Historic Milestone in Its Commitment to Cleaner Shipping. Ambiente Ma Non Solo… 2023. Available online: https://ambientenonsolo.com/il-mediterraneo-raggiunge-un-traguardo-storico-nellimpegno-per-una-navigazione-meno-inquinante/ (accessed on 12 November 2024).
- Il Mediterraneo Sarà Area ECA del 1° Maggio 2025 The Mediterranean Will Become an ECA Area on 1 May 2025. Ship2Store 2022. Available online: https://www.ship2shore.it/it/il-mediterraneo-sara-area-eca-del-1-maggio-2025 (accessed on 12 November 2024).
- Martinuzzi, M. Il Mediterrano è Diventato “Area Eca”. Regole più Severe per le Emissioni Delle Navi The Mediterranean Has Become an ‘ECA Area’. Stricter Rules for Ship Emissions. IL SECOLO XIX 2025. Available online: https://www.ilsecoloxix.it/blue-economy/energia/2025/05/06/news/mediterrano_area_eca_emissioni_navi-15132925/ (accessed on 23 June 2025).
- Il Mediterraneo Incluso Nella Normativa Ambientale Seca The Mediterranean Included in the SECA Environmental Regulations. TE Trasporto Europa 2025. Available online: https://www.trasportoeuropa.it/notizie/marittimo/il-mediterraneo-incluso-nella-normativa-ambientale-seca/ (accessed on 23 June 2025).
- Zis, T. (DTU management engineering program at Danmarks Tekniske Universitet, Kongens Lyngby, Danmarks). Cold Ironing at Ports as an Emissions Reduction Option. Available online: https://backend.orbit.dtu.dk/ws/portalfiles/portal/162459347/The_prospects_of_cold_ironing_as_an_emissions_reduction_option_TRB_2018.pdf (accessed on 15 September 2025).
- Pezzi, G. Quanto è Aumentato il Petrolio, Con i grafici e la Serie Storica Oil Price Increases, with Graphs and Historical Data. QM QUOTIDIANO MOTORI 2022. Available online: https://www.quotidianomotori.com/automobili/prezzo-del-petrolio/ (accessed on 13 January 2025).
- SENDECO2, CO2 Prices. Available online: https://www.sendeco2.com/it/prezzi-co2 (accessed on 26 June 2024).
- Bellini, M. ETS Carbon Price: Quali Aspettative per il 2023 ETS Carbon Price: What to Expect in 2023. Nextwork360 2023. Available online: https://www.esg360.it/esg-smart-data/ets-carbon-price-quali-aspettative-per-il-2023/ (accessed on 27 June 2024).
- European Parliament. Revision of the EU Emissions Trading System. Available online: https://www.europarl.europa.eu/doceo/document/TA-9-2022-0246_EN.html (accessed on 28 October 2024).
- European Commission, Climate Action, Reducing Emissions from the Shipping Sector. Available online: https://climate.ec.europa.eu/eu-action/transport-decarbonisation/reducing-emissions-shipping-sector_en (accessed on 18 October 2024).
- Bacalja, B.; Krčum, M.; Slišković, M. A Line Ship Emissions while Manoeuvring and Hotelling—A Case Study of Port Split. J. Mar. Sci. Eng. 2020, 8, 953. Available online: https://www.mdpi.com/2077-1312/8/11/953 (accessed on 20 May 2024). [CrossRef]
- Mocerino, L.; Quaranta, F. How emissions from cruise ships in the port of Naples changed in the COVID-19 lock down period. SageJournals 2021, 236, 125–130. Available online: https://journals.sagepub.com/doi/full/10.1177/14750902211028421 (accessed on 20 November 2024). [CrossRef]
- Enel S.p.A. Comunicato Stampa. ENEL: Nel 2024 risultati solidi grazie alla positiva evoluzione del business integrato in Iberia e nelle Americhe Enel S.p.A. Press release. ENEL: Solid results in 2024 thanks to the positive development of the integrated business in Iberia and the Americas. Available online: https://www.enel.com/content/dam/enel-common/press/it/2025-marzo/Enel%20risultati%20FY%202024ITA.pdf (accessed on 16 November 2024).
- Available online: https://shipandbunker.com/prices (accessed on 18 July 2024).
- Banca d’Italia. Tassi di cambio—Cambi annuali Bank of Italy. Exchange Rates—Annual Exchange Rates. Available online: https://portale.unipv.it/sites/default/files/2024-04/Cambi%20Medi%20Annuali%202023.pdf (accessed on 8 November 2024).
- Scala, E.; Cozzi, A.; Carobolante, A.; Silvestri, S. Porto di Trieste—Piano d’azione per un porto sostenibile e a basse emissioni di CO2. Autorità di Sistema Portuale del Mar Adriatico Orientale 2018 Port of Trieste—Action Plan for a Sustainable, Low-CO2 Emission Port. Eastern Adriatic Sea Port System Authority 2018. Available online: https://www.assoporti.it/media/6857/deasp-adsp-mare-adriatico-orientale-2.pdf (accessed on 11 November 2024).
- Martinuzzi, M. Seaview, il Gigante da 800 Milioni Facile da Manovrare Seaview, the Easy-to-Manoeuvre 800-Million Giant. The MediTelegraph 2018. Available online: https://www.themeditelegraph.com/it/shipping/cruise-and-ferries/2018/06/07/news/seaview-il-gigante-da-800-milioni-facile-da-manovrare-1.38083216#:~:text=La%20generazione%20elettrica%20%C3%A8%20garantita,una%20velocit%C3%A0%20di%2022%20nodi (accessed on 8 October 2024).
- Abu Bakar, N.N.; Vasquez, J.C.; Bazmohammadi, N.; Othman, M.; Dalby Rasmussen, B.; Al-Turki, Y.A. Optimal Configuration and Sizing of Seaport Microgrids including Renewable Energy and Cold Ironing—The Port of Aalborg Case Study. Energies 2022, 15, 431. Available online: https://www.mdpi.com/1996-1073/15/2/431 (accessed on 11 March 2025). [CrossRef]
- Kelmalis, A.; Dimou, A.; Francis Lekkas, D.; Vakalis, S. Cold Ironing and the Study of RES Utilization for Maritime Electrification on Lesvos Island Port. Environments 2024, 11, 84. Available online: https://www.mdpi.com/2076-3298/11/4/84 (accessed on 11 March 2025). [CrossRef]
Disclaimer/Publisher’s Note: The statements, opinions and data contained in all publications are solely those of the individual author(s) and contributor(s) and not of MDPI and/or the editor(s). MDPI and/or the editor(s) disclaim responsibility for any injury to people or property resulting from any ideas, methods, instructions or products referred to in the content. |
© 2025 by the authors. Licensee MDPI, Basel, Switzerland. This article is an open access article distributed under the terms and conditions of the Creative Commons Attribution (CC BY) license (https://creativecommons.org/licenses/by/4.0/).