Article

Multiphase Flow and Heat Transfer of a Mine Return Air-Gravity Heat Pipe: Numerical Simulation and Experimental Validation

School of Mechanical and Electrical Engineering, China University of Mining and Technology (Beijing), Beijing 100083, China
*
Author to whom correspondence should be addressed.
Energies 2025, 18(22), 5942; https://doi.org/10.3390/en18225942
Submission received: 5 October 2025 / Revised: 6 November 2025 / Accepted: 11 November 2025 / Published: 12 November 2025
(This article belongs to the Section J1: Heat and Mass Transfer)

Abstract

In order to ensure the stability of the gravity heat pipe (GHP) heat exchanger in the mine return air waste heat recovery project and to explore the influence of the working fluid and filling ratio of the GHP on the heat transfer performance, this paper establishes a computational fluid dynamics (CFD) model of the GHP for mine return air waste heat recovery. The heat transfer characteristics and multiphase flow mechanism of the GHP with R22 and R410a working fluids at 30% to 80% filling ratios were studied using the VOF model from three aspects: two-phase flow, wall temperature, and thermal resistance. The validity of the model was verified through experimental data. The findings of the research indicate that the physical property parameters of the working fluid and the alterations in the filling ratio exert a substantial influence on the liquid-phase boiling heat transfer and the condensation process on the condenser wall. The CFD operation results demonstrate a high degree of congruence with the experimental data. The maximum deviation in the wall temperature is 2.9%. When the filling ratio is in the range of 50% to 60%, the axial distribution of the wall temperature tends to be flat. With regard to thermal resistance, both CFD and experimental results demonstrate a tendency of initially decreasing and subsequently increasing with increasing filling ratio. The average wall temperature of R410a GHP with a 50% filling ratio reached the highest value (20.3 °C), and the thermal resistance reached the lowest value (0.021 K/W), demonstrating superior heat transfer performance and excellent isothermal characteristics.

1. Introduction

Mine ventilation is imperative to ensure air quality in subterranean environments by expeditiously removing noxious gases and thereby facilitating the uninterrupted operation of personnel and equipment. In order to prevent production from being adversely affected by excessively low temperatures in cold regions, fresh air must be heated prior to entering the mine. Meanwhile, large ventilation systems are employed at the mine’s outlet to extract the return air, which contains a substantial quantity of geothermal energy from the subterranean workings and thoroughfares. The temperature of the mine return air exhibits relative stability throughout the year (10–23 °C), whilst also demonstrating elevated levels of humidity (relative humidity exceeds 65%) and a substantial flow rate (typically over 6000 m3/min). This confers upon the mine return air the potential to serve as a valuable low-temperature resource for waste heat management [1,2,3]. The gravity heat pipe (GHP) has the capacity to absorb heat and subsequently evaporate through the internal working fluid on the return air side, and subsequently condense on the fresh air side to form a liquid film. This liquid film then flows back to the evaporator by virtue of its own gravity. The process does not necessitate additional energy or power, and it is characterised by zero pollution emissions. It can thus be concluded that the gravity heat pipe heat exchanger is capable of effectively recovering a significant quantity of low-temperature waste heat from mine return air and employing it for the purpose of preheating fresh air. This renders the project a green and environmentally friendly waste heat recovery initiative [4,5,6].
The gravity heat pipe is a wickless heat pipe that facilitates heat transfer through the self-circulation of the evaporator and condenser of the working fluid. The widespread utilisation of GHP in geothermal systems, waste heat recovery of large mechanical equipment, warm permafrost embankments, and other thermal management and heat recovery systems is attributable to its uncomplicated yet dependable configuration, its high heat transfer efficiency, and its capacity for long-distance heat transfer [7,8,9,10,11]. It has been determined by scholars through numerical simulation and experimental research that the heat transfer performance of GHP is primarily influenced by factors such as the type of working fluid, geometric shape (diameter, shape and length), filling ratio, and inclination angle [12,13,14,15]. In the case of a super-long gravity heat pipe (SLGHP) with an extremely large aspect ratio, and under conditions of low source temperature and small-diameter heat pipe, ammonia is shown to be a more suitable working fluid for SLGHP than water and methanol. In circumstances where the temperature of the heat source is elevated and the diameter of the heat pipe is substantial, water constitutes the optimal selection [16,17]. The numerical simulation of GHP represents a significant step prior to the implementation of a practical application. A wide range of parameters can be evaluated with regard to cost-effectiveness and the temporal benefits of their utilization [18]. The VOF model has been shown to provide a reliable means of tracking the liquid–vapor interface, accurately capturing the dynamics of bubble formation and phase transition. In addition, it facilitates high-fidelity predictions of wall temperature and thermal resistance, thus making it a widely utilised tool for GHP numerical simulations. Fadhl et al. established a CFD model in order to simulate the two-phase flow and heat transfer phenomena during transient start-up and steady-state operation in the GHP of R134a and R404a working fluids [19]. Chen et al. developed a CFD model of a U-shaped elliptical gravity heat pipe. They determined that the optimal filling ratio for a U-shaped elliptical gravity heat pipe is 65%, with an optimal inclination angle of 90° [20]. Jafari et al. conducted an experimental analysis and a numerical simulation of GHPs. They solved the complete two-dimensional conservation equations for mass, momentum and energy using a finite volume scheme for the vapour flow and the pipe wall. The transient performance of GHPs with filling ratios of 16%, 35%, and 135% was predicted [21]. Yao et al. improved the CFD model to study the heat and mass transfer performance of GHPs. This model introduced an automatic adjustment strategy for the condensation and mass transfer time relaxation parameters, balancing the phase change pressure with the working pressure [22].
As the depth of mine exploitation continues to increase on a consistent basis, the underground thermal environment is being subjected to considerable challenges. On the one hand, the effect of the ground temperature gradient results in an intensification of the thermal radiation of deep rock masses. Conversely, the extensive utilisation of large-scale coal mine machinery and equipment, such as mining, excavation and transportation, results in the generation of substantial motor waste heat. This heat is absorbed through air convection and subsequently discharged at the wellhead. In the contemporary context, the primary focus of heat pipe heat exchangers, heat pump units and spray heat exchangers are the effective recovery of low-temperature waste heat resources in mining operations. The primary application scenarios encompass preheating of fresh air, the heating of buildings in mining areas, and the provision of water for bathing, among others [23,24,25,26]. Bao et al. conducted an analysis of the heat transfer performance of the mine return air waste heat recovery system, and subsequently compared its economic efficiency with that of the traditional system [27]. Zhai et al. analysed the influence of parameters such as tube diameter, tube spacing, and fin outer diameter of the GHP for mine return air on its heat transfer performance. They established a thermal resistance model of the heat pipe and a heat transfer calculation model based on enthalpy difference [28,29]. Hai et al. designed a split-type gravity heat pipe system for the recovery of waste heat from mine return air. It was demonstrated that the system could raise the temperature of low-temperature fresh air by between 12 and 16.5 °C, thus meeting the anti-freezing requirements at the shaft inlet [30].
In conclusion, gravity heat pipes can effectively recover the high-quality low-temperature waste heat resources rich in mine return air and be used for preheating fresh air. However, the heat transfer performance of GHP is mainly affected by the type of working fluid and the filling ratio. The present state of research on GHP in mine return air waste heat recovery is such that the focus is predominantly on the enhancement of the overall heat transfer performance and geometric structure parameters of the system. Nevertheless, research on the influence of GHP working fluid type and filling ratio on heat transfer performance is still relatively insufficient. The experimental platform for the GHP of mine return air was thus established by the present study, and the CFD numerical simulation method was adopted for the purpose of studying the gas–liquid two-phase flow and heat transfer characteristics of the mine return air-GHP with two working fluids, R22 and R410a, under the filling ratio of 30–80%. An observation was made concerning the boiling heat transfer of the working fluid and the condensation process on the condenser wall under different filling ratios. The numerical simulation results were then compared and analysed with the variation laws of the wall temperature and thermal resistance of the GHP measured in the experiment. The optimal filling ratio of the mine return air gravity heat pipe was obtained, which is conducive to the stable operation of the gravity heat pipe heat exchanger under actual working conditions and is also the key to the mine return air waste heat recovery project.

2. Experimental Setup

2.1. Description of Mine Return Air-Gravity Heat Pipe

As demonstrated in Figure 1, the mine return air, characterised by its richness in low-temperature waste heat, traverses the evaporator of the heat exchanger. The heat energy is transferred to the working fluid within the gravity heat pipe through the pipe wall and fins. Following the absorption of heat, the working fluid undergoes rapid vaporisation and phase change. The gaseous working fluid diffuses rapidly into the condenser due to the pressure difference in saturated vapour. Upon exposure to low-temperature fresh air, the substance undergoes a phase transition, releasing latent heat and becoming liquid. This process realizes the transfer of residual heat present in mine return air to the fresh air. During this process, the working fluid forms a liquid film in the condenser and flows back to the evaporator by its own gravity, thereby creating a closed loop that does not require external power. Subsequently, the low-temperature waste heat from the mine is converted into a useable form of thermal energy, thereby reducing the mine’s energy consumption and carbon emissions.

2.2. Experimental Apparatus and Procedure

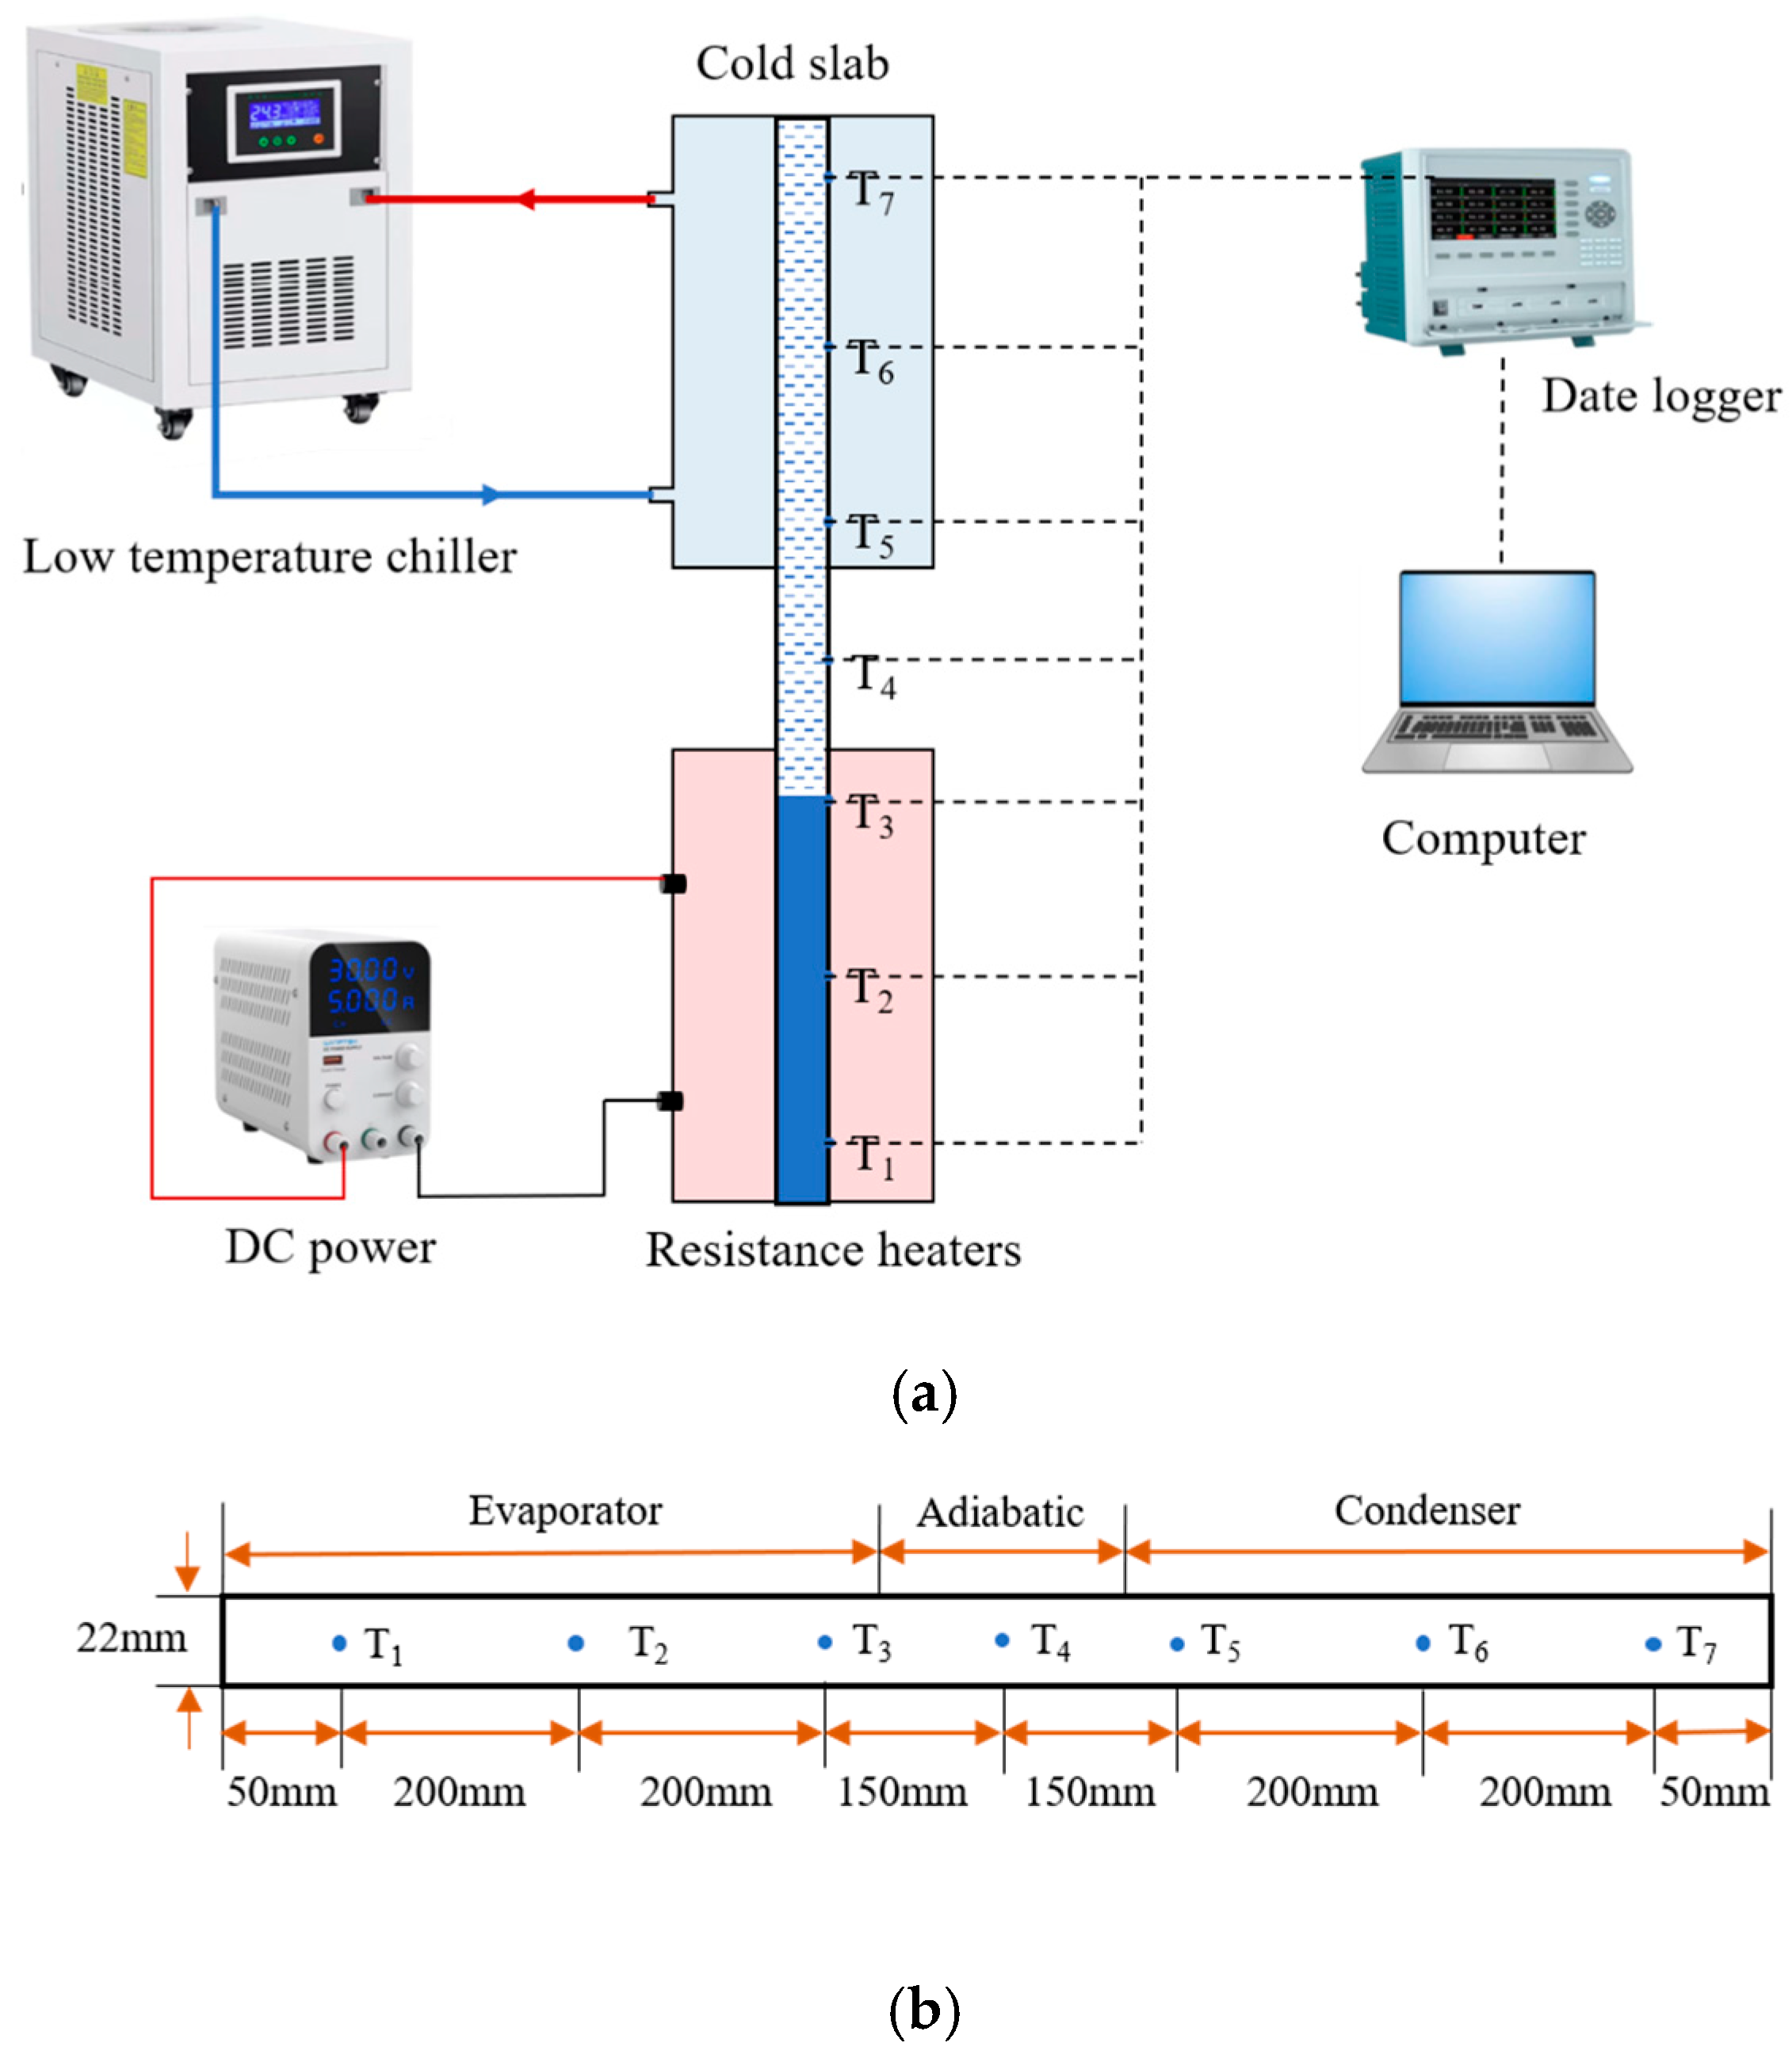
As shown in Figure 2, the experimental system of this project mainly consists of four parts: the GHP to be tested, the heating device of the evaporator, the constant temperature water cooling device of the condenser, and the data acquisition system. The GHP is positioned vertically at 90° on the experimental bench. The evaporator (Le = 500 mm) has been installed on a resistance heater driven by a DC power supply. The analysis of the uncertainty of voltage and current measurements indicates an approximate relative uncertainty of 4.2%. The condenser (Lc = 500 mm) is connected to the low-temperature chiller through a cold plate. The temperature control range of the low-temperature chiller is 5 to 35 °C, and the temperature stability is maintained within 0.1 °C. The contact interface has been coated with thermal grease, with the purpose of enhancing heat transfer. The pipelines and the adiabatic (Lad = 200 mm) connecting the low-temperature chiller and the cold plate are all covered with thermal insulation layers to insulate from the outside. The GHP material is composed of 304 stainless steel with a wall thickness of 2 mm. The total length of the pipe body is 1200 mm, and its outer diameter is 26 mm. The experimental apparatus consists of seven temperature sensors, designated T1 to T7, which are arranged at intervals along the axial direction. The real-time collection of experimental data is facilitated by the LabVIEW platform, thereby enabling the construction of a high-precision experimental research platform for the heat transfer performance of gravity heat pipes.
It is posited that if the temperature of the mine return air is stable at around 16 °C. The gradient charging method is to be employed in this experiment. The present method involves the gradual adjustment of the filling ratio of the working fluid in the evaporator (30%~80%) with an increment of 10% to study the influence of the filling ratio on the heat transfer performance of the R22 and R410a gravity heat pipes. The apparatus comprises a 30W fixed-power resistance heater, which is set up in the heat pipe evaporator for the purpose of heating. A low-temperature chiller is utilised to ensure that the condenser is maintained at a constant temperature of 10 °C. Each group of working conditions functions continuously for a period of 20 min, thereby ensuring that the system attains a state of thermal equilibrium. In order to eliminate the influence of transient fluctuations, the data measured by the seven temperature sensors arranged along the axial direction of the heat pipe were all processed by sliding average filtering, and the average value per minute was finally taken as the characteristic temperature value.

2.3. Experimental Data Reduction

The mean temperatures of the three measurement points designated on the evaporator and condenser of the GHP are taken as the evaporator temperature (Te) and the condenser temperature (Tc).
T e = 1 n 1 i = 1 n 1 T i
T c = 1 n 2 i = 1 n 2 T i
The thermal resistance of the gravity heat pipe is:
R = T e T c Q
where Q is the output power of the DC power supply, and R is the thermal resistance of the gravity heat pipe.

3. Numerical Simulation

3.1. Physical Model and Computational Mesh

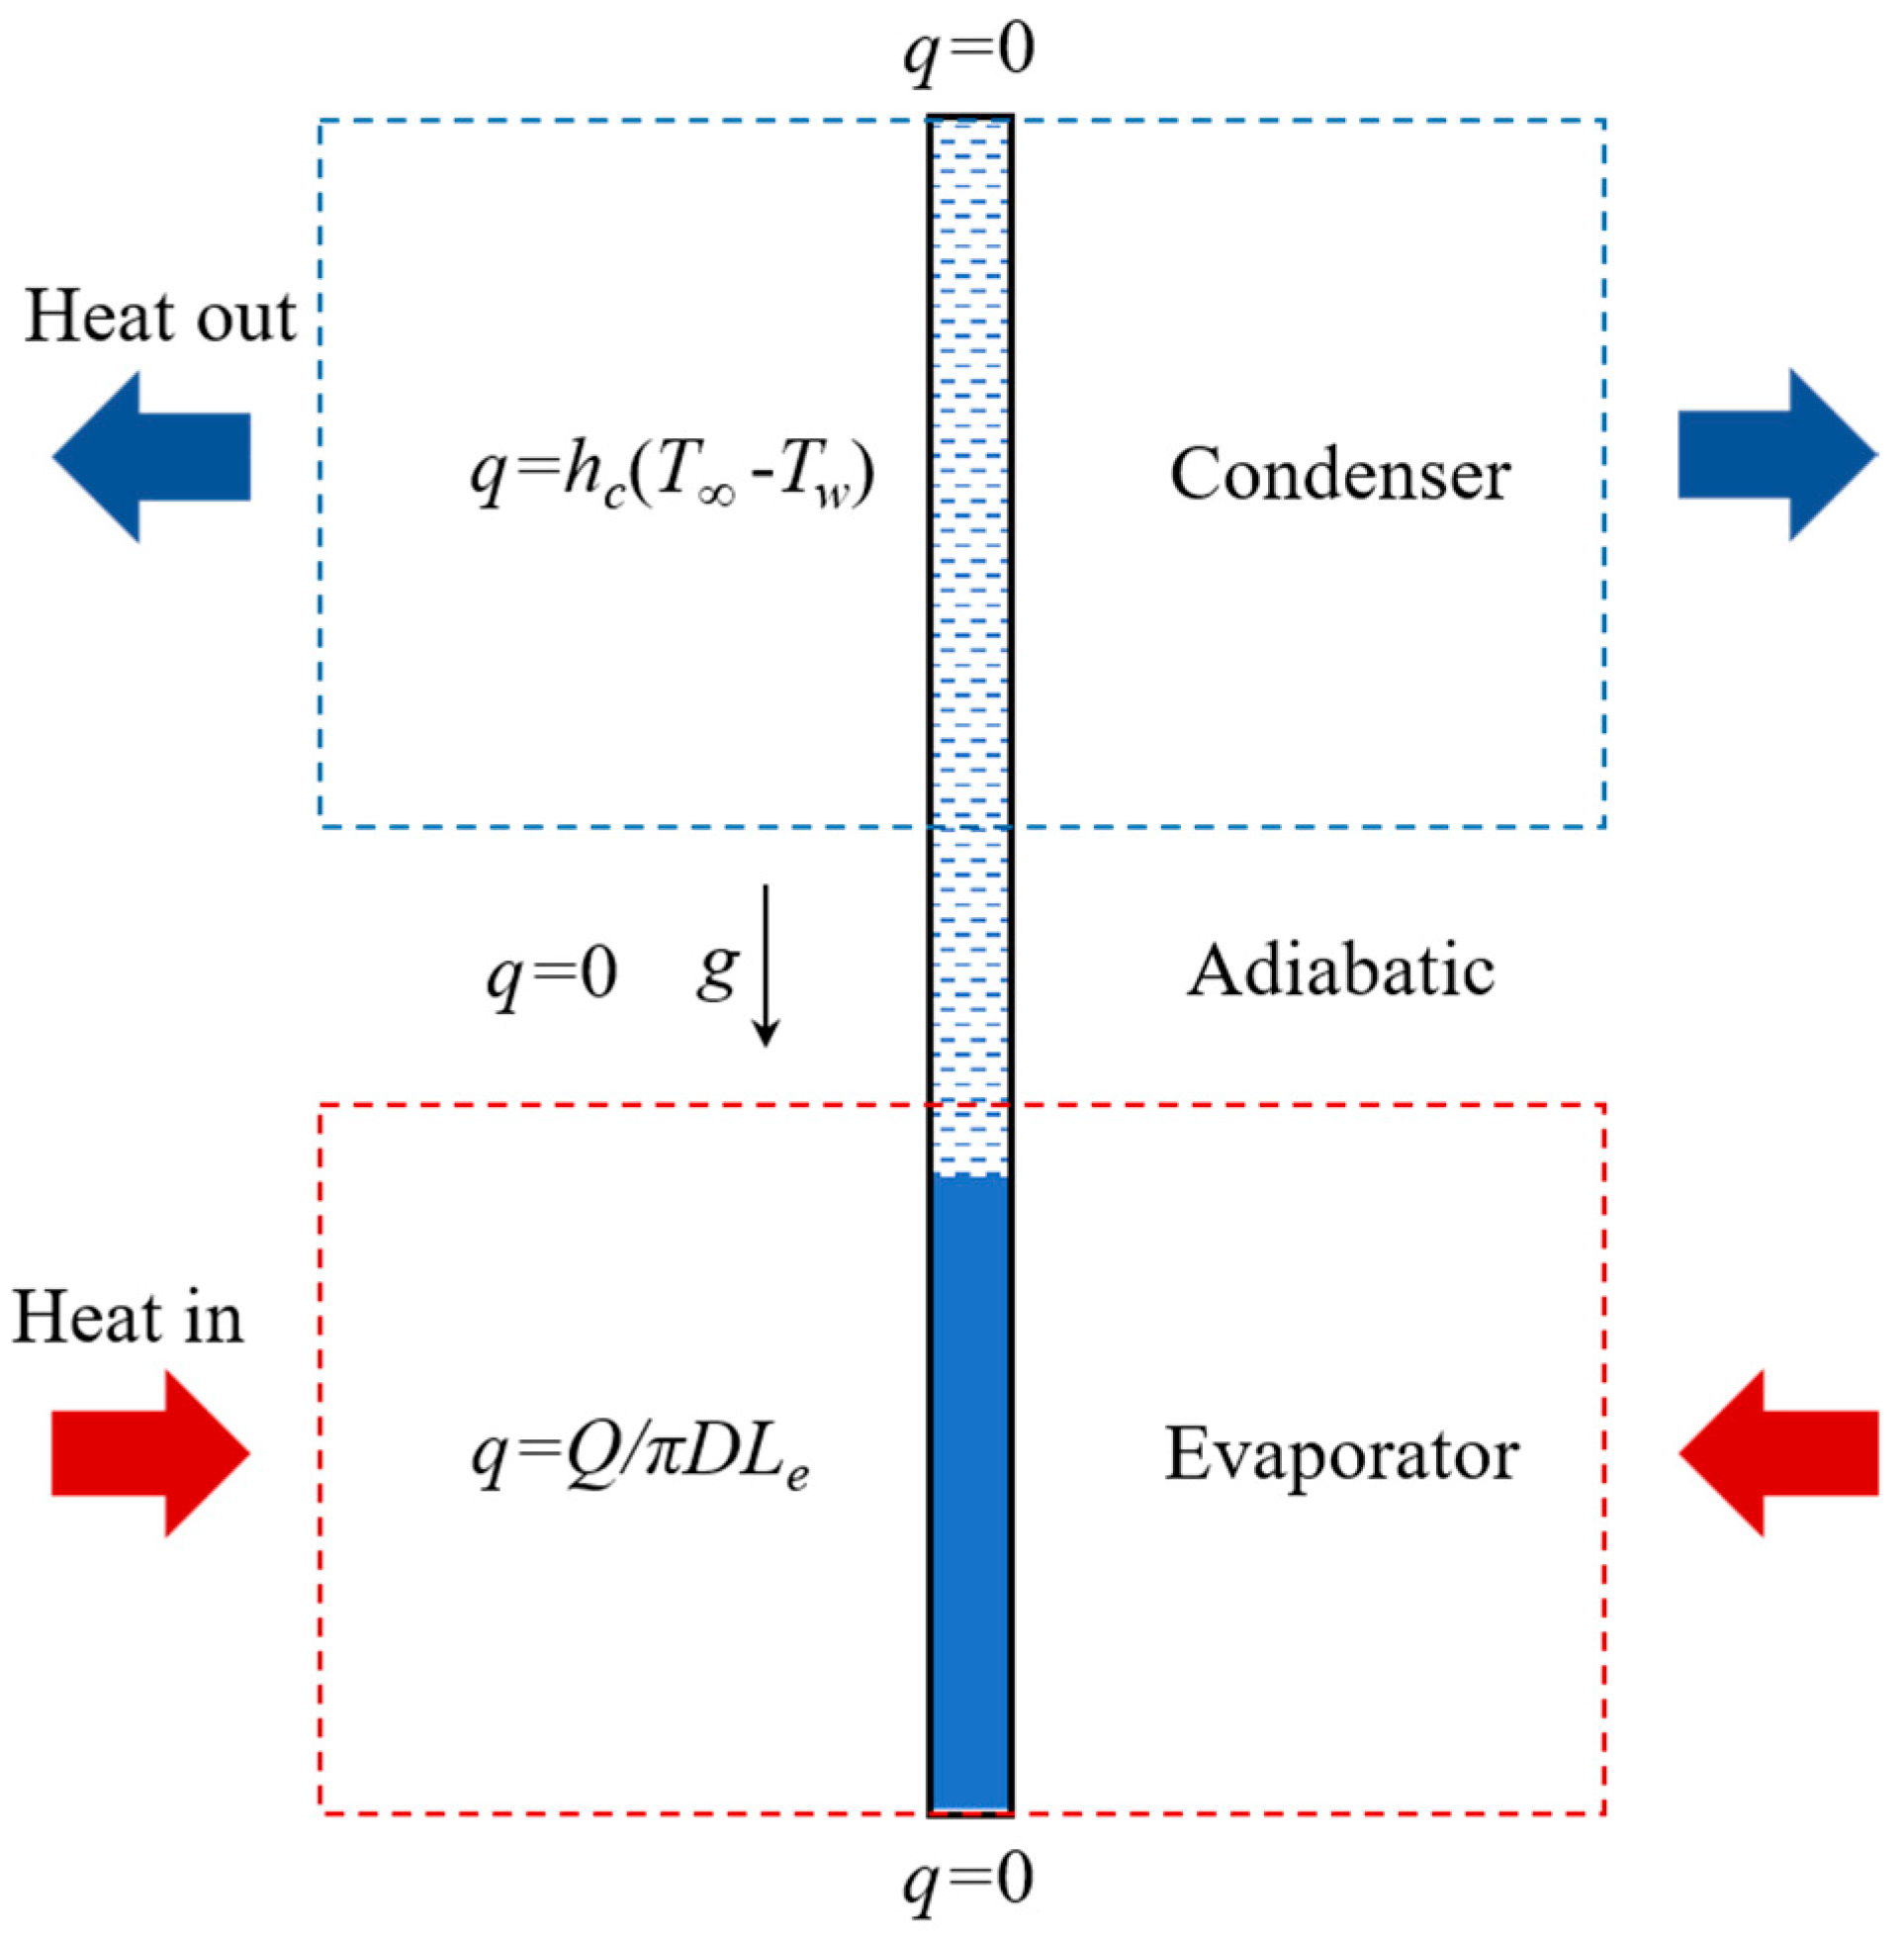
The present study investigates the evaporator and condenser process of the working fluid in a GHP, incorporating the phase change and latent heat transfer between the liquid working fluid and the vapour. The two-dimensional physical model is illustrated in Figure 3. The total length of the GHP is 1200 mm, with an outer diameter of 26 mm and an inner diameter of 22 mm for the gravity heat pipe. The evaporator and condenser are each 500 mm in length, while the adiabatic is 200 mm. The wall temperature distribution of the GHP can be measured by seven thermistors, according to the experimental setup. T4 gave the average wall temperature of the adiabatic, T1 to T3 were used to obtain the average wall temperature of the evaporator, while T5 to T7 were used to for the average wall temperature of the condenser.
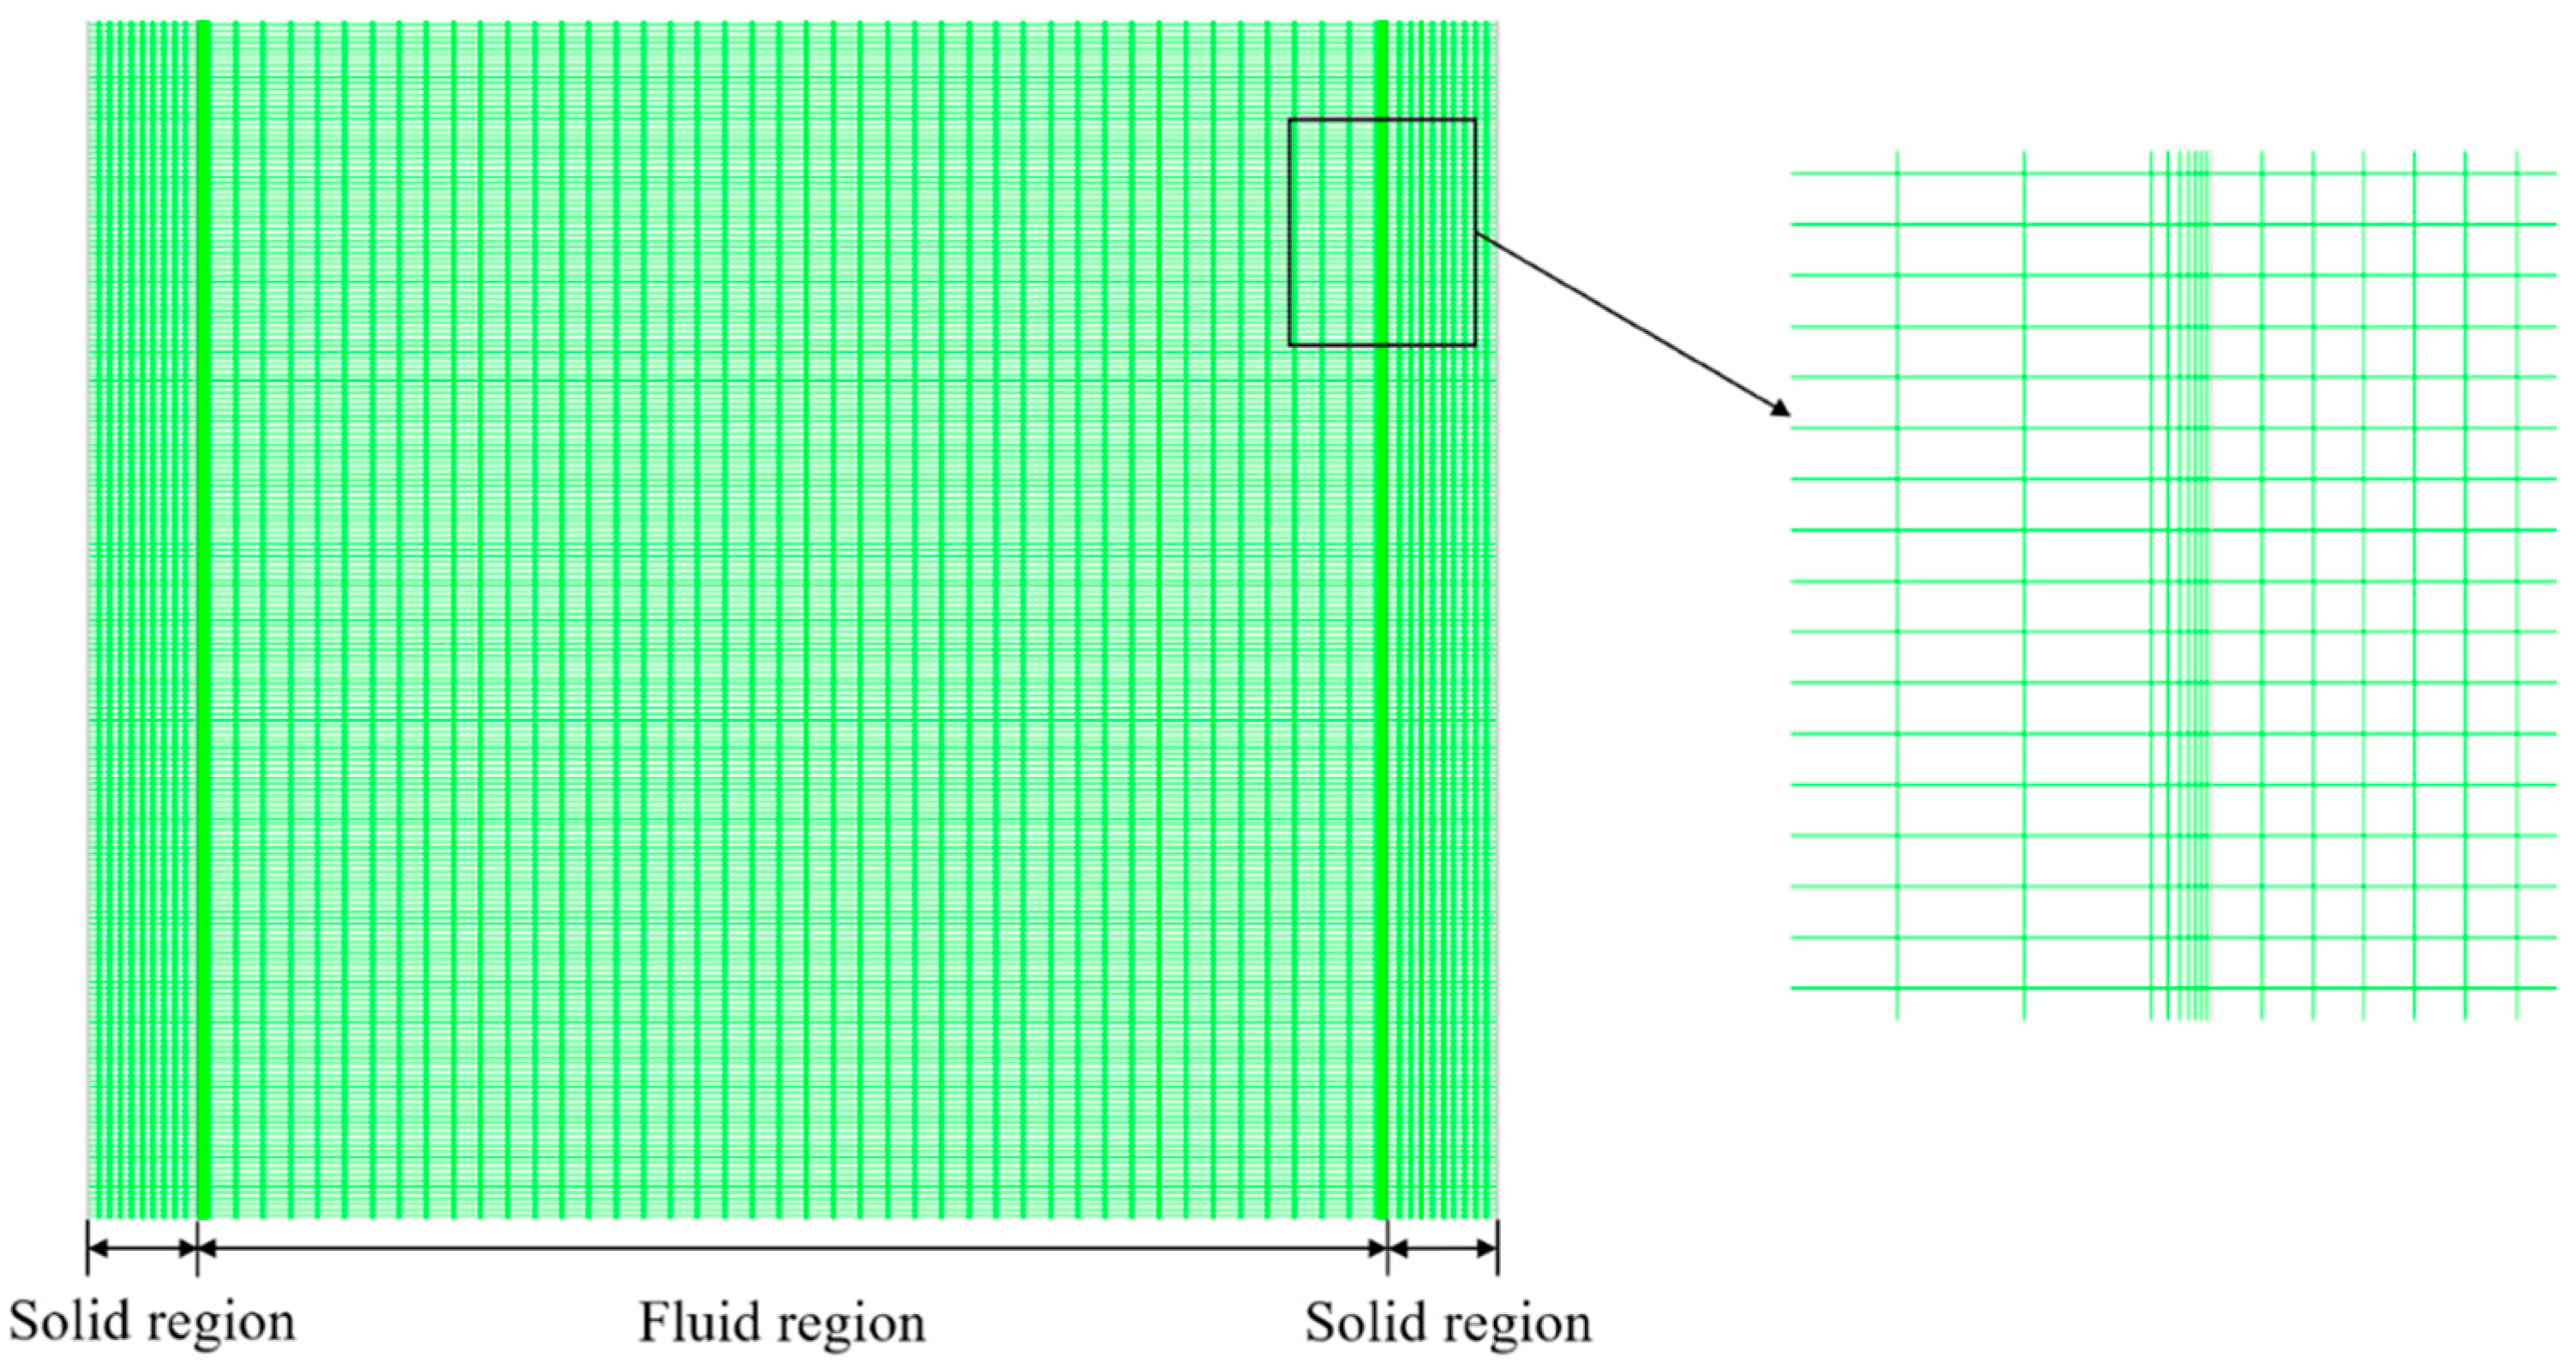
In this study, mesh was used in ANSYS FLUENT 2023 R1 to mesh the gravity heat pipe. As demonstrated in Figure 4, the delineation of solid and fluid regions is accomplished through multi-region meshing. At the inner wall surface of the GHP, expansion is employed to refine the meshing, and the boundary layer meshing is encrypted. The boundary layer is set to seven layers, with increments occurring at a rate of 1.2. The quantity of grids is determined by the configuration of the grid size on the cross-section of the GHP. As shown in Table 1, it is evident that as the number of grids increases, the calculation accuracy concomitantly improves. Once the number of grids reaches 436,740, the average temperature error of each section is less than 0.05 K. It is evident that the results remain largely unaffected by the densification of the grids. Following a comprehensive evaluation of calculation accuracy and cost, the number of grid cells selected for numerical calculation was determined to be 436,740.

3.2. Governing Equations

The flow state of the working fluid in the GHP is laminar, and the gas–liquid interface is clearly visible. The VOF (Volume of Fluid) model can be utilised to track the phase interface by calculating the phase volume fraction in the unit, and subsequently determining the flow changes in the gas–liquid two-phase inside the GHP. In the VOF control equation, α is defined as the phase volume fraction in the calculation unit, and αl and αv, respectively, represent the liquid volume fraction and gas volume fraction in the gas–liquid two-phase fluid. The sum of the gas–liquid two-phase volume fractions in the unit is 1, and the expression is as follows:
α l + α v = 1
Continuity equations:
α l ρ l t + α l ρ l u = S m l
α v ρ v t + α v ρ v u = S m v
where ρl and ρv respectively represent the density of the liquid phase and the gas phase, u indicates the velocity of the gas–liquid mixed phase, Sml and Smv are, respectively, represented as the mass source terms of the evaporation and condensation processes, used to calculate the mass transfer between the gas and liquid phases during evaporation and condensation. Their expressions will be specifically elaborated in the phase transition model below.
Momentum equations:
ρ u t + ρ u u = ρ g p + μ u + u T + F C S F
ρ = ρ l α l + ρ v α v
μ = μ l α l + μ v α v
where ρ is the average density, and μ is the volumetric average dynamic viscosity, g is the acceleration due to gravity, p stands for stress, F C S F represents surface tension, it can be calculated by the following formula:
F C S F = σ ρ k α 1 2 ρ l + ρ v
Energy equations:
ρ E t + ρ E + p u = k e f f T + S h
where keff is the effective heat transfer coefficient, E represents thermodynamic energy, Sh is the latent heat of phase change.
k e f f = k l α l + k v α v
E = α l ρ l E l + α v ρ v E v α l ρ l + α v ρ v

3.3. Mass and Heat Transfer

Based on the heat and mass transfer mechanism provided by Schepper et al. [31], the mass source term and energy source term in the heat and mass transfer processes of the evaporation stage and the condensation stage were determined; therefore, all source terms are required to calculate the mass and heat transfer rates in the following forms:
For mass source terms in the evaporation process (Tmix > Tsat):
S m v = S m l = C e α l ρ l T m i x T s a t T s a t
C e = 6 D s m M 2 π R T s a t ρ v Δ H ρ l ρ v
For mass source terms in the condensation process (Tmix < Tsat):
S m l = S m v = C c α v ρ v T m i x T s a t T s a t
C c = 6 D s m M 2 π R T s a t ρ l Δ H ρ l ρ v
For energy source terms in the evaporation and condensation processes, respectively:
S h = C e α l ρ l T m i x T s a t T s a t h f g
S h = C c α v ρ v T m i x T s a t T s a t h f g
Add them, respectively, to the continuity Equations (5) and (6) and the energy Equation (11). In the formula, the evaporation factor Ce and the condensation factor Cc determine the rates of evaporation and condensation, respectively. If their values are too large, it will cause the problem of difficult convergence of the values; if they are too small, it will lead to a significant deviation between the interface temperature and the saturation temperature. Ce and Cc are used from 0.1/s as Fadhl et al. [32]. The present CFD simulation did not use a fixed nucleation site density. The phase change process was governed by the Lee model, where the mass transfer rate between the liquid and vapor phases is determined by local superheating and thermodynamic equilibrium conditions.

3.4. Boundary and Operating Conditions

In this study, R22 and R410a were selected as the working fluids of GHP, and the liquid phase and gas phase of the refrigerant were defined as the primary phase and secondary phase, respectively. The liquid phase density (ρl) of the working fluid is related to temperature, and its functional expression is:
ρ l T = i = 0 n = 3 A i T i
The effect of surface tension (σ) along the interface between the liquid and vapor phases was taken into consideration by using the following equation:
σ T = i = 0 n = 3 B i T i
where the density coefficients Ai and the surface tension coefficients Bi are listed in Table 2 and Table 3.
In addition to the liquid phase density and surface tension, to limit the calculation time, it is assumed that the physical properties of the working fluid are independent of temperature. These attributes were obtained using the NIST REFPROP 9.1 program at 289.15 K, as shown in Table 4.
According to the experimental settings, the evaporator of the GHP is set as a constant heat flow boundary condition, with a heating power of 30 W. The adiabatic is defined as the adiabatic boundary, which corresponds to the zero heat flux boundary. The condenser constitutes a convective heat transfer boundary condition, whereby heat is released to water at a temperature of 283.15 K. The calculation of the corresponding heat transfer coefficient is achieved by the following formula:
h c = Q c π D L c T c , a v T w
where hc represents the heat transfer coefficient of the condenser, Qc represents the heat transfer rate of the condenser, Lc represents the length of the condenser, D represents the diameter of the condenser, Tc,av represents the average temperature of the condenser, and Tw represents the average temperature of the cooling water in the condenser. The boundary conditions of the numerical simulation are shown in Figure 5.
In order to simulate the dynamic flow inside GHP and study the influence of filling ratio on the heat transfer performance of GHP, this study simulated 12 cases with different filling ratios ranging from 30% to 80%. The liquid–vapor interface was tracked using a variable time step with a maximum Courant number of 1, and the SIMPLE algorithm coupled with pressure and velocity and the discretization method of the second-order upwind scheme of the momentum and energy equation were selected for the solution calculation. The utilisation of Geo-Reconstruct and PRESTO was instrumental in the discrete measurement of volume fraction and pressure, thereby facilitating the capture of dynamic changes in the two-phase interface with greater precision. The numerical computation is considered to have converged when the scaled residual of the mass and velocity components is less than 10−4. When the mass flow rate of vapour and liquid is balanced and the temperature is relatively stable, it is assumed that GHP reaches a steady state. The simulation results are then compared with the experimental results.

4. Results and Discussion

4.1. Two-Phase Flow Pattern Visualization

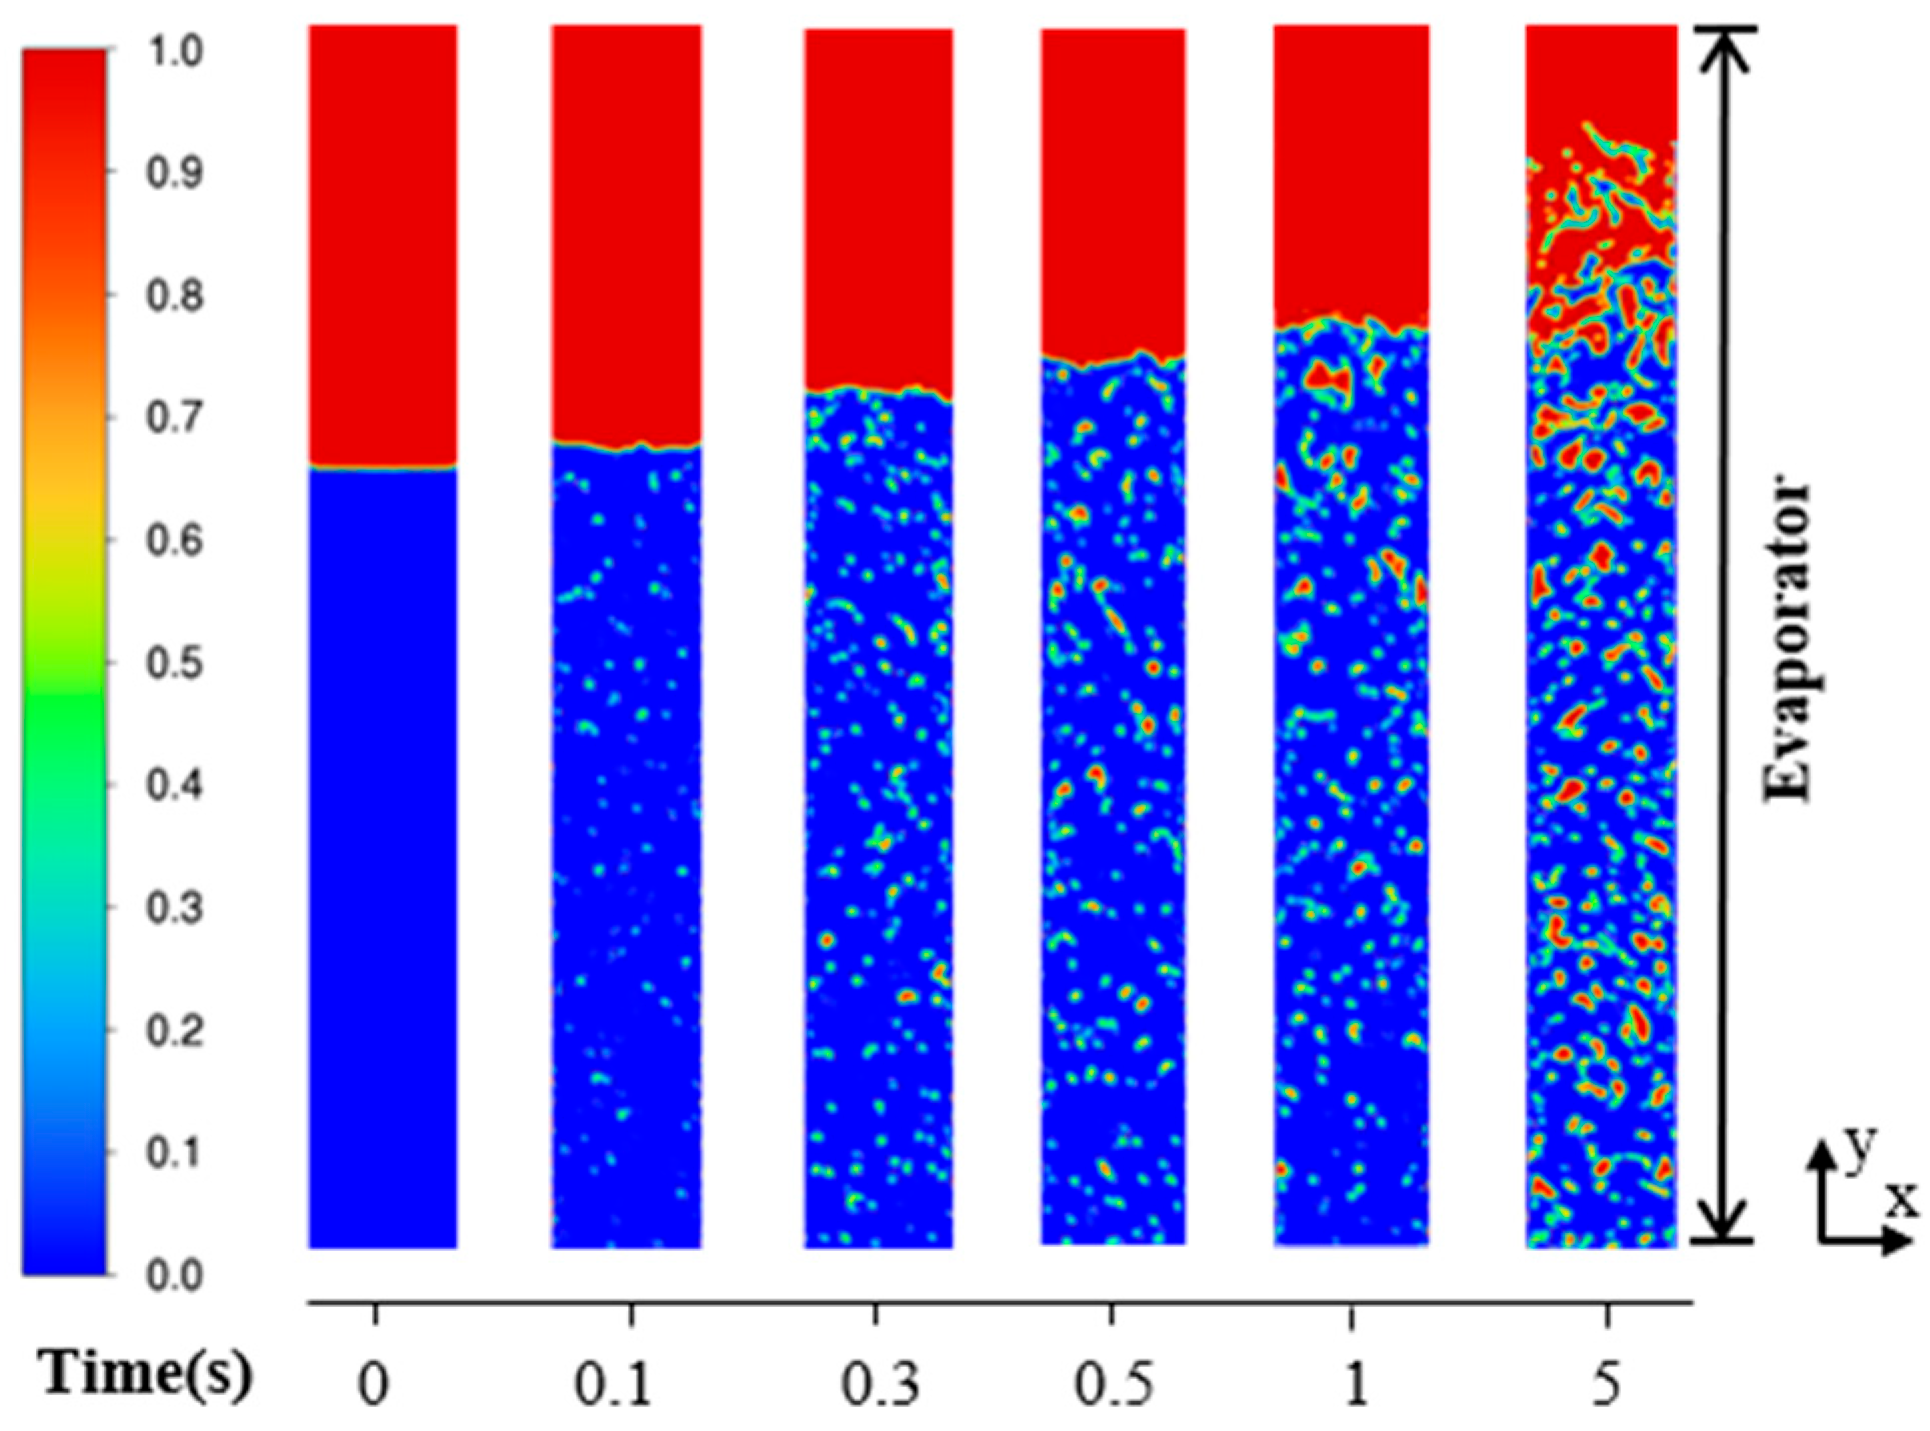
As illustrated in Figure 6, the vapour volume fraction contours of a R410a gravity heat pipe with the filling ratio of 50% at various simulation time is demonstrated. The blue area of the graph represents the liquid phase, which accounts for 50% of the evaporator at 0 s. The region designated by the red area in the diagram represents the gas phase, which occupies the remaining part of the heat pipe. A constant heat flow rate is transferred to the working fluid through the tube wall of the evaporator. When the working fluid is heated above the saturation temperature, it begins to boil and reaches the critical radius for local nucleation near the wall surface, thereby triggering a continuous nucleation phenomenon. The vapor bubbles observed in the VOF model results arise from local phase change driven by wall superheating and numerical perturbations in the volume fraction field, rather than from explicitly defined nucleation sites. The formation of vapor bubbles occurs through continuous nucleation within a time frame of 0.1 to 0.5 s. The dynamic interplay of buoyancy and the dynamic force of the liquid flow propels the bubbles along the surface of the wall, leading to their eventual dislodgement and upward ascent, thereby generating a bubble flow. The bubble flow ascends to the zenith of the liquid reservoir, whereupon it undergoes a rupture, effusing its gaseous constituents. Within a time frame ranging from 1 to 5 s, there is a continuous increase in the amount of vapour, accompanied by a concomitant growth in bubble density as the height increases. The process of aggregation of bubbles leads to the formation of a plug flow. The generation and upward migration of these bubbles result in an augmentation of the liquid pool’s volume, concomitant with an upward movement of the interface between the liquid pool and the gaseous phase.
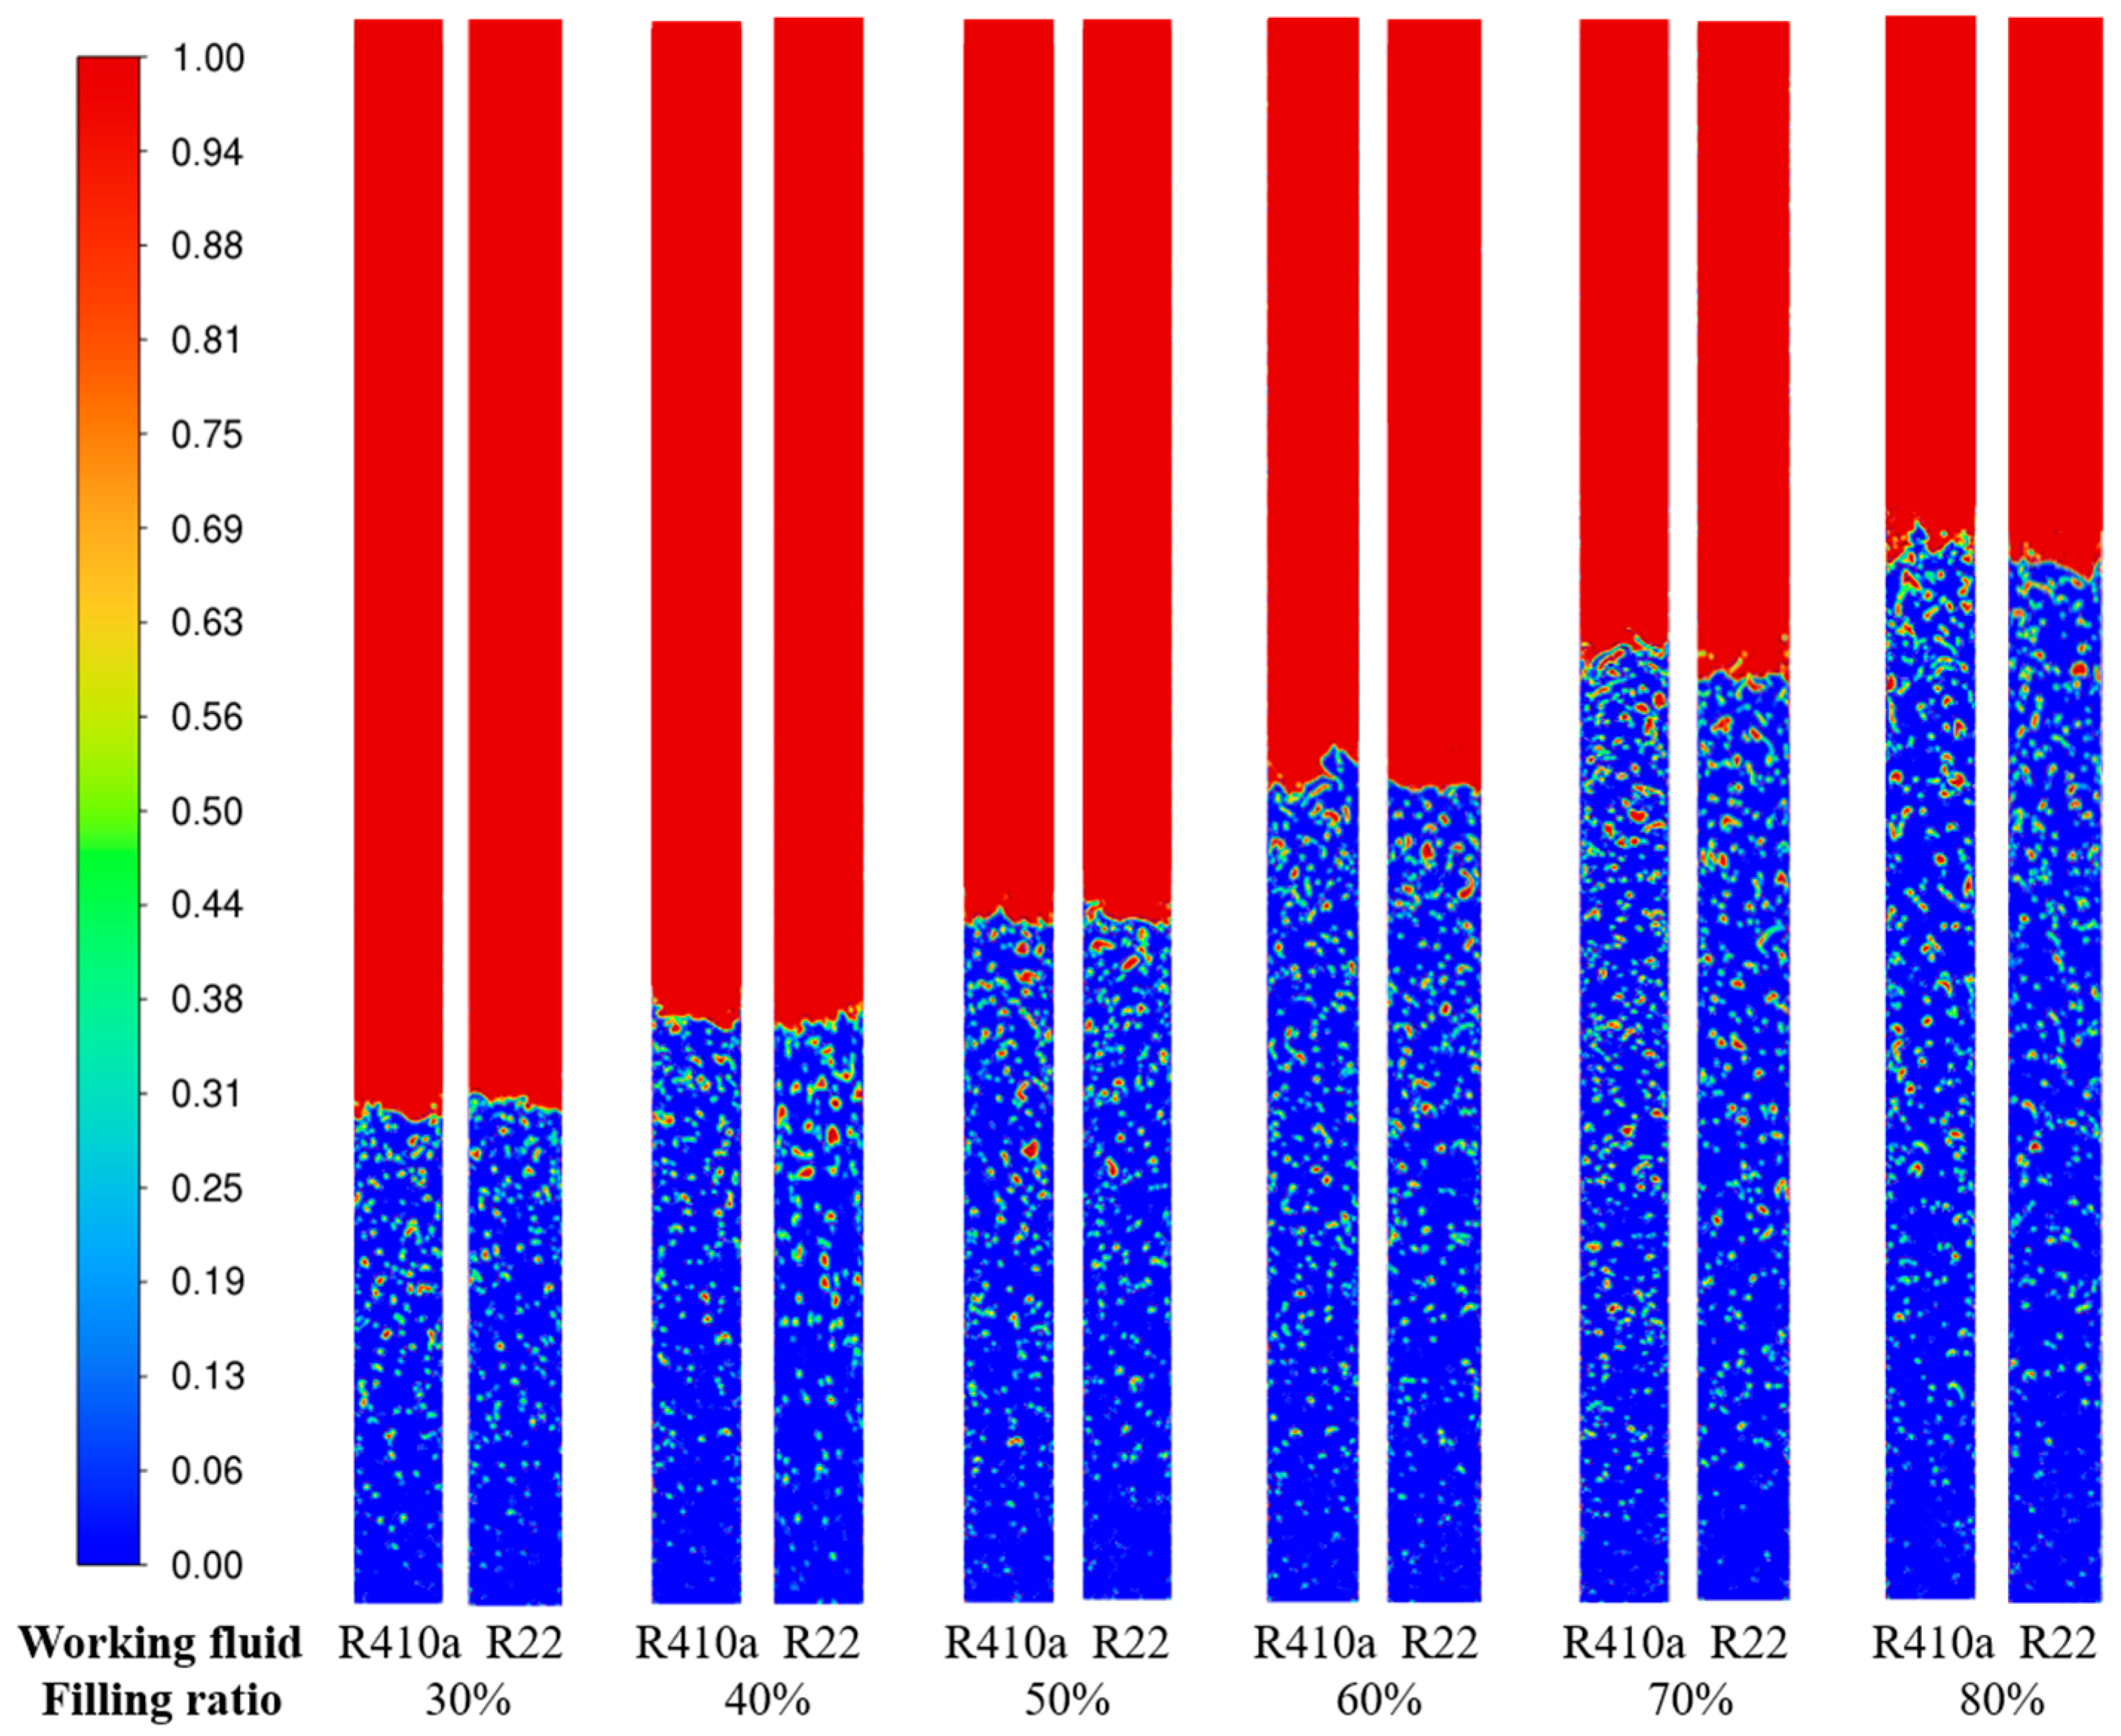
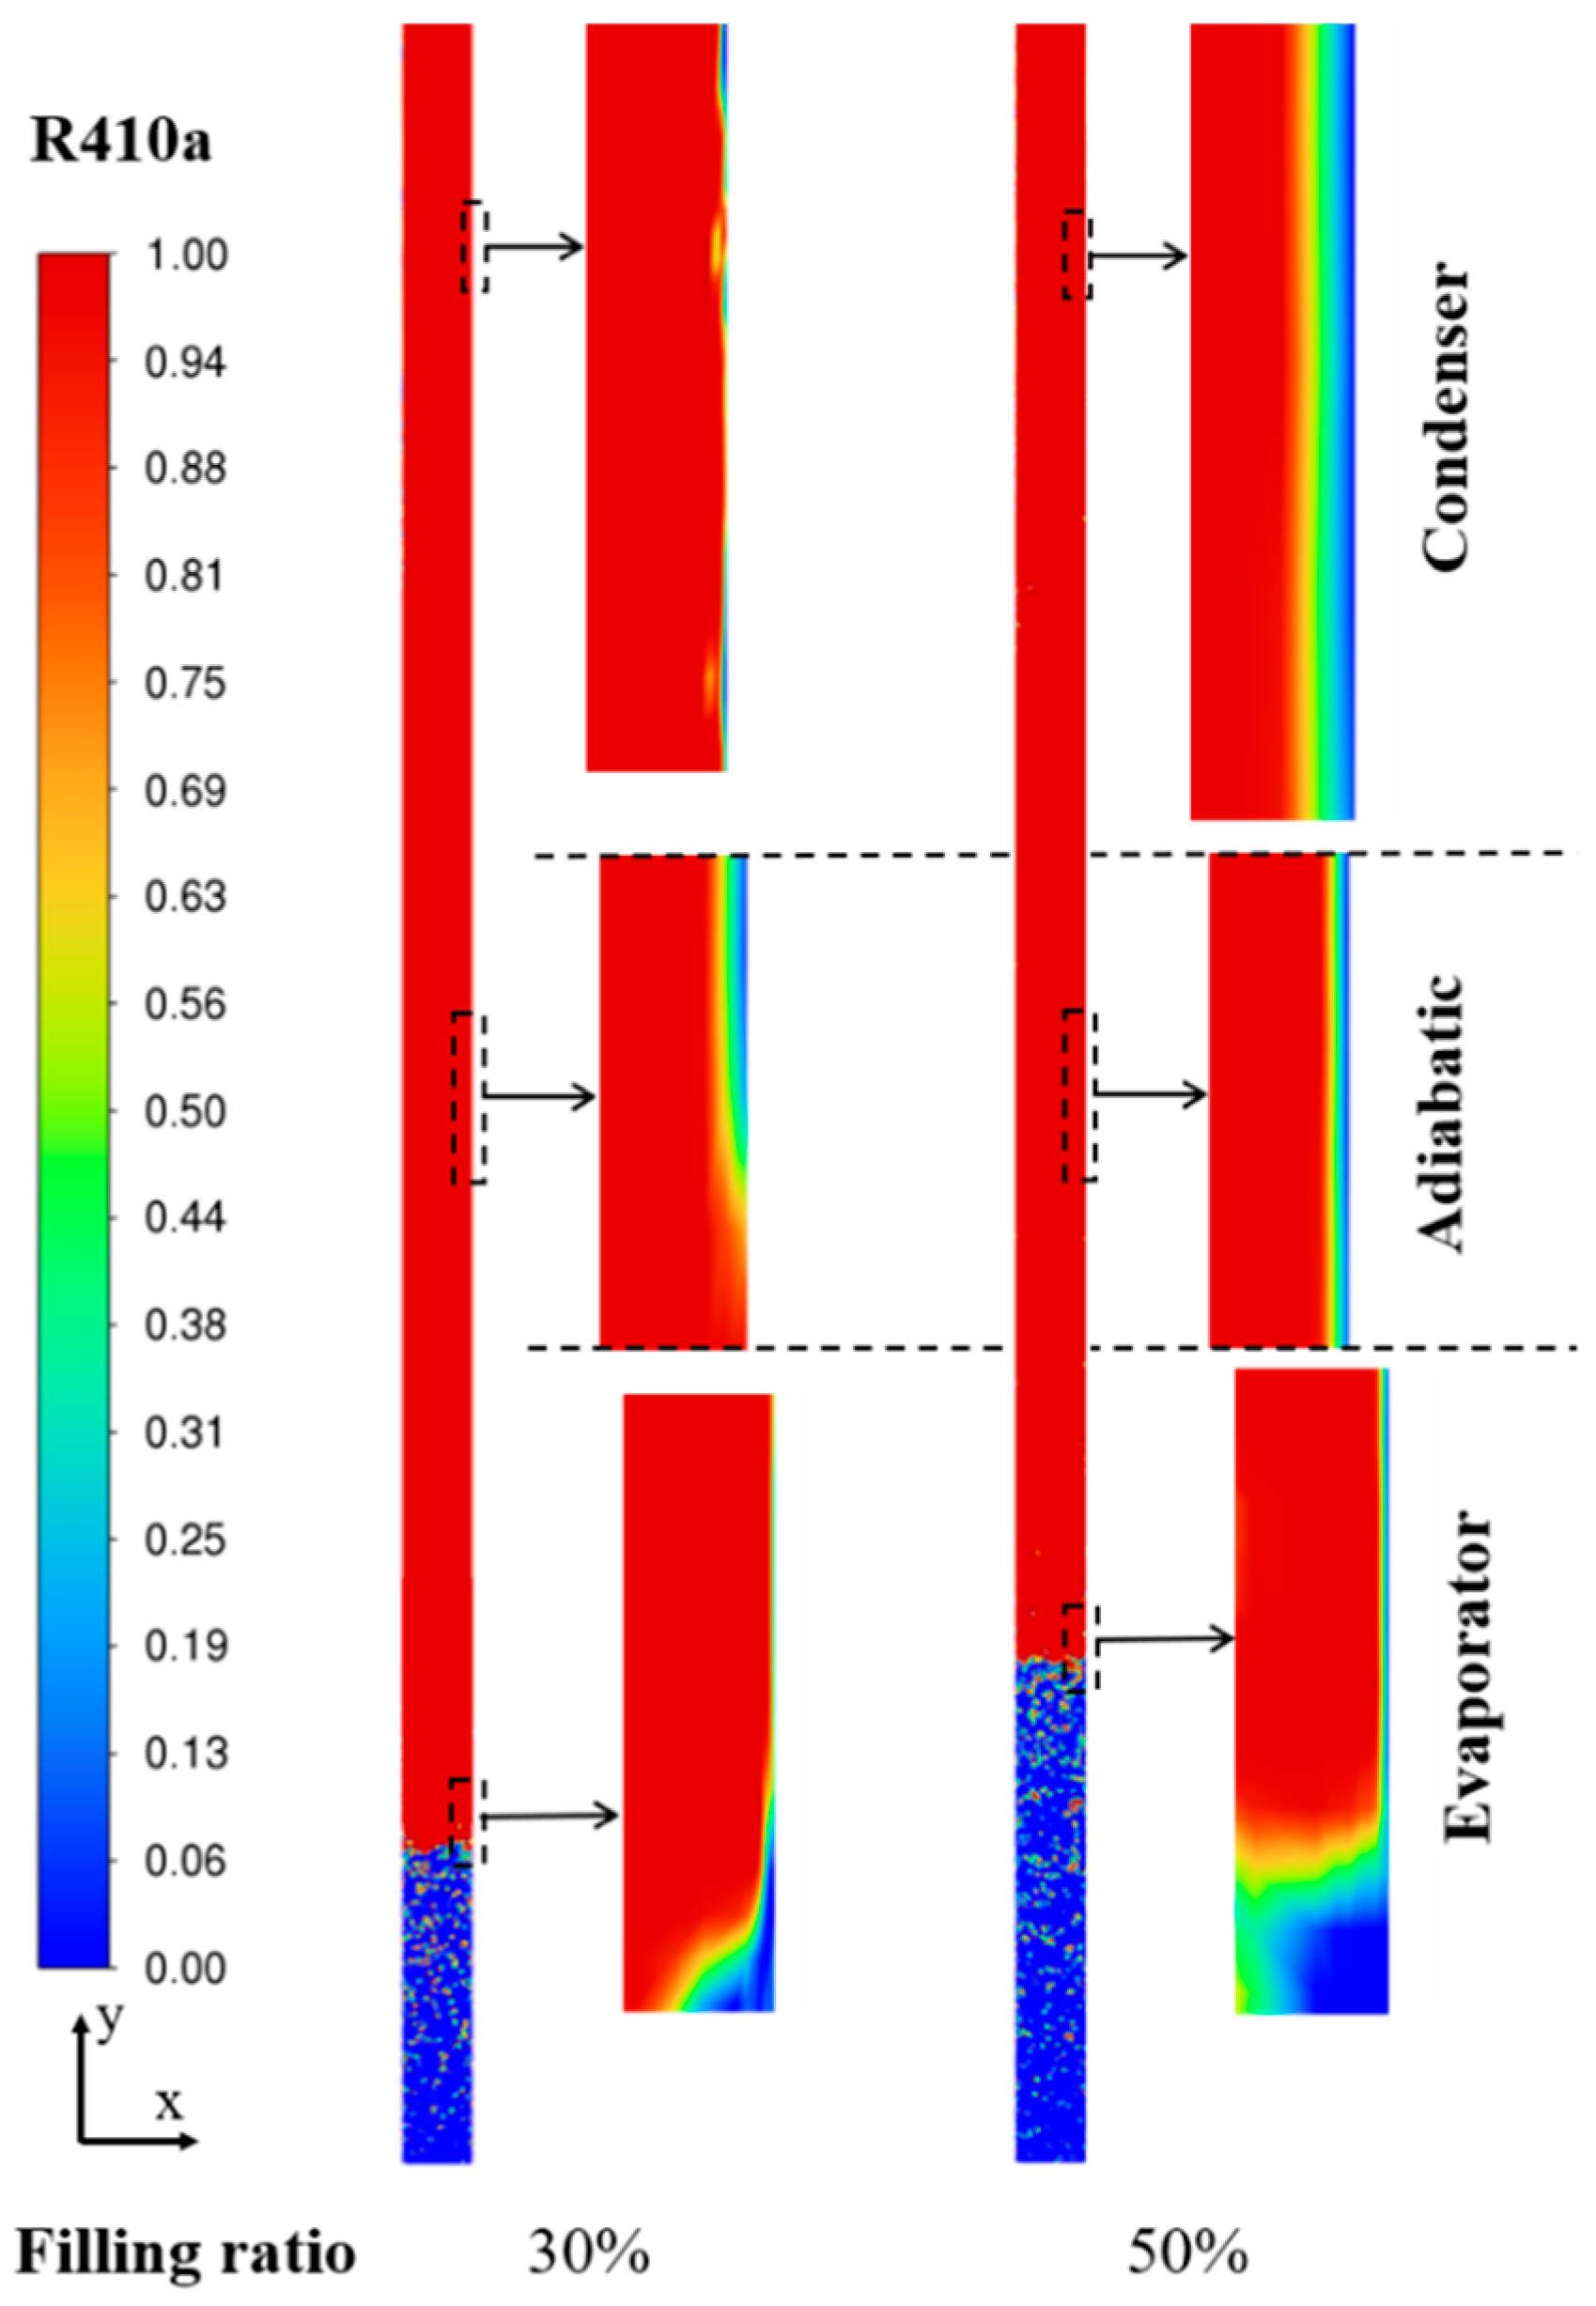
As illustrated in Figure 7, the vapour volume fraction contours of R22 and R410a GHP at different filling ratios is demonstrated. When the filling ratio is 30%, there is less working fluid in the evaporator, local dry areas appear in the evaporator, the temperature rises sharply, and the amount of vapour produced by vaporisation also decreases accordingly. This results in a reduction in the heat released by the condensation of the vapour transferred to the condenser, and a continuous liquid film cannot be formed (Figure 8). Concurrently, the proximity of the liquid surface to the position of the bubble results in the observation of relatively small bubbles. When the filling ratio is 40%, the energy barrier required for bubble detachment from the wall is reduced due to the lower surface tension of the working fluid R410a. This results in a smaller bubble detachment diameter and a higher frequency, thereby enhancing the nuclear boiling intensity. It can thus be observed that the diameter of the bubble in the R22 GHP is greater than that in the R410a GHP. It has been established that, when the filling ratio is in the range of 50% to 60%, there is an increase in the heat flux density inside the GHP. Concurrently, the core volume of vaporisation increases, as does the bubble generation rate. In addition, the upward resistance decreases, leading to an intensification of the disturbance within the working fluid. Furthermore, this results in an increase in the heat transfer coefficient of the evaporator of the GHP. The liquid film that has condensed and refluxed in the condenser is capable of completely covering the evaporator, thereby ensuring the continuity of the liquid film and liquid pool (Figure 8). This process serves to prevent the occurrence of dry burning in the evaporator. Evidence indicates that the product exhibits optimal heat transfer performance. When the filling ratio is in the range of 70% to 80%, the height of the liquid column is such that a significant number of large air bubbles adhere to the evaporator wall before reaching the liquid surface. The presence of an excess of working fluid in the evaporator has been demonstrated to result in a reduction in the rate of bubble generation, thereby impeding the process of nuclear boiling in the evaporator of the heat pipe. Furthermore, an increase in the liquid level of the working fluid results in greater resistance experienced by the generated bubbles during their ascent, thereby reducing the rate of rise in the bubbles and hindering the heat transfer process of the gravity heat pipe.

4.2. Heat Transfer Characteristics

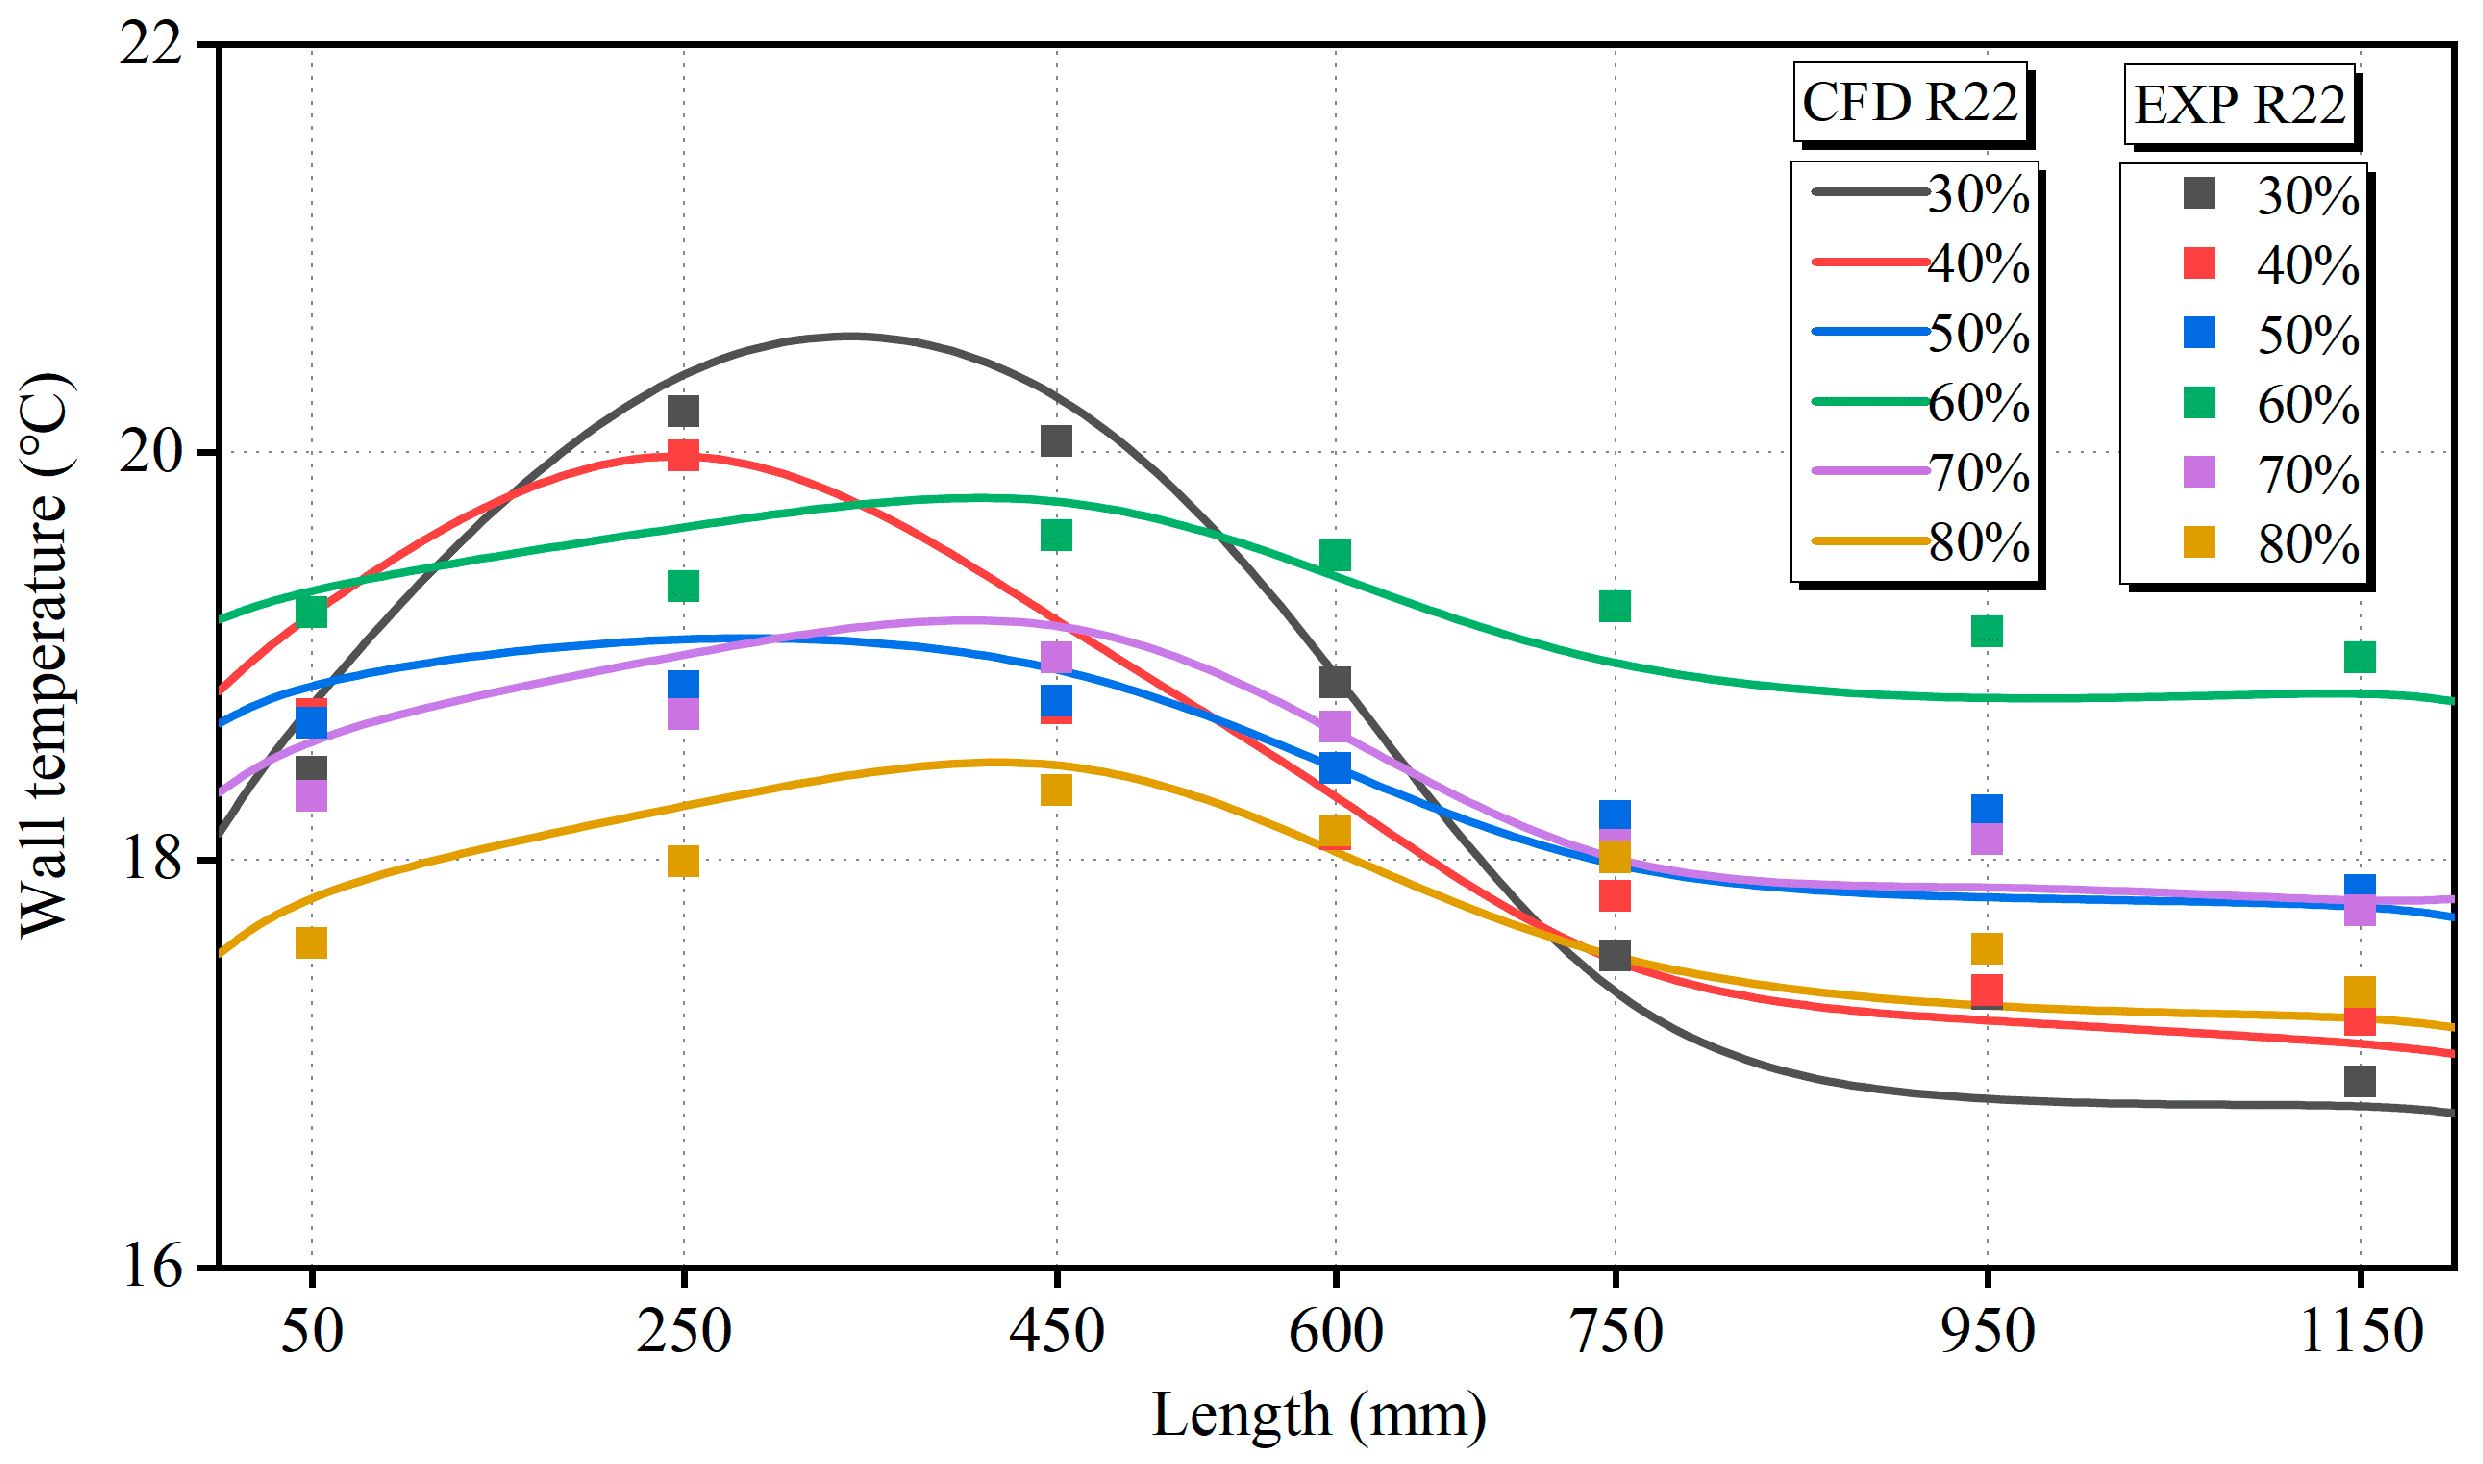
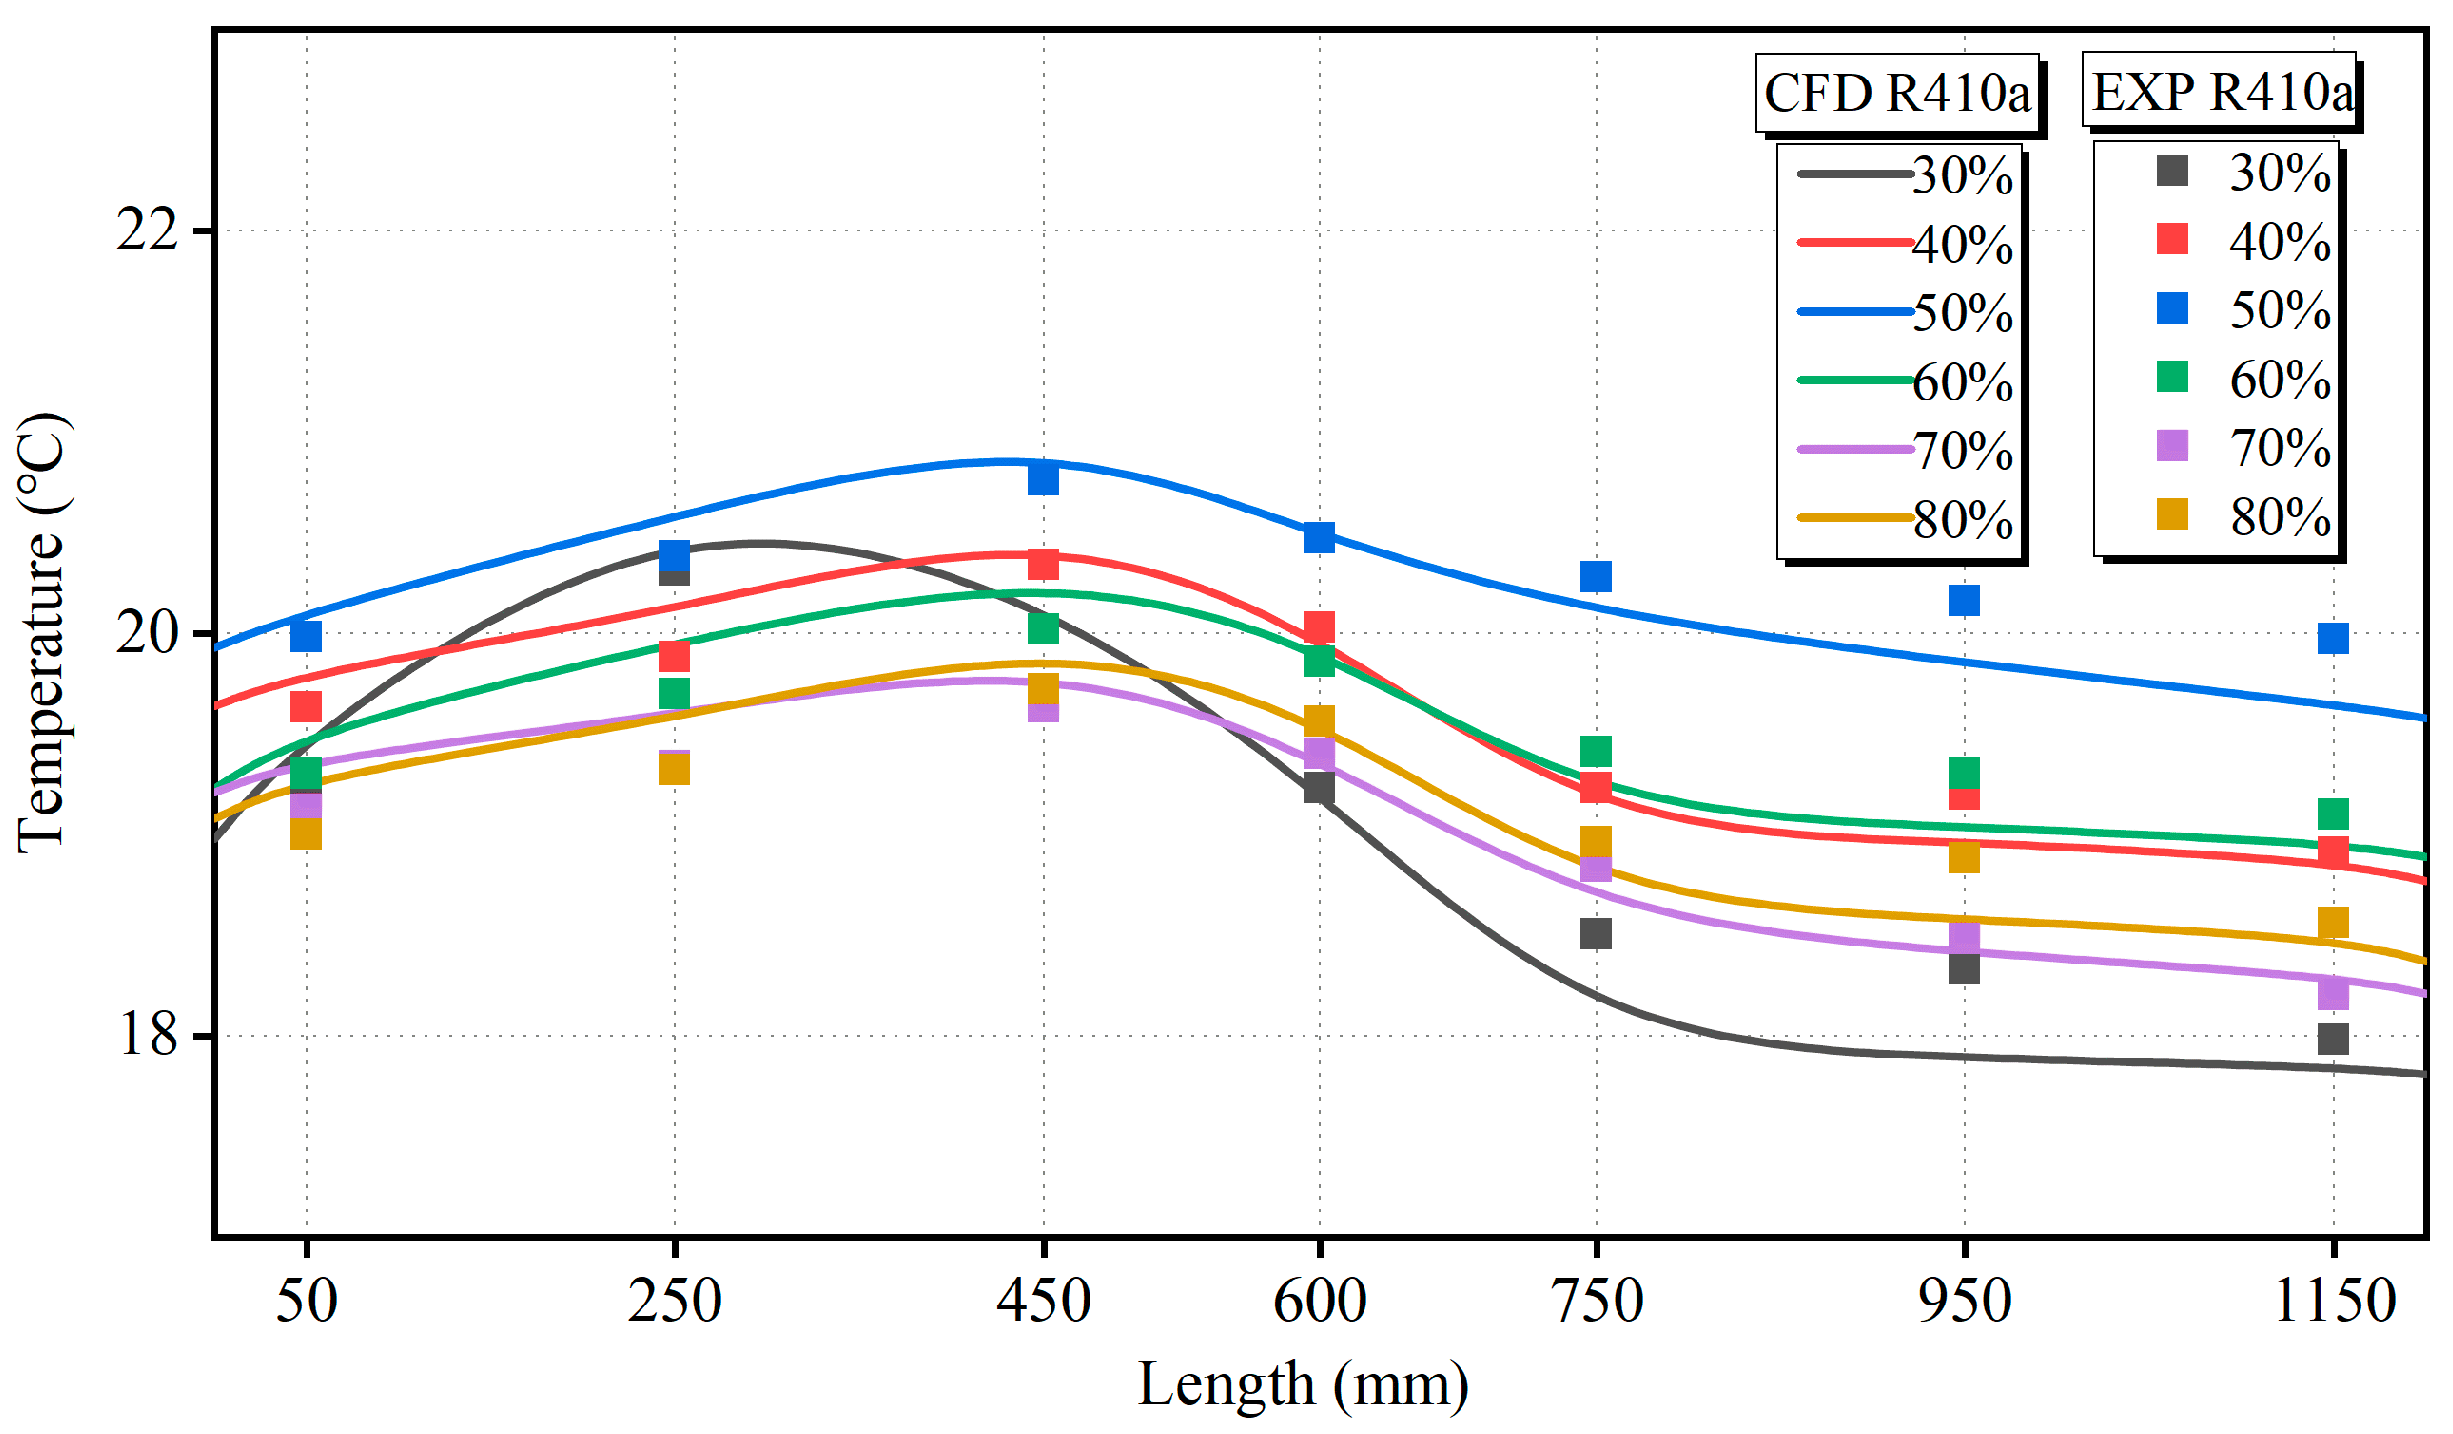
In order to verify the accuracy of the CFD simulation, this paper adopts the same GHP geometry and boundary condition settings as in the experiment. Furthermore, it arranges seven measurement points in the model for monitoring the wall temperature distribution of the evaporator, adiabatic and condenser under different filling ratios. As demonstrated in Figure 9 and Figure 10, a comparison was conducted of the wall temperature distributions of the R22 and R410a GHPs, obtained from CFD simulations, with experimental data. However, minor discrepancies are observed at the base of the evaporator and the apex of the condenser, with a maximum disparity of 2.9%. The findings corroborate the veracity of the CFD model, as evidenced by the substantial congruence between the modelled wall temperature distribution and the experimental data.
As shown in Figure 9, when the filling ratio is 30%, a sharp increase in the axial direction is exhibited by the surface temperature of the wall. Subsequent to attaining the maximum at the measurement points designated T2 and T3 in the evaporation segment, a precipitous decline is evident. At the measurement points designated T5–T7 in the condenser, the temperature exhibits a significant decline, reaching its lowest recorded value. The temperature difference between the evaporation and condensers is 2.3 °C. This finding suggests the presence of a localised dry area within the evaporator, resulting from insufficient working fluid, under conditions of low filling ratio. This results in a substantial increase in the local temperature of the evaporator, whilst the amount of vapour produced by vaporisation decreases, and the latent heat transferred to the condenser drops. Consequently, the mean temperature of the condenser is comparatively low. As the filling ratio increased to 40%, the average temperature of the evaporator decreased, and the temperature difference with the condenser reduced to 1.8 °C. However, the temperature at the T2 measurement point of the evaporator still reached its peak, indicating that the condensation reflux still could not fully cover the evaporator at this time, and the liquid film distribution was uneven. When the filling ratio is in the range of 50% to 60%, the axial distribution of the wall surface temperature tends to stabilise, and the temperature difference between the evaporator and the condenser significantly decreases, demonstrating excellent heat transfer performance and isothermal property. It has been demonstrated that, at a 60% filling ratio, the average wall temperature of GHP reaches 19.3 °C, which is higher than that of other filling ratios. This phenomenon signifies that, at this juncture, the heat flux density within the heat pipe is increasing, the amount of vaporized core is rising, the bubble generation rate is elevated, and the rising resistance is diminished. Consequently, the disturbance of the working fluid is intensified, thereby augmenting the heat transfer coefficient of the evaporator of the heat pipe. This ultimately leads to the optimal heat transfer performance. As the filling ratio continues to increase to between 70% and 80%, the wall temperature distribution of the GHP becomes uniform, but the heat transfer efficiency is reduced. The wall temperature distribution at 70% filling ratio is comparable to that 50% filling ratio. However, at 80% filling ratio, the average wall temperature of GHP drops to 17.8 °C, indicating that there is an excessive amount of working fluid in the evaporator at this time, which limits the generation of bubbles, hindering the formation of nuclear boiling in the evaporator of the heat pipe. Furthermore, an increase in the liquid level of the working fluid results in an increase in the resistance of the bubbles generated during their ascent, thereby slowing down the rising speed of the bubbles and inhibiting the overall heat transfer performance of the GHP.
As demonstrated in Figure 10, the wall temperature distribution of the R410a GHP for different filling ratios exhibits notable discrepancies in comparison with that of R22. With the exception of a filling ratio of 30%, the wall temperature of the GHP is evenly distributed along the axial direction at filling ratios of between 40% and 80%. The temperature difference between the evaporator and the condenser is minimal, thus demonstrating good isothermal property and stability. It is demonstrated by the results that, as the filling ratio is increased, the average wall temperature of R410a GHP firstly rises and subsequently falls, achieving its maximum value of 20.3 °C at 50% filling ratio. The primary cause of the aforementioned disparities in temperature distribution is attributable to the divergent thermal physical parameters exhibited by the respective working fluids, namely R410a and R22. These parameters, encompassing latent heat of evaporation, saturated vapor pressure, and surface tension, exert a substantial influence on the evaporation and condensation processes occurring within the GHP. R410a is characterised by a higher saturated vapour pressure and a lower surface tension. This renders it more conducive to the formation of high-frequency, small-diameter bubbles within the evaporator. This effectively enhances the intensity of local disturbances and nuclear boiling. Concurrently, the latent heat release rate of R410a vapour in the condenser is elevated, thereby facilitating the maintenance of continuity and coverage of the liquid film reflux, in addition to reducing the risk of drying out in the evaporator. Therefore, under the same filling ratio and working conditions, R410a GHP as a whole exhibits stronger heat transfer performance and uniformity of temperature distribution.
As shown in Figure 11, the CFD simulation results demonstrate higher values in comparison to the experimental data for each filling ratio, mainly because the VOF model is unable to fully capture the micro-scale bubble nucleation and liquid disturbance effects occurring in actual boiling, leading to an underestimation of the local heat transfer coefficient and consequently a slightly higher overall thermal resistance. The thermal resistance of both working fluids demonstrates a tendency to initially decrease and subsequently increase with the rise in filling ratio, attaining its lowest value around 50% to 60% of the filling ratio. This finding signifies that the distribution of working fluids, gas–liquid phase change, and heat transfer efficiency attain their optimal state within this specific range of filling ratios. For R22 GHP (Figure 11a), the thermal resistance attains its maximum value of 0.08 K/W at a 30% filling ratio, and the CFD simulation thermal resistance at this time is 0.11 K/W. This finding suggests that the local drying of the evaporator at a low filling ratio reduces the heat transfer efficiency of GHP. However, an increase in the filling ratio has been shown to result in the strengthening of the working fluid reflux, thereby making the evaporation condensation process more balanced, and gradually decreasing the thermal resistance. The minimum value of 0.009 K/W is attained at a 60% filling ratio, at which point the CFD simulation thermal resistance is 0.024 K/W In contrast, the overall thermal resistance of R410a GHP (Figure 11b) is lower. The thermal resistance drops to the minimum value at a 50% filling ratio. At this time, the experimental thermal resistance is 0.007 K/W, and the simulation thermal resistance is 0.021 K/W. Both are lower than the minimum thermal resistance value of R22 GHP, demonstrating a stronger heat transfer capacity. The thermal performance advantages of R410a are primarily attributable to its higher saturated vapor pressure and lower surface tension. These characteristics have been shown to enhance the intensity of nuclear boiling and facilitate the stable reflux of the liquid film in the condenser, thereby improving the thermal coupling effect between the evaporation and condensation processes. Furthermore, the average wall temperature of R410a GHPs with a 50% filling ratio is 1 °C higher than that of R22 GHPs with a 60% filling ratio. It is evident from the findings that the working fluid R410a exhibits not only the lowest thermal resistance at a 50% filling ratio, but also attains the optimal overall heat transfer state, thereby surpassing the performance of the working fluid R22. Consequently, despite the slight discrepancy between the CFD simulation results and the experimental data, the trend of thermal resistance variation remains consistent, thereby validating the model’s rationality and predictive capacity.

5. Conclusions

The present paper proposes a CFD simulation model of the gravity heat pipe, which is employed for the purpose of recovering waste heat from mine return air. The experimental study encompassed the investigation of the wall temperature distribution and the alterations in thermal resistance of R22 and R410a GHPs, encompassing a range of filling ratios from 30% to 80%, under a heating power of 30 W. The present study investigates the effects of different working fluids and filling ratios on the two-phase flow distribution and heat transfer performance of GHP. The following conclusions can be drawn:
(1) The CFD simulation results show that the filling ratio has a significant impact on the two-phase flow inside GHP. When the filling ratio is relatively low (30% to 40%), local drying occurs in the evaporator. At this time, there is less working fluid, and the liquid film is insufficient to cover the surface of the evaporator, resulting in low heat transfer efficiency. As the filling ratio increases to 50% to 60%, the heat flux density significantly increases, and the liquid film in the evaporator becomes continuous with the liquid pool, enhancing the heat transfer efficiency. When the filling ratio is further increased to 70% to 80%, if there is too much liquid in the evaporator, the flow resistance of the bubbles during their ascent will increase and their speed will slow down, resulting in a decrease in heat transfer efficiency.
(2) The wall temperature distribution obtained by CFD simulation is in good agreement with the experimental results, with a maximum deviation of 2.9%. With the increase in the filling ratio, when the filling ratio is 50% to 60%, the axial distribution of the wall surface temperature tends to flatten. Among them, at a filling ratio of 60%, the average wall temperature of R22 GHP reached the maximum value of 19.3 °C. The average wall temperature of R410a GHP reaches the maximum value of 20.3 °C when the filling ratio is 50%. This finding suggests that the working fluid R410a requires less mass to achieve the optimal liquid filling rate condition and has a higher heat transfer efficiency.
(3) The thermal resistance shows a trend of first decreasing and then increasing with the increase of the filling ratio, reaching the lowest value between 50% and 60% of the filling ratio. Moreover, among the minimum thermal resistance values of the two working fluids, the thermal resistance of R410a GHP at 50% filling ratio is 0.021 K/W, which is lower than that of R22 GHP at 60% filling ratio, which is 0.024 K/W. Therefore, under the condition of the optimal filling ratio, R410a GHP not only has better heat transfer performance, but also shows better isothermal property.
It can thus be concluded that, in the context of the recovery of mine return air waste heat, the R410a gravity heat pipe, when utilised with a filling ratio of 50%, demonstrates optimal overall performance. This condition is characterised by the lowest thermal resistance, the most uniform wall temperature distribution, a high heat flux density, and a stable, continuous liquid film along the inner wall. These features indicate that the R410a GHP possesses superior heat transfer efficiency and excellent isothermal stability under practical operating conditions.

Author Contributions

Conceptualization, B.S. and G.M.; investigation, B.S.; methodology, B.S., G.M., and A.W.; Visualization, B.S. and J.Y.; Software, B.S.; data collection and analysis, B.S. and A.W.; supervision, G.M.; writing—original draft, B.S. and X.C. All authors have read and agreed to the published version of the manuscript.

Funding

This research was funded by China National Key Laboratory of Intelligent Coal Mining and Rock Formation Control, grant number SKLIS202409.

Data Availability Statement

The original contributions presented in the study are included in the article; further inquiries can be directed to the corresponding author.

Conflicts of Interest

The authors declare no conflicts of interest.

References

  1. Kaplunov, D.R.; Ryl’nikova, M.V.; Radchenko, D.N. Utilization of renewable energy sources in hard mineral mining. J. Min. Sci. 2015, 51, 111–117. [Google Scholar] [CrossRef]
  2. Gui, X. Research on numerical simulation of wind kinetic energy recovery power generation at mine return air Wellhead. Arab. J. Sci. Eng. 2021, 46, 12743–12754. [Google Scholar] [CrossRef]
  3. Baidya, D.; de Brito, M.A.R.; Sasmito, A.P.; Ghoreishi-Madiseh, S.A. Diesel generator exhaust heat recovery fully-coupled with intake air heating for off-grid mining operations: An experimental, numerical, and analytical evaluation. Int. J. Min. Sci. Technol. 2022, 32, 155–169. [Google Scholar] [CrossRef]
  4. de Brito, M.A.R.; Baidya, D.; Ghoreishi-Madiseh, S.A. Techno-economic feasibility assessment of a diesel exhaust heat recovery system to preheat mine intake air in remote cold climate regions. Int. J. Min. Sci. Technol. 2020, 30, 517–523. [Google Scholar] [CrossRef]
  5. Sbarba, H.D.; Fytas, K.; Paraszczak, J. Economics of exhaust air heat recovery systems for mine ventilation. Int. J. Min. Reclam. Environ. 2012, 26, 185–198. [Google Scholar] [CrossRef]
  6. Wan, L.-R.; Li, J.-L.; Wang, L.; Zhou, G.-Y. Research and application of the heat energy recycling technology in mine return air. In Proceedings of the 2012 International Conference on Communication, Electronics and Automation Engineering, Xi’an, China, 23–25 August 2012; Springer: Berlin/Heidelberg, Germany, 2013; pp. 247–253. [Google Scholar]
  7. Faghri, A. Heat pipes: Review, opportunities and challenges. Front. Heat Pipes (FHP) 2014, 5. [Google Scholar] [CrossRef]
  8. Anand, R.; Li, A.; Huang, W.; Chen, J.; Li, Z.; Ma, Q.; Jiang, F. Super-long gravity heat pipe for geothermal energy exploitation-A comprehensive review. Renew. Sustain. Energy Rev. 2024, 193, 114286. [Google Scholar] [CrossRef]
  9. Lu, W.; Liu, Y.; Zhang, L.; Liu, F.; Wu, J.; Zhan, Z.; Zhang, X.; Zhang, H. Flow and heat transfer characteristics of a new coke oven gas ascension pipe heat exchanger: Experimental validation and numerical study. Therm. Sci. Eng. Prog. 2025, 60, 103386. [Google Scholar] [CrossRef]
  10. Peng, H.; Jia, X.L. Experimental study on heat energy recovery and utilization of coal gangue hill based on gravity heat pipe. Energy Rep. 2022, 8, 220–229. [Google Scholar] [CrossRef]
  11. Wang, G.; Bi, J.; Fan, Y.; Zhu, L.; Zhang, F.; Feng, D. Settlement characteristic of warm permafrost embankment with two-phase closed thermosyphons in Daxing’anling Mountains region. Sustainability 2022, 14, 12272. [Google Scholar] [CrossRef]
  12. Maghrabie, H.M.; Olabi, A.; Alami, A.H.; Al Radi, M.; Zwayyed, F.; Salamah, T.; Wilberforce, T.; Abdelkareem, M.A. Numerical simulation of heat pipes in different applications. Int. J. Thermofluids 2022, 16, 100199. [Google Scholar] [CrossRef]
  13. Li, Z.; Huang, W.; Chen, J.; Cen, J.; Cao, W.; Li, F.; Jiang, F. An enhanced super-long gravity heat pipe geothermal system: Conceptual design and numerical study. Energy 2023, 267, 126524. [Google Scholar] [CrossRef]
  14. Zeng, J.-L.; Liu, X.; Su, C.-Q.; Wang, Y.-P.; Xiong, X. Numerical investigation of a geothermal thermoelectric generator using gravity heat pipe structure. Energy Rep. 2023, 9, 1237–1246. [Google Scholar] [CrossRef]
  15. Lu, X.; Liu, J.; Tong, X.; Dai, R.; Xiao, Y.; Deng, J. Experimental investigation on thermal performance of gravity heat pipe with different pipe configurations. Case Stud. Therm. Eng. 2025, 65, 105695. [Google Scholar] [CrossRef]
  16. Chen, J.; Huang, W.; Cen, J.; Cao, W.; Li, Z.; Li, F.; Jiang, F. Heat extraction from hot dry rock by super-long gravity heat pipe: Selection of working fluid. Energy 2022, 255, 124531. [Google Scholar] [CrossRef]
  17. Chen, J.; Cen, J.; Huang, W.; Jiang, F. Multiphase flow and heat transfer characteristics of an extra-long gravity-assisted heat pipe: An experimental study. Int. J. Heat Mass Transf. 2021, 164, 120564. [Google Scholar] [CrossRef]
  18. Karpenko, M.; Bogdevičius, M. Investigation of hydrodynamic processes in the system—“pipeline-fittings”. In Proceedings of the International Conference TRANSBALTICA: Transportation Science and Technology, Vilnius, Lithuania, 18–19 September 2025; Springer International Publishing: Cham, Switzerland, 2019; pp. 331–340. [Google Scholar]
  19. Fadhl, B.; Wrobel, L.C.; Jouhara, H. CFD modelling of a two-phase closed thermosyphon charged with R134a and R404a. Appl. Therm. Eng. 2015, 78, 482–490. [Google Scholar] [CrossRef]
  20. Chen, Y.; Chen, G.; Xu, H.; Zhou, J. Numerical investigation of effect of fill ratio and inclination angle on a U-shaped elliptical gravity heat pipe thermal performance. Therm. Sci. 2025, 23. [Google Scholar] [CrossRef]
  21. Jafari, D.; Filippeschi, S.; Franco, A.; Di Marco, P. Unsteady experimental and numerical analysis of a two-phase closed thermosyphon at different filling ratios. Exp. Therm. Fluid Sci. 2017, 81, 164–174. [Google Scholar] [CrossRef]
  22. Yao, H.; Yue, C.; Wang, Y.; Chen, H.; Zhu, Y. Numerical investigation of the heat and mass transfer performance of a two-phase closed thermosiphon based on a modified CFD model. Case Stud. Therm. Eng. 2021, 26, 101155. [Google Scholar] [CrossRef]
  23. Niu, Y. Research on thermal energy recycling utilization in high temperature mines. Procedia Eng. 2015, 121, 389–395. [Google Scholar] [CrossRef]
  24. Kalantari, H.; Amiri, L.; Ghoreishi-Madiseh, S.A. Analysis of the performance of direct contact heat exchange systems for application in mine waste heat recovery. Int. J. Energy Res. 2022, 46, 290–307. [Google Scholar] [CrossRef]
  25. Ghoreishi-Madiseh, S.A.; Kalantari, H.; Kuyuk, A.F.; Sasmito, A.P. A new model to analyze performance of mine exhaust heat recovery systems with coupled heat exchangers. Appl. Energy 2019, 256, 113922. [Google Scholar] [CrossRef]
  26. Ran, Y.; Peng, J.; Tian, X.; Luo, D.; Zhao, J.; Pei, P. Technologies for heat hazard governance and thermal energy recovery in deep mines. Energies 2024, 17, 1369. [Google Scholar] [CrossRef]
  27. Bao, L.; Wang, J.; Wang, J.; Yu, Z. The heat recovery technologies of mine waste heat sources. World J. Eng. 2017, 14, 19–26. [Google Scholar] [CrossRef]
  28. Zhai, Y.; Zhao, X.; Xue, G.; Dong, Z. Study on Heat Transfer Performance and Parameter Improvement of Gravity-Assisted Heat Pipe Heat Transfer Unit for Waste Heat Recovery from Mine Return Air. Energies 2023, 16, 6148. [Google Scholar] [CrossRef]
  29. Zhai, Y.; Ling, Z.; Zhao, X.; Dong, Z. Effects of Structure Parameters of Gravity-Type Heat Pipe on Heat Transfer Characteristics for Waste Heat Recovery from Mine Return Air. Energies 2024, 17, 6495. [Google Scholar] [CrossRef]
  30. Yang, H.; Yang, R.; Huo, Y. Utilization of low-temperature waste heat from mine return air based on separated heat pipe technology. J. Min. Sci. Technol. 2024, 9, 828–836. [Google Scholar]
  31. De Schepper, S.C.K.; Heynderickx, G.J.; Marin, G.B. Modeling the evaporation of a hydrocarbon feedstock in the convection section of a steam cracker. Comput. Chem. Eng. 2009, 33, 122–132. [Google Scholar] [CrossRef]
  32. Fadhl, B.; Wrobel, L.C.; Jouhara, H. Numerical modelling of the temperature distribution in a two-phase closed thermosyphon. Appl. Therm. Eng. 2013, 60, 122–131. [Google Scholar] [CrossRef]
  33. Lemmon, E.W.; Huber, M.L.; McLinden, M.O. NIST reference fluid thermodynamic and transport properties–REFPROP. NIST Stand. Ref. Database 2002, 23, v7. [Google Scholar]
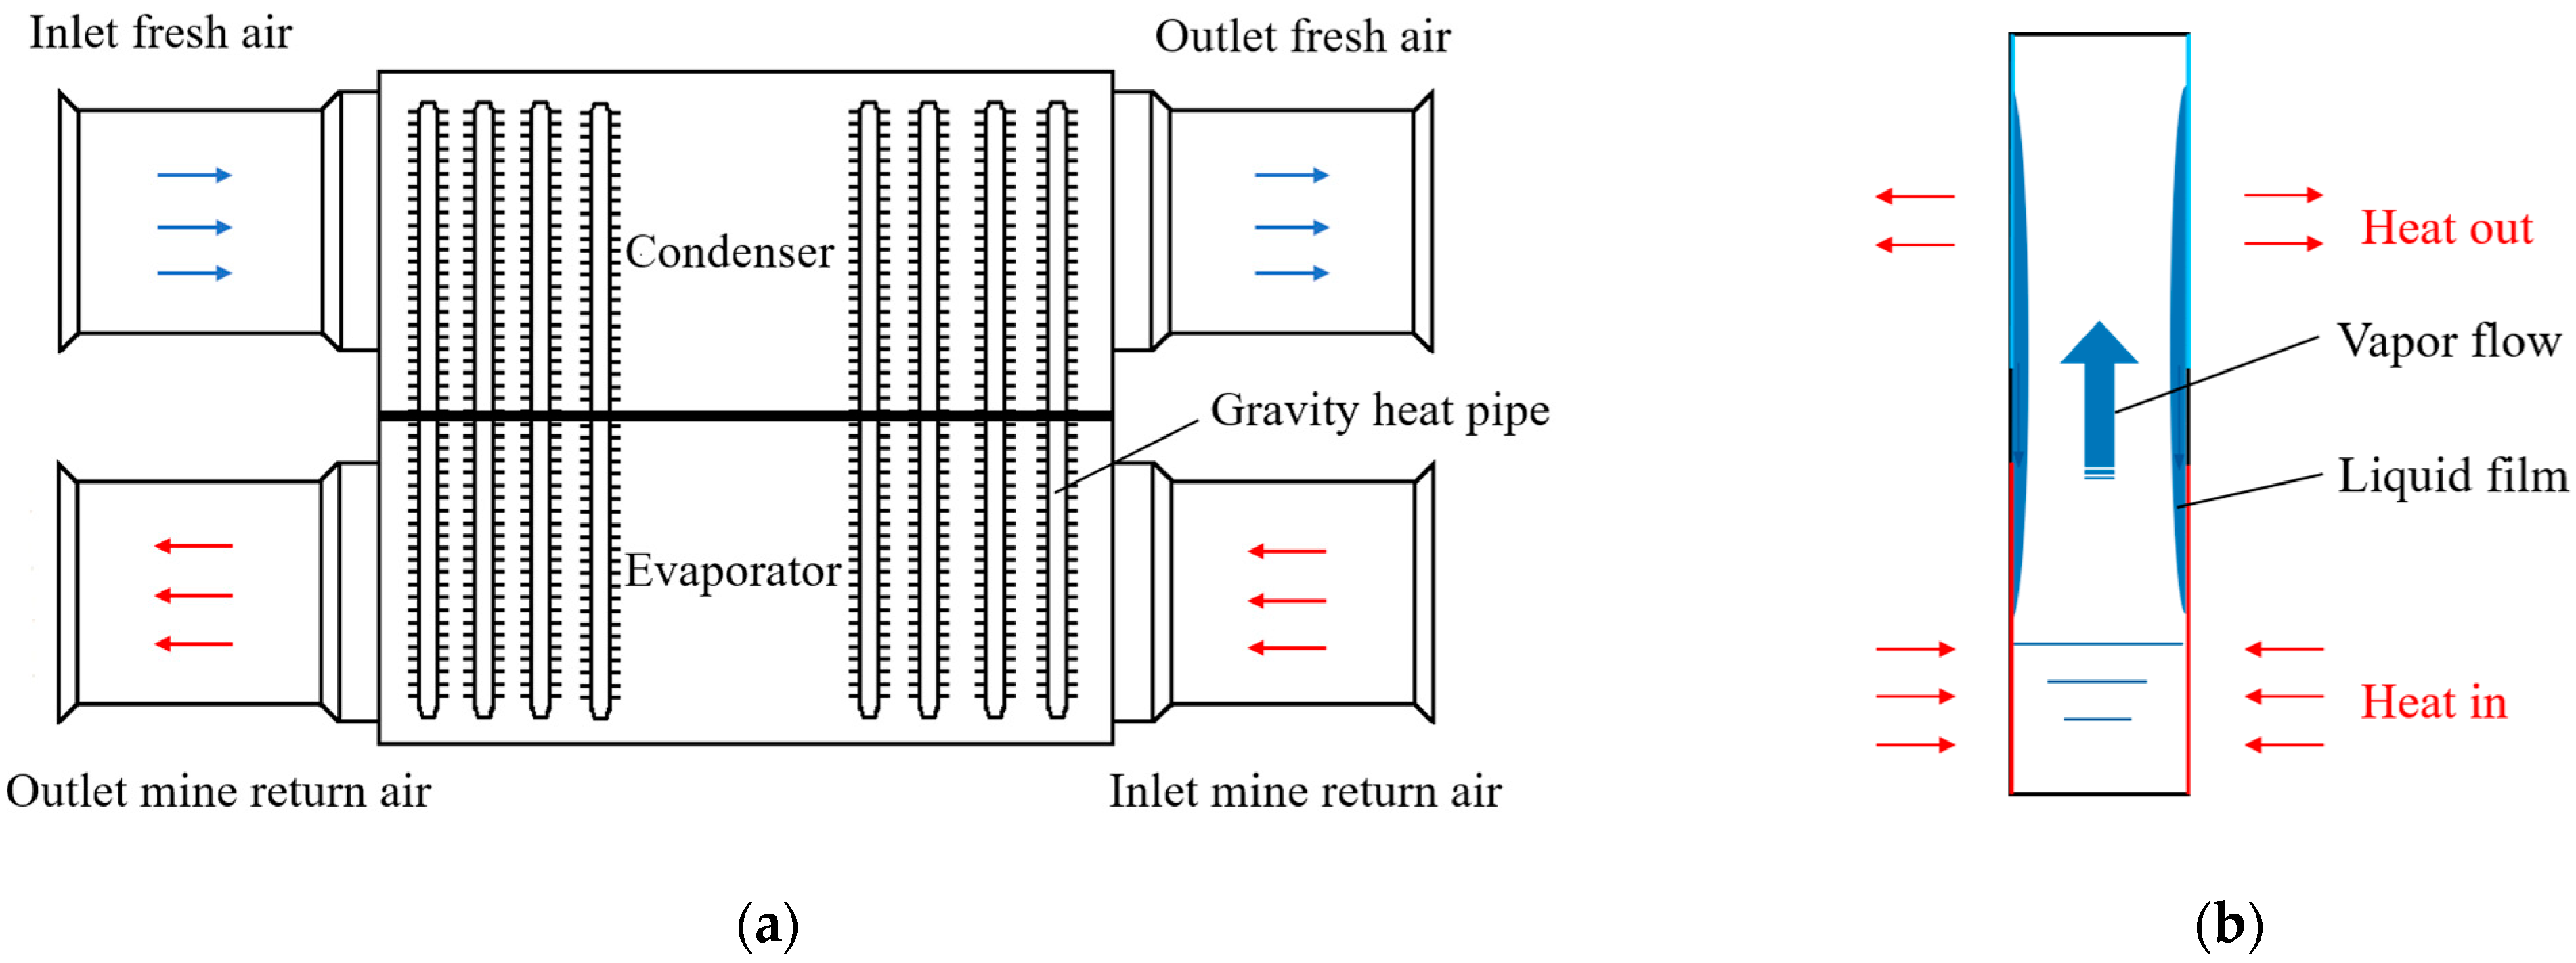
Figure 1. Gravity heat pipe heat exchanger for recovering waste heat from mine return air. (a) Schematic diagram of gravity heat pipe heat exchanger; (b) Schematic diagram of GHP.
Energies 18 05942 g001
Figure 2. Experimental system diagram. (a) Schematic diagram of the experimental system; (b) Dimensions and thermocouples’ positions.
Energies 18 05942 g002
Figure 3. Physical model diagram.
Energies 18 05942 g003
Figure 4. Mesh distribution.
Energies 18 05942 g004
Figure 5. Boundary conditions of numerical simulation.
Energies 18 05942 g005
Figure 6. Vapour volume fraction contours at various simulation time (R410a GHP, FR = 50%).
Energies 18 05942 g006
Figure 7. Vapour volume fraction contours for R22 and R410a GHP for different filling ratios.
Energies 18 05942 g007
Figure 8. Liquid film condensation process for the R410a GHP (FR = 30%, FR = 50%).
Energies 18 05942 g008
Figure 9. Wall temperature distribution for experiments and CFD simulations along R22 GHP for different filling ratios.
Energies 18 05942 g009
Figure 10. Wall temperature distribution for experiments and CFD simulations along R410a GHP for different filling ratios.
Energies 18 05942 g010
Figure 11. Thermal resistance distribution for the GHP for different filling ratios. (a) R22 GHP; (b) R410a GHP.
Energies 18 05942 g011
Table 1. Grid Independence Verification for R22 GHP.
Mesh Size (Cells)245,664327,552436,740545,925
Te292.71292.15292.21292.19
Tad292.02291.84291.92291.88
Tc290.41290.67290.69290.68
Table 2. Density coefficients of the working fluids.
Working FluidDensity (ρl)
A0A1A2A3
R223728.422−21.6690.07284−9.63 × 10⁻⁴
R410a4649.71897−37.218810.14793−2.13 × 10⁻⁴
Table 3. Surface tension coefficients of the working fluids.
Working FluidSurface Tension (σ)
B0B1B2B3
R220.0118−1.5175 × 10−51.5708 × 10−70
R410a0.5191−6.72 × 10⁻⁵−6.52 × 10−71.18 × 10−9
Table 4. Physical properties of working fluids [33].
PropertiesWorking Fluid
R22-LiquidR22-VaporR410a-LiquidR410a-Vapor
Density (kg/m3)ρl34.36ρl49.5
Thermal conductivity (W/m K)0.08750.01060.09420.0142
Viscosity (kg/m s)2.11 × 10−41.24 × 10−51.95 × 10−41.41 × 10−5
Specific heat (kJ/kg K)1.36180.87631.68431.1285
Latent heat (kJ/kg)191.3204.7
Critical temperature (K)369.3343.61
Critical pressure (kPa)49904770
Molecular weight (g/mol)86.4772.59
Disclaimer/Publisher’s Note: The statements, opinions and data contained in all publications are solely those of the individual author(s) and contributor(s) and not of MDPI and/or the editor(s). MDPI and/or the editor(s) disclaim responsibility for any injury to people or property resulting from any ideas, methods, instructions or products referred to in the content.