Abstract
Partial discharge, as an important indicator of insulation degradation in transformers, is a crucial means of assessing the insulation performance of transformers. The existing broadband pulse current detection is easy to install and has no electrical connection with the detection equipment, but it is susceptible to electromagnetic interference from the external environment. Although ultra-high-frequency detection has good anti-interference performance, the installation of its sensors needs to match the structure of the transformer and cannot be applied to partial discharge detection of transformers in operation. This article proposes a research method for detecting ultra-high-frequency partial discharge based on the induction signal of transformer iron core. A transformer iron core simulation model is established based on the time-domain finite-difference method, and the reliable detection frequency band of the iron core for ultra-high-frequency signals of partial discharge is simulated. At the same time, the optimal extraction method of the induction signal is also simulated and studied. The feasibility and effectiveness of the detection method are verified through partial discharge experiments on a physical 110 kV transformer. The results indicate that the transformer core can be used as an ultra-high-frequency sensor for partial discharge detection in the ultra-high-frequency domain. The ultra-high-frequency partial discharge detection method based on a transformer core induction signal is consistent with conventional pulse current and ultra-high-frequency detection.
1. Introduction
Transformers are critical components in power systems, and their operational safety and reliability directly affect the stability and continuity of power supply. Partial discharge (PD) occurring during transformer operation is often an early indication of insulation degradation. Therefore, timely detection and analysis of internal PD activity are essential to prevent equipment failure, prolong service life, and ensure the safe operation of the power system [1].
Currently, the main PD detection techniques include ultrasonic methods [2,3,4], ultra-high-frequency (UHF) detection [4,5,6,7], pulse current measurement [8,9,10,11,12], optical detection [13], and dissolved gas analysis (DGA) in oil [14,15]. Among them, the pulse current method indirectly reflects PD events by detecting high-frequency current changes in the windings. The high-frequency current transformer (HFCT) used in this method is easy to install and cost-effective, making it suitable for large-scale applications. However, its relatively low sensitivity may lead to missed detection of weak PD signals. Furthermore, the information provided by HFCT is often limited, requiring the support of other detection methods to obtain comprehensive diagnostic results.
UHF detection methods utilize the electromagnetic waves generated by PD, typically within the frequency range of 300 MHz to 3 GHz. Compared with traditional methods, UHF sensors offer higher sensitivity and better immunity to electromagnetic interference [16,17,18,19,20]. These characteristics make UHF detection highly suitable for real-time, online monitoring of high-voltage equipment such as transformers. Despite these advantages, practical deployment is constrained by the limited internal space of transformers, making sensor placement and structural design critical for effective signal acquisition without interfering with normal operation.
Metal materials have good conductivity and can respond to electromagnetic waves by converting them into electrical signals. The basic working principle of an antenna involves converting electromagnetic energy into electrical signals, or vice versa. Due to their free electrons, metals can form current under electric fields, allowing them to receive or emit electromagnetic radiation. Large metallic components inside transformers, such as the core and windings [21], can thus serve as inductive elements. When a PD event occurs, these structures can couple the radiated UHF signals, convert them into electrical signals, and transmit them through grounding conductors.
In this study, the transformer core is investigated as a PD sensing element. A signal extraction structure is installed at the core’s grounding copper bar, and its geometry is optimized to improve signal coupling. Experimental validation on a full-scale transformer platform confirmed successful detection of PD signals, offering theoretical support for practical implementation in field applications.
2. Principle of Discharge Signal Induction by Transformer Core
2.1. Antenna Performance Parameters
An antenna is a device used to transmit or receive electromagnetic waves and is widely applied in fields such as wireless communication, radar, broadcasting, and navigation. Its operation is based on the electromagnetic radiation theory derived from Maxwell’s equations. The fundamental principle involves inducing high-frequency currents in conductors to generate time-varying electromagnetic fields, which radiate into space in the form of electromagnetic waves. In receiving mode, the antenna captures electromagnetic waves propagating through space and converts them back into currents, which are then demodulated and processed by the receiving equipment.
The key performance parameters of antennas include gain, radiation pattern, polarization mode, voltage standing wave ratio (VSWR), and effective radiated power (ERP). Antenna gain measures the ability to concentrate input power in a specific direction. The radiation pattern describes how the antenna radiates energy spatially. The polarization mode—linear, circular, or elliptical—determines the orientation of the electric field of the radiated wave. The transformer core, being the largest metallic component within the transformer, enables near-field detection of partial discharges occurring at various internal locations.
The VSWR is a primary indicator of antenna performance, calculated as follows:
where Γ denotes the reflection coefficient. When the VSWR is 5, approximately 66.6% of the UHF signal is reflected, making this condition suitable for near-field PD detection using the transformer core. Therefore, a VSWR value less than 5 is defined as the effective range for reliable PD detection via the core structure.
2.2. Finite-Difference Time-Domain (FDTD) Method
The finite-difference time-domain (FDTD) method is a time-domain numerical technique widely used for simulating electromagnetic field propagation and scattering. It is particularly well-suited for analyzing transient electromagnetic field behaviors in complex structures, including antenna design, electromagnetic compatibility studies, and microwave circuit modeling.
The method is based on the Yee grid proposed in 1966, which discretizes Maxwell’s time-domain equations. By applying finite differences in both space and time, FDTD directly solves for the instantaneous distributions of electric and magnetic fields. The core procedure involves dividing the computational domain into a uniform or non-uniform mesh, approximating spatial and temporal derivatives at each grid node using difference equations, and iteratively updating the field components. This process enables accurate modeling of wave propagation while satisfying boundary conditions.
FDTD is extensively used in antenna performance simulations and is particularly suitable for modeling complex, heterogeneous dielectric structures, which aligns well with the intricate internal structure and diverse materials found in transformers. Furthermore, the method accommodates electrically large-scale simulations, enabling the modeling of structures much larger than the electromagnetic wavelength. This makes it ideal for simulating antenna characteristics of large transformer cores.
For a linear, isotropic medium without free charge and current, its Maxwell curl equation can be expressed as
In the formula, E represents the electric field intensity; H represents the magnetic field intensity; D is the electrical flux density; and B represents the magnetic flux density.
The FDTD method quantifies time and space during the calculation process, where the Z coordinate system and time are quantified. , , the points to be calculated for the E and H field values, are placed at the centers of the quantified time and space, and the finite difference is applied. The different forms of Faraday’s law of electromagnetic induction and Ampere’s loop law are shown in Equations (3) and (4). The values of E and H are cross-calculated by using the differential form of Faraday’s law of electromagnetic induction and Ampere’s loop law, thereby obtaining the one-dimensional FDTD component.
Equations (3) and (4) are the basic formulas for calculating the electric field intensity and magnetic field intensity, and only the one-dimensional components are calculated. The finite-difference time-domain calculation is carried out in the three axes of x, y, and z in space. The coordinates of the grid cells (x, y, z) are denoted as . Then, the function in any time and space can be expressed by Equation (5).
The time step for FDTD simulations is determined by the signal wavelength, and is calculated as follows:
Considering that the UHF range spans from 0.3 to 3 GHz, the grid size is set to 10 mm to meet the simulation requirements for this frequency band.
2.3. Construction of Transformer Core Simulation Models
In this study, three types of transformer cores were selected as simulation objects: a 220 kV single-phase two-limb core, a 110 kV three-phase three-limb core, and a 110 kV three-phase five-limb core. These models were used to construct comprehensive simulation representations of transformer cores.
Transformer cores are typically constructed using a laminated structure, composed of thin silicon steel sheets stacked together. Each sheet is coated with an insulating layer to effectively reduce eddy current losses. Silicon steel is chosen due to its high magnetic permeability and low core loss characteristics, making it an ideal material for transformer cores. The thickness of these sheets generally ranges from 0.23 mm to 0.35 mm; thinner sheets are more effective in minimizing eddy currents, although they also increase manufacturing costs.
In the simulation model, constructing each individual silicon steel sheet would significantly increase the computational burden and simulation time. Therefore, in this work, a model simplification strategy was adopted to ensure simulation efficiency while maintaining physical accuracy. Specifically, silicon steel sheets of identical specifications were grouped and represented as a single unified block. The transformer core model is thus constructed by stacking multiple such silicon steel blocks of varying geometries. This approach preserves the layered structure of the transformer while considerably reducing simulation time. The main structure of the model is illustrated in Figure 1.

Figure 1.
Transformer core model: (a) single-phase two-column core; (b) three-phase three-column core; (c) three-phase five-column core.
In the transformer simulation model, different components are assigned distinct material properties, including transformer oil, copper, oil–paper insulation, and steel. The key material parameters used in the simulation are summarized in Table 1, and the core geometry parameters are shown in Table 2.

Table 1.
Simulated material parameters.

Table 2.
Simulated geometric parameters.
PD current pulses typically exhibit extremely fast rising edges, with pulse durations ranging from 10−9 to 10−7 s. To simplify the analysis, the PD current is often modeled as a symmetric pulse. A Gaussian-shaped waveform is commonly used to represent such pulses and can be expressed as
In the equation, U0 denotes the peak voltage, and σ represents the pulse width. When the pulse width is less than 1 ns, the signal effectively covers the frequency range up to 3 GHz, satisfying the requirements for UHF simulations. Therefore, during the simulation, the excitation source is set as a Gaussian pulse waveform.
The external boundary conditions of the model are configured with seven layers of absorbing boundaries, employing a perfectly matched layer type. Electromagnetic waves incident from free space are not reflected, and refraction at the boundaries is effectively zero.
2.4. Simulation Study of Transformer Core Antenna Performance
The reciprocity of antennas is based on the characteristics of linear and passive electromagnetic systems. Maxwell’s equations in linear passive systems exhibit time-reversal symmetry, which implies that, under identical boundary conditions, the distribution of electromagnetic fields remains unchanged regardless of the direction of energy transmission. Therefore, at a given frequency and under fixed conditions, the transmitting and receiving properties of an antenna should be consistent.
Therefore, this study considers placing the antenna feed line at the transformer core grounding conductor, treating the core as a transmitting antenna to simulate its antenna performance. According to the reciprocity theorem, the simulation results correspond to the reliable detection frequency band of the transformer core acting as a UHF antenna for sensing internal partial discharges. As shown in Figure 2, the simulation results indicate that different types of cores can effectively detect partial discharges within the UHF range. The reliable frequency band range of detection for different types of cores is shown in Table 3.
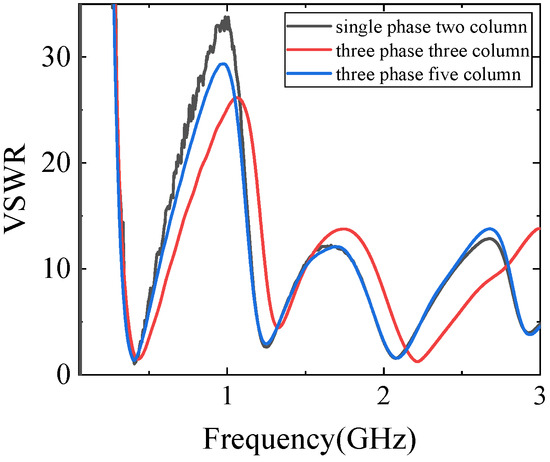
Figure 2.
Iron core antenna performance.

Table 3.
Reliable detection range of iron core.
2.5. Simulation Experiment on Signal Enhancement and Extraction
In order to study the propagation law and distribution of partial discharge signals within a transformer, an overall transformer model was created. The transformer model includes components such as the box body, core, high- and low-voltage windings, and high- and low-voltage bushings. In the actual drawings of the transformer, it has been appropriately simplified, and the supporting parts, flanges and other connecting parts have been omitted. The specific structural parameters are shown in Table 4 and the electromagnetic simulation solution is carried out using the finite-difference time-domain method. For boundary conditions, the surface of the copper busbar is set as the perfect electrical conductor boundary condition, and the outer boundary of the air domain is set as the open boundary condition.

Table 4.
Transformer parameters.
The PD signals induced by the transformer core are converted into electrical signals, and the signal propagation process is shown in Figure 3. Ultra-high-frequency signals will experience considerable transmission loss during propagation, resulting in significant signal attenuation. Outside the transformer, the signal mainly propagates in the form of traveling waves along the grounded copper busbar of the core.
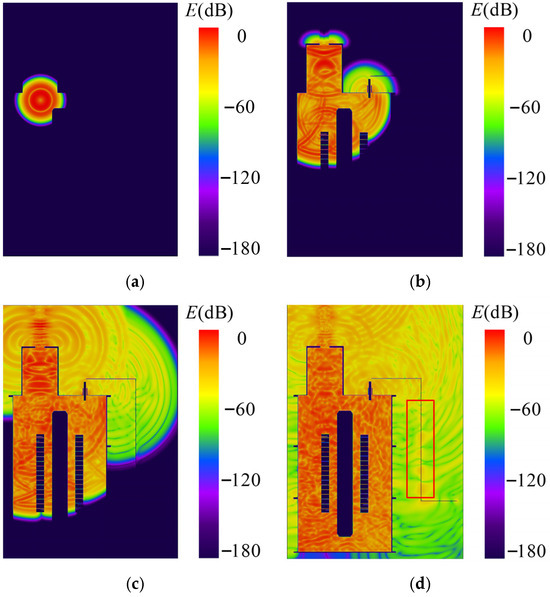
Figure 3.
The process of electromagnetic wave signal propagation: (a) 1.85 ns; (b) 4.31 ns; (c) 7.39 ns; (d) 13.55 ns.
Figure 4 illustrates the electric field intensity distribution across the copper busbar cross-section. When the electromagnetic wave frequency is at the lowest frequency of 0.3 GHz in the ultra-high-frequency band, the penetration depth of the electromagnetic wave is only 3.81 μm. Due to the skin effect, UHF electromagnetic waves cannot penetrate deeply into the metal; thus, the electric field intensity inside the copper busbar is nearly zero. The electric field is primarily concentrated on the surface of the busbar, with the strongest intensities observed at the four corners. The field intensity decays exponentially with increasing distance from the busbar surface. Therefore, the detection signals predominantly propagate along the surface of the grounding copper busbar, experiencing significant transmission loss in space. A signal extraction device is thus installed at the busbar position to capture the signal.
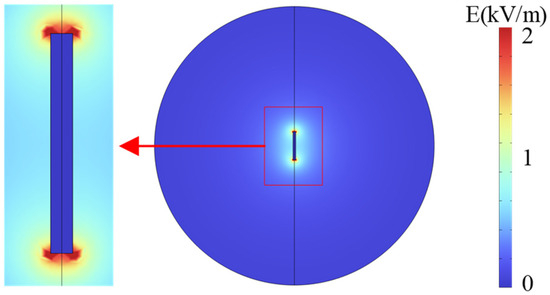
Figure 4.
Electric field distribution diagram of copper busbar cross-section.
Currently, two main methods are employed to improve efficient electromagnetic wave transmission: the first reduces obstacles and distance between the signal source and receiver by adjusting the installation position of the extraction device and modifying the detection environment; the second confines electromagnetic wave propagation within a waveguide structure. Common waveguide structures include parallel-wire lines, coaxial lines, and rectangular waveguides.
The parallel-wire line consists of two parallel conductors, with air or locally excellent insulating supports as the dielectric medium. It is mainly used as feeder lines between transmitters and antennas in medium- and short-wave radio communications, suitable for low to medium frequency ranges, typically from tens of Hz to hundreds of MHz. At higher frequencies, significant radiation losses and interference occur, making it unsuitable for high-frequency transmission. The rectangular waveguide, typically made of copper, aluminum, or other metals, is an important waveguide device for electromagnetic wave transmission, characterized by its simple structure and high mechanical strength. Without internal conductors, the waveguide exhibits low loss and high power capacity; electromagnetic energy is guided within the waveguide’s internal space, effectively preventing electromagnetic leakage. However, this enhancement method would incorporate the copper busbar as part of the rectangular waveguide, altering the grounding busbar structure and potentially affecting grounding current conduction.
The coaxial waveguide is a shielded, non-dispersive structure composed of an inner conductor, outer conductor, and dielectric in between. The common waveguide structure is shown in Figure 5. Typically, the outer conductor is grounded, confining the electromagnetic field between the conductors. As a result, coaxial lines exhibit minimal radiation loss and are nearly immune to external signal interference.

Figure 5.
Common waveguide structures: (a) parallel wire line, (b) coaxial line, (c) rectangular waveguide.
Therefore, this study considers designing the enhancement experiment using a coaxial line configuration. Referring to the coaxial transmission line structure, the grounding copper busbar is regarded as the core conductor of the coaxial line. A metallic cylindrical enclosure is placed at the signal extraction device location, simulating the shield layer of the coaxial line. The specific structure of the signal extraction device is shown in Figure 6. This device is composed of support elements, fastening devices, a radio-frequency connector and metal shielding layer. It is installed outside the iron core grounding copper bar, and the central conductor of the radio-frequency connector is connected to the grounding copper busbar. The diameter and length of the metal shielding layer can be changed. This arrangement increases signal reflection and refraction at the location, theoretically reducing transmission loss, improving transmission efficiency, and enhancing detection performance.
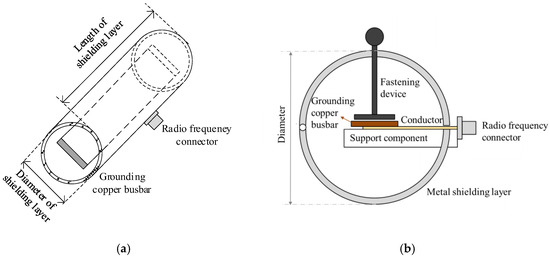
Figure 6.
The structure of signal extraction device: (a) Full view. (b) Side view.
To investigate the influence of the shield layer on signal enhancement, a partial discharge source is set at the high-voltage lead of the transformer’s high-voltage winding. Metallic cylinders with varying diameters are installed at the grounding busbar detection point as shielding layers, studying the effects of shield diameter and length.
The shield length is fixed at 20 cm with a thickness of 5 mm; diameters range from 6 cm to 30 cm, as detailed in the figure. In the simulation studying the impact of shield area on signal enhancement, the diameter varies between 6 and 30 cm, while length remains at 20 cm. To study the effect of shield length on signal enhancement, the diameter is fixed at 16 cm and the length varies from 5 to 40 cm. The original signal without shielding is used as a baseline to calculate the energy enhancement ratio of detection signals under different conditions. The energy enhancement ratio of detection signals under varying shield areas is shown in Figure 7. With increasing shield diameter, signal enhancement rapidly decreases, and when the diameter reaches 20 cm, enhancement nearly disappears. This is because, when the shield area is sufficiently large, the reflection and refraction enhancement effect between the busbar and the shield layer almost vanishes.
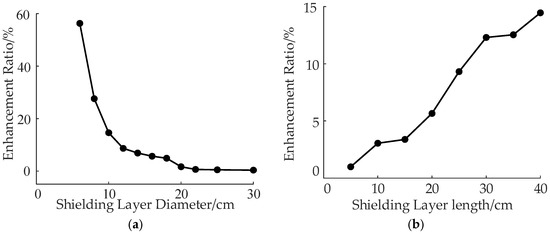
Figure 7.
Detection signal energy of different shielding layers: (a) diameters, (b) length.
With increasing shield length, detection performance gradually improves. This occurs because when the shield length is too short, the reflection and refraction between the grounding busbar and the shield layer are weak. As the shield length increases, signal reflection and refraction between the detection point and the shield become stronger, thereby enhancing signal strength.
3. Experimental Validation of UHF Partial Discharge Detection via Transformer Core Grounding Current
3.1. Experimental Platform
To investigate the effectiveness of transformer core-based PD detection, a PD detection platform was established using a 110 kV single-phase dual-winding transformer. A sharp-tip discharge defect model was embedded near the upper portion of the C-phase winding. The transformer was energized using three-phase inductive voltage application to ensure synchronized operation.
An HFCT and a signal extraction device were installed on the transformer core grounding lead to detect both the grounding current and UHF signals induced in the core. The output sensitivity of this HFCT is 15 V/A, and its operating frequency band range is 3–30 MHZ. A UHF sensor was placed at the bottom of the transformer tank to synchronously detect UHF PD signals for comparison with the core-induced signals. A capacitive voltage divider was installed on the high-voltage side to extract voltage signals for synchronization. All signals were synchronously transmitted to an oscilloscope for data acquisition and storage. The experimental platform is shown in Figure 8a,b.
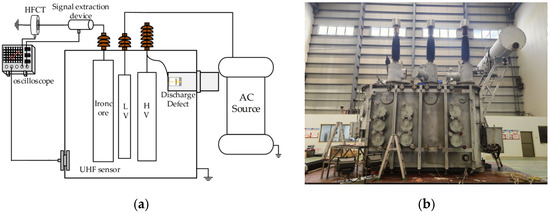
Figure 8.
Experimental platform: (a) Schematic diagram, (b) physical image.
3.2. Enhanced Detection Performance Test
In practical substation conditions, the signal extraction device is generally installed near the lower portion of the grounding lead. Therefore, the signal extraction device was placed 110 cm below the top of the low-voltage bushing. A cylindrical metal shielding layer made of 0.2 mm thick metal was employed, with diameters set at 12 cm, 16 cm, 20 cm, 26 cm, and 31 cm. The shielding layer length was fixed at 20 cm. The distance between the side of the metal bucket and the grounding copper plate is fixed.
This paper calculates the maximum values of 500 sets of ultra-high-frequency signals induced by iron cores and the ultra-high-frequency signals detected by ultra-high-frequency sensors, and there is a good linear relationship between the two. The relationship is shown in Figure 9. Since the signal frequency bands detected by the two detection methods are consistent and there is a good linear relationship, this paper holds that the optimization result of this method can be characterized by this parameter.
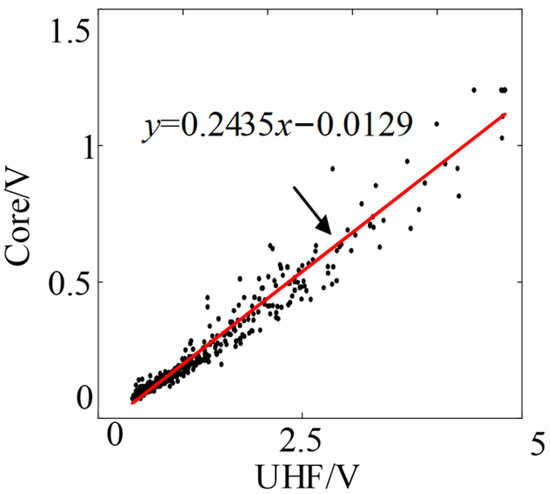
Figure 9.
The relationship between the maximum value of the UHF signal detected by the core induction and the UHF sensor.
The detection performance of different shielding layer diameters obtained from the experiment is shown in Table 5. The maximum values, average values and corresponding fitting functions under different shielding layer diameters were calculated. The Improvement Rate is calculated as the difference between the slope of the fitting curve with a shielding layer and the slope without shielding, divided by the slope without shielding.

Table 5.
Detection performance for different shielding layer areas.
A linear relationship was observed between the signal detected by the UHF sensor and the signal measured by the signal extraction device. To better evaluate the enhancement effect of the metal shielding, the relationship between the UHF sensor signal and the core-induced signal was fitted using a linear model of the form y = kx + b. Taking the UHF sensor output as a reference, the detection performance under different shielding configurations was standardized, with the coefficient k serving as the performance indicator.
The results demonstrate that the shielding layer significantly improves signal detection performance. However, as the shielding area increases, the enhancement effect gradually diminishes, which aligns well with simulation outcomes. Moreover, reflection and refraction between the shielding layer and the tank wall can dominate when the shielding area becomes too large, reducing the signal extraction efficiency.
3.3. Device Performance and Validation
Based on the simulation and experimental results, a signal extraction device was designed as shown in Figure 10. The shielding layer was set to a diameter of 10 cm, compatible with the grounding bar dimensions of most in-service transformers.
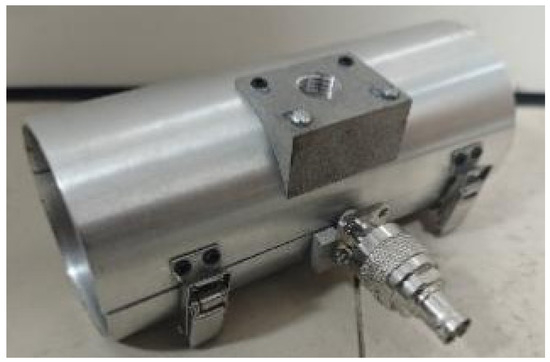
Figure 10.
Signal extraction device.
3.3.1. Anti-Interference Performance Detection
The core has a good perception ability for the ultra-high-frequency electromagnetic waves inside the transformer. The signals are mainly concentrated in the range of 300 MHz to 1000 MHz, as shown in Figure 11. The frequency band of the sensor should correspond to it.
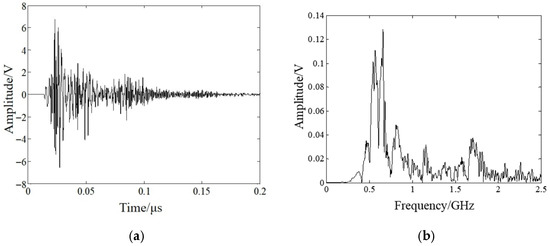
Figure 11.
The waveform diagram of the time–frequency domain of the signal sensed by the core: (a) time-domain waveform diagram; (b) frequency-domain waveform diagram.
The self-sensing sensor was tested using the network signal analyzer R&S-ZVL3. Within the frequency band of 100 MHz to 1.5 GHz, the average parameter of the self-sensing sensor S21 is 37 dB, with a fluctuation of no more than ±3 dB.
To study the anti-interference performance of the core induction method, high-frequency electromagnetic pulses were connected to the common grounding grid, and HFCT, ultra-high-frequency sensors, core induction and other methods were adopted for detection. The final results are shown in Figure 12. From the detection results, it can be seen that the frequency band of the interfering pulse signal is concentrated in the high-frequency band of 0–7 MHz. HFCT, due to its detection frequency band being concentrated in the high-frequency band, is severely interfered with by the pulse signal. The detection frequency band of the core induction method is mainly concentrated in the ultra-high-frequency band, which has a good shielding effect on the high-frequency pulse interference coupled in the grounding network and will not be disturbed by the direct contact of the signal extraction device with the grounding copper bar.
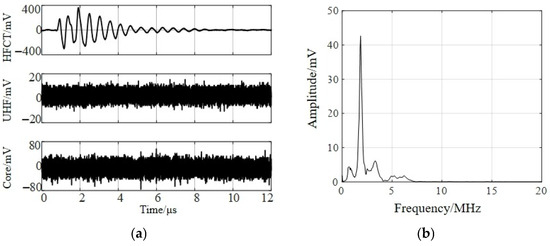
Figure 12.
The detection results of high-frequency pulse interference by different sensors: (a) Detection results of high-frequency pulse interference. (b) Frequency spectrum of high-frequency pulse interference signals.
3.3.2. Discharge Detection
The optimized device was used to detect sharp-tip discharge defects. A series of standard square wave pulses with known charge quantities were successively injected into the transformer detection circuit using the calibration pulse generator (JZF-9, Shanghai Xuji Electric Co., Ltd., Shanghai, China). The output voltage amplitude corresponding to each injected charge quantity was recorded to establish the calibration curve. When the discharge quantity was 100 pC, the amplitude corresponding to the magnetic core induction method was 1.8 mV. The amplitude corresponding to ultra-high frequency is 10.8 mV, and the amplitude corresponding to HFCT is 1.1 mV. Through calibration, it was found that the apparent discharge quantity could be stably discharged within the range of 20–40 nC.
The detection results are shown in Figure 13. The discharge quantity corresponding to partial discharge was the largest at 3.8 ms. The corresponding amplitude for the core induction method was 0.45 V, and the corresponding discharge quantity was 25 nC. The measurement results indicate consistency between the UHF PD detection method based on core-induced signals, conventional UHF detection, and HFCT-based methods.
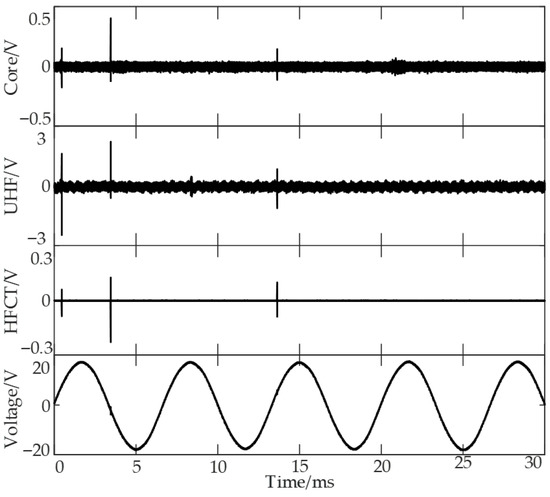
Figure 13.
Experimental result.
4. Conclusions
To address the limitations of pulse current detection in anti-interference capability and the installation constraints of UHF sensors, this paper proposes a UHF PD detection method based on signals induced in the transformer core. The feasibility and effectiveness of the proposed method were verified through both simulation and experimental tests, leading to the following conclusions:
- The transformer core model exhibits a voltage standing wave ratio below 5 within the UHF range, enabling effective PD detection as a UHF sensor in those bands.
- Adding a metal shielding layer outside the grounding bar significantly reduces signal transmission losses, improving the signal-to-noise ratio (SNR) of the detected signals.
- The UHF PD detection method based on transformer core-induced signals shows strong consistency with conventional pulse current and UHF detection techniques. The UHF signal amplitude can be reliably used to characterize discharge intensity.
Author Contributions
Conceptualization, Z.M. and L.C.; methodology, D.Z.; software, A.W.; validation, S.J.; formal analysis, C.L.; investigation, Y.W.; resources, A.W.; data curation, S.J.; writing—original draft preparation, Z.M.; writing—review and editing, C.L.; visualization, Y.W.; supervision, L.C.; project administration, L.C.; funding acquisition, L.C. All authors have read and agreed to the published version of the manuscript.
Funding
This research was funded by Guangdong Power Grid Co., Ltd. Technology Project, grant number GDKJXM20222576.
Data Availability Statement
The original contributions presented in this study are included in the article. Further inquiries can be directed to the corresponding author.
Conflicts of Interest
All Authors were employed by the company Electric Power Research Institute of Guangdong Power Grid Co., Ltd. The remaining authors declare that the research was conducted in the absence of any commercial or financial relationships that could be construed as a potential conflict of interest.
Abbreviations
The following abbreviations are used in this manuscript:
| PD | partial discharge |
| HFCT | high-frequency current transformer |
| UHF | ultra-high-frequency |
| DGA | dissolved gas analysis |
| VSWR | voltage standing wave ratio |
| ERP | effective radiated power |
| FDTD | finite-difference time-domain |
| SNR | signal-to-noise ratio |
References
- Zhao, T.; Feng, X.; Li, C.; Ma, J.; Sun, Y.; Guo, J. Partial discharge monitoring of commutation transformers based on high-frequency and ultra-high-frequency current monitoring of casings. Transformer 2020, 57, 33–37. [Google Scholar]
- Li, J.; Han, X.; Liu, Z.; Li, Y. Review of Partial Discharge Detection Technology in Electrical Equipment. High Volt. Eng. 2015, 41, 2583–2601. [Google Scholar]
- Du, H.; Cui, L.; Ao, M.; Wang, L.; Li, Y.; Lv, C. Design of denoising algorithm for 3D imaging system of transformer winding ultrasonic testing. High Volt. Eng. 2020, 46, 4376–4382. [Google Scholar]
- Ma, P.; Wang, Z.; Liu, Y.; Shen, P.; Wang, H.; Fu, X.; Yang, W. Partial discharge ultra-high frequency localization method for transformers based on IFA and TDOA. Comput. Appl. Softw. 2023, 40, 111–116. [Google Scholar]
- Su, Z.; Yu, R.; Zhang, Z. Partial discharge localization of transformers based on multiple polynomial results and double grid search. High Volt. Eng. 2024, 50, 1538–1547. [Google Scholar]
- Zhang, G.; Lu, C.; Zhou, H.; Tian, H.; Yu, X.; Zhang, X. Partial discharge ultrasonic and ultra-high frequency integrated sensing technology for power equipment. High Volt. Eng. 2022, 48, 5090–5101. [Google Scholar]
- Jia, Y.; Yang, J.; Gao, S.; Tao, F.; Liu, J.; Zhang, G. Design of PCB dipole antenna for partial discharge detection inside switchgear. High Volt. Appar. 2016, 52, 132–138. [Google Scholar]
- Yang, X.; Li, L.; Cheng, F.; Zhao, G.; Lei, B. Partial Discharge Pattern Recognition Based on FrFT Combined RVM. Guangdong Electr. Power 2024, 37, 95–103. [Google Scholar]
- Tenbohlen, S.; Jagers, J.; Vahidi, F. Standardized survey of transformer reliability: On behalf of CIGRE WG A2.37. In Proceedings of the 2017 International Symposium on Electrical Insulating Materials (ISEIM), Toyohashi, Japan, 11–15 September 2017; pp. 593–596. [Google Scholar]
- Yang, F.; Li, Y.; Lu, W.; Shi, H.; Li, Y.; Du, Z. Ultra high frequency signal monitoring method for partial discharge process of high voltage electrical equipment. Power Syst. Clean Energy 2022, 38, 55–60. [Google Scholar]
- Zhang, L.; Yang, J.; Jiang, C. Partial discharge location of power transformer based on UHF sensor and TDOA database. Transformer 2021, 58, 67–72. [Google Scholar]
- Xiao, Z.; Dong, M.; Deng, Y.; Ren, M.; Bi, J.; Yan, C. Simulation study on the selection of installation position for built-in ultra-high frequency sensors in transformers. Insul. Mater. 2014, 47, 76–81, 86. [Google Scholar]
- Chen, Y.; Ren, M.; Wang, K.; Guan, H.; Xia, C.; Wang, G. Simulation optimization of optical waveguide structure parameters for partial discharge detection. High Volt. Eng. 2023, 49, 5061–5072. [Google Scholar]
- Shen, Q.; Ni, Q.; Zhang, A.; Wang, K.; He, Z.; Sun, L. Case study of online monitoring of transformer oil chromatography in defect detection. Transformer 2024, 61, 72–75. [Google Scholar]
- Zhang, B.; Ma, Y.; Guan, R.; Bai, S.; Li, J.; Hu, W. Performance Optimization of ANN Method for Oil-filled Electrical Equipment Fault Diagnosis Based on DGA. Guangdong Electr. Power 2021, 34, 39–47. [Google Scholar]
- Guo, W.; Wang, Z.; Zhao, X.; Chen, G.; Xu, X.; Liu, Q.; Xie, X.; Chen, X. Review of Partial Discharge Detection Technology and Pattern Recognition of Oil-immersed Distribution Transformer. Guangdong Electr. Power 2023, 36, 67–78. [Google Scholar]
- Shen, Y.; Ruan, L.; Xie, Q.; Gao, S. On-site application of partial discharge detection of transformer using very wide bandwidth pulse current method. High Volt. Eng. 2011, 37, 937–943. [Google Scholar]
- Xu, C.; Xiao, R. Diagnosis and analysis of an internal discharge fault in large transformer. High Volt. Appar. 2010, 46, 67–69. [Google Scholar]
- Fu, J.; Yao, J. Fabrication and test of flexible microstrip antenna based on flexible PDMS. Transducer Microsyst. Technol. 2021, 40, 88–90. [Google Scholar]
- Li, Z.; Zang, Y.; Wang, C.; Tang, Y.; Ren, T.; Jiang, X. Analysis and diagnosis of optical and UHF partial discharges in GIS based on guided filtering fusion. IEEE Trans. Dielectr. Electr. Insul. 2025, 32, 2978–2985. [Google Scholar] [CrossRef]
- Cai, J.; Yuan, W.; Zhang, X.; Yang, Y.; Wu, J.; Li, J. Transformer partial discharge detection method based on UHF self-perception. High Volt. Eng. 2021, 47, 2041–2050. [Google Scholar]
Disclaimer/Publisher’s Note: The statements, opinions and data contained in all publications are solely those of the individual author(s) and contributor(s) and not of MDPI and/or the editor(s). MDPI and/or the editor(s) disclaim responsibility for any injury to people or property resulting from any ideas, methods, instructions or products referred to in the content. |
© 2025 by the authors. Licensee MDPI, Basel, Switzerland. This article is an open access article distributed under the terms and conditions of the Creative Commons Attribution (CC BY) license (https://creativecommons.org/licenses/by/4.0/).