Article

Simulation Study on Heat Transfer and Flow Performance of Pump-Driven Microchannel-Separated Heat Pipe System

1
Power China Huadong Engineering Corporation Limited, Hangzhou 310000, China
2
China North Vehicle Research Institute, Beijing 100072, China
3
College of Emergency Management, Nanjing Tech University, Nanjing 210009, China
*
Authors to whom correspondence should be addressed.
Energies 2025, 18(22), 5882; https://doi.org/10.3390/en18225882 (registering DOI)
Submission received: 11 September 2025 / Revised: 14 October 2025 / Accepted: 3 November 2025 / Published: 8 November 2025

Abstract

The separable heat pipe, with its highly efficient heat transfer and flexible layout features, has become an innovative solution to the heat dissipation problem of batteries, especially suitable for the directional heat dissipation requirements of high-energy-density battery packs. However, most of the number–value models currently studied examine the flow of refrigerant working medium within the pump as an isentropic or isothermal process and are unable to effectively analyze the heat transfer characteristics of different internal regions. Based on the laws of energy conservation, momentum conservation, and mass conservation, this study establishes a steady-state mathematical model of the pump-driven microchannel-separated heat pipe. The influence of factors—such as the phase state change in the working medium inside the heat exchanger, the heat transfer flow mechanism, the liquid filling rate, the temperature difference, as well as the structural parameters of the microchannel heat exchanger on the steady-state heat transfer and flow performance of the pump-driven microchannel-separated heat pipe—were analyzed. It was found that the influence of liquid filling ratio on heat transfer quantity is reflected in the ratio of change in the sensible heat transfer and latent heat transfer. The sensible heat transfer ratio is higher when the liquid filling is too low or too high, and the two-phase heat transfer is higher when the liquid filling ratio is in the optimal range; the maximum heat transfer quantity can reach 3.79 KW. The decrease in heat transfer coefficient with tube length in the single-phase region is due to temperature and inlet effect, and the decrease in heat transfer coefficient in the two-phase region is due to the change in flow pattern and heat transfer mechanism. This technology has the advantages of long-distance heat transfer, which can adapt to the distributed heat dissipation needs of large-energy-storage power plants and help reduce the overall lifecycle cost.

1. Introduction

In today’s world, energy storage and utilization have become one of the key factors to promote social progress. As an efficient and portable energy storage device, lithium-ion batteries are widely used in many fields, such as energy storage and transportation. However, the safety issues faced by lithium-ion batteries in practical applications, especially thermal runaway, pose significant challenges to their performance, longevity, and safety [1,2,3,4,5,6,7,8]. Thermal abuse refers to the phenomenon caused by external heating, accidental exposure to high temperatures, or malfunctioning cooling systems, which then triggers thermal runaway of the battery. Battery thermal runaway can be prevented by developing an effective battery thermal management system [9,10].
As an effective means of thermal management of lithium batteries, air cooling technology has the advantages of low cost, light weight, and environmental friendliness, and has been widely used in electric vehicles, energy storage systems, and other fields [11,12,13,14,15]. However, the shortcomings of air cooling technology, such as limited heat dissipation, inability to meet high heat dissipation requirements, and poor temperature uniformity, make it unable to cope with the increasing requirements of battery energy density and safety [16,17,18,19,20,21]. In addition, liquid cooling has the advantages of good temperature uniformity, wide application range, and high convective heat transfer, and has broad application prospects in electric vehicles, energy storage systems, and other fields [22,23,24,25,26]. However, battery management systems (BTMS) with liquid-cooling technology has a complex structure, high cost, and a risk of leakage. Therefore, the study of liquid cooling technology needs to focus on system complexity, tightness requirements, and coolant management [27,28,29,30]. As a new type of thermal management technology, phase change cooling has the main advantages of energy saving and low maintenance cost. However, there are still some challenges, such as the risk of leakage and large volume change [31,32,33].
In recent years, heat pipes and separate heat pipes have shown significant technical advantages in thermal management of lithium batteries. Heat pipes achieve efficient heat transfer through the phase change cycle of a working medium. Their lightweight and high thermal conductivity are especially suitable for battery systems with limited space. They can quickly conduct heat from the surface of cells to the heat dissipation end, effectively alleviating local overheating problems. Separated heat pipe further breaks through the layout limitation of a traditional heat pipe [34,35,36]. Through the physical separation in the design of the evaporator and condenser, heat can be transmitted from long distances. For example, in a power battery pack, the evaporator can be attached to the surface of a shaped cell to absorb heat, while the condenser is integrated into the edge of battery pack or external radiator, forming a flexible heat diversion path [37]. Both are often used in conjunction with a liquid cooling system.
However, the numerical simulation of a pump-driven separated heat pipe, especially the model of pump, is imprecise, considering the flow of refrigerant in the pump is an isentropic or isothermal process, which makes it difficult effectively analyze the heat transfer characteristics in different regions. In light of the research outlined above, the heat transfer mechanism and flow and heat transfer characteristics of pump-driven separated heat pipe are examined in this present study, from which a coupling system of pump-driven separated heat pipe and mechanical refrigeration is designed.

2. Steady State Mathematical Model of Pump-Driven Microchannel-Separated Heat Pipe

As shown in Figure 1, when the heat pipe system reaches steady state, the heat exchange quantity of the heat exchanger and the calorific value of the heat source reach equilibrium, and the temperature and pressure of the working medium are distributed throughout the system and the temperature of the air in the evaporator and condenser are equal.

2.1. Evaporator Model

Evaporators are usually calculated by the average temperature difference method (LMDT) or the efficiency-heat transfer unit number method (Ԑ-NTU), both of which need trial calculation. Because the outlet temperatures of the air and refrigerant are unknown, the assumed outlet temperature value of the average temperature difference method affects the total heat transfer coefficient and the average heat transfer temperature difference simultaneously; whereas, the assumed outlet temperature value of the efficiency-heat transfer unit method affects the surface heat transfer coefficient only by affecting the physical properties, then finally affects the total heat transfer coefficient K. The calculation convergence of the efficiency-heat transfer unit is faster, but the calculation amount of the average temperature difference method in a trial calculation is negligible with modern computing. Under the condition of equivalent calculation amount, the average temperature difference method can calculate the correction coefficient of temperature difference in the heat exchanger. ψ represents the coefficient of complex flow approaching countercurrent degree, which is the ratio of temperature difference in complex flow to logarithmic average temperature difference in heat transfer in pure countercurrent. It has certain reference significance for verifying heat transfer capacity of the heat exchanger. Therefore, the average temperature difference method is chosen to calculate the thermodynamic performance of the heat transfer unit.
For a given heat transfer unit i, assuming the outlet temperature Tr,out of the refrigerant medium, the heat transfer amount and the air outlet temperature of the microelement are calculated as follows:
Q i = m r c p , r ( T r , out T r , in )
T a , o u t = T a , i n Q i m a c p , a
where Qi is the heat transfer, kW; Ta,in, Ta,out are the inlet and outlet air temperature of the control body, °C; Tr,in, Tr,out are the inlet and outlet temperature of the refrigerant of the control body, °C; ma, mr are the mass flow of air and refrigerant, kg/s; and cp,a and cp,r are the specific heat capacity of air and refrigerant, J/(kg·K).
According to the flow mode of the heat exchanger and the inlet and outlet temperatures of the cold and hot fluids, the temperature difference correction coefficient ψ is calculated, and the average heat transfer temperature difference Δt is further obtained. The equation is:
Δ t = ψ Δ t l c
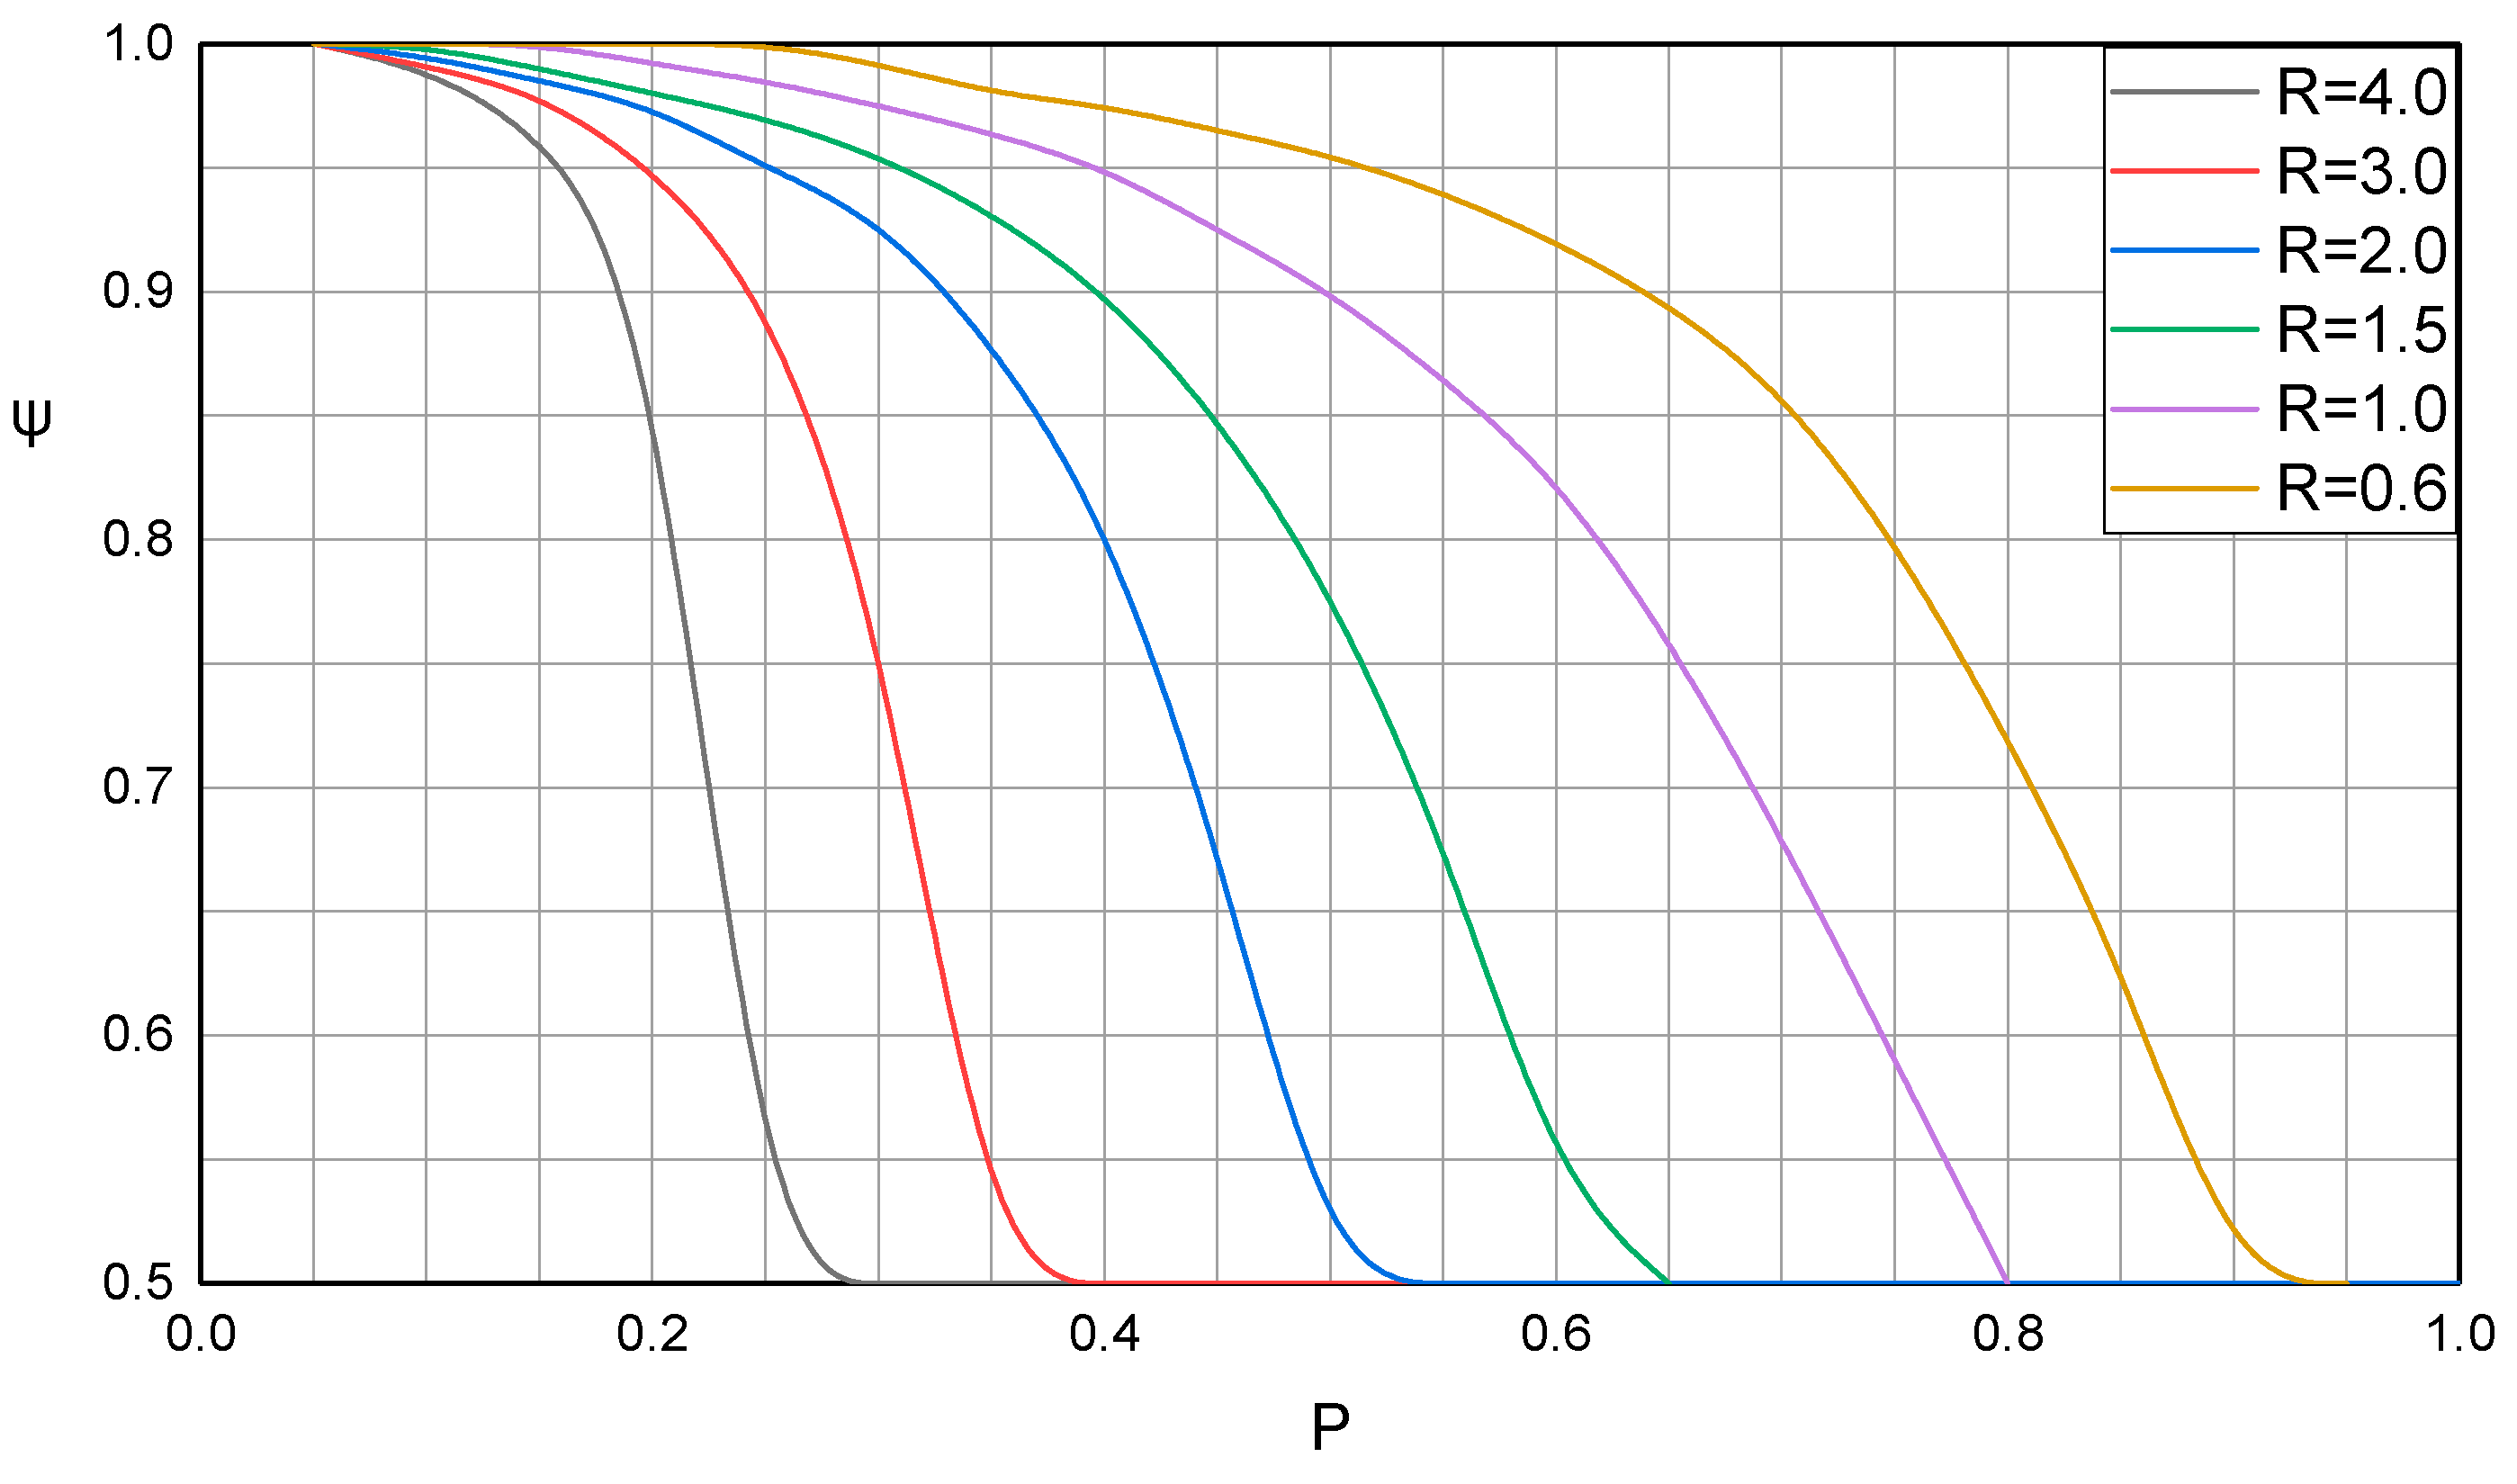
where Δt is the actual average heat transfer temperature difference, °C; and Δtlc is the average counter-current heat transfer temperature difference, °C. The value of ψ is obtained by looking up the two auxiliary parameters P and R in the table. The value table of primary cross flow ψ is shown in Figure 2.
The equations of auxiliary parameters P and R are as follows:
P = T a , o u t T a , i n T r , i n T a , i n
R = T r , i n T r , o u t T a , o u t T a , i n
The thermal resistance of the refrigerant absorbing heat from air in the evaporation section includes convective heat transfer thermal resistance on the refrigerant side, thermal conduction thermal resistance of the flat tube wall, and convective heat transfer thermal resistance on the air side. Therefore, the equation of total heat transfer coefficient relative to total heat transfer area on the air side is as follows:
K = 1 1 h r A o A w + δ w λ w A o A w + 1 h a
where A0, Aw are the total heat exchange area on the air side and refrigerant side, respectively, m2; hr, ha are the heat transfer coefficients on the refrigerant side and air side, respectively, W/(m2·K); δw is the tube wall thickness, m; λw is the tube wall thermal conductivity; and K is the total heat transfer coefficient, W/(m2·K).
Heat transfer is calculated from the total heat transfer coefficient as follows
Q i = K A o Δ t
When the difference between Qi and Qi is less than 2%, the calculation is finished. In the pump-driven microchannel-separated heat pipe, according to the law of mass conservation, the sum of the masses of each part is the total amount of working medium in the heat pipe system, i.e., the system filling volume. The equation is as follows:
d M = M e v a p + M l i q u i d + M c o n d + M g a s + M p u m p + M tan k = M F R
where MFR is the system fill volume, kg.
For refrigerant working medium in the single-phase region, its mass is
m i = ρ i A l
where mi is the mass of refrigerant in the control unit or system component, kg; A is the flow area of refrigerant working medium, m2; and l is the flow length of refrigerant working medium, m. For refrigerant working medium located in the single-phase region, its mass is
m i = ρ t p A l
ρ t p = ( x ρ g + 1 x ρ l ) 1
where x is the refrigerant dryness; ρtp is the two-phase fluid density, kg/m3; ρg is the density when the refrigerant is saturated gas at this temperature, kg/m3; and ρl is the density when the refrigerant is saturated liquid at this temperature, kg/m3.

2.2. Condenser Model

The heat transfer and pressure drop models of the pump-driven microchannel-heat-pipe condenser and evaporator are the same except for the size, but the shear force generated at the gas–liquid interface in the two-phase refrigerant region of the condensing section has a great influence on the heat transfer and flow of the refrigerant due to the small size of the channel in the flat tube, and neglecting it would have a great influence on the simulation results. In this paper, the modified equation proposed by Bivens [38] is applied, which is widely used and does not distinguish flow patterns. Its equation is as follows:
h d = 0.023 Re l 0.8 Pr l 0.4 λ l / D h
h c = h d 1 x 0.8 + 3.8 x 0.76 1 x 0.04 Pr 0.38 K mod
K mod = 0.78738 + 6187.89 ( 4 G / n π D h 2 ) 2
where Kmod is the correction factor, λl is the thermal conductivity, and (W/m·K), x is the refrigerant dryness.

2.3. Pump Model

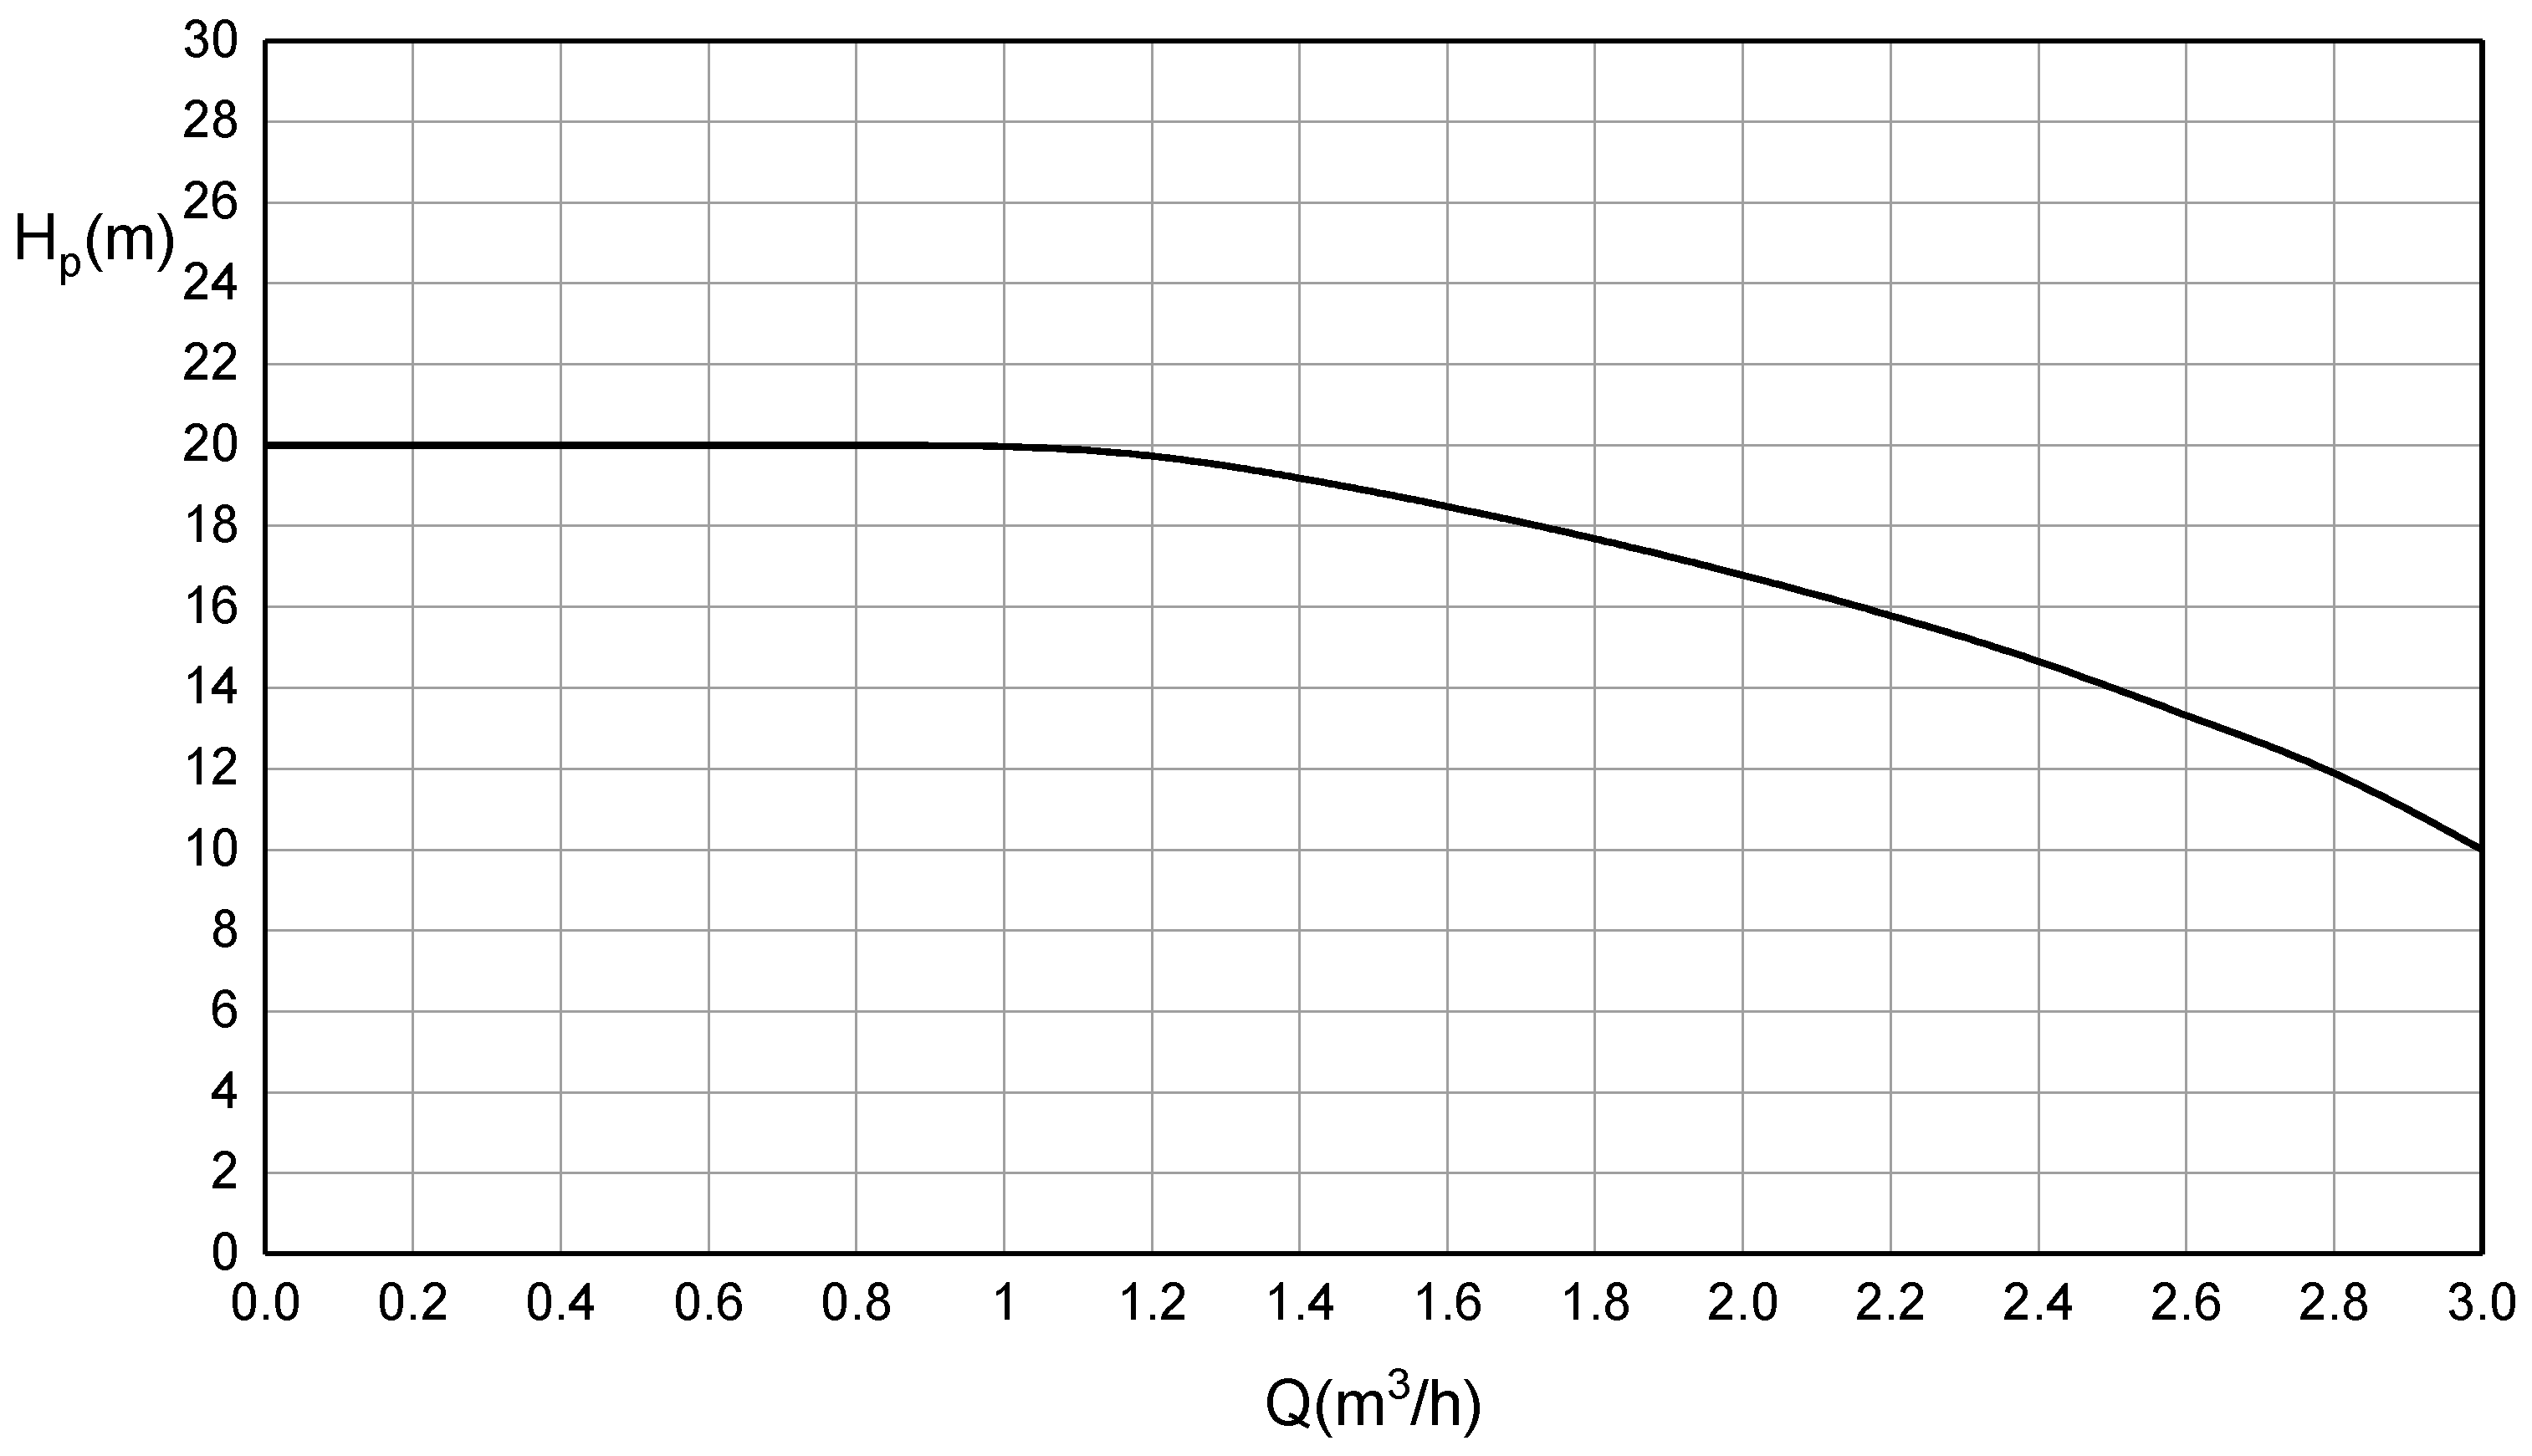
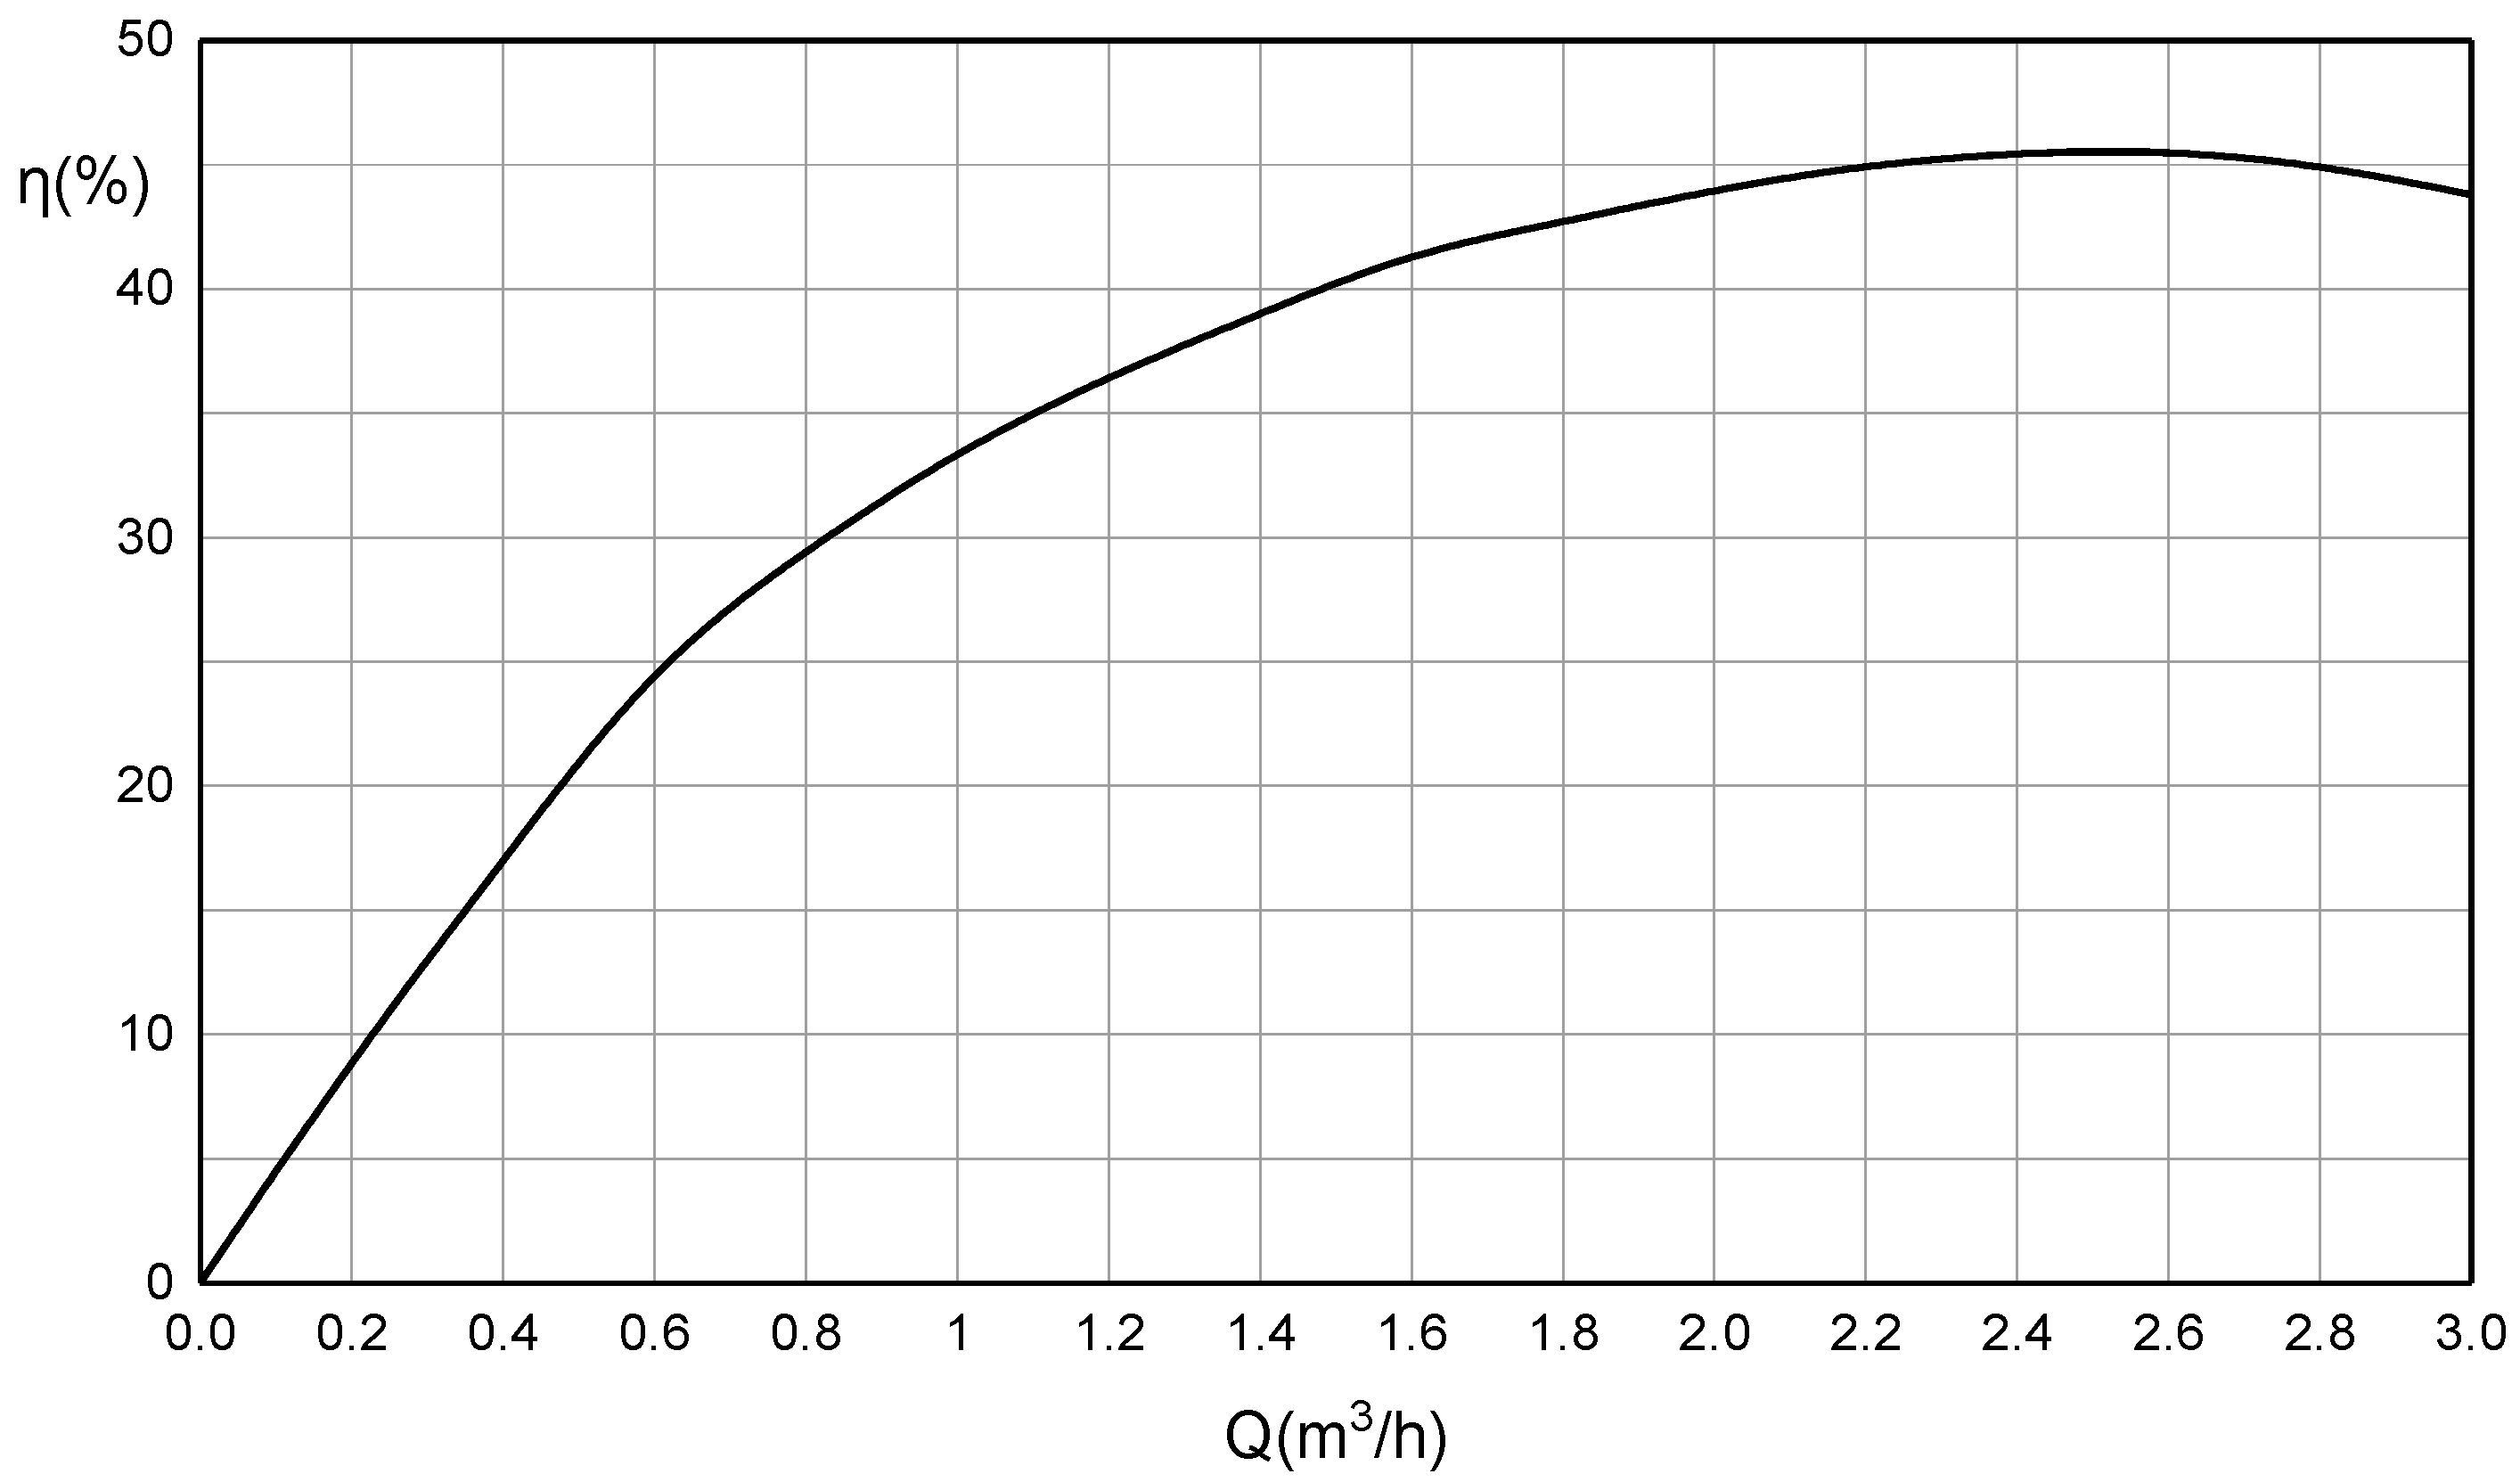
A centrifugal pump is mainly used for the transmission of working fluid. The corresponding relationship between flow rate, lift, and efficiency of a centrifugal pump can be obtained through the performance curve of the centrifugal pump. Figure 3 and Figure 4 illustrate the performance curve of the centrifugal pump. Ignoring the pressure pulsation during the operation of the centrifugal pump, the increment of mechanical energy of fluid in the pump is pump lift. The equation is as follows:
H P = H o u t H i n = P o u t P i n ρ g + V o u t 2 V i n 2 2 g + z o u t z i n
where HP is the lift, m. Assuming that the centrifugal pump maintains stable operation and the inlet and outlet working medium height difference and speed difference are zero, then the above equation is simplified as:
Δ P = P o u t P i n = ρ g H p
The pressure drop of refrigerant working fluid in the evaporation section is divided into the following five parts: (1) The sudden expansion pressure drop of refrigerant working fluid from the downcomer to the inlet manifold of the evaporator; (2) The sudden pressure drop from the inlet manifold to the evaporator flat tube; (3) The pressure drop of the flow inside the evaporator flat tube; (4) The sudden expansion pressure drop from the evaporator flat tube to the outlet manifold; (5) The sudden pressure drop from the manifold into the tracheal branch. Without considering the heat dissipation of the centrifugal pump surface, the working medium in the centrifugal pump undergoes adiabatic isentropic compression without any working medium friction and bearing friction, which is called the 1–2 process. However, the actual process, 1–3, is an irreversible process. This irreversible process is decomposed into the combination of adiabatic isentropic compression 1–2 and isobaric heating process 2–3.
By definition, the expression for an ideal pump work is:
W = m ( h 2 h 1 ) + 1 2 m ( V 2 2 V 1 2 ) + m g ( z 2 z 1 )
Similarly, assuming that the height difference and velocity difference between the inlet and outlet working medium, under stable operation of the centrifugal pump, are zero, the equation is simplified as
W = m ( h 2 h 1 )
where h2 is the enthalpy of the end point of ideal process 1–2, kJ/kg. The difference between h3 and the enthalpy of the end point of actual process 1–3 can be expressed by the thermodynamic equation:
d s = d q T = d h T
d h = T d s
h 3 h 2 = 2 3 T d s = T 2 ( s 3 s 2 )
Then the ideal function can be expressed as
W = m ( h 3 h 1 ) + T ( s 3 s 2 )
The actual work can be expressed as
W a c t = m ( h 3 h 1 ) + N q
where Nq is the stray power loss, W, and its ratio to the effective power Nq/N is about 0.01–0.02, then the centrifugal pump efficiency can be expressed as:
η = W W act = m ( h 3 h 1 ) T ( s 3 s 2 ) m ( h 3 h 1 ) + N q = h 3 h 1 T ( s 3 s 2 ) ( h 3 h 1 ) ( 1 + N q / N e )
According to the corresponding relationship on the performance curve, the lift Hp and the efficiency η are determined from the flow rate, and the performance curves shown in Figure 3 and Figure 4 are substituted to obtain ΔP and Δh.

2.4. Model of Liquid Storage Tank

Neglecting the heat exchange between the liquid storage tank and the external environment, the working medium flows adiabatically in the liquid storage tank, and the enthalpy value is unchanged, that is:
h i n = h o u t
The pressure drop of the liquid storage tank is calculated by considering the local loss ΔPf at the inlet and outlet and the loss ΔPξ along the way, and the equation is as follows:
Δ P f = f l d ρ r v r 2 2 g
Δ P ζ = ξ ρ r v r 2 2 g
where f is the resistance coefficient along the way; ξ is the local resistance coefficient, which is selected according to the sudden contraction and expansion situation; d is the diameter of the inlet and outlet pipeline, m; and l is the length of the inlet and outlet pipeline, m.

2.5. Calculation Procedure

MatlabR2021b is applied to code and solve the model of the pump-driven microchannel-separated heat pipe system, and the three-layer iterative convergence of enthalpy, pressure, and total mass is carried out for the whole cycle around the conservation of energy, momentum, and mass. The physical parameters of the refrigerant and wet air are obtained by Matlab. The calculation process is as follows:
(1)
Input liquid filling amount MFR, structural parameters of heat pipe system, ambient temperature, air volume at evaporator and condenser, and inlet air temperature;
(2)
Assumptions are made for evaporator inlet pressure p0, inlet enthalpy h0, and mass flow G0 to start calculation;
(3)
The refrigerant working medium parameters are brought into evaporator, riser, condenser, down pipe I, liquid storage tank, down pipe II, centrifugal pump, and down pipe III in turn for calculation to complete a cycle;
(4)
Analyze the difference between the outlet pressures p1 and p0 of the down pipe III; if the difference is within the allowable range, proceed to the next step; otherwise, adjust the mass flow rate G0 step by step, wherein the value is the previous assumed mass flow rate value plus 0.01 kg/s, returning to step (2);
(5)
Analyze the difference between h1 and h0 at the outlet of the down pipe III, if the difference is within the allowable range, proceed to the next step, otherwise adjust the inlet pressure h0 of the evaporator step by step, the value of which is the value of the previous assumed outlet enthalpy plus 0.1 kJ/kg, returning to step (2);
(6)
Analyze the difference between the total mass ∑Mi of each component of the system and the filling amount MFR, if the difference is within the allowable range, the calculation is complete, producing the parameters of each component and the parameters characterizing the heat transfer and flow of the evaporator and the condenser; otherwise adjust the inlet pressure p0 of the evaporator step by step, and the value of the inlet pressure p0 is the value of the previous assumed outlet enthalpy value plus 0.01 MPa, returning to step (2). Iterative cycles are also needed for the evaporator and condenser to discriminate the heat transfer quantity Q. Initial parameters for calculation procedure is show in Table 1.

3. Results and Discussion

3.1. Verification of Grid Independence

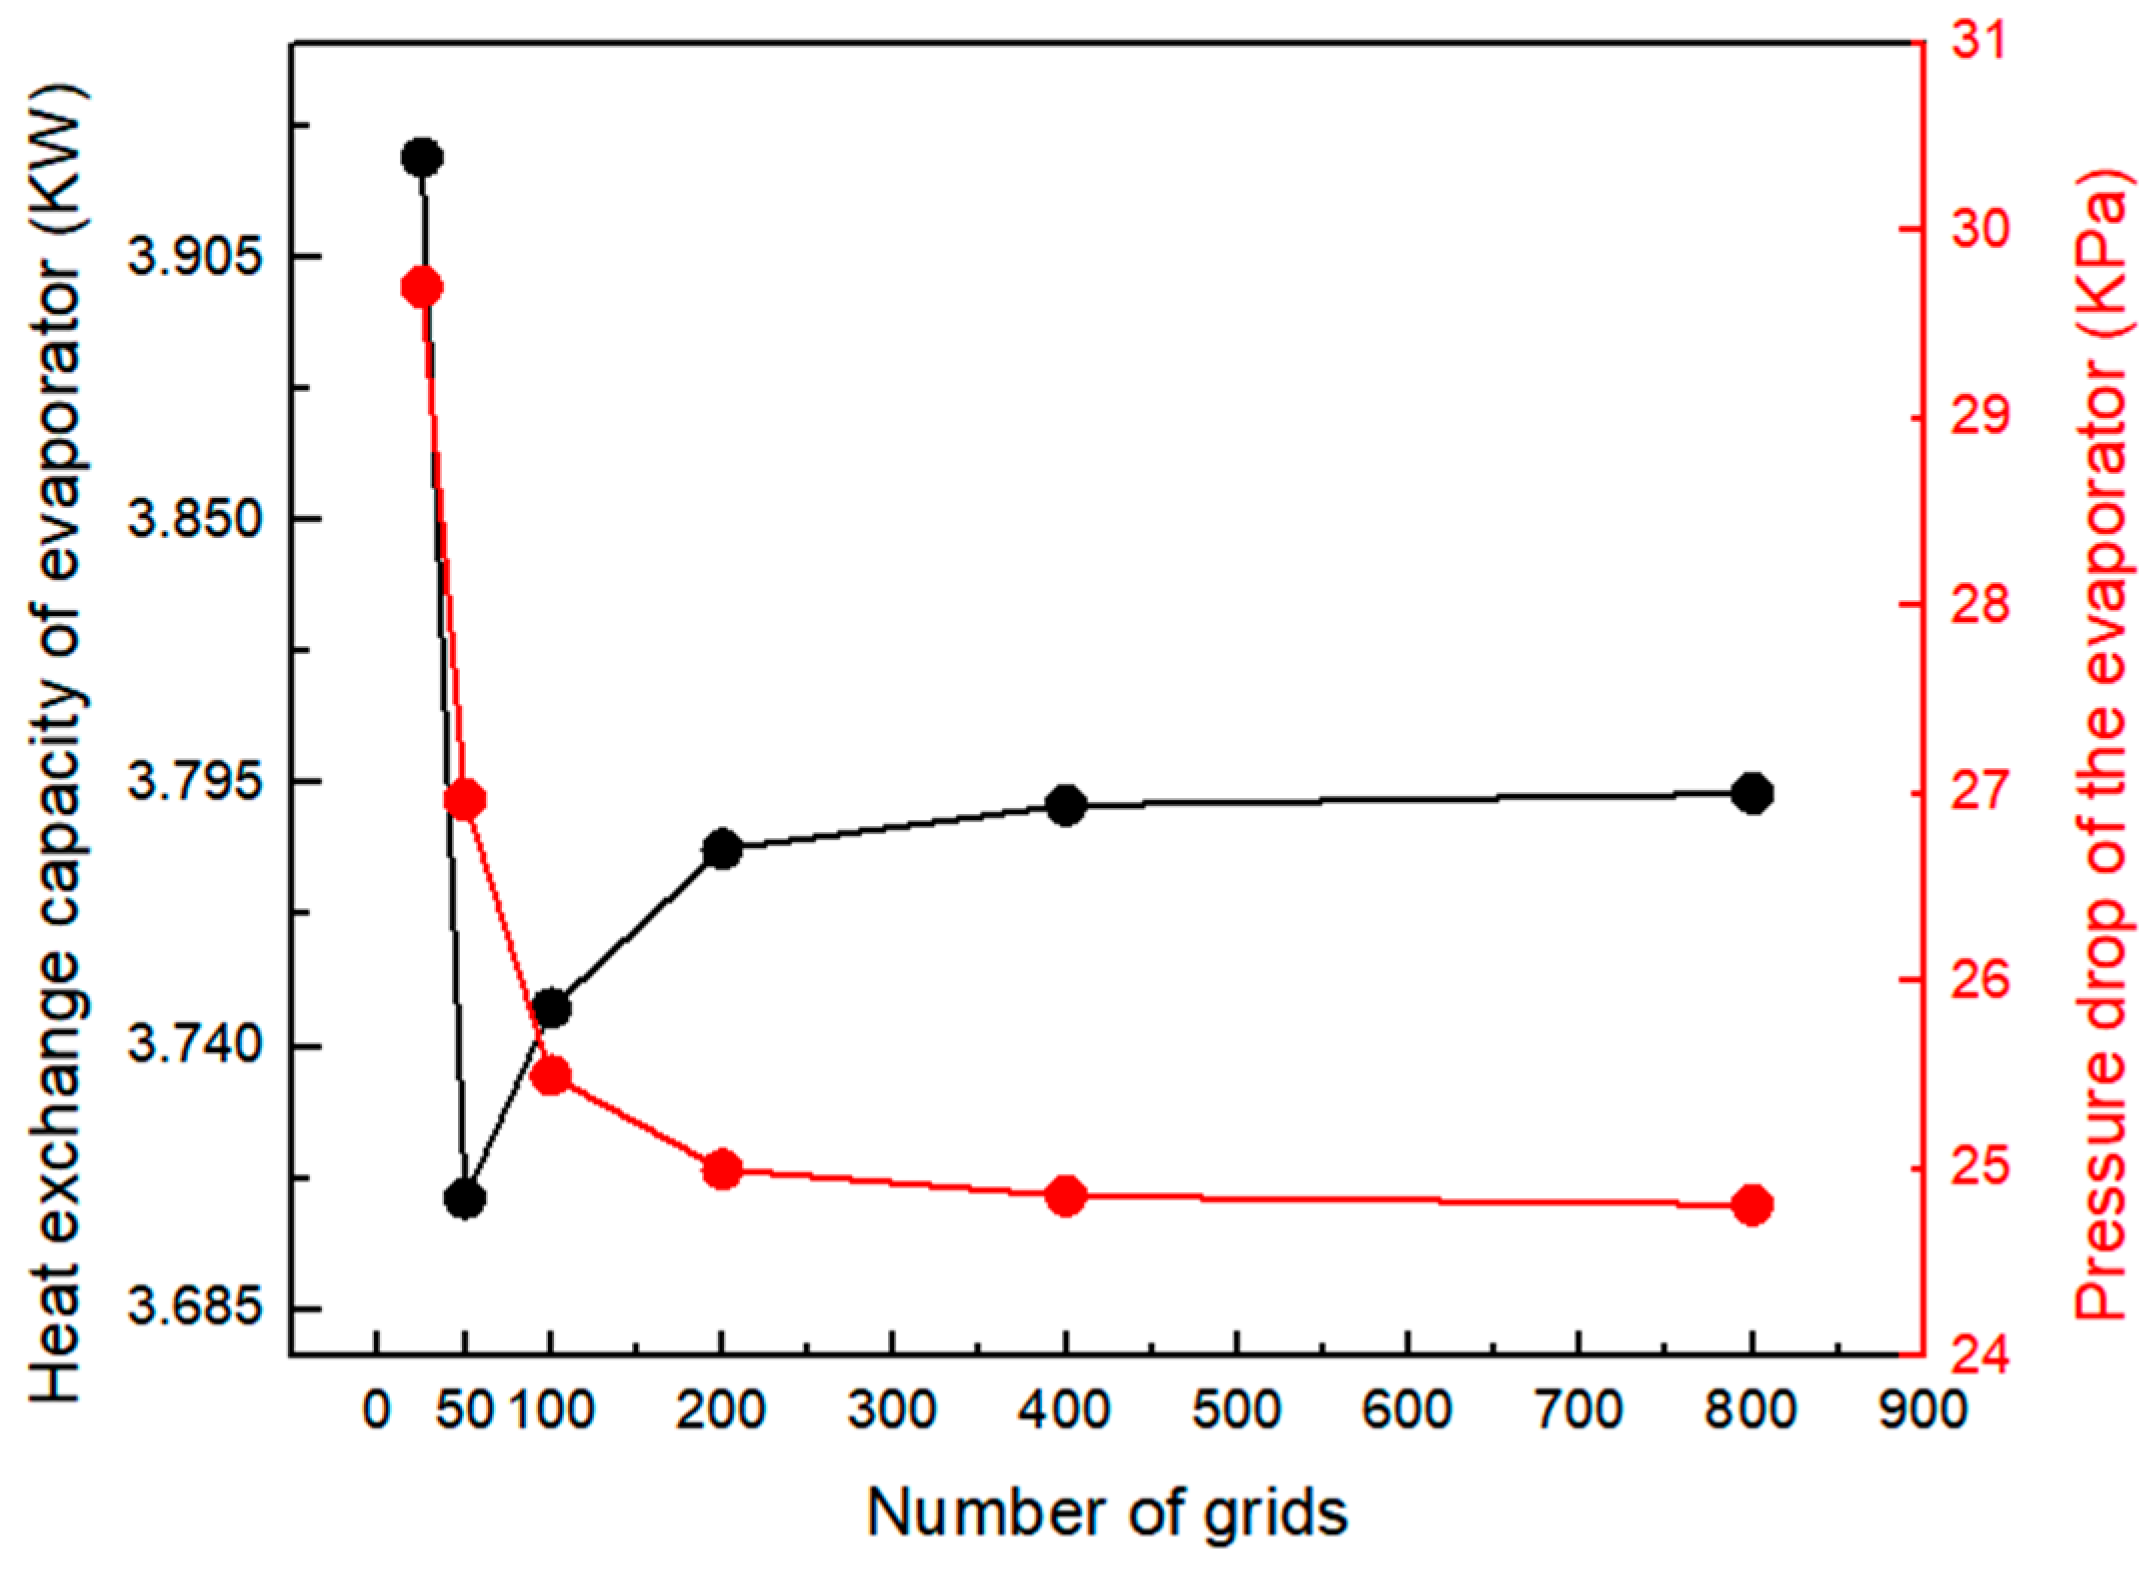
The model using the distributed parameter method divides the modeling length into several meshes of equal length. The refrigerant and air conditions in each segment are considered constant, and the heat transfer coefficient, pressure drop, and working medium mass are calculated by the same correlation equation as in the corresponding segment. However, too few microelements will lead to a large deviation between the outlet refrigerant parameters of the microelement section and the actual values, and the change in heat transfer coefficient will reach ten-fold, which reduces the efficiency and economy of the simulation. Therefore, before analyzing the steady flow and heat transfer of heat pipe system, it is necessary to analyze the relevance of the number of microelements divided along the flow direction of working medium in the evaporator and condenser models, and select the appropriate number of microelements n for numerical calculation, as shown in Figure 5.
Six micro-units of 25, 50, 100, 200, 400, and 800 are proportionally selected for numerical calculation. The calculated values of the evaporator heat exchange rate and refrigerant-side pressure drop are shown in Figure 5. It can be seen that with the increase of the micro-unit number, after the number of micro-unit meshes reaches 200, the fluctuations in the heat exchange rate and refrigerant-side pressure drop tend to flatten out and no longer change significantly. Therefore, considering the calculation amount and model accuracy, the model with 200 single tube elements is selected for subsequent numerical calculation, that is, the length of the element segment in the evaporation section is 373/200 = 1.865 mm, and the length of the element segment in the condensation section is 500/200 = 2.5 mm.

3.2. Comparison of Simulation and Experimental Results

In order to verify the accuracy of the models established in this present study for simulating the flow and heat transfer in heat pipe systems, especially in evaporators and condensers, the simulation results are compared with the experimental results in Section 3, and the relative errors of heat transfer at evaporator and refrigerant pressure at the outlet are analyzed. The relative error is calculated as follows:
σ = X c a l X exp X exp × 100 %
where σ is the relative error, Xcal is the parameter value obtained by simulation calculation, and Xexp is the experimental parameter value.
The filling rate of the separated heat pipe has a great influence on the steady-state heat transfer performance. The filling rate of the separated heat pipe is defined as the ratio of the volume of the filled working medium to the volume of the evaporator at 20 °C. The equation is:
M F R = M ρ l V e
where MFR is the filling rate; M is the filling amount of working medium, kg; ρl is the density of working medium R134a at 20 °C, kg/m3; Ve is the volume of evaporator, m3.
Heat transfer quantity by enthalpy difference on the air side of the separated heat pipe system can be calculated with the following equation:
Q = G a ( h i n h o u t ) v ( 1 + W )
where Q is the heat exchange amount, kW; Ga is the air volume flow, m3/s; v is the air specific volume, m3/kg; and W is the air moisture content, kg/kg.
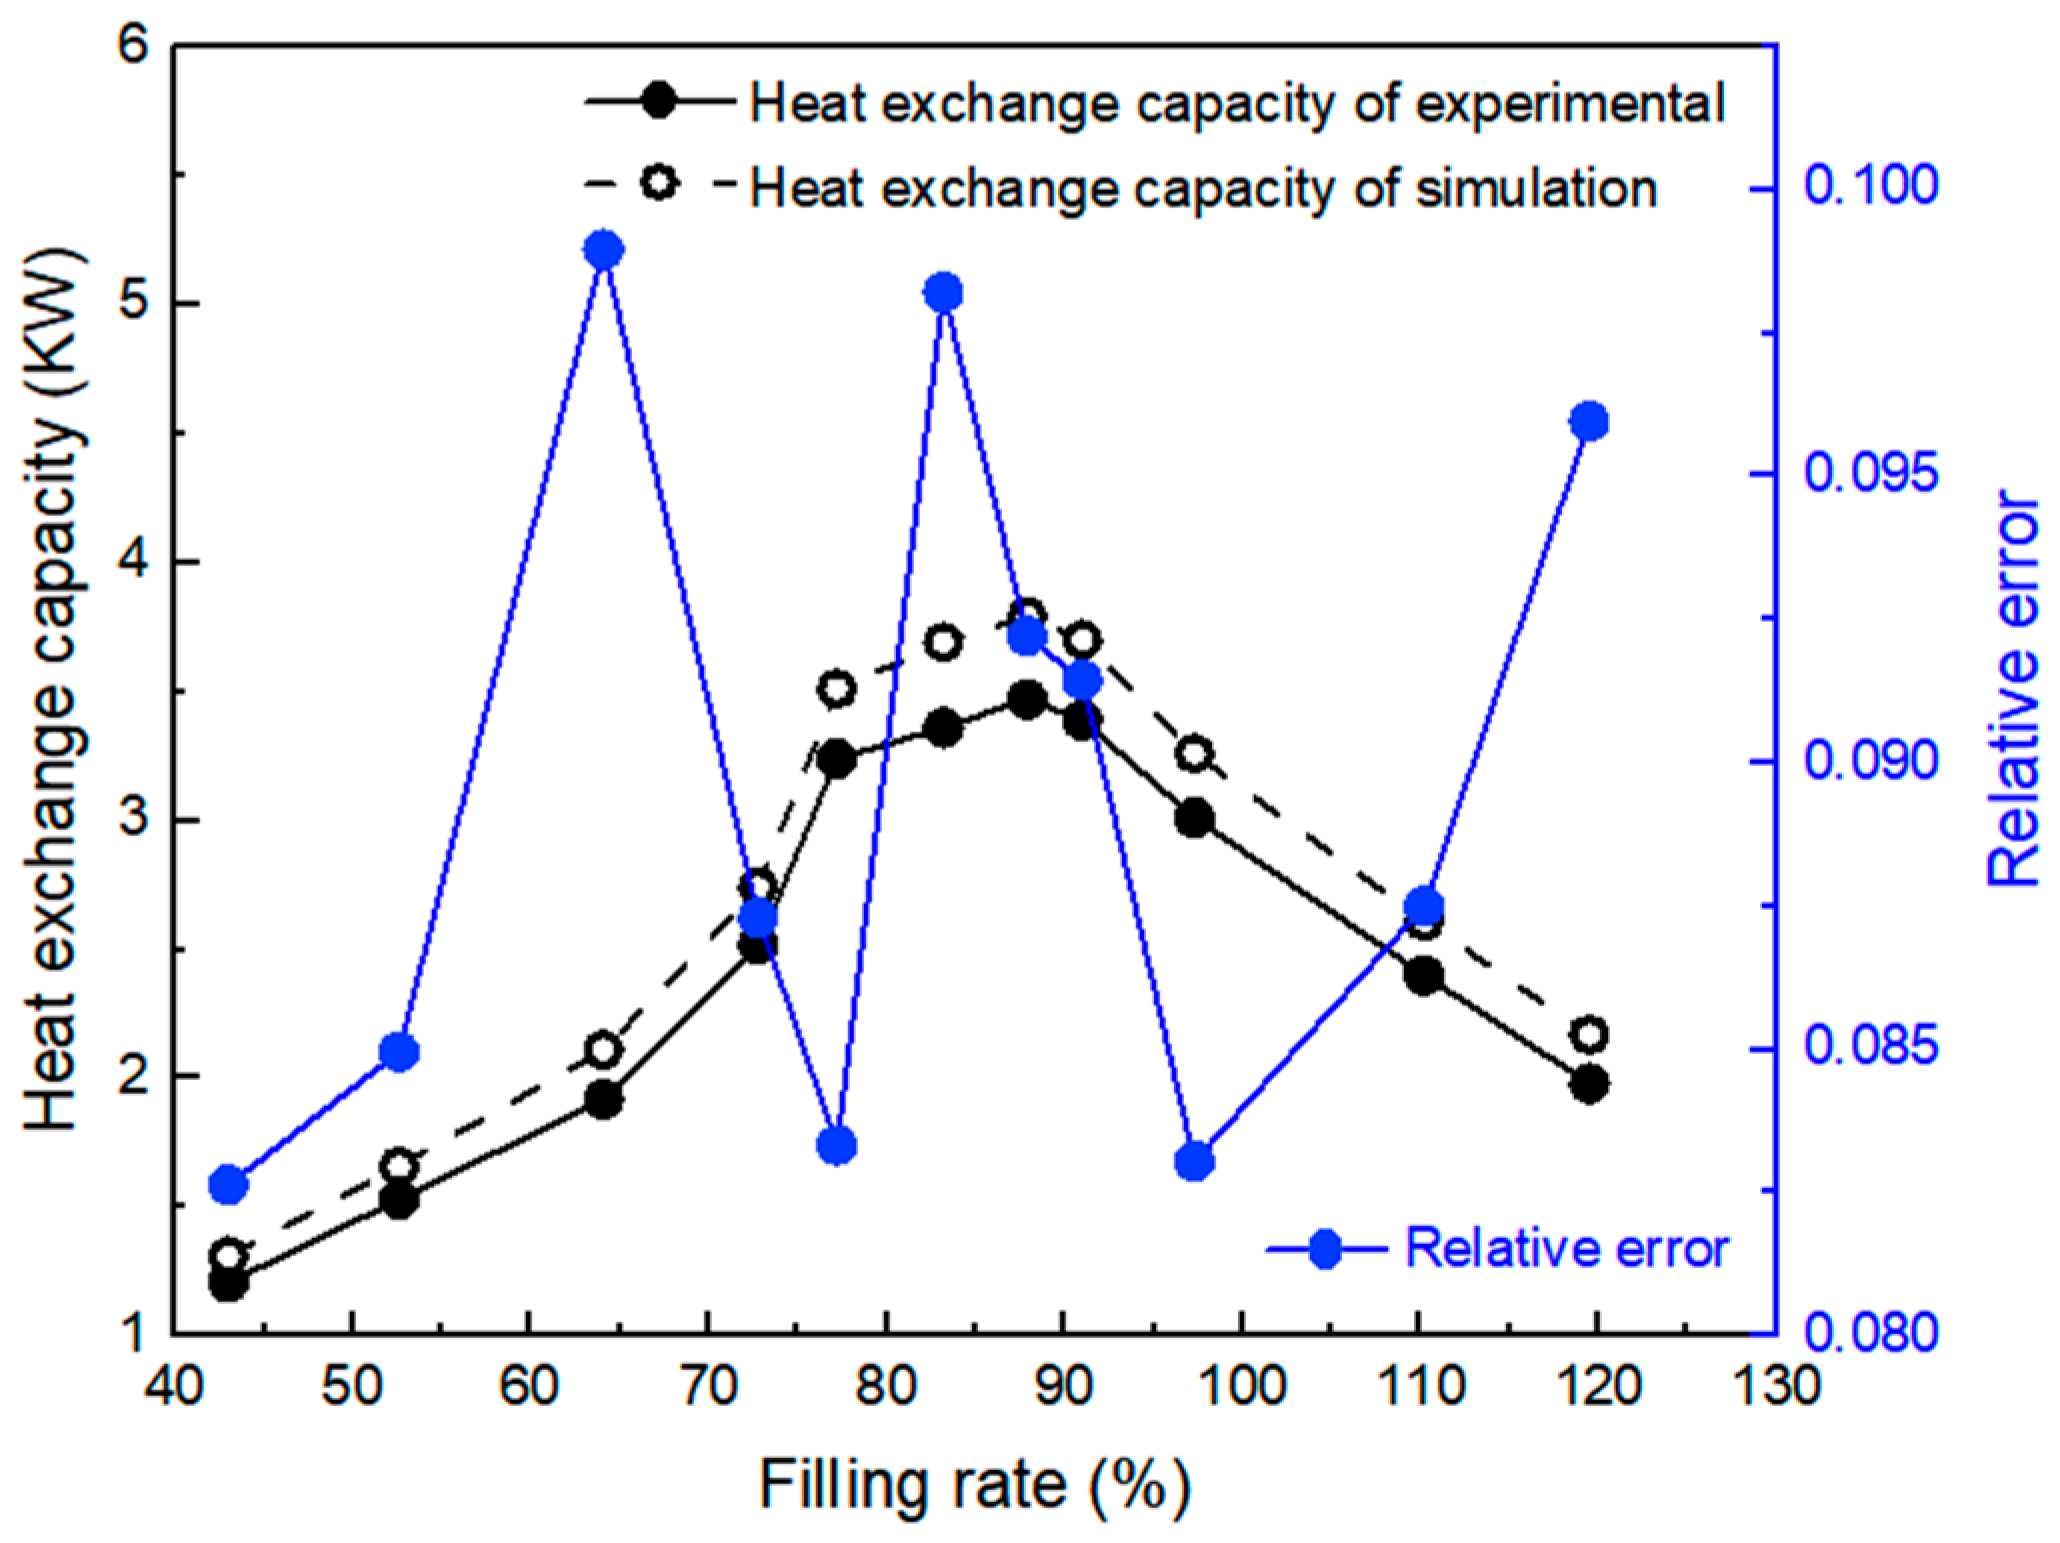
Figure 6 shows the calculated, experimental, and relative errors of evaporator heat transfer at different liquid filling rates. The calculated values of heat transfer are larger than experimental values, and the relative errors are between 8.2% and 9.9%. This is because the heat exchanger model assumes that the refrigerant flows into all of the flat tubes evenly, ignoring the non-uniformity of refrigerant flow from header to flat tubes. In actual experiments, the farther the flat tubes are from the heat exchanger inlet, the smaller the flow distribution, and thus, the lower the heat transfer amount. Therefore, the total heat transfer amount is lower than the calculated value. This flow nonuniformity can be solved by improving the protrusion depth of flat tubes in headers and using flat tubes with different inlet diameters [39].
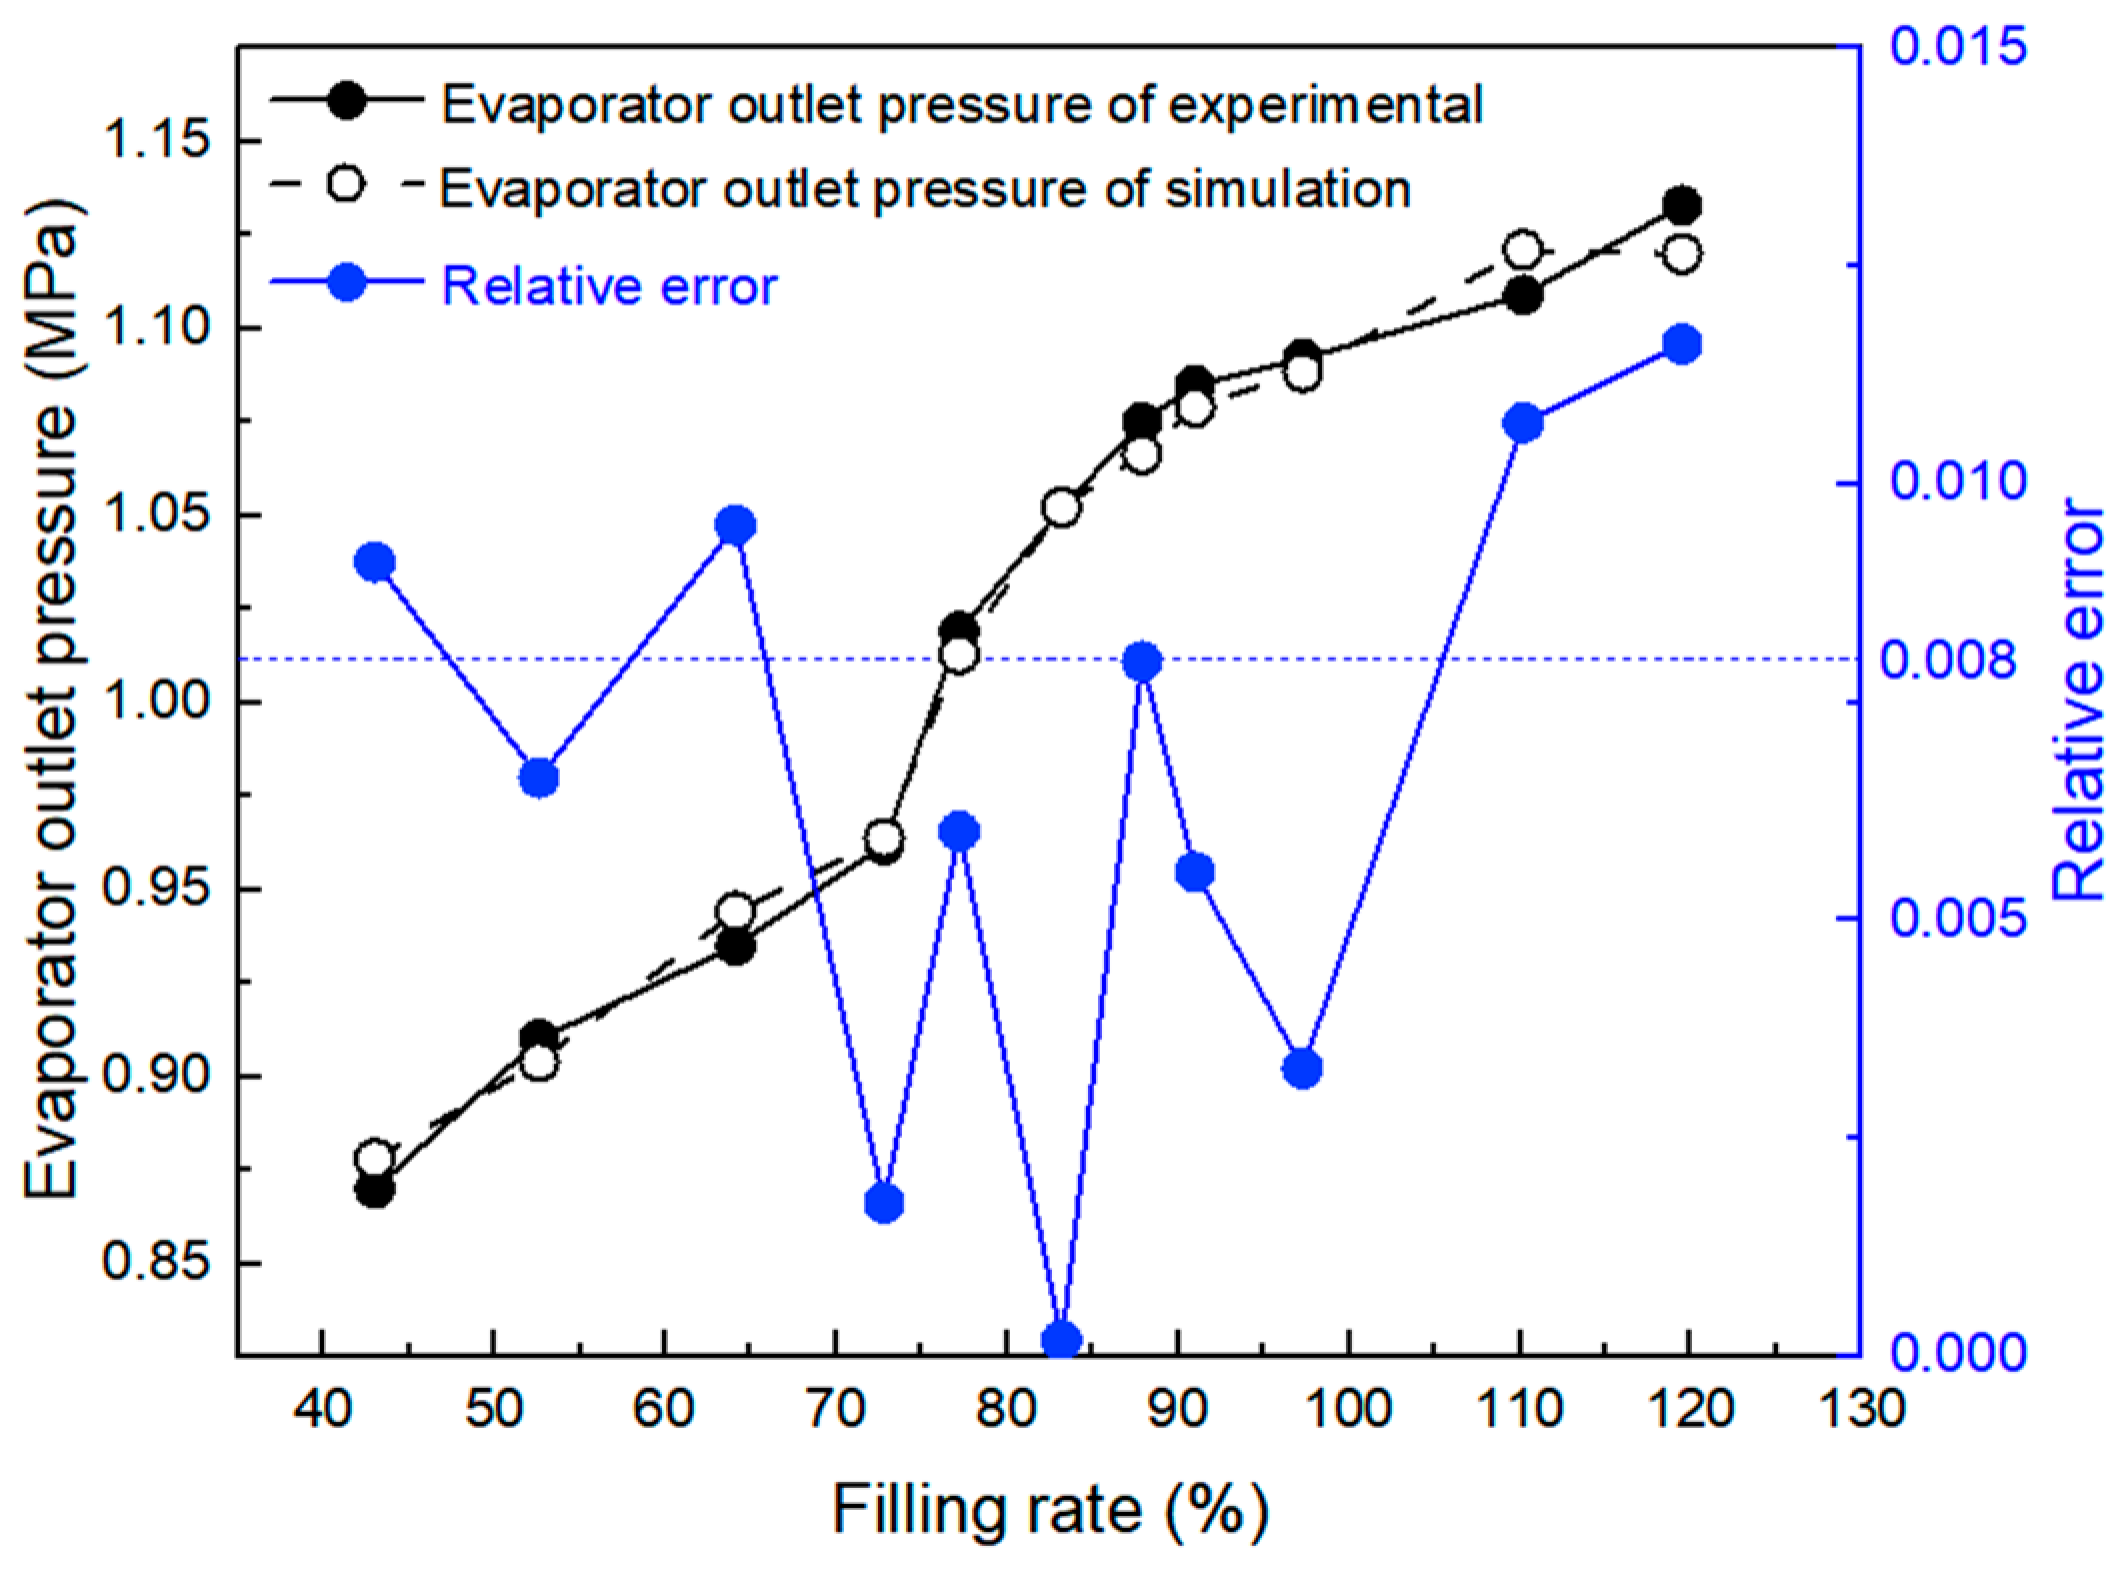
The calculated, experimental, and relative errors of evaporator outlet pressure at different filling rates are shown in Figure 7. The relative errors between calculated and experimental values of evaporator outlet pressure are between 0.19% and 1.16%. The errors are less than 0.8% in the optimal experimental filling rate range of 75–95%. It can be seen that the relative errors between calculated and experimental results are small. With the data falling within the acceptable range, the accuracy and reliability of the established model can be proven.

3.3. Analysis of Phase Change and Heat Transfer in Flat Tubes

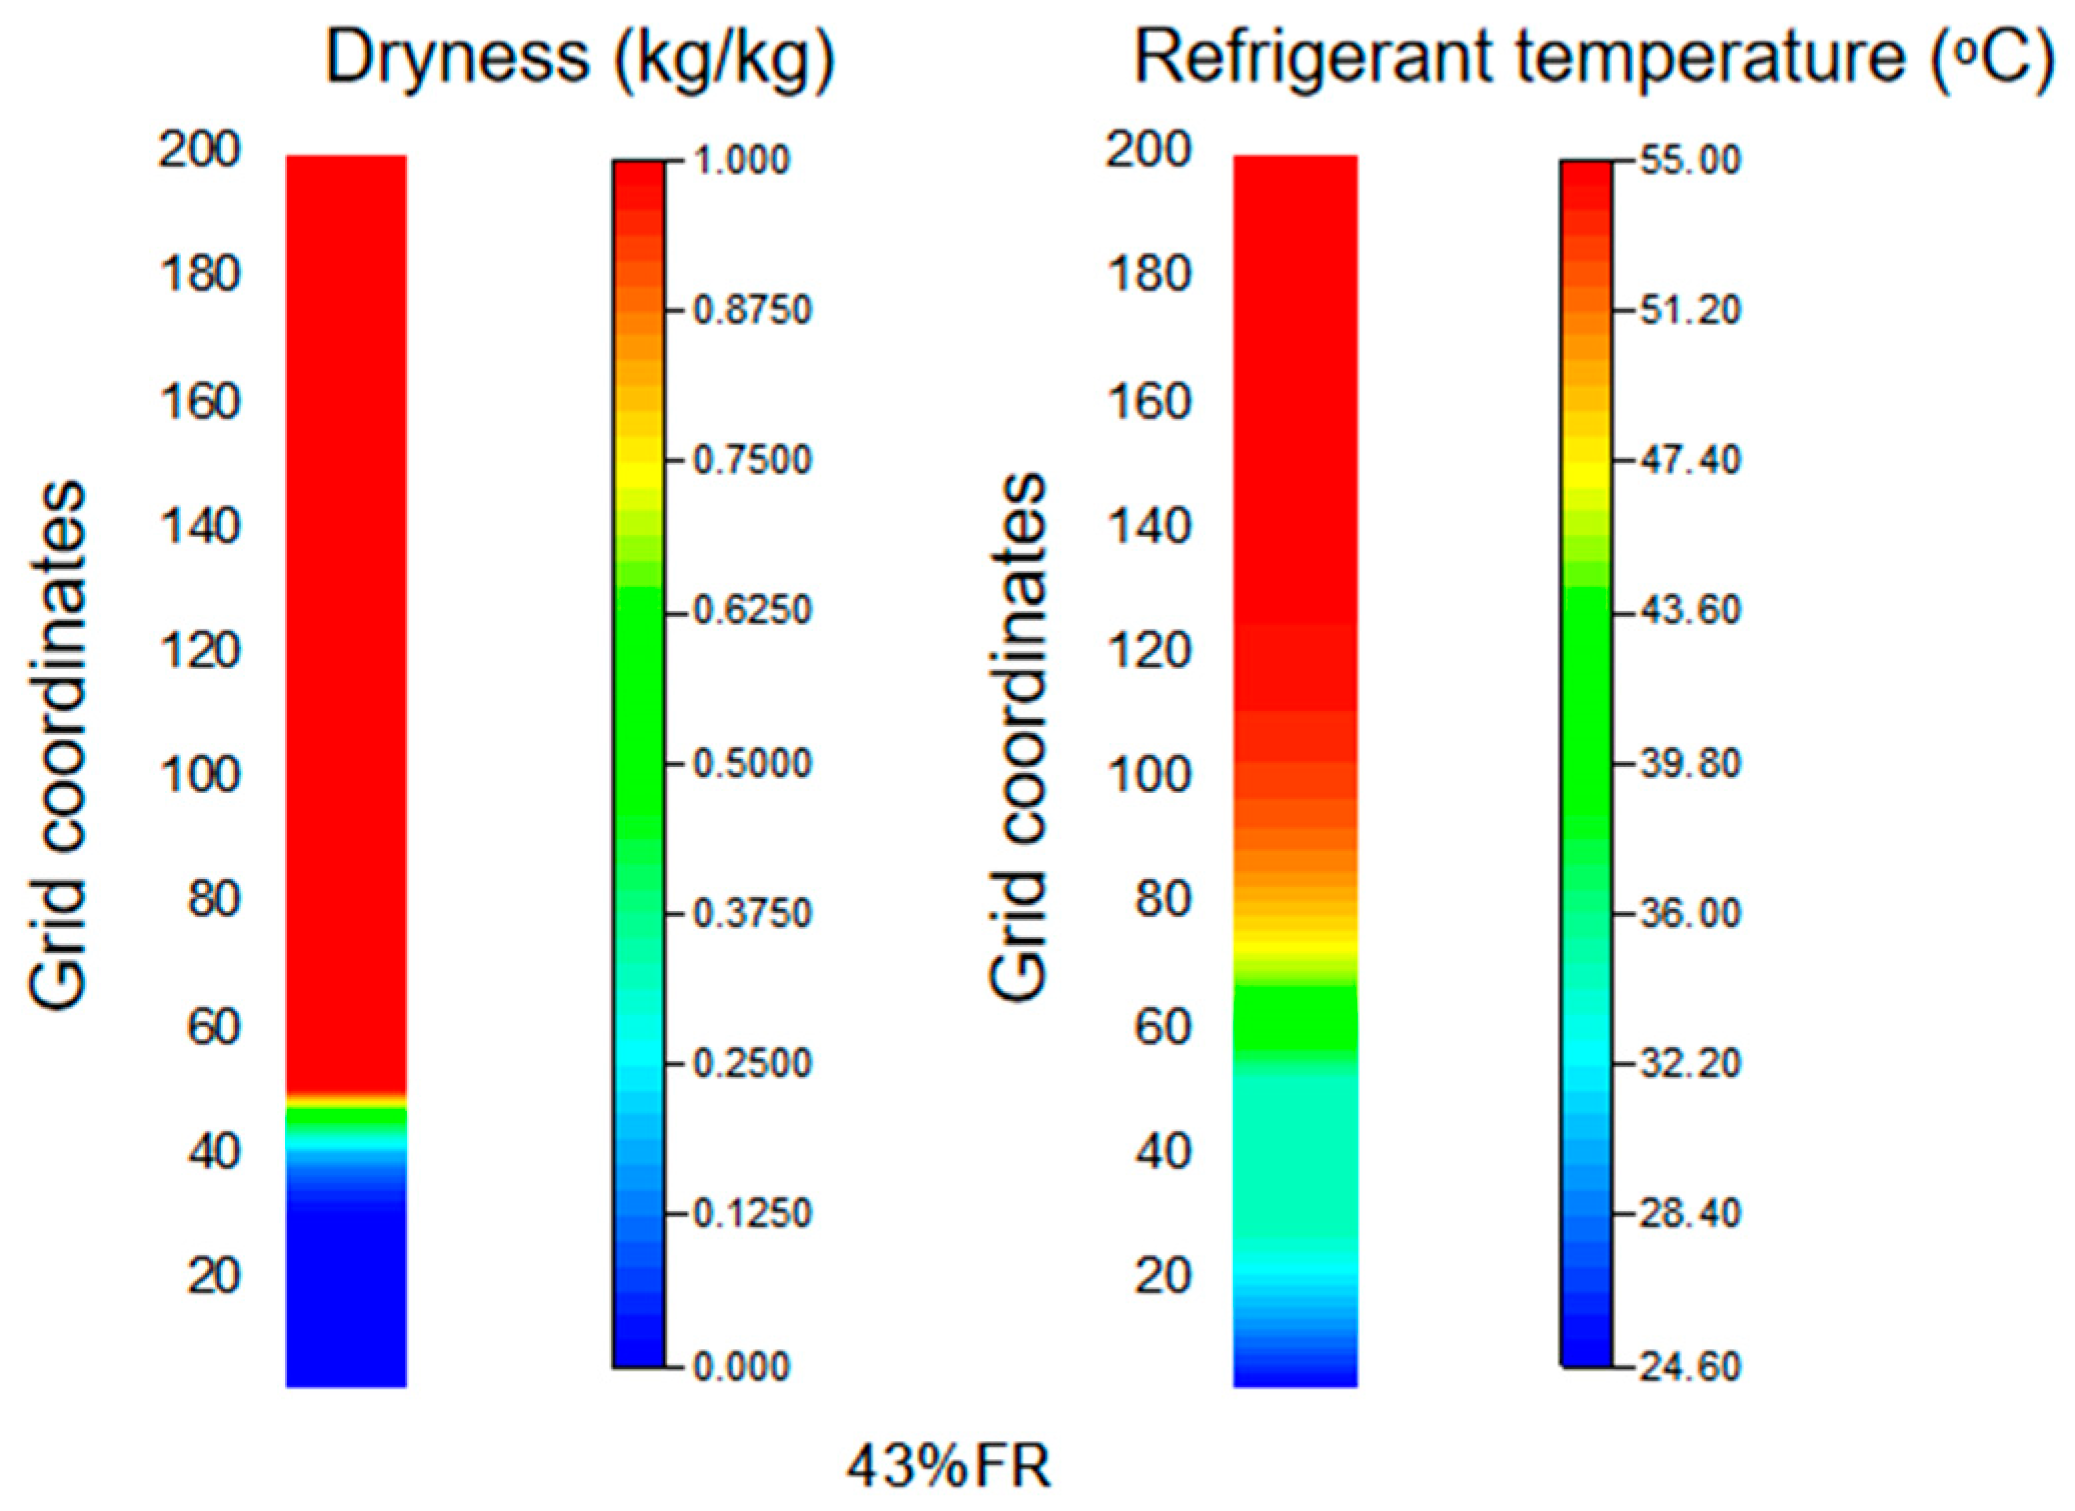
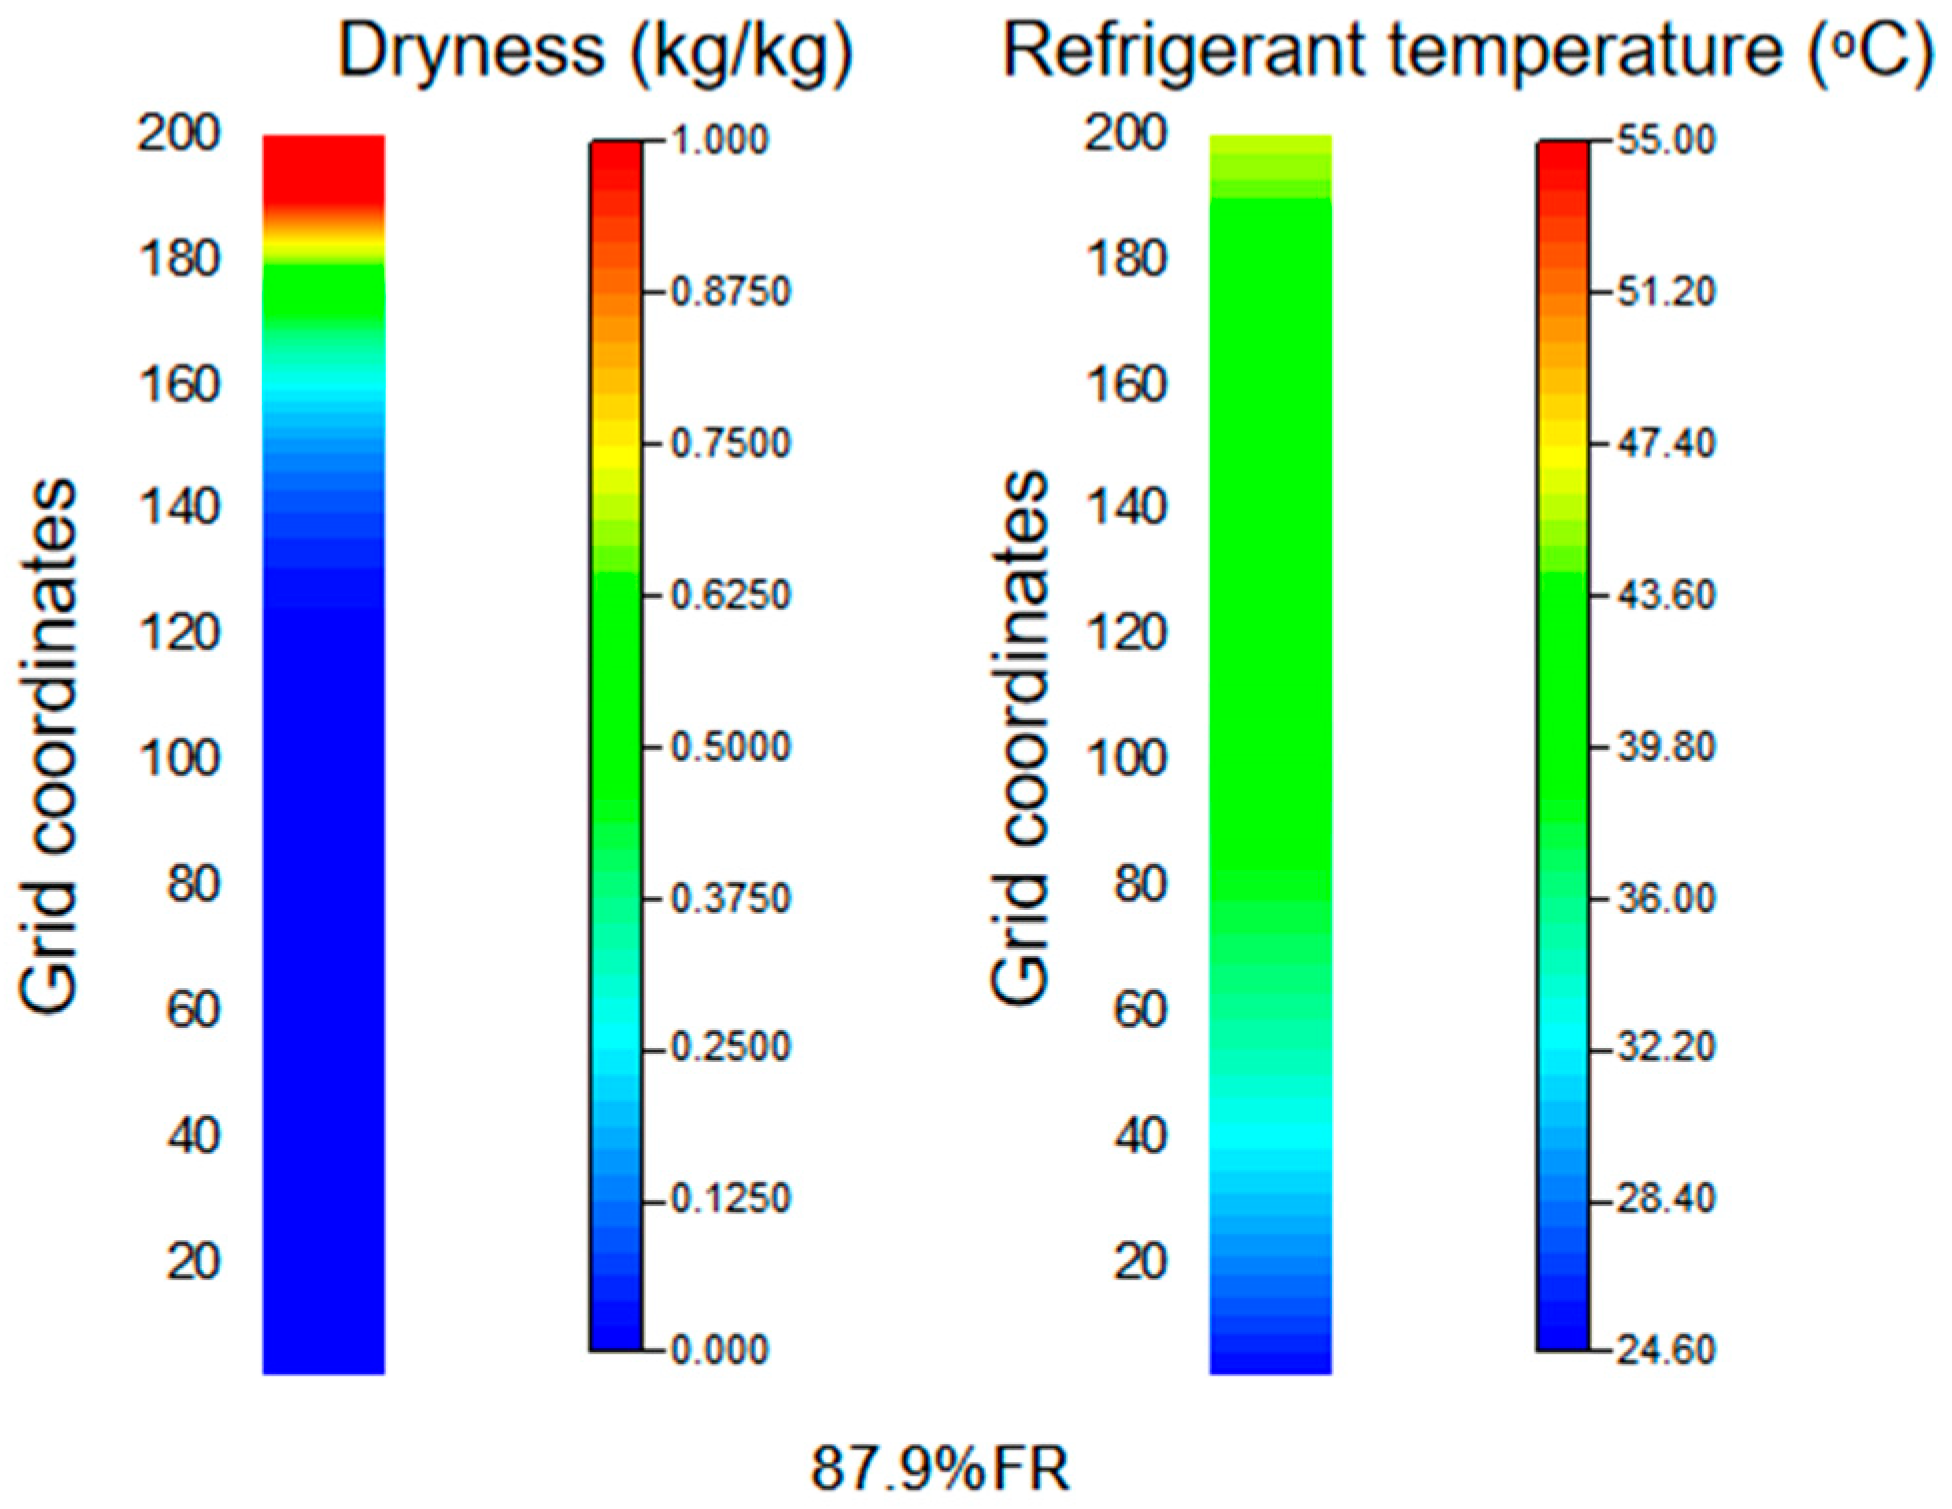
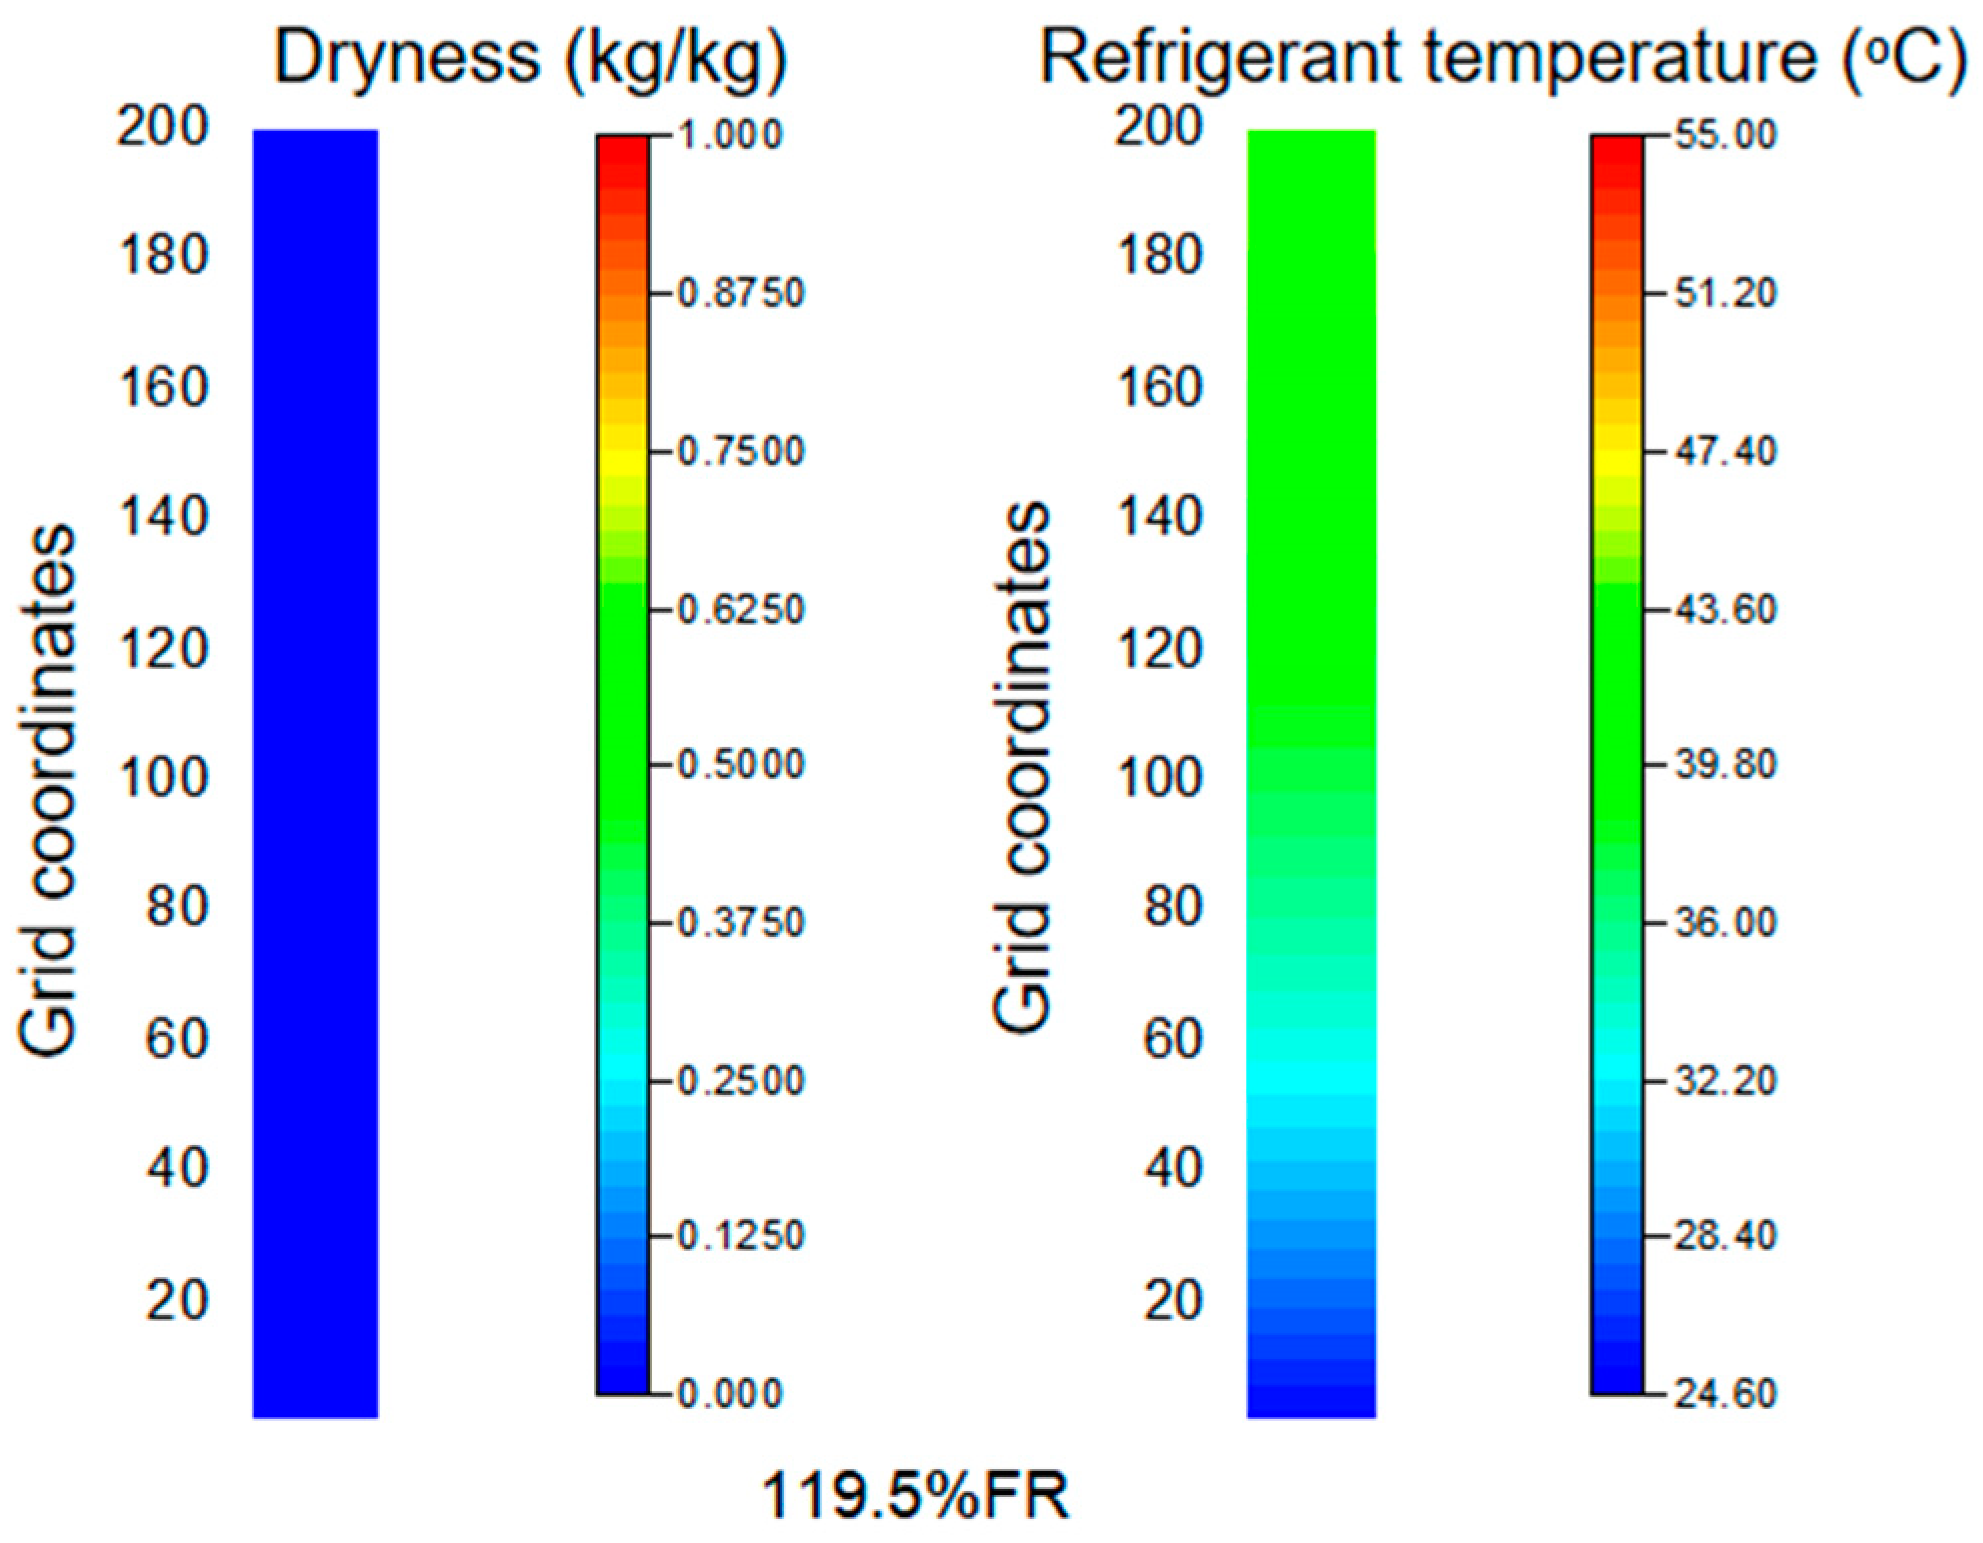
The analysis of the phase change flow of the working medium in flat tubes was conducted by selecting the calculation results of four working conditions with liquid filling rates of 43%, 64.1%, 87.9%, and 119.3%. The development trend of refrigerant dryness and temperature in flat tubes in the evaporator and condenser is shown in Figure 8, Figure 9, Figure 10 and Figure 11, wherein the flow direction of refrigerant in the flat tubes of evaporator is from 0 to 200, whereas refrigerant flow direction in the condenser flat tubes is from 200 to 0. The inlet working fluid temperature of the evaporation section is about 25 °C at all liquid filling rates; this is because the condenser flat tube length and design heat transfer are higher than that of the evaporator, indicating that the refrigerant in the condensation section has been fully cooled. When the liquid filling rate is 43%, the refrigerant absorbs heat at the inlet of the evaporator and enters the two-phase region at 34.31 °C, continuing to absorb heat and quickly entering the superheated steam state. The supercooled region and the two-phase region of the refrigerant are very short, 26 and 24 micro-element meshes, respectively, while the superheated region is 150 micro-element meshes, accounting for 3/4 of the total length of the flat tube. The temperature of the refrigerant in the superheated region rises rapidly, close to the inlet temperature of the evaporator, and the flat tube is close to drying up. At this time, the heat transfer temperature difference is very small. The heat transfer quantity in the micro-section is almost negligible compared with that in the two-phase section. The heat transfer quantity in the flat tube is mainly concentrated in the two-phase section, and the heat transfer effect is not good at this filling rate. However, due to the low mass of the working medium, the superheat degree of the working medium at the outlet of the evaporator reaches 20 °C. The temperature of the working medium decreases rapidly after entering the condensing section, and enters the two-phase section at 33.25 °C. The length of the superheat section and the two-phase section in the condensing section is 22 and 38 micro-sections, respectively. Then it passes through the subcooling zone, which is 140 micro-elements long, and is cooled to the air temperature close to the condenser inlet.
When the liquid filling rate is 64.1%, the pressure rises with the increase in MFR, exhibiting the following: the working medium enters the two-phase region at the 51st micro-element stage, the evaporation temperature is 36.9 °C, the two-phase region occupies 38 micro-element stages, and the superheated region occupies 111 micro-element stages. After entering the condenser, the refrigerant enters the two-phase region at a condensation temperature of 35.9 °C through a superheating region of 28 micro-element meshes. The two-phase region has a length of 46 micro-element meshes, and then is cooled to a temperature close to the inlet air temperature of the condenser through a supercooling region of 126 micro-element meshes. When the liquid filling rate reaches 87.9%, the refrigerant pressure at the evaporator inlet reaches 1.075 Mpa, the refrigerant supercooling degree is large, and the refrigerant enters the two-phase region at the 112th microelement length, where the evaporation temperature is 42 °C, and the two-phase region occupies 70 microelements, while the superheated region only occupies 13 microelements. After entering the condenser, the refrigerant enters the two-phase region with a condensation temperature of 41.2 °C through the superheating region of 12 micro-element meshes, and then is cooled to a temperature close to the inlet air temperature of the condenser through the supercooling region of 142 micro-element meshes. When the liquid filling rate continues to rise to 119.5%, the refrigerant pressure at the inlet of the evaporator reaches 1.13 Mpa, the refrigerant subcooling degree is 18.95 °C, and the refrigerant enters the two-phase region at the 186th microelement length, and the evaporation temperature is 43.95 °C. After entering the condenser, the refrigerant only passes through the two-phase region of 8 micro-element meshes, the condensation temperature is 43.25 °C, and then passes through the subcooling region of 192 micro-element meshes to be cooled to close to the inlet air temperature of the condenser. The heat transfer temperature difference in the latter part of the subcooling region is small, and the heat transfer effect is poor.

3.4. Heat Transfer Performance and Heat Transfer Mechanism Analysis

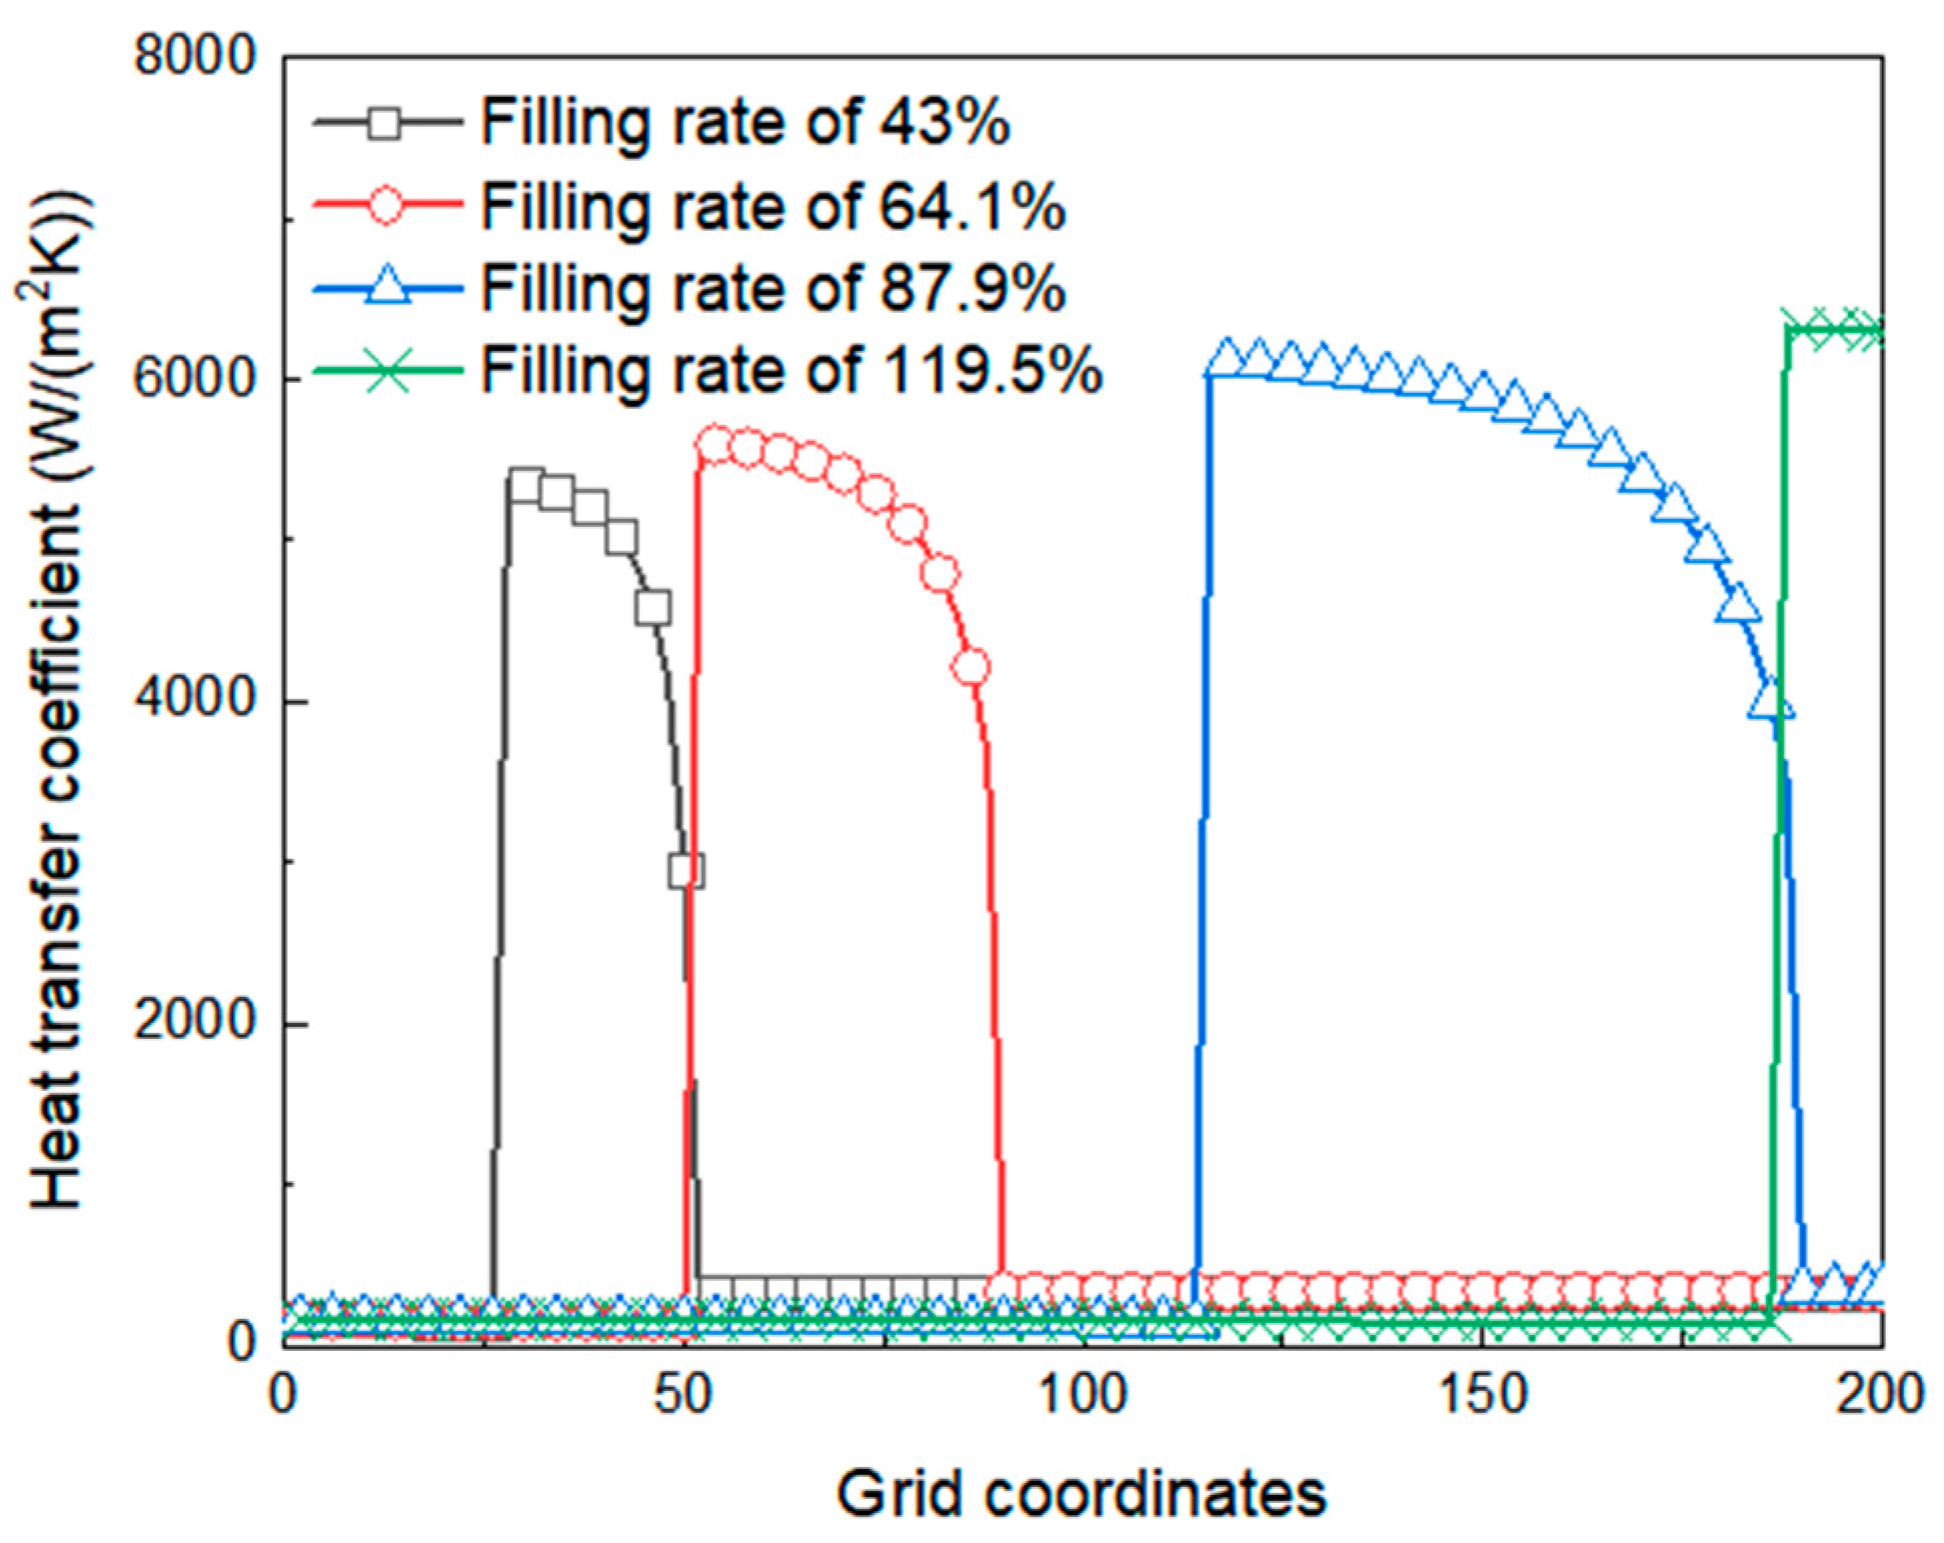
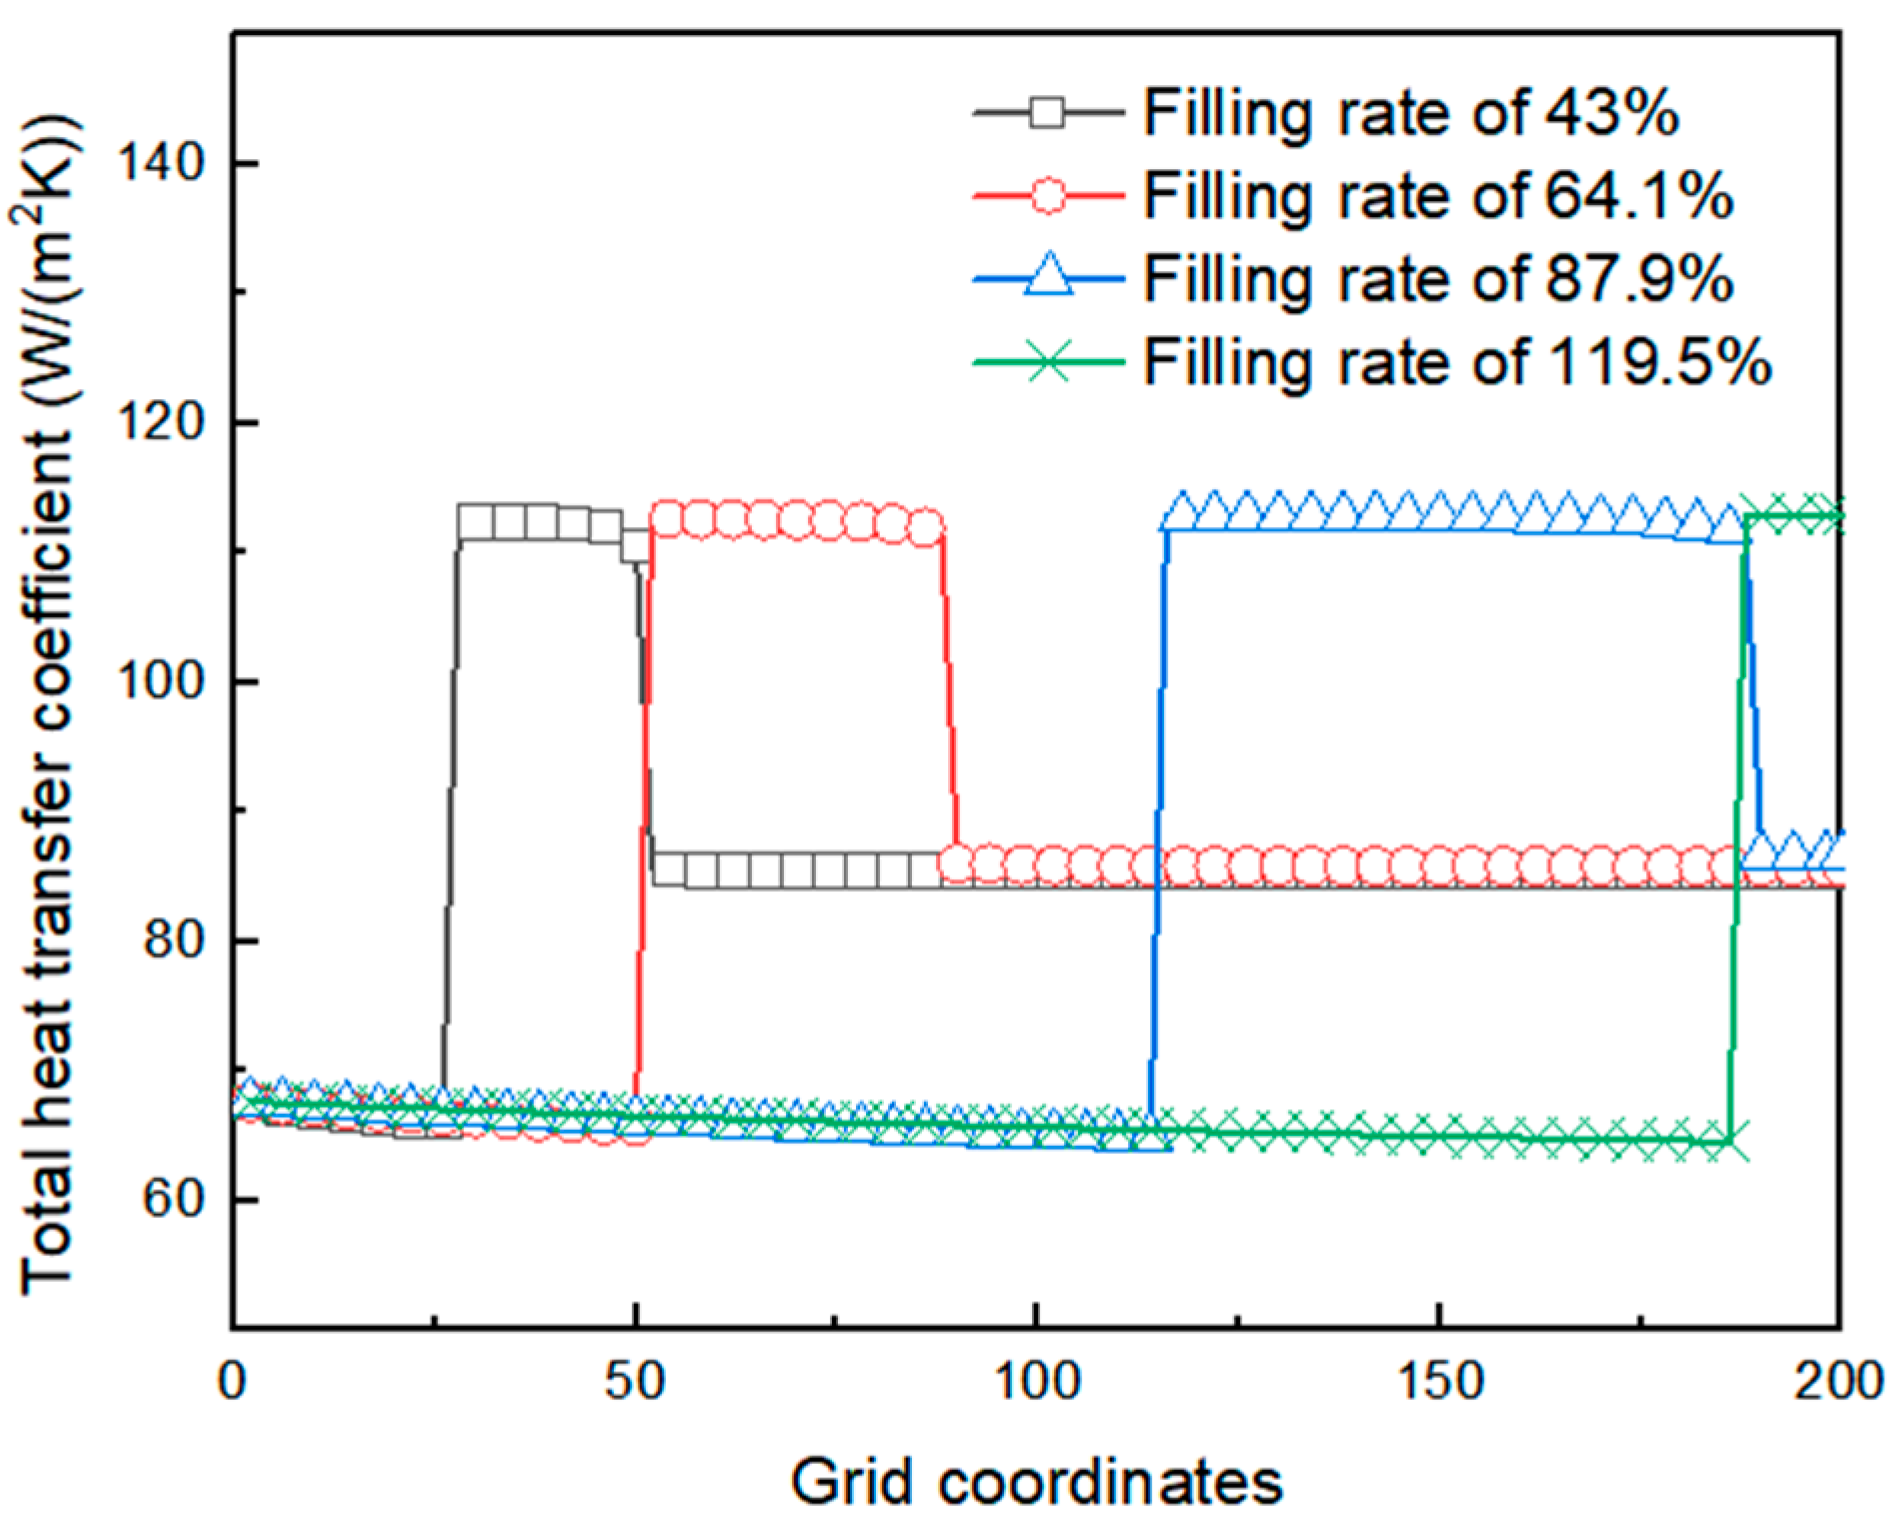
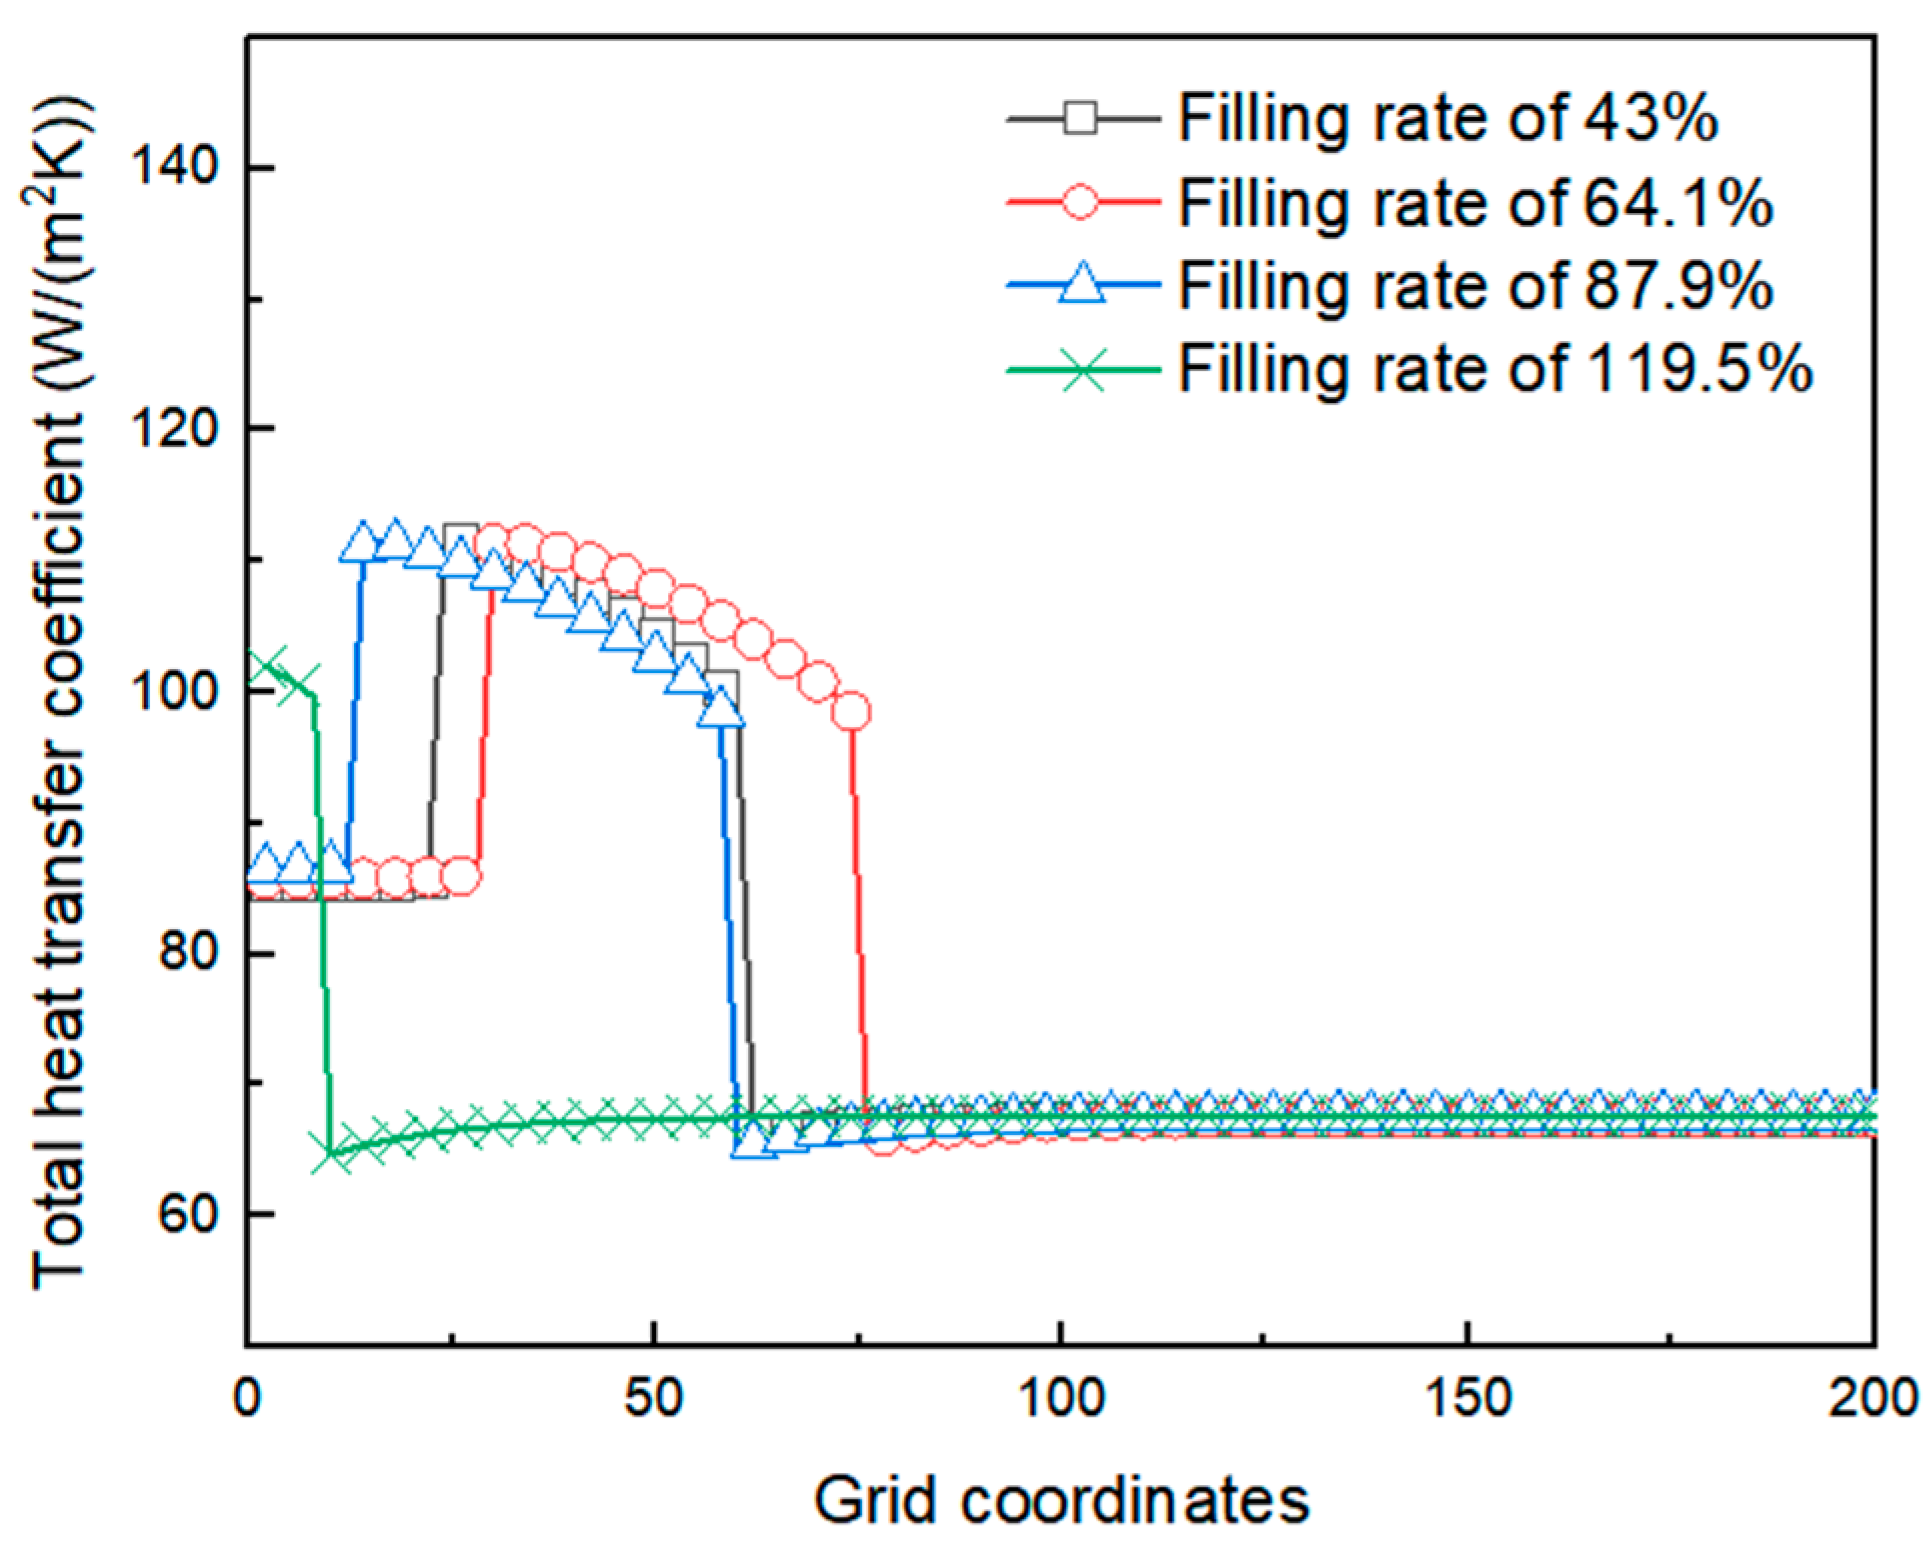
Figure 12 and Figure 13 describe the heat transfer coefficient at refrigerant side and total heat transfer coefficient relative to the total heat exchange area at air side of the evaporator, along the tube length direction, under different liquid filling rates, and under standard working conditions. It can be seen that the supercooled region and two-phase region of working medium in the evaporator are very short under low liquid filling rate. With the increase in liquid filling rate, the supercooled region and two-phase region of working medium in the evaporator become longer. At liquid filling rate of 119.5%, the proportion of tube length in the supercooled region of the evaporator is 92.5%. The refrigerant side heat transfer coefficient and the total heat transfer coefficient were analyzed with the tube length when the liquid filling ratio was 43%. The heat transfer coefficients of working fluid in subcooled, two-phase, and superheated regions all decrease in the single-phase region: the heat transfer coefficient in the subcooled region is the lowest, only 155–164 W/(m2·K); the heat transfer coefficient in the two-phase region is the highest, which is 2964–5366 W/(m2·K); while the heat transfer coefficient in the superheated region is 335–338 W/(m2·K). The variation trend of the total heat transfer coefficient Ka relative to the total heat transfer area on the air side is consistent with that on the refrigerant side, which is 66–68 W/(m2·K) in the subcooled region and 110–112 W/(m2·K) in the two-phase region. The refrigerant heat transfer coefficient decreases by 5.8% in the subcooled region, 0.9% in the superheated region, and 181% in the two-phase region.
The decrease in refrigerant heat transfer coefficient in the single-phase region is due to the increase in viscosity with the increase in temperature, which has an adverse effect on heat transfer, while the decrease in refrigerant heat transfer coefficient in the subcooled region is greater than that in superheated region because of the inlet effect in the subcooled region. When the dryness x is low, the bubble flow is mainly bubble flow; bubbles are generated from the wall, and nucleate boiling occurs when bubbles exist in the whole flow section, resulting in a high heat transfer coefficient. When the dryness continues to develop, a vapor column is formed in the center of the tube, and the liquid is pushed to the wall of the tube to form an annular flow. At this time, the bubble formation is further suppressed, and the heat transfer needs to be carried out across the film, and the nucleate boiling changes into convective boiling, and the heat transfer coefficient further decreases. At the higher dryness stage, the thin film of annular flow becomes thinner gradually with the increase in gas mass fraction until it is completely exhausted (evaporation). At this point, the tube wall directly contacts with wet steam, forming mist flow, the heat transfer type becomes forced convection heat transfer of wet steam, and the heat transfer coefficient decreases sharply.
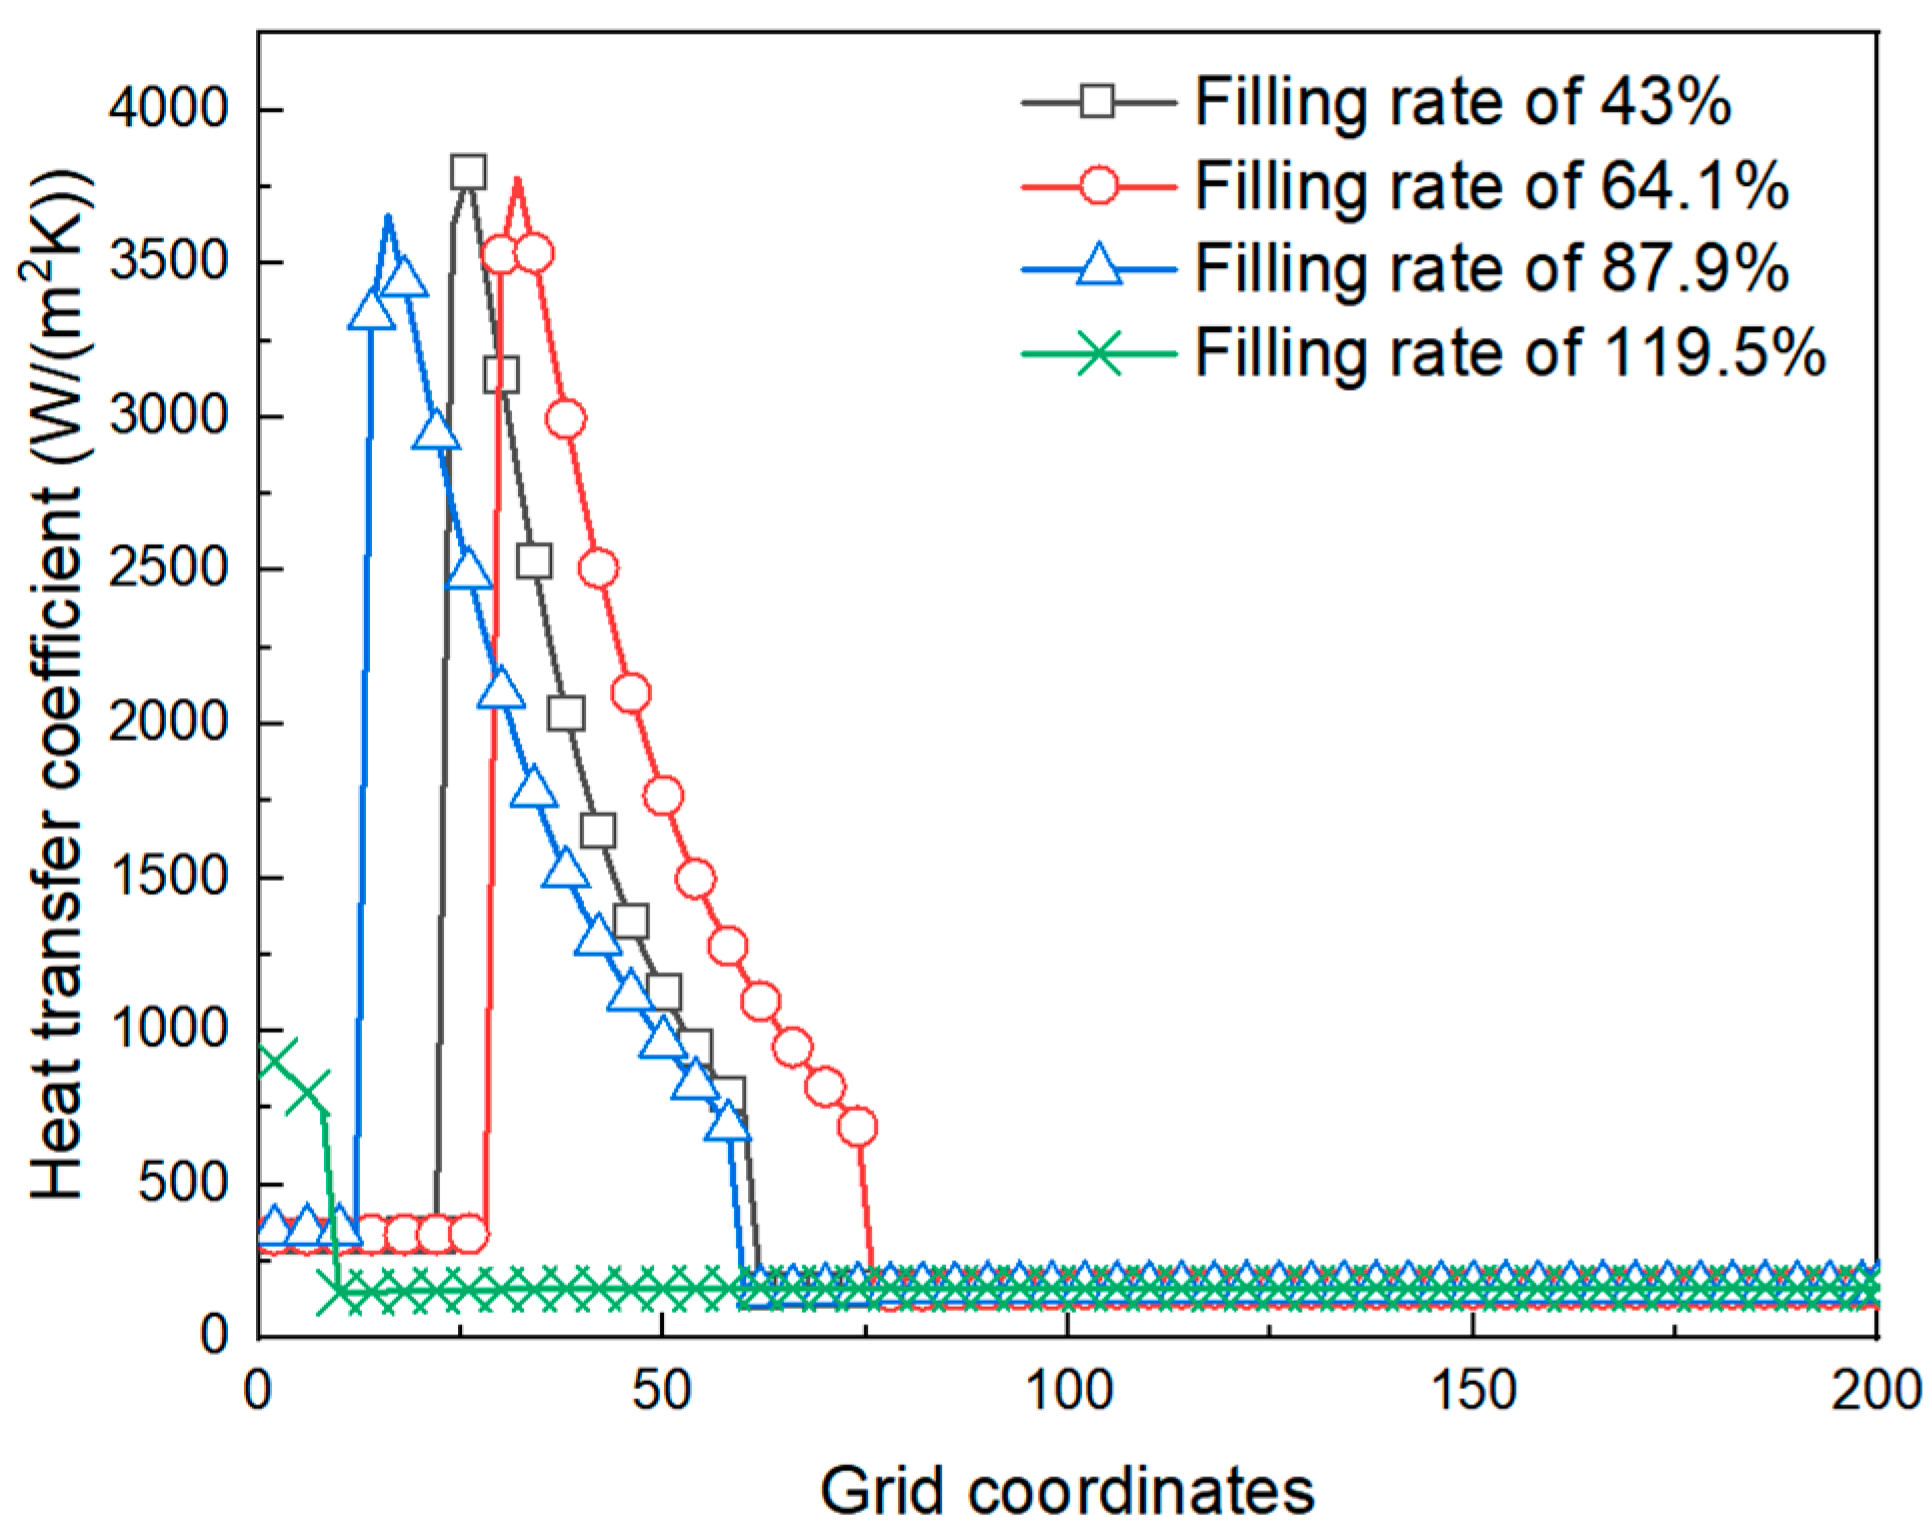
Figure 14 and Figure 15 show the curves of heat transfer coefficient on the refrigerant side and total heat transfer coefficient relative to total heat transfer area on the air side along the tube length direction under different liquid filling rates of the condenser and under standard conditions. The superheat zone in the condensing section is shorter at 43%, 64.1%, and 87.9% liquid filling rates, but there is no superheat zone in the condensing section at the higher liquid filling rate of 119.5%, and the two-phase zone is only shorter than 8 microelement length. The refrigerant side heat transfer coefficient decreases slightly from 344.61 W/(m2·K) to 333.28 W/(m2·K) in the superheat region due to inlet effect, and then increases to 336.11 W/(m2·K) due to temperature decrease. The refrigerant side heat transfer coefficient decreases from 3800.75 W/(m2·K) to 795.10 W/(m2·K) in the two-phase region. The heat transfer coefficient increases from 156.72 W/(m2·K) to 163.97 W/(m2·K) in the subcooled region due to the decrease in temperature. The change trend of total heat transfer coefficient Ka relative to total heat transfer area on the air side is consistent with that of the refrigerant side. The variation trend of total heat transfer coefficient Ka relative to total heat transfer area on the air side is also consistent with that on the refrigerant side, which is 85.53–85.71 W/(m2·K) in the subcooled region, 99.20–111.44 W/(m2·K) in the two-phase region, and 66.32–67.60 W/(m2·K) in the superheated region.

3.5. Effect of Temperature Difference on Heat Transfer Performance

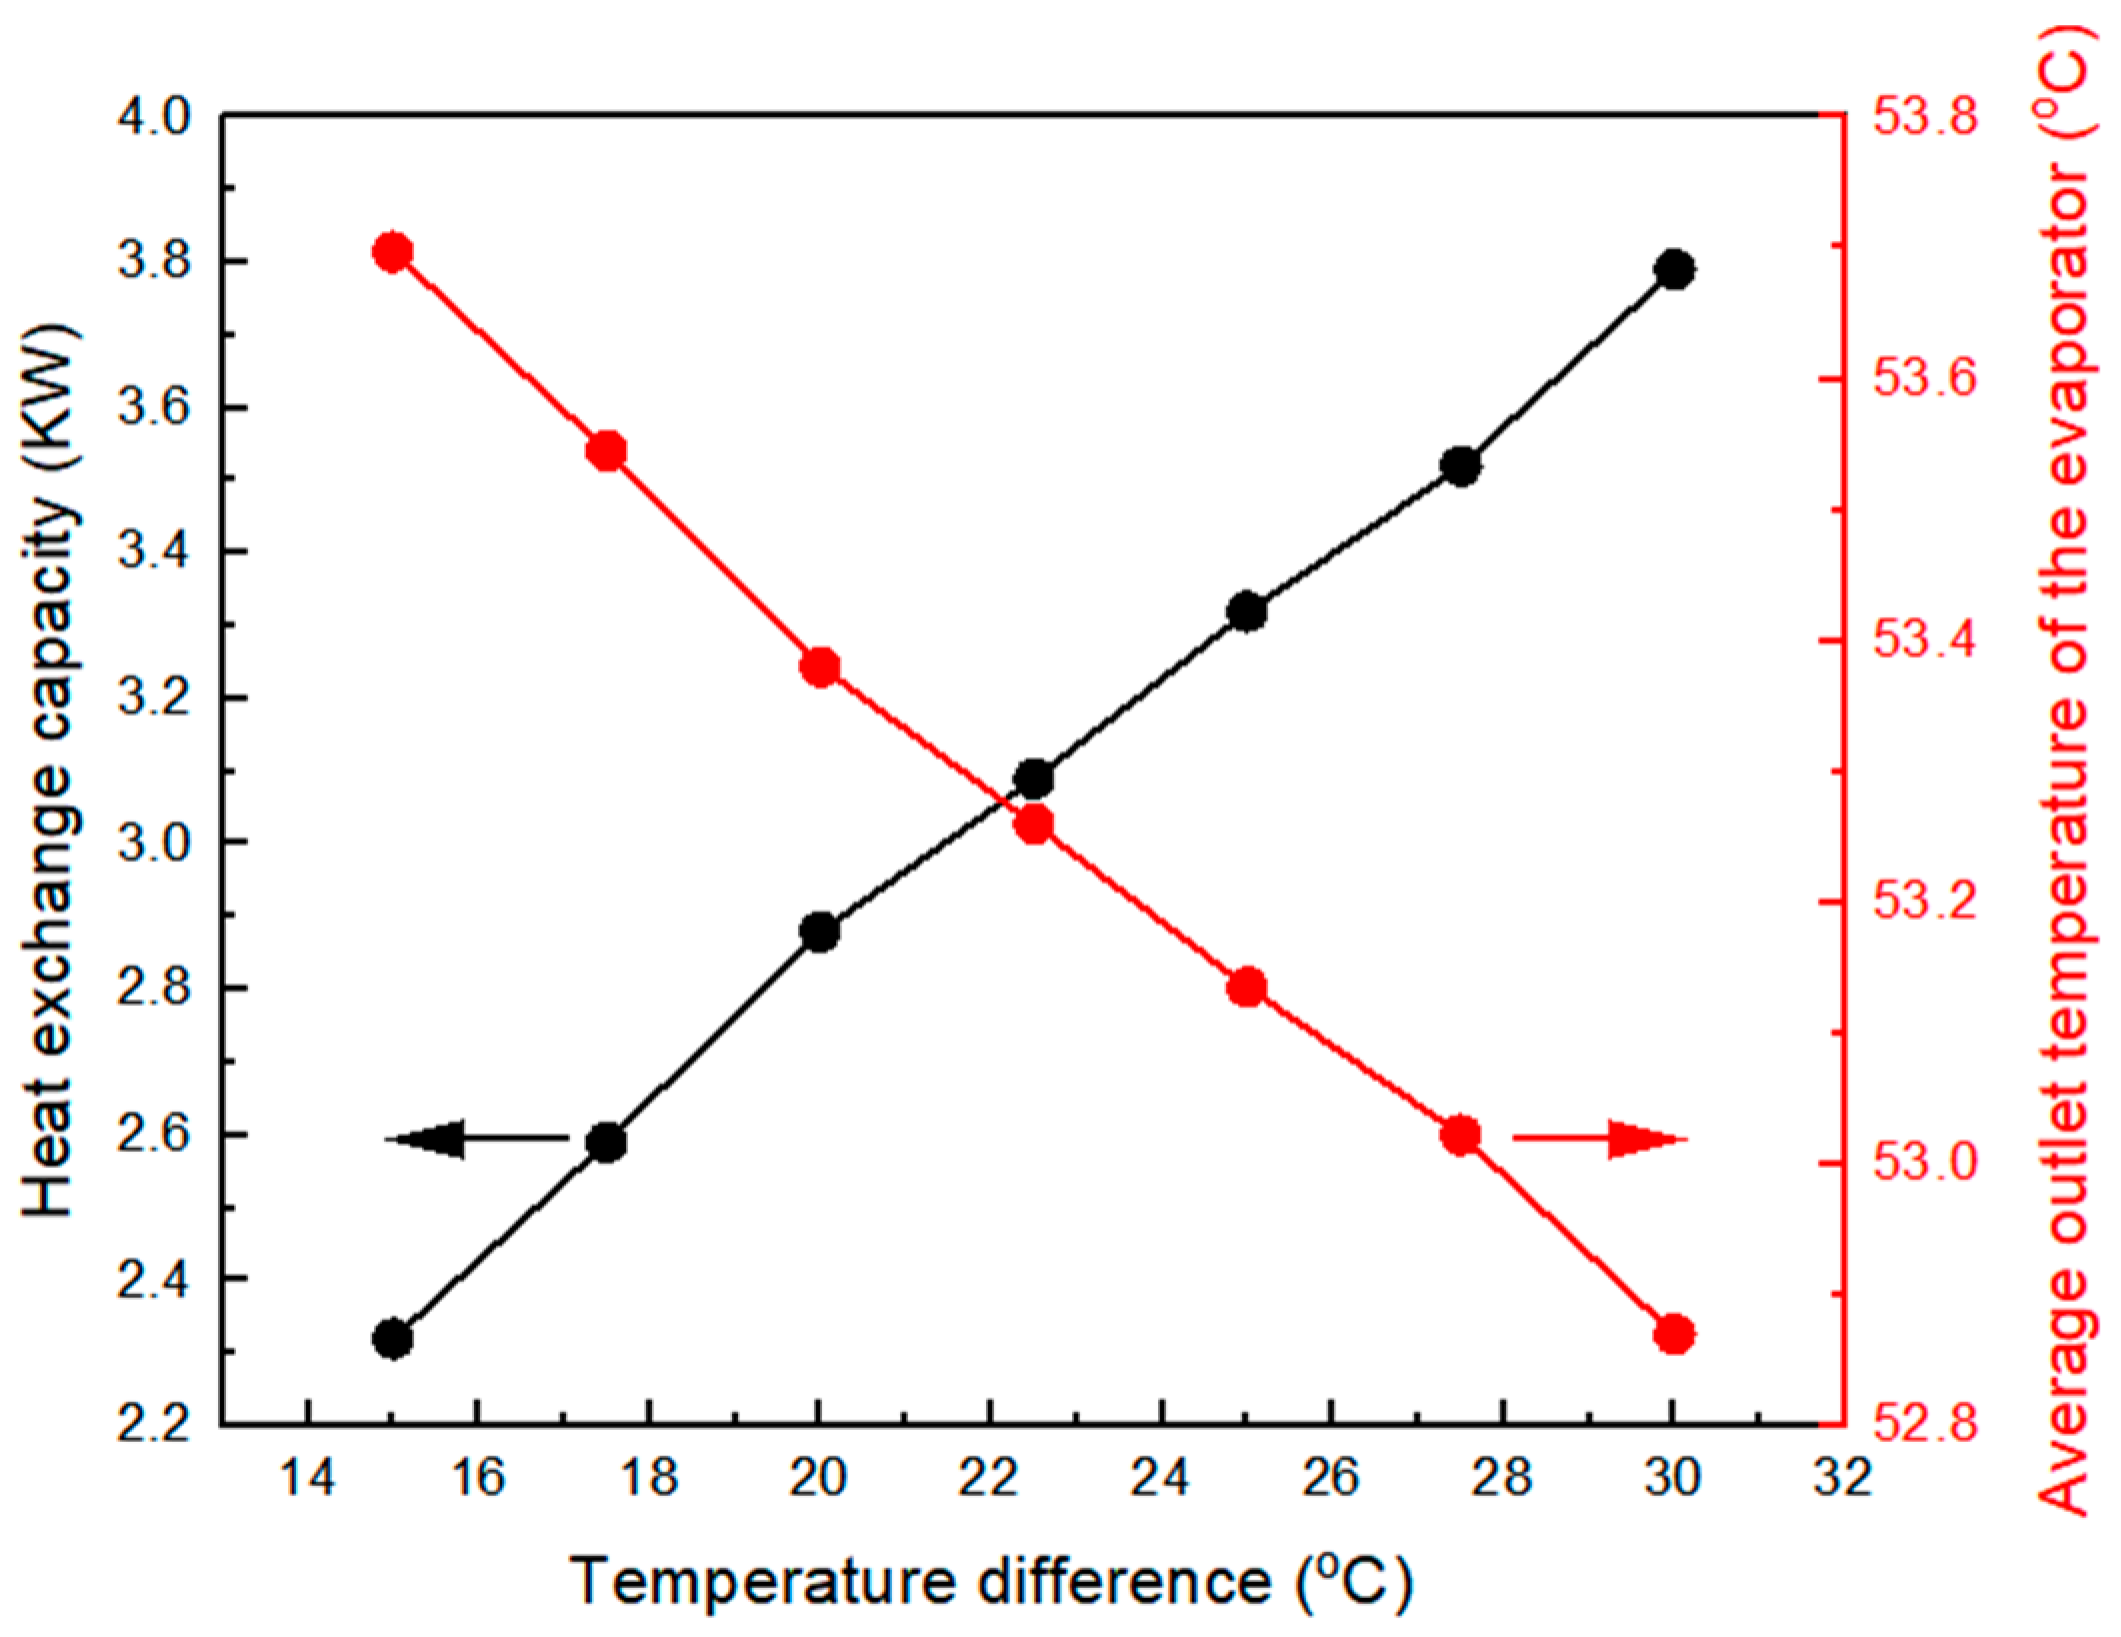
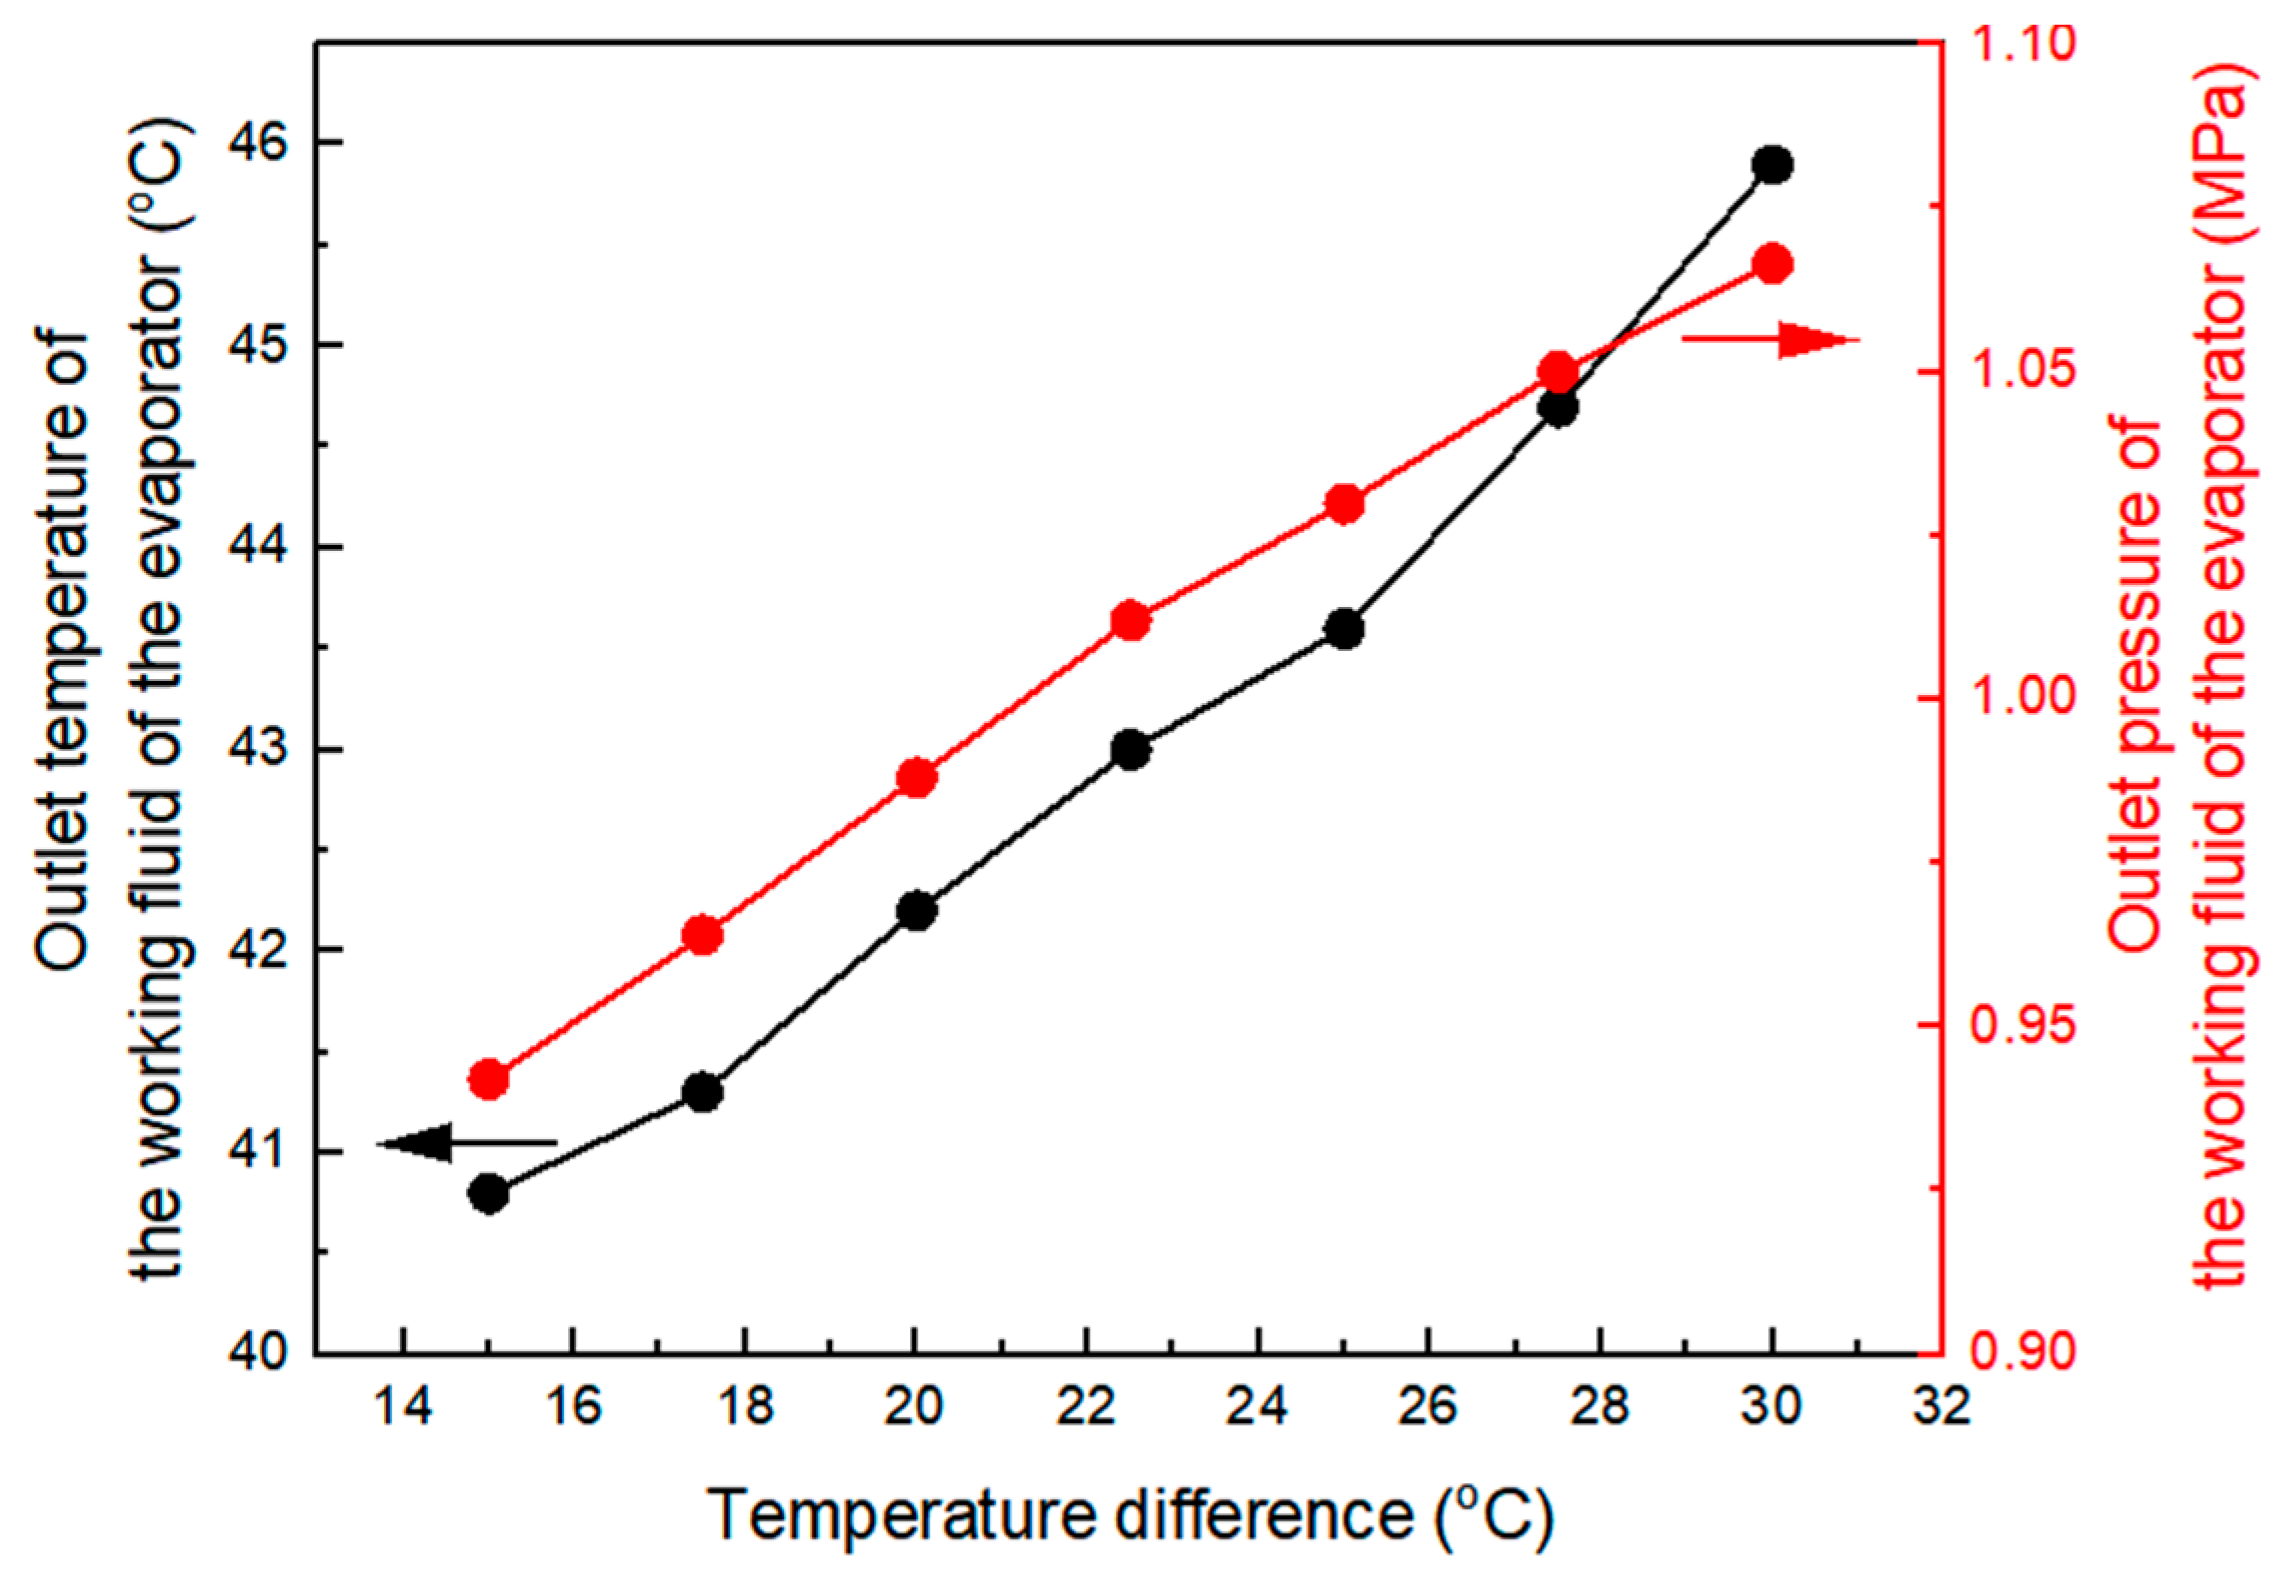
In order to study the influence of temperature difference, denoted as Δ(T“evap,in,air” − T“cond,in,air”), an indoor − outdoor ambient split is necessary. The inlet air temperature of the evaporator side is kept constant at 55 °C, and the inlet air temperature of the condenser side is changed. The inlet air temperature of the condenser side is 25–40 °C, and the temperature difference is 15–30 °C under the standard condition of 87.9%. The curves of heat exchange quantity and evaporator outlet air temperature and the evaporator outlet working medium parameters, changing with indoor and outdoor temperature difference, are shown in Figure 16. When the indoor and outdoor temperature difference is 15 °C, the heat exchange quantity of heat pipe system is 2.32 kW. When the indoor and outdoor temperature difference is 30 °C, the heat exchange quantity of heat pipe system is 3.79 kW, and the increased range of heat exchange quantity is 63.3%, indicating that when the outdoor temperature difference increases, the heat exchange quantity increases with it. However, the increased range is smaller than the increase range of indoor and outdoor temperature difference. When the temperature difference between indoor and outdoor is 15 °C, the outlet air temperature of evaporator is 53.70 °C. When the temperature difference between indoor and outdoor is 30 °C, the outlet air temperature of evaporator is 52.87 °C. Under the condition of constant air volume per unit area, the temperature difference between inlet and outlet air of evaporator section increases, and the heat exchange rate increases. The curve of refrigerant parameters at evaporator outlet varying with indoor and outdoor temperature difference is shown in Figure 17. When the indoor and outdoor temperature difference increases from 15 °C to 30 °C, the refrigerant pressure at the evaporator outlet increases from 0.942 Mpa to 1.066 MPa, and the refrigerant temperature at the evaporator outlet increases from 40.8 °C to 45.9 °C. It can be seen that the enthalpy value at the evaporator outlet increases with the increase in indoor and outdoor temperature difference, and the heat exchange between the refrigerant and refrigerant at the evaporator is more sufficient.

4. Conclusions

Based on the distributed parameter model, the iterative convergence cycle of the whole heat pipe system, evaporator, and condenser were designed according to the three laws of energy conservation, momentum conservation, and mass conservation. The mathematical models of heat transfer, pressure drop and mass of the evaporator, condenser, centrifugal pump, liquid storage tank and pipeline were established, respectively, and the steady-state mathematical model of the pump-driven microchannel-separated heat pipe was established. It was found that when the liquid filling ratio is as low as 43%, the refrigerant in the evaporator rapidly passes through the supercooling and two-phase state as superheated steam to continue absorbing heat, and the superheat of the refrigerant at the evaporator outlet reaches 20 °C. When the liquid filling rate is up to 119.5%, the refrigerant in the evaporator exchanges heat in the subcooled region, and only the refrigerant near the evaporator outlet enters the two-phase region. The sensible heat exchange ratio is very large in both cases. When the liquid filling rate is 87.9%, the two-phase region accounts for 35%, the superheat at the evaporator outlet is 3.9 °C, and the heat exchange rate is the largest among the four liquid filling rates. In addition, the heat transfer coefficients of working fluid in the three regions of supercooling, two-phase, and superheating decrease in the single-phase region, the decrease in heat transfer coefficients in the single-phase region is affected by temperature and inlet effect, and the decrease in heat transfer coefficients in the two-phase region is due to the change in flow pattern and heat transfer mechanism; among which, the flow pattern develops into bubble flow, bulk flow, annular flow, and mist flow along the tube length, and the heat transfer develops into nucleate boiling, convective boiling, and forced convection along the tube length. The results of this study can provide a new idea for the thermal management of an energy storage battery and expand the application of a separated heat pipe cooling system in battery cooling technology.

Author Contributions

Methodology, C.H.; software, H.G.; validation, H.G.; formal analysis, Y.H., L.S. and C.H.; investigation, C.H.; data curation, Y.H., L.S. and W.Y.; writing—original draft preparation, Y.H., L.S., C.H. and W.Y.; writing—review and editing, H.G. and C.H.; visualization, C.X. and W.Y. All authors have read and agreed to the published version of the manuscript.

Funding

The authors are grateful for National Natural Science Foundation of China under Grant No. 52306090, Natural Science Fund for Colleges and Universities in Jiangsu Province (Grant No. 23KJB470017) and China Postdoctoral Science Foundation (Grant No. 2023M731642).

Data Availability Statement

The original contributions presented in this study are included in the article. Further inquiries can be directed to the corresponding author.

Conflicts of Interest

Authors Yanzhong Huang, Linjun Si, Chenxuan Xu, and Wenge Yu were employed by the Power China Huadong Engineering Corporation Limited. The remaining authors declare that the research was conducted in the absence of any commercial or financial relationships that could be construed as a potential conflict of interest.

References

  1. Weng, J.; Huang, Q.; Li, X.; Zhang, G.; Ouyang, D.; Chen, M.; Yuen, A.; Li, A.; Lee, E.; Yang, W.; et al. Safety issue on PCM-based battery thermal management: Material thermal stability and system hazard mitigation. Energy Storage Mater. 2022, 53, 580–612. [Google Scholar] [CrossRef]
  2. Samimi, F.; Babapoor, A.; Azizi, M.; Karimi, G. Thermal management analysis of a Li-ion battery cell using phase change material loaded with carbon fibers. Energy 2016, 96, 355–371. [Google Scholar] [CrossRef]
  3. Huang, Y.; Stonehouse, A.; Abeykoon, C. Encapsulation methods for phase change materials—A critical review. J. Heat Mass Transf. 2022, 200, 123458. [Google Scholar] [CrossRef]
  4. Chen, X.; Zhang, C.; Li, Y. Research and development of hydrogen energy safety. Emerg. Manag. Sci. Technol. 2022, 2, 1–9. [Google Scholar] [CrossRef]
  5. Dallaire, J.; Gosselin, L. Various ways to take into account density change in solid-liquid phase change models: Formulation and consequences. Int. J. Heat Mass Transf. 2016, 163, 672–683. [Google Scholar] [CrossRef]
  6. Chao, W.; Chen, L.; Kang, L. Method for quantitative expression of psychological safety and security distance (PSSD) using fuzzy theory. Emerg. Manag. Sci. Technol. 2022, 2, 1–8. [Google Scholar] [CrossRef]
  7. Zhao, S.; Wu, Z.X.; Wang, T.; Han, Y.; Liu, H.; Miao, Z.; Huang, R.; Li, L. Directional thermal conductive PEG@BNNS composites enhanced tri-function passive radiative cooler for thermal management of high-power density devices. Compos. Sci. Technol. 2024, 258, 110889. [Google Scholar] [CrossRef]
  8. Chen, Q.; Wang, J.; Gao, M.; Liu, M.; Tao, J. Review on loss prevention of chemical reaction thermal runaway: Principles and application. Emerg. Manag. Sci. Technol. 2022, 10, 1–8. [Google Scholar] [CrossRef]
  9. Lv, Y.F.; Yang, X.Q.; Zhang, G.Q. Durability of phase-change-material module and its relieving effect on battery deterioration during long-term cycles. Appl. Therm. Eng. 2020, 179, 115747. [Google Scholar] [CrossRef]
  10. Naghavi, M.S.; Ong, K.S.; Badruddin, I.A.; Mehrali, M.; Silakhori, M.; Metselaar, H.S.C. Theoretical model of an evacuated tube heat pipe solar collector integrated with phase change material. Energy 2015, 91, 911–924. [Google Scholar] [CrossRef]
  11. Hwang, F.S.; Confrey, T.; Reidy, C.; Picovici, D.; Callaghan, d.; Culliton, d.; Nolan, C. Review on battery thermal management system for electric vehicles. Renew. Sustain. Energy Rev. 2024, 192, 114171. [Google Scholar] [CrossRef]
  12. Jiang, Z.Q.; Yang, Y.C.; Qiu, H.H. A novel battery thermal management system utilizing ultrathin thermal ground planes for prismatic Lithium-ion batteries. Appl. Therm. Eng. 2023, 231, 120869. [Google Scholar] [CrossRef]
  13. Shen, J.B.; Wang, Y.P.; Yu, G.Z.; Li, H.G. Thermal Management of Prismatic Lithium-Ion Battery with Minichannel Cold Plate. J. Energy Eng. 2019, 146, 1943–7897. [Google Scholar] [CrossRef]
  14. Li, W.H.; Wang, X.; Cen, P.; Chen, Q.; Cordeiro, I.; Kong, L.; Lin, P.; Li, A. A Comparative Numerical Study of Lithium-Ion Batteries with Air-Cooling Systems towards Thermal Safety. Fire 2024, 7, 29. [Google Scholar] [CrossRef]
  15. Han, C.L.; Cheng, Y.J.; Wang, Z.R.; Zheng, Y.Y. A study on the cooling characteristics of radiator for battery hot spots based on temperature hydrogel adaptive valve. J. Energy Storage 2024, 102, 114107. [Google Scholar] [CrossRef]
  16. Kim, J.; Oh, J.; Lee, H. Review on battery thermal management system for electric vehicles. Appl. Therm. Eng. 2019, 149, 192–212. [Google Scholar] [CrossRef]
  17. Cacua, K.; Buitrago-Sierra, R.; Herrera, B.; Pabon, E.; Sohel-Murshed, S. Nanofluids’ stability effects on the thermal performance of heat pipes: A critical review. J. Therm. Anal. Calorim. 2019, 136, 1597–1614. [Google Scholar] [CrossRef]
  18. Jiaqiang, E.; Yue, M.; Chen, J.; Zhu, H.; Deng, Y.; Zhu, Y.; Zhang, F.; Wen, M.; Zhang, B.; Kang, S. Effects of the different air cooling strategies on cooling performance of a lithium-ion battery module with baffle. Appl. Therm. Eng. 2018, 144, 231–241. [Google Scholar] [CrossRef]
  19. Shen, X.Y.; Cai, T.A.; He, C.M.; Yang, Y.; Chen, M. Thermal analysis of modified Z-shaped air-cooled battery thermal management system for electric vehicles. J. Energy Storage 2023, 58, 106356. [Google Scholar] [CrossRef]
  20. Ren, D.S.; Feng, X.L.; Lu, L.G.; Ouyang, M.G.; Zheng, S.Q.; Li, J.Q.; He, X.M. An electrochemical-thermal coupled overcharge-to-thermal-runaway model for lithium ion battery. J. Power Sources 2017, 364, 328–340. [Google Scholar] [CrossRef]
  21. Wang, H.T.; Tao, T.; Xu, J.; Shi, H.; Mei, X.S.; Guo, P.A. Thermal performance of a liquid-immersed battery thermal management system for lithium-ion pouch batteries. J. Energy Storage 2022, 46, 103835. [Google Scholar] [CrossRef]
  22. Chen, D.F.; Jiang, J.C.; Kim, G.H.; Yang, C.B.; Pesaran, A. Comparison of different cooling methods for lithium ion battery cells. Appl. Therm. Eng. 2016, 94, 846–854. [Google Scholar] [CrossRef]
  23. Ping, P.; Zhang, Y.; Kong, D.P.; Du, J. Investigation on battery thermal management system combining phase changed material and liquid cooling considering non-uniform heat generation of battery. J. Energy Storage 2021, 36, 102448. [Google Scholar] [CrossRef]
  24. Wiriyasart, S.; Hommalee, C.; Sirikasemsuk, S.; Prurapark, R.; Naphon, P. Thermal management system with nanofluids for electric vehicle battery cooling modules. Case Stud. Therm. Eng. 2020, 18, 100583. [Google Scholar] [CrossRef]
  25. Rao, Z.H.; Wang, S.F. A review of power battery thermal energy management. Renew. Sustain. Energy Rev. 2011, 15, 4554–4571. [Google Scholar] [CrossRef]
  26. Jaguemont, J.; Boulon, L.; Dubé, Y. A comprehensive review of lithium-ion batteries used in hybrid and electric vehicles at cold temperatures. Appl. Energy 2016, 164, 99–114. [Google Scholar] [CrossRef]
  27. Ran, Y.; Su, Y.F.; Chen, L.; Yan, K.; Yang, C.X.; Zhao, Y. Investigation on thermal performance of water-cooled Li-ion cell and module with tree-shaped channel cold plate. Energy Storage 2022, 50, 104040. [Google Scholar] [CrossRef]
  28. Chen, X.C.; Yan, S.T.; Wang, D.; Han, J.Q.; Guang, Z.R.; Yin, Y.H.; Yang, S.T.; Dong, H.Y. A novel bionic lotus leaf channel liquid cooling plate for enhanced thermal management of lithium-ion batteries. Int. J. Heat Mass Transf. 2025, 236, 126246. [Google Scholar] [CrossRef]
  29. Liu, F.F.; Chen, Y.Y.; Qin, W.; Li, J. Optimal design of liquid cooling structure with bionic leaf vein branch channel for power battery. Appl. Therm. Eng. 2023, 218, 119283. [Google Scholar] [CrossRef]
  30. Liu, N.; Jiang, Y.M.; Liu, X.J.; Sun, Z.; Huang, J.B. Thermal performance analysis and structure optimization of bionic shark skin channel liquid cooling plate for lithium ion battery. Appl. Therm. Eng. 2025, 279, 127683. [Google Scholar] [CrossRef]
  31. Liang, L.; Zhao, Y.H.; Diao, Y.H.; Ren, R.Y.; Zhu, T.T.; Li, Y. Experimental investigation of preheating performance of lithium-ion battery modules in electric vehicles enhanced by bending flat micro heat pipe array. Appl. Energy 2023, 337, 120896. [Google Scholar] [CrossRef]
  32. Behi, H.; Behi, M.; Karimi, D.; Jaguemont, J.; Ghanbarpour, M.; Behnia, M.; Berecibar, M.; Van-Mierlo, J. Heat pipe air-cooled thermal management system for lithium-ion batteries: High power applications. Appl. Therm. Eng. 2021, 183, 116240. [Google Scholar] [CrossRef]
  33. Chen, K.; Hou, J.S.; Song, M.X.; Wang, S.F.; Wu, W.; Zhang, Y.L. Design of battery thermal management system based on phase change material and heat pipe. Appl. Therm. Eng. 2021, 188, 116665. [Google Scholar] [CrossRef]
  34. Zhang, D.; Li, G.; Liu, Y.Q.; Tian, X.L. Simulation and experimental studies of R134a flow condensation characteristics in a pump-assisted separate heat pipe. Int. J. Heat Mass Transf. 2018, 126, 1020–1030. [Google Scholar] [CrossRef]
  35. Ambrose, J.H.; Feild, A.R.; Holmes, H.R. A pumped heat pipe cold plate for high-flux applications. Exp. Therm. Fluid Sci. 1995, 10, 156–162. [Google Scholar] [CrossRef]
  36. Salvatore, V.; Valeria, P.; Davide, L.R.; Bonanno, A. Experimental assessment and numerical study of a pump-assisted loop heat pipe for high capacity thermal systems. Appl. Therm. Eng. 2020, 180, 115828. [Google Scholar] [CrossRef]
  37. Vachhani, M.; Sagar, K.R.; Patel, V.M.; Mehta, H. Novel integration of dual evaporator loop heat pipe for improved electric vehicle battery thermal regulation. Appl. Therm. Eng. 2024, 236, 121832. [Google Scholar] [CrossRef]
  38. Bivens, D.B.; Yokozeki, A. Heat transfer coefficient and transfer properties for alternative refrigerants. In Proceedings of the 1994 International Refrigeration Conference at Purdue, West Lafayette, IN, USA, 19–22 July 1994; pp. 299–304. [Google Scholar]
  39. Zhou, F.; Zhou, W.; Qiu, Q.F.; Yu, W.; Chu, X.Y. Investigation of fluid flow and heat transfer characteristics of parallel flow double-layer microchannel heat exchanger. Appl. Therm. Eng. 2018, 137, 616–631. [Google Scholar] [CrossRef]
  40. Chen, S.P.; Xu, P.; Shi, J.; Sheng, L.S.; Han, C.L.; Chen, Z.Q. Experimental study of a pump-driven microchannel-separated heat pipe system. Sustainability 2023, 15, 16839. [Google Scholar] [CrossRef]
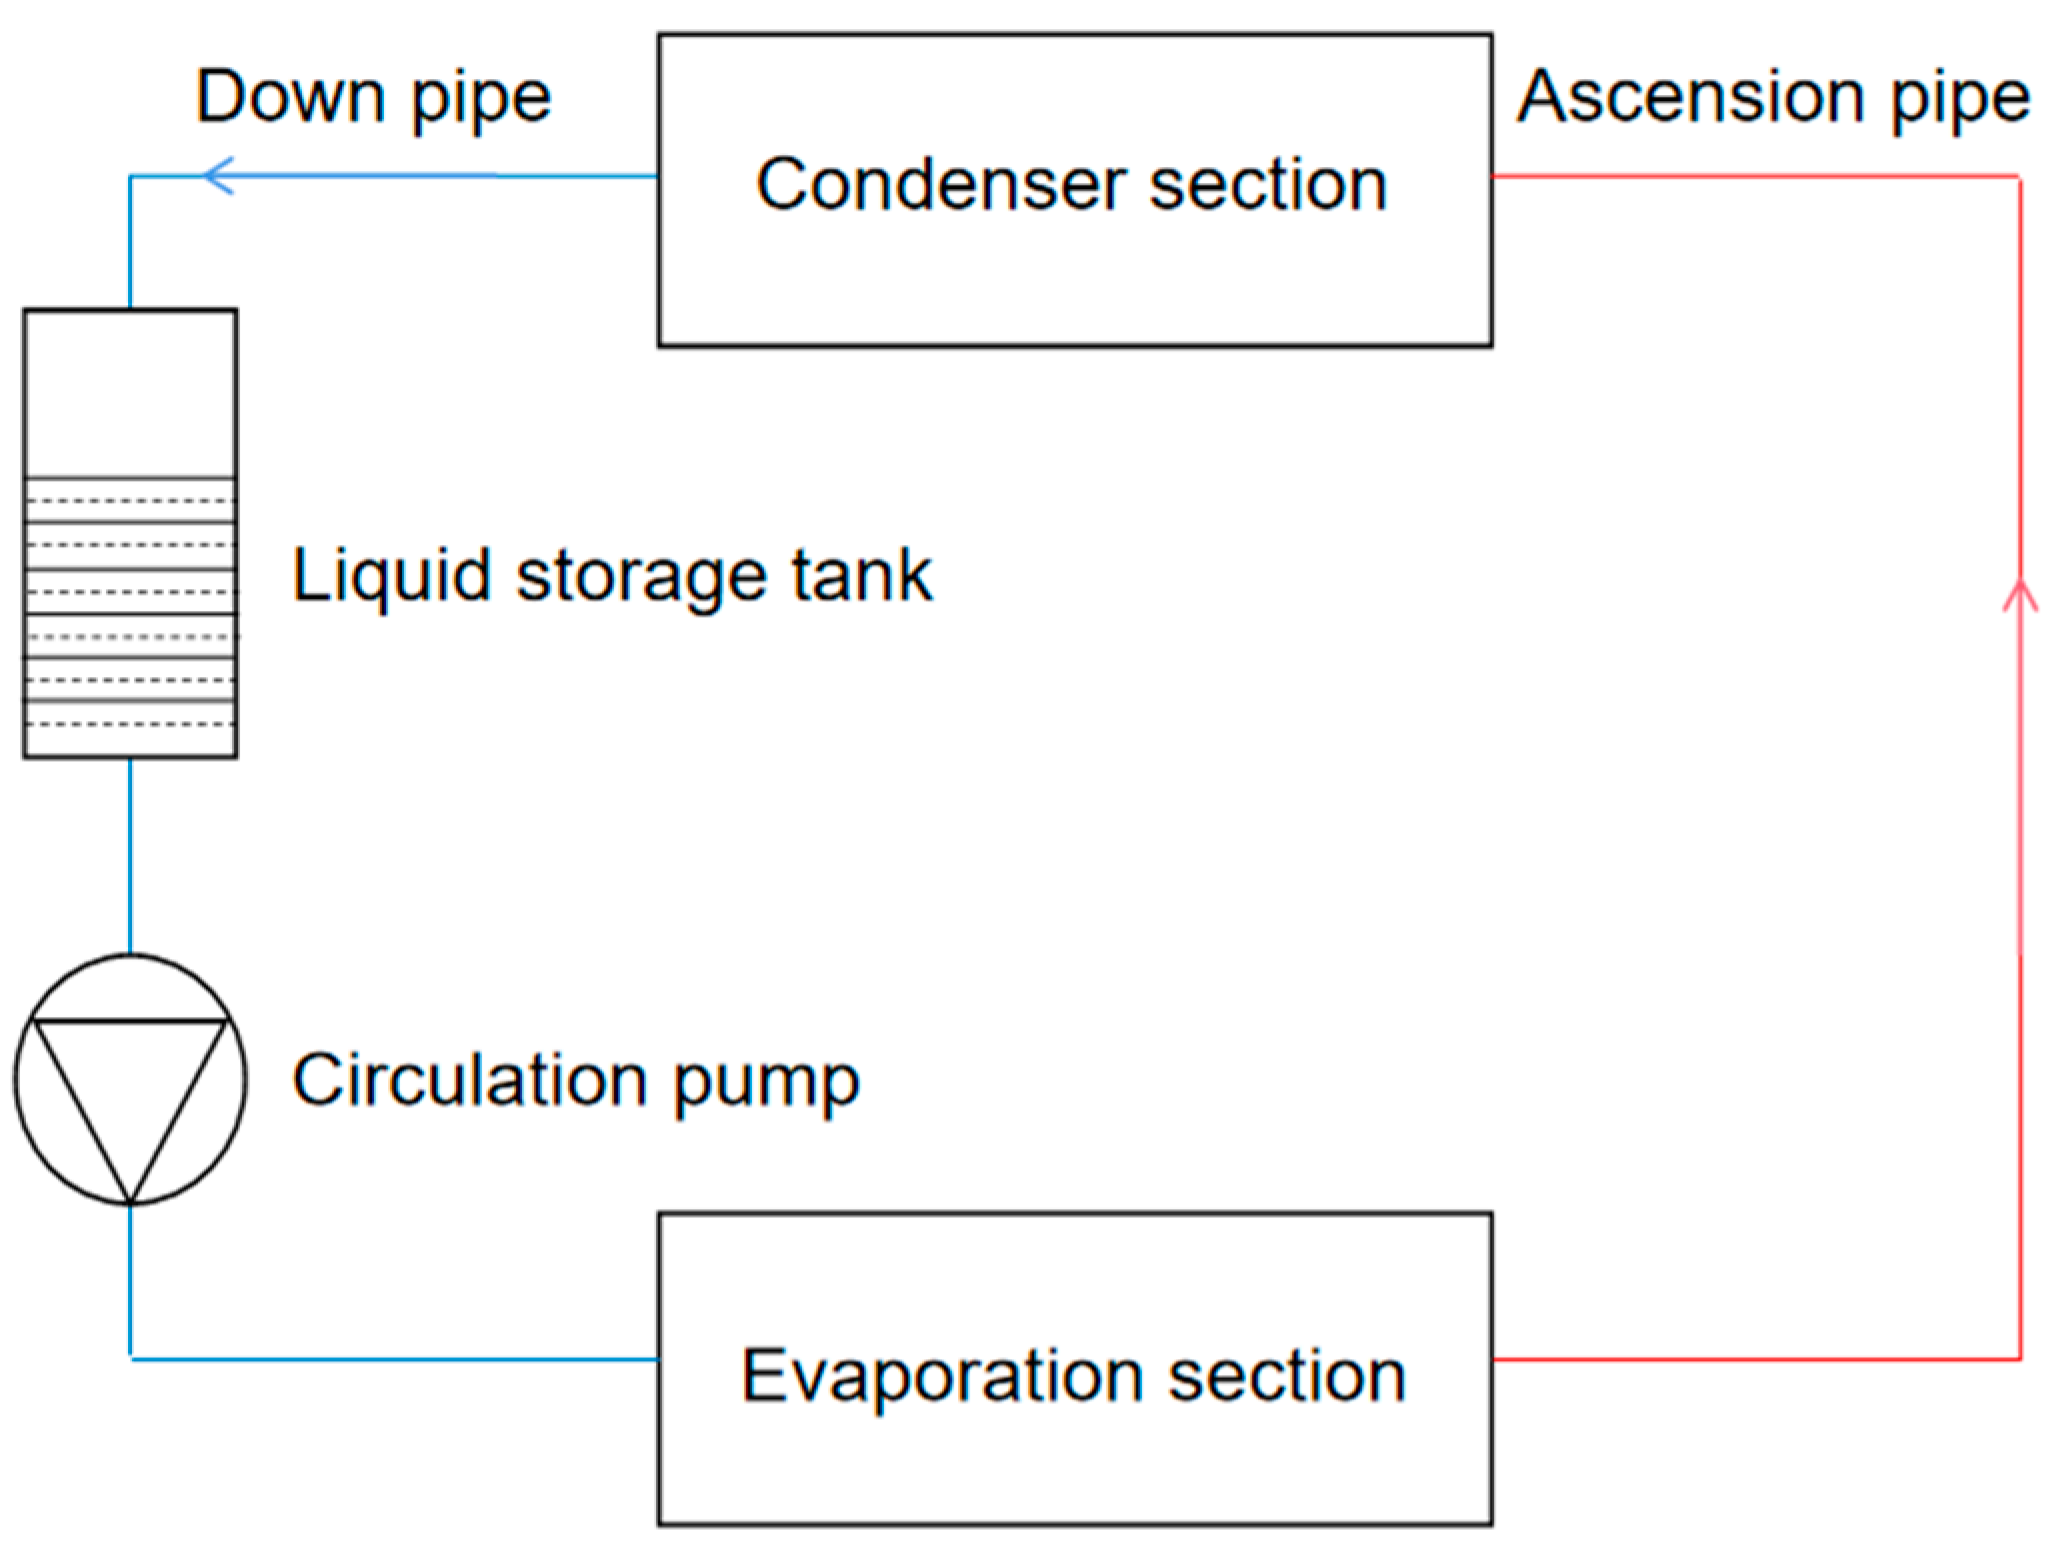
Figure 1. Schematic diagram of pump-driven separated heat pipe.
Energies 18 05882 g001
Figure 2. Diagram of temperature difference correction coefficient ψ for primary cross flow.
Energies 18 05882 g002
Figure 3. Performance curve of centrifugal pump corresponding to flow and lift.
Energies 18 05882 g003
Figure 4. Performance curve of centrifugal pump flow vs. efficiency.
Energies 18 05882 g004
Figure 5. Calculated values of evaporator heat transfer and refrigerant side pressure drop for each number of micro-meshes.
Energies 18 05882 g005
Figure 6. Relative error between calculation and experiment [40] in heat transfer quantity of evaporator under different liquid filling rate.
Energies 18 05882 g006
Figure 7. Relative error between calculation and experiment [40] in evaporator outlet pressure under different liquid filling ratio.
Energies 18 05882 g007
Figure 8. Dryness and temperature of evaporator flat tube refrigerant under filling rate of 43%.
Energies 18 05882 g008
Figure 9. Dryness and temperature of evaporator flat tube refrigerant under filling rate of 64.1%.
Energies 18 05882 g009
Figure 10. Dryness and temperature of evaporator flat tube refrigerant under filling rate of 87.9%.
Energies 18 05882 g010
Figure 11. Dryness and temperature of evaporator flat tube refrigerant under filling rate of 119.5%.
Energies 18 05882 g011
Figure 12. Change in heat transfer coefficient on refrigerant side of evaporator with tube length.
Energies 18 05882 g012
Figure 13. Change in total heat transfer coefficient of evaporator with tube length.
Energies 18 05882 g013
Figure 14. Change in refrigerant side heat transfer coefficient with tube length of condenser.
Energies 18 05882 g014
Figure 15. Diagram of total heat transfer coefficient of condenser varying with tube length.
Energies 18 05882 g015
Figure 16. Change in heat transfer quantity and evaporator outlet air temperature with indoor and outdoor temperature difference.
Energies 18 05882 g016
Figure 17. Variation in refrigerant temperature and pressure at evaporator outlet with indoor and outdoor temperature difference.
Energies 18 05882 g017
Table 1. Initial parameters for calculation procedure.
ParametersValueParametersValue
Inlet pressure (MPa)0.01Inlet enthalpy (kJ/kg)0.1
Inlet temperature of evaporator (°C)55Inlet temperature of condenser (°C)25
Inlet flow rate of evaporator (m3/h)2500Inlet flow rate of condenser (m3/h)3000
Filling rate (%)50Mass flow rate in heat pipe (kg/s)0.01
Heat pipe diameter (mm)16Heat pipe length (mm)4000
Disclaimer/Publisher’s Note: The statements, opinions and data contained in all publications are solely those of the individual author(s) and contributor(s) and not of MDPI and/or the editor(s). MDPI and/or the editor(s) disclaim responsibility for any injury to people or property resulting from any ideas, methods, instructions or products referred to in the content.