Abstract
This paper explores how the deployment of “High-Performance Heat-Powered Heat Pumps” (HP3s)—a novel heating technology—could help meet the domestic heating demand in the UK and reduce how much grid-scale energy storage is needed in comparison to a scenario where electrical heat pumps fully supply the heating demand. HP3 systems can produce electricity, which can partially alleviate the stress caused by electrical heat pumps. A parametric analysis focusing on two variables, the penetration of HP3 systems (H) and the amount of electricity exported (Ɛ), is presented. For every combination of H and Ɛ, the electricity system is optimized to minimize the cost of electricity. Three parameters define the electricity system: the generation mix, the energy storage mix and the amount of over-generation. The cost of electricity is at its highest when electrical heat pumps supply all demand. This reduces as the penetration of HP3 systems increases due to a reduction in the need for energy storage. When HP3 systems supply 100% of the heating demand, the total cost of electricity and the storage capacity needed are 6% and 50% lower, respectively, compared to a scenario where electrical heat pumps are in 100% of residences.
1. Background
Currently, approximately 23 million UK homes are supplied by the gas network and use natural gas boilers during winter to keep warm [1,2]. About 17% of the carbon dioxide emissions of the country are attributed to space heating [3,4,5]. In order to achieve Net Zero, we must transform the way we keep our living spaces warm.
The electrification of heat via heat pumps is deemed as one of the main routes to decarbonize space heating [6,7]. The efficiency of heat pumps is significantly higher than that of natural gas boilers (or H2) as they can deliver around three times as much energy as they consume.
Presently, less than one percent of the country’s house stock has a heat pump installed [8,9]. However, the government plans to boost adoption as a key component of its strategy to phase out gas boilers over the next decade [10,11]. The transition to electric heating will increase peak load on electricity, creating substantial new challenges.
Space heating demand has two well-defined peaks: one during the morning, as people wake up and get ready, and another one in the evening, when people return from work [12]. Electricity demand follows a similar pattern. The mean gas consumption per day during the colder months of the year is more than four times greater than the electricity consumption. Furthermore, the peak in gas usage during the early hours of the day exceeds the electricity demand peak by a factor of ~10 [13].
Flexible heating (i.e., demand-side management) as well as thermal storage and lagging can decrease heat demand peaks [12,14]. Nonetheless, electrifying heat will place a considerable additional load (and stress) on the electricity grid. Without significant upgrades and reinforcements, the existing electricity system cannot provide enough power to support electrifying domestic space heating.
The UK’s National Infrastructure Commission estimates that approx. GBP 50 bn of investment could be required to ensure the distribution network can support the Net Zero transition, including the electrification of heat [15]. The national grid has already unveiled a GBP 35bn upgrade plan for the next 5 years to reduce constraining renewables and increase grid resilience for the future [16,17]. The total investment required could be much higher than this.
Energy storage is considered key to increasing the penetration of renewables [18,19,20,21]. Even if space heating is not electrified, the UK will need a significant energy storage capacity to decarbonize its electricity grid [22,23]. However, the electrification of space heating will increase demand peaks and create steeper ramps, making energy storage much more important.
Several researchers have reported that the peak hourly electricity demand in the country could increase by 50 to 70 GW (80 to 110% of current levels) due to the electrification of space heating [24,25,26]. Additionally, the ramps seen could be up to three times as steep as what is currently experienced [26,27].
In a previous study, Cardenas et al. [28] considered a fully renewable electricity system for the UK and estimated that a storage capacity as high as 175 TWh could be needed if electrical heat pumps entirely supply the country’s demand for domestic heat. This is significantly larger than the ~80 TWh needed in a scenario where the electricity grid does not handle the demand for heat [29]. The vast majority will be provided by underground hydrogen caverns [30,31,32]. These figures align with the outlook published by the Royal Society [33,34].
The storage capacity cost of underground hydrogen caverns is cheaper than that of CAES by a factor of ~6 and cheaper than that of Li-ion batteries by a factor of ~200. At present, underground hydrogen storage is the only affordable technology to supply the very large storage capacity that will be necessary in a future entirely renewable system.
Besides the significant investment involved, timescales are another important challenge. Developing underground hydrogen caverns is time-consuming; an asset can take more than a decade to be fully operational [35,36]. Excluding fossil fuel reserves, the country’s energy storage capacity is almost null, and as mentioned, several tens of TWhs will be required. The country must grow its energy storage infrastructure rapidly to meet its ambitious 2035 and 2050 Net Zero targets.
In this work, we explore how the deployment of a nascent space heating technology, called “High-Performance Heat-Powered Heat Pumps” or HP3s for short [37], can contribute to the decarbonization of heat in the country. HP3 systems use hydrogen as a clean fuel and do not draw electricity from the grid. Therefore, as HP3 systems meet a greater portion of the heat demand, the peak load experienced by the electricity grid will reduce with respect to a scenario where 100% of UK homes have a conventional electrical heat pump.
This paper assesses the extent to which the above can help to lower how much grid-scale energy storage is needed and, in turn, reduce electricity costs. By reducing the magnitude of the energy storage challenge ahead of us, our chances of achieving Net Zero in time improve.
Novelty and Objectives
Previous work by the authors investigated the potential increase in the amount of grid-scale energy storage needed as the UK shifts towards a zero-carbon electricity system [29,38]. The authors also studied the effect of electrifying space heating and the relationship between the market share of electrical heat pumps and how much energy storage is needed [28]. The results of those studies show that a storage capacity of many tens of TWhs will be required. Although the resulting rise in total electricity costs is manageable, building the enormous storage capacity needed on the timescales available will prove challenging.
This study considers a scenario where electricity is 100% renewable and domestic heat demand has been fully decarbonized. This paper explores the potential system-level effect of supplying a fraction of the space heating demand in the country with a novel, zero-carbon heating technology powered by hydrogen (or another clean fuel) that can also produce a small amount of electricity. Handling a fraction of the domestic heat demand with a non-electrical heating solution will not only reduce the average electricity demand but also the peak load seen by the grid. Potentially, this can significantly reduce the storage capacity required.
This paper has two overarching objectives: (1) to offer a perspective on the system-level challenges created by the shift toward electric household heating and (2) to show how deploying new technologies can help to reduce the challenges ahead, which will accelerate our transition to clean, sustainable heating and improve our chances of achieving Net Zero on time.
Several scenarios based on different ‘market shares’ of electrical heat pumps and HP3 systems are evaluated. For each scenario, different combinations of renewables, different over-generation percentages and different energy storage provisions are explored to minimize the total cost of electricity. This study uses twelve years of UK data on renewable power generation and electricity consumption, together with modeling tools developed for previous work.
The methodology presented here can be used to study other territories. In some European countries, residential buildings will not have access to hydrogen in the future. In such cases, the methods presented here allow for (i) quantifying the amount of grid-scale energy storage needed in relation to the adoption of electrical heat pumps and (ii) assessing the potential system-level benefit of meeting the demand for space heating via district heating networks powered by HP3 systems or other non-electrical technologies.
2. High-Performance Heat-Powered Heat Pumps (HP3s)
This section introduces a new technology for zero-carbon heating called “High-Performance, Heat-Powered Heat-Pumps”. From now on, we will use the acronym HP3 to refer to these systems. This technology is at an early R&D stage (TRL level 2–3) and is not commercially available yet. This paper aims to assess the effect that the deployment of HP3 systems could have on the UK electricity grid.
A fleet of HP3 systems installed across a fraction of UK homes will help to flatten the country’s electricity demand in two ways: (1) by reducing the number of electrical heat pumps installed and (2) by exporting some electricity to the grid during peak times. The total amount of grid-scale energy storage capacity needed can be reduced by flattening the profile of electricity usage. In turn, this can lead to cheaper electricity.
A heat-powered heat pump combines the best attributes of direct heating from hydrogen combustion and electrically driven heat-pumping. These thermo-mechanical systems blend a heat engine and a heat pump, providing a vast amount of low-grade heat for space heating and consuming only a small quantity of high-grade heat from the combustion of hydrogen or another clean fuel. These systems benefit from the same ‘heat multiplication effect’ of heat pumps. Therefore, for a given heat output, HP3 systems consume less hydrogen compared to simpler hydrogen boilers.
The widespread utilization of HP3 systems will enable the gas network to continue to supply the enormous energy demand during winter by delivering hydrogen to homes across the country. It will also exploit the possibility of using underground caverns to store large amounts of hydrogen as a seasonal energy reserve. If most properties installed and used electrical heat pumps, an overwhelmingly large additional load would be placed on the electricity network. The use of HP3 systems avoids straining the grid.
Figure 1 shows how an HP3 achieves its heat multiplication effect. When a heat engine section takes in 1 unit of high-grade heat, it produces units of mechanical work and delivers units of low-grade heat into a house. The units of work drive the heat-pump, which draws in units of heat from the ambient and delivers a total of units of low-grade heat into the house. Here, is a design variable and represents the heat pumps’ performance coefficient (CoP). Typical CoP values are between 1 and 4. The difference with a ‘normal’ heat pump is that the input energy is heat and not electricity.
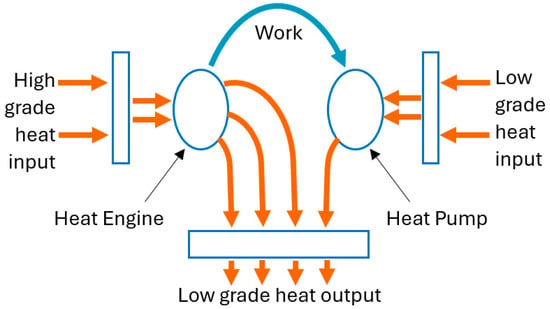
Figure 1.
Block diagram of a heat-powered heat pump.
There are many possible ways to implement an HP3 system. Figure 2 shows one possible arrangement. Here, both subsystems share a common working fluid and a common heat output device. In the heat engine section, the working fluid at high pressure flows into a heat collector, where it receives high-grade heat from the combustion of hydrogen and boils. The gas then produces mechanical work in an expander. Subsequently, the gas enters the heat output device where it condenses, giving away most of its heat content to provide space heating.
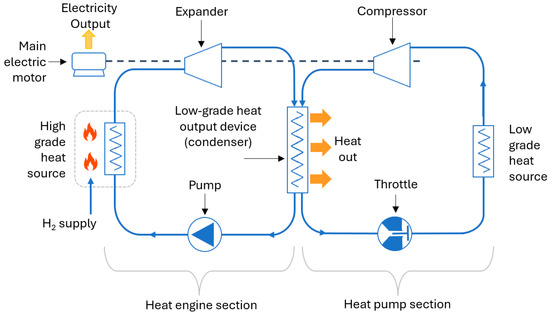
Figure 2.
A possible configuration for a heat-powered heat pump (HP3).
The expander’s work output drives the heat pump’s compressor. The way this part of the system operates is the same as a conventional heat pump; the difference is that the compressor is driven mechanically.
It can be seen in Figure 2 that the compressor and the expander are mechanically coupled via a shaft to the main electrical motor of the system. This motor allows the expander’s work output to be different from the power that the compressor consumes. Therefore, the design of an HP3 system is a continuum between a pure heat pump and a pure heat engine.
There is a strong motivation for designing the system to be ‘more heat engine’. This enables the generation of electricity at the expense of a smaller low-grade heat output. During cold spells in the UK, houses where an HP3 is installed will naturally use it to the fullest. The net effect would be that those houses would (i) not draw grid electricity for the purpose of space heating and (ii) produce some extra electricity that can either be self-consumed or exported to the grid. This reduces the stress on the electricity grid caused by other homes using electrically driven heat pumps.
An HP3 system could be regarded as a type of combined heat and power (CHP) system if it were designed to be ‘more heat engine’, as suggested above. The main difference between the proposed systems and existing micro-CHP plants is the heat pump cycle, which enhances the low-grade thermal output of the system.
In the heat engine section, the work fluid can reach temperatures of approximately 650 °C after collecting high-grade heat from the combustion of hydrogen (or another clean fuel). Although this may seem high for a domestic system, current natural gas boilers see temperatures in excess of 1000 °C inside the combustion chamber [39,40]. The difference is that in a gas boiler, hot water is produced directly, and its temperature is not allowed to exceed ~70 °C. In an HP3 system, the working fluid is allowed to reach much higher temperatures, but the hot water output will still be under the safe limit. Therefore, implementing an HP3 system in a domestic setting is feasible. It should be noted that HP3 systems could also be implemented at a larger scale (e.g., district heat networks [41,42]) where a central multi-MW system can combust hydrogen, produce hot water and deliver it to several dwellings.
This paper is not concerned with the technical aspects of the design of HP3 systems. As mentioned, the objective is to assess the grid-level effect of their widespread utilization in the country. A separate study showed that HP3 systems can achieve CoPs > 2.5 at ambient temperatures of −10 °C using propane (R290) as the working fluid and hydrogen as a fuel [37]. In the case of an HP3 system, the CoP (when there is no electricity output) is simply calculated as the ratio between the thermal output and the thermal input. Because these systems do not draw electricity from the grid, the CoP is not relevant to the analyses carried out in this paper and does not influence the results. Naturally, a lower CoP would have other implications at a national level, such as a greater demand for hydrogen during the colder months.
It has also been found that an electricity output of more than 50% of the system’s heat output is not sensible from a performance standpoint. In this paper, we use this value as the upper limit for the amount of electricity that an HP3 system can generate. For comparison, some micro-CHP systems can provide an electricity output equivalent to between 18 and 40% of their thermal output. This electricity output is produced in parallel to the heat output, which is the primary service [43].
3. Modeling the Electricity Grid
3.1. Data on Electricity Consumption and Generation
Figure 3 shows a 12-year time series of UK electricity demand sourced from the ‘Balancing Mechanism Reporting Service’ [44]. The resolution of the data is 1 h. The time series is normalized and adjusted so that the mean yearly demand matches current consumption (~335 TWh) [45]. The grid sees a mean load of approximately 35 GW, peaking at around 60 GW. The 12 years of demand data cover some extreme weather conditions in the UK, such as the ‘Beast from the East’ event in 2018. However, in this paper, we avoid making predictions of future changes in demand due to varying weather conditions.
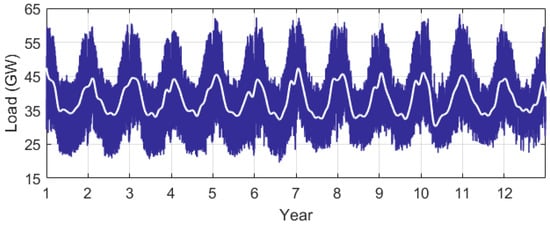
Figure 3.
Normalized and adjusted UK electricity demand profile. Mean yearly demand of 335 TWh [44,46].
Figure 4A shows a 12-year time series of wind power in the UK [44,46]. The profile is normalized to account for an expansion in the installed capacity. Wind has large daily, seasonal and inter-annual variations [44,47,48]. Figure 4B shows a time series of solar photovoltaic power generation in the UK [49]. Solar PV shows a more marked seasonal variation compared to wind.
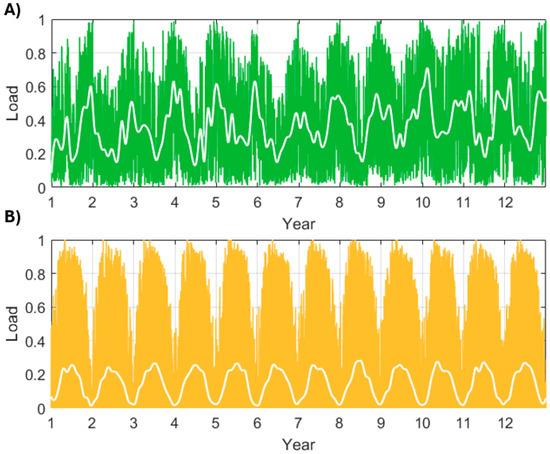
Figure 4.
Normalized profiles of (A) wind power and (B) solar PV power in the UK.
Using a time series as long as possible is key. Analyses based on a short time span tend to underestimate how much energy storage capacity is needed because they do not fully account for the year-to-year variability in renewables [38,50].
3.2. Domestic Demand for Space Heating
Data relating to the residential gas consumption in the UK was obtained from a 2021 study carried out by the University College London [51]. On average, a dwelling will consume 12.4 MWh of gas per year [52]. The hourly gas demand of a property changes with respect to the month of the year, as Figure 5 shows. There are two main peaks, one around 8:00 and another around 18:00. The heating season (Oct-Apr) sees more pronounced peaks. Figure 5 also shows that overnight demand is low throughout the year.
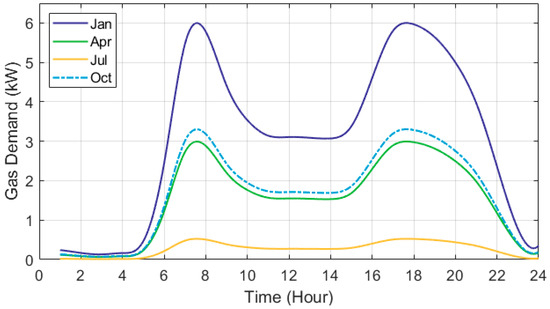
Figure 5.
Hourly gas demand of the average UK home with respect to the month of the year.
The profile of residential gas demand can easily be converted to a profile of heat demand by applying a gas boiler’s thermal efficiency (~90%). Subsequently, the heat demand time series can be transformed into a ‘space heating electricity demand’ profile by factoring in a heat pump performance coefficient. Here, we calculate the CoP by means of M. Chesser’s empirical equation [53], using hourly data on the UK mean ambient temperature [49]
Air-source heat pumps with a 45 °C output [48] can attain seasonal CoPs of approximately 2.9. Ground-source heat pumps (GSHPs) achieve seasonal CoPs up to 4.5 [54]. However, GSHPs are not considered as a viable option for existing properties in the UK because their high installation costs overshadow the increased efficiencies. Considering that nearly 80% of the 2050 UK house stock already exists [55,56], we only focus on air-source heat pumps.
Figure 6 shows the heat demand profile of the average home in the UK and the electricity consumed by an air-source heat pump to supply that amount of heat. As mentioned, this profile of heat demand is created by multiplying gas usage data of the average UK home [51] by a boiler’s thermal efficiency (~90%). The curve of a heat pump’s electricity usage is simply created by dividing the heat demand profile by the heat pump’s performance coefficient [53]. For visual clarity, the curves only show the highest value for each day; however, there are hourly and sub-hourly variations, and demand is close to zero during the night.
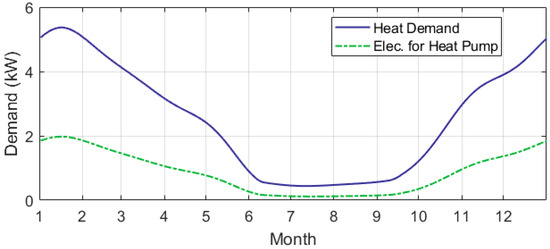
Figure 6.
Heat demand and electricity used by a heat pump for an average UK home.
To correctly account for the year-to-year variability in renewable generation (particularly wind), this study uses 12 years of generation data. A profile of ‘space heating electricity demand’ of the same length is required. In this case, it is assumed that the yearly profile shown in Figure 6 (green dashed line) repeats over the twelve years.
Figure 7 shows the overall electricity demand profile that would be seen in the country if domestic space heating were fully supplied by electrical heat pumps. In this scenario, the mean yearly demand reaches a total of 423 TWh, which is a 26% increase over the current value. Other researchers have reported similar estimates [24,25,26].
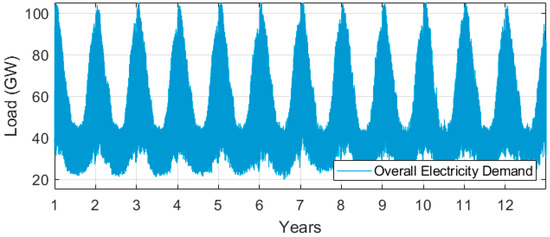
Figure 7.
Country-wide electricity usage once space heating is fully supplied by heat pumps.
We can also see in Figure 5 that demand would peak at around 108 GW, which is ~45 GW (~70%) higher than the current maximum load. Studies carried out by other researchers have found similar conclusions. S.D Watson et al. estimated that the maximum load seen by the electricity system could be 113 to 132 GW [26]. M. Zhang et al. mentioned that the maximum load could be 39–50 GW higher due to the electrification of space heating [25]. C. Whalen estimated that the additional load could be in the range of 65–70 GW [24].
3.3. Methodology
This study analyzes the potential effect, at a system level, of deploying heat-powered heat pumps (HP3 systems) in the country. We carry out a combinatorial exploration based on two variables: the share of households using HP3 systems (H) and the electricity export fraction of those systems (Ɛ). Ɛ is a fraction of the heat output of an HP3 system and varies between 0 and 0.5
For each combination of H and Ɛ, we need to find the optimum configuration for the electricity system. This allows calculating the energy storage capacity needed and the electricity cost and then assessing whether a greater proportion of HP3 systems or a greater electricity export reaction can offer a benefit at a system level.
The electricity system is characterized by three main parameters, namely, the generation mix (R), the quantity of allowable over-generation (Ω) and the combination of different energy stores (X).
- The generation mix (R) represents the wind power’s share of the total energy generated. This ratio has a range between 0 and 1. Solar PV’s share is simply 1 − R.
- Renewable over-generation (Ω) is a percentage of all electricity consumed. This over-generated energy is curtailed to reduce the amount of energy storage needed. Besides the economic benefit of reducing the need for storage, having some over-generation is desirable from a redundancy and reliability standpoint. This over-generation is separate from another amount of ‘extra’ energy that renewables produce to offset storage losses.
- The mix between energy stores (X) is a ratio between 0 and 1. Let us consider that E is the sum of all the energy that must be stored throughout the period analyzed. X represents the fraction of E that will pass through the medium-duration energy store (CAES). The fraction of E that is stored in the long-duration store (H2 caverns) is simply 1 − X.
For each different combination of H and Ɛ, the optimal values of R, X and Ω are determined.
The medium-duration energy storage role is represented by CAES in this paper. However, other thermo-mechanical technologies, such as pumped heat storage [57,58], liquid air storage [59,60] and redox flow batteries [61,62,63], are also well suited for this role. Other studies have also used CAES to represent the medium-duration energy storage role [28,29,33,64]. Schmidt et al. [65] showed that pumped hydro and CAES are the most cost-effective technologies in the medium-duration range (4–200 h of discharge) between 2020 and 2040.
Long-duration energy storage is represented in this study by underground hydrogen caverns. Given the quantities of energy involved, this role is only possible through the storage of synthesized fuels, and hydrogen is the most feasible option. In future renewable-based energy systems, medium- and long-duration energy stores will provide the vast majority of the storage capacity needed [66].
The two different storage technologies considered (CAES and H2) offer different advantages. Therefore, mixing them can minimize the overall electricity cost. Storing hydrogen in underground caverns is very cheap per unit capacity. However, its power cost is high because the electrolyzers used remain expensive to this day. Therefore, hydrogen caverns are ideal for the role of long-duration storage, in which an immense amount of energy is stored, but the store is filled and emptied at a slow rate.
CAES is more expensive in terms of storage capacity, but it offers lower power costs and higher roundtrip efficiencies. Therefore, CAES systems are highly suitable for the role of medium-duration storage, in which the amount of energy to be stored is moderate but the stores are charged and discharged more often and at a faster rate.
Pumped hydro is also very well suited for medium-duration storage. It is significantly more efficient and considerably cheaper per unit capacity than CAES. However, it is constrained to very specific geographical locations, much more than CAES and underground H2 [67]. Therefore, its scope to contribute in a significant way to the future UK total storage capacity is limited.
The calculations carried out do not include Li-ion batteries (i.e., short-duration storage) because analyzing their role entails using data with a resolution of <5 min. The full factorial experiment proposed comprises five variables (H, Ɛ, R, X and Ω), which translates into a large number of combinations to be evaluated. Exploring this space using fine-resolution data is extremely computationally expensive and simply not possible. Nevertheless, batteries will be instrumental in future zero-carbon electricity networks. They offer very high roundtrip efficiencies and fast response times, which are needed to handle short-duration imbalances.
Previous work by the authors indicated that Li-ion batteries will contribute between 0.2 and 0.5 TWh of capacity to the electricity system. By comparison, the combined contribution of medium- and long-duration stores is several tens of TWh [29]. Not including batteries in the analyses does not significantly affect the trends presented further in Section 4.1 and Section 4.2. The main research objective can still be explored, which is whether the deployment of heat-powered heat pumps could reduce the amount of grid-scale energy storage needed. However, once batteries are included in the mix, the total costs per MWh of electricity could increase by ~6 GBP/MWh due to the capacity costs of batteries being much higher than those of underground hydrogen caverns or CAES systems [68,69,70].
3.3.1. Creating Different Profiles of Demand
Every ‘case’ or combination of H and Ɛ will have a different profile of overall electricity demand. This subsection explains how this profile is created.
This study considers a scenario in which domestic space heating has been completely decarbonized. There are no more natural gas boilers, and the ~23 × 106 residential properties in the country have installed a zero-carbon heating alternative, such as an electrically driven air-source heat pump or an HP3 system that uses hydrogen as fuel.
The variable H indicates what fraction of the 23 million households use HP3 systems. The fraction of homes using more conventional air-source heat pumps is given by 1 − H. When H equals 0, it means that 100% of homes are using electrical heat pumps, and HP3 systems have not been installed in any property. Conversely, when H equals 1, it means that HP3 systems have been adopted in 100% of households, and electrical heat pumps are not used anywhere in the country.
Figure 6 shows the electricity usage of an air-source heat pump installed in an average UK residence. This profile is created by combining heat demand data [51] with empirical CoP data for a heat pump operating in the UK [53]. A time series of ‘national electricity usage for space heating’ is created by multiplying the time series shown in Figure 6 by the fraction of the 23 million households using electrical heat pumps (1 − H) [1,71].
As mentioned, an HP3 system can produce some electricity while operating. This electricity can be exported to the grid or used for self-consumption. The amount of electricity that a system produces is given as a fraction of the thermal output of the unit. An HP3 system has the same thermal output as a heat pump; this is given by the household’s heat demand. The electricity export profile of a property using an HP3 system is simply the profile of heat demand (shown in Figure 6) multiplied by the export fraction (Ɛ). A separate study revealed that export fractions higher than 0.5 significantly reduce the coefficient of performance of an HP3 system. Therefore, in this paper, we fixed the upper limit for Ɛ at 0.5.
The country-wide profile of electricity export from HP3 systems is created by simply multiplying the export profile of one household by the fraction of the 23 million properties using HP3 systems, given by H.
The overall profile of electricity consumption in the country results from adding together the profile of ‘normal’ electricity usage (see Figure 3) and the profile of additional demand created by heat pumps and subtracting the electricity exports from HP3 systems.
Figure 8 illustrates how different combinations of H and Ɛ modify the overall profile of electricity demand. In Figure 8A, we can see the case where HP3 systems are being used in 100% of homes, but these systems do not export any electricity (Ɛ = 0). In this case, the profile of electricity demand is unmodified and is equivalent to the current situation in which natural gas boilers supply heat demand.
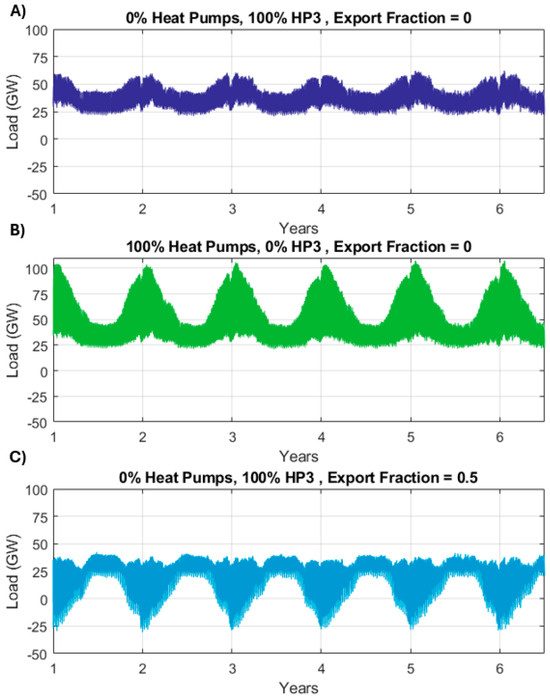
Figure 8.
Effect of different combinations of H and Ɛ on the electricity demand profile. Scenarios: (A) 100% HP3 but 0% export. (B) 100% heat pumps and 0% export. (C) 100% HP3 and 50% export.
Figure 8B shows the case where there are no HP3 systems installed and electrically driven heat pumps are used in 100% of homes. In this case, the annual electricity demand increases by ~26% compared to normal demand (of uses other than space heating), but the peaks can be up to 70% higher.
Lastly, Figure 8C shows a scenario where 100% of homes use HP3 systems and these units export 50% of their heat output in the form of electricity (Ɛ = 0.5). We can see that demand becomes negative in this case. This is because demand is ‘low’ because there are no heat pumps, and the fleet of HP3 systems exports a considerable amount of electricity to the grid at times when it is not needed.
3.3.2. Determining Optimum System Parameters for a Specific Scenario
As mentioned, for each combination of H and Ɛ, we must determine the optimum system configuration. This allows for determining the storage capacity needed and the total cost of electricity (GBP/MWh) for every scenario. In turn, this allows for understanding how different HP3 penetration levels and export fractions can help to reduce the TCoE compared to a scenario in which electrical heat pumps wholly meet the demand for space heating.
The algorithm and tools used to model the different scenarios are taken from the authors’ previous work [28,29,38]. In this section, we describe the process followed; however, the publications mentioned provide a more detailed explanation of how the different calculation and optimization tools work.
Figure 9 shows the algorithm used to find the optimum values of the system parameters (R, Ω and X) for a specific scenario given by H and Ɛ.
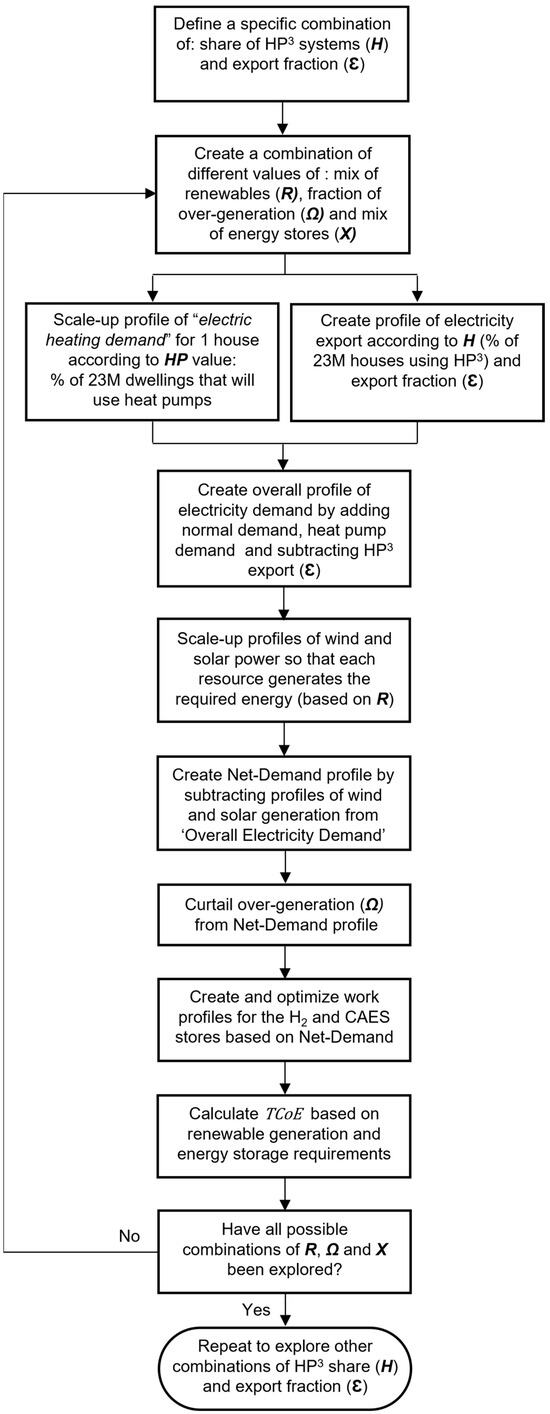
Figure 9.
Algorithm to find the optimal system configuration parameters for a specific scenario (H and Ɛ).
The electricity is treated as a single node. An energy balance is carried out to determine the storage capacity that a fully renewable system needs.
The normalized profiles of the renewable resources (see Figure 4) are scaled up to the correct level. This is a function of demand and over-generation, but also of the mix of energy stores. Renewables produce enough electricity to cover demand and some excess quantity specified by Ω. Renewables generate an additional amount to offset storage losses. This extra generation for ‘loss compensation’ changes the shape of net demand (demand take away generation), which, in turn, modifies how much energy passes through storage and how much energy is lost. Therefore, determining the correct amount of renewable generation is an iterative calculation.
Equation (2) allows for the calculation of how much renewable generation is required (). Here, is electricity demand throughout the 12 years studied, considering the additional demand due to heat pumps and HP3 exports. Energy losses due to storage are denoted by L. These take an initial value of 0.
The time series of wind and solar photovoltaic power are scaled so that their combined output meets . The contribution of wind is given by R, while the solar PV’s share is given by .
The net demand time series () is formed by subtracting renewable generation from electricity demand. The negative portion of the series comprises all the ‘excess’ energy that will either be stored or curtailed (). The positive part of the series consists of the energy that is discharged to meet demand ().
The loop-based calculation for the amount of generation ends, as shown in Equation (3), when the energy put into storage times the net storage efficiency is equal to the energy returned.
At this point, still contains the over-generated energy, which needs to be curtailed. This involves using a modeling tool (implemented in MATLAB R.2021) that simulates the operation of a single, central energy store as it moves through the time series of net demand. The capacity of this store is calculated so that (1) demand is always fully met and (2) the quantity of energy curtailed from matches Ω. The tool for time-marching through the series has been used in previous work and is described in detail in [29,72].
After curtailment, the net demand time series is separated into two profiles, which are the duty cycles for the long- (H2) and medium-duration (CAES) stores. The energy that will be stored in CAES over the period analyzed (negative part of work profile), corresponds to . The energy that will be stored in hydrogen caverns corresponds to .
The tools used to create and optimize the medium- and long-duration duty cycles have been used in previous research [28,29]. These references provide a comprehensive explanation of how the tools work.
A time series of net demand and the two work profiles created from it is shown in Figure 10. It should be mentioned that the sum of the two individual work cycles does replicate exactly. In this example, CAES and underground hydrogen caverns each handle 50% of all the energy that requires storage.
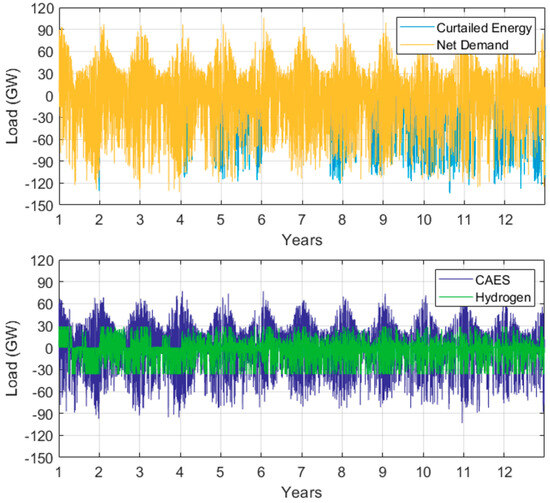
Figure 10.
Net demand time series split into two work cycles: CAES and hydrogen caverns.
The capacity () of each energy store is given by the integral of the duty cycle. The rated charging power (Pc) of a store is the lowest negative value of the work cycle, while the discharge power (Pd) is the maximum of the work profile.
At this point, the ‘total cost of electricity’ (TCoE) of a specific scenario can be calculated. For every scenario defined by H and Ɛ, we need to evaluate several different system configurations (combinations of R, Ω and X). The optimal configuration for a specific scenario is that which minimizes TCoE.
3.3.3. Calculating the Total Cost of Electricity (TCoE)
The TCoE accounts for the expenses associated with producing and storing electricity. It is calculated as shown in Equation (4):
where and are costs of all the energy produced from wind and solar PV, respectively. is the sum of all electricity consumed through the full period studied. and are the energy stores’ capital costs. The calculation of the cost of electricity only accounts for a fraction of the stores’ life (λ), which is proportional to the 12-year period (). Typically, these types of stores offer a service life of ~3 decades. Operational and maintenance costs (OpEx) are not taken into consideration in this calculation for several reasons: (1) they will be small compared to CapEx, and (2) given that these are new technologies not widely deployed yet, there is little information on maintenance costs, and the available data offers low confidence levels. The authors consider that including said costs would add ‘noise’ to the results. Other studies on the cost of energy storage for the electricity grid also exclude OpEx [28,29,38,64].
The cost of all wind and solar PV electricity can be determined through Equations (5) and (6), where LCoE is the levelized cost of MWh of electricity produced (GBP/MWh) by the specific resource.
The energy stores’ capital costs ( and ) consist of an energy cost relating to the provision to store energy (e.g., an underground salt cavern) and a power cost, relating to equipment used to fill and empty the stores. Both costs are independent of each other. A store’s capital cost (CapEx) is determined via Equation (7). Here, the storage capacity cost (per kWh) is denoted by , while the costs of the charging and discharging machinery (per kW) are given by β and γ, respectively,
This paper considers CAES and underground hydrogen caverns as example technologies for the medium- and long-duration storage roles, respectively. These technologies are regarded by both academics and the UK government as some of the most promising alternatives to accomplish the very large amount of storage that the country will need as it moves towards an entirely renewable electricity system [73,74].
A summary of the economic and performance figures used to calculate the TCoE is provided in Table 1. Levelized costs of renewable generation consider current costs in the UK. Power and storage capacity costs for hydrogen and CAES consider forecast costs for 2030–2035. These figures are in general agreement with values used in [33].

Table 1.
Values of parameters involved in the calculation of the electricity costs (TCoE).
4. Findings and Discussion
4.1. Heat Demand Fully Met by Electrical Heat Pumps
Two scenarios are analyzed and compared here: (i) one where 100% of homes use electrical air-source heat pumps and (ii) another where there are no heat pumps and the existing gas network meets the heating demand. HP3 systems are not considered here; therefore, there are no electricity exports. In both scenarios, the electricity system is entirely based on renewables.
This comparison helps to explain the impact of using electricity to heat residential buildings and how the TCoE is affected by the different system parameters (R, X and Ω). This section creates a reference line to assess the potential system-level benefit of supplying a fraction of the domestic space heating demand with HP3 systems, which can also export some electricity to the grid.
Figure 11 shows the electricity costs achieved through various system parameters. The plot presents two sets of curves, one for the scenario with 0% electrical heat pumps (blue) and one for the scenario with a 100% heat pump adoption (green). For each scenario, two wind shares are shown, 85% and 95%. Solar PVF produces the remainder of the energy. The cost of electricity increases as household heating shifts towards electricity, mainly due to a greater need for grid-scale energy storage. A more detailed discussion is provided further on.
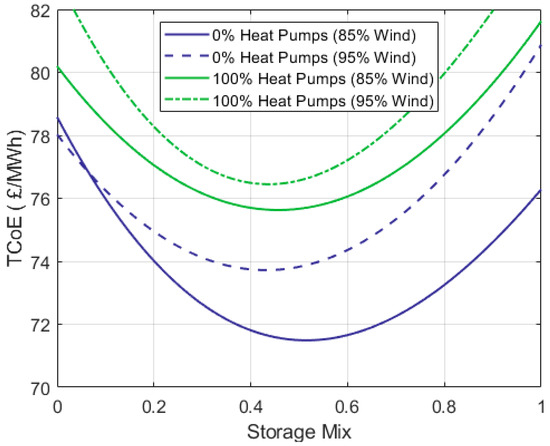
Figure 11.
Effect of the market share of electrical heat pumps, the generation mix (R) and the combination of energy stores (X) on the TCoE.
We can also see that as the market share of electrical heat pumps expands, the optimum generation mix relies more heavily on wind power. When space heating demand is not met by electricity, a wind and solar mix of 85/15% minimizes the TCoE. As the adoption of electrical heat pumps approaches 100%, electricity demand becomes much peakier in colder months (see Figure 7 and Figure 8B). Wind resembles this behavior, so it is logical for its contribution to the energy mix to increase. However, due to its pronounced inter-annual variability, relying entirely on it would increase the system’s requirement for grid-scale energy storage and the TCoE.
Figure 11 shows that using a mix of energy stores minimizes the TCoE because their specific attributes can be better exploited. The full storage duty can be handled with a single technology. However, H2 caverns have low roundtrip efficiency and high-power costs. Therefore, using this technology to provide all the storage capacity required (X = 0) will result in an elevated TCoE. On the other hand, the cost per kWh of storage capacity of CAES is higher than that of underground H2 caverns. Therefore, meeting the full storage requirement only with CAES (X = 1) also results in more expensive electricity costs.
It is also important to mention that Ω is not constant. All the curves in Figure 11 consider the optimal quantity of over-generation for every set of R and X values. As mentioned, this reduces the disparity between demand and generation profiles, and, in turn, it reduces how much storage is needed. For all given values of R and X, several levels of over-generation were assessed to find that which minimizes the TCoE.
When no electrical heat pumps are installed, the minimum TCoE is 71.49 GBP/MWh. This considers an X = 0.51 and an R = 0.85. Here, the amount of storage capacity needed is at a minimum. Increasing the contribution of solar PV beyond 15% (i.e., R < 85%) increases the TCoE because the seasonal behavior of solar PV does not match the trend of electricity demand. Increasing the contribution of wind beyond 85% also results in higher electricity costs. Wind power’s inter-annual variability calls for a greater energy storage capacity. When heat pumps supply the entire demand for space heating, the optimum R is 0.95 and the optimum value for X is 0.46. The electrification of space heating increases the cost of electricity by ~4.1 GBP/MWh. Although this increase may be affordable, it brings an important challenge in the form of the large storage capacity that is needed.
As previously discussed, the TCoE comprises energy generation, energy storage and power conversion costs. Section 4.1.1, Section 4.1.2 and Section 4.1.3 explain how the various system parameters (R, X and Ω) impact said cost-driving factors.
4.1.1. Additional Components of Generation
When domestic space heating is met by some means other than heat pumps (e.g., the gas network), 4020 TWh of electricity is consumed throughout the 12-year period, equating to a mean demand of 335 TWh per year. When heat pumps supply the entire demand for space heating, the mean annual demand increases by 26%. In both cases, renewables generate a ‘baseload’ equal to the total demand.
However, renewable generation has two additional components: (1) over-generation and (2) storage losses compensation. Both vary with respect to X. Renewable generation will be high enough so that after storage losses, demand can still be fully met. Underground hydrogen caverns have a lower roundtrip efficiency than CAES. Therefore, storage losses increase as the ratio X reduces (see Figure 12).
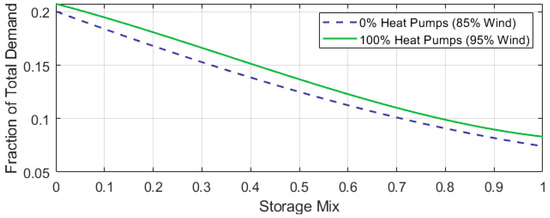
Figure 12.
Energy losses (given as a fraction of electricity demand), with respect to the mix of energy stores (X) and the market share of electrical heat pumps.
We can also see in Figure 12 that energy losses increase as more heat pumps are installed. As mentioned, electricity demand becomes increasingly peaky as heat pumps supply a greater share of the space heating demand. This increases not only the amount of storage capacity needed but also how much energy passes through those stores.
Energy losses represent approximately 20% of the total electricity demand when X = 0, while for X = 1, losses are equivalent to about 8% of total demand
Figure 12 only considers the generation mix that minimizes the TCoE for each of the two heat pump penetrations presented. Different shares of wind and solar would increase the mismatch between demand and generation. This would not only call for a greater storage capacity, but more energy would pass through storage, causing greater losses.
The third component of renewable generation is the over-generation (Ω). This additional generation helps to reduce the amount of energy storage needed. There is an optimum value for Ω within the range of X. As X moves away from zero, Ω increases. This is because hydrogen storage is cheaper than CAES; therefore, spending more on generation to reduce storage capacity is beneficial. Moreover, at small values of X, there is substantial ‘extra’ energy in the system to balance the greater losses caused by passing more energy through the less efficient hydrogen caverns. This leaves little scope for any over-generation beyond that.
The optimal percentage of over-generation (i.e., curtailment) goes from 12% to 20% of the total electricity demand depending on the penetration level of heat pumps and the values of R and X. If energy storage capacity were more expensive or generation were cheaper, the system would shift towards greater amounts of over-generation.
4.1.2. Energy Storage Capacity
Figure 13 illustrates the relationship between the amount of energy storage needed, the fraction of heat demand supplied by heat pumps and the mix of stores (X). Figure 13C shows the total energy storage capacity needed, which is equal to the capacities provided by CAES and underground H2 caverns added together. More storage capacity is needed as the market share of heat pumps increases. In turn, this leads to higher electricity costs.
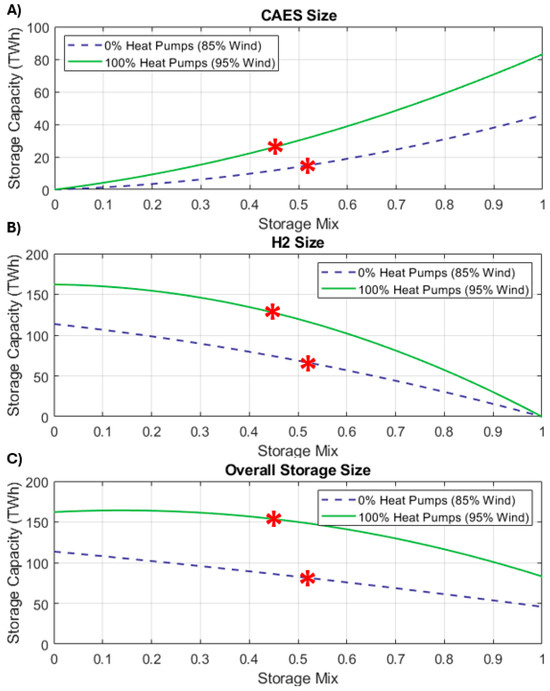
Figure 13.
Storage capacities supplied by (A) CAES and (B) H2 with respect to heat pump share and ratio X. (C) Total storage capacity needed by the system. The red stars in the figures show the storage capacities at the value of (X) that minimizes the total cost of electricity.
Let us consider a scenario without any heat pumps. When hydrogen caverns handle all the storage duty (X = 0), approximately 114 TWh of storage capacity is needed. When CAES handle all the storage duty (X = 1), approximately 46 TWh of storage capacity is needed. These values agree with published figures [29]; the differences stem from the longer datasets used for the present study. At the optimum X for each heat pump penetration level (shown by a star), the electricity system needs 82 TWh of storage. Underground hydrogen caverns contribute 67.6 TWh. The other 14.4 TWh are supplied by CAES systems.
The reason why the amount of storage capacity needed changes so dramatically with respect to X is the markedly different roundtrip efficiencies of the two technologies. CAES systems attain efficiencies of up to 70% [83,84]. At best, hydrogen storage can offer an electricity-to-electricity efficiency of 45% [76]. This considers the efficiency of electrolysis (~80%) and the efficiency of the turbines used to generate electricity (~55%) [77].
The electricity system requires a much greater storage capacity when heat pumps fully supply the space heating demand in the country. At the point where the TCoE is minimized (R = 0.95, X = 0.46), the electricity system needs 153 TWh. The capacities provided by underground H2 caverns and CAES systems account for 82% and 18% of the total needed, respectively.
The storage capacities presented here should be deemed as estimates of the energy storage capacity that will be needed as the country shifts towards a zero-carbon electricity supply. They depend on whether domestic demand for space heating is supplied by electrical heat pumps or a non-electric alternative such as hydrogen boilers (or HP3 systems).
A simplification made in this paper is that the energy storage capacity is realized as two large stores: one underground cavern for H2 and one CAES system. However, in practice, several small, distributed energy stores will provide the total storage capacity that the grid needs.
In the UK, large-scale deployment of either CAES or underground hydrogen caverns has not yet occurred. Nevertheless, at present, hydrogen remains the only viable option for the very large-scale long-duration storage role, as highlighted by the Royal Society [33,73]. Hydrogen storage is central to the UK’s decarbonization strategy [74,91].
A significant challenge linked to underground hydrogen storage is the lengthy process required to establish a fully operational reservoir. The stages of site assessment, planning, permits, development and commissioning can span up to a decade [92]. Therefore, the UK must begin expanding its H2 storage capacity now to achieve its 2035 decarbonization goals.
One major reason for the limited rollout of underground caverns for storing H2 is the lack of robust business models and regulatory frameworks to minimize financial risks. Developers currently face considerable uncertainty regarding the future need for hydrogen storage, the type and location of infrastructure required and the potential role it will play in ensuring energy security and resilience [92].
The UK government issued an initial report setting out its stance [74]. The business model considers safeguards for developers and operators against risks associated with low sales prices and reduced sales volumes. Since these are viewed as key investment barriers, the government intends to address them by introducing a minimum revenue guarantee. This measure aims to provide developers with the confidence needed to make timely final investment decisions on strategically important storage projects.
Several researchers have warned of a possible market failure that could hinder the UK’s ability to install the required hydrogen storage in the available timeframe. In short, without timely intervention, the UK will fall short of scaling up long-duration storage to match demand. Any delay in establishing this crucial infrastructure could jeopardize the nation’s Net Zero objective [92].
4.1.3. Charging and Discharging Powers
The machinery used for putting/extracting energy from the stores accounts for a significant portion of the capex of the energy stores. Electrolyzers are used to charge hydrogen caverns, while hydrogen-fired turbines are used to discharge the caverns and produce electricity [93,94]. On the other hand, CAES systems are charged and discharged using air compressors and expanders. In the case of CAES, the charging equipment and discharging equipment are very similar to each other; therefore, their costs are also very similar.
Figure 14 shows the effect that changes in the heat pump market share and the mix of energy stores (X) have on CAES charging () and discharging () powers. The effect on the rated powers of the hydrogen stores is shown in Figure 15. The negative portion of the work profiles dictates the charging power of a store.
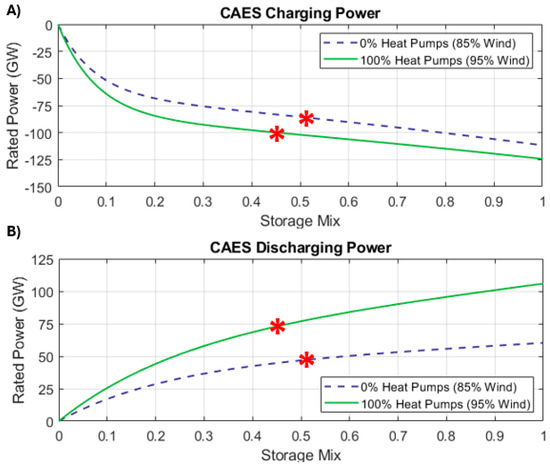
Figure 14.
Variation in CAES (A) charge and (B) discharge powers in relation to the market share of heat pumps and the storage duty distribution (X). The red stars in the figures show the rated powers at the value of (X) that minimizes the total cost of electricity.
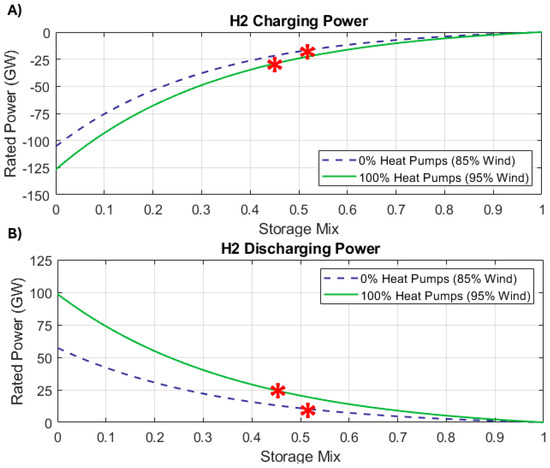
Figure 15.
Variation in hydrogen store (A) charge and (B) discharge powers in relation to the market share of heat pumps and the storage duty distribution (X). The red stars in the figures show the rated powers at the value of (X) that minimizes the total cost of electricity.
Figure 14 and Figure 15 show that a greater penetration of heat pumps causes an increase in the store’s rated powers, both charging and discharging. In general, the peak load in the grid increases as electrical heat pumps supply a larger portion of the demand for space heating. The profile of net demand will have more pronounced negative peaks because renewables produce more energy, which, in turn, leads to the energy stores having a greater rated charging power.
The discharge powers increase because the peak load in the grid is greater. Figure 16 shows two net demand profiles. It can be seen how the maximum and minimum values of the time series, as well as its ‘peakiness’, increase as heat demand is electrified. This leads to higher rated powers for the energy stores, both in charge and discharge.
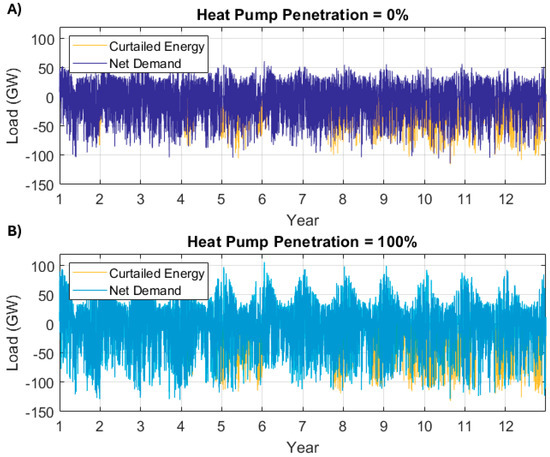
Figure 16.
Profiles of net electricity demand and penetration of heat pumps of (A) 0% and (B) 100%. The profiles consider the optimum system configuration for each scenario.
As the mix of energy stores (X) moves towards 1, more energy is sent to the CAES store. This increases its charging and discharging powers (see Figure 14). Conversely, the powers of the H2 store (charging/discharging) decrease as the mix of stores (X) tends to 1 (see Figure 15).
The electricity demand profile sets a limit for the discharge power of the stores. When space heating is not supplied electrically, the electricity grid sees a peak load of about 60 GW. In this case, the CAES and H2 stores will also have a peak discharge power of ~60 GW. When heat demand is wholly supplied by electrical heat pumps, the grid sees a peak load of ~108 GW. Both energy stores have a similar maximum discharge power.
Considering the optimum system configuration for the scenario when heat pumps fully supply heat demand (i.e., penetration of 100%), CAES has rated charging and discharging powers of −100.4 GW and 73.7 GW, respectively. On the other hand, the H2 store has a charging power of −28 GW and a discharge power of 23.7 GW.
Table 2 provides a summary of the best configurations found (i.e., lowest TCoE) for the scenarios based on heat pump penetrations of 0% and 100%.

Table 2.
Comparison between the minimum-cost system configurations for heat pump penetrations of 0% and 100%.
Section 4.1.1, Section 4.1.2 and Section 4.1.3 demonstrated how the need for energy storage, the stores’ (dis)charging powers and the losses owing to passing energy through storage increase as electrical heat pumps provide a greater fraction of the country’s space heating demand, therefore increasing the cost of electricity (see Figure 11).
4.1.4. Composition of the Total Cost of Electricity
Figure 17 separates the total cost of electricity into its different contributors. Figure 17A presents a scenario based on a heat pump penetration of 0%. Figure 17B shows a scenario where 100% of UK homes have installed an electrically driven heat pump. Both figures consider the optimum generation mix for the specific heat pump penetration level.
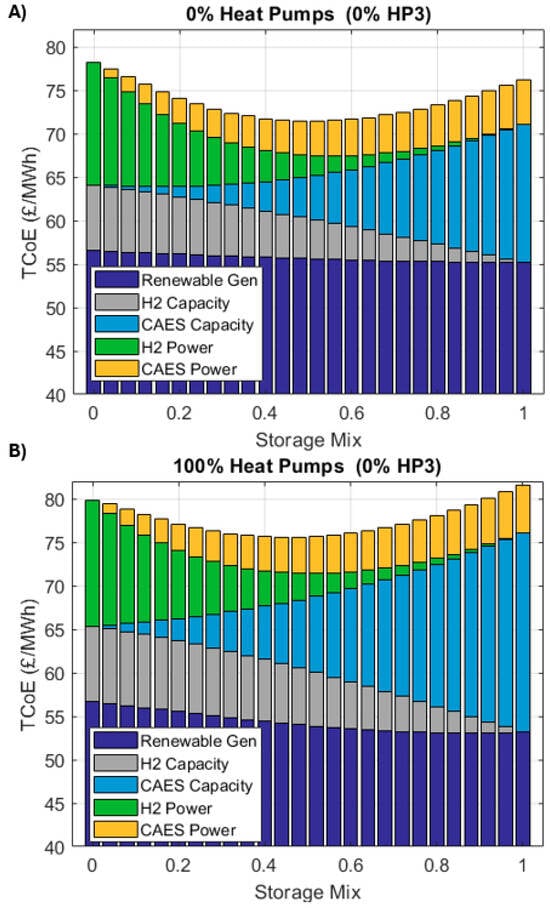
Figure 17.
Composition of the TCoE. Scenarios with heat pump penetrations of (A) 0% and (B) 100%. Each scenario assumes the optimum mix of renewables.
In both scenarios, renewable generation accounts for the majority of the TCoE. In the scenario with no heat pumps, renewable generation (including base generation, loss compensation and over-generation) accounts for between 72% and 77% of the TCoE, depending on the mix of energy stores (X). By comparison, when heat pumps have a penetration of 100%, generation costs are between 65 and 72% of the TCoE. Energy storage becomes more important for the system as more electricity is used to heat residential buildings.
In both scenarios (heat pump penetrations of 0% and 100%), hydrogen storage capacity represents 0 −10% of the TCoE, depending on the storage mix (X). The contribution of the CAES storage capacity does vary as the heat pump penetration changes. When the heat pump market share is 0%, CAES capacity accounts for between 0 and 21% of the TCoE, depending on the storage mix (X). In the scenario where heat pumps are in 100% of homes, CAES storage capacity contributes between 0 and 28% to the TCOE, depending on X.
Despite the heat pump market share, the energy storage capacity needed when underground hydrogen caverns handle the whole duty (X = 0) exceeds the capacity needed for X = 1 by a factor of >2 (see Figure 13). Notwithstanding, CAES has a higher cost per kWh and constitutes a greater fraction of the TCoE.
Independent of the adoption level of heat pumps, CAES power costs account for between 0 and 7% of the TCoE. Power costs of the hydrogen store contribute 0–18% to the TCoE. The machinery used to fill and empty the underground hydrogen stores costs more per KW than the equipment used to cycle CAES systems. Therefore, it makes up for a greater fraction of the TCoE.
The individual contributions of the different cost-influencing factors to the TCoE are summarized in Table 3. The table considers the optimum or lowest-cost system configuration for each heat pump penetration level.

Table 3.
Breakdown of the TCoE into individual contributions of different parameters. The table considers the optimum system configuration for both heat pump shares.
4.2. Different Penetrations of HP3 Systems
Section 4.1 discussed two scenarios: one where domestic space heating demand is met 100% by electrical heat pumps and another in which there are no heat pumps anywhere in the country. Here, the demand for space heating could either be met by natural gas boilers or by HP3 systems. However, in this case, those HP3 systems do not export any electricity. In both scenarios, all electricity comes from renewable sources. The discussion in Section 4.1 used the two scenarios mentioned to explain (i) the relationships between the different system parameters and (ii) why electricity becomes more expensive as a greater fraction of heat demand is electrified.
In this section, we analyze the potential system effect of supplying a fraction of the space heating demand with HP3 systems. As previously explained in Section 2, HP3 systems are heat-powered heat pumps that burn hydrogen (or another clean fuel) and do not draw electricity from the grid. In addition to that, HP3 systems can generate and export some electricity while they operate. This paper explores a combinatorial space defined by two variables: the fraction of space heating demand that is supplied by HP3 systems (H) and the ‘export fraction’ (Ɛ) of each one of those HP3 systems.
Figure 18 shows how the country’s mean annual electricity demand changes with respect to H and Ɛ. As mentioned, yearly electricity demand reaches 423 TWh when heat pumps fully supply space heating demand.
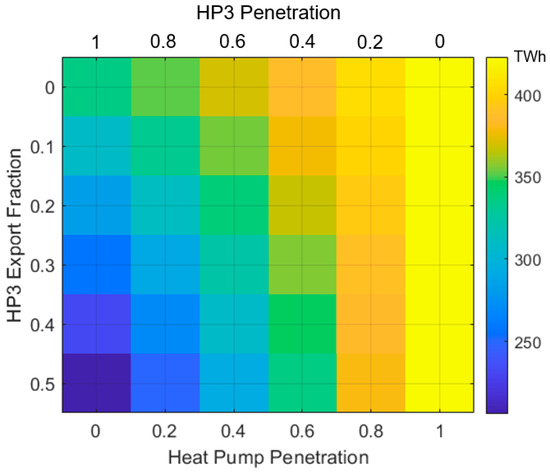
Figure 18.
Yearly electricity demand (TWh) in relation to the mix between heat pumps and HP3 systems and the electricity export fraction of the HP3 systems.
The mean yearly electricity demand reduces as the fraction of households that use HP3 systems instead of conventional heat pumps increases. We can also see from the figure that, for any given value of H, the overall electricity demand decreases as the export fraction of the HP3 systems increases. For example, when 40% of households have an HP3 system installed, but these systems do not produce and export electricity, the annual demand is 388 TWh. This reduces to 336 TWh if the fleet of HP3 systems has an export fraction of 50%.
In a scenario where domestic space heating demand is entirely met by HP3 systems, but these systems have an export fraction of 0%, electricity demand is 335 TWh. This scenario is equivalent to supplying heat demand through natural gas boilers. If the HP3 systems were able to export 50% of their heat output in the form of electricity, annual demand would significantly reduce to ~206 TWh.
The increase in the amount of energy consumed annually as a greater fraction of heat demand is electrified is not a particular concern for the electricity system. It simply entails expanding the country’s renewable generation capacity. However, in many cases, the changes in the profile of demand can be an important challenge. For example, electricity demand becomes markedly ‘peaky’ when electrical heat pumps solely supply the full demand for space heating. In this case, the power peaks during winter are about 1.7 times greater than what is currently seen. Furthermore, the ramp rates also increase considerably and can be up to 3× greater. This poses a significant challenge for the electricity system, and without substantial upgrades and reinforcements, it would not be able to provide the power levels that are required [95].
The crest factor is a way of measuring the peakiness of the profile of demand. The crest factor is a ratio that expresses how large the peaks of a profile are compared to its RMS value. Figure 19 shows the variation in the crest factor of the electricity demand profile in relation to the share of HP3 systems (H) and their export fraction (Ɛ). Here, the crest factor is calculated by taking the peak power of the electricity demand profile (i.e., max. demand) and dividing it by the average demand (rms value). As mentioned, the profiles throughout this study have an hourly resolution.
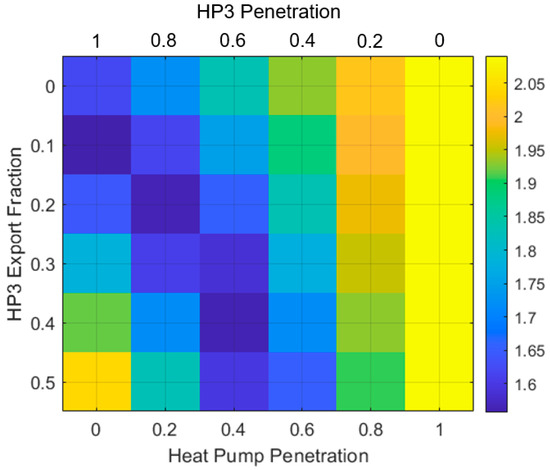
Figure 19.
Variation in the electricity demand profile’s crest factor with respect to the share of HP3 systems (H) and their export fraction (Ɛ).
The profile of demand reaches its maximum crest factor of 2.09 (i.e., it is the peakiest) when heat pumps provide 100% of the demand for space heating. When HP3 systems (or natural gas boilers) fully supply the demand for heat and there are no exports of electricity, the crest factor of the demand profile reduces to 1.62. Allowing HP3 systems to generate and export some electricity leads to further reductions in the crest factor. The minimum ‘peakiness’ is observed when HP3 systems handle 100% of the demand for space heating and they have an export fraction of 10%. In this case, the crest factor is 1.56.
Figure 20 considers a scenario where electrical heat pumps supply heat for 40% of UK homes while the remaining 60% of properties use HP3 systems. The different subplots show how the shape of the electricity demand profile is modified as the HP3 systems generate and export more electricity. When the 13.8 million HP3 units (60% of homes) do not export any electricity, the grid sees a peak load of about 80 GW. The peaks reduce as the export fraction increases because the electricity produced and exported by the HP3 systems is delivered at the same time that heat pumps work in the remaining 40% of homes.
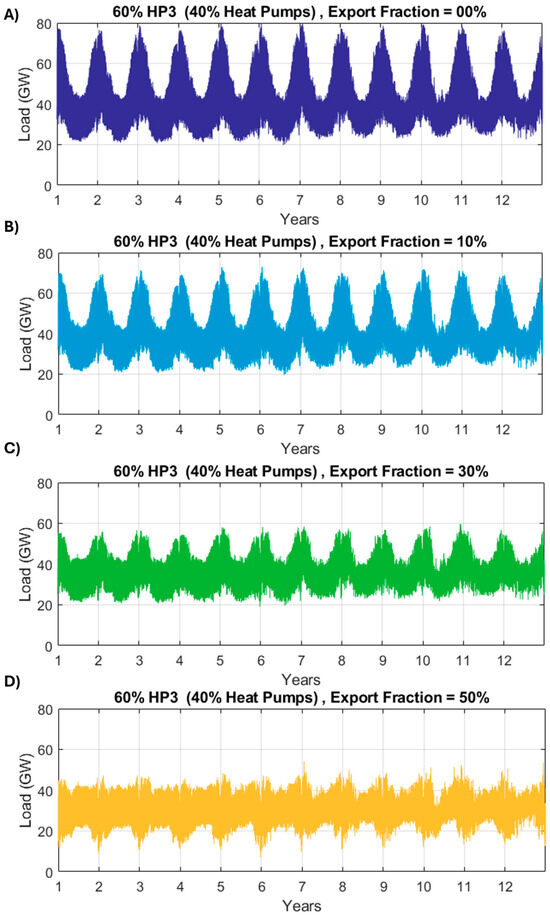
Figure 20.
Effect of different export fractions on the shape of electricity demand. A mix of 40% heat pumps and 60% HP3 systems is considered. (A) Export fraction = 0% (B) Export fraction = 10%, (C) Export fraction = 30%, (D) Export fraction = 50%.
When the electricity output of the HP3 systems is 50% of their heat output (i.e., Ɛ = 0.5), the peak load seen by the grid reduces to approximately 54 GW, which is lower than current levels, and the average annual demand reduces from 370 TWh (at Ɛ = 0%) to 293 TWh. It can also be seen in Figure 20 that increasing the export fraction significantly reduces the peakiness of electricity demand. For a heat pump share of 40%, the crest factor is 1.83 when the export fraction is 0, while it reduces to 1.59 when Ɛ = 0.5.
The significant change seen in the electricity demand profile as the export fraction increases will modify the optimal combination of system parameters (values of R, Ω and X will all vary). This will change how much energy storage is needed by the system, the power conversion costs of said energy storage provision and, ultimately, the TCoE.
Figure 21 shows the effect of the electricity export fraction of the HP3 systems (Ɛ) and the combination of energy stores (X) on the TCoE. Each subplot considers a different mix between heat pumps and HP3 systems (H). It should be noted that each curve considers the optimal generation mix and quantity of over-generation for the specific combination of H and Ɛ.
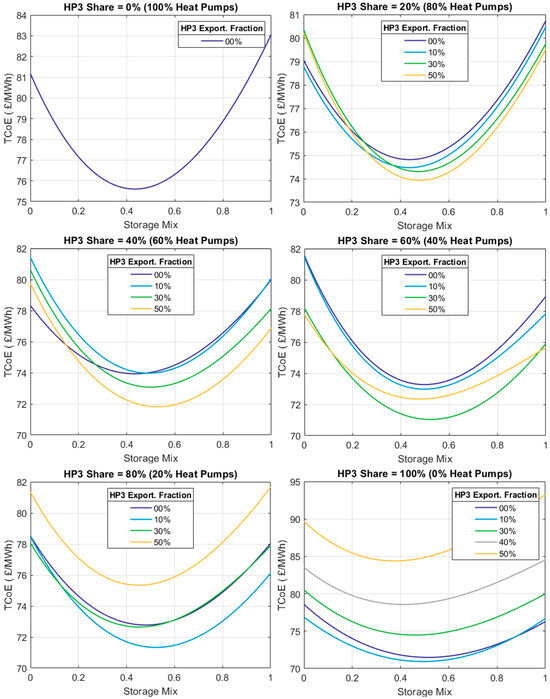
Figure 21.
Optimum system configuration for scenarios considering different mixes between electrical heat pumps and heat-powered heat pumps (HP3s).
Figure 21 demonstrates that an increased utilization of HP3 systems across the country and a reduced contribution of heat pumps to meeting the domestic heat demand will reduce the TCoE. Allowing HP3 systems to handle 100% of the domestic heat demand minimizes the cost of electricity.
The TCoE also varies as a function of the export fraction. The optimum export fraction varies for the different mixes of electrical heat pumps and HP3 systems. When the share of HP3 systems is small (≤40%), an export fraction of 0.5 minimizes the TCoE. In this case, electricity demand is high because of the large number of heat pumps installed. This allows the fleet of HP3 systems to export the maximum amount of electricity possible.
Greater exports could reduce the cost of electricity even further. However, a separate study found that from a system performance standpoint (relationship between Ɛ and CoP), 50% is a reasonable upper limit for the export fraction.
When the share of homes using HP3 systems is large (≥80%), the TCoE is minimized with an export fraction of only 10%. The reason for this is twofold. Electricity demand is low because not many heat pumps draw power from the grid, and a considerable amount of electricity is exported (even at a Ɛ = 0.1) due to the large amount of individual HP3 systems installed.
When the share of HP3 systems is large, export fractions greater than 0.1 will result in negative peaks in demand of significant magnitude because the electricity produced is exported at times when it is not needed. The negative demand peaks cause the crest factor and the amount of energy storage needed to increase. This causes a higher TCoE.
The electricity cost reduces as fewer properties use electrical heat pumps (i.e., larger H values) because HP3 systems help to flatten demand in two distinct ways: (1) by not drawing electricity from the grid and (2) by putting some power into the grid at peak times. The combined effect of this is that a smaller energy storage capacity is required, which translates into cheaper electricity.
Figure 22 simplifies the information previously shown in Figure 21; only the curve that contains the lowest possible TCoE for each value of H is plotted. The different curves consider the optimum export fraction for the particular mix of heat pumps and HP3 systems. We can clearly see that the cost of electricity reduces as HP3 systems handle a greater share of the space heating demand.
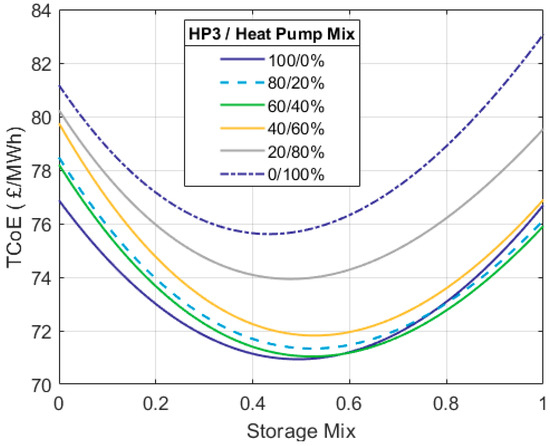
Figure 22.
Comparison between the ‘lowest-cost’ curves for the different mixes between heat pumps and HP3 systems.
In the scenario where 100% of UK homes use HP3 systems (H = 1), the lowest TCoE achieved is 70.93 GBP/MWh when the HP3 systems have an export fraction of 0.1. Here, wind contributes 90% to the energy mix, and the ratio X has a value of 0.49 (H2 and CAES have almost the same duty). For comparison, when there are no HP3 systems and electrical heat pumps wholly meet the demand for space heating (H = 0), the minimum TCoE is 75.6 GBP/MWh. Here, 95% of all energy produced comes from wind, and the mix of stores (X) reduces slightly to 0.46 (i.e., a shift towards more H2).
Looking at the lowest cost system configuration for the various HP3 penetration levels shown in Figure 22, the over-generation in the system ranges between 12 and 21% of the overall electricity demand.
Figure 23 shows—through a colormap—how the TCoE varies in relation to the share of HP3 systems (H) and their export fraction (Ɛ). The cost per MWh shown for each combination of H and Ɛ considers optimal values of R, X and Ω for that specific scenario. The colourmap is an easy-to-understand summary of the information provided by previous figures. The stars indicate the export fraction that minimizes the TCoE for each mix of heat pumps and HP3 systems.
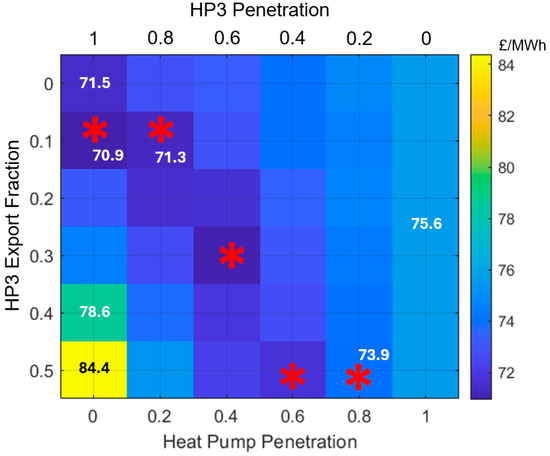
Figure 23.
Variation in the (minimum) TCoE with respect to the share of HP3 systems (H) and the export fraction (Ɛ). The red stars show the export fraction that minimizes the cost of electricity for each different heat pump penetration level.
When the value of H is low (≤0.4), the HP3 systems installed across the country can export up to 50% of their heat output as of electricity. This reduces the TCoE by flattening demand and reducing the amount of energy storage needed by the grid.
When the value of H high (≥0.8), the electricity export of HP3 systems can only be a small fraction of their heat output because there is a large number of systems installed, and electricity demand is low because not many heat pumps draw power. We can also see that when HP3 systems handle most of the heat demand (high H values), large export quantities cause the cost of electricity to increase. As mentioned, the exports exceed demand, creating negative power peaks, which, in turn, call for greater energy storage capacity.
4.2.1. Energy Storage Capacity
One of the main factors contributing to the TCoE is how much energy storage capacity the system needs. Figure 24 shows the variation in the overall storage capacity (H2 + CAES) needed as the share of HP3 systems in the country increases and the fraction of the heat demand handled by electrical heat pumps decreases. All the curves consider the optimum HP3 export fraction (Ɛ), the optimum generation mix (R) and the optimal quantity of over-generation (Ω) for the specific mix of heat pumps and HP3 systems.
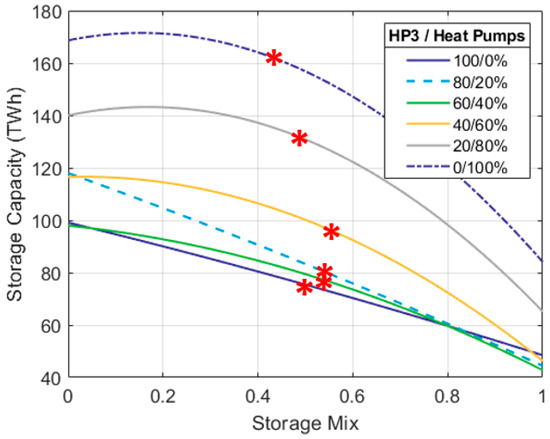
Figure 24.
Overall energy storage capacity required vs. fraction of homes using HP3 systems. Optimum system parameters are considered for each value of H. The red stars show the storage capacity needed at the value of (X) that minimizes the cost of electricity for each different mix of HP3 and heat pumps.
Figure 24 shows different mixes between heat pumps and HP3 systems. Nevertheless, the total storage capacity changes with respect to the mix of stores (X) in the same general way previously described in Section 4.1
As the ratio X tends to zero, underground hydrogen caverns provide a greater storage capacity. Conversely, as the ratio X tends to 1, the capacity provided by CAES increases. In general, allowing CAES to service most of the storage duty (X→1) significantly reduces the amount of storage capacity needed, compared to when H2 caverns handle most of the duty (X→0). As mentioned, this difference is attributable to the difference between the efficiencies of CAES and H2, the latter having a considerably lower electricity-to-electricity efficiency.
Figure 24 shows that the electricity system needs less storage capacity as HP3 systems provide heating for a greater proportion of UK homes and the penetration of heat pumps reduces from 100%. This explains to a large degree why the TCoE is higher when heat pumps are installed in more homes.
As discussed in Section 4.1, in a scenario where heat demand is 100% supplied by electrical heat pumps (and there are no electricity exports), the TCoE is minimized with a mix of stores (X) of 0.46. Here, the medium-duration energy store (CAES) provides 27 TWh while the long-duration energy store (underground H2 caverns) provides a much greater 126 TWh for a joint capacity of 153 TWh.
When the market share of heat pumps reduces to 60% and HP3 systems provide heating for the other 40% of homes (H = 0.4) with an export fraction of 0.5, the TCoE is minimized with a mix of stores (X) of 0.53. Here, a total capacity of 98 TWh is needed. Underground hydrogen caverns provide 83 TWh, while the remaining 15 TWh is provided by CAES.
Contrastingly, when HP3 systems provide heating for 100% of homes in the UK (H = 1) with an export fraction of 0.1, the minimum TCoE is found with a mix of stores (X) of 0.49. The storage capacity required in this scenario is smaller at 75.9 TWh; about 62.2 TWh is provided by underground H2 caverns, while another 13.7 TWh is supplied by CAES.
The energy storage capacities reported for the different scenarios and system configurations were calculated using 12 years of UK demand and renewable generation data. Nevertheless, there is potential (albeit limited) that some future year could have an unexpectedly long wind drought. Therefore, the results presented in this paper should be treated as the minimum storage capacity needed to meet demand. It behooves the network operator to determine what level of risk is acceptable and assess whether it is necessary to have any extra storage capacity to enhance the electricity system in terms of robustness, reliability and resilience.
4.2.2. Charging and Discharging Powers
The rated powers of the energy storage provisions are another cost driver. However, their contribution to the TCoE is smaller than that of the storage capacity. Figure 25 and Figure 26 illustrate how the mix between HP3 systems and electrical heat pumps modifies the stores’ (dis)charge powers. Each curve considers the optimum export fraction and renewable mix for the given penetration level of HP3 systems.
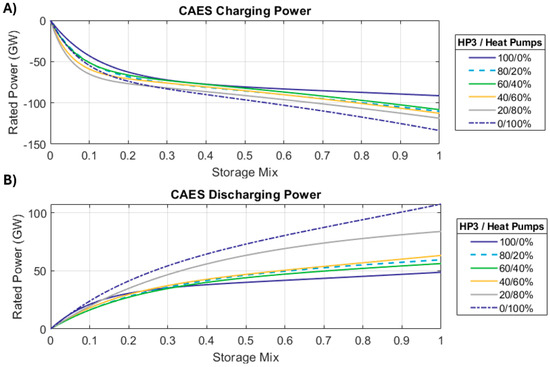
Figure 25.
Variation in CAES charge (A) and discharge (B) powers in relation to the share of HP3 systems and the mix between energy stores (X).
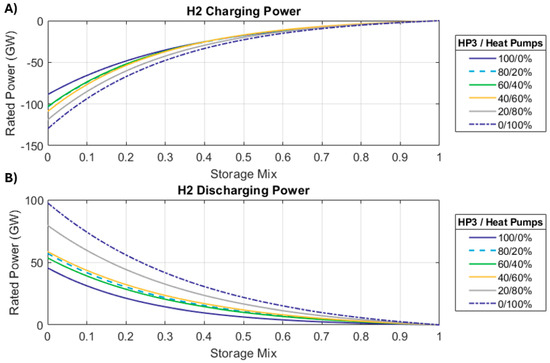
Figure 26.
Variation in the hydrogen stores’ charge (A) and discharge (B) powers in relation to the share of HP3 systems and the mix between energy stores (X).
The stores’ (dis)charge powers follow the same general behavior discussed in Section 4.1. CAES powers increase as the mix of stores (X) moves towards 1. Oppositely, a reduction in the value of X causes an increase in the hydrogen stores’ rated powers. Figure 25 and Figure 26 show that, regardless of the mix between energy stores (X), the (dis)charging powers of the energy stores become smaller as the proportion of homes using HP3 systems grows.
As mentioned, when heat pumps meet 100% of the space heating demand, the minimum TCoE is found when the mix of stores (X) is 0.46. In this configuration, hydrogen has a charging power of 28 GW, and CAES has a much higher charging power of 100.3 GW.
For comparison, in the scenario where HP3 systems provide 100% of the space heating demand, a mix of stores (X) of 0.49 minimizes the TCoE. Here, the H2 and CAES stores have charging powers of 18.3 GW and 80.4 GW, respectively.
In the optimum (i.e., minimum cost) configuration for a 100% penetration of heat pumps (H = 0), the hydrogen stores have a discharge power of 23.7 GW, while CAES’s rated discharge power is 73.7 GW. For comparison, in the optimum configuration for an HP3 share of 100% (H = 1), the H2 and CAES stores have smaller rated discharge powers of 6.5 GW and 39.8 GW, respectively.
4.2.3. Energy Passed Through Storage and Losses
As fewer homes use electrical heat pumps and the penetration of HP3 systems increases, the amount of electricity put into the stores and discharged back into the grid throughout the 12-year period becomes smaller. This results in lower storage losses (owing to the stores’ inefficiencies) as the value of H increases. Storage losses increase as more electricity is used for domestic heating.
For any given mix between electrical heat pumps and HP3 systems, losses due to storage increase significantly as the mix of stores (X) shifts towards zero. This is because more energy is put into the underground hydrogen caverns, whose roundtrip efficiency is ~25 percentage points lower than that of CAES. Greater energy losses entail increased generation costs because renewables must generate more electricity to compensate for these losses and ensure that sufficient electricity is available to meet demand. In the system configurations that minimize the TCoE for H = 0 and H = 1, storage losses represent approximately ~13% of the total electricity demand.
Table 4 summarizes the system configuration that attains the minimum TCoE. This is achieved when HP3 systems supply 100% of the space heating demand (H = 1) and they have an export fraction of 0.1. The figures presented in Table 4 can be compared against the optimum system parameters for scenarios based on H = 1 and no electricity exports and H = 0. Both scenarios were summarized in Table 2.

Table 4.
Details of the optimum (i.e., minimum cost) system configuration: HP3 penetration of 100% (H = 1) and 10% exports (Ɛ = 0.1).
Figure 24, Figure 25 and Figure 26 show that the amount of energy storage that the grid needs and the stores’ (dis)charging powers become smaller as the share of space heating demand supplied by HP3 systems increases and the number of dwellings using electricity for heating purposes reduces. This explains the reduction in the TCoE seen as more HP3 systems are introduced.
4.2.4. Composition of the Total Cost of Electricity
The cost of electricity is minimized when there are no heat pumps installed and HP3 systems supply the full demand for space heating (with an export fraction of 0.1). For this scenario, Figure 27 shows how the mix of energy stores (X) changes the composition of the TCoE. Depending on the value of X, the cost of electricity ranges between 70.9 and 76.6 GBP/MWh.
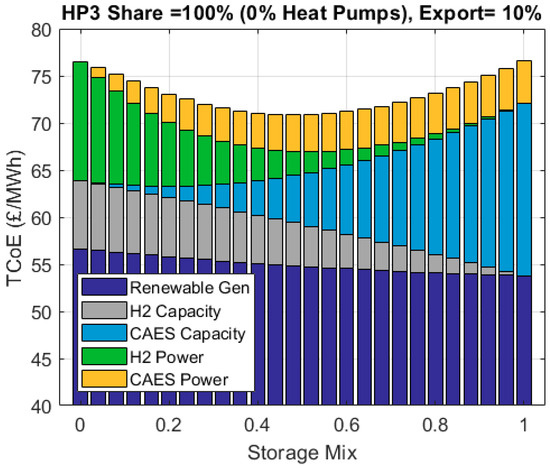
Figure 27.
TCoE composition in a scenario based on H = 1 and Ɛ = 0.1 The optimum mix of renewables and level of over-generation is considered.
The largest cost is owed to renewable generation, representing between 70% and 77% of the TCoE. Generation costs comprise base generation, over-generation and loss compensation. ‘Base’ renewable generation is independent of X. This component constitutes 55% to 59% of the TCoE. Base generation costs are lower than those observed in a scenario with HP = 0 and no exports because wind’s share (R), which offers a lower cost per MWh compared to solar PV, increases from 85% to 90% when HP3 systems have a penetration of 100% (H = 1) and operate with an Ɛ of 0.1
In Figure 27, over-generation and loss compensation are grouped together. The energy needed to offset storage losses reduces as the mix of stores (X) tends to 1, owing to CAES’s higher efficiency. Depending on the value of X, this component makes up between 4% and 11% of the TCoE.
Because less energy is needed to overcome storage losses, the system can allow a greater amount of over-generation and curtailment. Depending on the mix of energy stores, over-generation ranges between 8% and 11%.
The cost of the overall energy storage capacity is the second largest cost driver. The capacity cost of H2 increases as X tends to 0. This constitutes between 0 and 9% of the TCoE. The capacity cost of CAES represents between 0 and 24% of the TCoE.
A significantly smaller capacity cost is seen at X = 0 compared to X = 1. This is because CAES’s storage capacity costs are greater than those of H2 caverns by a factor > 5.2 (see Table 2).
Power conversion equipment’s contribution to the TCoE is smaller than that of the storage capacity. Power costs associated with the hydrogen caverns represent between 0 and 16% of the TCoE, depending on X. CAES power conversion costs account for between 0 and 6% of the TCoE. A value of X = 1 minimizes power conversion costs due to the lower cost per kW of CAES air compressors and expanders compared to the electrolyzers and hydrogen-fired turbines.
Table 5 considers the optimum (i.e., minimum cost) system configuration for H = 1 and provides a summary of the different cost drivers’ contributions.

Table 5.
Composition of the TCoE in the lowest-cost system configuration (H = 1, Ɛ = 0.1, R = 0.9, X = 0.49).
Figure 28 shows, in a very simple way, the key finding of this study. In a scenario where domestic space heating is fully decarbonized, a lower cost of electricity can be achieved by supplying a fraction of the heat demand with HP3 systems and allowing those systems to produce and export some electricity during peak times. All points consider the optimum system configuration for the specific combination of H and Ɛ.
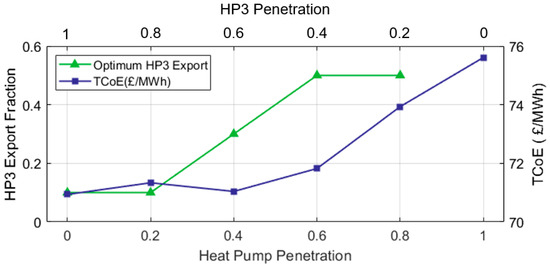
Figure 28.
Reduction in the TCoE as the fraction of the heat demand handled by HP3 systems increases and the penetration of electrical heat pumps reduces.
It can be seen from Figure 28 that the TCoE reduces from 75.61 GBP/MWh when heat demand is supplied 100% by conventional electrically driven heat pumps, down to approx. 70.9 GBP/MWh when heat pumps are not used anywhere and 100% of heat demand is met by HP3 systems (with an Ɛ = 0.1). The cost per unit of electricity reduces by about 6% (~4.7 GBP/MWh). Although this may seem relatively small, it entails some important changes to the electricity system.
Even without accounting for space heating, achieving a zero-carbon electricity system will still necessitate several tens of terawatt-hours of energy storage capacity. The results of this paper, as well as those of previous studies [28], indicate that if conventional heat pumps were used in 100% of UK homes, a storage capacity of approximately 175 TWh would be needed.
Electricity costs reduce as the share of HP3 systems increases because the need for grid-scale energy storage is reduced. In a scenario where 100% of the space heating demand is met by HP3 systems, the total storage capacity needed is ~76 TWh, which is still a significant figure but considerably smaller than what would be required if demand were fully met by conventional heat pumps.
Developing underground caverns for energy storage (either for hydrogen or compressed air) can take more than a decade until they are fully operational [35,92].
Presently, the UK’s energy storage capacity is near 0 TWh. For obvious reasons, this figure excludes natural gas storage. The country’s largest store (Dinorwig’s pumped hydro) only provides ~0.01 TWh [96]. This highlights two important aspects: (i) the country must ramp up its development of storage capacity to achieve its 2035 Net Zero goals and (ii) new technologies (such as HP3) can be instrumental in achieving Net Zero by reducing the scale of the system upgrades required.
5. Conclusions
Around 17% of the UK’s carbon dioxide emissions come from space heating. Replacing natural gas boilers with electric heat pumps could increase peak grid load by about 70% compared to present values, with significantly faster ramp rates.
To be able to provide all the power that the country will demand, the electricity grid will require substantial upgrades, including a significant energy storage capacity. This will lead to increased costs of electricity. The published literature indicates that the UK would need about 80 TWh to fully decarbonize its electricity system. However, this figure does not consider the electrification of space heating. If 100% of homes in the country were to use electric heat pumps to keep warm, the electricity grid would need > 150 TWh of storage capacity. Most of this storage capacity will be realized as underground H2 caverns, which is the only bulk energy storage technology that is cost-effective at such a scale.
However, deploying all the capacity needed in the short time available is a considerable challenge. Developing underground caverns for hydrogen storage is a lengthy process, and it can take close to 10 years before the stores are operational. At present, the UK has an energy storage capacity of ≪ 0.1 TWh (not counting natural gas storage as it is not zero carbon). Energy storage infrastructure development must commence almost immediately to meet our 2035 and 2050 decarbonization targets.
This paper investigates how the deployment of a novel space heating technology called “High-Performance Heat-Powered Heat Pumps” (HP3s) could help to (i) meet the demand for space heating, (ii) reduce how much grid-scale energy storage is needed and (iii) reduce the overall cost of electricity. HP3 systems do not use electricity to operate. They are heat-driven and can use hydrogen or another clean fuel distributed through the gas network. Therefore, supplying a fraction of the heating demand via HP3 systems will reduce the peak load seen by the electricity grid in comparison to scenarios where electrical heat pumps fully meet demand.
An advantageous feature of HP3 systems is their ability to generate and export electricity. This electricity is produced during the times when the system operates, which naturally coincides with the times electrical heat pumps operate in other houses. The electricity exported by HP3 systems will alleviate some of the strain on the grid created by the heat pumps in the country.
This paper carries out a parametric study focusing on two variables: the fraction of homes using HP3 systems (H) and the “export fraction” (Ɛ) of each one of those systems. The export fraction refers to the amount of electricity produced, which is expressed as a fraction of an HP3 system’s heat output (ranging from 0 to 50%). For every combination of H and Ɛ, an optimization is carried out to find the system configuration that minimizes electricity costs. The electricity system is characterized by three parameters, namely, generation mix (wind/solar PV), the mix of energy stores (CAES and underground hydrogen caverns) and the amount of overgeneration.
A levelized cost of electricity of 75.61 GBP/MWh is seen when 100% of the demand for space heating is supplied by electrical heat pumps. This is the highest cost seen across all scenarios explored. As HP3 systems are introduced into the mix and their market share increases, the cost of electricity reduces. The reason for this is twofold: (i) electricity demand becomes significantly less peaky compared to a scenario where heat is fully electrified, because less power is drawn from the grid during peak times, and (ii) electricity is being produced and exported to the grid at peak times.
When HP3 systems are installed and used in 20% of UK homes, the levelized cost of electricity falls to 73.9 GBP/MWh. This reduces to 71.8 GBP/MWh when the penetration of HP3 systems increases to 40% and to 70.9 GBP/MWh when HP3 systems fully supply the domestic space heating demand in the country. The figures above consider the optimum amount of electricity exports (Ɛ) in each scenario. It is important to note that as more HP3 systems are installed, the amount of electricity each system can export to the grid reduces. This is due to a combination of factors: (i) load on the electricity grid is lower because fewer electrical heat pumps operate and (ii) there is a greater number of discrete HP3 systems installed across the country.
For example, in a scenario where HP3 systems supply 20% of the space heating demand, the optimum export fraction is 0.5. The optimum export fraction reduces to 0.1 in a scenario where HP3 systems are installed in 100% of UK homes. In this scenario, exporting more than 10% increases the cost of electricity. This is because too much electricity is being exported when it is not needed, which increases the electricity demand’s ‘peakiness’. This increases how much energy storage is needed and consequently drives up the overall electricity cost.
As mentioned, the cost of electricity reduces as HP3 systems supply a greater fraction of heat demand (considering the optimum amount of electricity exports). The reduction in the TCoE is due to a reduced need for energy storage. In a scenario where the demand for space heating is entirely supplied by electrical heat pumps (highest cost of electricity), approximately 153 TWh of grid-scale energy storage capacity is needed. In a scenario where all the space heating demand is supplied by HP3 systems, the requirement for grid-scale energy storage could be as ‘low’ as 75.9 TWh. Here, 62.2 TWh is provided by underground hydrogen caverns, while another 13.7 TWh is supplied by CAES systems.
Although the reduction in the TCoE achieved by switching entirely from electrical heat pumps to heat-powered heat pumps may seem relatively small (on the order of 6%), there is a significant reduction (~50%) in the storage capacity that the electricity grid needs. Reducing the magnitude of the infrastructure challenge ahead improves our chances of achieving Net Zero.
Although the HP3 systems discussed are still at a low ‘technology readiness level’ and not ready to be deployed, this paper has shown that new clean heating technologies can substantially contribute to the achievement of Net Zero by reducing the scale of the system upgrades required.
Author Contributions
Conceptualization, B.C. and R.M.; Methodology, S.D.G.; Validation, Z.B. and R.M.; Formal analysis, B.C. and S.D.G.; Resources, S.D.G.; Data curation, B.C.; Writing—original draft, B.C.; Writing—review & editing, Z.B. and R.M.; Supervision, S.D.G.; Project administration, Z.B. All authors have read and agreed to the published version of the manuscript.
Funding
This research was funded by the Engineering and Physical Sciences Research Council (EPSRC) of the United Kingdom through the following award: EP/W037327/1.
Data Availability Statement
The data presented in this study are available on request from the corresponding author. The data are not publicly available due to privacy reasons.
Acknowledgments
The authors are grateful to the UK’s EPSRC for allowing us to conduct this research We also thank the anonymous reviewers who provided valuable feedback and recommendations.
Conflicts of Interest
The authors declare no conflict of interest.
References
- UK Government. Written Evidence Submitted by Northern Gas Networks, Session 2022–2023. 7 June 2023. Available online: https://publications.parliament.uk/pa/cm5803/cmpublic/Energy/memo/EB13.htm (accessed on 2 November 2025).
- National Gas. Available online: https://www.nationalgas.com/about-us (accessed on 2 November 2025).
- Lamb, N. A New Strategy for the UK Government to Meet Heat Pump Targets. 27 July 2023. WBS. Available online: https://www.wbs.ac.uk/news/a-new-strategy-for-the-uk-government-to-meet-heat-pump-targets/ (accessed on 2 November 2025).
- Energy Systems Catapult. A Guide to the Decarbonisation of Heat in the UK. Available online: https://es.catapult.org.uk/guide/decarbonisation-heat/ (accessed on 2 November 2025).
- UK National Audit Office. Report Value for Money: Decarbonising Home Heating. 18 March 2024. Available online: https://www.nao.org.uk/reports/decarbonising-home-heating/ (accessed on 2 November 2025).
- Gabbatiss, J. Heat Pumps are the ‘Central Technology’ for Low-Carbon Heating, Concludes IEA. 2 December 2022. Carbon Brief. Available online: https://www.carbonbrief.org/heat-pumps-are-the-central-technology-for-low-carbon-heating- concludes-iea/ (accessed on 2 November 2025).
- International Energy Agency. The Future of Heat Pumps. November 2022. Available online: www.iea.org/reports/the-future-of-heat-pumps/executive-summary (accessed on 2 November 2025).
- UK Department for Energy Security and Net Zero. Heat Pump Deployment Statistics. December 2024. Available online: https://www.gov.uk/government/statistics/heat-pump-deployment-statistics-december-2024 (accessed on 2 November 2025).
- MCS. UK Reaches 250,000 Certified Heat Pump Installations. 19 August 2024. Available online: https://mcscertified.com/uk-reaches-250000-certified-heat-pump-installations/ (accessed on 2 November 2025).
- UK Parliamentary Office of Science and Technology. Research Briefing: Heat Pumps. 14 July 2023. Available online: https://doi.org/10.58248/PN699 (accessed on 2 November 2025).
- UK Department for Energy Security and Net Zero. Policy Paper: Heat and Buildings Strategy. 1 March 2023. Available online: https://www.gov.uk/government/publications/heat-and-buildings-strategy (accessed on 2 November 2025).
- Oxford University. How Heat Pumps can Keep Homes Warm Without Frying the Power Grid. 9 February 2023. Available online: https://eng.ox.ac.uk/news/how-heat-pumps-can-keep-homes-warm-without-frying-the-power-grid/ (accessed on 2 November 2025).
- Rowley, P.; Wilson, G.; Taylor, R. Heat Decarbonisation Challenges: Local Gas vs. Electricity Supply, UK Energy Research Centre. August 2018. Available online: https://ukerc.ac.uk/publications/local-gas-demand-vs-electricity-supply/ (accessed on 2 November 2025).
- James, P. Latent: Residential Heat as an Energy System Service. Part of “Decarbonising UK Domestic Heating: Disruptive Approaches” London. 6 November 2024. Available online: https://www.era.ac.uk/wp-content/uploads/2024/11/Patrick_James_IMechE_November_2024_LATENT.pdf (accessed on 2 November 2025).
- UK Parliament. Costs of Network Reinforcement to Support the Roll-Out of Heat Pumps and How the Grid is Placed to Accommodate Greater Electric Heating. 2025. Available online: https://committees.parliament.uk/publications/47684/documents/249076/default/ (accessed on 29 October 2025).
- McFadden, C. The National Grid Unveils £35bn Upgrade Plan. 14 January 2025. The Eco Experts. Available online: https://www.theecoexperts.co.uk/news/national-grid-upgrade-plan (accessed on 2 November 2025).
- Oliver, M. Miliband’s Net Zero Grid Upgrade Means Household Charges will Almost Double. 18 December 2024. The Telegraph. Available online: https://www.telegraph.co.uk/business/2024/12/18/household-charges-for-electricity-grid-to-almost-double/ (accessed on 2 November 2025).
- Schmidt, O.; Staffell, I. Monetizing Energy Storage: A Toolkit to Assess Future Cost and Value; Oxford University Press: Oxford, UK, 2023. [Google Scholar]
- Child, M.; Bogdanov, D.; Breyer, C. The role of storage technologies for the transition to a 100% renewable energy system in Europe. Energy Procedia 2018, 155, 44–60. [Google Scholar] [CrossRef]
- Schill, W.P. Electricity storage and the renewable transition. Joule 2020, 4, 2059–2064. [Google Scholar] [CrossRef]
- Dowling, J.A.; Rinaldi, K.Z.; Ruggles, T.H.; Davis, S.J.; Yuan, M.; Tong, F.; Lewis, N.S.; Caldeira, K. Role of long-duration energy storage in variable renewable electricity systems. Joule 2020, 4, 1907–1928. [Google Scholar] [CrossRef]
- Garvey, S. Energy Storage is Many-Faceted, it’s Real and It is Going to be Very Big. 17 May 2024. Available online: https://www.nottingham.ac.uk/research/research-areas/energy-institute/news-and-events/news/ukes2024.aspx (accessed on 2 November 2025).
- UK Science and Technology Committee of House of Lords. Long-duration energy storage: Get on with it. 13 March 2024. Available online: https://publications.parliament.uk/pa/ld5804/ldselect/ldsctech/68/68.pdf (accessed on 2 November 2025).
- Whalen, C. How Much Electricity will the UK Need as it Switches to Electric Heating and Cars? 2022 Carbon Commentary. Available online: https://www.carboncommentary.com/blog/2022/2/11/how-much-electricity-will-the-uk-need-as-it-switches-to-electric-heating-and-cars (accessed on 2 November 2025).
- Zhang, M.; Millar, M.A.; Yu, Z.; Yu, J. An assessment of the impacts of heat electrification on the electric grid in the UK. Energy Rep. 2022, 8, 14934–14946. [Google Scholar] [CrossRef]
- Watson, S.D.; Crawley, J.; Lomas, K.J.; Buswell, R.A. Predicting Future GB Heat Pump Electricity Demand. Energy Build. 2023, 286, 112917. [Google Scholar] [CrossRef]
- Lynas, M. Heat Pump Deployment Requires Massive Amounts of Storage, Finds UK Researcher. 13 May 2025. PV Magazine. Available online: https://www.pv-magazine.com/2025/05/13/heat-pump-deployment-requires-massive-amounts-of-storage-uk-researcher-finds/ (accessed on 2 November 2025).
- Cardenas, B.; Garvey, S.; Baniamerian, Z.; Mehdipour, R. Heat pumps’ impact on the requirement for grid-scale energy storage in the UK. Renew. Energy 2025, 247, 123020. [Google Scholar] [CrossRef]
- Cardenas, B.; Swinfen-Styles, L.; Rouse, J.; Garvey, S.D. Short-, Medium-, and Long- Duration energy storage in a 100% renewable electricity grid: A UK Case Study. Energies 2021, 14, 8524. [Google Scholar] [CrossRef]
- Energy Research Accelerator. Hydrogen storage in Caverns—“2035 is Effectively Tomorrow. March 2022. Available online: https://www.era.ac.uk/wp-content/uploads/2023/03/H2_Storage_in_Caverns_Event_Report_FINAL_v2.pdf (accessed on 2 November 2025).
- Garvey, S. Underappreciated’ Medium-Duration Energy Storage Could Take Centre Stage. 13 February 2024. Available online: https://www.imeche.org/news/news-article/feature-underappreciated-medium-duration-energy-storage-could-take-centre-stage (accessed on 2 November 2025).
- Garvey, S. Why Medium-Duration Energy Storage is Vital for a ‘Net Zero’ UK. 19 May 2020. Available online: https://www.imeche.org/news/news-article/feature-why-medium-duration-energy-storage-is-vital-for-a-net-zero-uk (accessed on 2 November 2025).
- Smith, C.L. Large Scale Electricity Storage; The Royal Society: London, UK, 2023; ISBN 978-1-78252-666-7. [Google Scholar]
- Hydrogen Central. Britain Needs 900 Hydrogen Filled Salt Caverns to Hit Climate Goals. 10 September 2023. Available online: https://hydrogen-central.com/britain-needs-900-hydrogen-filled-salt-caverns-hit-climate-goals-says-royal-society-hydrogen-storage/ (accessed on 2 November 2025).
- Alvarado, A. An Overview of Gas Cavern Construction and Its Energy Requirements. Deep KBB. Part of Hydrogen Storage in Caverns. April 2024. Available online: https://www.era.ac.uk/resources/event-resources/hsic-2024-event-resources/ (accessed on 2 November 2025).
- Alvarado, A. Meeting the UK’s Underground Hydrogen Storage Requirements—An Assessment of Timescales. Deep KBB. Part of Hydrogen Storage in Caverns. April 2025. Available online: https://www.era.ac.uk/resources/event-resources/hydrogen-storage-in-caverns-hsic-2025/ (accessed on 2 November 2025).
- Cardenas, B. High-Performance Hydrogen-Powered Heat-Pumps. Part of “Decarbonising UK Domestic Heating: Disruptive Approaches”. London. 6 November 2024. Available online: https://www.era.ac.uk/resources/event-resources/decarbonising-uk-domestic-heating-disruptive-approaches/ (accessed on 2 November 2025).
- Cardenas, B.S.; Swinfen-Styles, L.; Rouse, J.; Hoskin, A.; Xu, W.; Garvey, S.D. Energy storage capacity vs. Renewable penetration: A study for the UK. Renew. Energy 2021, 171, 849–867. [Google Scholar] [CrossRef]
- Hocking, M.B. Handbook of Chemical Technology and Pollution Control, 3rd ed.; Academic Press: Cambridge, MA, USA, 2005; Chapter19: Petrochemicals; pp. 637–668. [Google Scholar]
- Kawai, K.; Yoshikawa, K.; Kobayashi, H.; Tsai, J.S.; Matsuo, M.; Katsushima, H. High temperature air combustion boiler for low BTU gas. Energy Convers. Manag. 2002, 43, 1563–1570. [Google Scholar] [CrossRef]
- Gong, Y.; Ma, G.; Jiang, Y.; Wang, L. Research progress on the fifth-generation district heating system based on heat pump technology. J. Build. Eng. 2023, 71, 106533. [Google Scholar] [CrossRef]
- Muntean, D.; Tokar, A.; Dorca, A.; Tokar, D.; Adam, M. Expanding the prosumer concept to enhance the efficiency of district heating systems. A case study. Rev. Română De Ing. Civilă 2024, 15, 167–174. [Google Scholar] [CrossRef]
- Sommer, K. Micro-Combined Heat and Power (Micro-CHP) Appliances for One- or Two-Family Houses for More Energy Efficiency. REHVA Journal. December 2011. Available online: https://www.rehva.eu/rehva-journal/chapter/micro-combined-heat-and-power-micro-chp-appliances-for-one-or-two-family-houses-for-more-energy-efficiency (accessed on 29 October 2025).
- Elexon: Balancing Mechanism Reporting Service. Actual Generation Output Per Generation Unit. Available online: https://bmrs.elexon.co.uk/actual-aggregated-generation-per-type (accessed on 2 November 2025).
- UK Department for Business, Energy, and Industrial Strategy. Energy Trends: UK Electricity. April 2025. Available online: https://www.gov.uk/government/statistics/electricity-section-5-energy-trends (accessed on 2 November 2025).
- Gridwatch: GB National Grid Status. Available online: https://www.gridwatch.templar.co.uk/ (accessed on 2 November 2025).
- UK Department for Business, Energy, and Industrial Strategy. Digest of UK Energy Statistics. Load Factors for Renewable Electricity Generation. 2022. Available online: https://www.gov.uk/government/statistics/renewable-sources-of-energy-chapter-6-digest-of-united-kingdom-energy-statistics-dukes (accessed on 2 November 2025).
- UK Department for Business, Energy, and Industrial Strategy. Energy Trends: Average Wind Speed and Deviations from the Long-Term Mean. 2024. Available online: https://www.gov.uk/government/statistics/energy-trends-section-7-weather (accessed on 2 November 2025).
- Pfenninger, S.; Staffell, I. Renewables Ninja. Available online: www.renewables.ninja (accessed on 2 November 2025).
- Ziegler, M.S.; Mueller, J.M.; Pereira, G.D.; Song, J.; Ferrara, M.; Chiang, Y.; Trancik, J.E. Storage requirements and costs of shaping renewable energy toward grid decarbonization. Joule 2019, 3, 2134–2153. [Google Scholar] [CrossRef]
- Few, J.; Pullinger, M.; McKenna, E.; Elam, S.; Webborn, E.; Oreszczyn, T. Energy Use in GB Domestic Buildings 2021; Smart Energy Research Lab: London, UK, 2022. [Google Scholar]
- UK Office of Gas and Electricity Markets. Average Gas and Electricity Usage. Available online: https://www.ofgem.gov.uk/information-consumers/energy-advice-households/average-gas-and-electricity-use-explained (accessed on 2 November 2025).
- Chesser, M.; Lyons, P.; O’Reilly, P.; Carroll, P. Air source heat pump in-situ performance. Energy Build. 2021, 251, 111365. [Google Scholar] [CrossRef]
- Kensa Heat Pumps. Evo Heat Pump Actual Thermal Outputs. Available online: https://www.kensaheatpumps.com/wp-content/uploads/2023/03/TI-Actual-Thermal-Outputs-v24.pdf (accessed on 2 November 2025).
- UK Government Property Function. Net Zero Estate Playbook: A Guide to Decarbonising Government Property. November 2021. Available online: https://www.gov.uk/government/publications/net-zero-estate-playbook (accessed on 2 November 2025).
- UK Energy Saving Trust. Retrofitting the UK’s Housing Stock to Reach Net Zero. November 2021. Available online: https://energysavingtrust.org.uk/retrofitting-the-uks-housing-stock-to-reach-net-zero/ (accessed on 2 November 2025).
- Benato, A.; Stoppato, A. Pumped thermal electricity storage: A technology overview. Therm. Sci. Eng. Prog. 2018, 6, 301–315. [Google Scholar] [CrossRef]
- Sharma, S.; Mortazavi, M. Pumped Thermal Energy Storage: A Review. Int. J. Heat Mass Transf. 2023, 213, 124286. [Google Scholar] [CrossRef]
- Vecchi, A.; Li, Y.; Ding, Y.; Mancarella, P.; Sciacovelli, A. Liquid air energy storage (LAES): A review on technology state-of-the-art, integration pathways and future perspectives. Adv. Appl. Energy 2021, 3, 100047. [Google Scholar] [CrossRef]
- She, X.; Wang, H.; Zhang, T.; Li, Y.L.; Zhao, X.; Ding, Y.; Wang, C. Liquid air energy storage—A critical review. Renew. Sustain. Energy Rev. 2025, 208, 114986. [Google Scholar] [CrossRef]
- Akman, A.L.; Arslan, M.Z.; Farsak, M. The rise of vanadium redox flow batteries: A game-changer in energy storage. J. Alloys Compd. 2025, 1038, 182869. [Google Scholar] [CrossRef]
- Sharmoukh, W. Redox flow batteries as energy storage systems: Materials, viability, and industrial applications. RSC Adv. 2025, 15, 10106–10143. [Google Scholar] [CrossRef]
- Barzigar, A.; Ebadati, E.; Mujumdar, A.S.; Hosseinalipour, S.M. A comprehensive review of vanadium redox flow batteries: Principles, benefits, and applications. Next Res. 2025, 2, 100767. [Google Scholar] [CrossRef]
- Cardenas, B.; Ibanez, R.; Rouse, J.; Swinfen-Styles, L.; Garvey, S. The effect of a nuclear baseload in a zero-carbon electricity system: An analysis for the UK. Renew. Energy 2023, 205, 256–272. [Google Scholar] [CrossRef]
- Schmidt, O.; Melchior, S.; Hawkes, A.; Staffell, I. Projecting the Future Levelized Cost of Electricity Storage Technologies. Joule 2019, 3, 81–100. [Google Scholar] [CrossRef]
- Smith, C.L. The Need for Long Duration Electricity Storage and Options Available. Part of Hydrogen Storage in Caverns 2021. Energy Research Accelerator. April 2021. Available online: https://www.era.ac.uk/event/hydrogen-storage-in-caverns-event-2021/ (accessed on 2 November 2025).
- Stocks, M.; Stocks, R.; Lu, B.; Cheng, C.; Blakers, A. Global atlas of closed-loop pumped hydro energy storage. Joule 2021, 5, 270–284. [Google Scholar] [CrossRef]
- Beuse, M.; Steffen, B.; Schmidt, T.S. Projecting the competition between energy storage technologies in the electricity sector. Joule 2020, 4, 2162–2184. [Google Scholar] [CrossRef]
- Henze, V. Battery Pack Prices Fall as Market Ramps Up with Market Average At $156/kWh in 2019. December 2019. Bloomberg NEF. Available online: https://about.bnef.com/blog/battery-pack-prices-fall-as-market-ramps-up-with-market-average-at-156-kwh-in-2019/ (accessed on 2 November 2025).
- Catsaros, O. Lithium-Ion Battery Pack Prices Hit Record Low of $139/kWh. Nov 2023. Bloomberg NEF. Available online: https://about.bnef.com/blog/lithium-ion-battery-pack-prices-hit-record-low-of-139-kwh/ (accessed on 2 November 2025).
- UK Committee on Climate Change. Next Steps for UK Heat Policy. Heat in UK Buildings Today. October 2016. Available online: https://www.theccc.org.uk/wp-content/uploads/2017/01/Annex-2-Heat-in-UK-Buildings-Today-Committee-on-Climate-Change-October-2016.pdf (accessed on 2 November 2025).
- Cardenas, B.; Davenne, T.R.; Garvey, S. A sign-preserving filter for signal decomposition. Proc. Inst. Mech. Eng. Part I J. Syst. Control. Eng. 2018, 233, 1106–1126. [Google Scholar] [CrossRef]
- The Royal Society. UK Government Must Kick-Start the Construction of Large-Scale Electricity Storage or Fail to Meet Legally Binding Net Zero Targets by 2050. September 2023. Available online: https://royalsociety.org/news/2023/09/electricity-storage-report (accessed on 2 November 2025).
- UK Department for Energy Security and Net Zero. Hydrogen Transport and Storage Infrastructure: Minded to Positions. August 2023. Available online: https://assets.publishing.service.gov.uk/media/64ca0e6c5c2e6f0013e8d92a/hydrogen-transport-storage-minded-to-positions.pdf (accessed on 2 November 2025).
- Jülch, V. Comparison of electricity storage options using levelized cost of storage (LCOS) method. Appl. Energy 2016, 183, 1594–1606. [Google Scholar] [CrossRef]
- Victoria, M.; Zhu, K.; Brown, T.; Andresen, G.B.; Greiner, M. The role of storage technologies throughout the decarbonisation of the sector-coupled European energy system. Energy Conv. Manag. 2019, 201, 111977. [Google Scholar] [CrossRef]
- Lyseng, B.; Niet, T.; English, J.; Keller, V.; Palmer-Wilson, K.; Robertson, B.; Rowe, A.; Wild, P. System-level power-to-gas energy storage for high penetrations of variable renewables. Int. J. Hydrog. Energy 2018, 43, 1966–1979. [Google Scholar] [CrossRef]
- Tarkowski, R. Underground hydrogen storage: Characteristics and prospects. Renew. Sustain. Energy Rev. 2019, 105, 86–94. [Google Scholar] [CrossRef]
- Blanco, H.; Faaij, A. A review at the role of storage in energy systems with a focus on Power to Gas and long-term storage. Renew. Sustain. Energy Rev. 2018, 81, 1049–1086. [Google Scholar] [CrossRef]
- UK Department of Energy and Climate Change. Electricity Generation Costs and Hurdle Rates Lot 3: Non-Renewable Technologies. 2016. Available online: https://assets.publishing.service.gov.uk/media/5a7f700440f0b62305b8724f/Leigh_Fisher_Non-renewable_Generation_Cost.pdf (accessed on 2 November 2025).
- Breeze, P. The Cost of Power Generation: The Current and Future Competitiveness of Renewable and Traditional Technologies. p. 30. Business Insights. Available online: https://www.prnewswire.com/news-releases/the-cost-of-power-generation-the-current-and-future-competitiveness-of-renewable-and-traditional-technologies-97933224.html (accessed on 2 November 2025).
- Luo, X.; Wang, J.; Dooner, M.; Clarke, J. Overview of current development in electrical energy storage technologies and the application potential in power system operation. Appl. Energy 2015, 137, 511–536. [Google Scholar] [CrossRef]
- Steinmann, W.D. Thermo-mechanical concepts for bulk energy storage. Renew. Sustain. Energy Rev. 2017, 75, 205–219. [Google Scholar] [CrossRef]
- Barbour, E.; Mignard, D.; Ding, Y.; Li, Y. Adiabatic compressed air energy storage with packed bed thermal energy storage. Appl. Energy 2015, 155, 804–815. [Google Scholar] [CrossRef]
- Locatelli, G.; Palerma, E.; Mancini, M. Assessing the economics of large Energy Storage Plants with an optimisation methodology. Energy 2015, 83, 15–28. [Google Scholar] [CrossRef]
- Wang, J.; Lu, K.; Ma, L.; Wang, J.; Dooner, M.; Miao, S.; Li, J.; Wang, D. Overview of Compressed Air Energy Storage and Technology Development. Energies 2017, 10, 991. [Google Scholar] [CrossRef]
- Chapman, B. Offshore Wind Energy Price Plunges 30 Per Cent to a New Record Low. 20 September 2019. The Independent. Available online: https://www.independent.co.uk/news/business/news/offshore-wind-power-energy-price-falls-record-low-renewables-a9113876.html (accessed on 2 November 2025).
- Evans, S. Wind and Solar are 30–50% Cheaper than Thought. 27 August 2020. Carbon Brief. Available online: https://www.carbonbrief.org/wind-and-solar-are-30-50-cheaper-than-thought-admits-uk-government/ (accessed on 2 November 2025).
- Department for Business, Energy, and Industrial Strategy. BEIS Electricity Generation Costs. May 2019. Available online: https://www.gov.uk/government/publications/beis-electricity-generation-costs-november-2016 (accessed on 2 November 2025).
- Hutchins, M. Solar ‘Could Soon be UK’s Cheapest Source Of Energy. December 2018. PV Magazine. Available online: https://www.pv-magazine.com/2018/12/12/solar-could-soon-be-uks-cheapest-source-of-energy/ (accessed on 2 November 2025).
- UK Department for Energy Security and Net Zero. Hydrogen Strategy Update to the Market: December 2024. Available online: https://www.gov.uk/government/publications/hydrogen-strategy-update-to-the-market-december-2024 (accessed on 2 November 2025).
- Edlmann, K.; Todd, J.; Hoffman, C.; Kemshell, A.; Williams, H.; Garvey, C.; Noone, M.; Seakins, J.; Armitage, T. Assessing the regional demand for geological hydrogen storage: Building a strategic case for investment in the east coast cluster. In Proceedings of the Part of UK Energy Storage Conference, Nottingham, UK, 10–12 April 2024. [Google Scholar]
- Brey, J.J. Use of hydrogen as a seasonal energy storage system to manage renewable power deployment in Spain by 2030. Int. J. Hydrog. Energy 2021, 46, 17447–17457. [Google Scholar] [CrossRef]
- Wolf, E. Large-scale hydrogen energy storage. In Electrochemical Energy Storage for Renewable Sources and Grid Balancing; Elsevier: Amsterdam, The Netherlands, 2015; pp. 129–142. [Google Scholar]
- Few, S. The UK’s Power Grid Needs Upgrading to Reach Net Zero. 29 May 2024. The Conversation. Available online: https://theconversation.com/the-uks-power-grid-needs-upgrading-to-reach-net-zero-our-new-study-shows-where-226346 (accessed on 29 October 2025).
- Wilson, I.A.G.; McGregor, P.G.; Hall, P.J. Energy storage in the UK electrical network: Estimation of the scale and review of technology options. Energy Policy 2010, 38, 4099–4106. [Google Scholar] [CrossRef]
Disclaimer/Publisher’s Note: The statements, opinions and data contained in all publications are solely those of the individual author(s) and contributor(s) and not of MDPI and/or the editor(s). MDPI and/or the editor(s) disclaim responsibility for any injury to people or property resulting from any ideas, methods, instructions or products referred to in the content. |
© 2025 by the authors. Licensee MDPI, Basel, Switzerland. This article is an open access article distributed under the terms and conditions of the Creative Commons Attribution (CC BY) license (https://creativecommons.org/licenses/by/4.0/).