Article

Numerical Modeling and Multiscale Evaluation of Fe3O4–Graphene Oxide Nanofluids in Electromagnetic Heating for Colombian Heavy Oil Recovery

Grupo de Investigación en Tomografía (GIT), Universidad Industrial de Santander, Bucaramanga 680002, Colombia
*
Author to whom correspondence should be addressed.
Energies 2025, 18(22), 5868; https://doi.org/10.3390/en18225868
Submission received: 1 October 2025 / Revised: 28 October 2025 / Accepted: 1 November 2025 / Published: 7 November 2025

Abstract

Electromagnetic heating (EMH) using microwaves has emerged as a promising enhanced oil recovery (EOR) technique, particularly for heavy crude oils where conventional thermal methods encounter technical and environmental challenges. However, its large-scale implementation remains limited due to incomplete understanding of its energy transfer mechanisms. This study proposes an experimental–numerical approach integrating magnetic graphene oxide nanoparticles (Fe3O4@GO) with microwave heating to enhance energy absorption near the wellbore. The nanomaterial was synthesized via a modified Hummer’s method followed by in situ magnetite precipitation and studied through multiple material characterization techniques showing uniform 80 nm particles with superparamagnetic behavior—ideal for EMH applications. Nine experiments were conducted on sand–heavy-oil–water systems with nanoparticle concentrations up to 500 ppm using a laboratory microwave heating prototype. A simulation model was then developed in CMG-STARS for history matching to estimate energy absorption as a function of saturation and nanoparticle concentration. Experiments reached temperatures up to 240 °C, with 653 MJ of effective heat transferred to the target zone over 55 h, as estimated from the input heat required in the simulator for history matching. The results confirm that magnetic graphene oxide nanoparticles enhance thermal efficiency and heat distribution in microwave-assisted EOR.

1. Introduction

To meet the growing global energy demand, relying solely on conventional crude oil is no longer viable [1,2]; thus, the exploitation of heavy crude oil has become a strategic priority. However, as global energy demand continues to rise across multiple sources—including oil, coal, and natural gas—the focus on heavy crude oil development emerges from its vast untapped reserves and its potential to complement other fossil resources in the transitional energy landscape. Its high viscosity and density make recovery difficult using conventional extraction methods [3,4]. Thermal EOR techniques, such as steam injection, aim to reduce viscosity by increasing the in situ temperature [5,6]. Among emerging alternatives, electromagnetic heating (EMH)—particularly at microwave frequencies—has gained attention due to its potential for volumetric heating, localized energy transfer, and reduced surface energy losses, especially in deep or heterogeneous reservoirs [7].
Despite its theoretical advantages, field-scale implementation of EMH remains limited, primarily due to economic constraints and technical challenges. At present, the technology has not reached commercial deployment, but there are a few successful demonstrations. Notable pilot tests include Radio frequency (RF) heating of oil sands in Utah [8], early commercial application in the Wildmere Field, Canada [9], and RF heating in dolomite formations in Minnesota [10]. These projects highlighted both the potential and unresolved challenges, such as equipment durability, heat control, and scalability. More recently, bottom-hole electric heating was evaluated in a heavy oil reservoir offshore Congo through numerical modeling, demonstrating conceptual viability [11].
These cases illustrate both the potential and the current limitations of EM heating technologies. While the results demonstrate feasibility in controlled conditions, scalability, reservoir heterogeneity, wellbore integrity, and energy efficiency remain key obstacles, reinforcing the need for further experimental validation and simulation studies—such as the one proposed in this research.
Microwave energy primarily interacts with polar molecules like water and ferromagnetic phases in the rock, generating heat via molecular rotation and friction. Since heavy crude has a low dielectric loss factor, direct heating is inefficient; most thermal transfer occurs through adjacent materials, making it critical to understand the contributions of rock-fluid compositions to the heating process [12,13,14,15,16,17,18].
Several experimental studies have explored the potential of electromagnetic (EM) heating as a thermal EOR method for heavy oil reservoirs. Building upon the discussion of rock–fluid interactions, these studies further examine how EM energy propagates through porous media, emphasizing the role of electromagnetic frequency, power, and material composition in heat generation and distribution. These investigations have demonstrated the ability of EM energy to raise the temperature of porous media saturated with crude oil, thus reducing viscosity and enhancing fluid mobility. For instance, ref. [10] reported temperatures above 130 °C using microwave and radiofrequency sources to heat diatomite and heavy oil from Bakersfield [19] used scaled physical models with horizontal wells and gas injection, analyzing the impact of frequency, power, and salinity on temperature and oil production.
Subsequent studies expanded on this by heating core samples saturated with medium to extra-heavy crude oils [20], applying microwave-assisted gravity drainage (MWAGD) techniques [21,22] and introducing EM-absorbing nanoparticles (e.g., Ni and Fe) to improve heating efficiency and reduce oil viscosity [18].
Recent studies have advanced the understanding of Fe3O4 magnetic properties at the nanoscale. Serga [23] showed that doping with small amounts of Gd3+ (0.5–2.5 mol%) enhances magnetization and inhibits the magnetite-to-hematite transition during thermal treatment, maintaining ferrimagnetic stability up to 550 °C, while higher Gd contents lead to non-magnetic Gd2O3 formation. Bleija [24] reported that Fe3O4 nanoparticles display ferrimagnetic behavior with saturation around 0.2 T in biodegradable polymer matrices, where magnetic and electromagnetic properties depend strongly on nanoparticle dispersion. Likewise, Gerbreders [25] synthesized highly pure, ~10 nm Fe3O4 nanoparticles exhibiting stable superparamagnetic behavior, suitable for biomedical and agricultural applications.
Similarly, recent research on SiO2-based nanofluids has shown their strong potential to enhance interfacial phenomena and heat transfer in porous media. Their stability and dispersion behavior critically influence thermal efficiency [26] while experimental and mesomechanical studies report improved wettability, energy coupling, and matrix modification [27]. Moreover, SiO2–surfactant hybrid systems further optimize these interactions by altering microstructure and promoting uniform energy distribution [28].
While several studies have established the feasibility and general performance of EM heating, most focus on validating recovery efficiency or modeling production response. Few have been designed to isolate and quantify the energy absorption mechanisms or systematically analyze how initial water saturation and nanoparticle addition affect heating behavior in representative rock–fluid systems. In this way, this study introduces a novel experimental–numerical framework aimed at elucidating energy absorption and heat transfer dynamics within a reservoir-representative rock–fluid system subjected to electromagnetic radiation. Unlike previous works that focus primarily on bulk heating effects, this research investigates two synergistic factors governing EMH efficiency: (1) water saturation, which modulates both dielectric polarization and heat distribution pathways within the porous medium, and (2) the incorporation of functionalized nanoparticles, designed to amplify electromagnetic field interactions and enhance thermal conductivity. By systematically studying these parameters, the work establishes quantitative links between microstructural heterogeneity, fluid composition, and macroscale thermal performance, offering actionable insights for the optimization of electromagnetic-based enhanced oil recovery (EOR) strategies in Colombian heavy oil reservoirs.
A next-generation nanomaterial—an iron oxide–graphene composite (Fe3O4@GO)—was synthesized and integrated into the EMH experiments. This hybrid nanostructure, engineered via in situ precipitation of magnetite nanoparticles on oxidized graphene sheets, exhibits exceptional dielectric responsiveness, magnetic tunability, and thermal conductivity, making it uniquely suited for electromagnetic coupling within porous media. The development of such new nanomaterials reflects a strong spirit of innovation, bridging advances in material science with applied reservoir engineering. Comprehensive physicochemical characterization confirmed the formation of a stable and well-dispersed nanocomposite, while reservoir-condition tests (high salinity, temperature, and acidity) validated its structural integrity, colloidal stability, and compatibility with Colombian heavy crude. These results position Fe3O4@GO as a multifunctional additive capable of bridging the gap between nanomaterial design and field-scale EMH implementation.
Five controlled experiments were conducted using rock–fluid systems with systematically varied saturation and nanoparticle loading. Each sample was subjected to microwave heating to assess the thermal amplification and energy efficiency under different physicochemical configurations. The experimental findings were subsequently extended through multiscale numerical simulations using both custom-developed computational models and CMG-STARS (Computer Modelling Group), allowing for validation, extrapolation, and performance prediction under diverse operating scenarios.
Building upon these findings, an analytical–numerical hybrid model is proposed to describe heat transfer behavior as a function of saturation state, nanoparticle concentration, and electromagnetic power input. The innovative aspect of this model lies in its ability to embed EMH-specific phenomena into a commercial reservoir simulator—a capability not natively supported by existing tools. Consequently, the model allows the estimated temperature to account for multiple interrelated factors, such as changes in the system’s heat capacity, fluid movement, conductive heat transfer, phase changes, latent heat, and oil recovery. This integrated approach not only expands the current understanding of nanostructure-assisted electromagnetic heating but also establishes a scalable, field-applicable framework for optimizing EOR operations. The proposed methodology thus represents a paradigm shift toward data-driven, material-aware reservoir engineering—bridging laboratory-scale innovation with next-generation energy recovery technologies.

2. Materials and Methods

2.1. Materials

The reagents used for the synthesis included graphite powder, sodium nitrate, potassium permanganate, sulfuric acid (98%), hydrochloric acid, hydrogen peroxide (30%), sodium chloride (99.5%), sodium hydroxide, ferrous sulfate heptahydrate, potassium nitrate, and toluene (analytical grade, Merck-Sigma-Aldrich, St. Louis, MO, USA). The magnetite-based nanomaterials were synthesized via a modified Hummers method combined with a co-precipitation technique to obtain a stable magnetic nanofluid.
The crude oil used in this study was classified as heavy, with an API gravity of 13° and a density of 0.9792 g/mL. Its compositional profile was dominated by resins (43.9 wt%) and saturated hydrocarbons (26.4 wt%), followed by aromatics (20.5 wt%) and asphaltenes (9.2 wt%). The formation brine associated with this crude exhibited a high salinity, primarily composed of chloride ions (~22,243 mg/L) and sodium (~7250 mg/L), with significant concentrations of calcium (~5122 mg/L), magnesium (~683 mg/L), potassium (~142 mg/L), strontium (~17.1 mg/L), and barium (~32.3 mg/L). The sand used for the experiments consisted of silica sand with a mesh size of 40/80.

2.2. Synthesis of Nanofluid

Graphene oxide (GO) was synthesized from natural graphite flakes (≤40 µm) using a modified Hummer’s method based on the protocol reported by Tour et al., omitting sodium nitrate to reduce by-product formation. Briefly, 1 g of pretreated graphite was dispersed in a mixture of concentrated sulfuric acid (120 mL) and phosphoric acid (13.3 mL) in a 250 mL beaker. The suspension was stirred at 500 rpm and maintained at 50 °C. Oxidation was initiated by gradually adding 6 g of potassium permanganate in small increments (0.5 g every 10 min) to prevent excessive heat generation due to the exothermic nature of the reaction. After 24 h of continuous stirring, the reaction was quenched by transferring the mixture into 300 mL of cold deionized water (5 °C), followed by the slow addition of 30% hydrogen peroxide (10 mL) until effervescence ceased and the mixture turned orange [29].
The oxidized graphite was purified through sequential centrifugation and washing steps. First, the solid residue was washed twice (2×) with 10% HCl solution for 20 min per cycle to remove residual metal ions. Then, it was washed seven times (7×) with deionized water until the pH stabilized at ~5–6. To promote exfoliation, the purified graphite oxide was sonicated in 250 mL of deionized water using an ultrasonic probe (750 W, 19 mm tip, 90 min, pulse mode 1 s:1 s). The final GO dispersion was freeze-dried and stored as powder for further use [29,30].
Magnetic graphene oxide nanocomposites (Fe3O4 @GO) were synthesized by in situ precipitation of magnetite nanoparticles onto GO nanosheets. In a typical synthesis, 200 mL of an aqueous GO dispersion (5 mg/mL) was heated to 90 °C under a nitrogen atmosphere and vigorous stirring (1000 rpm). Once thermal equilibrium was reached, 25 mL of a freshly prepared FeSO4 + 7H2O solution was added to promote adsorption of Fe2+ ions onto the GO surface. After 15 min of incubation, a second solution containing NaOH and KNO3 (25 mL) was added dropwise to initiate the precipitation of Fe3O4 nanoparticles via partial oxidation of Fe2+. The reaction proceeded for 30 min under continuous stirring. The resulting Fe3O4 @GO nanocomposites were purified through repeated centrifugation and washing with ethanol (5–7×) until neutral pH was achieved. The purified nanomaterials were redispersed in 25 mL of deionized water and subsequently freeze-dried to obtain a stable magnetic nanocomposite powder [31].

3. Methodology

This investigation consists of two main parts. The first part presents the synthesis and evaluation of the proposed nanomaterial, while the second proposes an experimental setup to test its efficiency in enhancing heat transfer during a microwave electromagnetic heating process. In this latter part, reservoir simulation is applied to interpret and estimate the amount of heat transferred in each case as a function of the temperature reached, allowing the effect of the nanomaterial on improving heat transfer to the sample to be studied.

3.1. Characterization of the Graphene Oxide (GO) and Magnetic Graphene Oxide Fe3O4@GO)

Fourier transform infrared (FTIR) spectroscopy was performed using a Nicolet iS50 spectrophotometer (Thermo Fisher Scientific, Waltham, MA, USA) equipped with an attenuated total reflectance (ATR) diamond crystal accessory. Spectra were collected in the range of 4000–400 cm−1 by placing a small amount of solid sample directly onto the ATR crystal and applying uniform pressure to ensure optimal contact. FTIR spectroscopy provides valuable information about the chemical bonding and functional groups present in carbon-based materials, making it an essential tool for confirming the successful oxidation and functionalization of graphite.
Raman spectroscopy analysis was carried out using a Lab RAM HR Evolution spectrometer (Horiba, Palaiseau, France) coupled with a confocal optical microscope. Measurements were obtained using a 50× objective lens and a 532 nm laser operating at 5% of its nominal power to avoid sample degradation. The powdered samples were deposited onto aluminum-coated microscope glass slides to enhance signal clarity and minimize fluorescence background. Raman spectroscopy is one of the most widely used techniques for the characterization of carbon allotropes and other carbon-based materials.

3.2. Experimental Design to Evaluate Heat Transfer as a Function of Nanoparticle and Water Content in an EMH Process

To evaluate the effect of the developed nanomaterial on heat transfer in an electromagnetic heating (EMH) process for viscosity reduction, a representative sample of a heavy oil reservoir is prepared, in which sand, heavy crude oil, formation water, and the added nanoparticles will coexist. This sample consists of three main layers: the target layer, which represents a productive reservoir stratum and contains the fluid or nanoparticle saturation; two control layers, which are dry and placed above and below the target layer. All layers must be the same thickness, ranging between 5 and 10 cm.
Since both the target and control layers must be aligned with the thermocouples, a fourth part of sand (not under study) is included: a bed of dry, sieved river sand that serves as the base for the experimental layers.
The target layer or section of interest represents the productive rock of the reservoir; it is primarily a layer of sand which is saturated with fluids from the reservoir: high viscosity oil and water. To test the effects of the nanofluid, some experiments included a concentration of 500 ppm of nanoparticles dispersed in the aqueous phase. This concentration was selected based on preliminary screening tests, which indicated that 500 ppm provided optimal stability and interfacial activity without causing particle agglomeration or affecting the viscosity of the based fluid. The nanofluid was prepared by dispersing the required amount of nanoparticles in deionized water using ultrasonic agitation for 30 min to ensure homogeneous dispersion. Nine experiments were proposed for the experimental design where the target layer will have different saturations each time as described in Table 1.
To prepare the target layer, the sand is sieved and saturated with fluids depending on the case under study. The volume of each fluid (oil, water, or nanofluid) added to the mixture was calculated, multiplying the estimated porous volume of the sand layer (typically 35% of the total volume, for uncompressed sands) by the fluid saturation.
The corresponding volumes of sand, water, and oil are mixed to ensure homogeneity and eliminate air bubbles.
The layers are placed inside a reactor in the following order (from bottom to top):
  • The base layer is the bed of river sand, which is compacted to form a level, uniform surface.
  • A quartz tube is inserted above it to isolate the antenna.
  • Then, the bottom control layer is placed, followed by the target layer, and finally the top control layer.
All layers must be leveled to maintain uniformity.
Once the sample preparation is completed, the tank is sealed, the thermocouples are set, then the system is turned on for a predetermined period, and the temperature rise over time is recorded. The actual input power to the system is monitored as it may fluctuate slightly due to the challenge of maintaining constant impedance tuning. The maximum nominal power of this magnetron is 5.5 kW, according to the manufacturer’s specifications. For experiments from 1 to 3, at a certain point, the microwave system is turned off, and the subsequent temperature decrease continues to be logged to study the heat losses of the system.

Simulation Matching for Data Processing

To process the temperature data and convert it into heat transfer estimates to the system, reservoir simulation is used as a tool. Through history matching the temperature profiles, the amount of heat effectively transferred to the system can be analyzed, allowing the evaluation of whether the presence of nanoparticles enhanced heat transfer [32,33,34]. The approach used for this processing of the results involves employing a reservoir simulator to reproduce the results obtained in the previously presented experiments and, through this tool, interpret the amount of energy (heat) transmitted by the electromagnetic wave in each case. It is important to note that in this case, the simulator is not used as a predictive tool, but rather to calculate heat transfer based on the temperatures reached in the experiments. This approach relies on the simulator’s ability to accurately represent thermal processes as a function of properties such as the heat capacities and thermal conductivities of the different materials, as well as phenomena including phase changes and system heat losses [35,36,37].
Based on the temperature profiles obtained from the tests, a history match of the results was performed, developing a representative simulation model of the laboratory prototype. By performing the match, it is possible to evaluate the thermal efficiency of the technology and determine the heating behavior as a function of time and fluid saturation. It is important to note that not all the input energy delivered to the system by the magnetron is effectively transferred to the target layer. The purpose of performing history matching of the numerical simulation is to quantify how much heat is transferred to the layer of interest by analyzing the temperatures achieved. In this way, it is possible to determine if magnetic nanocomposites have an effect on the efficiency of microwave heat transfer. The effect of water saturation and water vaporization is also investigated, as these nanocomponents are suspended in the aqueous phase.
Considering the dimensions and shape of the experimental setup, a radial model was constructed. The model consists of 80 cells in direction I, representing the 80 cm radius of the prototype. Additionally, it includes 30 cm in the K direction, representing 10 cm of the upper sand, 10 cm of the lower sand, and 10 cm of the sand saturated with crude oil, water, and nanoparticles as applicable for the test included in the experimental design. The null space in the initial cells represents the quartz tube where the microwave-generating antenna is located (Figure 1). The porosity of the medium is 35% and the permeability is 6 Darcy (D). Finally, the sand layers were also differentiated by the thermal properties corresponding to average values reported by other authors. The experimental setup included the three different sand layers where the intermediate sand represents the study formation, and the upper and lower sands represent thermal insulators and the overburden and under burden layers (Shown in Figure 1).
To evaluate the potential compositional change in the crude oil in later stages, the crude oil is represented for 5 pseudo-components. The in situ oil upgrading is modeled by chemical reactions between the defined pseudo-components [32].
To achieve the match between the experimental data and the simulation results, special keywords previously defined in CMG-STARS were used. These allow for adjusting reference temperatures for each block (UHTR) and setting heat transfer coefficients (TMPSET), considering the effect of boundaries; to improve the match in heat losses to the environment, three additional temperature adjustment points are added at the external boundaries of the three layers (average between the most external thermocouple temperature and the ambient temperature).
Once the simulation model is matched with the experimental data, the simulator can be used to calculate the amount of energy (heat) that needs to be added to the system to achieve this matching. This allows us to approximate how much heat was effectively transferred to the system due to the wave, as well as the approximate heat flow from the antenna, which can then be compared to the power consumed by the magnetron. The results are presented in the following section.

4. Results

This section presents the results obtained from the two main parts of the study. First, the characterization of the synthesized nanomaterial is presented, followed by the results of the experimental setup and the simulation used for interpreting the data.

4.1. Nanomaterial Characterization Results

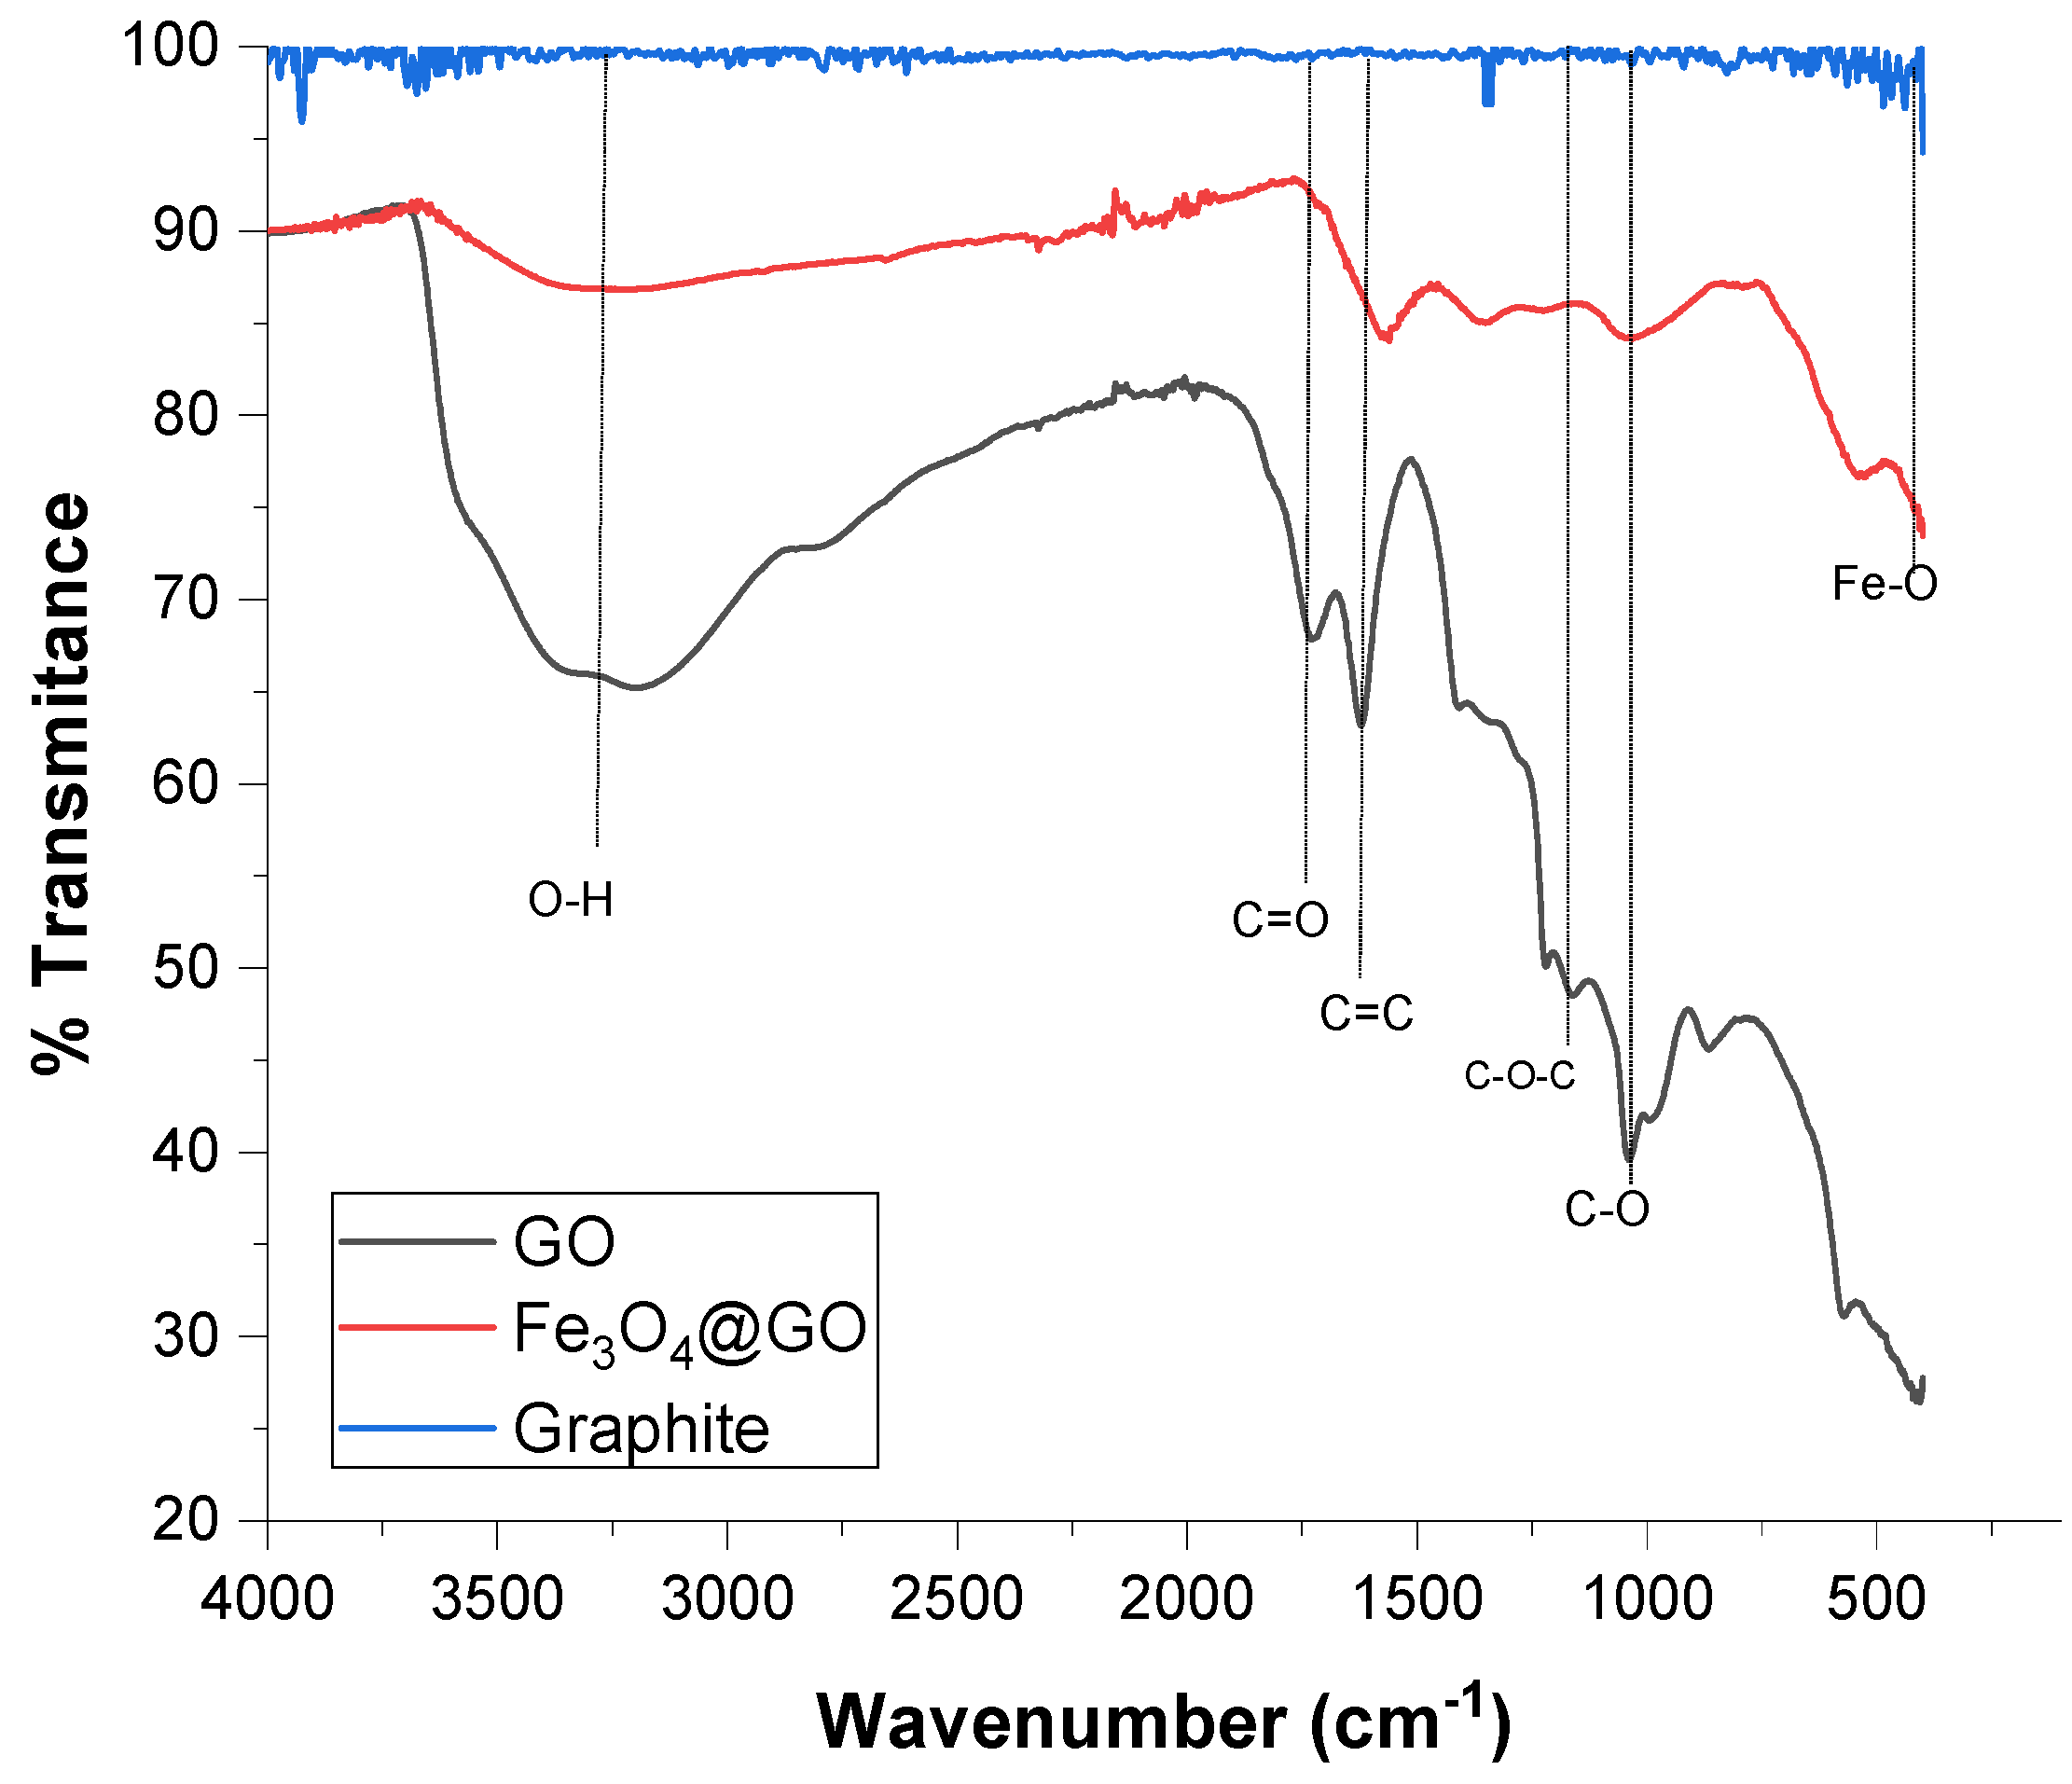
In the FTIR spectrum of graphite (Figure 2), no significant absorption bands are observed. This is attributed to the high crystallinity and symmetry of its sp2-hybridized carbon network, which does not induce a net dipole moment during vibrational transitions. In contrast, the FTIR spectrum of graphene oxide (GO) reveals the introduction of various oxygen-containing functional groups as a result of the oxidative treatment. The presence of carboxylic and carbonyl groups, mainly at the sheet edges, and hydroxyl and epoxy groups on the basal planes, is consistent with previous reports. These functional groups are responsible for the broad O–H stretching band around ~3400 cm−1, the C=O stretching band at ~1720 cm−1, the C–O–C stretching near 1220 cm−1, and the C–OH bending modes around 1380 cm−1.
For the Fe3O4@GO nanocomposite, a distinct band is observed near 540 cm−1, which corresponds to the stretching vibration of Fe–O bonds in magnetite. This confirms the successful integration of Fe3O4 nanoparticles onto the GO matrix.
On the other hand, the Raman spectrum of graphene oxide (GO) (Figure 3) shows the characteristic D and G bands, commonly reported for graphenic materials. The G band, located at 1599 cm−1, corresponds to the first-order scattering of the E2g vibrational mode in sp2-hybridized carbon domains. In contrast, the D band, observed at 1327 cm−1, is associated with structural defects, sp3 carbon, and edges that break the symmetry and Raman selection rules [29]. The relatively higher intensity of the D band in GO compared to pristine graphite indicates a greater degree of disorder and successful oxidation during synthesis.
In the Raman spectrum of magnetite nanoparticles (Fe3O4), the most intense band at 650 cm−1 corresponds to the A1g vibrational mode. Two additional bands are observed at 515 cm−1 and 320 cm−1, corresponding to T2g and E2g vibrational modes, respectively. These features are in good agreement with the vibrational fingerprint of inverse spinel-type Fe3O4 and confirm the formation of the crystalline magnetite phase.

4.2. Results of the Heat Transfer Experiments

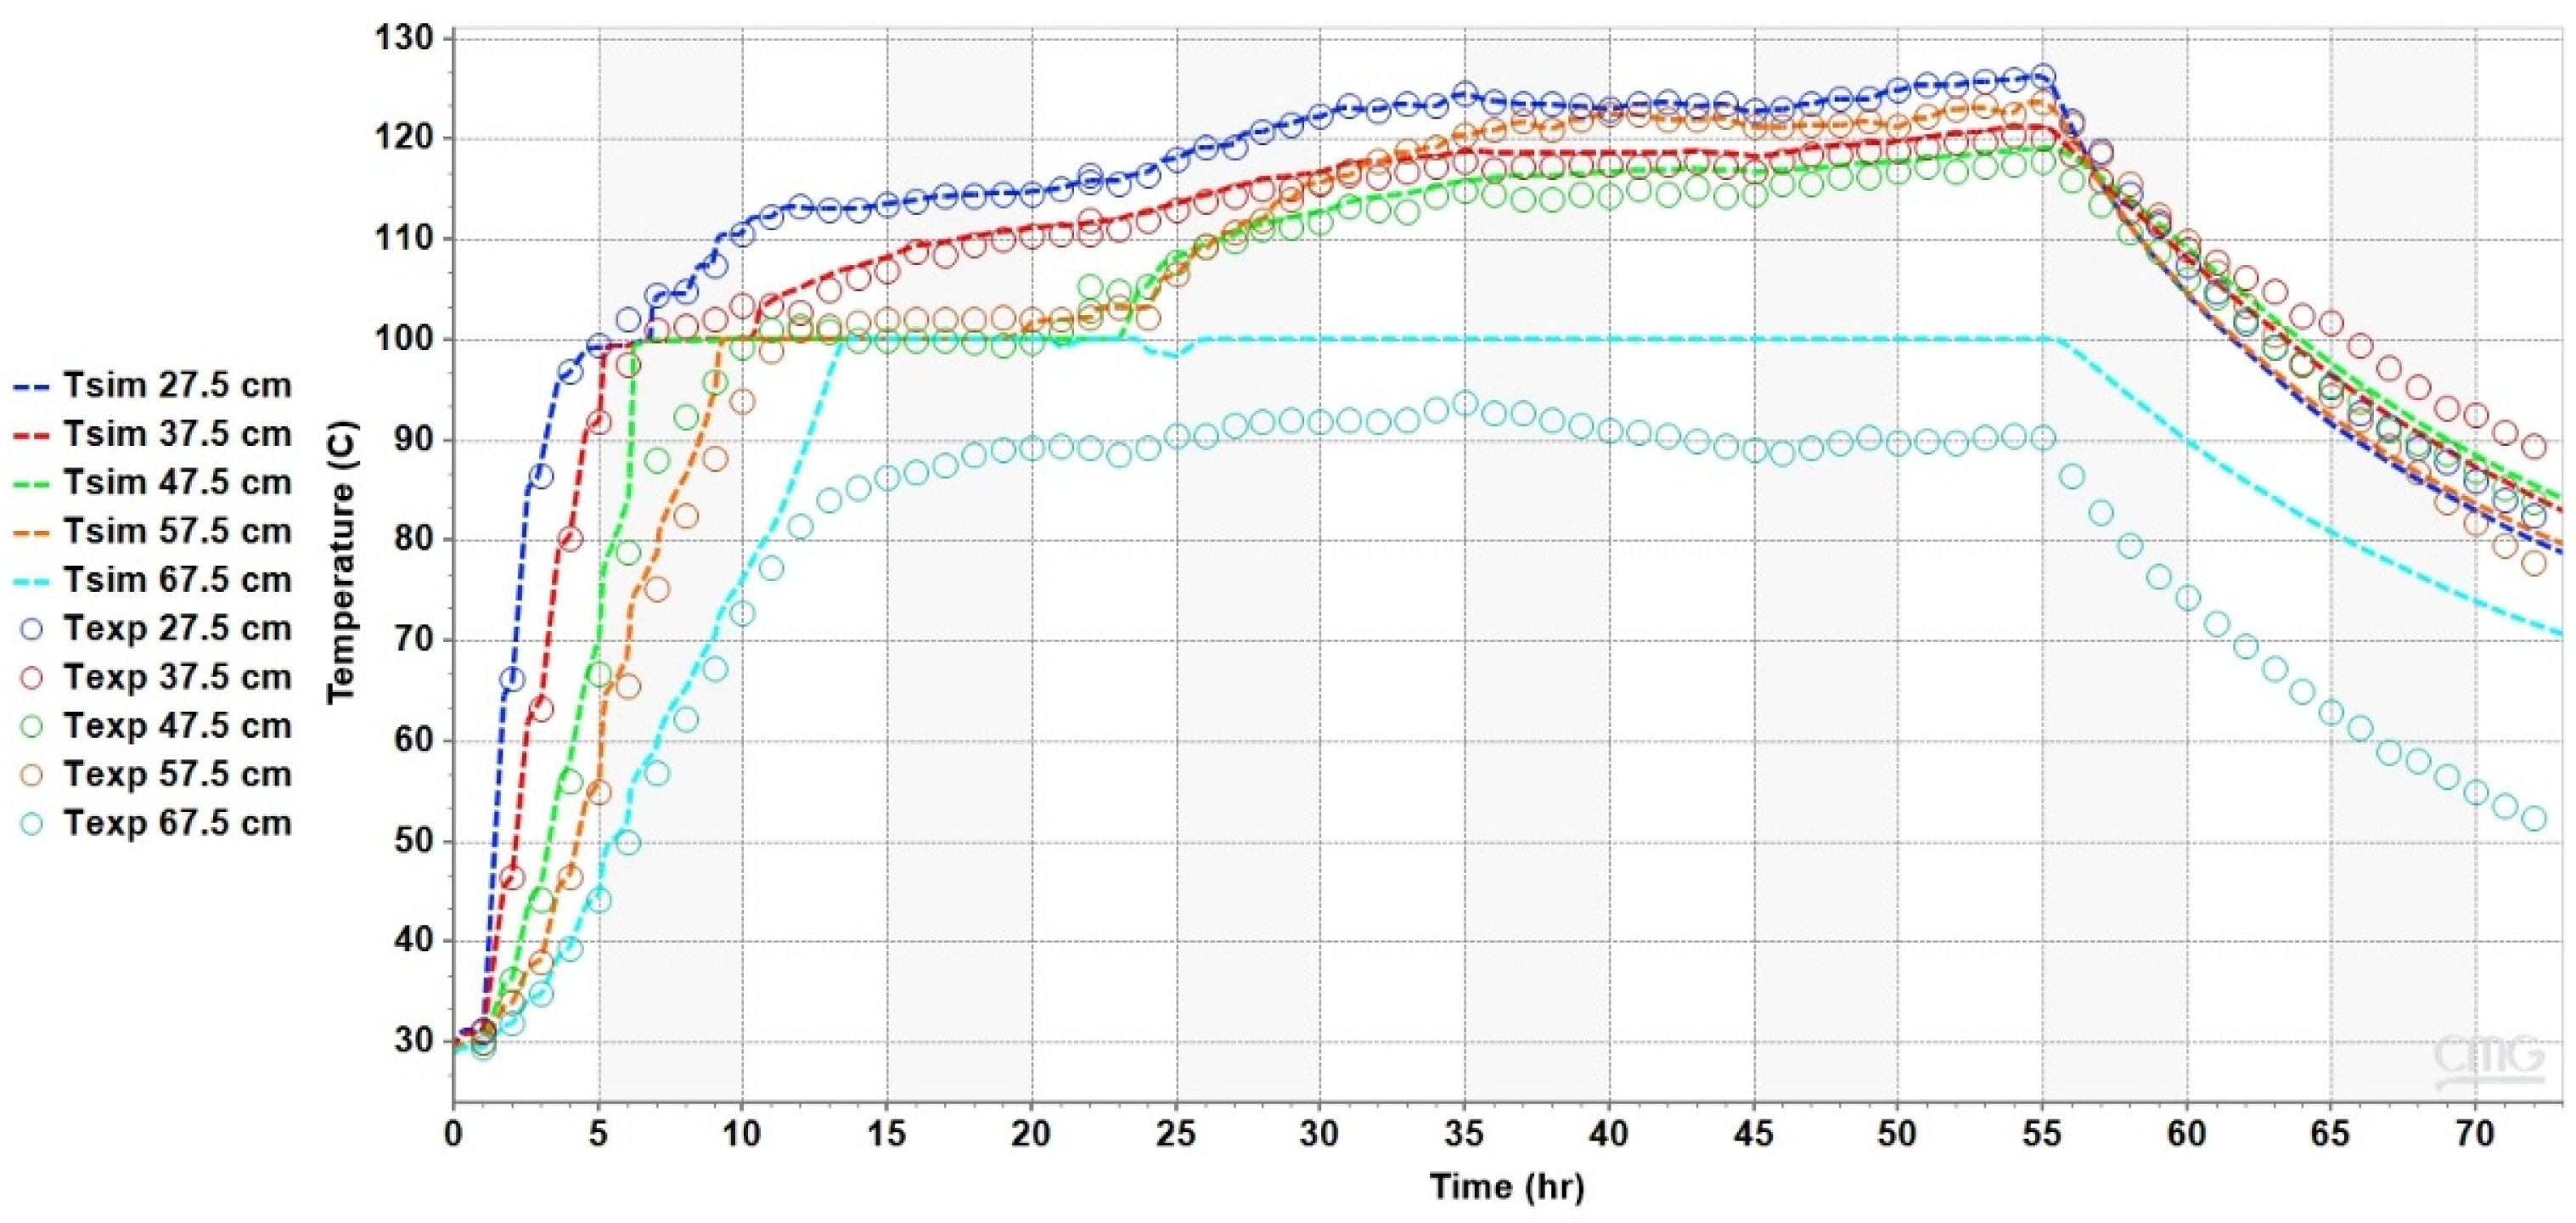
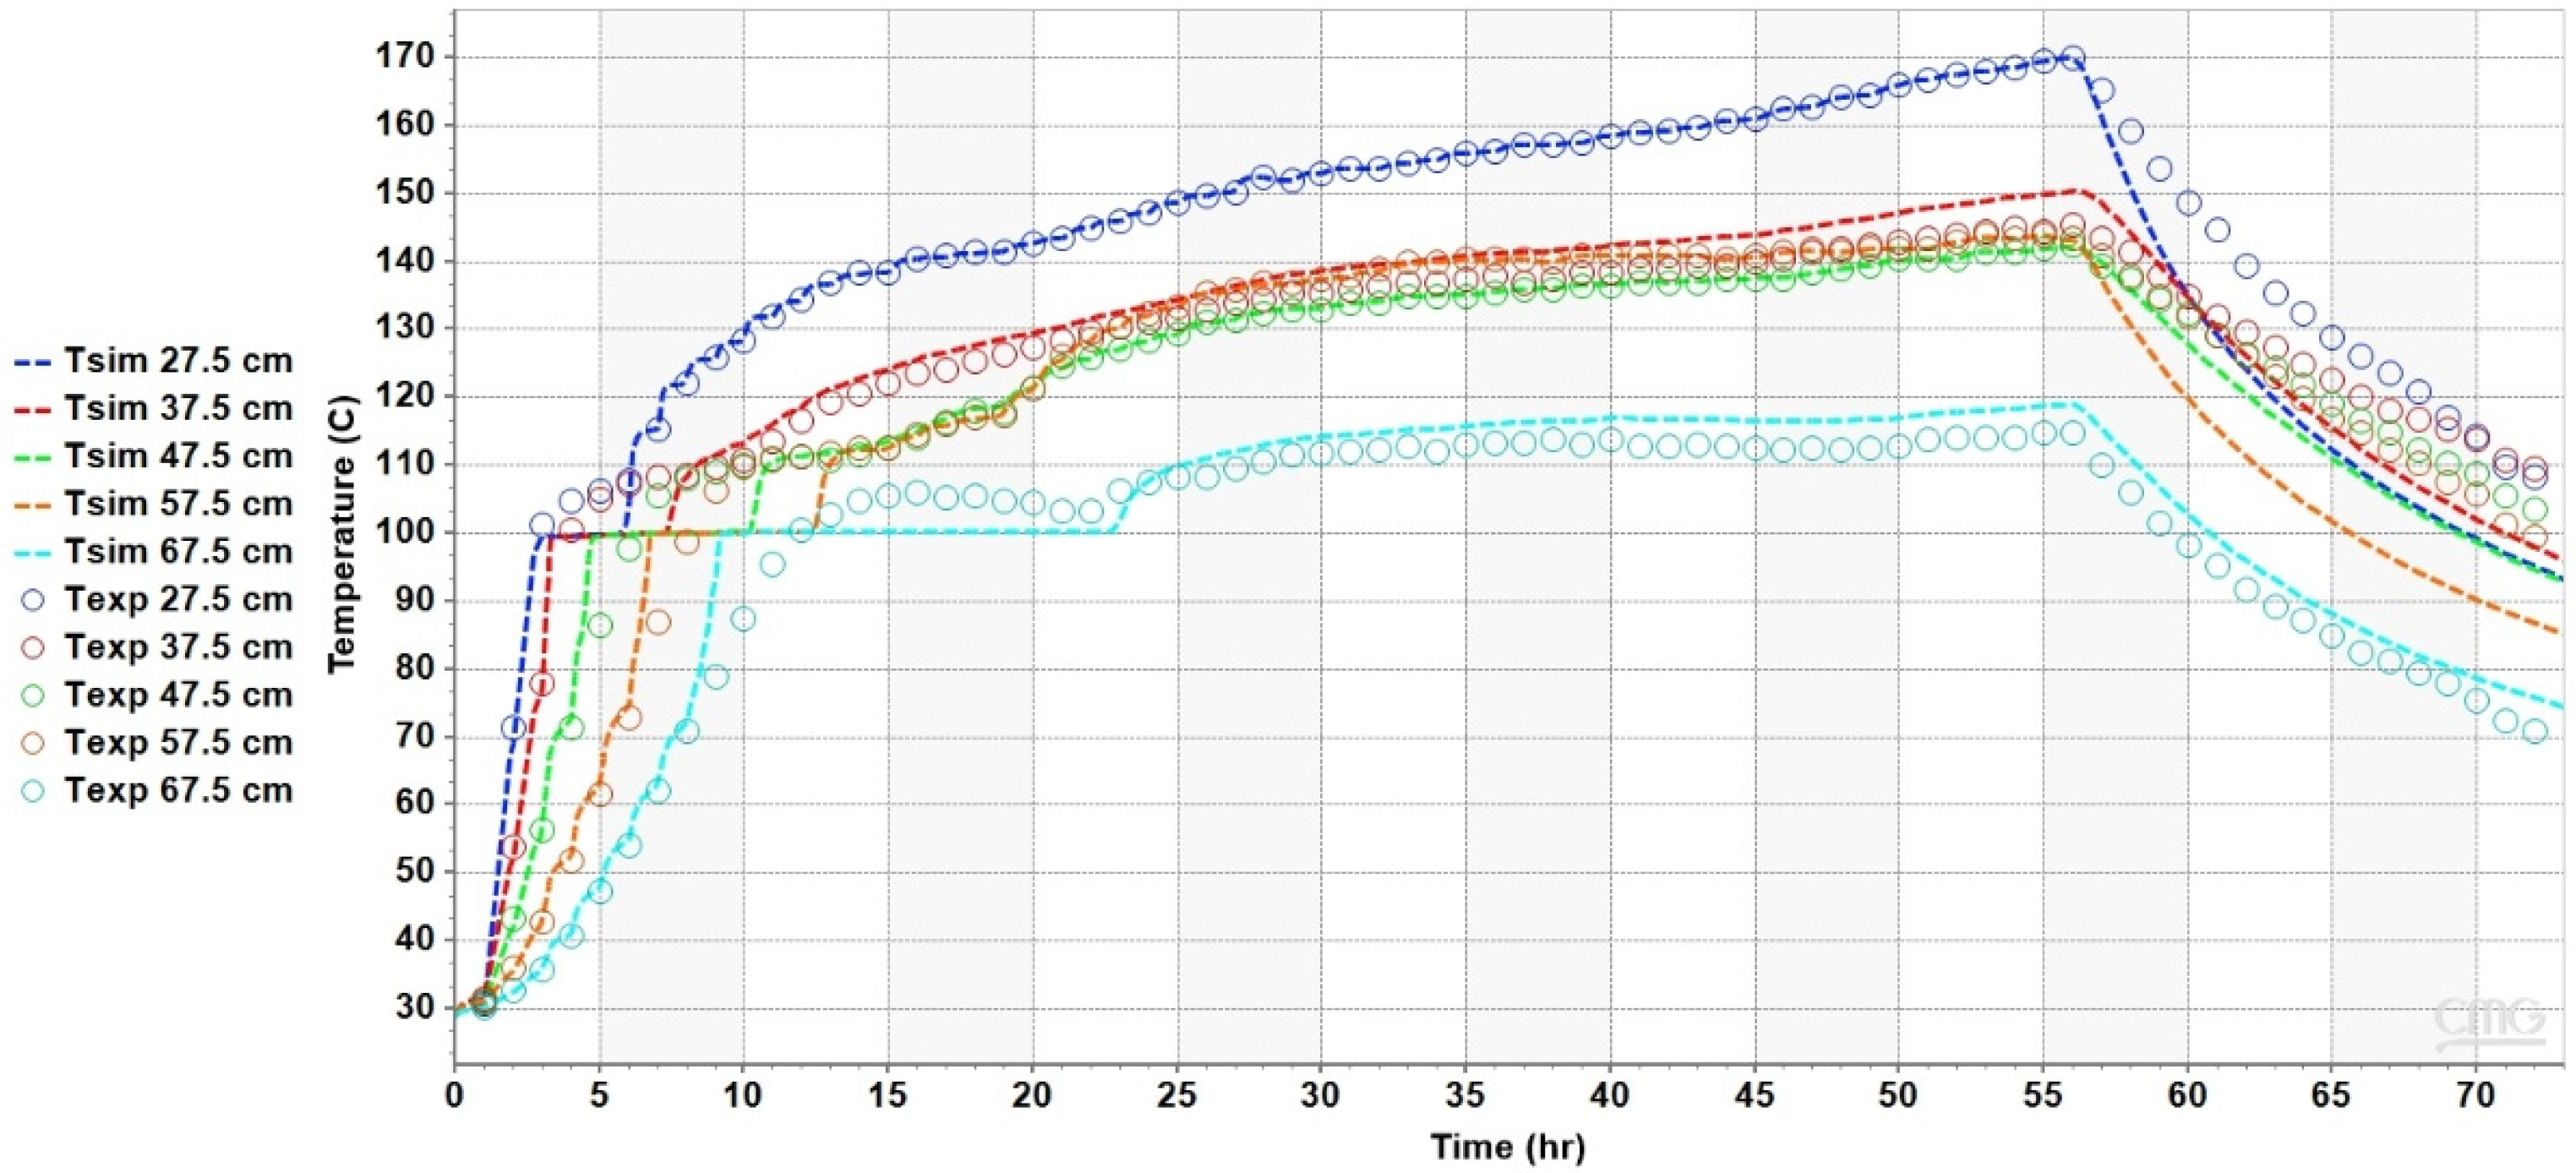
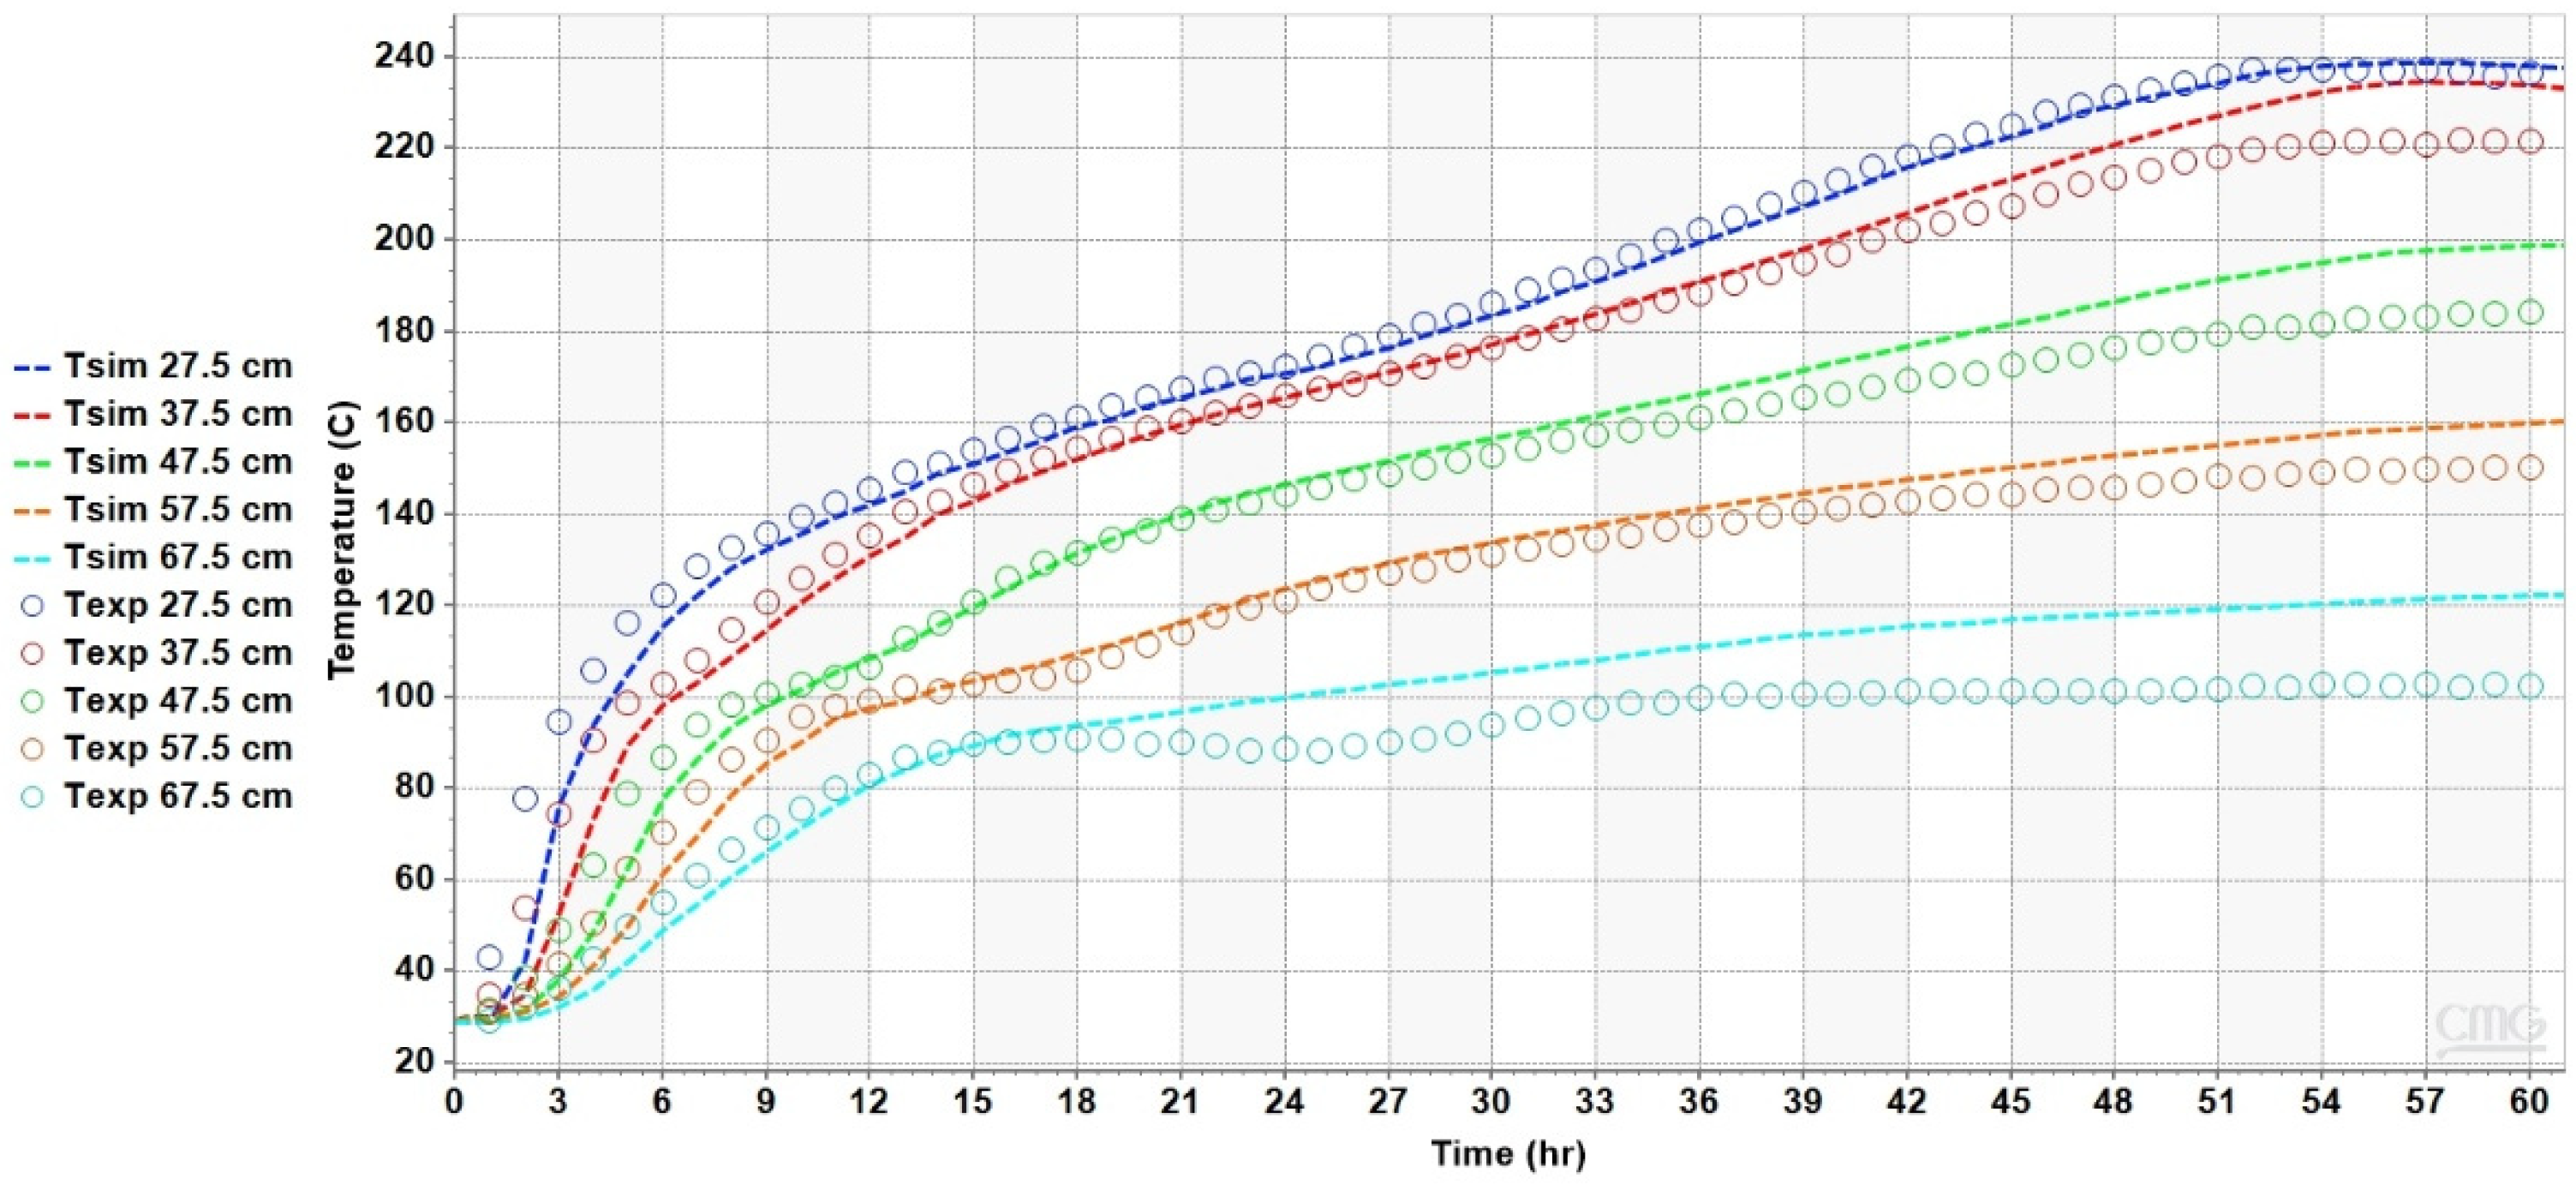
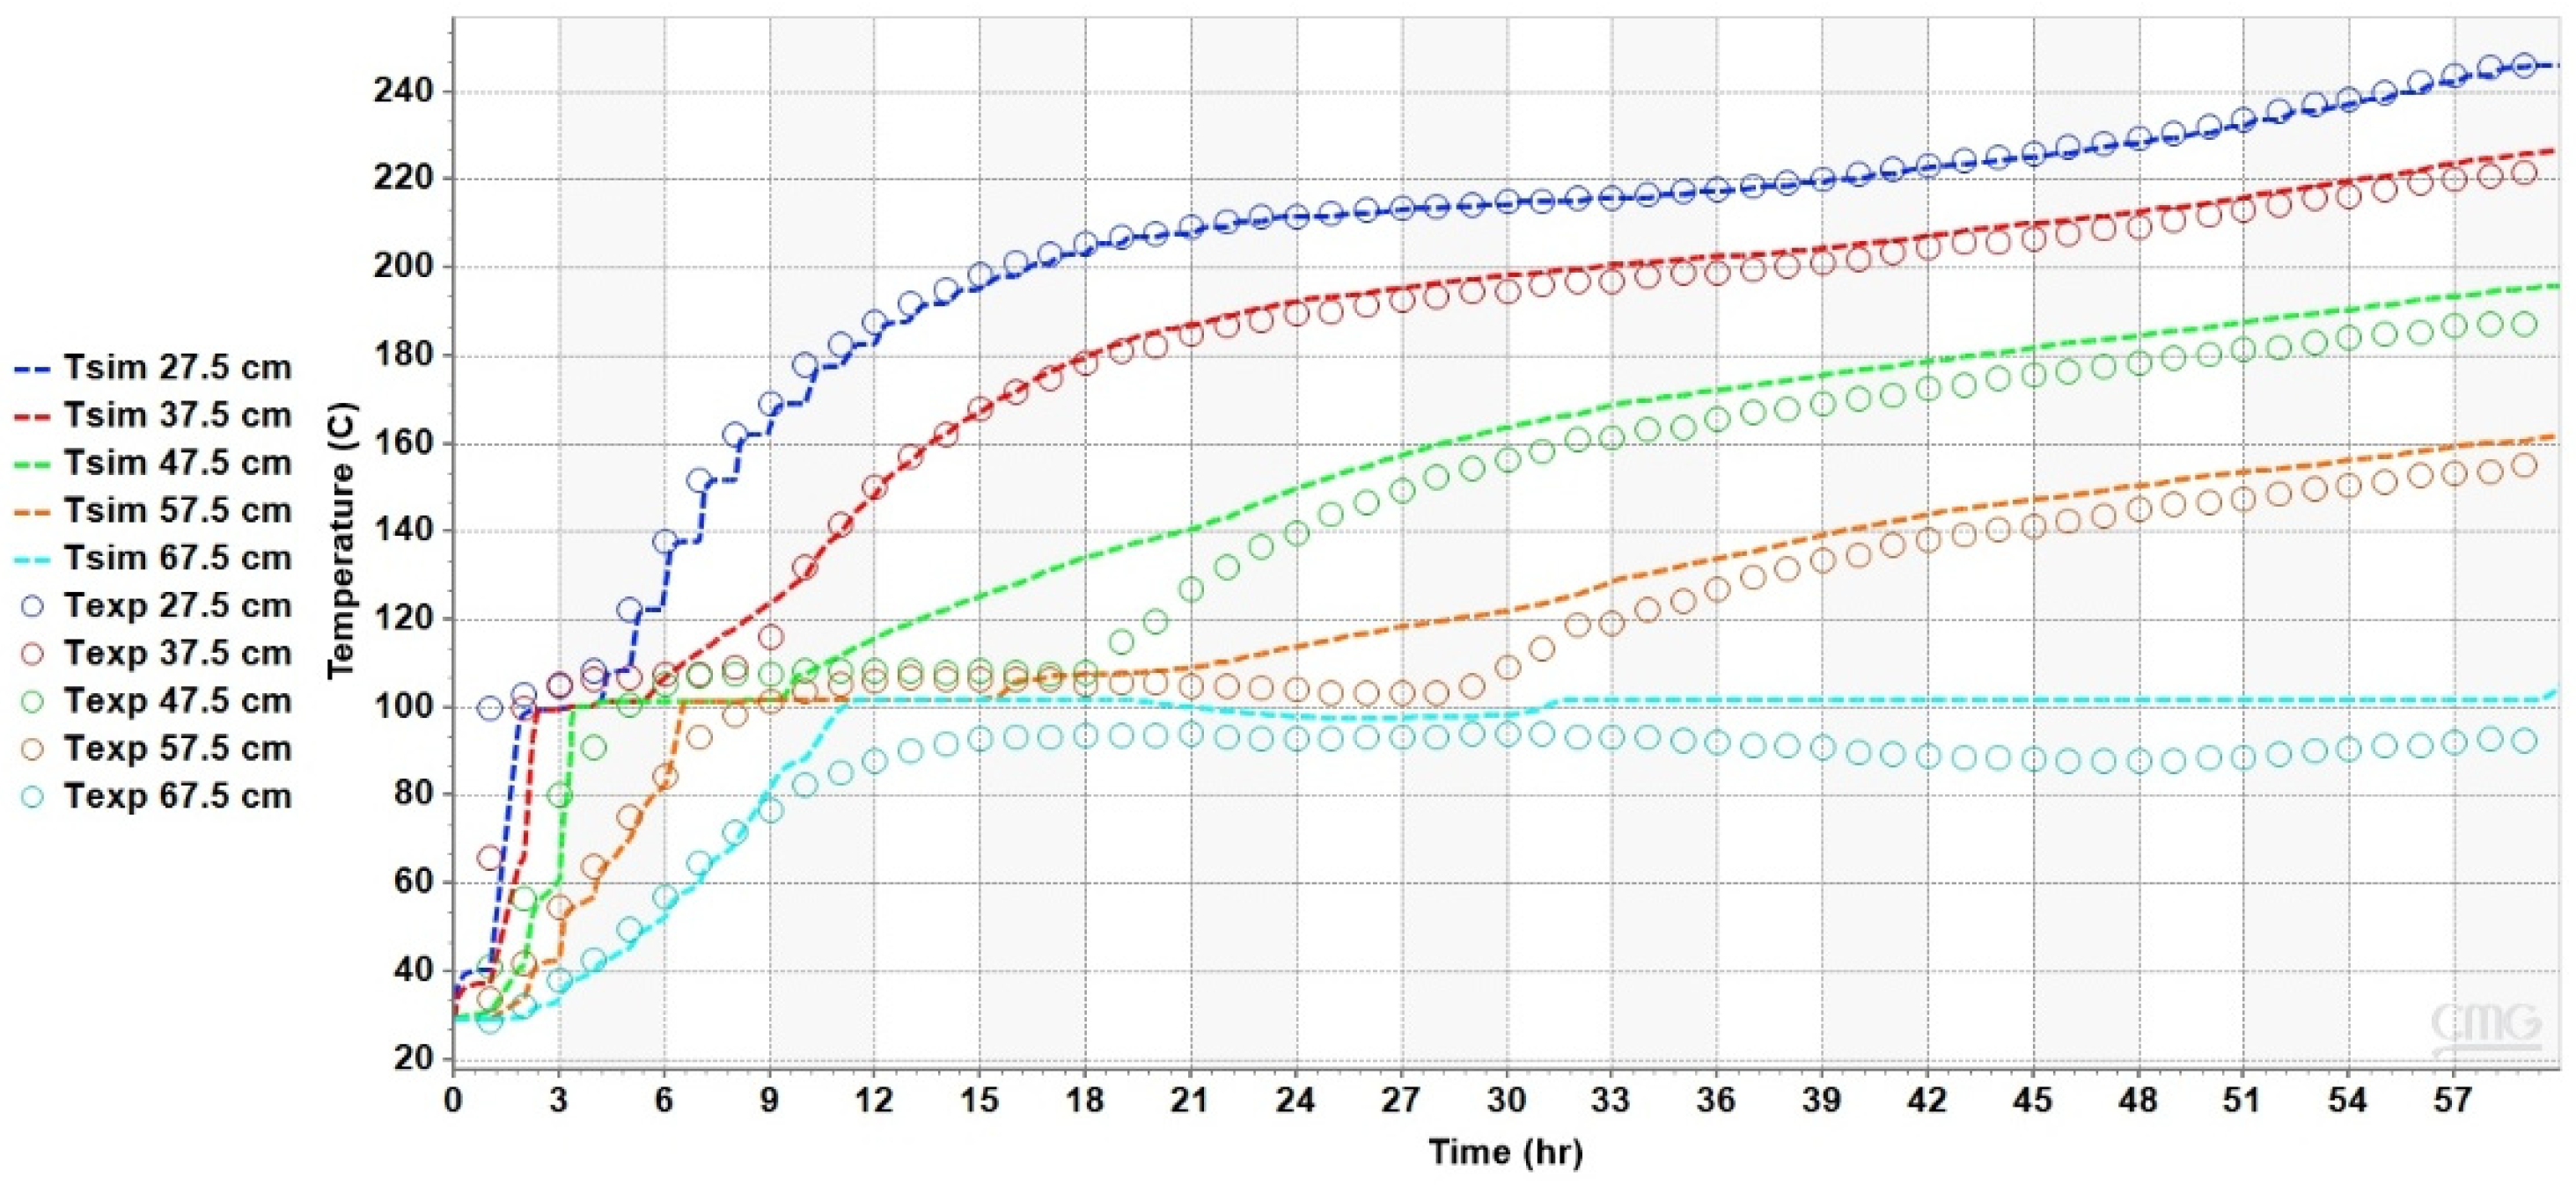
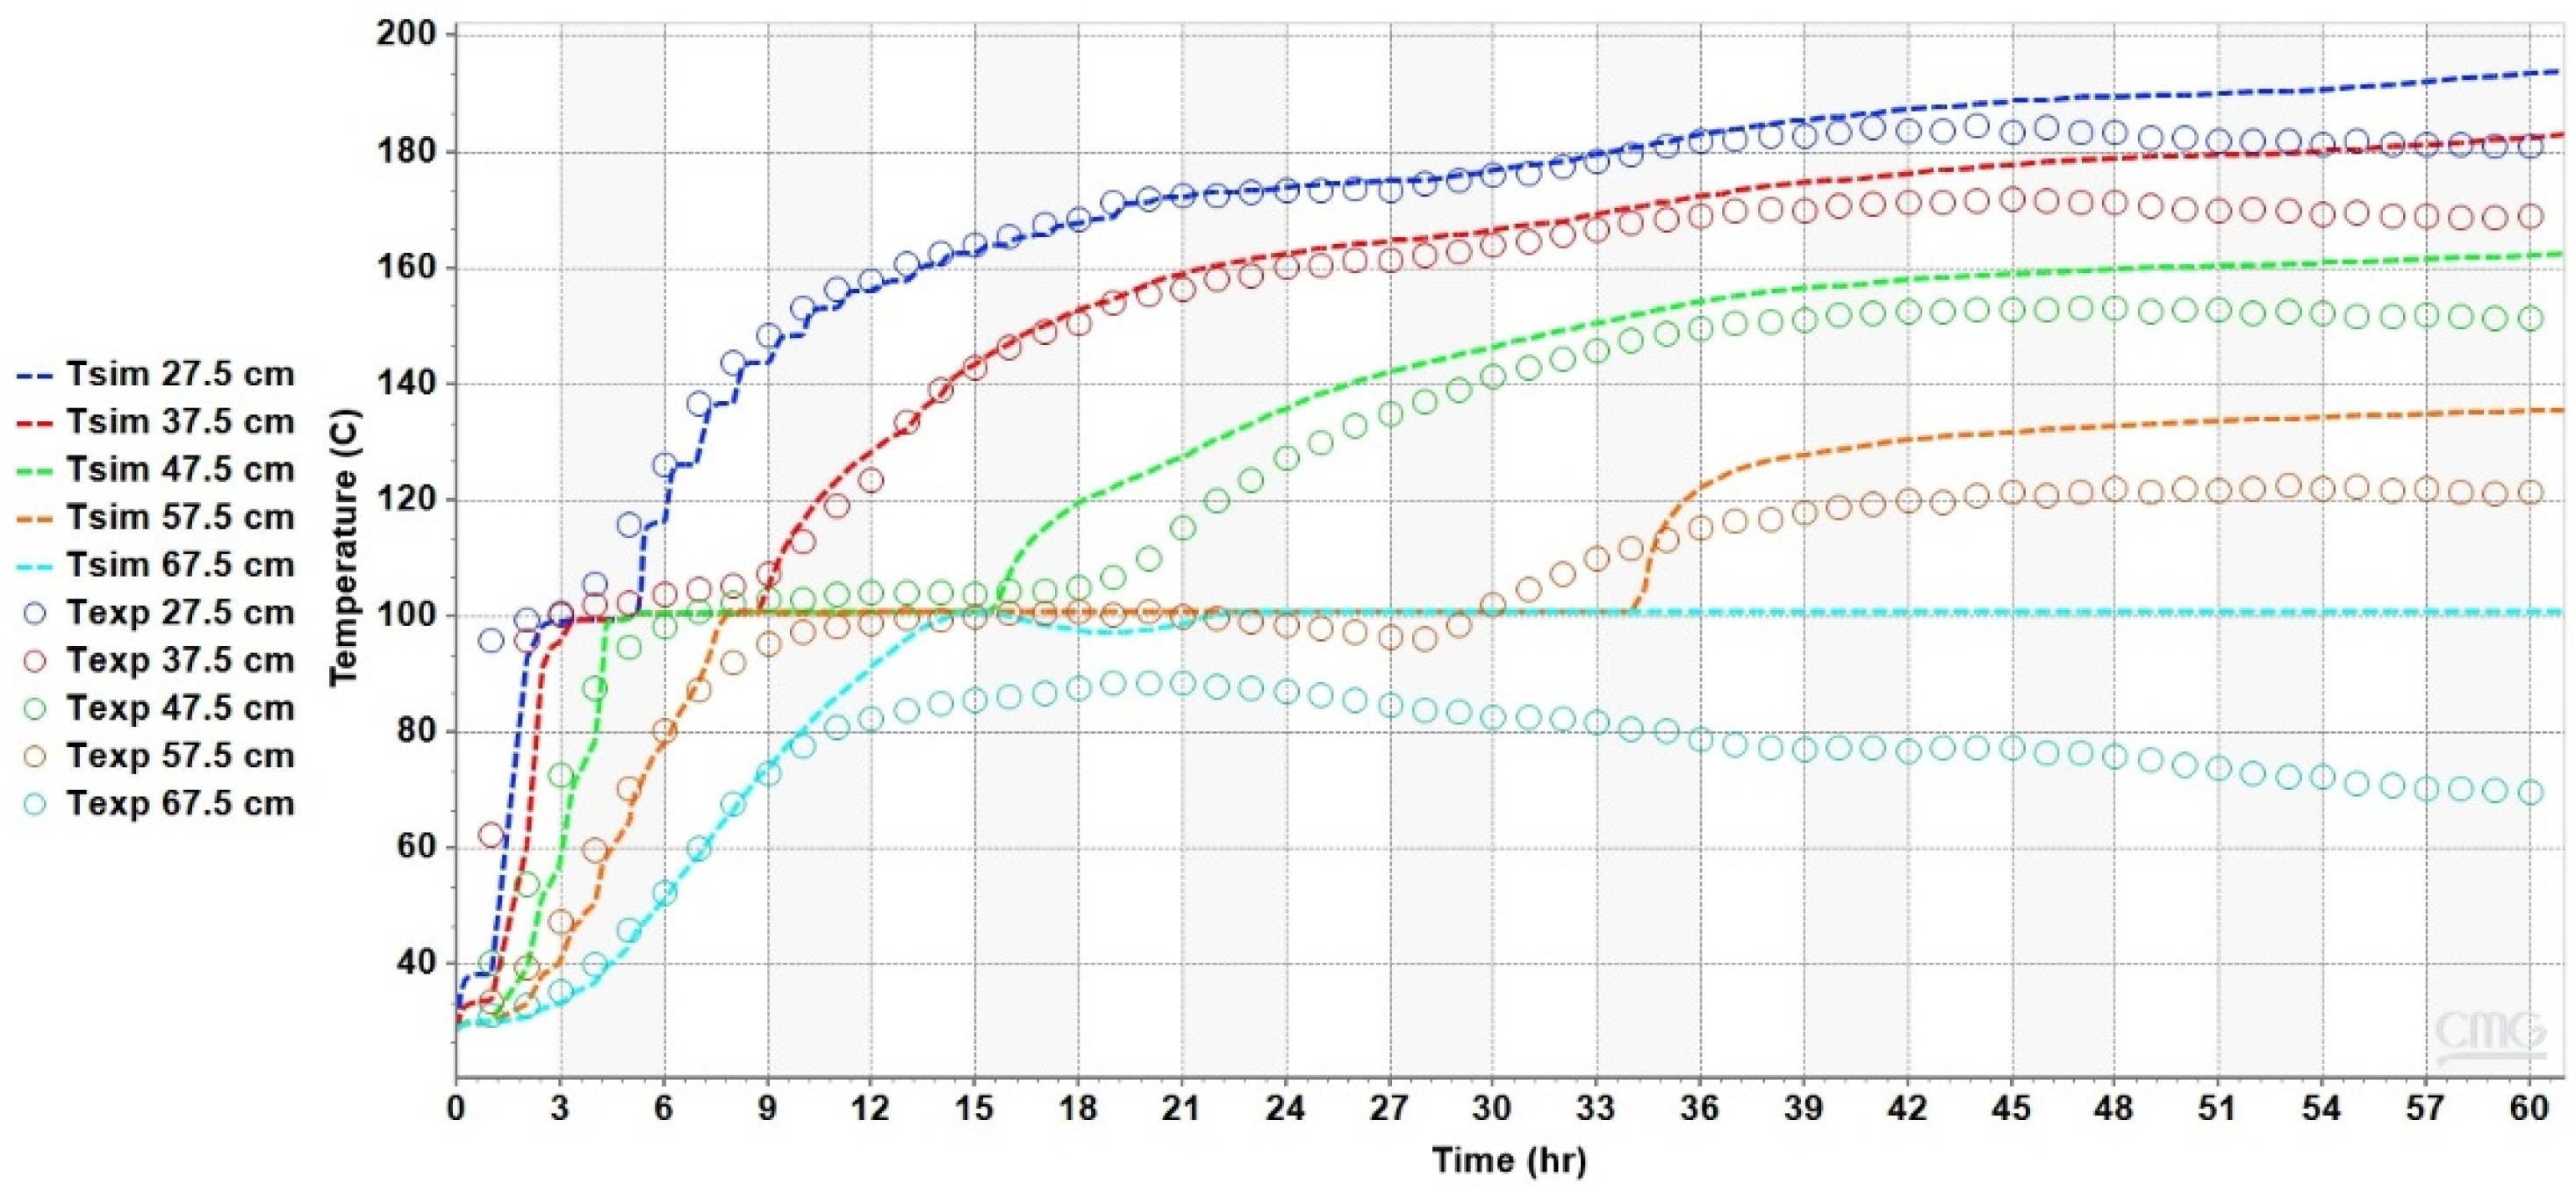
The simulation results showed a good history match between the calculated and experimentally measured temperatures. Figure 4, Figure 5, Figure 6, Figure 7, Figure 8, Figure 9, Figure 10, Figure 11 and Figure 12 present the temperature–time profiles for experiments 1 through 9, along with their corresponding simulations.
From the behavior of the profiles, the following general observations can be made: (1) The microwave system effectively increased the temperature of the target layer. (2) A temperature rise was recorded during the initial phase, which then tended to stabilize (pseudo-stable period) after approximately 20 h. (3) For experiments 1 to 3, when the magnetron was turned off, the temperature decreased. This overall trend was observed consistently across all these experiments [38].
It was observed that the greatest temperature increases in the sample occurred in areas near the center of the system. This was expected since the energy source—the waveguide—is located there [39,40,41,42].
The periods of pseudo-stability observed after approximately 20 h are attributed to two possible causes: The system may have reached a thermal equilibrium where the energy transferred to the medium equals the energy lost through heat dissipation. Also, in all of the experiments the boiling point of water was exceeded (100 °C as no pressure increase was possible because the system was open-flow), probably reducing the absorption of the electromagnetic wave and therefore decreasing the amount of heat transferred. This analysis is discussed in more detail in the following section.
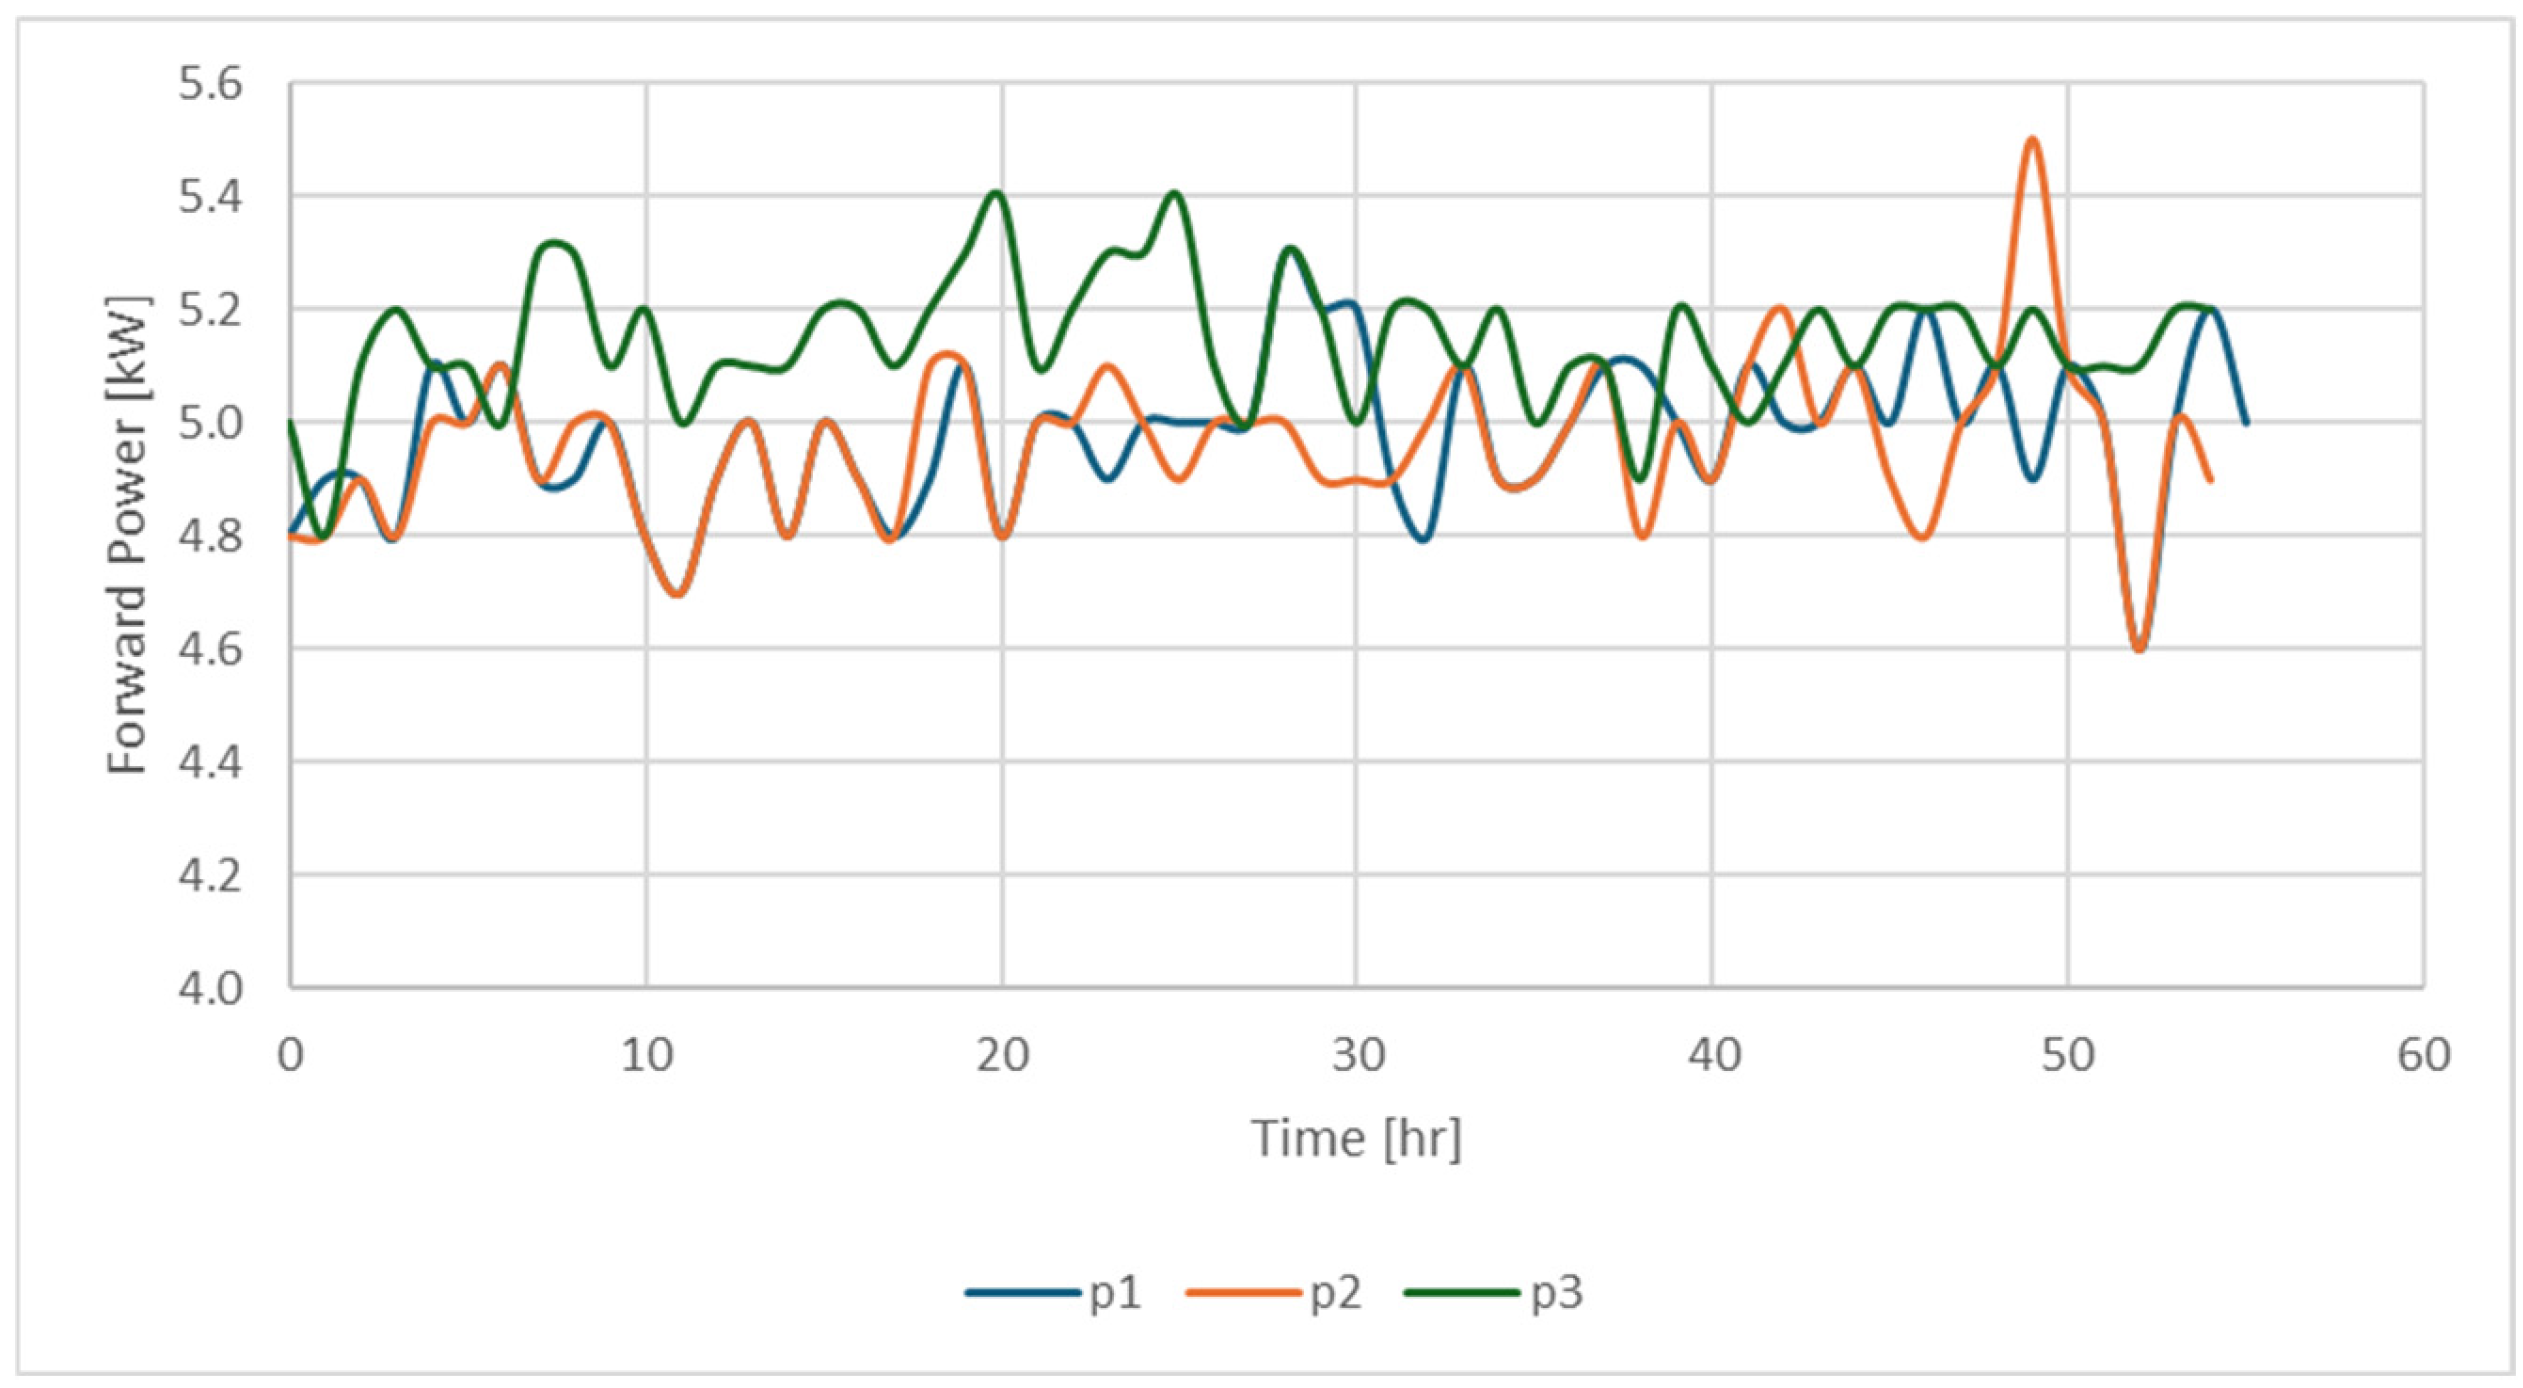
Note that experiments 1 to 3 used samples with the same composition and were conducted to assess repeatability, but a significant deviation occurred in the third one. This deviation is due to a significant variation in impedance tuning, which is related to the actual effective power transmitted to the medium. In the experimental setup, part of the power generated and transmitted by the antenna is lost due to a system configuration known as impedance tuning. This configuration is difficult to maintain consistently between experiments, resulting in variations in the actual power transferred; a higher temperature was observed in experiment 3, due to improved impedance handling. The actual power transferred in each experiment will be presented later when all experimental results are analyzed together.
Temperature over time for the thermocouples in the target stratum saturated with 30% water and 30% oil for the three tests.
To represent the heat losses to the surroundings, the cooling period data from experiments 1 to 3 were used, and the simulator was instructed to match the results to the experimental data (see Figure 4, Figure 5 and Figure 6). Through this procedure, it was found that a coefficient of −30 ± 0.6 J/min·°C is suitable for reproducing these heat losses using the UHTR keyword. This coefficient was applied in the simulation of all experiments.
In all cases a good match is obtained between simulated and historical temperatures. It is important to note that the comparison is made with the specific cell where the thermocouple is located; however, the energy is provided to the entire area of interest, so it is valid to infer that the overall match is good.
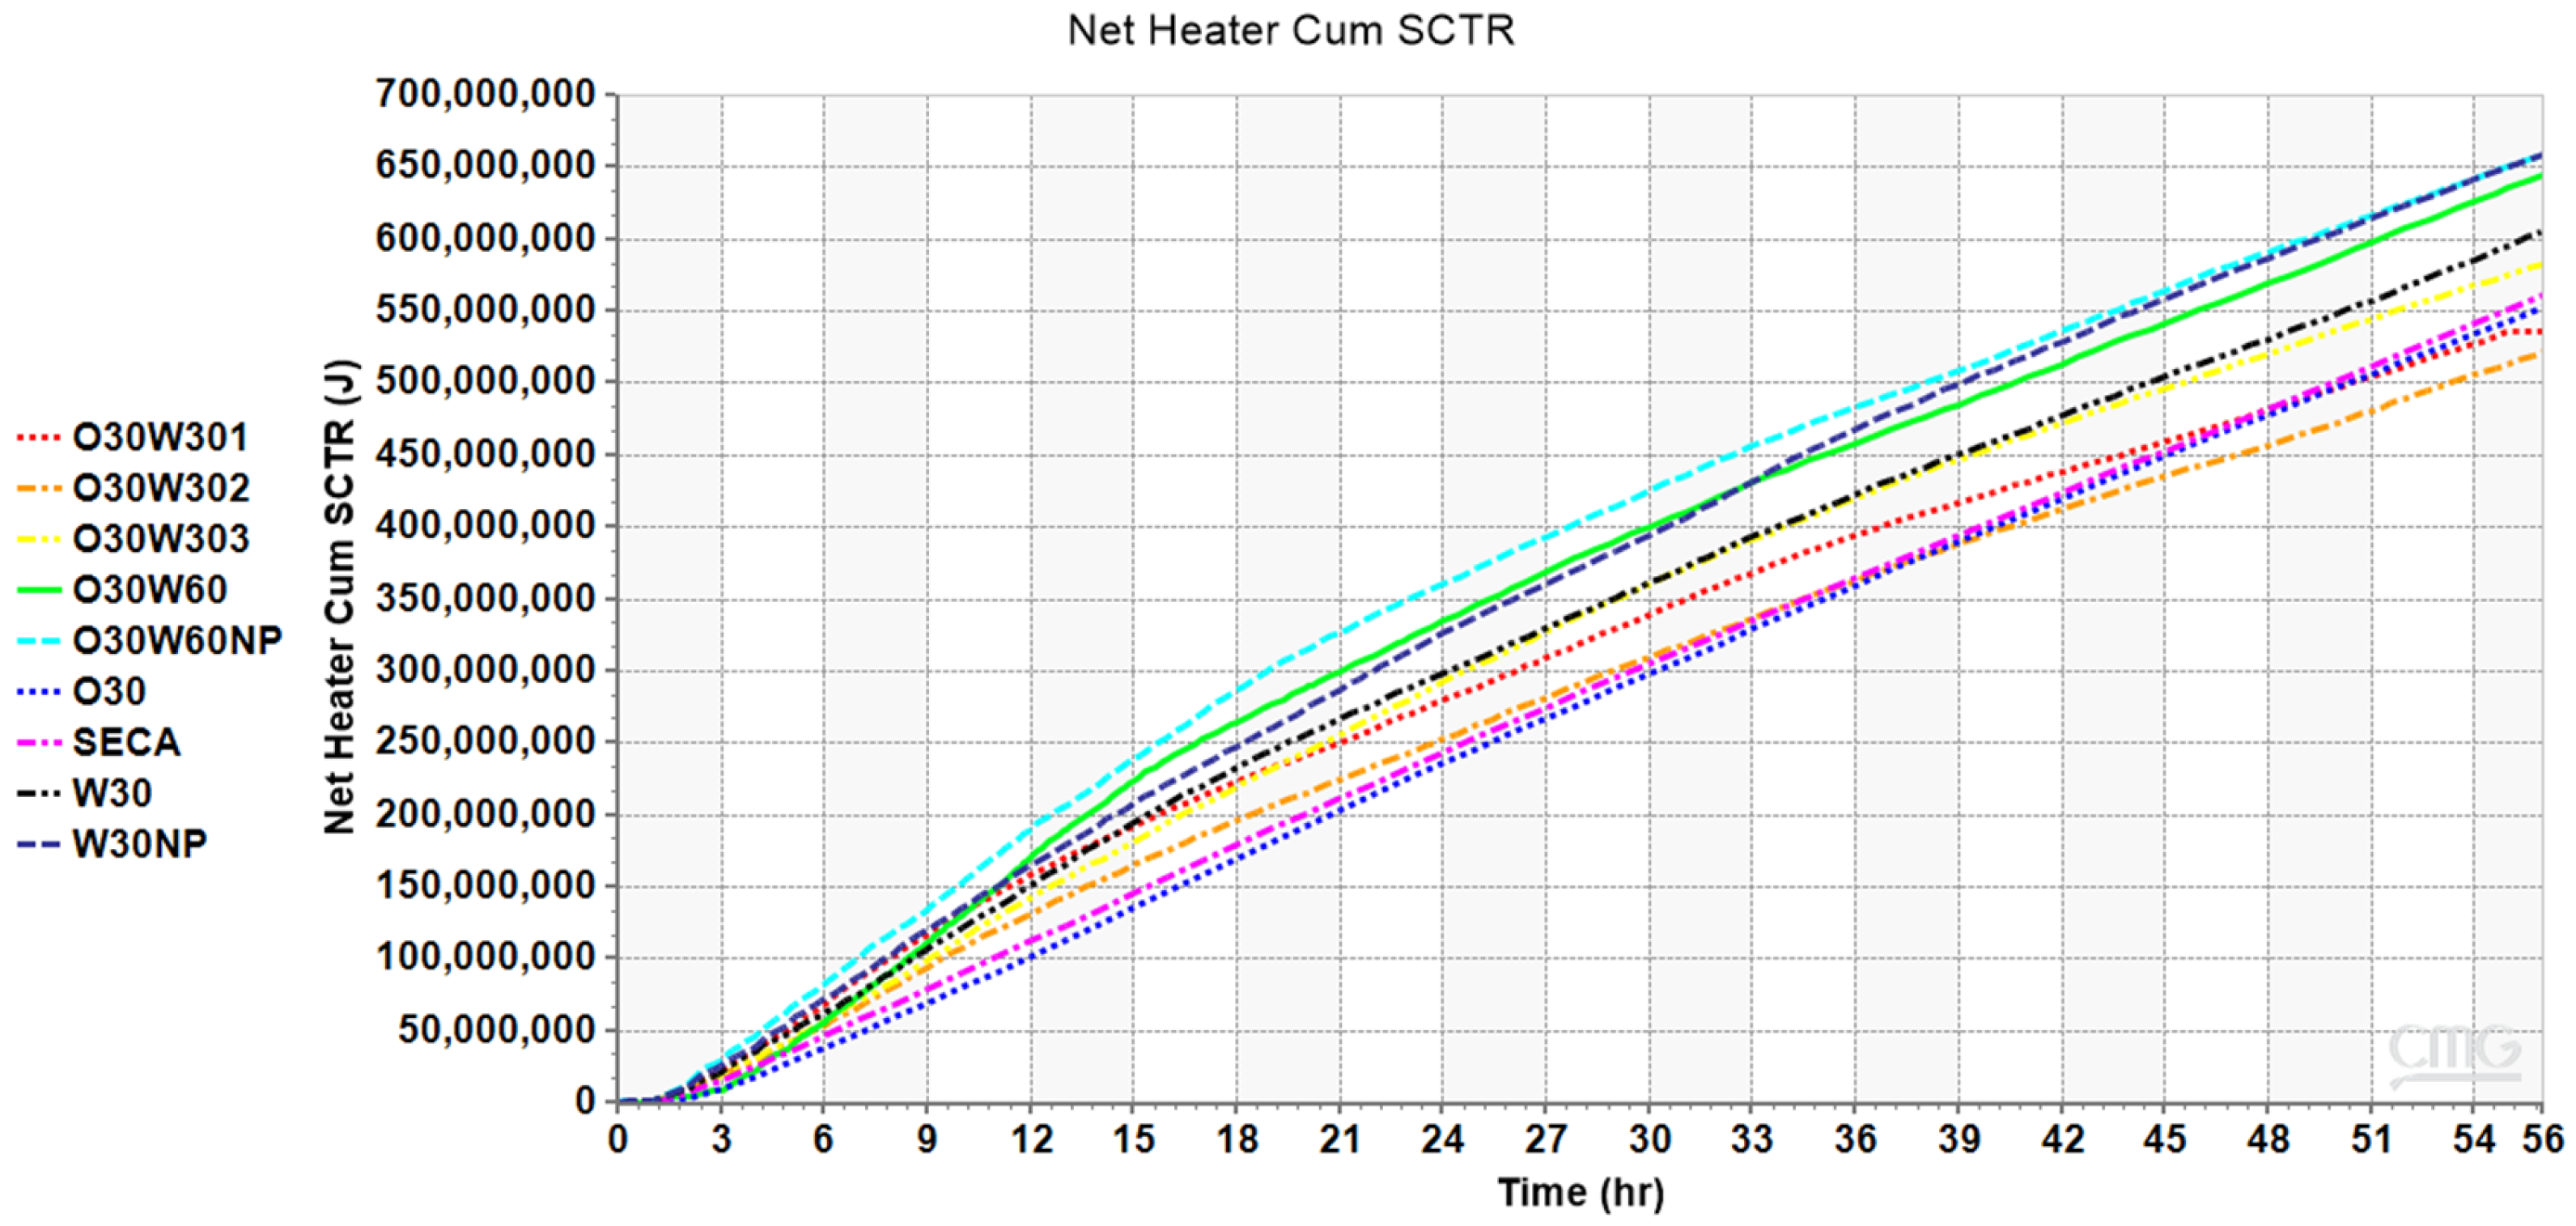
With the matched simulations of the experiments, the simulator was used to generate plots of the heat transfer required in each experiment to reach the recorded temperatures. These results are presented in Figure 13. Note that it would be more representative to perform a future scaling of the results based on the transmitted energy rather than on the temperature reached. The last is affected in the experiment by conditions that will not be present in a heavy oil reservoir, such as low pressures that allow for easy water evaporation or greater heat losses to the environment. In the other hand, for a coherent and meaningful analysis, it is important to note that the actual power delivered to the system (Actual Input Power) depends on the impedance tuning achieved during the equipment configuration for each test. As Actual Input Power varied in each case due to different levels of impedance tuning, consequently, a ratio was calculated between the average amount of energy transferred to the system (Average Transmitted Power) in each experiment and its actual input power (Transfer ratio) [43,44]. The average power transferred was calculated as the energy transferred to the system (specifically to the target zone) 55 h (which corresponds to the maximum heating time shared by all experiments) estimated as the total amount of heat added by the simulator to achieve the history match of temperatures in the zone of interest. Note that this value excludes the heat transferred to non-target regions. This information is presented in Table 2 as Cumulative transmitted heat over 55 h (MJ) and can be read from Figure 12 by checking the curve values at that time.
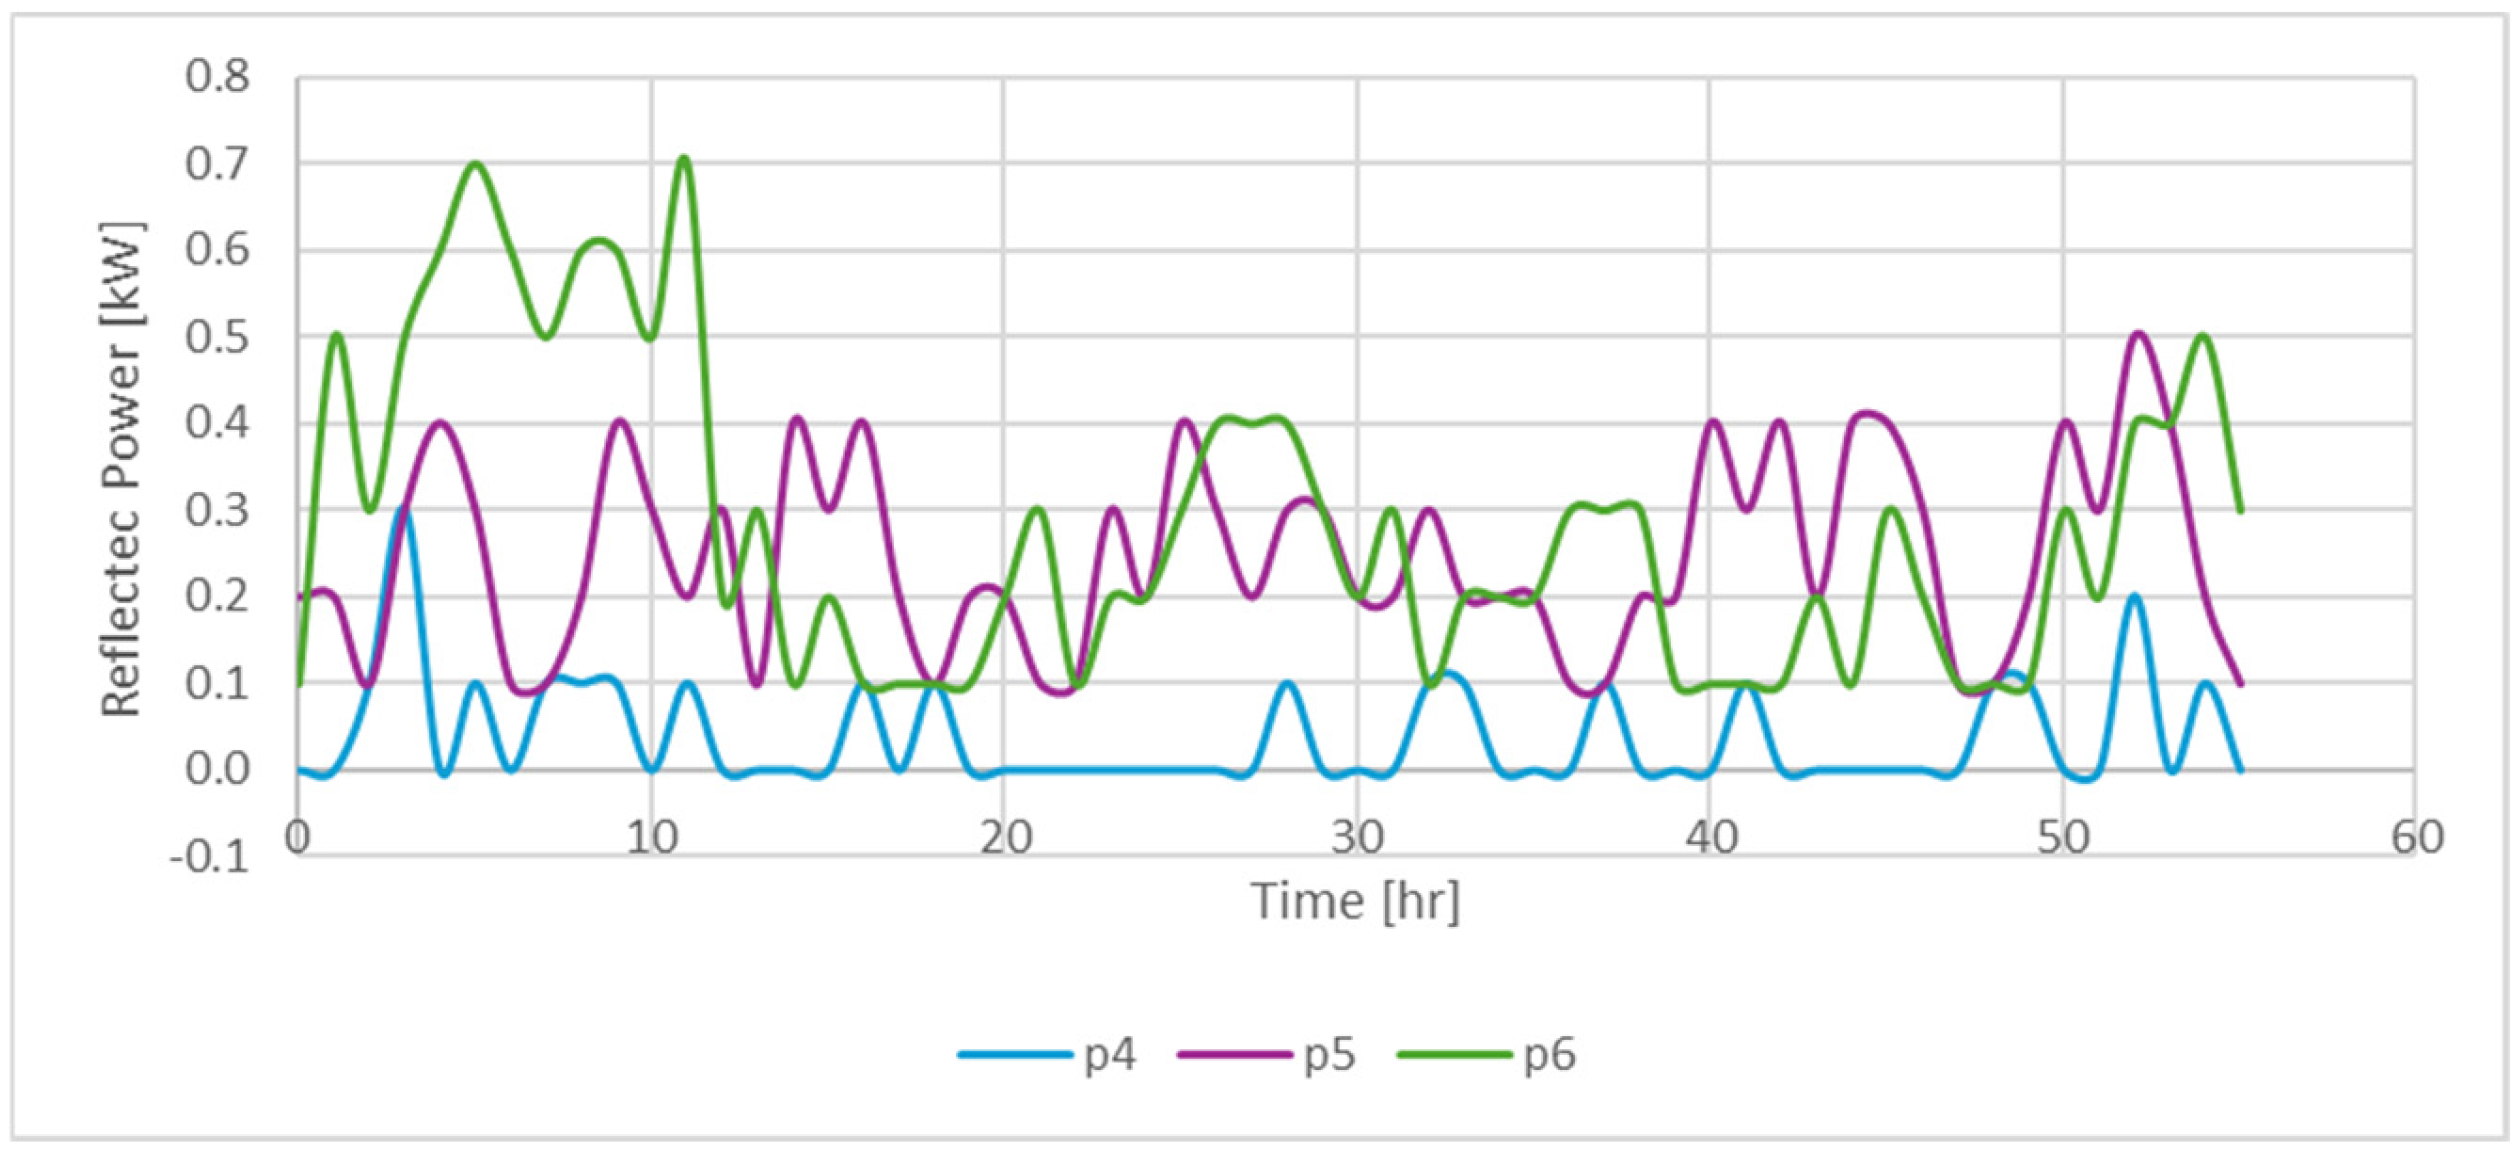
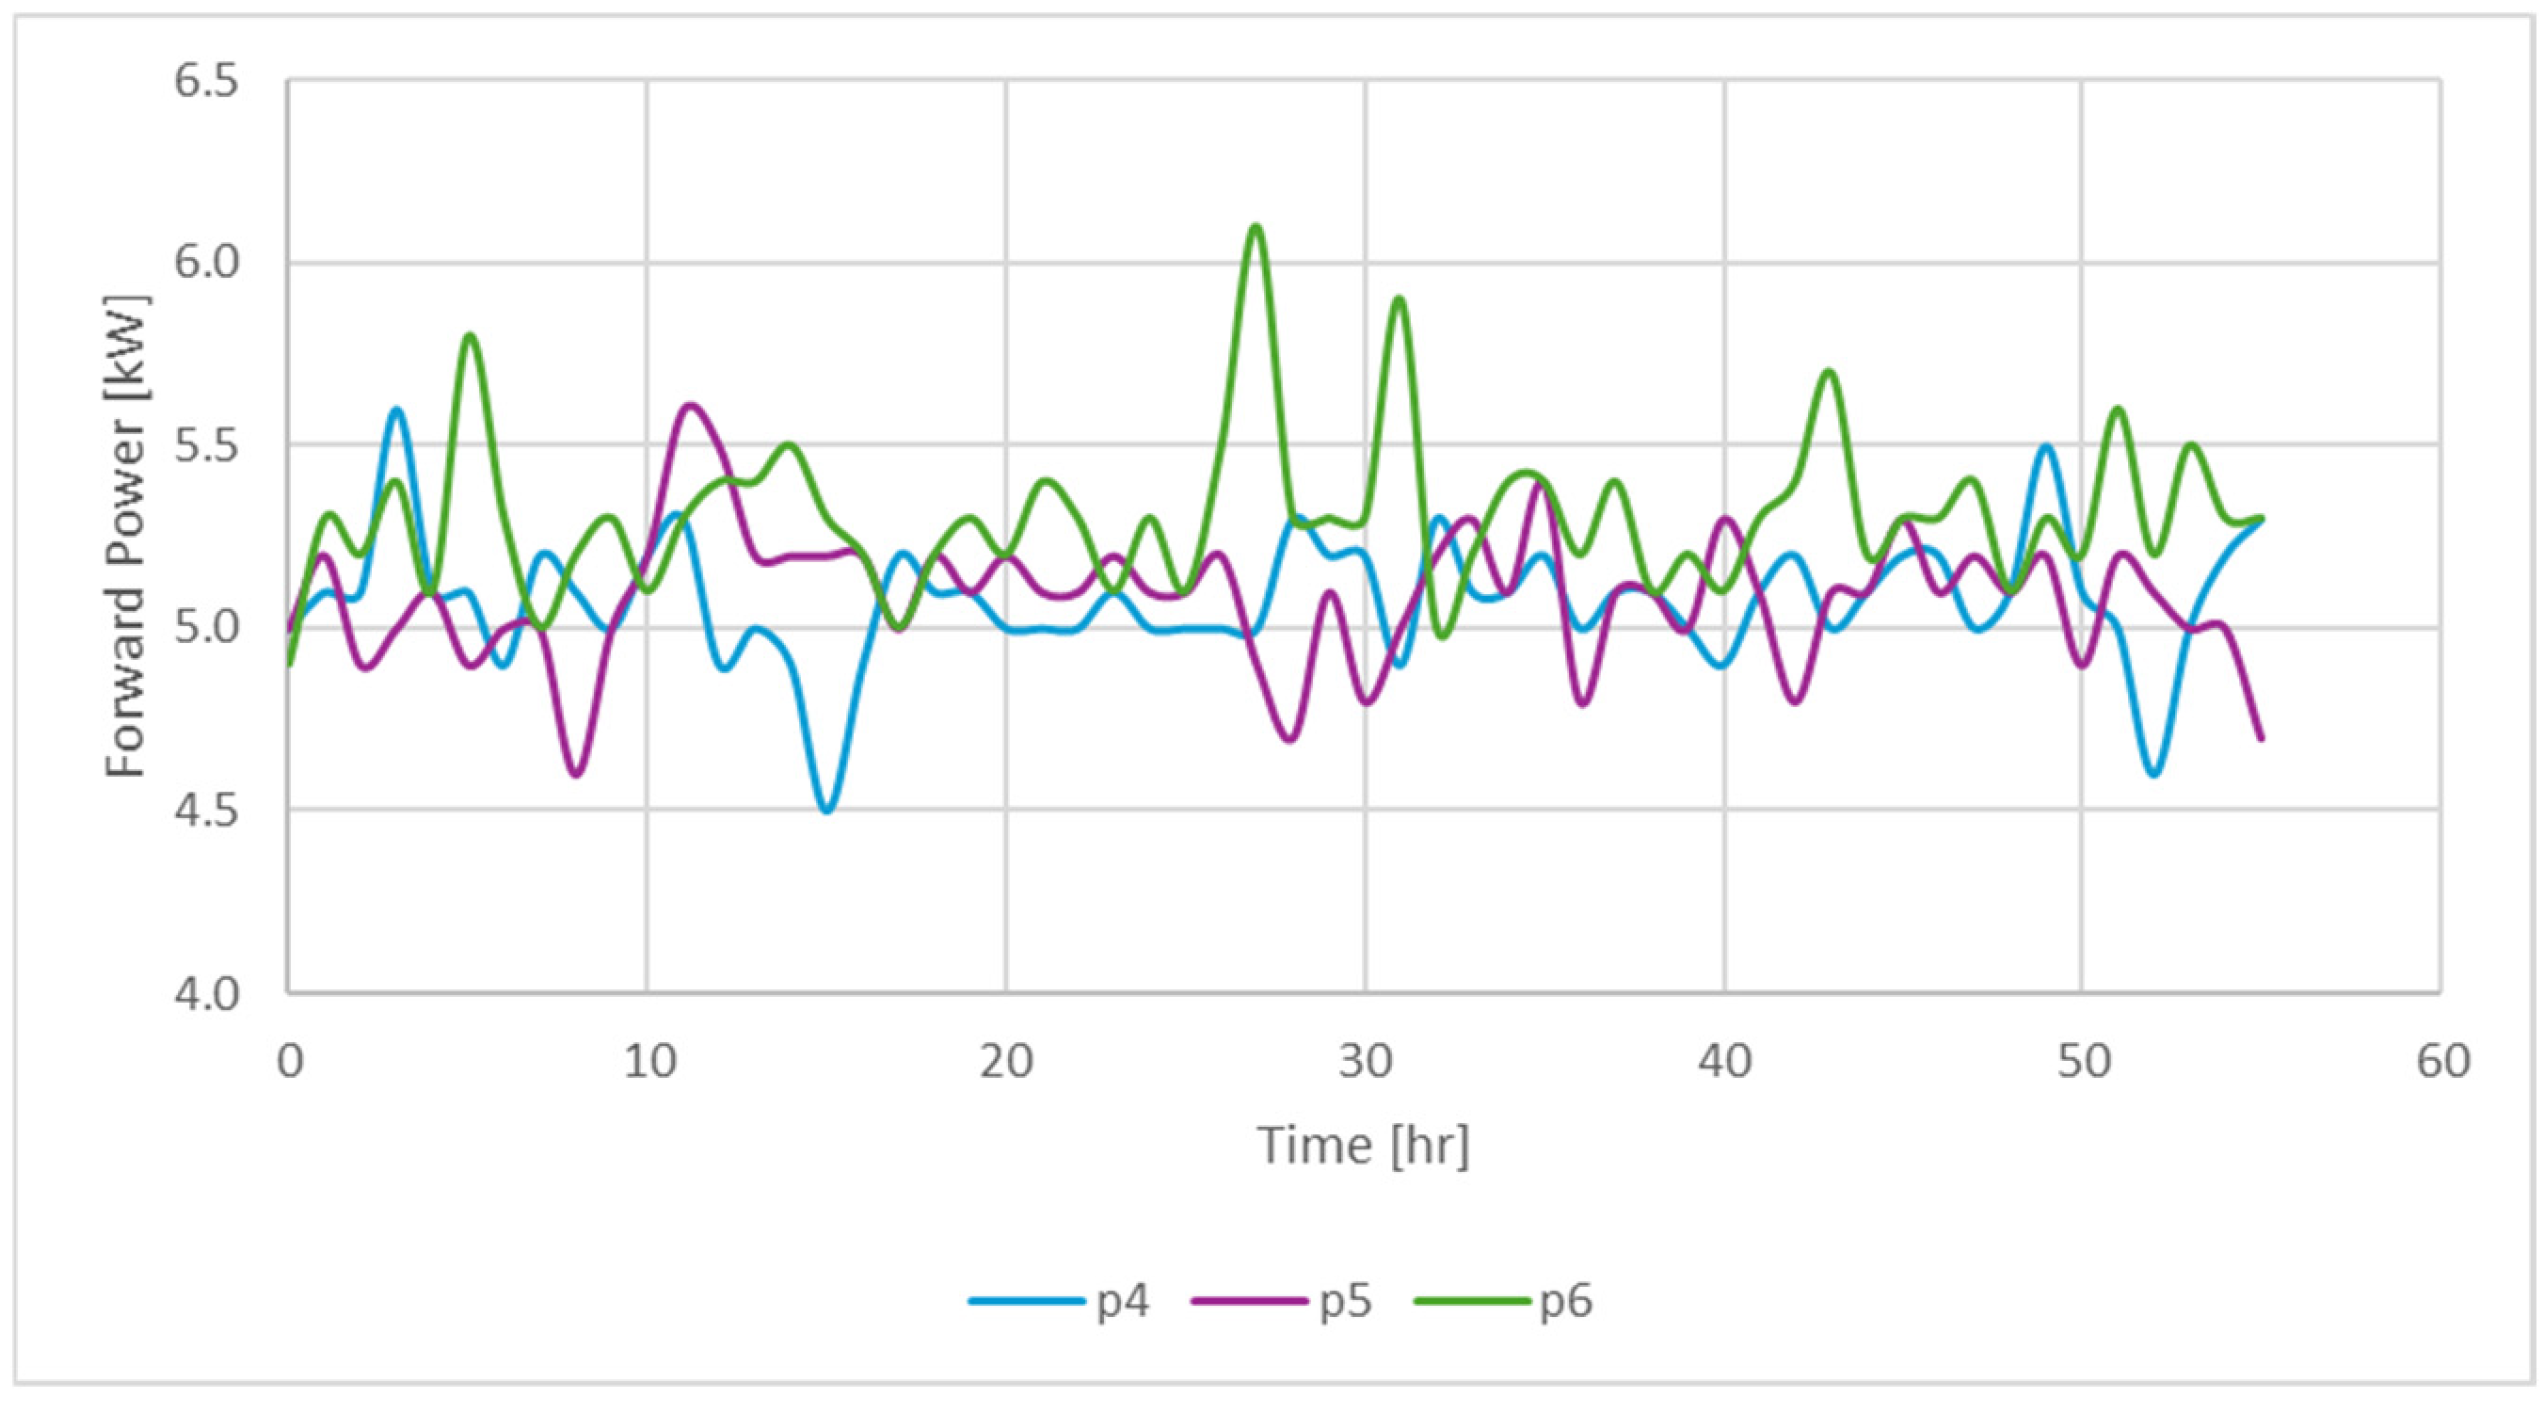
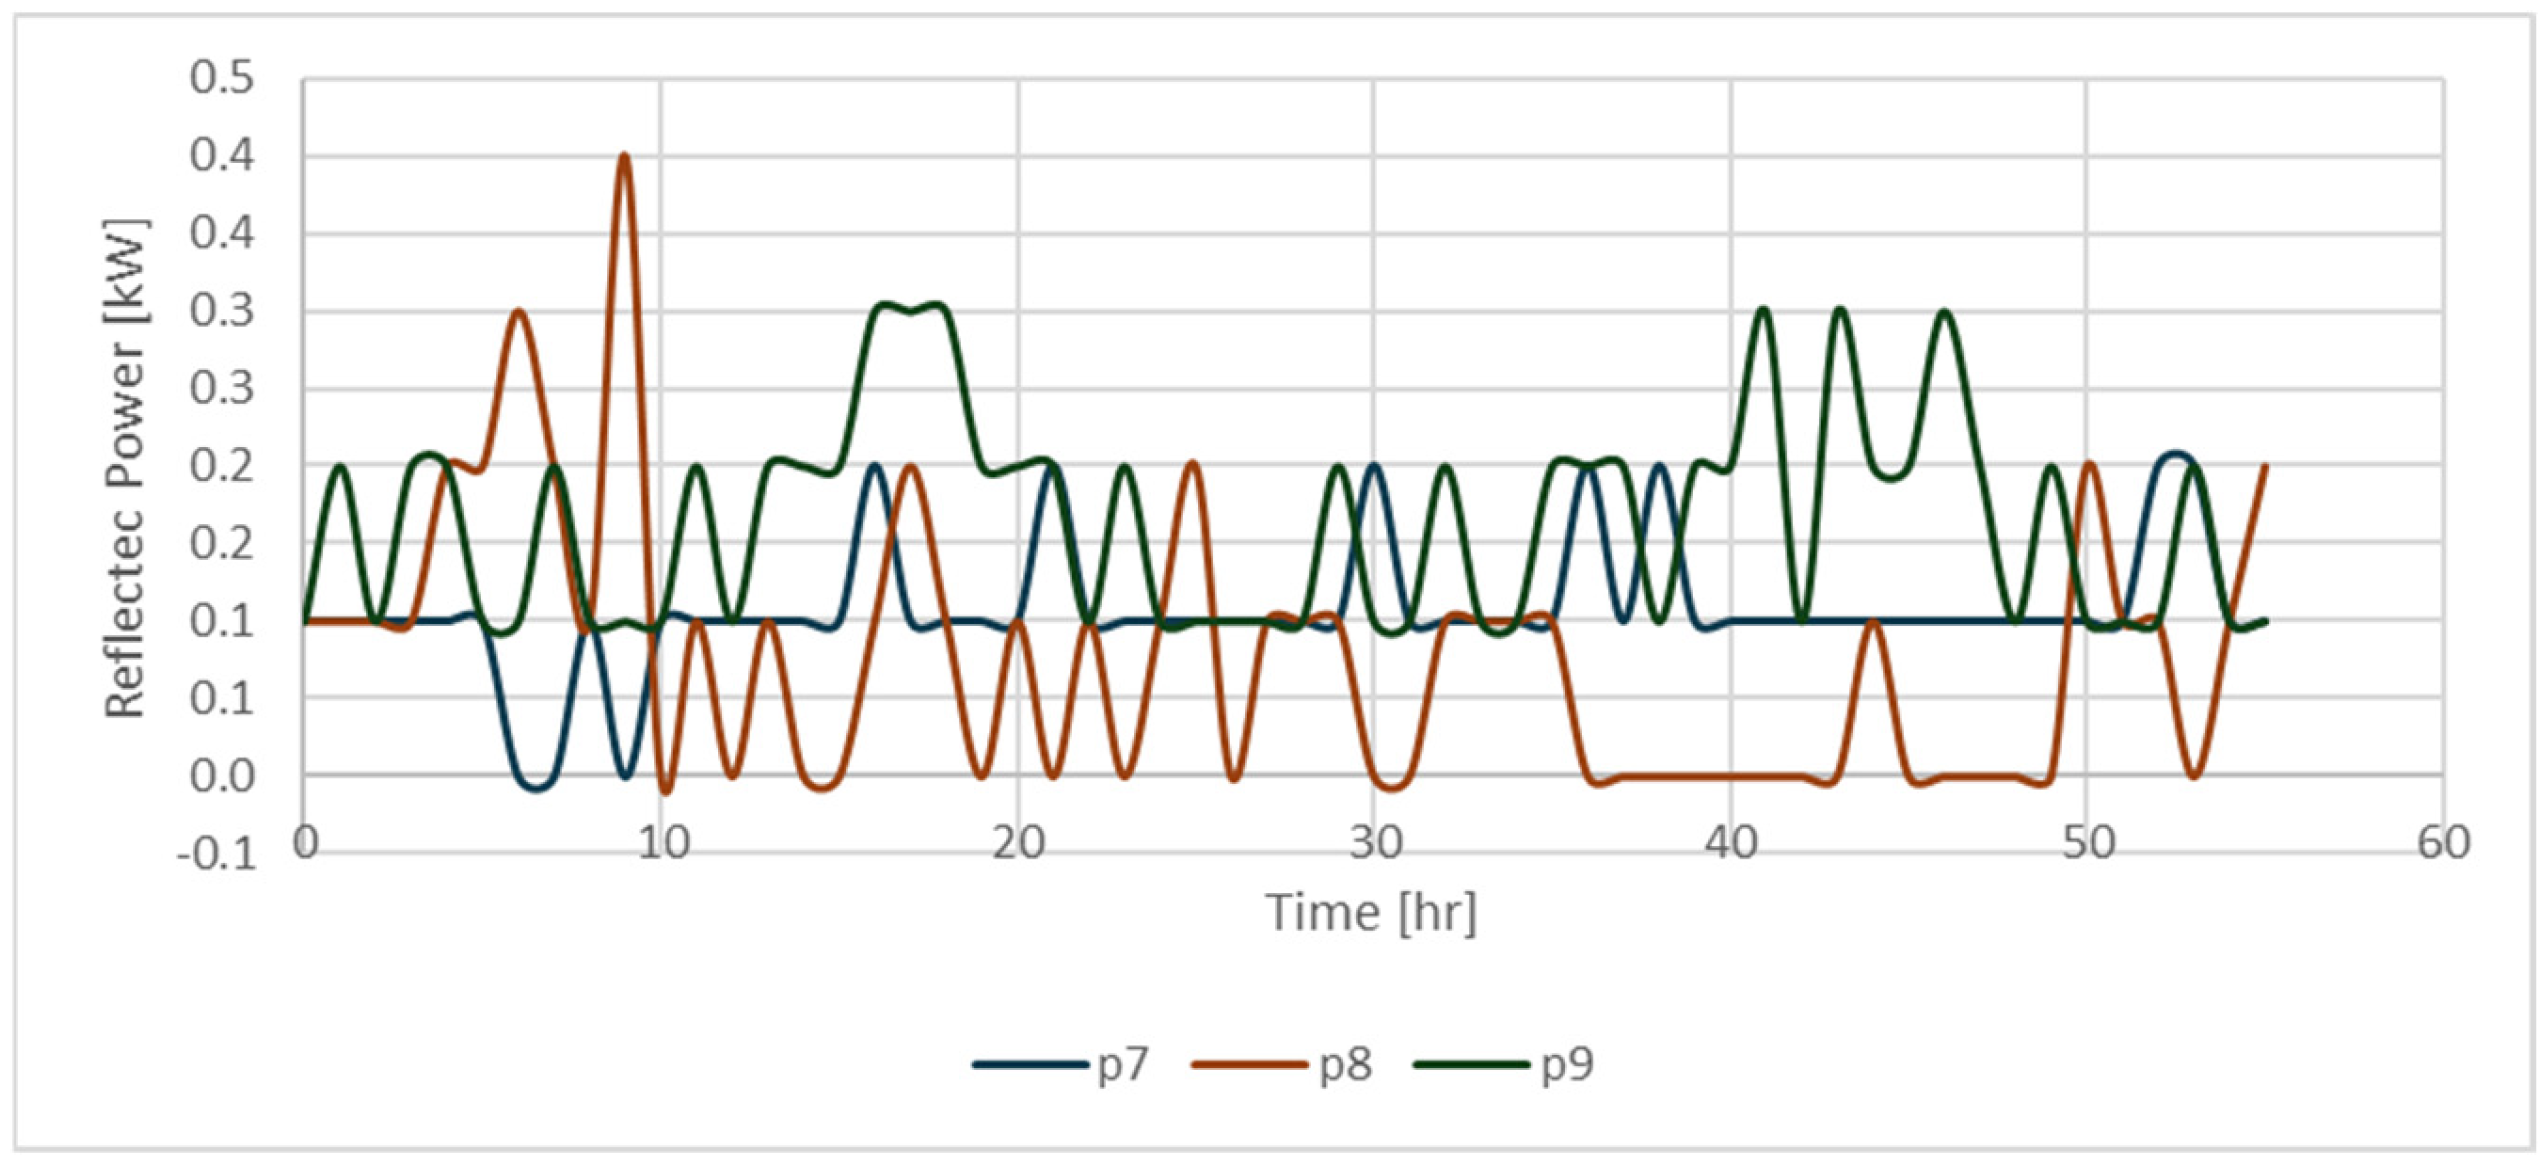
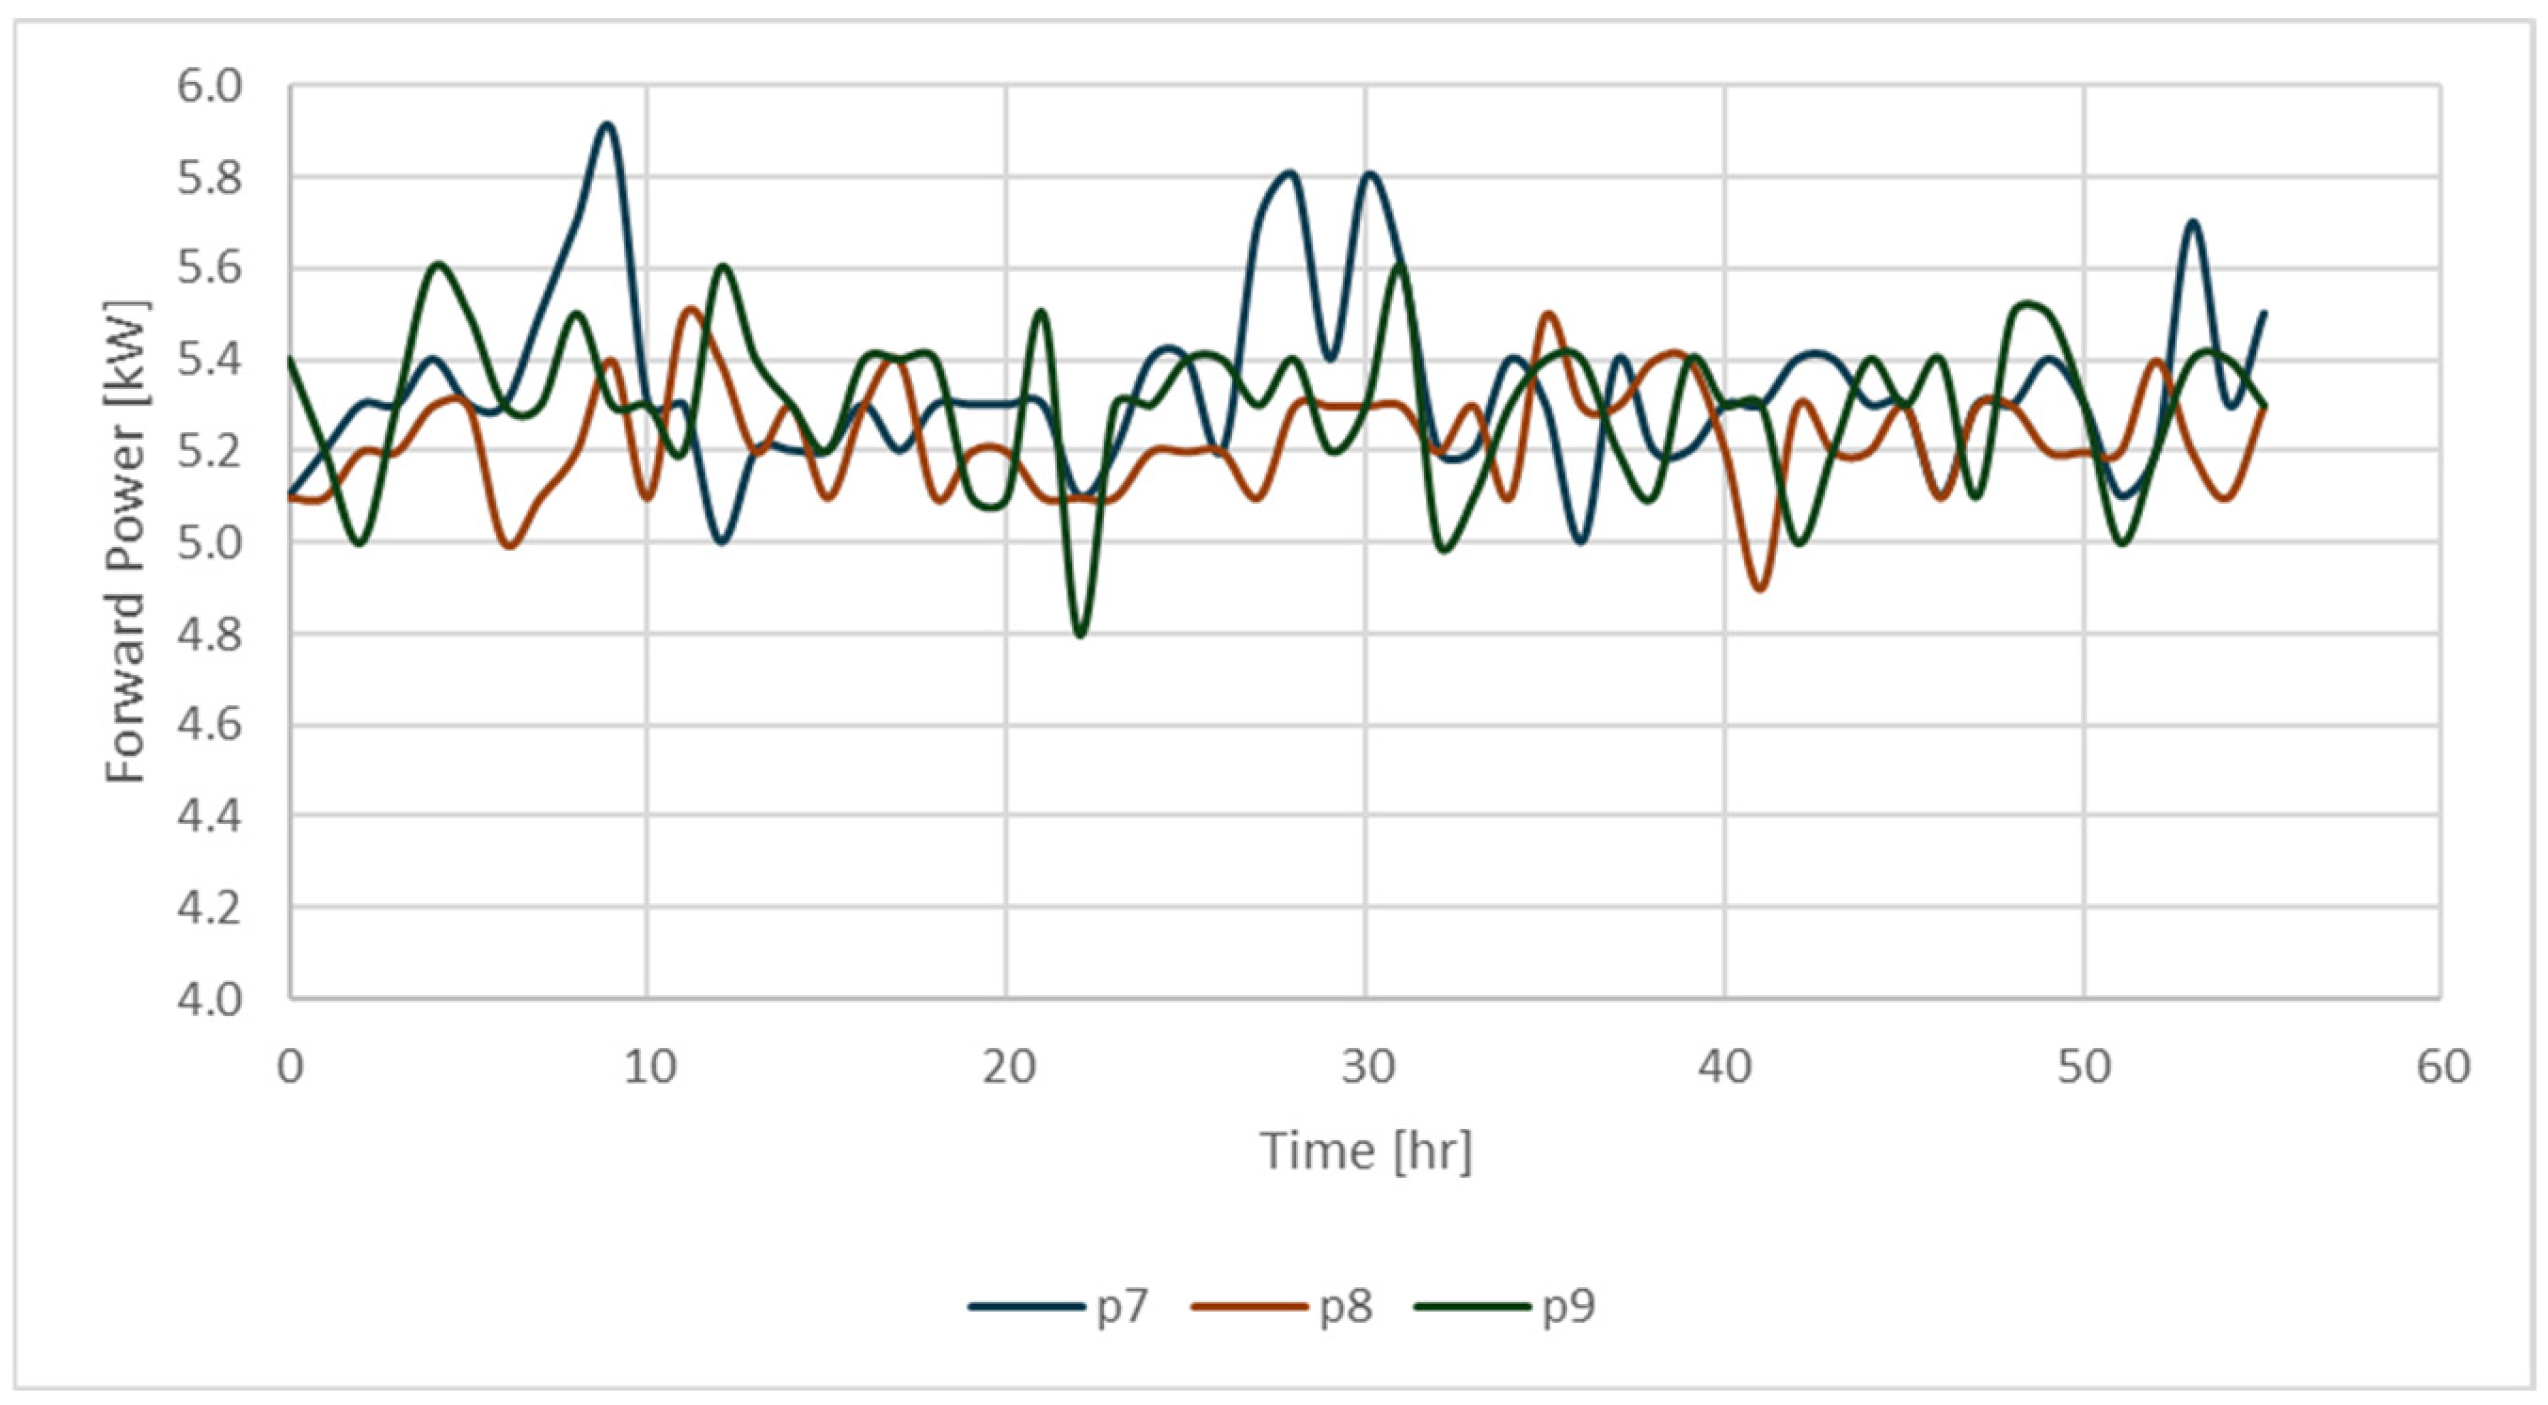
Note that the so-called Actual Input Power corresponds to the average Forward Power of the magnetron over a 55 h period of continuous emission (100% duty) and represents a measured quantity, whereas the Average Transmitted Power refers to the heat reaching the Target Zone, which was estimated through simulation matching. The ratio between these two quantities is defined as the Transfer Ratio. Figure 14, Figure 15, Figure 16, Figure 17, Figure 18 and Figure 19 show the temporal evolution of Reflected Power and Forward Power for all experiments.
The information presented in Table 2 simplifies the identification of the relationship between the study variables (Nanoparticle concentration and water saturation) and the energy transmitted into the medium. Note that the transfer ratio includes confidence intervals calculated based on the standard deviation obtained from the first three experiments conducted for repeatability.

5. Analysis and Discussion

Regarding the experiments conducted to evaluate heat transfer by means of microwaves, the results shown in Table 2 indicate that the first three experiments (performed to study repeatability), which had the same fluid saturation conditions and absence of nanocomponents, exhibited similar energy transfer ratios (Transfer ratio). However, in experiments 4 and 5, which had higher water saturation and the presence of magnetic nanoparticles, this transfer ratio increased significantly. Although the maximum power of the magnetron is 5.5 kW and the actual wave power (Actual input power) is less than 5.0 kW in most of the cases, part of the energy is directed towards areas that are not of interest, due to the spherical nature of the wave’s propagation. While the presence of nanoparticles in the water enhances energy transfer and heating in test 5, test 4 shows slightly higher temperature peaks than test 5. However, the simulation results demonstrate that more energy was globally transferred in test 5, validating the usefulness of magnetic nanoparticles as an agent for enhancing heating efficiency. Similarly, in experiments 6 to 9, where the liquid saturations were lower, a reduced heat transfer was observed. However, it was again evident that experiments in which the sample contained water exhibited better heat transfer. Notably, experiment 9, which included magnetic nanoparticles, showed the highest transfer ratio among them.
Analysis of the results presented in Table 2 indicates that the presence of nanoparticles is associated with an increase in the transfer ratio—from 0.64 to 0.68 for the case with 30% water and 30% oil saturation, and from 0.58 to 0.64 under other conditions. Considering the confidence intervals (±0.0116), these differences suggest a consistent trend toward improved heat transfer with the addition of nanoparticles, although the magnitude of the enhancement remains moderate. In order to explain the results obtained, and to model the improvement in heat transfer observed due to the presence of water and the nanocomposite—so that the results can later be scaled up using a commercial reservoir simulator—the following approach is proposed:
In this study, the model proposed by Abernethy will be used, which describes the absorption of an electromagnetic wave traveling through a conductively homogeneous medium under stable flow conditions [31]. The model used is shown in Equations (1)–(3).
P   r = P o   e a ( r r o )
a = 0.02 a   o  
a o = ω μ ε 2 { ( 1 + [ σ ω ε ] ) 1 2 1 }
P is the power, Po is the emitted power at the antenna output, r 0     is the wellbore radius (cm), r is the variable radius measured in (cm), and α is the power absorption coefficient (1/cm), which can be determined by the absorption of the electromagnetic wave in the porous medium. This parameter depends on the electromagnetic properties of the medium and can be determined for a homogeneous medium using Equations (2) and (3). α0 is the electrical absorption coefficient (1/m), σ is the conductivity (mho/m), μ is the magnetic permeability (H/m), ε is the permittivity (F/m), and ω is the angular frequency (2π times the frequency in MHz).
We propose to use a modified version of the model proposed by ref. [31], adapted to a discrete space such as that used in reservoir simulation—in other words, a numerical version of the original model, as shown in the following equation.
P i + 1 n = P i n e α i n ( d r i )
This alpha coefficient is governed by the electromagnetic properties of the medium, which are, in turn, influenced by factors such as water saturation or nanoparticle concentration.
A Visual Basic code was developed, and this identifies the grid geometry and applies a finite numerical difference solution to Equation (1) to estimate the amount of energy absorbed in each grid block. The value of α changes spatially, as it is a function of properties such as water saturation, rock type, or nanoparticle concentration (In case of injection). Similarly, the algorithm uses thermal properties to estimate when the temperature of a grid block exceeds the boiling point of water. When this occurs, the dielectric properties of the medium change (due to water vaporization), leading to reduced power absorption and increased electromagnetic wave penetration, meaning the value of α may also change over time.
The effect of water vaporization on heat transfer needs to be understood [32,33]. Phase change alters water’s electromagnetic properties, causing deeper wave penetration and reduced absorption. Experiments show that temperatures near the antenna often exceeded 100 °C, indicating partial water vaporization, with remaining liquid water found at the far end of the model. After reaching 100 °C, the temperature increase slows, suggesting a lower heat transfer rate post-evaporation. This agrees with the results of Bientinesi [34], who observed that waves penetrate further and are less absorbed after boiling, reducing transfer efficiency (55–68%). Therefore, the model should use different alpha values for evaporated (lower) and non-evaporated (higher) zones during pseudo-steady-state analysis.
Equation (4) is solved with the boundary condition that for all r = ro (which is 12 cm), (which is the Actual Power Input calculated from the experimental data meaning for any value of n. Note that this scheme allows for changes in the antenna’s output power over time, as well as changes in the absorption coefficient ( α i n ) both in time and space. The values of ( α i n ) are explicitly defined according to temperature values at the evaluated time n (to account for the effect of water vaporization).
To perform the calibration, the proposed model consists of a discretized version of the Abernethy [31] model. This model is programmed in an Excel spreadsheet for the 9 experiments conducted previously, and it is parameterized so that the heat transfer behavior depends not only on the initial power but also on the alpha values associated with each “saturation system”. Nine “saturation systems” are defined, each with a characteristic α value, which may appear in different experiments depending on whether the area is in the vaporization zone or not (or if nanoparticles or oil are present or not). A definition of the composition and conditions of each saturation system is presented in Table 3. Rules are also established for these systems: for example, it is known that the alpha values in zones with water and/or nanoparticles must be higher than in dry zones, and the heat absorption distribution should be consistent (where the thermocouples at 27.5 cm and 57.5 cm must absorb the most energy).
A trial-and-error exercise (stepwise heuristic process) is carried out, adjusting the alphas while respecting the rules, to minimize the error between what the model estimates and what is observed in the simulations. The Abernethy model modification is used for each of the studied cases, and the spreadsheet estimates the heat transferred in each reservoir sector according to this model and calculates the error compared to the simulation results. Users can vary the characteristic α values for each system; the spreadsheet shows the sum of the errors for each case—the sum of the absolute errors being the objective function to minimize.
To analyze the obtained results, Table 3 is generated, showing the relationship between the alpha values and the conditions of each case. Using this table, a multivariable linear regression is performed to estimate the relationship and generate a mathematical model that allows for estimating this heat absorption alpha as a function of water saturation and the presence of nanoparticles; crude oil saturation is also included, as experimental results suggest it may have some (though smaller) impact. The regression model is presented in Equation (5), where So and Sw represent the crude oil and water saturations, respectively, and NP is the nanoparticle concentration in ppm.
α = 0.0076526 0.00110526 S o + 0.01538596 S w + 1.684211 10 6 N P
The equation presented is used to estimate the alpha parameter through the proposed regression model, in order to verify the usefulness of this regression model, the results are shown in Table 4.
Given the above, it can be stated that as a result of this research, a model is obtained that describes the distribution and amount of heat transferred to the rock-fluid system when subjected to electromagnetic heating, as a function of applied power, fluid saturation, and the presence of nanoparticles. Once this heat transfer distribution is determined using the proposed model, the estimation of the temperatures reached in the medium can be performed much more accurately by using a commercial reservoir simulator, which can account for multiple considerations (heterogeneity, conduction heat transfer, reactions, etc.). Furthermore, this same simulator can later be used to predict how production and recovery in the reservoir will be affected by these increases.

6. Conclusions

An Fe3O4@GO magnetic nanocomposite was successfully synthesized using a modified Hummers method followed by in situ magnetite precipitation, yielding uniform particles of approximately 80 nm with confirmed Fe–O bonding and superparamagnetic behavior, suitable for electromagnetic heating (EMH) applications.
The results suggest that the incorporation of nanoparticles may contribute to a moderate enhancement of heat transfer efficiency under the tested conditions. Although the observed increase in the transfer ratio is small, the consistency across different cases and the associated confidence intervals indicate a reproducible trend rather than random variability.
History-matched numerical simulations using CMG-STARS accurately reproduced the experimental temperature profiles and enabled quantification of the heat transferred to the porous medium. From this analysis, an empirical correlation was derived linking the electromagnetic absorption coefficient (α) with water and nanoparticle content, which can be implemented in commercial reservoir simulators for predictive modeling.
Overall, the findings confirm that Fe3O4@GO nanofluids act as efficient electromagnetic absorbers, improving heat distribution and energy utilization in microwave-assisted thermal processes. The proposed experimental–numerical framework provides a scalable approach for optimizing EMH processes for heavy oil systems.
The modified Hummers method proved to be efficient for synthesizing graphene oxide (GO), as evidenced by the functional groups identified through FTIR analysis. Subsequently, magnetic graphene oxide (Fe3O4@GO) was obtained through the partial oxidation of Fe2+ ions in the presence of GO sheets. The formation of the Fe–O bond, observed as a distinct band in the FTIR spectrum and accompanied by a reduction in the intensity of GO-specific signals, confirmed successful functionalization. Then a mathematical model that describes the heat transfer behavior of typical heavy oil fields in Colombia was developed for processes using different power for EMH in presence of nanofluid.
The measured temperature profiles show that the proposed magnetic nanocomposite successfully enhances heat transfer in an electromagnetic microwave heating process used to raise the temperature of heavy oil reservoir fluids. This improvement is observed when the nanocomposite is added to the rock–fluid system through an aqueous phase at a concentration of 500 ppm. Similarly, water alone, even without the addition of nanoparticles, improves the efficiency of the process. It is validated that the design of the proposed experimental setup is suitable for evaluating the temperature increase and heat transfer in a fluid–porous medium system representative of a heavy oil reservoir when subjected to an electromagnetic microwave heating process.
This model provides equations and a valid framework to predict heat transfer behavior as a function of the fluid saturation of the medium, the presence of nanoparticles, and the applied power. It can also be integrated into existing commercial thermal reservoir simulators to enable future upscaling of the results.

Author Contributions

All authors contributed to the study conception and design. Material preparation was performed by J.G.-D.; data collection and analysis were performed by P.A.L., A.F.O., J.G.-D., D.B., N.S. and E.M.-O. The first draft of the manuscript was written by P.A.L., A.F.O., D.B., and J.G.-D., and all authors commented on previous versions of the manuscript. All authors have read and agreed to the published version of the manuscript.

Funding

This work was supported by Colombian Ministry of Science and Technology (MINCIENCIAS) and the Colombian National Agency of Hydrocarbons (ANH) within the framework of project No. 80740-413-2021.

Data Availability Statement

The original contributions presented in the study are included in the article, further inquiries can be directed to the corresponding author.

Acknowledgments

The authors are grateful to the Grupo de Investigación en Tomografía Computarizada para Caracterización de Yacimientos -GIT, Central Laboratories of the Technological Park of Guatiguará of the Universidad Industrial Santander (PTG-UIS); Surface Laboratory, Spectroscopy Laboratory, Microscopy Laboratory and Catalysis Research Center (CICAT) for their assistance.

Conflicts of Interest

The authors declare no conflict of interest.

References

  1. Bjørnseth, F.; Gudmundsson, J.S. Heavy Oil Production Technology Challenges and the Effect of Nano Sized Metals on the Viscosity of Heavy Oil A Literature Review and an Experimental Study. Master’s Thesis, Norwegian University of Science and Technology (NTNU), Trondheim, Norway, 2013. [Google Scholar]
  2. Larter, S.R.; Head, I.M. Oil Sands and Heavy Oil: Origin and Exploitation. Elements 2014, 10, 277–283. [Google Scholar] [CrossRef]
  3. Guo, K.; Li, H.; Yu, Z. In-situ heavy and extra-heavy oil recovery: A review. Fuel 2016, 185, 886–902. [Google Scholar] [CrossRef]
  4. Li, Y.; Wang, Z.; Hu, Z.; Xu, B.; Li, Y.; Pu, W.; Zhao, J. A review of in situ upgrading technology for heavy crude oil. Petroleum 2021, 7, 117–122. [Google Scholar] [CrossRef]
  5. Castañeda, L.; Muñoz, J.; Ancheyta, J. Combined process schemes for upgrading of heavy petroleum. Fuel 2012, 100, 110–127. [Google Scholar] [CrossRef]
  6. Wiehe, I.; Liang, K. Asphaltenes, resins, and other petroleum macromolecules. Fluid Ph. Equilib. 1996, 117, 201–210. [Google Scholar] [CrossRef]
  7. Sahni, A.; Kumar, M.; Knapp, R. Electromagnetic Heating Methods for Heavy Oil Reservoirs. In Proceedings of the SPE/AAPG Western Regional Meeting, Long Beach, CA, USA, 19–23 June 2000; pp. 1–10. [Google Scholar] [CrossRef]
  8. Ryles, R.G.; Cicchiello, J.V. New Polymers for EOR Applications. In Proceedings of the SPE Enhanced Oil Recovery Symposium, Tulsa, Oklahoma, 17–21 April 1986. [Google Scholar] [CrossRef]
  9. Spencer, H.W. Commercial application of radio frequency heating for heavy oil recovery in the Wildmere field, Alberta. J. Can. Pet. Technol. 1987, 26, 38–45. [Google Scholar] [CrossRef]
  10. Kasevich, R.S.; Price, S.L.; Faust, D.L.; Fontaine, M.F. Pilot Testing of a Radio Frequency Heating System for Enhanced Oil Recovery From Diatomaceous Earth. In Proceedings of the SPE Annual Technical Conference and Exhibition, New Orleans, Louisiana, 25–28 September 1994. [Google Scholar] [CrossRef]
  11. Bottazzi, F.; Hanzlik, W.; Cardenas, E. Downhole electrical heating for heavy oil enhanced recovery: A successful application in offshore Congo. In Proceedings of the International Petroleum Technology Conference, Dhahran, Saudi Arabia, 13–15 January 2020. [Google Scholar] [CrossRef]
  12. Alomair, O.; Alarouj, M.; Althenayyan, A.; Alsaleh, A.; Mohammad, H.; Altahoo, Y.; Alhaidar, Y.; Alansari, S.; Alshammari, Y. Improving Heavy Oil Recovery by Unconventional Thermal Methods. In Proceedings of the SPE Kuwait International Petroleum Conference and Exhibition, Kuwait City, Kuwait, 12–14 December 2012. [Google Scholar] [CrossRef]
  13. Greff, J.; Babadagli, T. Use of nano-metal particles as catalyst under electromagnetic heating for in-situ heavy oil recovery. J. Pet. Sci. Eng. 2013, 112, 258–265. [Google Scholar] [CrossRef]
  14. Bera, A.; Babadagli, T. Status of electromagnetic heating for enhanced heavy oil/bitumen recovery and future prospects: A review. Appl. Energy 2015, 151, 206–226. [Google Scholar] [CrossRef]
  15. Kovaleva, L.; Davletbaev, A.; Babadagli, T.; Stepanova, Z. Effects of electrical and radio-frequency electromagnetic heating on the mass-transfer process during miscible injection for heavy-oil recovery. Energy Fuels 2010, 25, 482–486. [Google Scholar] [CrossRef]
  16. Hascakir, B.; Acar, C.; Akin, S. Microwave-assisted heavy oil production: An experimental approach. Energy Fuels 2009, 23, 6033–6039. [Google Scholar] [CrossRef]
  17. Sadeghi, A.; Hassanzadeh, H.; Harding, T.G. A comparative study of oil sands preheating using electromagnetic waves, electrical heaters and steam circulation. Int. J. Heat Mass Transf. 2017, 111, 908–916. [Google Scholar] [CrossRef]
  18. Bera, A.; Babadagli, T. Effect of native and injected nano-particles on the efficiency of heavy oil recovery by radio frequency electromagnetic heating. J. Pet. Sci. Eng. 2017, 153, 244–256. [Google Scholar] [CrossRef]
  19. Ovalles, C.; Vardeman, R.; Velasco, J.; Martínez, M. Opportunities of downhole dielectric heating in Venezuela: Three case studies involving medium, heavy, and extra-heavy crude oil reservoirs. In Proceedings of the SPE International Thermal Operations and Heavy Oil Symposium and International Horizontal Well Conference, Calgary, Alberta, Canada, 4–7 November 2002; Society of Petroleum Engineers: Calgary, AB, Canada, 2002. [Google Scholar] [CrossRef]
  20. Hascakir, B. Microwave assisted gravity drainage of heavy oils. In Proceedings of the International Petroleum Technology Conference, Kuala Lumpur, Malaysia, 3–5 December 2008. [Google Scholar] [CrossRef]
  21. Hu, L.; Sun, Z.; Li, Y.; Chen, H. Experimental investigation of microwave-assisted thermal recovery in heavy oil reservoirs: Effects of frequency, salinity, and permeability. Fuel 2017, 207, 523–532. [Google Scholar] [CrossRef]
  22. Serga, V.; Burve, R.; Maiorov, M.; Krumina, A.; Skaudžius, R.; Zarkov, A.; Kareiva, A.; Popov, A.I. Impact of Gadolinium on the Structure and Magnetic Properties of Nanocrystalline Powders of Iron Oxides Produced by the Extraction-Pyrolytic Method. Materials 2020, 13, 4147. [Google Scholar] [CrossRef]
  23. Bleija, M.; Platnieks, O.; Macutkevič, J.; Banys, J.; Starkova, O.; Grase, L.; Gaidukovs, S. Poly(Butylene Succinate) Hybrid Multi-Walled Carbon Nanotube/Iron Oxide Nanocomposites: Electromagnetic Shielding and Thermal Properties. Polymers 2023, 15, 515. [Google Scholar] [CrossRef]
  24. Gerbreders, V.; Krasovska, M.; Sledevskis, E.; Mihailova, I.; Mizers, V. Co3O4 Nanostructured Sensor for Electrochemical Detection of H2O2 as a Stress Biomarker in Barley: Fe3O4 Nanoparticles-Mediated Enhancement of Salt Stress Tolerance. Micromachines 2024, 15, 311. [Google Scholar] [CrossRef]
  25. Zhang, T.; Zou, Q.; Cheng, Z.; Chen, Z.; Liu, Y.; Jiang, Z. Effect of particle concentration on the stability of water-based SiO2 nanofluid. Powder Technol. 2021, 379, 457–465. [Google Scholar] [CrossRef]
  26. Zou, Q.; Ma, T.; Liang, J.; Xu, B.; Ran, Q. Mesomechanical weakening mechanism of coal modified by nanofluids with disparately sized SiO2 nanoparticles. Int. J. Rock Mech. Min. Sci. Géoméch. Abstr. 2025, 188, 106056. [Google Scholar] [CrossRef]
  27. Zou, Q.; Zhang, T.; Ma, T.; Tian, S.; Jia, X.; Jiang, Z. Effect of water-based SiO2 nanofluid on surface wettability of raw coal. Energy 2022, 254, 124228. [Google Scholar] [CrossRef]
  28. Ma, T.; Zou, Q.; Wang, P.; Li, Q.; Fan, C.; Ran, Q.; Xu, B.; Huo, Z.; Zhang, J. Regulation mechanism of surfactant-SiO2 nanoparticle compound on mechanical property and microstructure of coal: Effect of the type of surfactant. Powder Technol. 2025, 466, 121459. [Google Scholar] [CrossRef]
  29. Gómez-Delgado, J.L.; Gutierrez-Niño, N.; Carrillo-Moreno, L.F.; Martínez-López, R.A.; Santos-Santos, N.; Mejía-Ospino, E. Experimental Assessment of Magnetic Nanofluid Injection in High-Salinity and Heavy-Crude-Saturated Sandstone: Mitigation of Formation Damage. Energies 2025, 18, 212. [Google Scholar] [CrossRef]
  30. Nguyen, N.; Chen, Z.; Almao, P.P.; Scott, C.E.; Maini, B. Reservoir Simulation and Production Optimization of Bitumen/Heavy Oil via Nanocatalytic in Situ Upgrading. Ind. Eng. Chem. Res. 2017, 56, 14214–14230. [Google Scholar] [CrossRef]
  31. Yamauchi, T. Electromagnetic Heating. In Soft Actuators; Asaka, K., Okuzaki, H., Eds.; Springer: Tokyo, Japan, 2014. [Google Scholar] [CrossRef]
  32. Al-Farsi, H.; Pourafshary, P.; Al-Maamari, R.S. Application of nanoparticles to improve the performance of microwave assisted gravity drainage (MWAGD) as a thermal oil recovery method. In Proceedings of the SPE EOR Conference at Oil and Gas West Asia, Muscat, Oman, 21–23 March 2016. [Google Scholar] [CrossRef]
  33. Davidson, A.; Huh, C.; Bryant, S.L. Focused Magnetic Heating Utilizing Superparamagnetic Nanoparticles for Improved Oil Production Applications. In Proceedings of the SPE International Oilfield Nanotechnology Conference and Exhibition, Noordwijk, The Netherlands, 12–14 June 2012. [Google Scholar]
  34. Bientinesi, M.; Petarca, L.; Cerutti, A.; Bandinelli, M.; De Simoni, M.; Manotti, M.; Maddinelli, G. A radiofrequency/microwave heating method for thermal heavy oil recovery based on a novel tight-shell conceptual design. J. Pet. Sci. Eng. 2013, 107, 18–30. [Google Scholar] [CrossRef]
  35. Salas-Chia, L.M.; Núñez-Mendez, K.S.; León, P.A.; Muñoz, S.F.; León, A.Y. Metodología para la simulación numérica de la adición de agentes catalíticos en procesos de inyección de vapor. Rev. ION 2022, 35, 17–32. [Google Scholar] [CrossRef]
  36. León Naranjo, P.A.; Muñoz Navarro, S.F.; León Bermudez, A.Y.; Bottia Ramirez, H. Efecto del uso de Catalizadores Sobre la Recuperación Mejorada de Crudos Pesados en Procesos de Inyección de Vapor; Universidad Industrial de Santander: Bucaramanga, Colombia, 2019; pp. 36–40. [Google Scholar]
  37. Sadeghi, A.; Hassanzadeh, H.; Harding, T.G.; MacFarlane, B.; Bashti, S.; Haghighat, P. Numerical modeling of electromagnetic-based thermal recovery techniques combined with solvent injection. Int. J. Heat Mass Transf. 2020, 151, 119393. [Google Scholar] [CrossRef]
  38. Zinnatullin, R.R.; Musin, A.A.; Kovaleva, L.A. Study of Heating of Oil Source Rocks in a High-Frequency Electromagnetic Field by the Method of Physico-Mathematical Modeling. High Temp. 2022, 60, 136–139. [Google Scholar] [CrossRef]
  39. Zinnatullin, R.R.; Musin, A.A.; Gaisin, I.V.; Usmanov, B.A. Physical and Mathematical Modeling of the Temperature Distribution Along the Length of Oil Source Rocks under Microwave Irradiation. High Temp. 2023, 61, 138–141. [Google Scholar] [CrossRef]
  40. Al-Yaari, A.; Ching, D.L.C.; Sakidin, H.; Muthuvalu, M.S.; Zafar, M.; Haruna, A.; Merican, Z.M.A.; Azad, A.S. A New 3D Mathematical Model for Simulating Nanofluid Flooding in a Porous Medium for Enhanced Oil Recovery. Materials 2023, 16, 5414. [Google Scholar] [CrossRef]
  41. Dong, X.; Duan, Z.; Nie, T.; Gao, D. An analytical model for reservoir temperature during electromagnetic heating based on power transmission. Appl. Therm. Eng. 2023, 219, 119441. [Google Scholar] [CrossRef]
  42. Sun, C.; Liu, W.; Wang, B.; Ma, T.; Guo, C. Modeling microwave heating for enhanced shale gas recovery: Fully coupled two-phase flows with heat transfer and electromagnetism in deformable reservoirs. Appl. Therm. Eng. 2024, 248, 123190. [Google Scholar] [CrossRef]
  43. Yang, S.; Wang, H.; Lou, X.; Li, Z.; Pan, Y.; Zhao, X. The study of core and particle model of Fushun oil shale based on microwave field. J. Anal. Appl. Pyrolysis 2024, 179, 106496. [Google Scholar] [CrossRef]
  44. Chen, H.-W.; Zhang, S.-S.; Li, Y.; Xu, C.; Qin, S.-X. Multi-Physical Field Numerical Simulation of Electromagnetic Heating in Heavy Oil Reservoirs With Different Well Configurations. J. Therm. Sci. Eng. Appl. 2024, 16, 031006. [Google Scholar] [CrossRef]
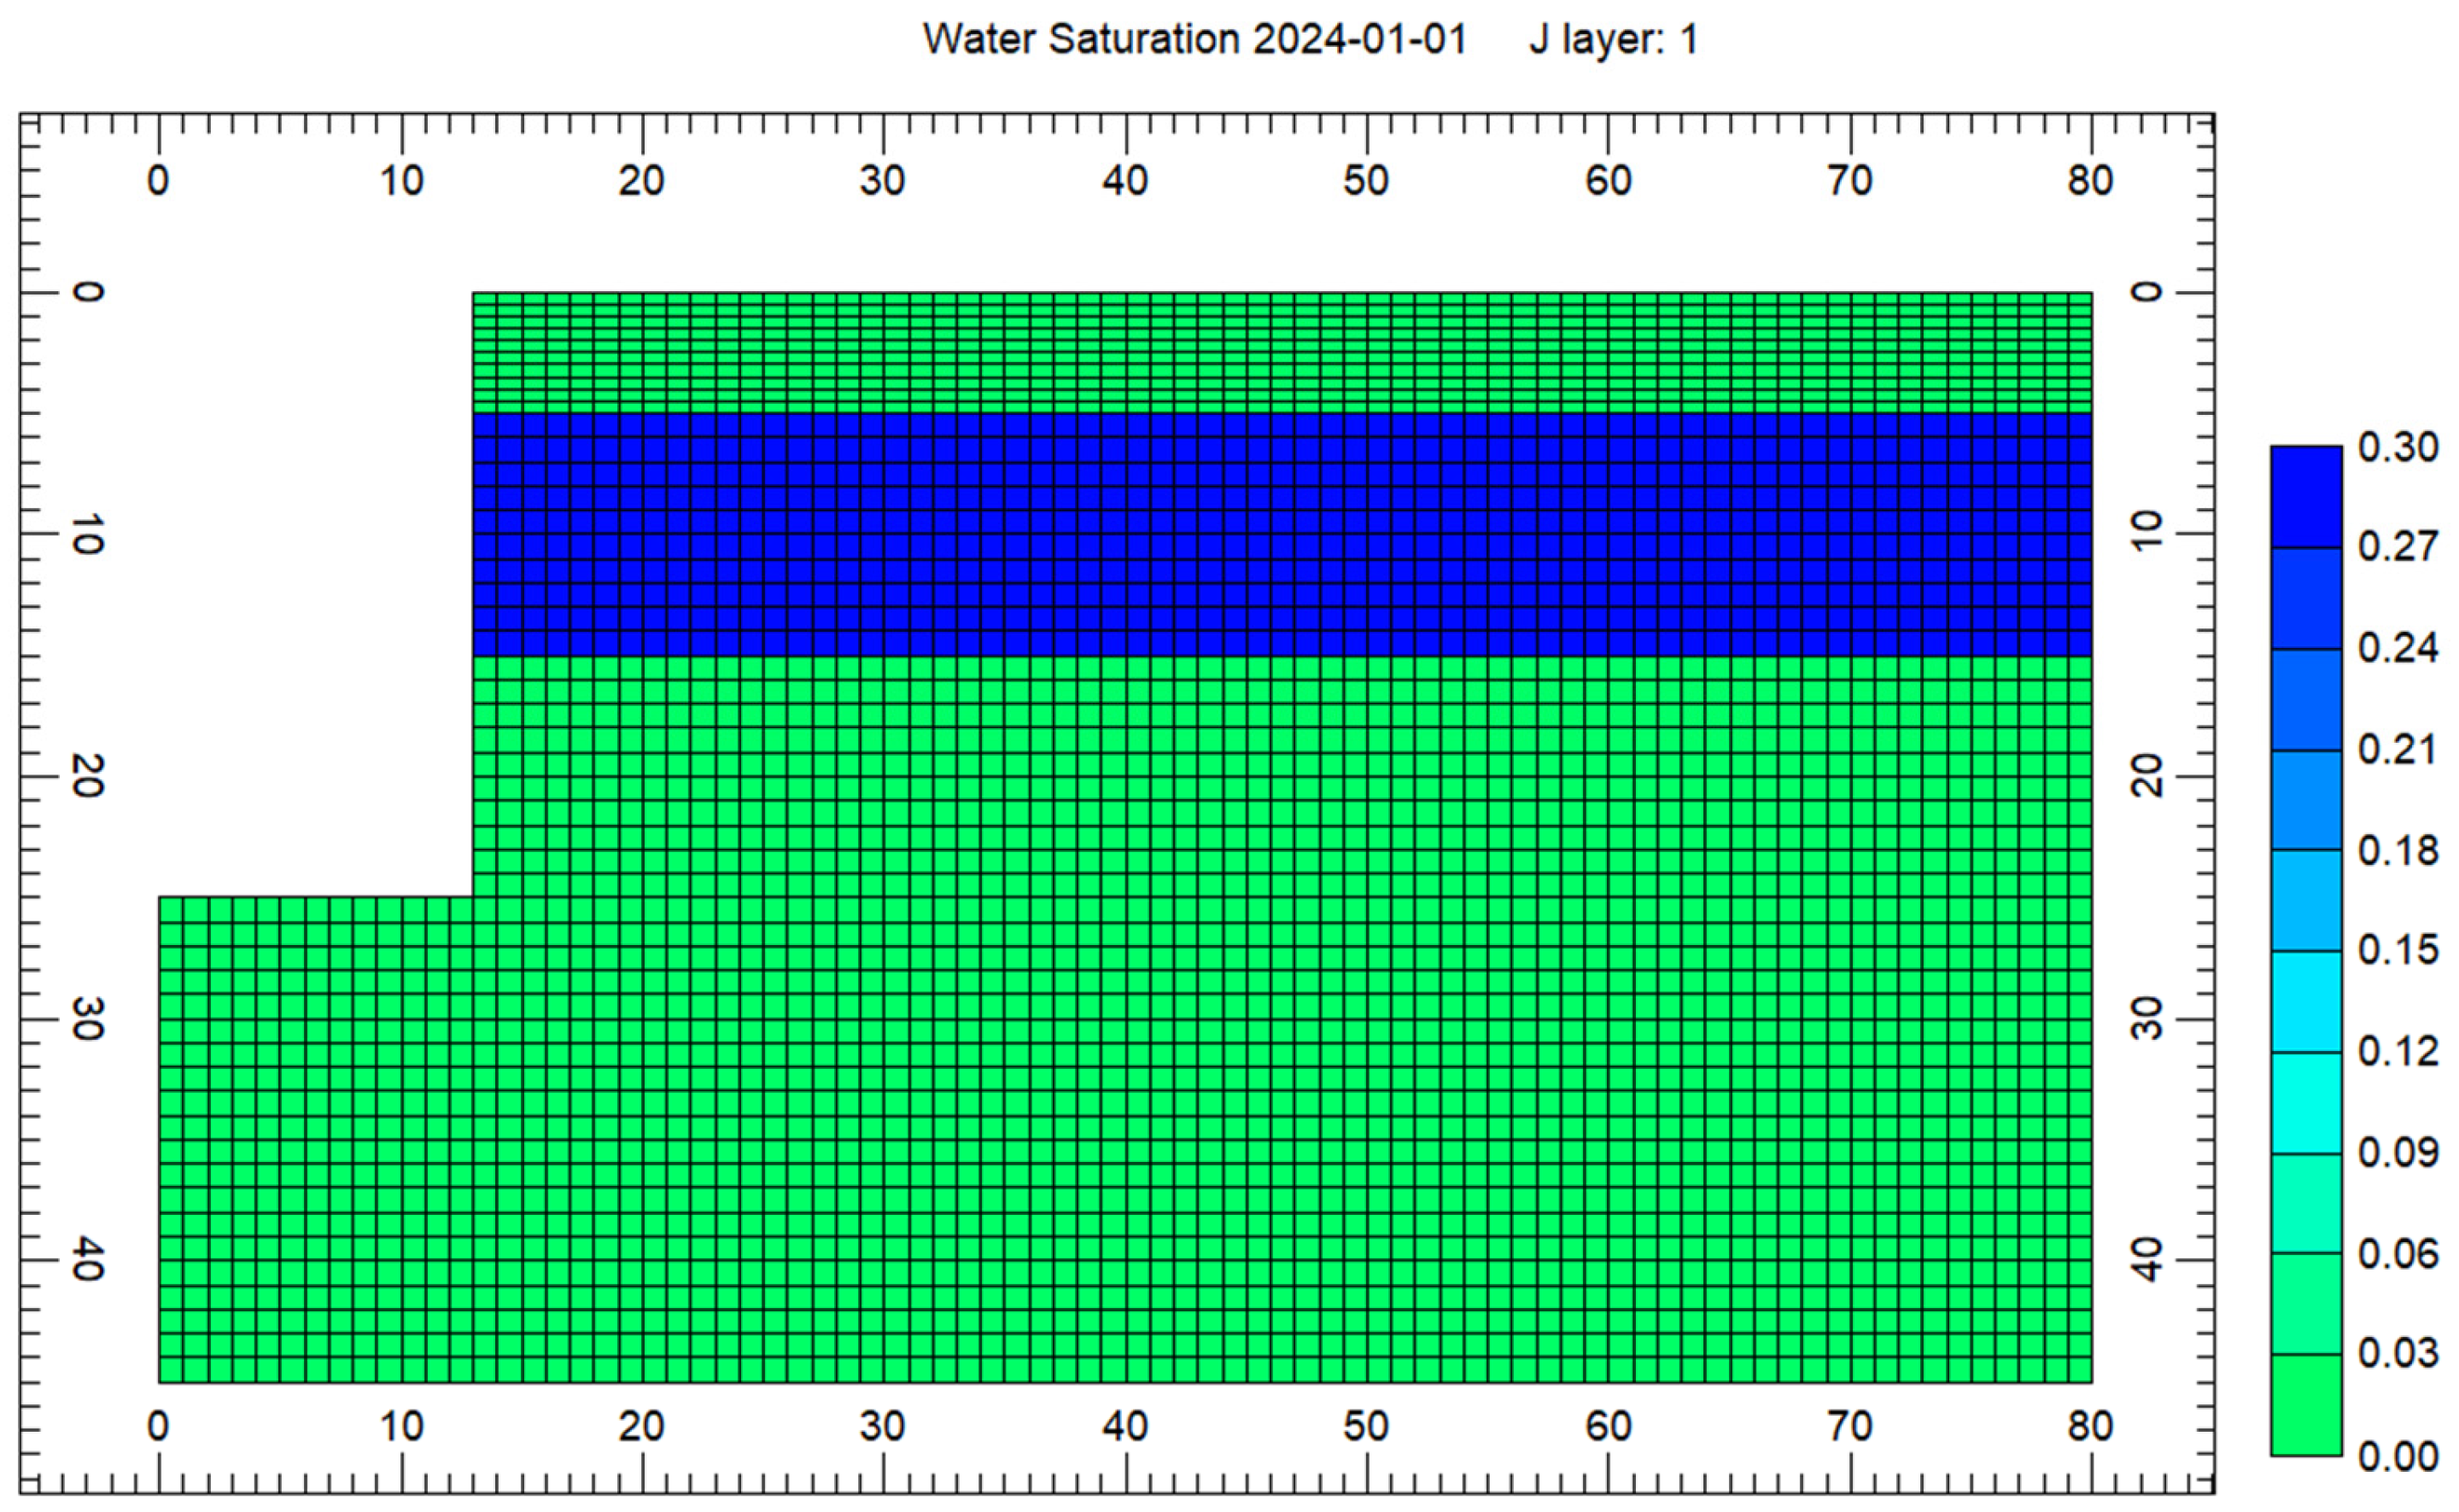
Figure 1. Simulation model for representing the experimental setup.
Energies 18 05868 g001
Figure 2. FTIR spectra of Graphene Oxide (GO), Graphite, and Magnetic Graphene Oxide (Fe3O4@GO).
Energies 18 05868 g002
Figure 3. Raman spectra of graphite, graphene oxide (GO), and Fe3O4 nanoparticles.
Energies 18 05868 g003
Figure 4. Temperature profile and simulation match for experiment 1.
Energies 18 05868 g004
Figure 5. Temperature profile and simulation match for experiment 2.
Energies 18 05868 g005
Figure 6. Temperature profile and simulation match for experiment 3.
Energies 18 05868 g006
Figure 7. Temperature profile and simulation match for experiment 4.
Energies 18 05868 g007
Figure 8. Temperature profile and simulation match for experiment 5.
Energies 18 05868 g008
Figure 9. Temperature profile and simulation match for experiment 6.
Energies 18 05868 g009
Figure 10. Temperature profile and simulation match for experiment 7.
Energies 18 05868 g010
Figure 11. Temperature profile and simulation match for experiment 8.
Energies 18 05868 g011
Figure 12. Temperature profile and simulation match for experiment 9.
Energies 18 05868 g012
Figure 13. Estimated transferred heat for each experiment.
Energies 18 05868 g013
Figure 14. Reflected Power over time for Experiments 1 through 3.
Energies 18 05868 g014
Figure 15. Forward Power over time for Experiments 1 through 3.
Energies 18 05868 g015
Figure 16. Reflected Power over time for Experiments 4 through 6.
Energies 18 05868 g016
Figure 17. Forward Power over time for Experiments 4 through 6.
Energies 18 05868 g017
Figure 18. Reflected Power over time for Experiments 1 through 9.
Energies 18 05868 g018
Figure 19. Forward Power over time for Experiments 7 through 9.
Energies 18 05868 g019
Table 1. Experimental design for testing nanocomposites in an EMH process.
Code for Identification of the SampleExp No.Sw (%)So (%)Sg (%)Presence of 500 ppm of Nanofluid
O30W30110.30.30.4NO
O30W30220.30.30.4NO
O30W30330.30.30.4NO
O30W6040.60.30.1NO
O30W60NP50.60.30.1YES
O30600.30.7NO
DRY7001NO
W3080.300.7NO
W30NP90.300.7YES
Table 2. Heat transfer ratio for every experiment.
Sample IDExp No.Actual Input Power (kW)Water SaturationNanoparticle’s Concentration (ppm)Cumulative Transmitted Heat over 55 h (MJ) Average Transmitted Power (kW)Transfer Ratio
O30W30114.460.305362.720.61 ± 0.0116
O30W30224.420.305142.610.59 ± 0.0116
O30W30334.790.305752.920.61 ± 0.0116
O30W6045.020.606363.210.64 ± 0.0116
O30W60NP54.860.65006533.300.68 ± 0.0116
O3065.020.005432.760.55 ± 0.0116
DRY75.220.005512.770.53 ± 0.0116
W3085.160.305952.990.58 ± 0.0116
W30NP95.160.35006513.300.64 ± 0.0116
Table 3. Relationship of the absorption coefficient (alpha) with fluid saturations and nanoparticle concentration.
SystemWater SaturationCrude Oil SaturationNanoparticle Concentration [ppm]Alpha [1/cm]
Sand with 30% crude oil and no water (either not added or evaporated)00.300.007
Sand with 30% crude oil and 30% water0.30.300.012
Sand with 30% crude oil and 60% water0.60.300.016
Sand with 30% crude oil and no water, but with nanoparticles (O30W60NP in evaporation zone)00.35000.008
Sand with 30% crude oil, 60% water, and nanoparticles (O30W60NP in non-evaporation zone)0.60.35000.015
Dry sand0000.006
Sand with 30% water and no crude oil0.3000.011
Sand with nanoparticles and no water005000.006
Sand with nanoparticles and 30% water0.3000.016
Table 4. Comparison of the alpha values estimated by regression with those identified the optimization analysis.
SoSwNPEstimated Alpha [1/cm]Regression Alpha [1/cm]Absolute Error [1/cm]
0.3000.0070.0070.000
0.30.300.0120.0120.000
0.30.600.0160.0170.001
0.305000.0080.0060.002
0.30.65000.0150.0160.001
0000.0060.0080.002
00.300.0110.0120.001
005000.0060.0070.001
00.300.0160.0120.004
Disclaimer/Publisher’s Note: The statements, opinions and data contained in all publications are solely those of the individual author(s) and contributor(s) and not of MDPI and/or the editor(s). MDPI and/or the editor(s) disclaim responsibility for any injury to people or property resulting from any ideas, methods, instructions or products referred to in the content.