Article

Modeling Hybrid Renewable Microgrids in Remote Northern Regions: A Comparative Simulation Study

by
Nurcan Kilinc-Ata
1,* and
Liliana N. Proskuryakova
2
1
College of Economics and Political Science, Sultan Qaboos University, Alkhoud, Muscat 123, Oman
2
Institute for Statistical Studies and Economics of Knowledge, HSE University, 11 Myasnitskaya Street, 101000 Moscow, Russia
*
Author to whom correspondence should be addressed.
Energies 2025, 18(21), 5827; https://doi.org/10.3390/en18215827
Submission received: 31 August 2025 / Revised: 28 October 2025 / Accepted: 31 October 2025 / Published: 4 November 2025
(This article belongs to the Special Issue Advanced Grid Integration with Power Electronics: 2nd Edition)

Abstract

Remote northern regions face unique energy challenges due to geographic isolation, harsh climates, and limited access to centralized power grids. In response to growing environmental and economic pressures, there is a rising interest in hybrid energy systems that integrate renewable and conventional sources. This study investigates sustainable and cost-effective energy supply strategies for off-grid northern communities through the modeling and simulation of multi-energy microgrids. Focusing on case studies from Yakutia (Russia), Hordaland (Norway), and Alaska (United States), the research employs a comprehensive methodology that combines a critical literature review, system design using HOMER Pro software (version 3.16.2), and a comparative analysis of simulation outcomes. Three distinct microgrid configurations are proposed, incorporating various combinations of solar photovoltaic (PV), wind energy, diesel generators, and battery storage systems. The findings reveal that integrating solar PV significantly enhances economic efficiency, particularly in regions with high solar irradiance, underscoring its pivotal role in shaping resilient, sustainable energy systems for remote northern areas. This study is innovative in its cross-regional comparative approach, linking techno-economic simulation with climatic variability analysis to identify context-specific energy strategies. The key findings highlight how hybrid microgrids combining PV, wind, and storage systems can reduce both costs and emissions by up to 35% compared to diesel-only systems, offering practical pathways toward sustainable electrification in high-latitude regions.

1. Introduction

The Paris Agreement has established a critical global objective: to limit the rise in average global temperature to well below 2 °C, preferably to 1.5 °C, above pre-industrial levels [1]. In alignment with this climate imperative, signatory countries, including those with expansive northern territories such as the United States, Russia, and Norway, have adopted comprehensive national strategies to curtail greenhouse gas (GHG) emissions. As fossil fuel combustion remains the principal source of these emissions, transitioning away from hydrocarbons is essential to achieving national and global decarbonization targets [2,3]. In this context, the accelerated deployment of renewable energy (RE) technologies and the strategic utilization of locally available energy resources have emerged as indispensable components of sustainable energy transitions [4].
Over the past two decades, the global energy sector has undergone a fundamental transformation, marked by an increasing reliance on clean energy sources and the decentralization of energy systems. These shifts, underpinned by rapid digitalization, are enabling the evolution of traditional power systems into smart grids, capable of accommodating a high share of intermittent renewables without compromising grid reliability or resilience. Given the rising role of electricity in final energy consumption worldwide, these advancements are central to net-zero emission strategies [5].
RE integration is occurring at both national and local scales, particularly through the deployment of mini- and microgrids (MGs). These systems typically consist of low-voltage networks with flexible loads, energy storage solutions, and distributed energy resources (DERs), such as photovoltaic (PV) panels, wind turbines, fuel cells, and microturbines [6]. In off-grid or remote contexts, including isolated communities, islands [7], and decentralized energy cooperatives, autonomous MGs offer cost-effective and environmentally sustainable alternatives to centralized systems. Most previous research has focused on developing countries of the Global South, leaving a knowledge gap regarding high-latitude off-grid regions in the developed economies, where extreme low temperatures, seasonal variations in solar and wind resources, and high diesel fuel costs pose unique challenges. In many cases, cost advantages arise through disintermediation, which reduces dependency on conventional utility providers and grid operators [8]. Accordingly, microgrids are increasingly adopted across both industrialized and developing nations, including in North America (e.g., the U.S. and Canada), Europe (e.g., Austria, Greece, Portugal, Italy, Germany), Asia (e.g., Japan, China), and Africa (e.g., Somalia, Kenya, Tanzania, Ghana). These systems often incorporate diverse energy technologies from diesel generators and hydroelectric units to PV arrays, wind turbines, and hybrid combinations [9].
Recent research has increasingly focused on optimizing microgrid design and operations through digitalization. Smart MGs integrate advanced digital solutions for generation, distribution, and real-time power flow management. Emerging technologies such as distributed ledger technologies (DLTs) have been evaluated for their potential to facilitate secure energy trading within the evolving Internet of Energy paradigm [10]. The Internet of Things (IoT) has also become central to smart energy systems, enabling optimized power exchange between sources, loads, and battery energy storage systems (BESS), and facilitating dynamic microgrid operation [11]. However, digitalization also introduces new vulnerabilities—including cybersecurity risks [12,13] and reliability issues related to the degradation of power electronic components [14].
An expanding body of literature has examined microgrid modeling across diverse geographic contexts. Solar PV remains a core component of many MG designs due to its broad accessibility, modularity, and relatively low infrastructure demands—even in regions with modest solar resources. While some systems rely exclusively on PV and battery storage [15], others integrate alternative energy sources such as biogas, reducing the need for storage components [16]. More advanced hybrid configurations incorporate fuel cells, electrolyzers, hydrogen storage systems [17], or combined technologies such as tidal turbines and wind generators [18]. Despite this growing body of research, there is limited understanding of microgrid performance in extreme northern conditions that require careful consideration of seasonal variability, low temperatures, and high energy demand for heating and infrastructure operation.
This study aims to address this research gap by examining the design and feasibility of renewable microgrids in remote northern regions of Yakutia (Russia), Hordaland (Norway), and Alaska (United States). By comparing the performance of diverse microgrid configurations in these northern locations, the study provides original insights into the role of local resource availability, environmental constraints, and technology options in shaping effective energy system design. The analysis employs HOMER Pro software (version 3.16.2), to simulate the technical and economic performance of microgrid systems under site-specific meteorological and demand profiles. Each scenario features varying combinations of PV, wind, diesel backup, and energy storage technologies. The main innovation of this study lies in its cross-country comparative modeling framework, which integrates environmental and economic assessments to identify optimal RE configurations for cold-climate, off-grid regions. Unlike prior studies that focus on single regions or technologies, this research bridges geographic and climatic differences to derive generalizable design principles for high-latitude electrification.
By providing a novel comparative analysis across three geographically and climatically distinct northern regions, this research contributes to both scientific knowledge and practical applications in several ways. First, it addresses a critical gap in the literature by providing a comparative perspective on high-latitude off-grid locations that are underrepresented in existing microgrid studies. Second, the study systematically evaluates the technical, economic, and environmental performance of diverse microgrid configurations, including combinations of PV panels, wind turbines, diesel generators, and energy storage systems, under extreme seasonal and climatic conditions, providing insights into the resilience and reliability of these systems. Third, by employing site-specific meteorological and energy demand profiles, the research demonstrates how local resource availability and environmental constraints influence optimal microgrid design, offering a methodology that can be adapted to other remote or harsh environments. Furthermore, the findings emphasize the substantial cost and emission reductions achievable through the strategic integration of renewables and storage technologies, highlighting their potential to accelerate sustainable energy transitions in northern and Arctic communities.
To sum up, the integrated modeling approach, combining technical simulation with economic assessment, provides a replicable framework for future studies aimed at optimizing RE deployment in regions with harsh climate conditions. This study uses advanced software to simulate multiple scenarios, enabling a semi-quantitative assessment of system performance under varying conditions. This approach demonstrates the practical applicability of the methodology for energy planners, policymakers, and engineers seeking robust, cost-effective solutions for electrification in northern areas.
The remainder of this paper is structured as follows: Section 2 reviews the relevant literature and contextualizes the energy systems of the selected regions and outlines the research methodology, data sources, and modeling framework. Section 3 presents and analyzes the simulation results, including sensitivity tests and identified limitations. Finally, Section 4 concludes with key takeaways and suggestions for future research and implementation strategies.

2. Materials and Methods

2.1. An Outline of the Methods

Various methodological approaches have been employed in the modeling of microgrids (MGs), reflecting the multidimensional nature of their design and operation. A significant body of research focuses on the technical and economic optimization of MGs, analyzing system configurations based on diverse combinations of RE resources and storage technologies. These studies frequently utilize simulation and optimization platforms such as HOMER, MATLAB, and Monte Carlo-based models [16,17]. Within these platforms, a wide range of optimization techniques are applied, including multi-objective optimization, genetic algorithms, general algebraic modeling systems (GAMS), and various mathematical programming frameworks.
In parallel, a growing subset of studies incorporates social, environmental, and behavioral dimensions into MG modeling. These approaches often rely on tools such as agent-based modeling, RETScreen, DIgSILENT PowerFactory, Eco-Si, and IoT-enabled systems, allowing for the consideration of user behavior, environmental constraints, and decentralized control strategies [19]. Despite this methodological diversity, most studies are limited to single-country or single-region analyses, offering insights into localized contexts but constraining broader generalizations [18]. Comparative assessments across multiple geographic locations remain scarce, largely due to the lack of standardized and location-specific datasets, which impedes replicability and validation of model assumptions [20,21].
In the present study, MG modeling is conducted using the HOMER Pro (Hybrid Optimization of Multiple Energy Resources) software, which facilitates techno-economic analysis with a specific focus on minimizing the Net Present Cost (NPC). This tool enables: (i) the optimal planning of multi-energy MG systems through the identification of the least-cost configurations, and (ii) the exploration of system operation features under various RE resource scenarios [22].
HOMER Pro was selected due to its extensive capabilities for simulating MG performance in geographically diverse contexts. Its built-in libraries allow for the detailed modeling of generation technologies, storage components, and load profiles, while its flexible architecture supports the construction of hybrid energy systems under varying techno-economic, environmental, and policy conditions [23]. The software’s versatility and user-defined parameterization make it particularly well-suited for off-grid energy solutions in remote or climatically extreme environments [24,25].
By applying HOMER Pro across three geographically and climatically distinct northern regions, this study goes beyond typical single-region analyses. The methodology integrates site-specific meteorological and load data to capture the influence of local resource availability and environmental constraints on optimal MG design. This comparative approach allows for the evaluation of technical, economic, and environmental performance under diverse regional conditions, providing insights that are directly applicable to planning, policy, and engineering practice in remote or harsh environments.
Although HOMER Pro allows for detailed scenario analysis, the present study focuses on a comparative assessment of multiple hybrid microgrid configurations across three distinct northern regions. The primary objective was to identify the optimal configurations under realistic site-specific conditions, rather than to conduct exhaustive sensitivity testing on individual parameters such as fuel price, CAPEX, or seasonal load. Nonetheless, the modeling framework provides sufficient flexibility to incorporate such analyses in future work, and the current results still offer meaningful insights into system performance, resilience, and cost-effectiveness across diverse climatic and geographic contexts.

2.2. Case Study Regions and RE Potential

This study focuses on three northern regions, the Republic of Sakha (Yakutia) in the Russian Federation, Hordaland County in Norway, and the State of Alaska in the United States, chosen because of their similar traits: limited or no centralized grid infrastructure, location within northern latitudes, and difficult climate conditions. These similarities make them especially useful for assessing the performance and feasibility of decentralized, renewable-based microgrid (MG) systems. Regional assessments included local meteorological conditions (wind speed, solar irradiance, and temperature profiles) and energy consumption indicators to evaluate the practicality of RE integration.

2.2.1. Russian Federation—Republic of Sakha (Yakutia)

The Republic of Sakha (Yakutia) is Russia’s largest administrative region located above the Arctic Circle. Covering approximately 3.08 million km2, it has a notably low population density of just 0.31 inhabitants per km2. The regional economy is resource-intensive, dominated by extractive industries including gold, diamond, tin, and coal mining, along with timber processing and manufacturing. Indigenous communities engage in traditional practices such as reindeer herding, fur farming, and fishing [26].
Yakutia holds considerable RE potential, with high solar radiation in inland areas and strong wind regimes along its Arctic coastline [27]. Notably, it was the first region in Russia to implement a legal framework supporting RE deployment [28]. As of 2024, Yakutia is home to 21 PV plants, including the world’s largest solar installation beyond the Arctic Circle, commissioned in Batamay in 2015. The regional share of renewable electricity generation, excluding large hydropower, is projected to reach 10%—approximately ten times the national average [29]. These installations are primarily integrated within autonomous smart microgrids that combine diesel generators with energy storage.
Despite these developments, academic research on off-grid MG systems in Yakutia remains limited. Notable contributions include [25], who demonstrated the environmental and economic benefits of decentralized systems using a Monte Carlo tree search approach in Transbaikal National Park [30] proposed a multi-criteria design for net-zero energy systems in rural Siberia. Moreover, ref. [31] explored emerging technologies such as metal hydride storage in MG configurations involving fuel cells and electrolyzers.

2.2.2. Norway—Hordaland County

Hordaland, located on the western coast of Norway, spans 15,460 km2 and had a population of 524,495 in 2019, with a density of 33 inhabitants per km2. The region encompasses several islands, including Askøy, Sotra, and Stord, whose geographic isolation makes them well-suited for microgrid applications [20]. The local climate is humid, with high precipitation and considerable wind energy potential due to the coastal location.
Norway’s electricity generation is overwhelmingly RE, with hydropower contributing over 92% of electricity production by 2020 [32]. Nationally, renewables accounted for 67.5% of gross final energy consumption in 2018 [33]. Hordaland is also a strategic maritime and energy hub, hosting Norway’s largest naval base and companies responsible for 80% of the country’s oil exports [34].
Microgrids in Norway are typically deployed in regions with minimal electricity demand or weak grid connections. Approximately 94% of distributed generation is sourced from small-scale hydropower [35]. Several studies have modeled MG deployment in Hordaland and neighboring islands. For instance, ref. [36] applied a two-stage stochastic MILP model combined with a heuristic CDM method to optimize MG design. Ref. [37] analyzed cost dynamics for wind-based MGs in the municipality of Ås, concluding that low wind potential rendered the system economically unviable. Ref. [20] proposed an MG model for three Hordaland islands, achieving 85% RE penetration using a hybrid system comprising 123 kW PV, 3 MW wind, 1.059 MW hydropower, 1.2 MW hydrokinetic, 0.5 MW biogas, and 11 MW diesel generation with 15 MWh storage. Similarly, ref. [38] simulated eight MG configurations in Grimstad, estimating an average operational cost of €0.2275 per kWh.

2.2.3. United States—State of Alaska

Alaska, the largest and northernmost state of the United States, spans over 1.7 million km2 and has a population of approximately 736,081, resulting in a low population density of 0.49 people per km2—comparable to Yakutia. Its economy, like Yakutia’s, is dominated by extractive industries, particularly oil and gas, alongside fisheries and timber production.
Despite its vast renewable potential, Alaska’s 2022 electricity generation relied predominantly on natural gas (42%), followed by hydropower (29%), petroleum (14%), and coal (12%), with other RE sources (solar, wind, biomass) contributing just 3% [39]. Nevertheless, Alaska leads the United States in microgrid adoption, with over 3.500 MW of installed MG capacity as of 2021—among the highest globally [40]. MGs in Alaska typically serve small, remote communities with populations under 1000 and average loads below 300 kW. These systems commonly integrate wind and solar energy, supplemented by hydropower, geothermal, and biomass.
Academic literature on Alaskan MGs emphasizes technological configurations and renewable integration challenges. Ref. [41] assessed solar PV installations in communities ranging from 2.2 kW (Ambler) to 50 kW (Galena). Ref. [42] detailed the implementation of over 70 renewable-diesel hybrid MGs, focusing on technical barriers and mitigation strategies [43] introduced a decision-making framework for aligning renewable generation with non-electric thermal loads, such as space and water heating, showing potential for significant cost reductions and energy efficiency improvements [44].

2.3. Microgrid Design and Planning

The design and planning of microgrids (MGs) usually follow a two-phase approach: research and development (R&D), followed by implementation and validation [45,46]. In the R&D phase, three main sub-stages can be identified: developing representative case studies, defining system specifications, and modeling the characteristics and components of the microgrid [46]. An important step in this process is selecting an appropriate benchmark test system, which should be based on its relevance to the proposed design, level of applicability, and the availability of reliable operational data. This benchmark acts as a basis for modeling system components, including control mechanisms and communication infrastructure, which are then tested through simulations to evaluate technical feasibility and performance. A key goal of modern MG design, particularly in remote and off-grid locations, is integrating RE sources (RES) to decrease reliance on fossil fuels [47]. In this study, various technical and economic parameters are included to develop optimal configurations suited to the unique conditions of each case study region.
PV/Wind Module: PV and wind modules are modeled based on the geographic coordinates (latitude and longitude) of each site to capture region-specific solar irradiance and wind speed profiles [48]. PV modules generate direct current (DC) electricity by converting solar radiation, and their output is influenced by multiple factors, including the type of solar cell, nominal panel power, derating factor, irradiance levels, cell temperature, temperature coefficient, and prevailing environmental conditions [49,50,51]. These parameters are used in performance equations to estimate the energy output and inform system design. Similarly, wind turbine models account for hub height, rotor diameter, cut-in and cut-out wind speeds, and temporal variations in wind speed. Together, these components form the foundation for a context-specific and cost-effective MG system that can reliably meet local energy needs (Equation (1)).
P P V = Y P V f P V G T ¯ G T , S T C 1 + a p T C T C , S T C
Equation (2) is used to calculate the power law formula, which is used to estimate the wind speed data in HOMER Pro.
U h u b = U a n e m ( Z h u b Z a n e m ) α
where U h u b is the wind speed at the wind turbine hub height (m/s), U a n e m is the wind speed at the anemometer height (m/s), Z h u b is the anemometer height (m), and a is the power law exponent. By multiplying the air density ratio by the power value predicted by the power curve with the air density at standard temperature and pressure (1.225 kg/m3), HOMER Pro adapts to real-world conditions as follows (Equation (3)):
P W T G = P p 0 × P W T G , S T P
P W T G is the wind turbine power output (kW), and P W T G , S T P is the wind turbine power output at standard temperature and pressure (kW). While p is the actual air density (kg/m3), p0 is the air density at standard temperature and pressure (1.225 kg/m3).
DGs are also employed as alternative energy sources when there is no connection to the grid or a disruption in the electricity supply [52]. DGs that are favored as backup power offer a strong and consistent energy supply [53]. Below is the formula (Equation (4)) for calculating how much fuel a diesel-fueled generator uses each hour.
F = F 0 Y g e n + F 1 P g e n
Battery devices are crucial to provide energy continuity in an RE system that depends on weather conditions [54]. Storage units fulfill energy reliability during power outages or times of peak demand, which improves the functioning of MGs [55]. Below are HOMER’s calculations of the kinetic battery model’s charge power, maximum charge rate of the storage component, and maximum charge current values of the storage component.
P b a t t e r y , c   m a x , m c r = 1   e a t t ( Q m a x Q ) t
An essential component in the architecture of microgrids (MGs) is the power converter, which ensures efficient integration between the alternating current (AC) and direct current (DC) subsystems. A bidirectional power converter is typically employed within MGs to facilitate energy transfer between the AC and DC buses, depending on the system’s operational requirements [56,57]. This converter operates dynamically, functioning as an inverter during energy supply from DC to AC and as a rectifier when converting AC to DC, thereby adapting to variations in energy production, consumption, and storage [58]. To enhance system accuracy and cost analysis, the HOMER Pro software includes features that allow for the customization of converter cost curves, improving the representation of system economics in the simulation [59]. Figure 1 illustrates the modeled grid-integrated microgrid configuration, which incorporates key components such as diesel generators, wind turbines, PV systems, a 1 kWh battery storage unit, and an AC/DC converter to ensure operational flexibility and energy balance across the system.
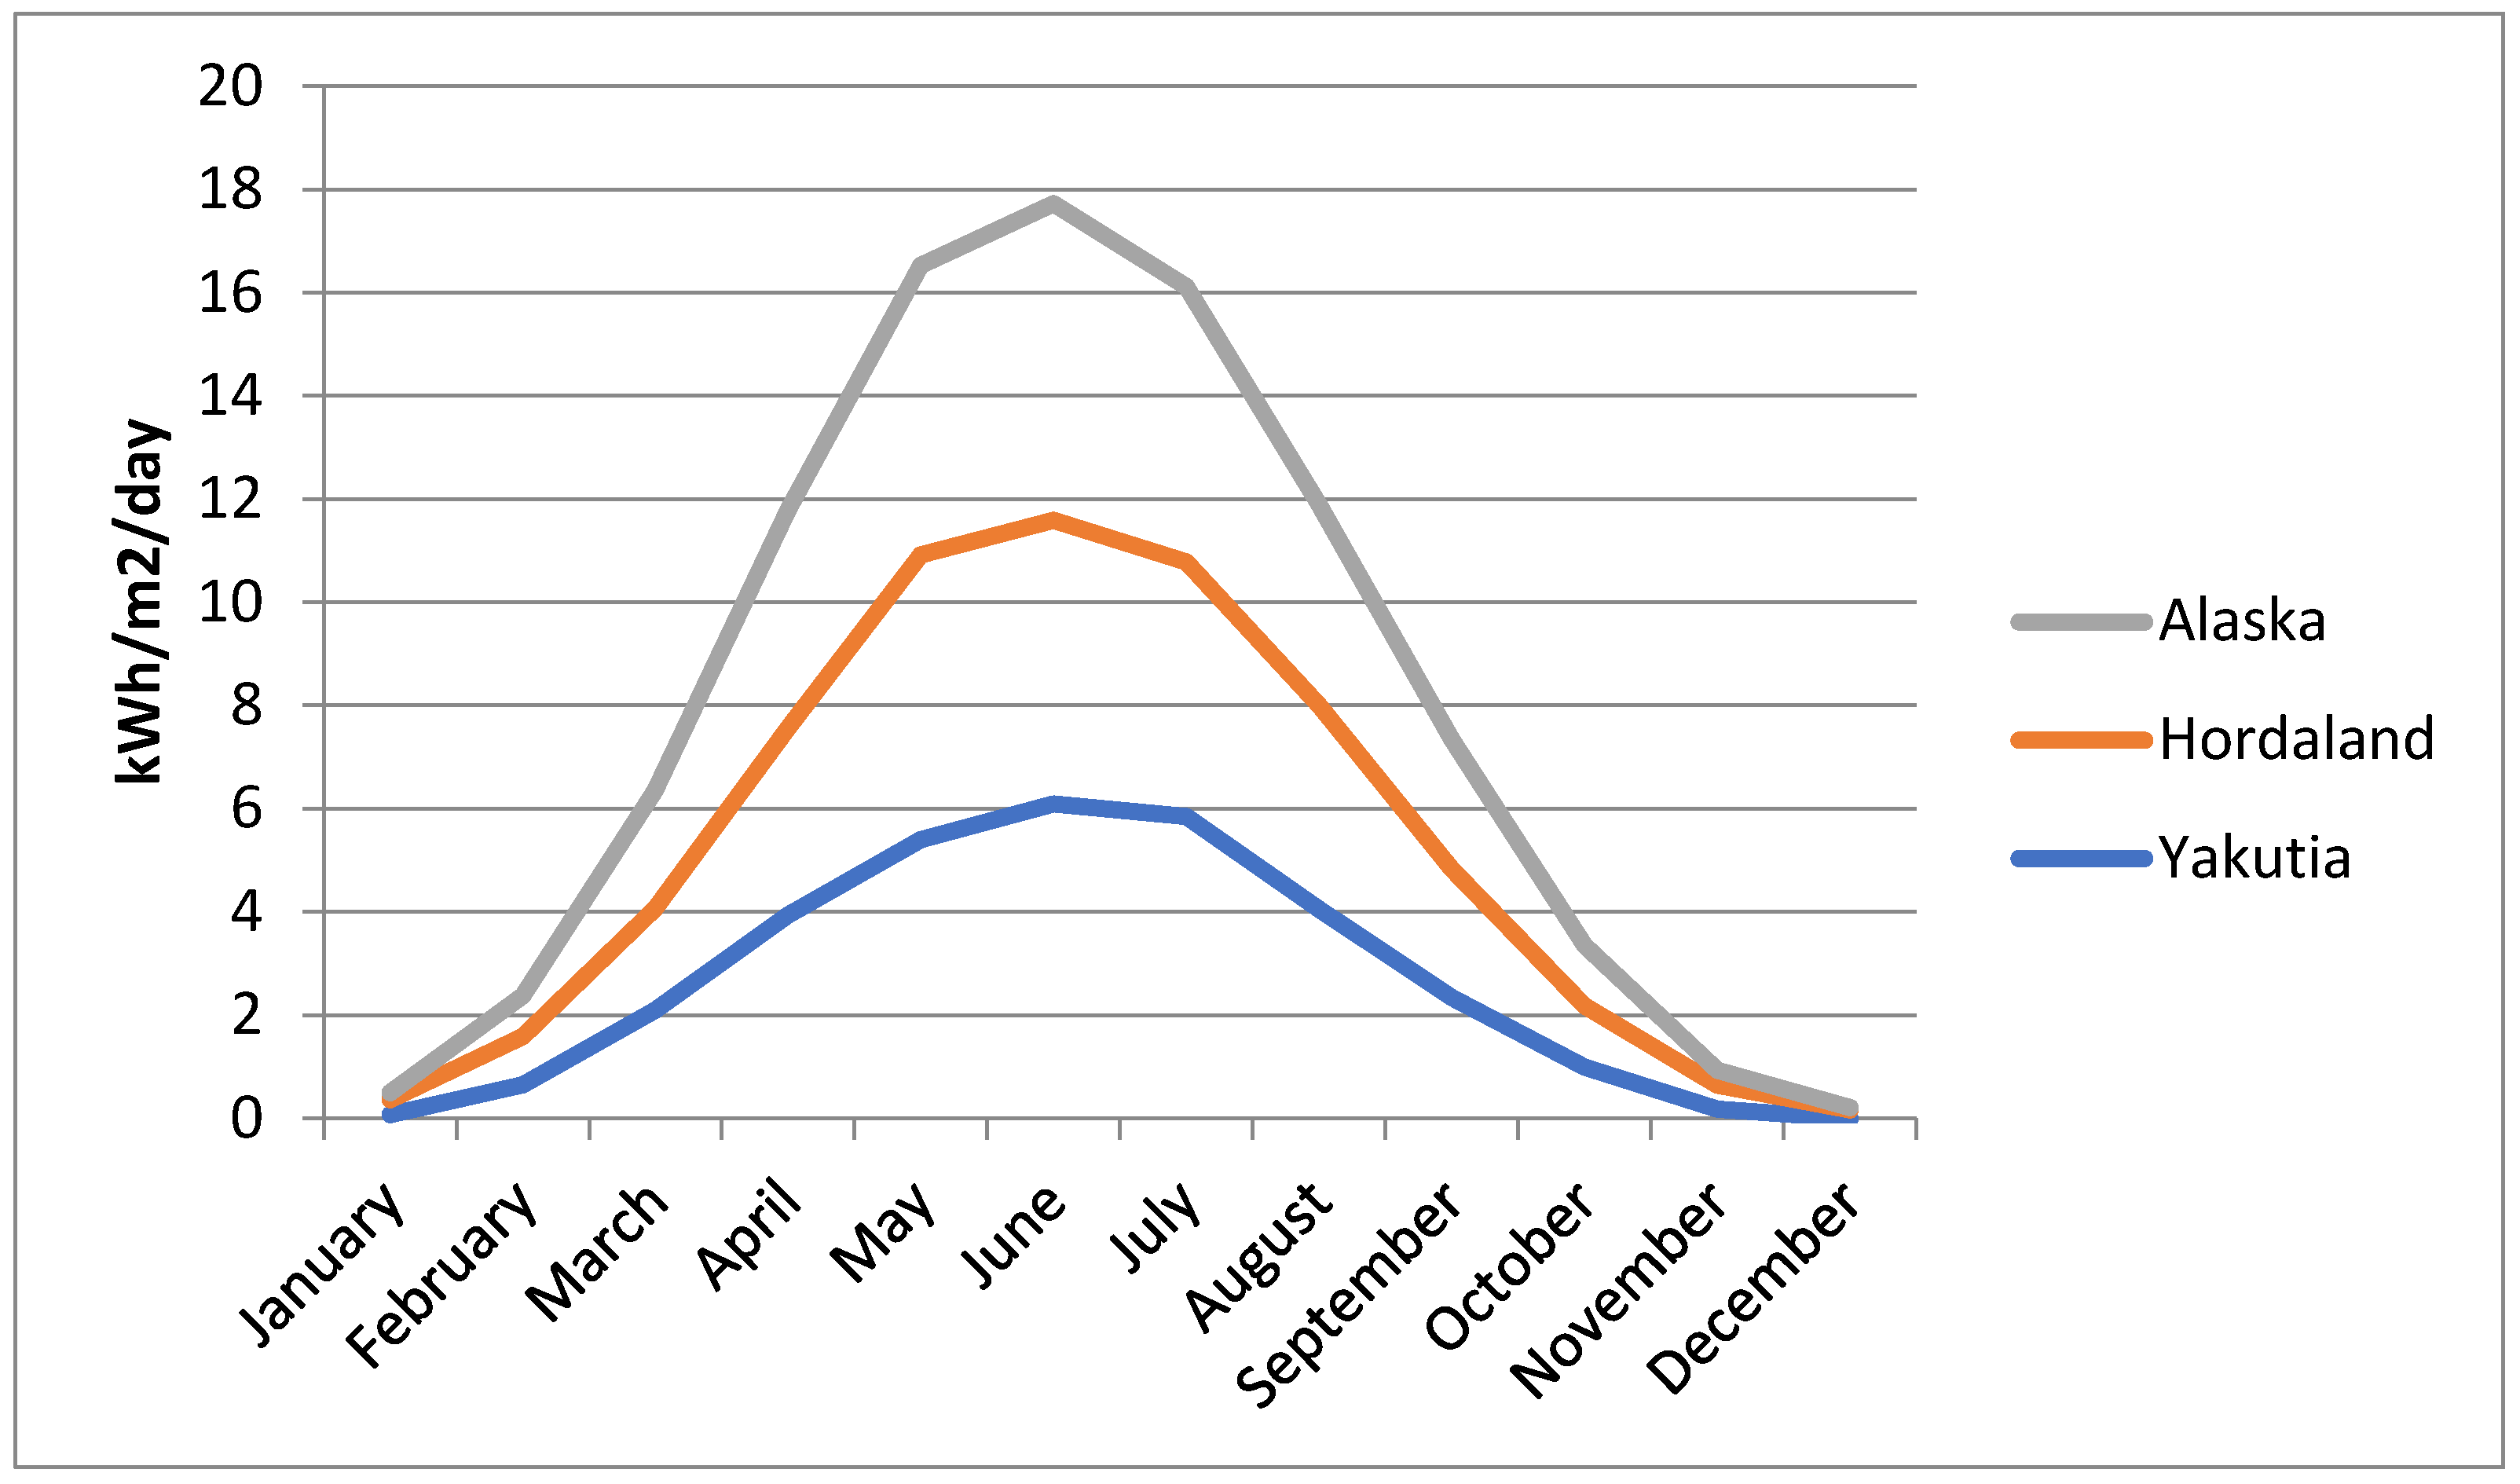
This study examines six hybrid energy system configurations, each comprising different combinations of diesel generators, wind turbines, solar PV arrays, and battery storage units. The modeling process incorporates long-term meteorological data, including 30-year monthly averages of global horizontal irradiance and wind speed at 50 m above ground level, as well as monthly average air temperatures spanning from 1984 to December 2013. All climatic data were sourced from NASA’s Worldwide Energy Resources forecasts. Figure 2 presents the annual average daily solar irradiance (kWh/m2/day) profiles for the selected study regions, providing a visual representation of their solar energy potential.
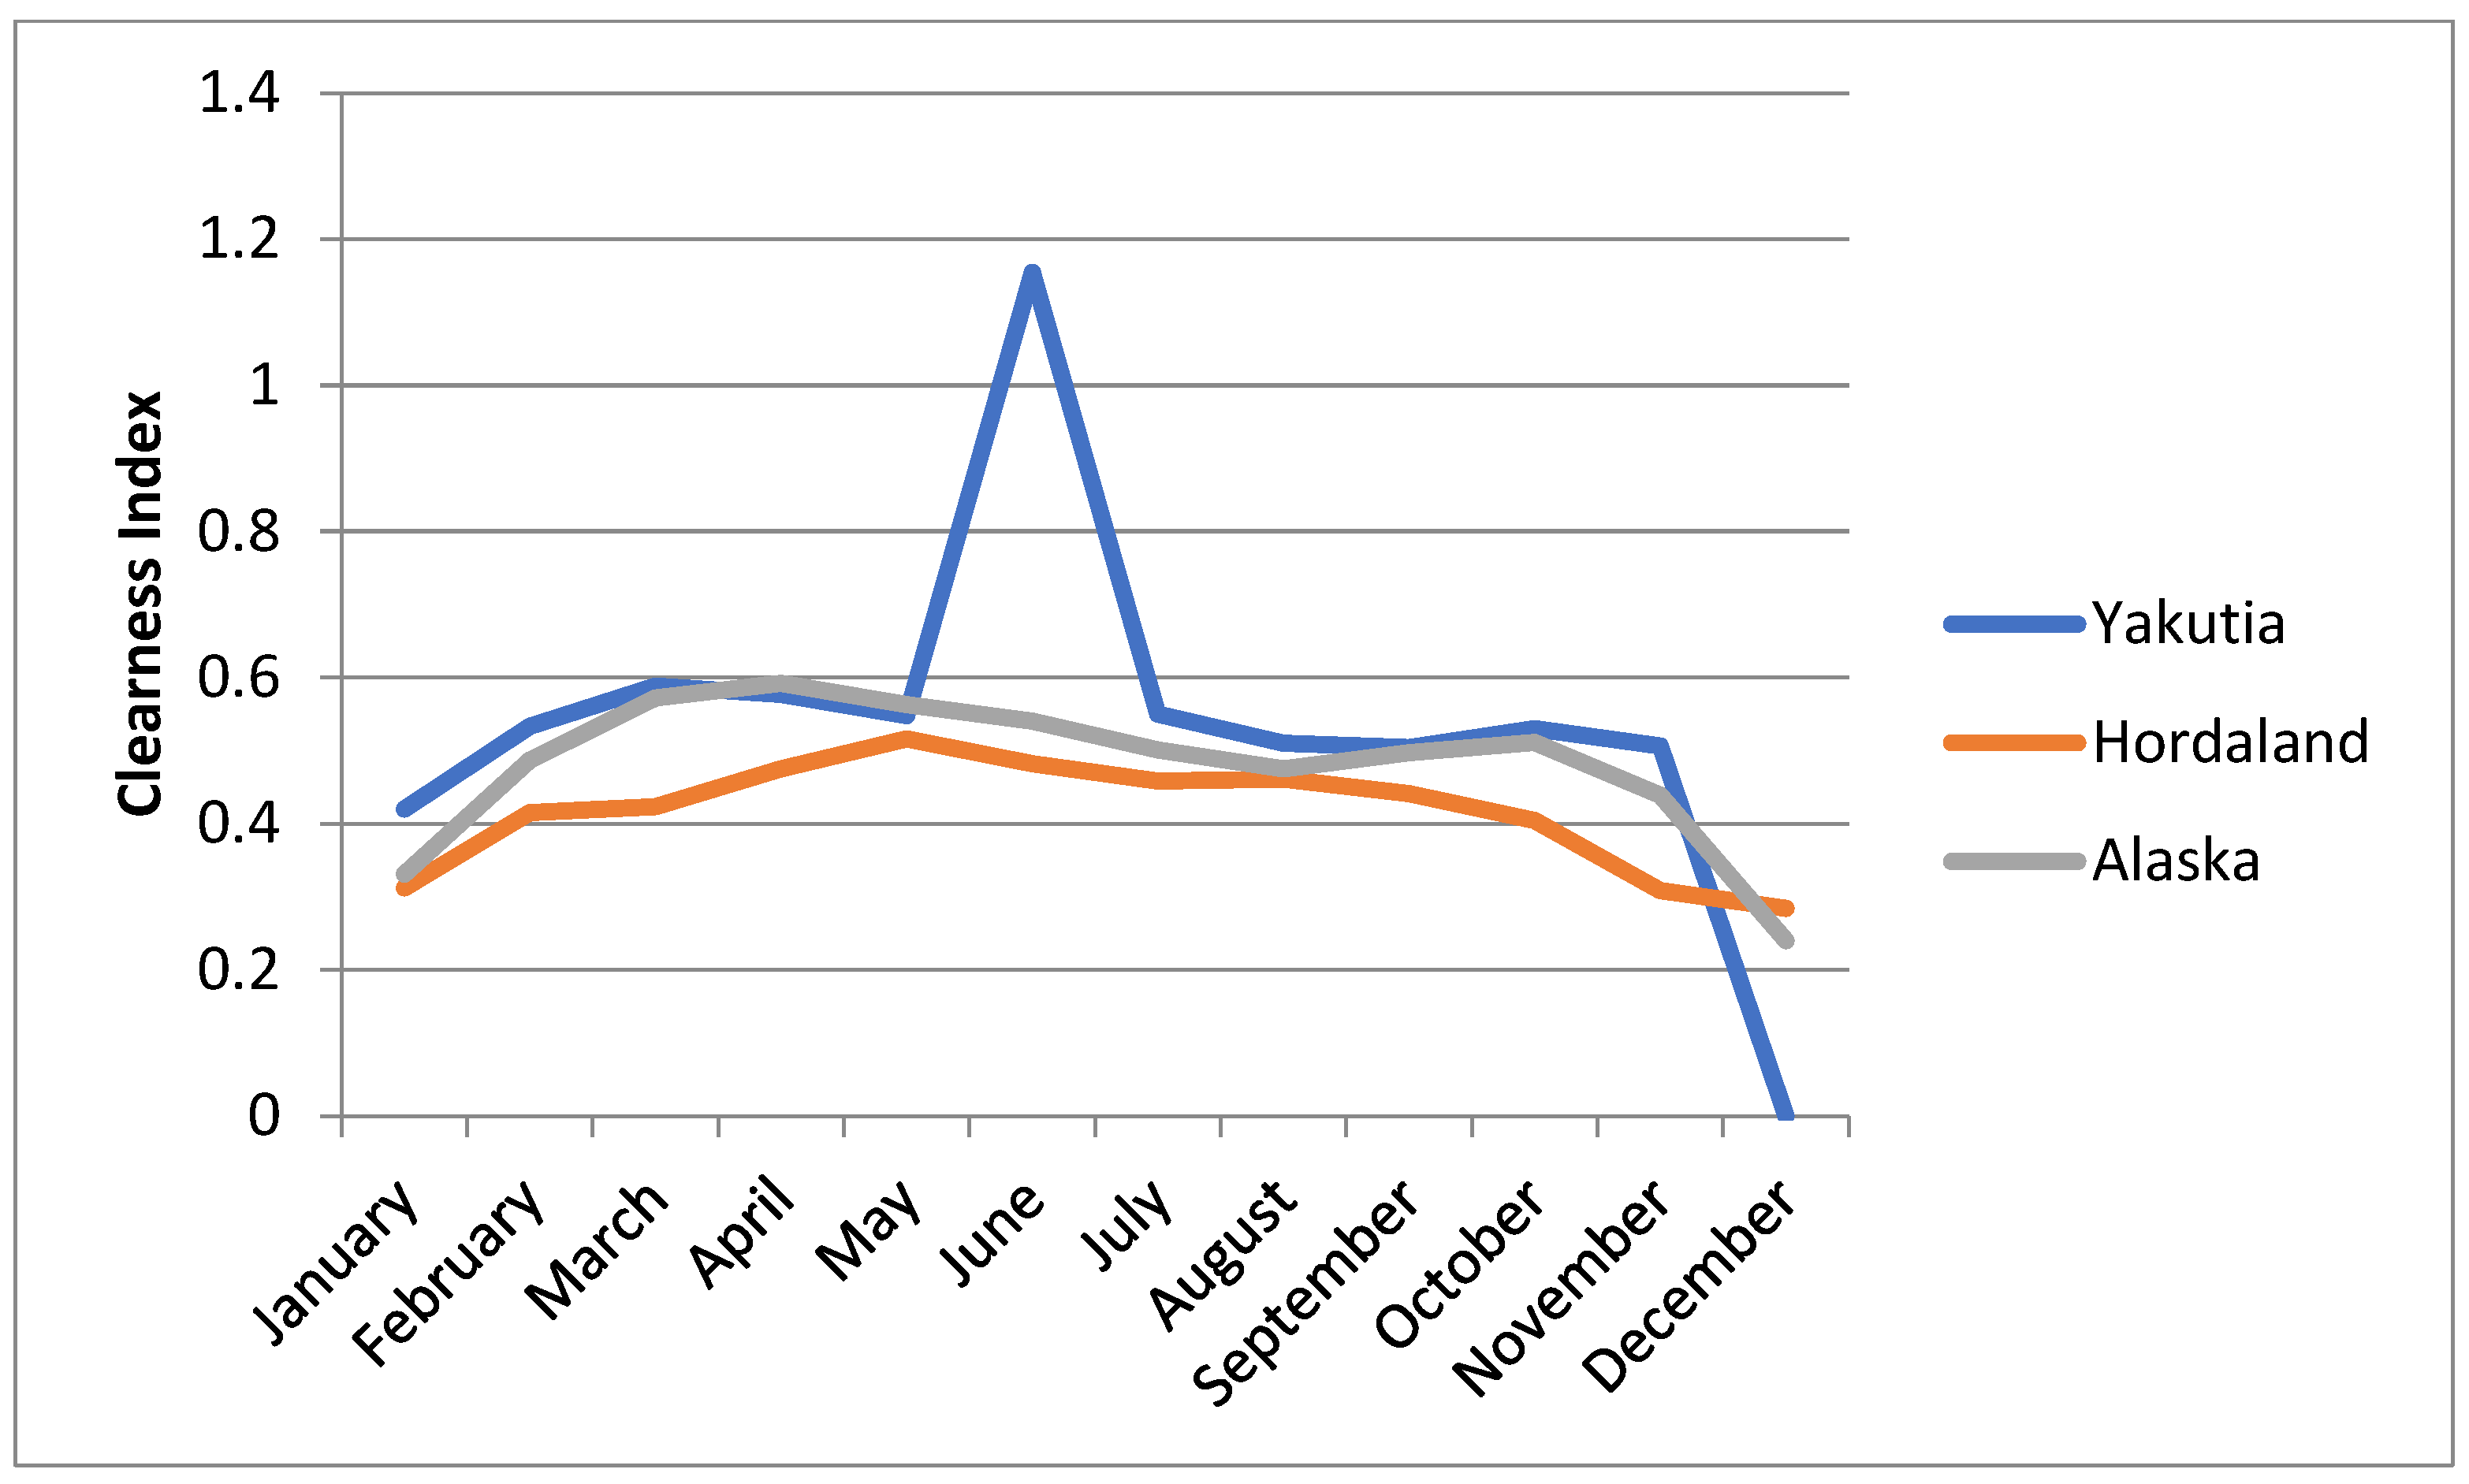
It can be concluded that Alaska exhibits the highest levels of solar irradiation, followed by Hordaland and Yakutia. However, the effectiveness of PV systems depends not only on irradiation intensity but also on atmospheric clarity, which is quantified by the Clearness Index (Figure 3). This index represents the fraction of solar radiation that penetrates the atmosphere to reach the Earth’s surface and is calculated as the ratio of surface radiation to extraterrestrial radiation, yielding a dimensionless value ranging between 0 and 1 [61].
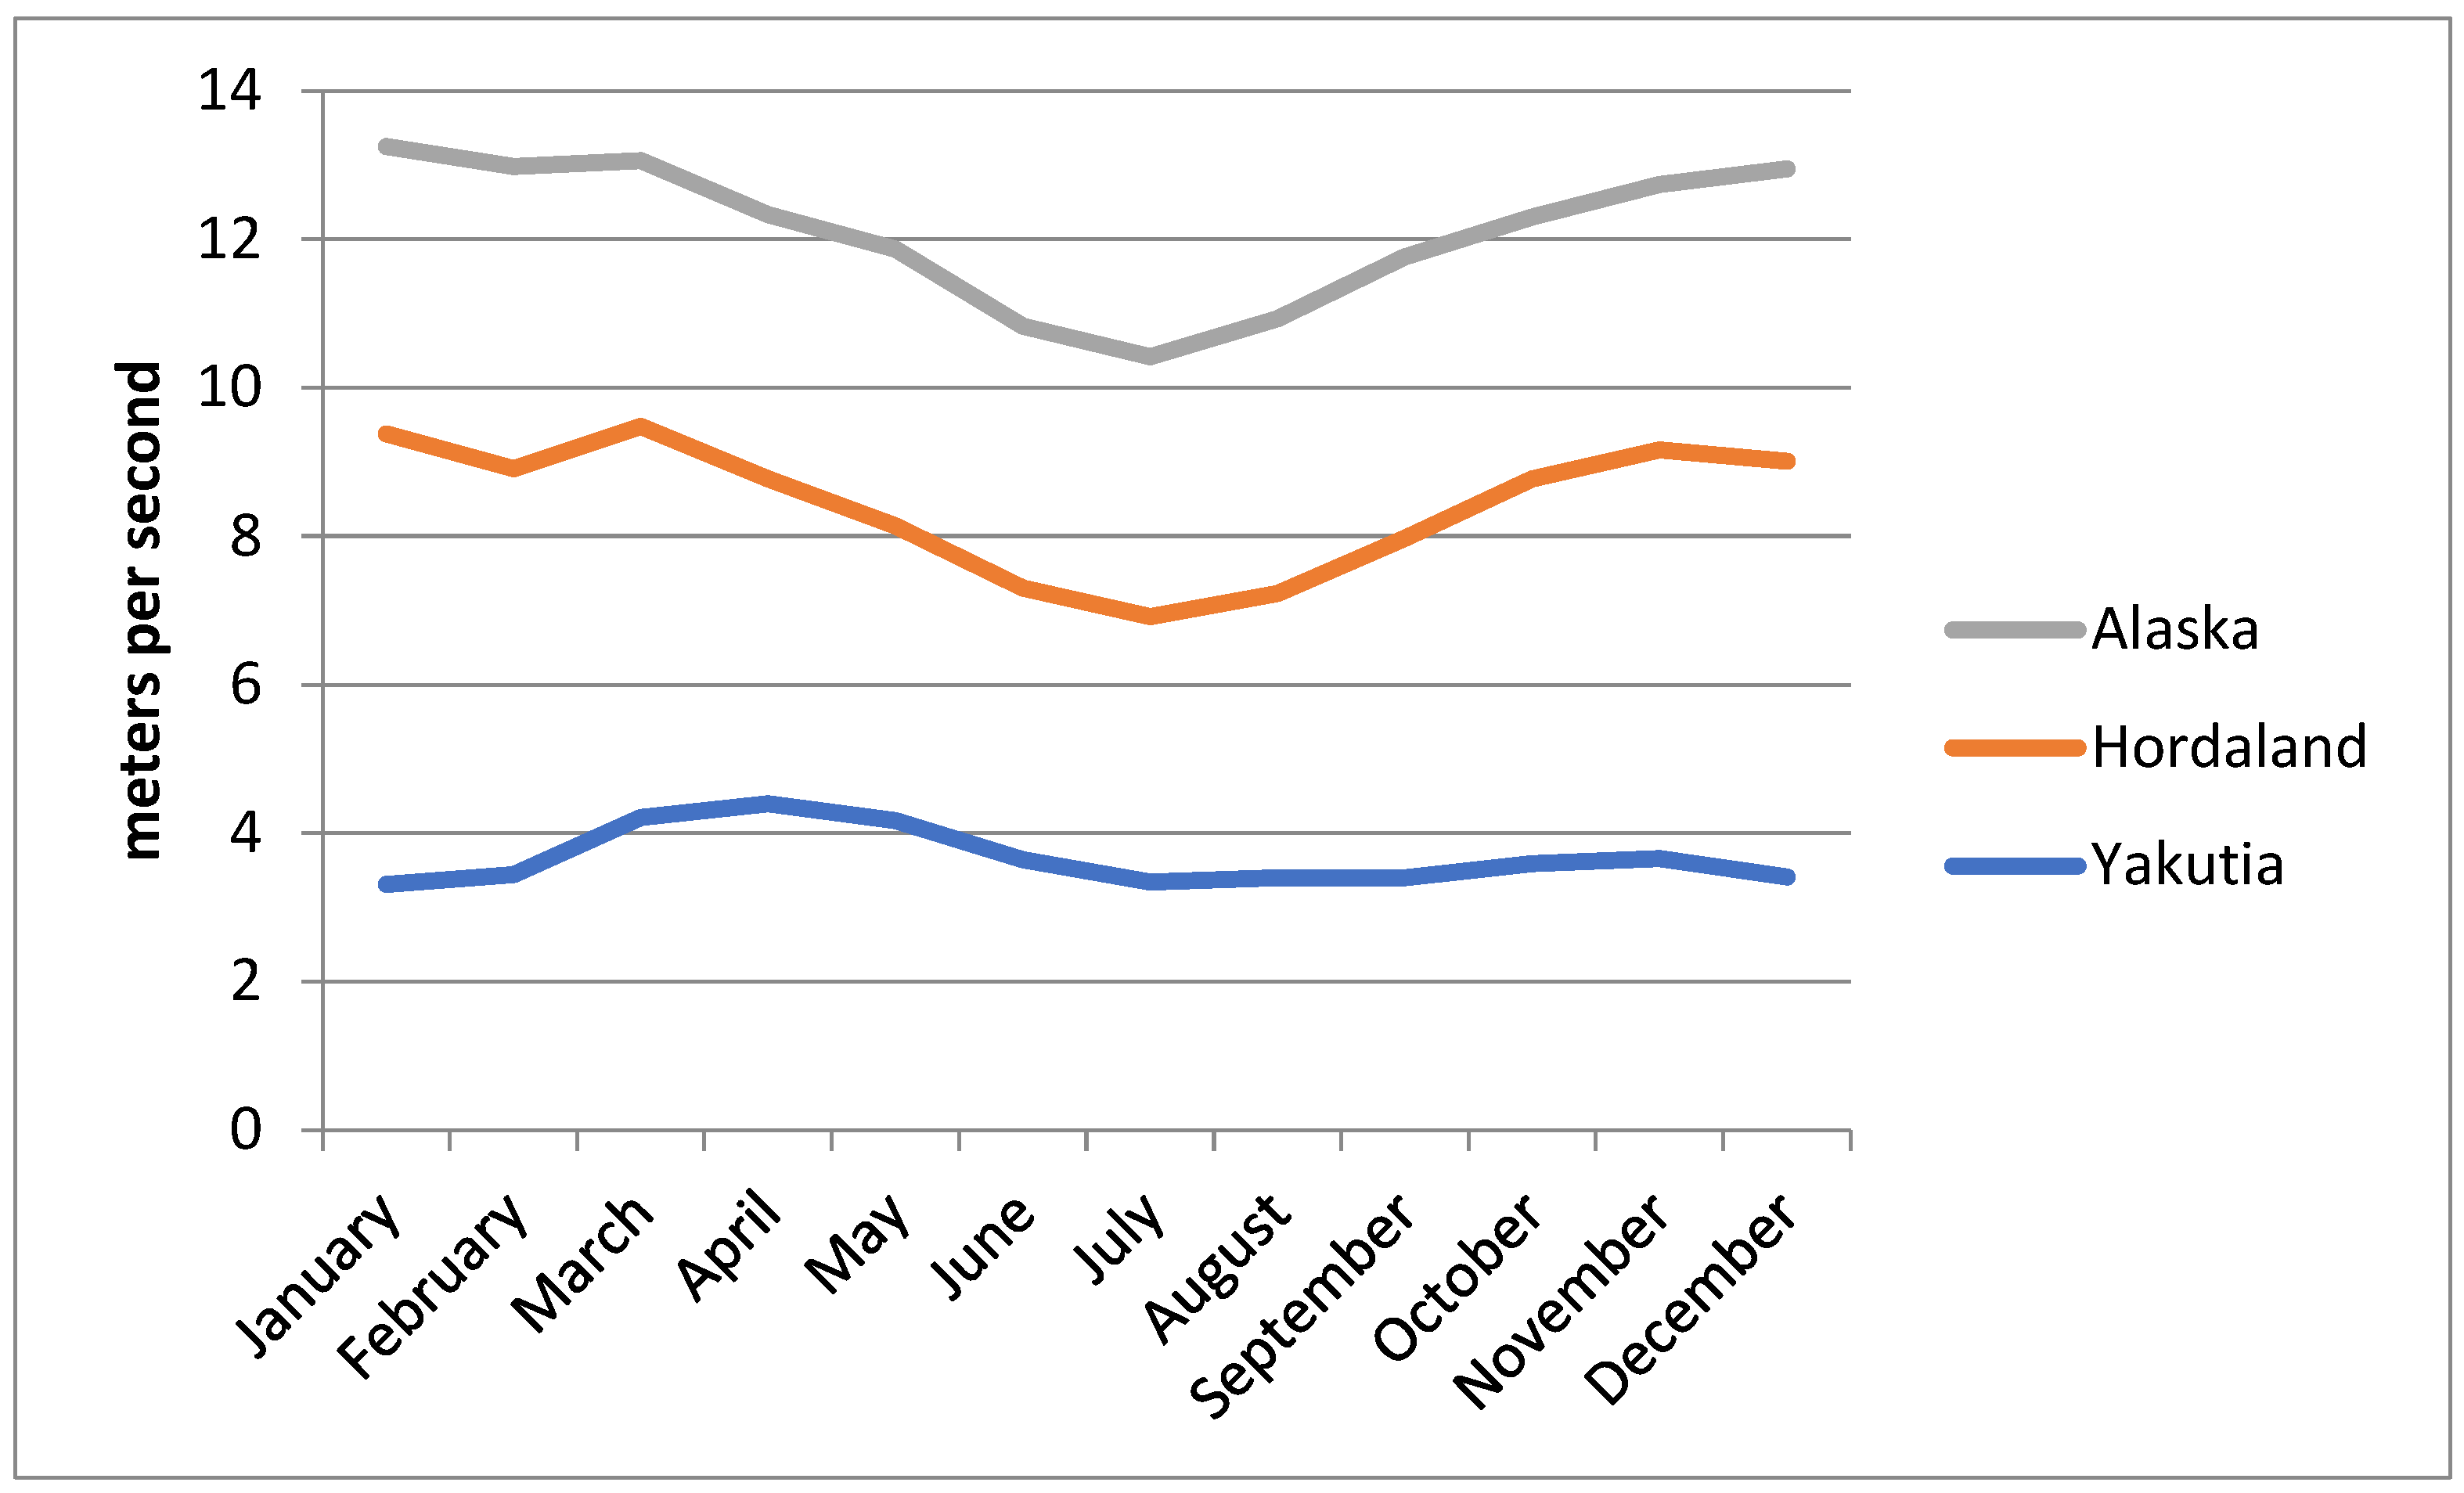
It can be inferred that solar irradiance positively correlates with the Clearness Index, which varies inversely with atmospheric factors such as humidity, airborne particulate concentration, and other meteorological conditions [62]. As depicted in Figure 3, the Clearness Index reaches its maximum in June within the Yakutia region, coinciding with an average temperature of 26 °C—the highest among the three study areas compared to Hordaland and Alaska. Figure 4 presents the wind speed profiles for the selected regions, revealing that Alaska experiences the strongest wind regimes, followed by Hordaland and Yakutia. Notably, peak wind speeds occur between March and June, underscoring a critical seasonal window for harnessing wind energy in these northern localities.

2.4. Optimization Options

The primary objective of modeling with HOMER Pro is to minimize the NPC, also referred to as the life cycle cost, which represents the comprehensive economic assessment of a project over its entire lifespan [63]. NPC is defined as the present value of all incurred costs, including capital investments, operation and maintenance (O&M), component replacements, and grid power purchases, offset by the present value of all revenues such as electricity sales to the grid and salvage value at the end of the project’s life [64]. The total NPC is calculated by aggregating the discounted cash flows for each year of the project lifecycle, providing a holistic measure of economic feasibility and cost-effectiveness [65]. This calculation is implemented within HOMER Pro and is expressed as:
min C N P C , i = a l l   e l e m e n t s { R 0 , i + t = 0 T R t , i ( 1 + x ) t }
The optimization process in HOMER Pro involves several key steps, as highlighted in recent studies [66,67].
  • System Configuration Definition: Users define the components of the microgrid, such as solar PV panels, wind turbines, diesel generators, batteries, and loads. Each component’s specifications, including capacity, cost, and operational parameters, are input into the software [68].
  • Simulation Setup: HOMER Pro simulates the operation of each system configuration over a specified period, typically one year, using time steps ranging from one minute to one hour. This simulation accounts for factors like RE availability, load demands, and system constraints [66].
  • Optimization Algorithm: HOMER Pro evaluates all feasible system configurations using its proprietary algorithm. The algorithm ranks configurations based on economic metrics (NPC, LCOE) and system reliability to identify the most cost-effective and efficient design [69].
  • Constraints and Assumptions: The optimization incorporates several constraints [70]:
    Load and Generation Matching: The system must always meet load demand, considering RE variability and storage limits.
    Reserve Requirements: Adequate reserves are maintained to manage fluctuations in load or generation.
    Operational Constraints: Components operate within specified limits, and system configurations adhere to predefined rules.
    Economic Assumptions: Fuel prices, interest rates, and component lifespans are based on current market data and projections.
  • Sensitivity Analysis: HOMER Pro conducts sensitivity analyses to assess how changes in parameters such as fuel prices or component costs affect system performance, enhancing robustness evaluation [71].
  • Result Analysis and Reporting: The software generates detailed reports and graphs on the optimized system’s performance, costs, and sensitivities, assisting in decision-making and policy recommendations [72].
The system constraints for minimizing NPC are expressed as follows [7]:
P s h e d d i n g 0.05   P l o a d
f P V 0.15   E g e n
r l o a d , t 0.10   P l o a d , t
r p e a k l o a d 0.10   P l o a d
The cost for each component and salvage value are calculated as:
C e l e m e n t , i = C c a p i t a l , i + C O & M , i + C r e p l a c e m e n t , i + C f u e l , i
C s a l v a g e , i = C r e p l a c e m e n t , i × R r e m , i R e l e m e n t , i
The PV fraction is given by:
f P V = 1 E n o n r e n + H n o n r e n E s e r v e d + H s e r v e d
To determine the cost of one kWh of useful energy produced in the power system, the levelized cost of electricity (LCOE) must be calculated as follows (Equation (14)):
L C O E = C a n n . t o t E s e r v e d
The total annual cost of energy (COE) production constitutes the numerator in Equation (14), while the denominator represents the total annual electrical load served by the system. Capital expenditures, replacement costs, O&M expenses, fuel costs, emissions penalties, and grid power tariffs are all automatically computed by the HOMER Pro software. Revenue streams include income from electricity sales to the grid as well as salvage value [73]. Ultimately, the Levelized Cost of Energy (LCOE) and the total annualized cost are derived from HOMER’s primary economic metric, the NPC, which serves as the basis for ranking and optimizing the various system configurations, as expressed in Equation (15).
C O E = C a n n , t o t C b o i l e r H s e r v e d E s e r v e d
C a n n , t o t means total annualized cost while, C b o i l e r is the boiler marginal cost is H s e r v e d and E s e r v e d are the total thermal and electrical loads served. The relationship between the total annualized cost and total capital cost is known as the operating cost. The component’s analytical value is provided by the operational cost analysis, which disregards the component’s initial capital and installation costs. The formula for operational costs is as follows (Equation (16))
C O & M = C a n n , t o t C a n n , c a p
C O & M shows the difference between the total annualized and annual capital cost of a particular MG model. The cost difference between the total power sold/purchased from the grid and various RE sources is also included in the O&M cost analysis when analyzing an energy system that relies on power from the centralized grid and an MG [62].
A battery charge controller is essential for regulating the flow of power to and from the battery, ensuring optimal and safe operation. It continuously monitors the battery’s state of charge and prevents overcharging by diverting excess energy to a dump load once the battery reaches full capacity [74]. The required number of batteries for the system is determined using the calculation outlined in Equation (17).
N b a t t e r y = E d n d V b a t t e r y × A h × D O D
where n d represents the days of autonomy, E d means the energy demand per day. While V b a t t e r y shows the voltage score in amperes, Ah is the hour score in amperes, and DOD means the battery system depth of discharge. A comprehensive list of symbols and their definitions is provided in Table 1.

3. Results and Discussion

3.1. Results

The MG configurations modeled for the three selected regions incorporate diverse site-specific energy resources and account for the financial impacts of variable climatic conditions, including solar irradiance, air temperature, humidity, and wind speed. The optimization outcomes generated by HOMER Pro for each region are summarized in Table 2, Table 3 and Table 4. Key performance indicators such as the LCOE, RE share, operational costs, and NPC are central to the analysis. Table 2 specifically presents the detailed optimization results for the Yakutia region.
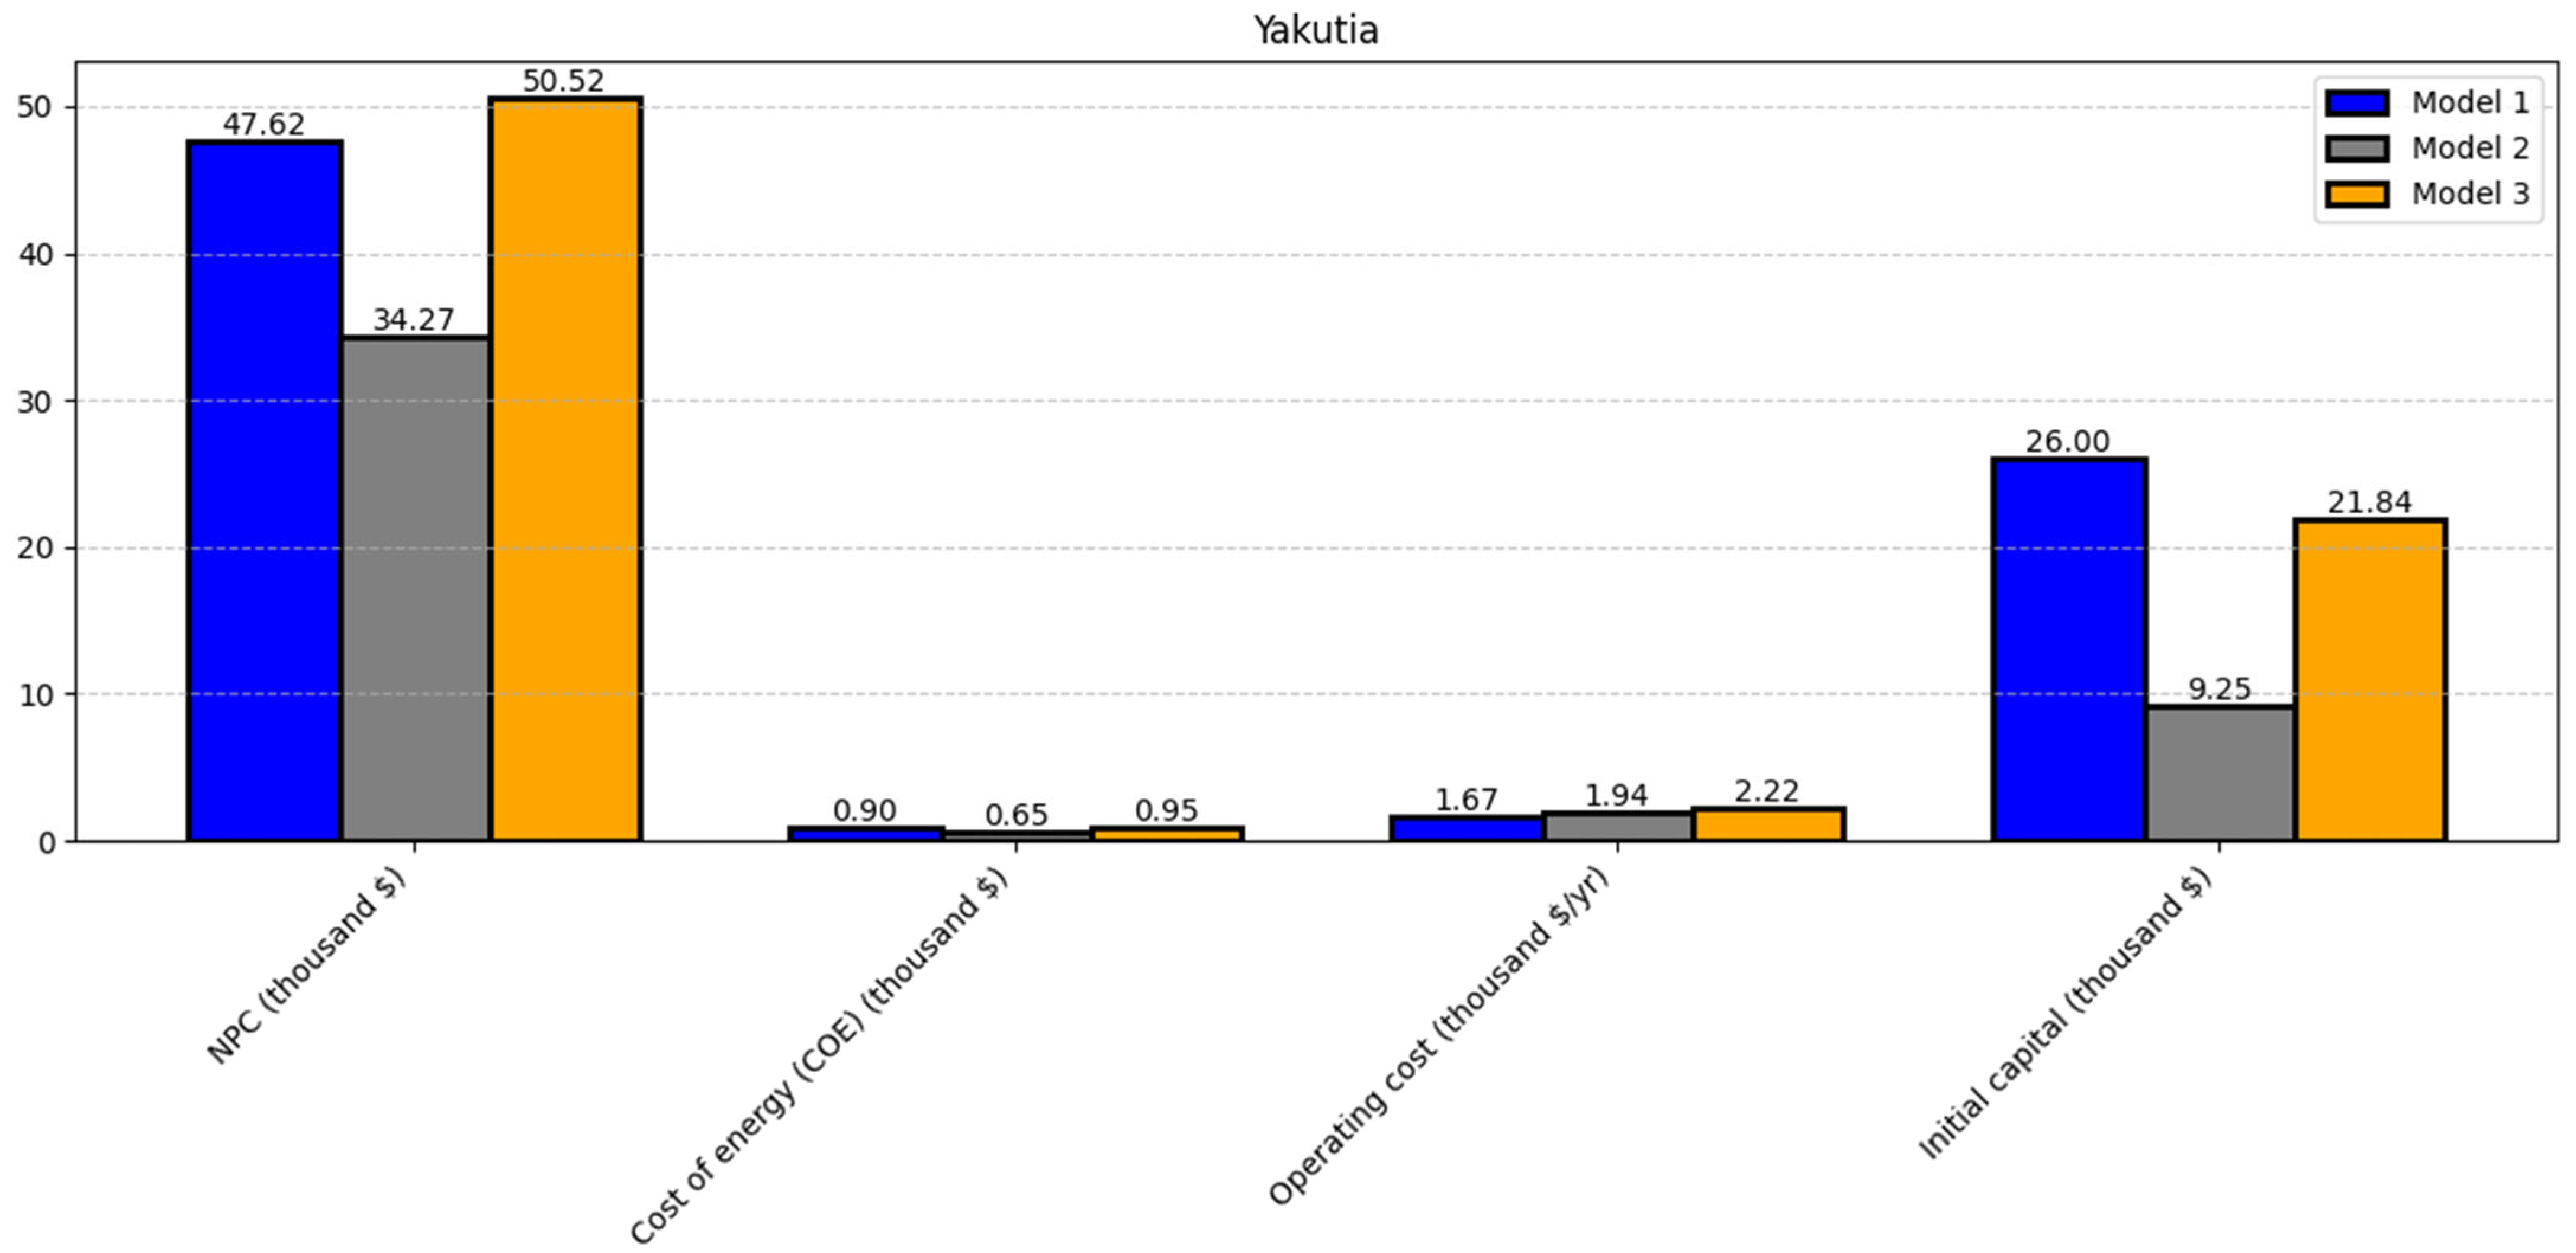
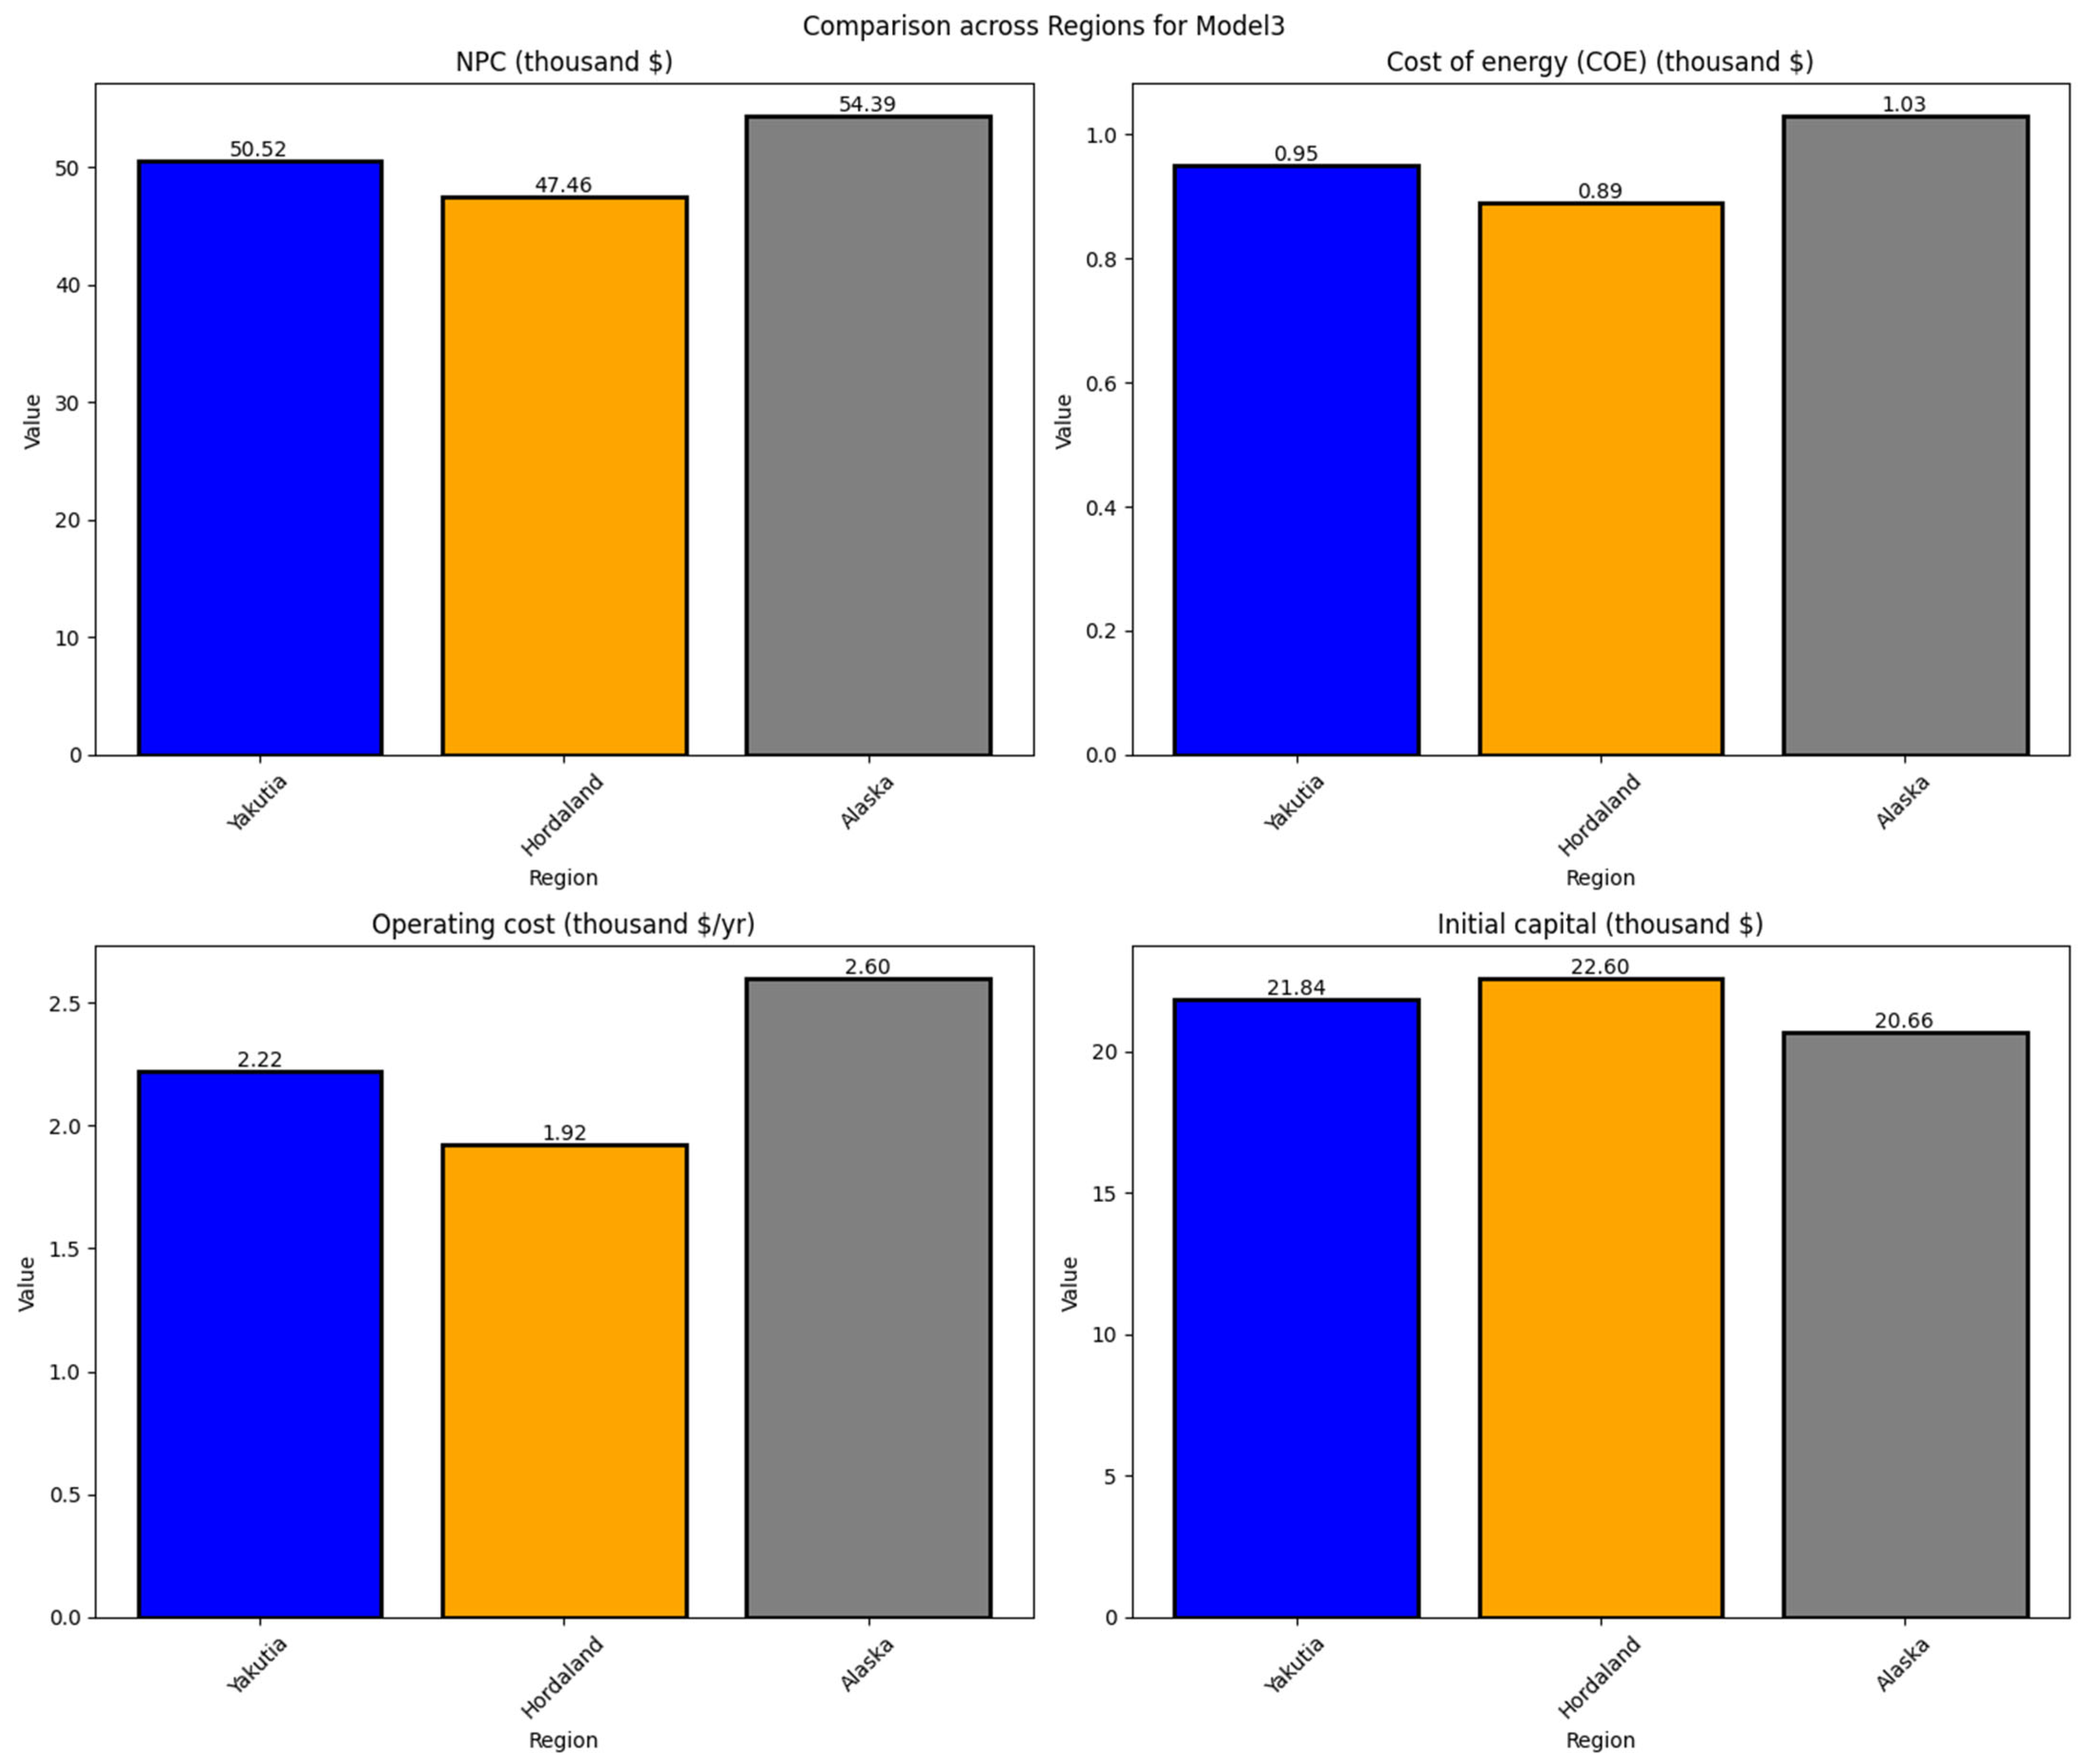
The potential microgrid (MG) designs for Yakutia are based on various feasible combinations of energy components, including “Diesel + Wind + Converter + PV + Battery” (Model 1), “Diesel + Converter + PV + Battery” (Model 2), and “Diesel + Wind + Converter + Battery” (Model 3). These configurations differ significantly in terms of their LCOE, NPC, and other key performance indicators. Among these, Model 3 exhibits the highest COE (0.952 $/kWh) and NPC ($50,517), which are 6.1% and 6.1% higher than Model 1, and 47.2% and 47.4% higher than Model 2, respectively (Figure 5). This outcome can be attributed to the exclusion of solar PV technology in Model 3, despite solar energy being the most abundant and cost-effective RE resource in Yakutia.
In contrast, Model 2 achieves the lowest COE (0.646 $/kWh) and NPC ($34,266), which are 28% lower in COE and 28% lower in NPC compared to Model 1, and 32% lower in COE and 32% lower in NPC compared to Model 3. The substantial cost advantage of Model 2 highlights the economic importance of including solar PV in the system. Model 1, which combines diesel, wind, PV, battery, and converter, provides a balanced configuration with moderate NPC ($47,615) and COE (0.897 $/kWh), reflecting the trade-off between capital costs, operational costs, and RE fraction (REC = 63.8%).
These quantitative comparisons demonstrate that excluding or including specific RE components can significantly influence both the economic and operational performance of microgrid configurations. In Yakutia, the region’s solar irradiance levels make PV the most economically attractive option, particularly for small settlements where PV modules can be conveniently installed, whereas wind turbines require more open and less populated spaces. This emphasizes the need for site-specific optimization when designing microgrids in sparsely populated northern regions.
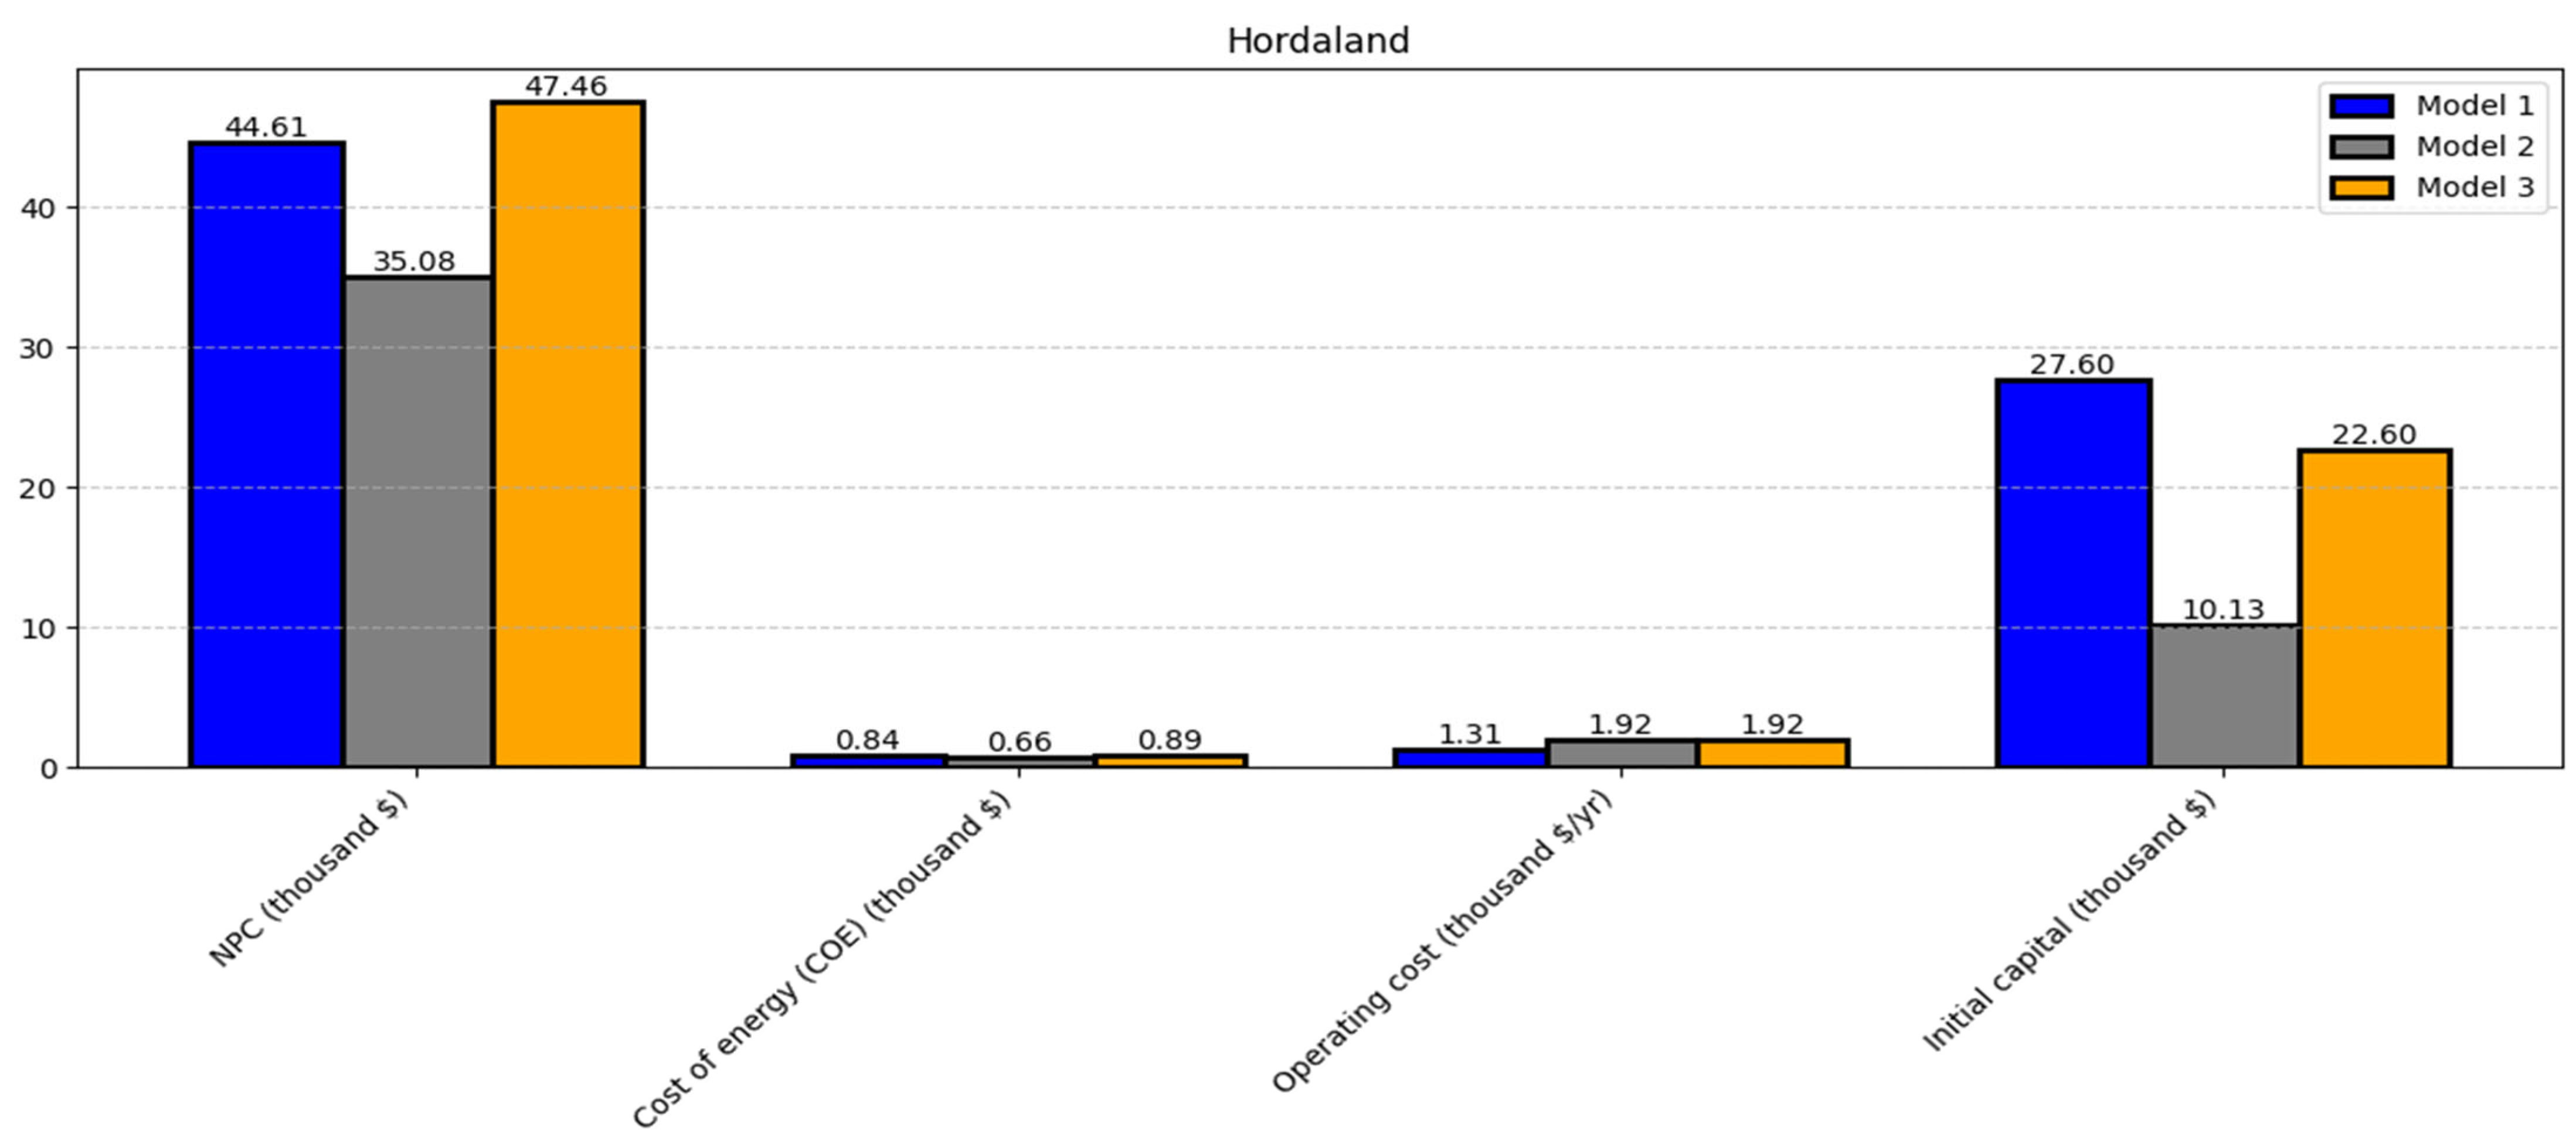
The optimization results for Hordaland show that Model 3 (“Diesel + Wind + Converter + Battery”) has the highest NPC ($47,460) and COE (0.89 $/kWh). Compared to Model 1, this represents an increase of 6.4% in NPC and 5.95% in COE, and compared to Model 2, the increase is 35.3% in NPC and 34.8% in COE. Model 2 (“Diesel + Converter + PV + Battery”) achieves the lowest NPC ($35,080) and COE (0.66 $/kWh), which are 21.4% lower in NPC and 21.4% lower in COE compared to Model 1, and significantly more cost-effective than Model 3. Model 1, which includes diesel, wind, PV, battery, and converter, provides intermediate NPC ($44,610) and COE (0.84 $/kWh), reflecting the trade-offs between higher capital costs and lower operational expenses due to greater RE fraction (REC = 79.1%). The results indicate that Hordaland’s favorable wind resources and established infrastructure reduce the operational cost advantage of excluding PV, but including PV (Model 2) still improves economic performance due to lower capital requirements and more efficient energy production (Figure 6).
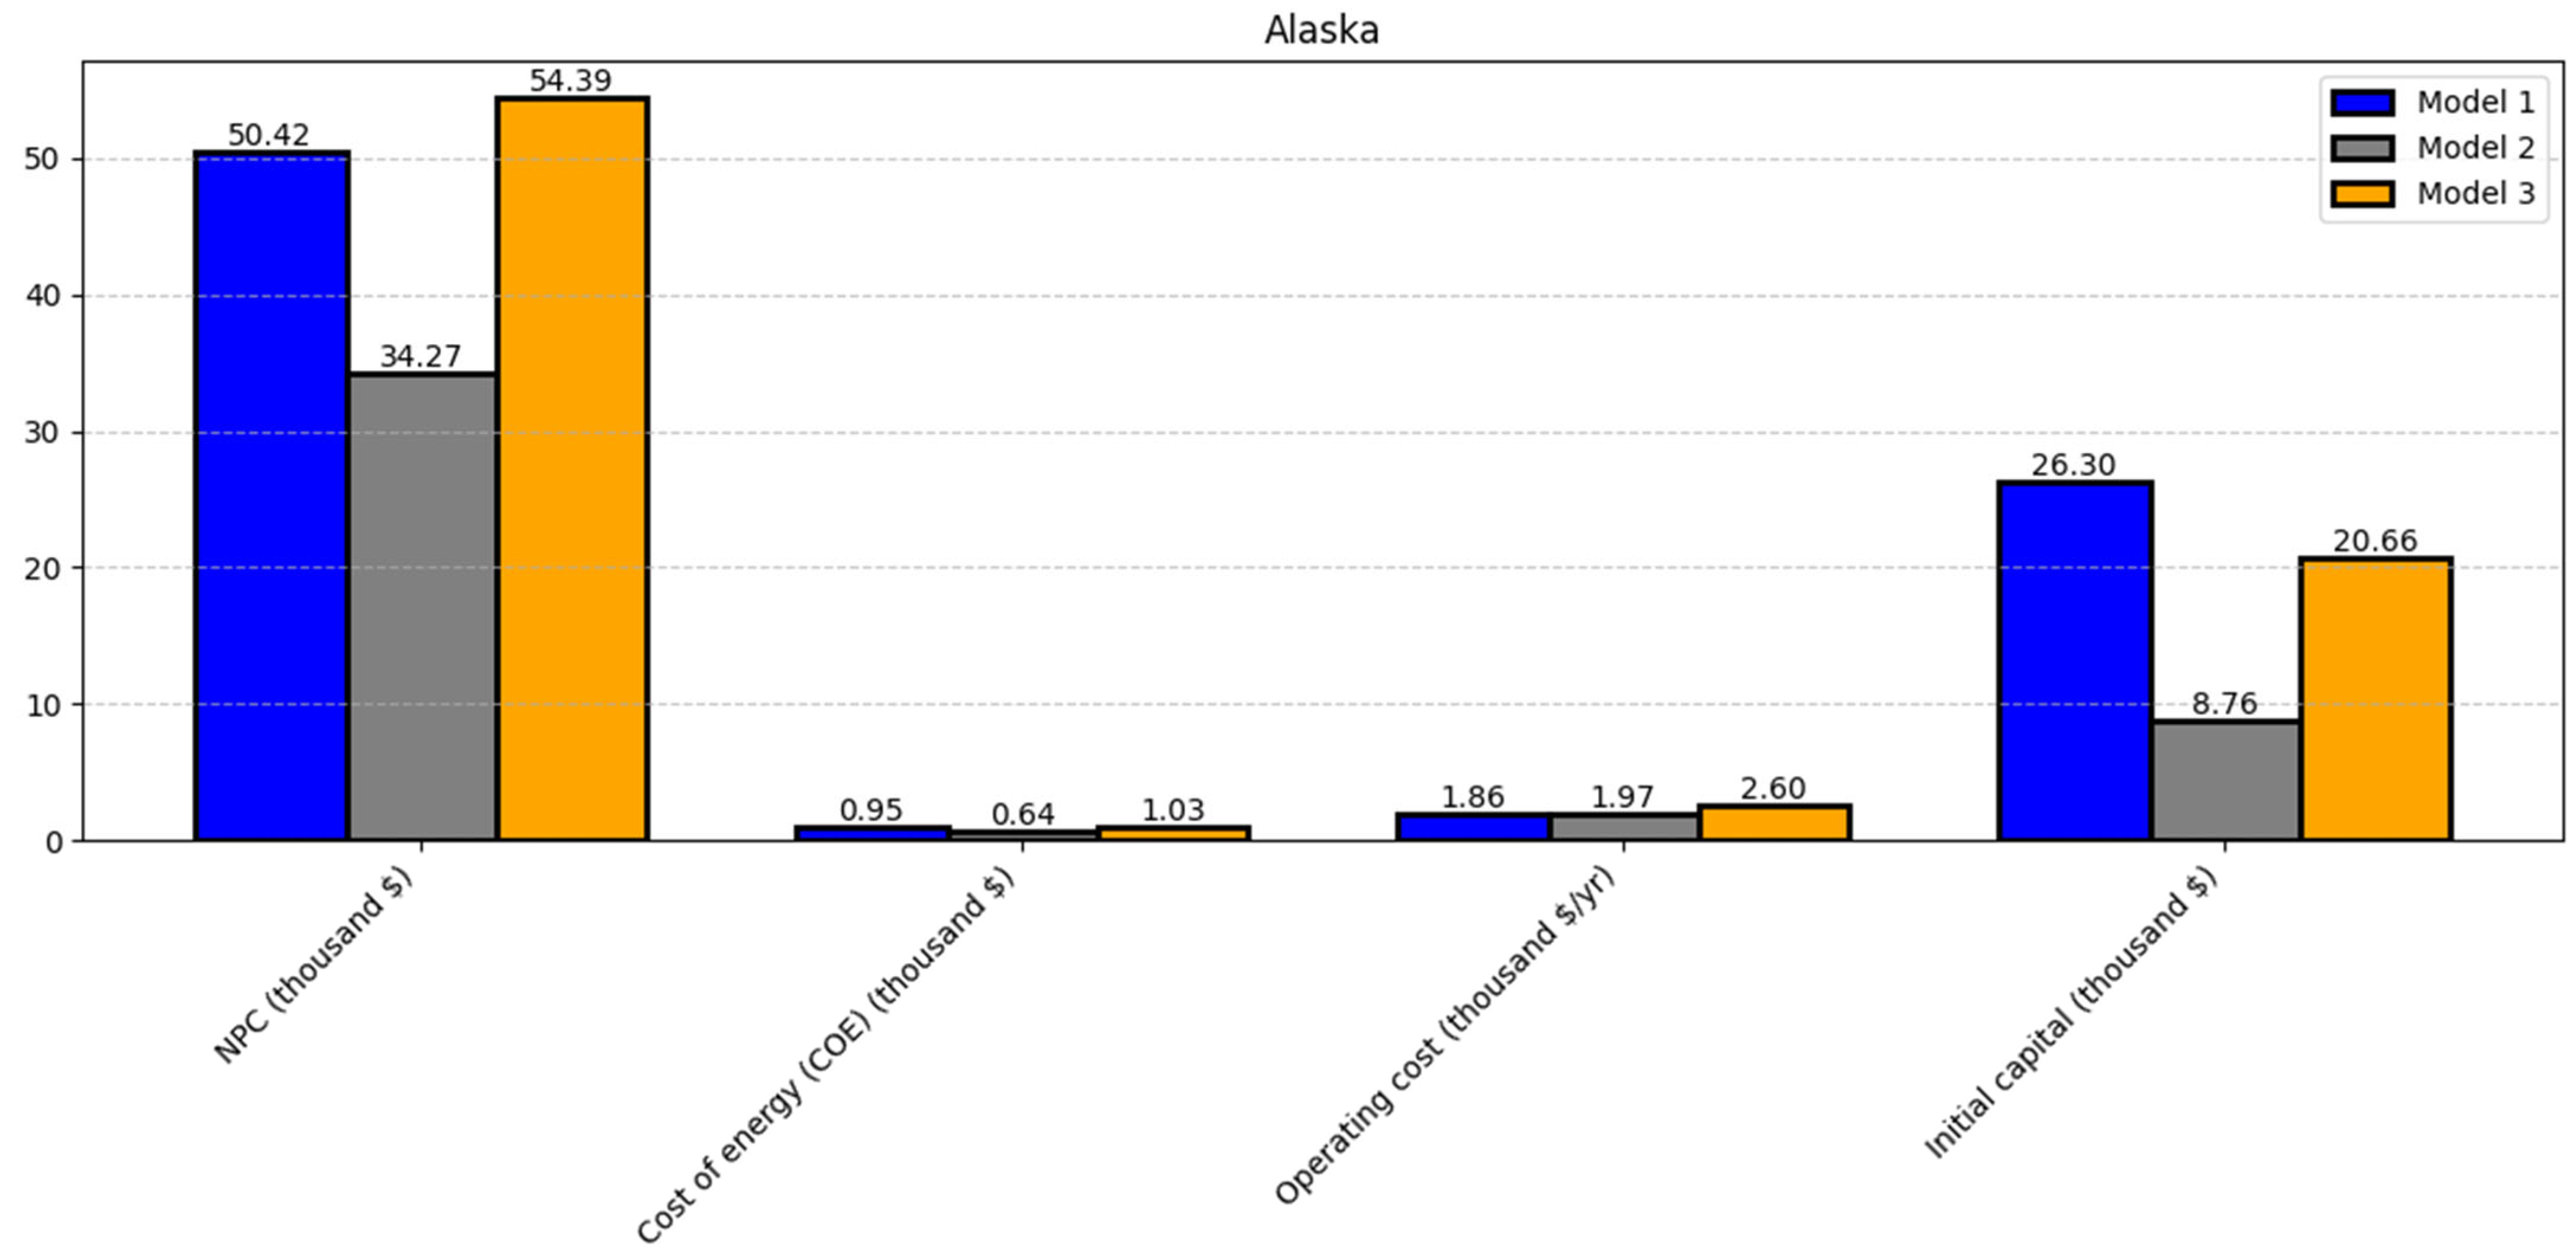
For Alaska, Model 3 again exhibits the highest NPC ($54,390) and COE (1.03 $/kWh), which are 7.8% higher in NPC and 8.1% higher in COE than Model 1, and 58.6% higher in NPC and 60.9% higher in COE than Model 2. Model 2 (“Diesel + Converter + PV + Battery”) remains the most cost-effective option with NPC of $34,270 and COE of 0.64 $/kWh, representing a 32% reduction in NPC and 32.6% reduction in COE compared to Model 1. Model 1 provides intermediate NPC ($50,420) and COE (0.95 $/kWh), highlighting the balance between including multiple RE components and managing upfront capital versus operational costs. The higher costs for Model 3 are primarily due to the absence of PV, increased diesel reliance, and logistical challenges in remote Alaskan regions, which amplify both fuel and operational expenditures (Figure 7).
These quantitative comparisons demonstrate that including solar PV consistently improves economic performance across all three northern regions, whereas configurations excluding PV or relying heavily on wind (Model 3) tend to increase NPC and COE. The magnitude of improvement or worsening varies by region due to differences in resource availability, infrastructure, fuel costs, and operational constraints, underscoring the importance of region-specific optimization when designing hybrid microgrids for northern, off-grid communities.
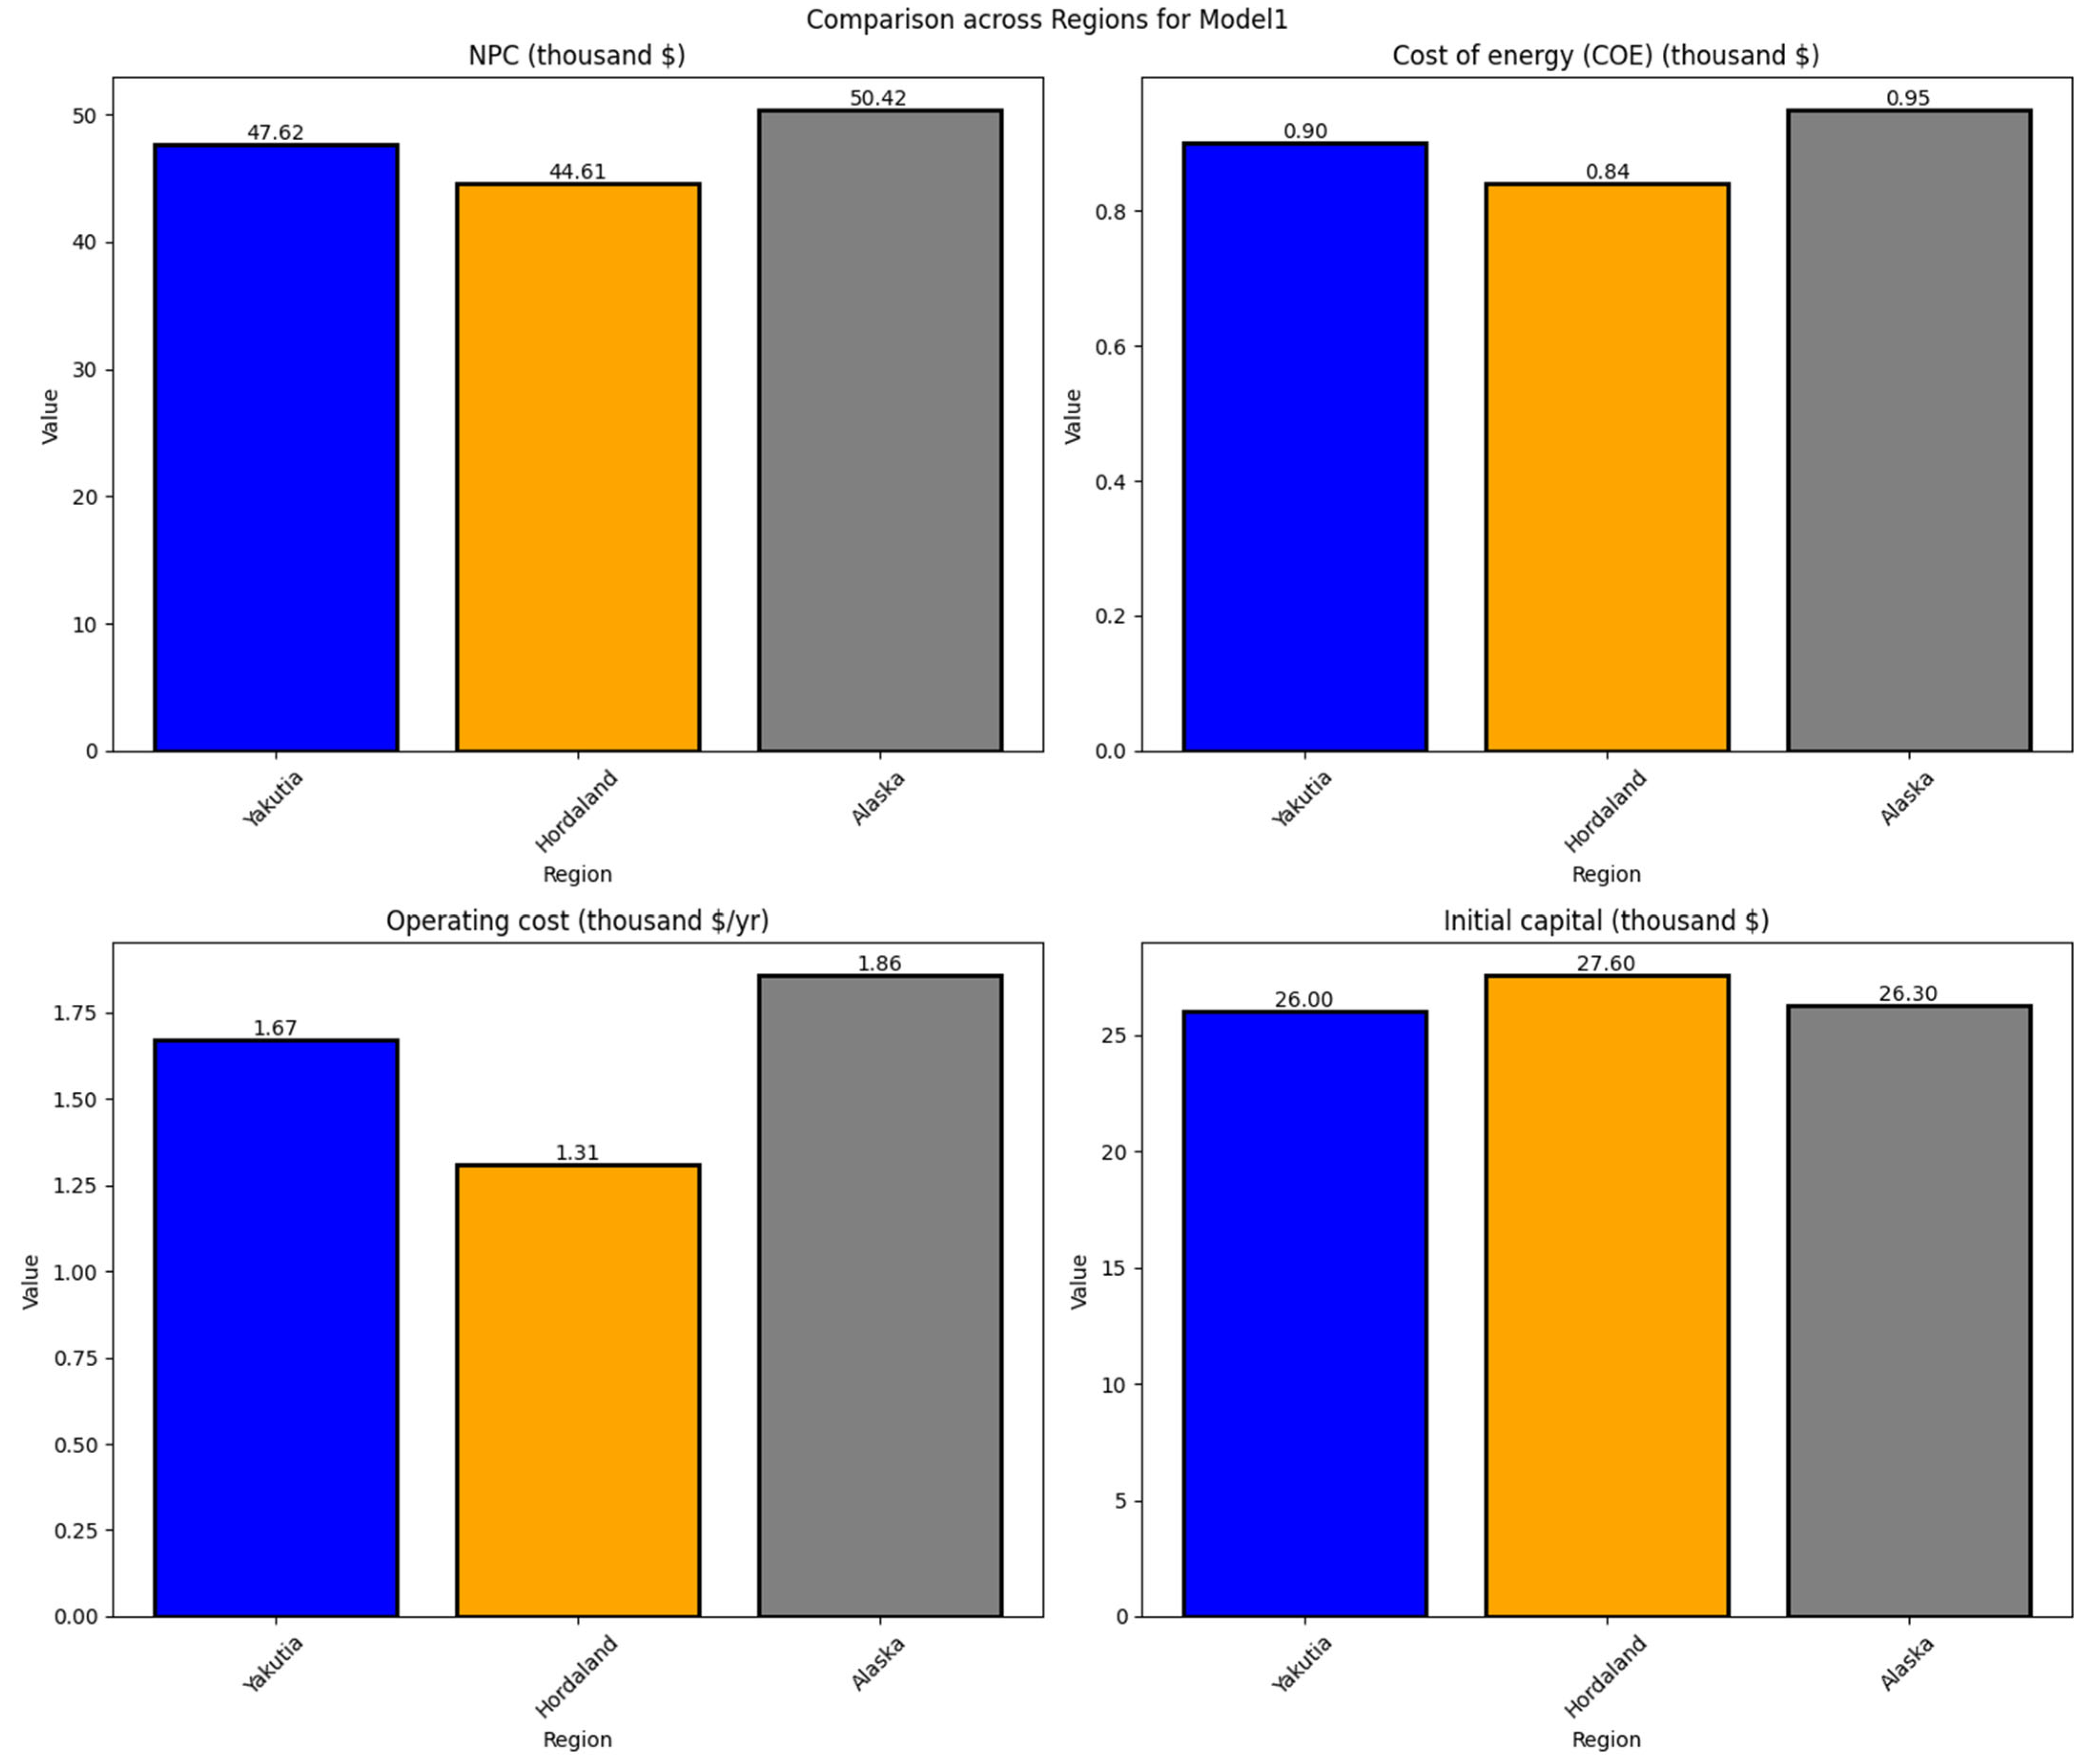
Overall, the results demonstrate that the LCOE for microgrids incorporating diesel generators, wind turbines, converters, PV systems, and battery storage (Model 1) is 0.897, 0.841, and 0.950 USD/kWh for Yakutia, Hordaland, and Alaska, respectively (Figure 8). These variations reflect not only differences in resource availability and climatic conditions but also region-specific socio-economic and infrastructural contexts. A detailed summary of all key input parameters, including load profiles, component costs, discount rates, fuel prices, and project lifetime, is provided in Table A1 in the Appendix A to enhance transparency and reproducibility.
In Yakutia, remote locations and limited transportation infrastructure significantly increase diesel delivery costs, raising operational expenditures and COE [75]. Alaska faces similar logistical challenges, compounded by sparse population distribution, which limits economies of scale and increases per-unit system costs [76]. In contrast, Hordaland benefits from well-developed infrastructure, lower transportation costs, and a more mature RE integration framework, which reduces operational costs and enhances economic sustainability [77].
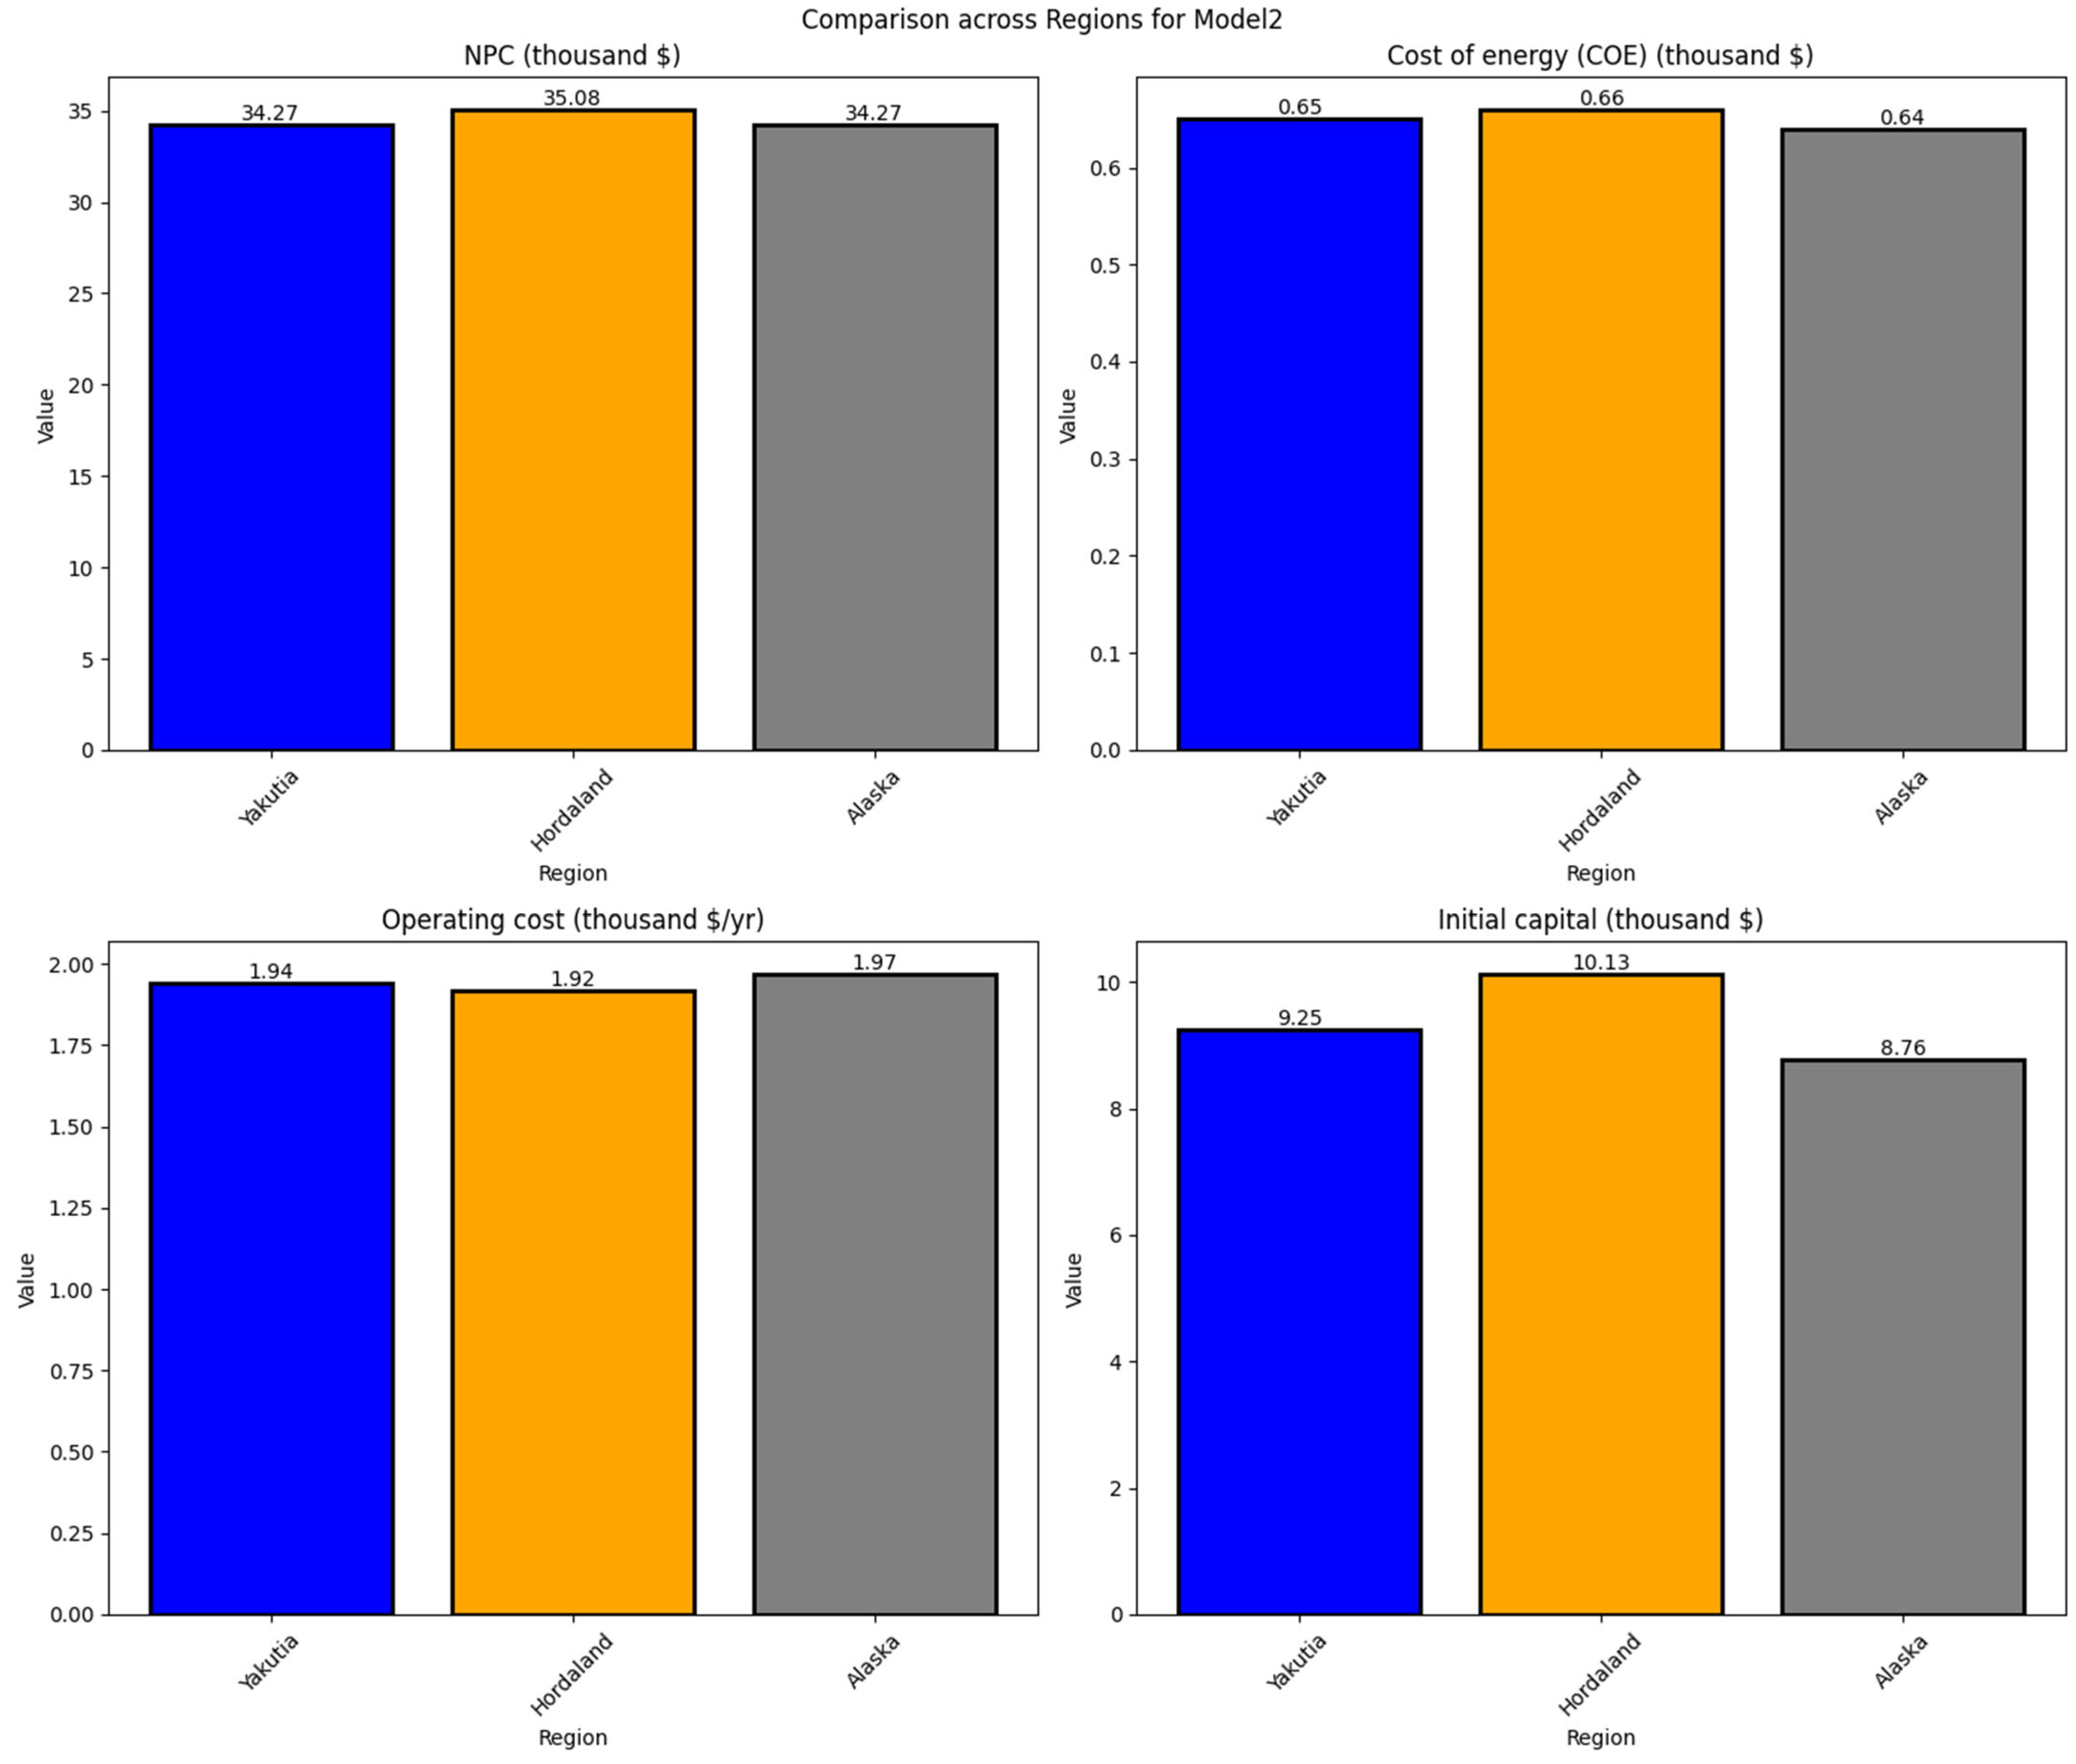
The comparatively lower COE values observed in the PV-dominant microgrid (Model 2), 0.646, 0.661, and 0.646 USD/kWh in Yakutia, Hordaland, and Alaska, indicate that solar PV is a cost-efficient RE source across northern regions. This is reinforced by socio-economic factors, such as local policies promoting solar adoption in Hordaland and government-supported subsidies for off-grid PV deployment in Alaska, which improve financial feasibility [15]. Seasonal variability in solar irradiance is a factor in all regions, but hybrid systems with storage help mitigate intermittency, maintaining reliability and cost-effectiveness (Figure 9).
In contrast, the wind-centric microgrid (Model 3) exhibits higher COE values of 0.952, 0.894, and 1.03 USD/kWh across the regions, with Alaska showing the highest cost (Figure 10). These higher costs can be attributed to several factors: (i) higher capital expenditures and maintenance requirements for wind turbines in harsh northern climates [78], (ii) greater intermittency of wind resources compared to solar, which increases the need for storage or diesel backup [76,77], and (iii) logistical challenges associated with transporting and installing large turbine components in remote areas [79]. Hordaland’s abundant coastal and island wind resources, coupled with existing grid and maintenance infrastructure, reduce additional storage and backup needs, demonstrating the interplay between natural resources, infrastructure, and regional policy support [78].
The similarity in NPC values across the three regions further reflects analogous long-term economic assessments of the systems, despite local variations in resource profiles. However, the operational cost divergence, particularly the markedly lower values in Hordaland compared to Yakutia and Alaska, underscores the impact of assumptions such as diesel prices, fuel transportation costs, and local maintenance practices on ongoing expenditures. Hordaland’s greater reliance on RE and more mature microgrid integration likely reduces fuel consumption and maintenance costs, enhancing economic sustainability.

3.2. Discussion

The MG configurations modeled for the three selected regions incorporate diverse site-specific energy resources and account for the financial impacts of variable climatic conditions, including solar irradiance, air temperature, humidity, and wind speed. The optimization outcomes generated by HOMER Pro for each region are summarized in Table 2, Table 3 and Table 4. Key performance indicators such as the LCOE, RE share (REC fraction), operational costs, and NPC are central to the analysis. Table 2 specifically presents the detailed optimization results for the Yakutia region.
The potential microgrid (MG) designs for Yakutia are based on various feasible combinations of energy components: Model 1 (“Diesel + Wind + Converter + PV + Battery”), Model 2 (“Diesel + Converter + PV + Battery”), and Model 3 (“Diesel + Wind + Converter + Battery”). These configurations differ significantly in their COE, NPC, and RE fraction. Model 3, which excludes PV, exhibits the highest COE (0.952 $/kWh) and NPC ($50,517), reflecting the combined effects of increased diesel reliance and higher operational costs. Model 2 achieves the lowest COE (0.646 $/kWh) and NPC ($34,266), highlighting the economic advantage of including PV in the system. Model 1, which integrates all RE components, provides a balanced configuration with moderate NPC ($47,615) and COE (0.897 $/kWh), illustrating the trade-offs between capital expenditure, operational cost, and RE fraction (REC = 63.8%).
Similar trends are observed in Hordaland and Alaska (Table 3 and Table 4, Figure 6 and Figure 7). In Hordaland, Model 2 achieves the lowest COE (0.66 $/kWh) and NPC ($35,080), whereas Model 3, which excludes PV, shows higher costs due to greater diesel reliance. Alaska exhibits the highest overall costs, with Model 2 remaining the most cost-effective option ($34,270 NPC, 0.64 $/kWh COE). These patterns underscore the importance of site-specific resource availability, infrastructure, and logistical constraints in shaping microgrid economic performance [75].
These findings underscore the importance of considering socio-economic, infrastructural, and policy contexts when evaluating microgrid performance. Tailored policy interventions, such as financial incentives for RE adoption, subsidies for transport and logistics, and community engagement programs, can significantly affect the economic viability of off-grid microgrids in northern regions [76,77]. Solar PV remains consistently cost-effective across locations, while wind energy’s feasibility is highly site-dependent, emphasizing the need for region-specific assessments that account for infrastructure, policy frameworks, and community characteristics [80].
Furthermore, the observed differences in operational costs indicate that regions with established RE infrastructure and supportive policies, such as Hordaland, may experience lower barriers and higher returns from microgrid projects. This highlights the importance of policy frameworks, financial incentives, and local capacity building in promoting sustainable energy adoption [81]. It also reinforces the need for adaptive planning approaches that consider evolving technology costs, regulatory developments, and climate variability in the design and operation of northern microgrids [82].
The comparative analysis demonstrates that the observed preference for PV systems over wind power arises from site-specific climatic and operational conditions rather than a general technological superiority. In the modeled northern regions, solar irradiance, though seasonally variable, shows greater temporal predictability and stability compared to wind speeds, which tend to be highly intermittent and spatially dispersed [83]. This consistency enables smoother system operation, reduces storage requirements, and results in a lower levelized COE for PV-dominant configurations. Additionally, PV systems impose lower O&M demands and are less affected by icing, mechanical wear, and logistical constraints commonly experienced by wind turbines in cold climates [84]. These environmental and technical factors, integrated into the simulation parameters, collectively explain the cost advantage of PV observed in the modeled scenarios.
Building upon these insights, it is crucial to interpret the quantitative results within the broader context of the modeling framework and local environmental conditions. While the numerical outcomes generated by HOMER Pro provide a robust quantitative foundation for assessing the comparative economics of PV- and wind-based microgrids, these results are inherently sensitive to assumptions about solar irradiance, wind speed variability, fuel prices, and capital cost parameters. In the selected case studies, solar irradiance, although seasonally variable, demonstrates greater predictability and stability than wind patterns, which tend to be more intermittent and regionally dispersed. This higher temporal consistency contributes to improved system reliability and lower storage requirements for PV-dominant configurations, resulting in a reduced levelized COE [85].
Moreover, the advantage of PV systems is amplified by their lower O&M burden and reduced mechanical complexity compared to wind turbines. In harsh northern climates, where temperatures frequently fall below freezing, mechanical wear, icing, and maintenance logistics pose significant challenges for wind power systems [86]. These environmental constraints increase downtime and O&M costs, which were incorporated into the simulation parameters. Conversely, PV panels require minimal maintenance once installed, and advances in module efficiency have made them more resilient to low-temperature conditions and diffuse radiation. Thus, the cost advantage of PV under these modeled conditions is not merely a numerical artifact but a reflection of the physical and operational realities of northern environments [87].
Finally, it is important to emphasize that the conclusion favoring PV over wind does not represent a universal prescription but rather a context-dependent outcome driven by the site-specific data and boundary assumptions of this study. In regions where wind resources are stronger, more consistent, and supported by established infrastructure, as in coastal or offshore sites, the relative cost-effectiveness of wind power could surpass that of PV. Therefore, the findings should be interpreted as demonstrating that, under the modeled climatic, economic, and infrastructural conditions of Yakutia, Hordaland, and Alaska, PV offers a more reliable and cost-efficient RE pathway. This nuanced interpretation reinforces the importance of integrating simulation outcomes with contextual, technical, and environmental reasoning when evaluating microgrid design alternatives.

4. Conclusions

Harnessing infinite RE sources is critical to addressing the escalating global energy demand while simultaneously fostering sustainable economic growth and enhancing the well-being of populations worldwide. This imperative is particularly acute in northern and remote regions, where harsh climatic conditions, sparse populations, and limited access to centralized energy infrastructure pose significant challenges to conventional energy supply. In this context, microgrids emerge as a transformative technology, enabling the localized generation, storage, and distribution of clean energy. By facilitating the integration of RE resources such as solar and wind, microgrids not only improve energy accessibility and affordability but also increase resilience against power outages and grid instabilities, thereby strengthening the energy security of isolated communities.
The design and deployment of microgrids must be meticulously tailored to the unique conditions of each location. This process is influenced by a complex interplay of factors, including the technical potential of available RE resources, the costs and availability of energy technologies, capital investment constraints, and socio-economic characteristics of the served communities. Among these, ensuring both the technical feasibility and financial viability of the system is paramount. Decisions regarding the choice of energy sources with the highest potential, sizing of the microgrid components, evaluation of existing grid infrastructure, and comprehensive cost estimation are fundamental to optimizing system performance and ensuring sustainability.
This study conducts a rigorous comparative analysis of RE microgrid configurations across three northern regions with distinct climatic and socio-economic profiles: Yakutia in the Russian Federation, Alaska in the United States, and Hordaland in Norway. These regions are characterized by limited or no centralized grid access and face significant environmental and logistical challenges. The study models microgrids comprising solar PV panels, wind turbines, diesel generators, and energy storage systems, employing meteorological data on solar irradiance, wind speeds, and atmospheric clearness sourced from NASA’s extensive datasets. This data reveals substantial variability in solar energy availability, which critically influences microgrid design and cost-effectiveness across these locations.
The analysis highlights several important findings. Model 1, which integrates diesel, wind, solar PV, and storage, demonstrates a clear inverse relationship between COE and global horizontal irradiance, indicating that regions with higher solar radiation experience lower COE. Model 2, focusing on PV and storage integration, consistently achieves the lowest COE across all regions, emphasizing the economic advantages of solar PV deployment in northern microgrids. Conversely, microgrids relying more heavily on wind energy (Model 3) tend to exhibit higher COE, reflecting the higher capital and maintenance costs associated with wind turbines and the challenges of intermittency. The regional variations in these costs also reflect differing resource endowments, grid infrastructure maturity, and local market conditions.
To accelerate the deployment and effectiveness of RE microgrids in northern regions, it is imperative must implement targeted financial incentives such as grants, low-interest loans, and tax credits to alleviate the high initial capital costs associated with solar PV, wind, and energy storage technologies, while establishing clear and adaptive regulatory frameworks to streamline permitting processes, facilitate grid interconnection, and promote community ownership models. Policies should encourage the integration of hybrid RE systems combining solar, wind, storage, and potentially biomass and fuel cells to enhance system reliability amid variable climatic conditions. Investing in comprehensive data collection and detailed load profiling can be operationalized through government-funded programs that deploy smart meters, remote monitoring systems, and standardized energy surveys, while mandating energy utilities and microgrid developers to share anonymized consumption data to improve planning and system design. Capacity building and community engagement programs should include government-supported training workshops, certification schemes for local technicians, and educational campaigns to involve residents in microgrid operation, maintenance, and decision-making. Given the substantial heating needs in northern climates, policies could provide targeted subsidies or tax incentives for the installation of combined heat and power (CHP) systems using RE sources, and support pilot projects demonstrating CHP integration with solar, wind, and biomass to improve energy efficiency and cost-effectiveness. Sustained research and innovation funding can be directed through national and regional grants, innovation competitions, and public–private partnerships aimed at developing technologies specifically designed for cold environments, including advanced storage solutions, low-temperature turbines, and modular microgrid designs.
Region-specific recommendations include engaging indigenous communities in Alaska to ensure culturally appropriate and socially inclusive energy solutions, leveraging decentralized energy regulation and financial incentives in Norway to promote distributed RE generation and local capacity building, and implementing targeted RE frameworks in Russia to facilitate microgrid deployment in remote northern regions while supporting hybrid systems incorporating solar, wind, biomass, and CHP solutions. Finally, fostering regional and cross-border collaboration can be achieved through joint research initiatives, intergovernmental knowledge-sharing platforms, harmonization of technical standards, and coordinated funding schemes for multi-country pilot projects. Collectively, these policy measures will create a supportive ecosystem that promotes clean, resilient, and inclusive energy access while aligning with broader climate and sustainable development goals, ensuring that northern microgrids are technically robust, economically viable, and socially inclusive.
While this study provides valuable insights, several limitations must be acknowledged. The load profiles used were derived from average daily energy consumption per capita, which may not fully capture hourly variations, sharp seasonal demand peaks, or specific community consumption behaviors. This simplification could underestimate storage and diesel backup requirements, particularly during winter months when heating demand is substantial. Additionally, the exclusion of biomass as a potential energy source limits the comprehensiveness of the microgrid configurations, especially as biomass is a viable and sustainable resource in some northern contexts. While combined heat and power (CHP) applications were discussed, no CHP unit was included in the current scenarios. Integrating CHP could further enhance energy efficiency and economic performance, particularly in cold climates with high heating loads. These methodological simplifications may introduce biases in the COE and NPC results, underscoring the importance of future studies to incorporate hourly and seasonal load variations, biomass, CHP, fuel cells, and emerging storage solutions for a more complete assessment of microgrid performance.
It is important to note that the current load modeling still provides sufficient accuracy for comparative evaluation of system configurations across the three regions studied. However, reconstructing hourly and seasonal demand profiles in future work would allow for a more precise assessment of storage and backup requirements, as well as a deeper understanding of economic performance under extreme seasonal variations.
This research underscores the necessity of developing region-specific microgrid solutions that consider local RE resource availability, socio-economic conditions, and infrastructure constraints. Policymakers and stakeholders should prioritize investments in solar PV and energy storage technologies given their demonstrated cost-effectiveness and adaptability. Furthermore, fostering supportive regulatory frameworks, financial incentives, and capacity-building initiatives will be crucial to scaling microgrid deployment in northern regions.
In conclusion, by advancing our understanding of the techno-economic dynamics of renewable microgrids in challenging northern environments, this study contributes to the broader goal of sustainable, resilient, and inclusive energy systems. Continued innovation and interdisciplinary research are essential to overcoming remaining barriers and unlocking the full potential of microgrids as a cornerstone of the global clean energy transition.

Author Contributions

Conceptualization: N.K.-A. and L.N.P.; methodology: N.K.-A.; software: N.K.-A.; validation: N.K.-A. and L.N.P.; formal analysis: N.K.-A.; investigation: N.K.-A. and L.N.P.; resources: N.K.-A. and L.N.P.; data curation: N.K.-A.; writing—original draft preparation: N.K.-A.; writing—review and editing: N.K.-A. and L.N.P.; visualization: N.K.-A. and L.N.P.; supervision: N.K.-A. and L.N.P. All authors have read and agreed to the published version of the manuscript.

Funding

Liliana N. Proskuryakova acknowledges support of the Basic Research Program of the HSE University.

Data Availability Statement

The original contributions presented in this study are included in the article. Further inquiries can be directed to the corresponding author.

Acknowledgments

The authors would like to thank Igor Vokhmintsev, at HSE University, for providing assistance with data visualizations for Figure 1, Figure 5, Figure 6, Figure 7, Figure 8, Figure 9 and Figure 10.

Conflicts of Interest

The authors declare no conflicts of interest.

Abbreviations

The following abbreviations are used in this manuscript:
BESSBattery Energy Storage System
COECost of Energy
DGDiesel Generator
DPPDiesel Power Plant
HOMERHybrid Optimization Model for Multiple Energy Sources
HPPHydro Power Plant
LCOEThe Levelized Cost of Energy
MGMicrogrids
NPCNet Present Cost
O&MOperation and Maintenance
PVPhotovoltaic
RE/SRenewable Energy Sources
UPSUnited Power System

Appendix A

Table A1. Summary of key input parameters for microgrid simulations in Yakutia, Hordaland, and Alaska.
ParameterYakutiaHordalandAlaskaNotes
Load profileAverage daily load: 1500 kWh/dayAverage daily load: 1800 kWh/dayAverage daily load: 1650 kWh/dayHourly profile used in HOMER; adjusted seasonally
Project lifetime25 years25 years25 yearsStandard microgrid lifetime assumption
Discount rate8%8%8%Reflects regional financial assumptions
Diesel price0.98 $/L0.89 $/L1.05 $/LIncludes local transport costs
PV capital cost3750 $/kW5000 $/kW3910 $/kWBased on local installation and shipping
PV O&M cost20 $/kW/yr25 $/kW/yr22 $/kW/yrAnnual fixed O&M
Wind turbine capital cost18,000 $/unit18,000 $/unit18,000 $/unitIncludes installation in harsh climates
Wind O&M cost180 $/yr180 $/yr180 $/yrAnnual fixed O&M per turbine
Battery capital cost400 $/kWh420 $/kWh410 $/kWhIncludes shipping to remote areas
Battery O&M cost10 $/kWh/yr12 $/kWh/yr11 $/kWh/yrAnnual fixed O&M
Converter capital cost833–1460 $/unit1000–2000 $/unit560–1320 $/unitVaries by model size
Converter O&M cost100–150 $/yr80–180 $/yr95–180 $/yrAnnual fixed O&M
Fuel consumption (diesel)628–969 L/yr356–961 L/yr685–1280 L/yrBased on HOMER optimization outputs
RE fraction (REC)26–64%26–79%17–48%Fraction of total energy supplied by RE
Load profile sourceLocal community surveys & meteorological dataLocal utility data & meteorologyLocal utility data & meteorologyCombined with HOMER synthetic profiles
Notes: The values represent representative ranges from the three proposed models: Model 1 (Diesel + Wind + PV + Battery), Model 2 (Diesel + PV + Battery), and Model 3 (Diesel + Wind + Battery). All costs are in 2024 USD, and all energy outputs are annual estimates derived from HOMER Pro simulations.

References

  1. Teske, S. Achieving the Paris Climate Agreement: Setting Meaningful Goals for the Finance Industry. In Handbook of Climate Change Mitigation and Adaptation; Springer: New York, NY, USA, 2024; pp. 1–59. [Google Scholar]
  2. Kilinc-Ata, N.; Fikru, M.G. A Framework for Evaluating EV Battery Mineral Sourcing Challenges. Sustain. Futures 2025, 9, 100720. [Google Scholar] [CrossRef]
  3. Zhang, J. Energy access challenge and the role of fossil fuels in meeting electricity demand: Promoting renewable energy capacity for sustainable development. Geosci. Front. 2024, 15, 101873. [Google Scholar] [CrossRef]
  4. Kilinc-Ata, N. Investigation of the Impact of Environmental Degradation on the Transition to Clean Energy: New Evidence from Sultanate of Oman. Energies 2025, 18, 839. [Google Scholar] [CrossRef]
  5. Kilinc-Ata, N.; Camkaya, S.; Topal, S. What Role Do Foreign Direct Investment and Technology Play in Shaping the Impact on Environmental Sustainability in Newly Industrialized Countries (NIC)?: New Evidence from Wavelet Quantile Regression. Sustainability 2025, 17, 4966. [Google Scholar] [CrossRef]
  6. Purkait, P.; Basu, M.; Nath, S.R. Renewable energy integration to electric power grid: Opportunities, challenges, and solutions. In Challenges and Opportunities of Distributed Renewable Power; Springer: Singapore, 2024; pp. 37–100. [Google Scholar]
  7. Oulis Rousis, A.; Tzelepis, D.; Konstantelos, I.; Booth, C.; Strbac, G. (Design of a hybrid AC/DC microgrid using Homer Pro: Case study on an islanded residential application. Inventions 2018, 3, 55. [Google Scholar] [CrossRef]
  8. Proskuryakova, L.; Ermolenko, G. The future of Russia’s renewable energy sector: Trends, scenarios and policies. Renew. Energy 2019, 143, 1670–1686. [Google Scholar] [CrossRef]
  9. Souza Junior, M.E.T.; Freitas, L.C.G. Power electronics for modern sustainable power systems: Distributed generation, microgrids and smart grids—A review. Sustainability 2022, 14, 3597. [Google Scholar] [CrossRef]
  10. Ledwaba, L.P.; Hancke, G.P.; Isaac, S.J.; Venter, H.S. Smart microgrid energy market: Evaluating distributed ledger technologies for remote and constrained microgrid deployments. Electronics 2021, 10, 714. [Google Scholar] [CrossRef]
  11. Kilinc-Ata, N.; Ata, R. The Place and Role of Digital Twin Applications: Directions for Energy and Education Sector. In Transforming Industry Using Digital Twin Technology; Springer: Cham, Switzerland, 2024; pp. 45–57. [Google Scholar]
  12. Alomari, M.A.; Al-Andoli, M.N.; Ghaleb, M.; Thabit, R.; Alkawsi, G.; Alsayaydeh, J.A.; Gaid, A.S. Security of Smart Grid: Cybersecurity Issues, Potential Cyberattacks, Major Incidents, and Future Directions. Energies 2025, 18, 141. [Google Scholar] [CrossRef]
  13. Kilinc-Ata, N.; Rahman, M.P. Digitalization and financial development contribution to the green energy transition in Malaysia: Findings from the BARDL approach. Nat. Resour. Forum 2025, 49, 2775–2793. [Google Scholar] [CrossRef]
  14. Sandelic, M.; Peyghami, S.; Sangwongwanich, A.; Blaabjerg, F. Reliability aspects in microgrid design and planning: Status and power electronics-induced challenges. Renew. Sustain. Energy Rev. 2022, 159, 112127. [Google Scholar] [CrossRef]
  15. Mutlag, A.A.; Abd, M.K.; Shneen, S.W. Power Management and Voltage Regulation in DC Microgrid with Solar Panels and Battery Storage System. J. Robot. Control (JRC) 2024, 5, 397–407. [Google Scholar] [CrossRef]
  16. Chisale, S.W.; Lee, H.S.; Calvo, M.S. Exploring Weather Research and Forecasting (WRF) Model Parameterizations for Enhanced Solar and Wind Energy Resources Predictions in Malawi. In Future Directions in Energy Engineering: Challenges, Opportunities, and Sustainability; Springer Nature: Cham, Switzerland, 2024; pp. 1–10. [Google Scholar]
  17. Kapen, P.T.; Medjo Nouadje, B.A.; Chegnimonhan, V.; Tchuen, G.; Tchinda, R. Techno-economic feasibility of a PV/battery/fuel cell/electrolyzer/biogas hybrid system for energy and hydrogen production in the far north region of cameroon by using HOMER pro. Energy Strategy Rev. 2022, 44, 100988. [Google Scholar] [CrossRef]
  18. Zhou, J.; Xu, Z. Optimal sizing design and integrated cost-benefit assessment of stand-alone microgrid system with different energy storage employing chameleon swarm algorithm: A rural case in Northeast China. Renew. Energy 2023, 202, 1110–1137. [Google Scholar] [CrossRef]
  19. Akinyele, D.; Amole, A.; Olabode, E.; Olusesi, A.; Ajewole, T. Simulation and Analysis Approaches to Microgrid Systems Design: Emerging Trends and Sustainability Framework Application. Sustainability 2021, 13, 11299. [Google Scholar] [CrossRef]
  20. Zamora, I.; San Martin, J.I.; Asensio, F.J.; Saldaña, G.; Oñederra, O.; Goitia, U. Reliable Power Supply of Islanded Locations through Microgrids. Renew. Energy Power Qual. J. 2019, 17, 162–167. [Google Scholar] [CrossRef]
  21. Veilleux, G.; Potisat, T.; Pezim, D.; Ribback, C.; Ling, J.; Krysztofiński, A.; Ahmed, A.; Papenheim, J.; Mon Pineda, A.; Sembian, S.; et al. Techno-economic analysis of microgrid projects for rural electrification: A systematic approach to the redesign of Koh Jik off-grid case study. Energy Sustain. Dev. 2020, 54, 1–13. [Google Scholar] [CrossRef]
  22. Feng, W.; Jin, M.; Liu, X.; Bao, Y.; Marnay, C.; Yao, C.; Yu, J. A review of microgrid development in the United States–A decade of progress on policies, demonstrations, controls, and software tools. Appl. Energy 2018, 228, 1656–1668. [Google Scholar] [CrossRef]
  23. Mongrain, R.S.; Ayyanar, R. Multi-platform real-time microgrid simulation testbed with hierarchical control of distributed energy resources featuring energy storage balancing. IET Renew. Power Gener. 2020, 14, 834–844. [Google Scholar] [CrossRef]
  24. Shaikh, P.H.; Shaikh, A.; Memon, Z.A.; Lashari, A.A.; Leghari, Z.H. Microgrids: A review on optimal hybrid technologies, configurations, and applications. Int. J. Energy Res. 2021, 45, 12564–12597. [Google Scholar] [CrossRef]
  25. Tomin, N.; Shakirov, V.; Kozlov, A.; Sidorov, D.; Kurbatsky, V.; Rehtanz, C.; Lora, E.E. Design and optimal energy management of community microgrids with flexible renewable energy sources. Renew. Energy 2022, 183, 903–921. [Google Scholar] [CrossRef]
  26. Sukneva, S.A. Migration processes in the Sakha Republic (Yakutia). Espace Popul. Soc. 2021, 1, 62–77. [Google Scholar] [CrossRef]
  27. GIS, R.E. GIS Renewable Energy Sources of Russia. 2022. Available online: https://gisre.ru/en/main/ (accessed on 27 June 2025).
  28. Gritsenko, D. Sustainable energy policies and programs in Yakutia. In Discourses on Sustainability; Palgrave Macmillan: Cham, Switzerland, 2020; pp. 185–206. [Google Scholar]
  29. Neftegza.ru. Yakutia May Increase the Share of Renewable Power Output in the Arctic to 10% by 2024. 2022. Available online: https://neftegaz.ru/news/Alternative-energy/749815-yakutiya-mozhet-narastit-dolyu-vyrabotki-vozobnovlyaemoy-energii-v-arktike-do-10-v-2024-godu/ (accessed on 20 October 2025).
  30. Sokolnikova, P.; Lombardi, P.; Arendarski, B.; Suslov, K.; Pantaleo, A.; Kranhold, M.; Komarnicki, P. Net-zero multi-energy systems for Siberian rural communities: A methodology to size thermal and electric storage units. Renew. Energy 2020, 155, 979–989. [Google Scholar] [CrossRef]
  31. Khayrullina, A.; Blinov, D.; Borzenko, V. Air heated metal hydride energy storage system design and experiments for microgrid applications. Int. J. Hydrogen Energy 2019, 44, 19168–19176. [Google Scholar] [CrossRef]
  32. IEA. Norway Energy Policy Review. 2022. Available online: https://iea.blob.core.windows.net/assets/de28c6a6-8240-41d9-9082-a5dd65d9f3eb/NORWAY2022.pdf (accessed on 25 April 2025).
  33. Egging, R.; Tomasgard, A. Norway’s role in the European energy transition. Energy Strategy Rev. 2018, 20, 99–101. [Google Scholar] [CrossRef]
  34. Sasson, A.; Blomgren, A. Knowledge-Based Oil and Gas Industry; Research Report 3/2011; Nordberg Publisher: Stavanger, Norway, 2011. [Google Scholar]
  35. Mehammer, E.B.; Berg, K.; Torsæter, B.N.; Johansson, O. Power Quality in Islanded Microgrids supplied by Vehicle-to-Grid: Norwegian Pilot Study. In Proceedings of the 2021 IEEE Madrid PowerTech, Madrid, Spain, 28 June–2 July 2021; IEEE: Washington, DC, USA, 2021; pp. 1–6. [Google Scholar]
  36. Mishra, S.; Bordin, C.; Tomasgard, A.; Palu, I. A multi-agent system approach for optimal microgrid expansion planning under uncertainty. Int. J. Electr. Power Energy Syst. 2019, 109, 696–709. [Google Scholar] [CrossRef]
  37. Bøe, V. Cost Optimization of Distributed Power Generation in Southern Norway, with Focus on Renewable Hybrid System Configurations. Master’s Thesis, Norwegian University of Life Sciences, Ås, Norway, 2017. [Google Scholar]
  38. Sarker, S. Feasibility analysis of a renewable hybrid energy system with producer gas generator fulfilling remote household electricity demand in Southern Norway. Renew. Energy 2016, 87, 772–781. [Google Scholar] [CrossRef]
  39. US EIA Alaska. State Profile and Energy Estimates. 2023. Available online: https://www.eia.gov/state/analysis.php?sid=AK#:~:text=In%202022%2C%20natural%20gas%20fueled,about%203%25%20of%20Alaska’s%20generation (accessed on 25 April 2025).
  40. Asmus, P. How Alaska Fits into the Global Microgrid Movement. 2022. Available online: https://uaf.edu/acep-blog/how-alaska-fits-into-the-global-microgrid-movement%20.php#:~:text=When%20measured%20in%20terms%20of,installed%20according%20to%20Guidehouse%20Insights (accessed on 30 June 2025).
  41. Whitney, E.; Pike, C. An Alaska case study: Solar photovoltaic technology in remote microgrids. J. Renew. Sustain. Energy 2017, 9, 061704. [Google Scholar] [CrossRef]
  42. Holdmann, G.P.; Wies, R.W.; Vandermeer, J.B. Renewable energy integration in Alaska’s remote islanded microgrids: Economic drivers, technical strategies, technological niche development, and policy implications. Proc. IEEE 2019, 107, 1820–1837. [Google Scholar] [CrossRef]
  43. Bolt, G.; Wilber, M.; Huang, D.; Sambor, D.J.; Aggarwal, S.; Whitney, E. Modeling and Evaluating Beneficial Matches between Excess Renewable Power Generation and Non-Electric Heat Loads in Remote Alaska Microgrids. Sustainability 2022, 14, 3884. [Google Scholar] [CrossRef]
  44. Sambor, D.J.; Bishop, S.C.M.; Dotson, A.; Aggarwal, S.; Jacobson, M.Z. Optimizing demand response of a modular water reuse system in a remote Arctic microgrid. J. Clean. Prod. 2022, 346, 131110. [Google Scholar] [CrossRef]
  45. Bower, W.I.; Ton, D.T.; Guttromson, R.; Glover, S.F.; Stamp, J.E.; Bhatnagar, D.; Reilly, J. The Advanced Microgrid. Integration and Interoperability (No. SAND2014-1535); Sandia Report SAND2014-1535; Sandia National Lab. (SNL-NM): Albuquerque, NM, USA, 2014.
  46. Farhangi, H.; Joós, G. Microgrid Planning and Design: A Concise Guide; John Wiley & Sons: Hoboken, NJ, USA, 2019. [Google Scholar]
  47. Taraghi Nazloo, H.; Babazadeh, R.; Varmazyar, M. Optimal Configuration and Planning of Distributed Energy Systems Considering Renewable Energy Resources. J. Environ. Inform. 2024, 43, 1–12. [Google Scholar] [CrossRef]
  48. Mostafaeipour, A.; Qolipour, M.; Rezaei, M.; Jahangiri, M.; Goli, A.; Sedaghat, A. A novel integrated approach for ranking solar energy location planning: A case study. J. Eng. Des. Technol. 2020, 19, 698–720. [Google Scholar] [CrossRef]
  49. Al Garni, H.Z.; Awasthi, A.; Ramli, M.A. Optimal design and analysis of grid-connected photovoltaic under different tracking systems using HOMER. Energy Convers. Manag. 2018, 155, 42–57. [Google Scholar] [CrossRef]
  50. Jatoi, A.R.; Samo, S.R.; Jakhrani, A.Q. Influence of Temperature on Electrical Characteristics of Different Photovoltaic Module Technologies. Int. J. Renew. Energy Dev. 2018, 7, 85–91. [Google Scholar] [CrossRef]
  51. Kasaeian, A.; Rahdan, P.; Rad, M.A.V.; Yan, W.M. Optimal design and technical analysis of a grid-connected hybrid photovoltaic/diesel/biogas under different economic conditions: A case study. Energy Convers. Manag. 2019, 198, 111810. [Google Scholar] [CrossRef]
  52. Cetinbas, I.; Tamyurek, B.; Demirtas, M. Design, analysis, and optimization of a hybrid microgrid system using HOMER software: Eskisehir Osmangazi University example. Int. J. Renew. Energy Dev. 2019, 8, 65–79. [Google Scholar] [CrossRef]
  53. Givler, T.; Lilienthal, P. Using HOMER Software, NREL’s Micropower Optimization Model, to Explore the Role of Gen-Sets in Small Solar Power Systems; Case Study: Sri Lanka; Technical Report NREL/TP-710-36774; National Renewable Energy Lab.: Golden, CO, USA, 2005.
  54. Nguyen, X.P.; Hoang, A.T. The flywheel energy storage system: An effective solution to accumulate renewable energy. In Proceedings of the 2020 6th International Conference on Advanced Computing and Communication Systems (ICACCS), Coimbatore, India, 6–7 March 2020; IEEE: Washington, DC, USA, 2020; pp. 1322–1328. [Google Scholar]
  55. Bahramirad, S.; Reder, W.; Khodaei, A. Reliability-constrained optimal sizing of energy storage system in a microgrid. IEEE Trans. Smart Grid 2012, 3, 2056–2062. [Google Scholar] [CrossRef]
  56. Wang, P.; Goel, L.; Liu, X.; Choo, F.H. Harmonizing AC and DC: A hybrid AC/DC future grid solution. IEEE Power Energy Mag. 2013, 11, 76–83. [Google Scholar] [CrossRef]
  57. Brandao, D.I.; dos Santos, R.P.; Silva, W.W.A.; Oliveira, T.R.; Donoso-Garcia, P.F. Model-free energy management system for hybrid alternating current/direct current microgrids. IEEE Trans. Ind. Electron. 2020, 68, 3982–3991. [Google Scholar] [CrossRef]
  58. Xu, L.; Guerrero, J.M.; Lashab, A.; Wei, B.; Bazmohammadi, N.; Vasquez, J.; Abusorrah, A.M. A Review of DC Shipboard Microgrids Part I: Power Architectures, Energy Storage and Power Converters. IEEE Trans. Power Electron. 2021, 37, 5155–5172. [Google Scholar] [CrossRef]
  59. Babu, M.K.; Ray, P. Sensitivity analysis, optimal design, cost and energy efficiency study of a hybrid forecast model using HOMER pro. J. Eng. Res. 2023, 11, 100033. [Google Scholar] [CrossRef]
  60. NASA. 2023. Available online: https://data.nasa.gov/dataset/prediction-of-worldwide-energy-resources-power (accessed on 16 January 2025).
  61. Tan, S.; Wu, Y.; Xie, P.; Guerrero, J.M.; Vasquez, J.C.; Abusorrah, A. New challenges in the design of microgrid systems: Communication networks, cyberattacks, and resilience. IEEE Electr. Mag. 2020, 8, 98–106. [Google Scholar] [CrossRef]
  62. Mehta, S.; Basak, P. A case study on pv assisted microgrid using homer pro for variation of solar irradiance affecting cost of energy. In Proceedings of the 2020 IEEE 9th Power India International Conference (PIICON), Delh, India, 28 February–1 March 2020; IEEE: Washington, DC, USA, 2020; pp. 1–6. [Google Scholar]
  63. Khalil, L.; Bhatti, K.L.; Awan, M.A.I.; Riaz, M.; Khalil, K.; Alwaz, N. Optimization and designing of hybrid power system using HOMER pro. Mater. Today Proc. 2021, 47, S110–S115. [Google Scholar] [CrossRef]
  64. Taghavifar, H.; Zomorodian, Z.S. Techno-economic viability of on grid micro-hybrid PV/wind/Gen system for an educational building in Iran. Renew. Sustain. Energy Rev. 2021, 143, 110877. [Google Scholar] [CrossRef]
  65. Hafez, O.; Bhattacharya, K. Optimal planning and design of a renewable energy-based supply system for microgrids. Renew. Energy 2012, 45, 7–15. [Google Scholar] [CrossRef]
  66. Huner, B. Feasibility and environmental analysis of biogas-based hybrid energy system using HOMER pro software: A case study for Hatay. Energy Convers. Manag. 2025, 326, 119480. [Google Scholar] [CrossRef]
  67. Said, T.R.; Kichonge, B.; Kivevele, T. Optimal design and analysis of a grid-connected hybrid renewable energy system using HOMER Pro: A case study of Tumbatu Island, Zanzibar. Energy Sci. Eng. 2024, 12, 2137–2163. [Google Scholar] [CrossRef]
  68. Krishnamurthy, S.; Ogunwole, E.I. Microgrid system design, modeling, and simulation. In Modeling and Control Dynamics in Microgrid Systems with Renewable Energy Resources; Academic Press: New York, NY, USA, 2024; pp. 345–376. [Google Scholar]
  69. Khalid, W. Design and Analysis of Hybrid Power System and IoT SCADA System for Remote Sites. Ph.D. Thesis, Memorial University of Newfoundland, St. John’s, NL, Canada, 2024. [Google Scholar]
  70. Basheer, Y.; Qaisar, S.M.; Waqar, A.; Lateef, F.; Alzahrani, A. Investigating the optimal DOD and battery technology for hybrid energy generation models in cement industry using HOMER Pro. IEEE Access 2023, 11, 81331–81347. [Google Scholar] [CrossRef]
  71. Hasan, S.M.N.; Ahmad, S.; Liaf, A.F.; Mustayen, A.G.M.B.; Hasan, M.M.; Ahmed, T.; Howlader, S.; Hassan, M.; Alam, M.R. Techno-economic performance and sensitivity analysis of an off-grid renewable energy-based hybrid system: A case study of Kuakata, Bangladesh. Energies 2024, 17, 1476. [Google Scholar] [CrossRef]
  72. Giedraityte, A.; Rimkevicius, S.; Marciukaitis, M.; Radziukynas, V.; Bakas, R. Hybrid renewable energy systems—A review of optimization approaches and future challenges. Appl. Sci. 2025, 15, 1744. [Google Scholar] [CrossRef]
  73. Bakar, N.N.A.; Guerrero, J.M.; Vasquez, J.C.; Bazmohammadi, N.; Othman, M.; Rasmussen, B.D.; Al-Turki, Y.A. Optimal Configuration and Sizing of Seaport Microgrids including Renewable Energy and Cold Ironing—The Port of Aalborg Case Study. Energies 2022, 15, 431. [Google Scholar] [CrossRef]
  74. Chisale, S.W.; Eliya, S.; Taulo, J. Optimization and design of hybrid power system using HOMER pro and integrated CRITIC-PROMETHEE II approaches. Green Technol. Sustain. 2023, 1, 100005. [Google Scholar] [CrossRef]
  75. Naiborhu, M.A.; Purwanti, D.R.; Kumalasari, S.D.; Idris, M.K.; Dwisa, C.B.P.; Elkhomei, A.S.; Purnawanti, Y.N. Transportation challenges for onshore wind turbine power plant development in Indonesia. IOP Conf. Ser. Earth Environ. Sci. 2025, 1464, 012002. [Google Scholar] [CrossRef]
  76. Sovacool, B.K. The intermittency of wind, solar, and renewable electricity generators: Technical barrier or rhetorical excuse? Util. Policy 2009, 17, 288–296. [Google Scholar] [CrossRef]
  77. Conde, H.J.C.; Demition, C.M.; Honra, J. Storage Is the New Black: A Review of Energy Storage System Applications to Resolve Intermittency in Renewable Energy Systems. Energies 2025, 18, 354. [Google Scholar] [CrossRef]
  78. Pryor, S.C.; Barthelmie, R.J. Climate change impacts on wind energy: A review. Renew. Sustain. Energy Rev. 2010, 14, 430–437. [Google Scholar] [CrossRef]
  79. Vis, I.F.; Ursavas, E. Assessment approaches to logistics for offshore wind energy installation. Sustain. Energy Technol. Assess. 2016, 14, 80–91. [Google Scholar] [CrossRef]
  80. Kilinc-Ata, N.; Proskuryakova, L. New energy-rich or still energy-poor? Evidence from selected African countries. Util. Policy 2025, 97, 102068. [Google Scholar] [CrossRef]
  81. Falcone, P.M. Sustainable energy policies in developing countries: A review of challenges and opportunities. Energies 2023, 16, 6682. [Google Scholar] [CrossRef]
  82. Thirunavukkarasu, M.; Sawle, Y. Smart microgrid integration and optimization. In Active Electrical Distribution Network: A Smart Approach; John Wiley & Sons, Ltd.: Hoboken, NJ, USA, 2021; Volume 7, pp. 201–235. [Google Scholar]
  83. Deshmukh, M.K.; Singh, A.B. Modeling of Energy Performance of Stand-Alone SPV System Using HOMER Pro. Energy Procedia 2019, 156, 90–94. [Google Scholar] [CrossRef]
  84. Tan, Y.; Wang, Q.; Zhang, Z. Algorithms for separating diffuse and beam irradiance from data over the East Asia-Pacific region: A multi-temporal-scale evaluation based on minute-level ground observations. Sol. Energy 2023, 252, 218–233. [Google Scholar] [CrossRef]
  85. Sitharthan, R.; Vimal, S.; Verma, A.; Karthikeyan, M.; Dhanabalan, S.S.; Prabaharan, N.; Rajesh, M.; Eswaran, T. Smart microgrid with the Internet of things for adequate energy management and analysis. Comput. Electr. Eng. 2023, 106, 108556. [Google Scholar] [CrossRef]
  86. Battisti, L. Wind Turbines in Cold Climates: Icing Impacts and Mitigation Systems; Springer: Berlin/Heidelberg, Germany, 2015. [Google Scholar]
  87. Adothu, B.; Kumar, S.; John, J.J.; Oreski, G.; Mathiak, G.; Jäckel, B.; Alberts, V.; Bin Jahangir, J.; Alam, M.A.; Gottschalg, R. Comprehensive review on performance, reliability, and roadmap of c-Si PV modules in desert climates: A proposal for improved testing standard. Prog. Photovolt. Res. Appl. 2024, 32, 495–527. [Google Scholar] [CrossRef]
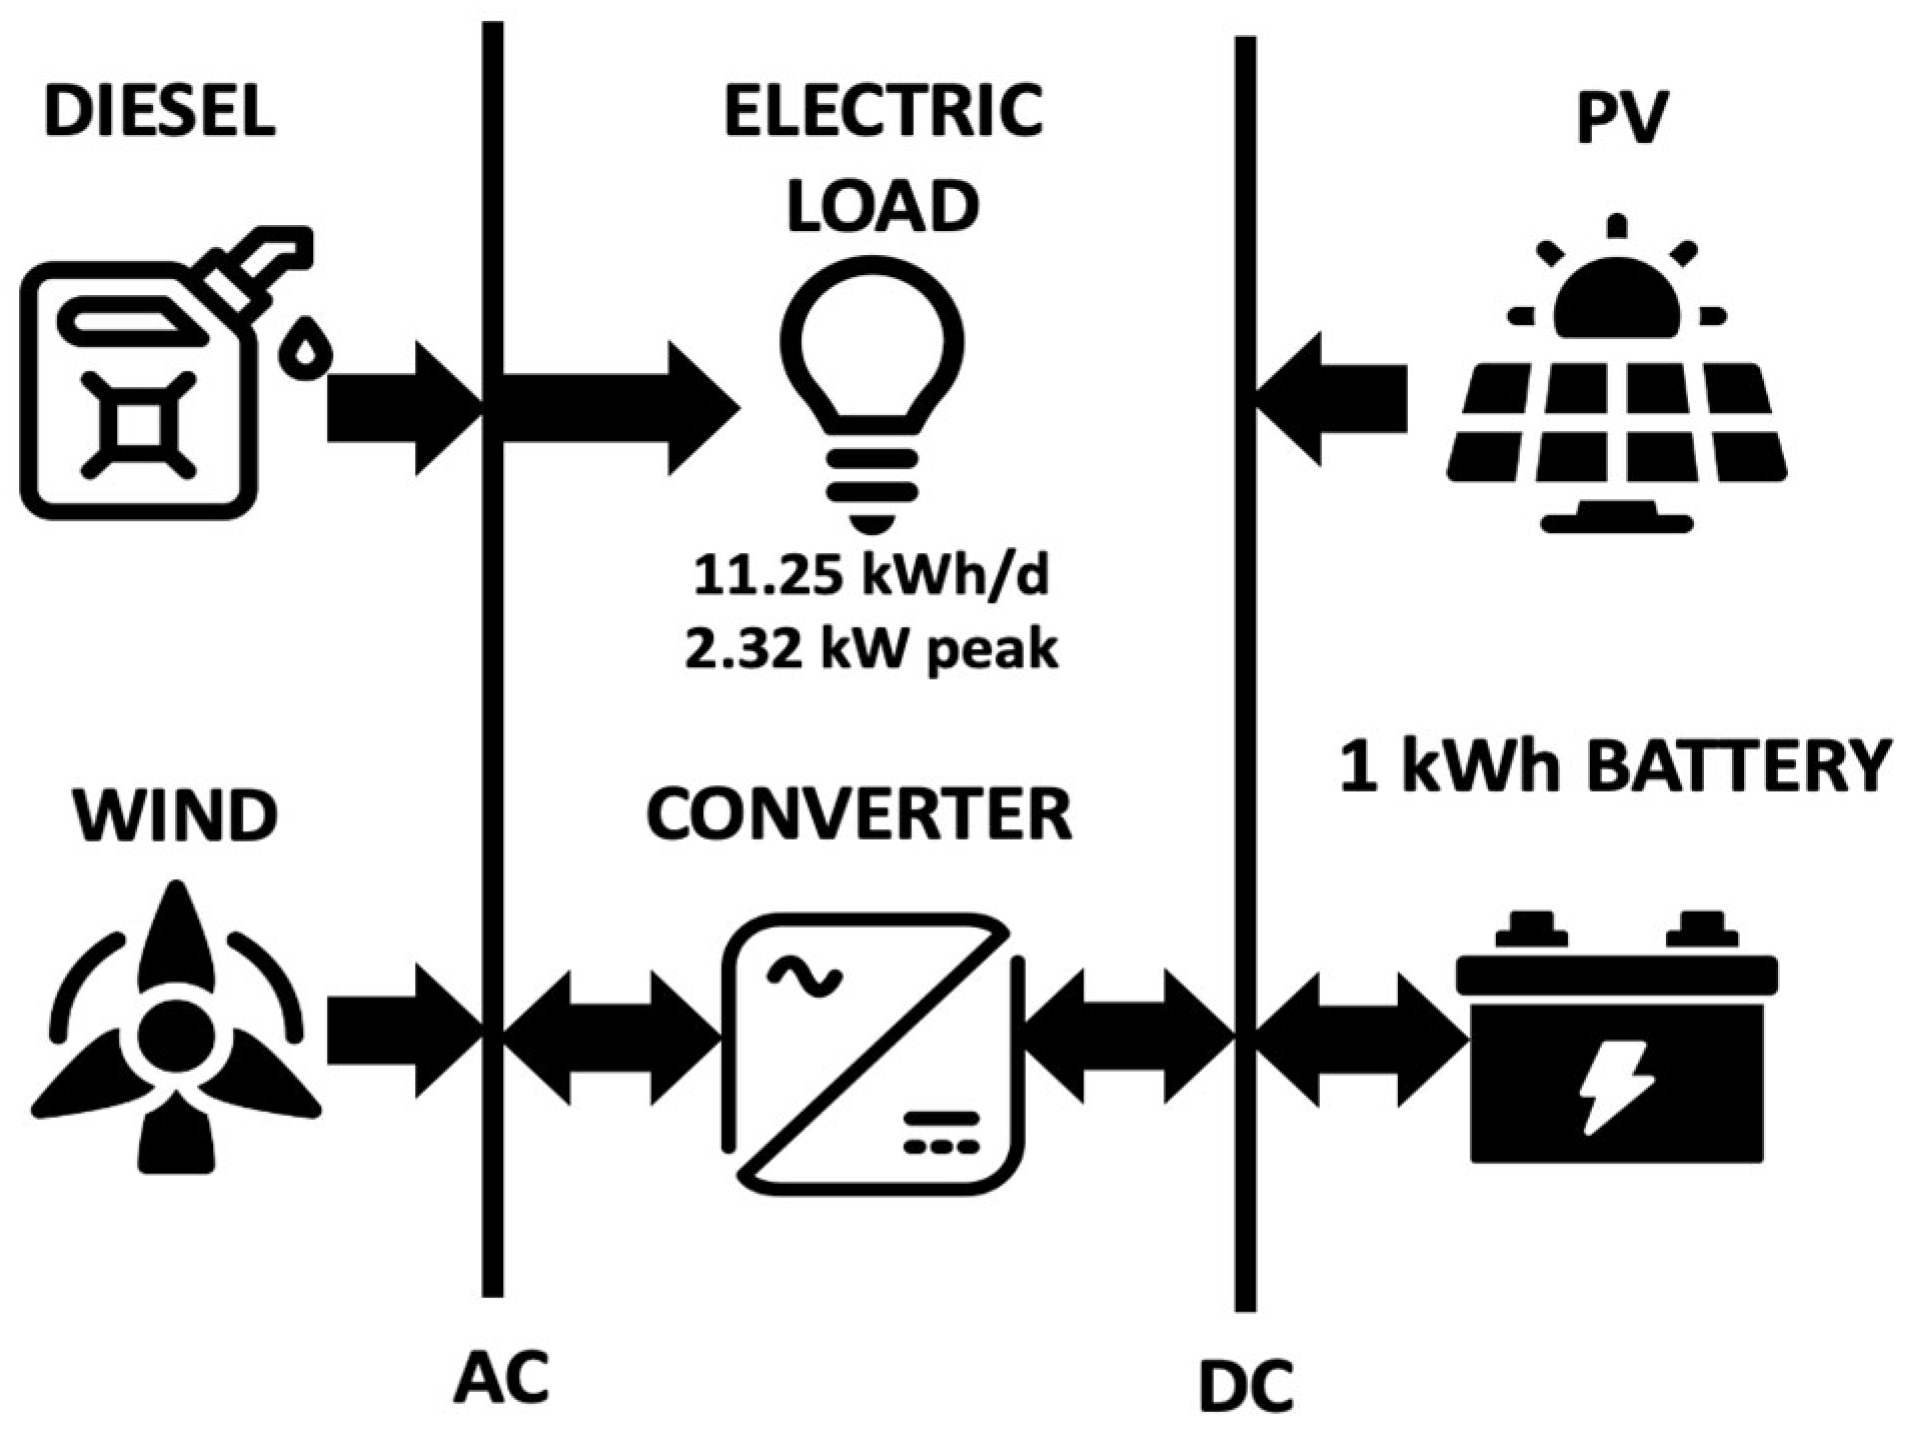
Figure 1. Design of the proposed MG system layout for the analysis. Source: Created by authors using HOMER Pro.
Energies 18 05827 g001
Figure 2. Monthly average solar irradiance in Yakutia, Hordaland, and Alaska. Source of data: [60].
Energies 18 05827 g002
Figure 3. Clearness Index in Yakutia, Hordaland, and Alaska. Source of data: [60].
Energies 18 05827 g003
Figure 4. Monthly wind speed in Yakutia, Hordaland, and Alaska. Source of data: [60].
Energies 18 05827 g004
Figure 5. Cost optimization results for Yakutia, USD, in thousands. Note: Operating cost is in USD/year in thousands.
Energies 18 05827 g005
Figure 6. Cost optimization results for Hordaland, thousand USD. Note: Operating cost is in thousand USD/year.
Energies 18 05827 g006
Figure 7. Cost optimization results for Alaska, USD, in thousands. Note: Operating cost is in USD/year in thousands.
Energies 18 05827 g007
Figure 8. Comparison of costs for simulated microgrids in Yakutia, Hordaland, and Alaska in Model 1.
Energies 18 05827 g008
Figure 9. Comparison of costs for simulated microgrids in Yakutia, Hordaland, and Alaska in Model 2.
Energies 18 05827 g009
Figure 10. Comparison of costs for simulated microgrids in Yakutia, Hordaland, and Alaska in Model 3.
Energies 18 05827 g010
Table 1. Notation Table.
SymbolDescription
C N P C , i Net Present Cost of configuration i
R 0 , i Initial cost for element i
R t , i Cash flow at year t for element i
xDiscount rate
P s h e d d i n g Power shed
P l o a d Load demand
f P V Fraction of energy served by PV
r l o a d , t Reserve requirement at time t
C e l e m e n t , i Total cost of system element i
C s a l v a g e , i Salvage value of element i
E s e r v e d + H s e r v e d Total electrical and thermal loads served
E n o n r e n ,   H n o n r e n Non-RE served
C a n n , t o t Total annualized cost
C O & M Operation & Maintenance cost
N b a t t e r y Number of batteries required
DODDepth of discharge of battery
Source: Created by authors.
Table 2. Optimization results from the proposed models for Yakutia *.
ParameterProposed Model 1Proposed Model 2Proposed Model 3
LayoutPV (kW)1.501.94-
Converter (kW)0.8331.331.46
CostNPC (thousand $)47.6234.2750.52
COE (thousand $)0.900.650.95
Operating cost (thousand $/yr)1.671.942.22
Initial capital (thousand $)26.009.2521.84
SystemREC fraction %63.826.230.3
Total fuel (L/yr)628969927
DieselProduction (kWh)1.4853.0312.863
O&M Cost ($/yr)149136135
Fuel Cost ($/yr)628969927
PVCapital cost (thousand $)3.754.85-
Production (kWh/yr)1.531.97-
WindCapital cost (thousand $)18.000-18.000
Production (kWh/yr)2.64-2.64
O&M Cost ($)180-180
ConverterRectifier mean output (kWh)0.070.170.23
Inverter mean output (kWh)0.170.300.18
BatteryAutonomy (hr)11.511.58.97
Annual throughput (kWh/yr)1.091.911.82
Nominal capacity (kWh)9.019.017.01
Usable nominal capacity5.405.404.20
Notes: Proposed Model 1: Diesel + Wind + Converter + PV + Battery; Proposed Model 2: Diesel + Converter + PV + Battery; Proposed Model 3: Diesel +Wind + Converter + Battery. * The data for Table 1 is sourced directly from the HOMER Pro program.
Table 3. Optimization results from the proposed models for Hordaland *.
ParameterModel 1Model 2Model 3
LayoutPV (kW)2.002.18-
Converter (kW)1.001.282.00
CostNPC (thousand $)44.6135.0847.46
COE (thousand $)0.840.660.89
Operating cost (thousand $/yr)1.311.921.92
Initial capital (thousand $)27.6010.1322.60
SystemREC fraction %79.126.043.6
Total fuel (L/yr)356961723
DieselProduction (kWh)8573.032.32
O&M Cost ($/yr)82.413194.9
Fuel Cost ($/yr)356961723
PVCapital cost (thousand $)5.005.45-
Production (kWh/yr)1.801.96-
WindCapital cost (thousand $)18.00-18.00
Production (kWh/yr)3.76-3.76
O&M Cost ($)180-180
ConverterRectifier mean output (kWh)0.070.170.23
Inverter mean output (kWh)0.180.300.17
BatteryAutonomy (hr)12.812.811.5
Annual throughput (kWh/yr)1.231.951.81
Nominal capacity (kWh)10.010.09.01
Usable nominal capacity6.006.005.40
Notes: Proposed Model 1: Diesel + Wind + Converter + PV + Battery; Proposed Model 2: Diesel + Converter + PV + Battery; Proposed Model 3: Diesel +Wind + Converter + Battery. * The data source for Table 1 is taken directly from the HOMER Pro program.
Table 4. Optimization results from the proposed models for Alaska *.
ParameterProposed Model 1Proposed Model 2Proposed Model 3
LayoutPV (kW)1.561.75-
Converter (kW)1.321.280.560
CostNPC (thousand $)50.4234.2754.39
COE (thousand $)0.950.641.03
Operating cost (thousand $/yr)1.861.972.60
Initial capital (thousand $)26.308.7620.66
SystemREC fraction %47.724.217.3
Total fuel (L/yr)6859961.28
DieselProduction (kWh)2.143.113.39
O&M Cost ($/yr)95.8140260
Fuel Cost ($/yr)6859961.28
PVCapital cost (thousand $)3.914.37-
Production (kWh/yr)1.601.79-
WindCapital cost (thousand $)18.00-18.00
Production (kWh/yr)1.56-1.56
O&M Cost ($)180-180
ConverterRectifier mean output (kWh)0.150.170.15
Inverter mean output (kWh)0.240.290.11
BatteryAutonomy (hr)11.511.55.13
Annual throughput (kWh/yr)1.731.921.19
Nominal capacity (kWh)9.019.014.00
Usable nominal capacity5.405.402.40
Notes: Proposed Model 1: Diesel + Wind + Converter + PV + Battery; Proposed Model 2: Diesel + Converter + PV + Battery; Proposed Model 3: Diesel +Wind + Converter + Battery. * The data source for Table 1 is taken directly from the HOMER Pro program.
Disclaimer/Publisher’s Note: The statements, opinions and data contained in all publications are solely those of the individual author(s) and contributor(s) and not of MDPI and/or the editor(s). MDPI and/or the editor(s) disclaim responsibility for any injury to people or property resulting from any ideas, methods, instructions or products referred to in the content.