1. Introduction
Due to unpredictable power supply, distribution networks become more complex when integrating intermittent sources, like distributed generation (DG). Enhancing the utilization of energy depends on managing DG in unbalanced networks effectively. Internal unbalances in active distribution networks can impair stability and effectiveness and affect the quality of consumers’ power. These unbalances must be corrected for distribution systems to be dependable and effective. This research intends to improve unbalance in the system and DG integration for reliable power delivery. The continuous enlargement of the distribution network due to increasing load demand and substantial evolution of distributed generation (DG) is one of the critical research areas in the electrical engineering domain. DG penetration into distribution networks transforms them from passive to active systems, which could impact the entire power system’s dynamics, particularly the distribution networks [
1]. Power electronic voltage source inverters are frequently used to interface DG systems. Power quality will be a significant challenge in networks with increased power electronics interfacing with DGs and loads as well as increased nonlinear loads. Among the many power quality challenges, unbalanced voltage is one of the most serious [
2]. Voltage regulation becomes difficult when network voltages are unbalanced because the unbalanced voltage’s negative-sequence component causes oscillations with a double fundamental frequency in both reactive and active power injections [
3]. Moreover, an unbalanced network can support less photovoltaic (PV) generation before the critical voltage limit is reached [
4].
Many scholarly contributions have been made to address the issues mentioned earlier. Based on strong and weak mutual Var compensation effects, a novel inter-phase coordinated consensus technique is proposed in the paper [
5] to overcome the voltage regulation challenges arising from unbalanced photovoltaic systems. In coordination with the distribution system operator, an ideal hierarchical control technique is proposed for handling reactive power injection of electrical vehicle chargers located geologically nearby. This system uses a linear quadratic regulator (LQR) that prevents voltage sag/swell [
6]. Voltage source converters (VSCs) are used as reactive power sources in the proposed controller. It coordinates with conventional controllers without substantially modifying the current distribution grid’s control and operation architecture [
7]. The distributed voltage control scheme based on the time-graded control strategy is presented. In case of regulative need, the coordination scheme enables prioritization of control devices adjustments in for photovoltaic plants, ensuring they are configured prior to the other connected devices according to the time synchronization schedule [
8]. In [
9], a novel controller parameter tuning method is proposed based on a virtual-time delay scheme to moderate the adverse effects of simultaneous and non-simultaneous operations of traditional voltage regulating devices and distributed generation units. In reference [
10], an innovative multi-phase zonal-based coordination method is proposed to control network voltages within limits and mitigate the overuse of regulating devices. The authors of [
11] presented an integrated multi-agent system architecture in which each voltage regulator is treated as an independent control agent that operates based on changes in the network topology to minimize voltage deviations. The research paper in ref. [
12] provides a hybrid online approach for optimum coordination of plug-in electric vehicles (PEVs) that performs voltage regulation and improves voltage unbalance with local auxiliary voltage assistance through dynamic PEV switching. An on-load tap changer’s post-contingency slow-timescale curative activities are coordinated with solar inverters and battery energy storage system’s fast-timescale curative activities using a multi-time scale optimization method in [
13]. The differential evolution optimization technique is used to elucidate the coordination between electric vehicles and distributed generations to improve the distribution system’s performance [
14]. A two-stage stochastic approach using the co-optimization method is presented to handle short and long-term period voltage issues [
15]. The research paper in reference [
16] provides a two-level coordination model for distributed generation and soft open point scheduling in unbalanced distribution networks considering their regulating capacities. In the studies, a multi-objective optimization model is used to coordinate the operation of fast and slow voltage regulators [
17,
18,
19].
The papers in references [
20,
21,
22] tackles real-time voltage control in power systems using a unique algorithm called EC-MADRL. Its operation is analogous to a strategy game involving various components like energy storage, compensators, and flexible loads, intending to minimize power loss from solar panels. The algorithm is designed to be efficient and flexible, and simulations show that it works better than other methods, ensuring stable voltage while wasting as little solar power as possible, on IEEE 33-bus test systems. The papers in references [
23,
24,
25] presents an innovative voltage regulator control strategy for unbalanced distribution systems (UDS) with photovoltaic (PV) integration. Using a multi-agent system (MAS) architecture, it optimizes voltage regulation while adapting to changing UDS conditions [
26]. This method ensures robust performance under normal operation and during system failures, as demonstrated throughsimulations on IEEE 34-node and 123-node distribution test feeders with high PV penetration and varying sun profiles [
27,
28,
29,
30]. The reference papers [
31,
32] present a cooperative voltage control strategy using a multi-agent system to manage high PV penetration challenges. It optimizes voltage regulation by coordinating voltage regulators with PV inverter reactive power control [
33]. Simulations on IEEE 34-bus and 123-bus test feeders demonstrate their effectiveness under diverse 24 h operating conditions [
11]. The paper in [
34] introduces a distributed multi-objective optimization model to coordinate PV inverter fast dispatch with the slower dispatch of on-load tap changers and capacitor banks in unbalanced three-phase distribution systems. While existing studies often rely on centralized control, this approach decentralizes the coordination, mitigating single points of failure and reducing the computational load for more effective voltage regulation.
When viewed in the context of earlier studies, the need for a distinct approach becomes clear. While several methods have been proposed for voltage regulation in distribution networks, most are developed for balanced systems, rely on centralized control, or consider the operation of a single type of device, such as DG units, shunt capacitors, or OLTCs in isolation. In contrast, the present work adopts a coordinated MAS framework that integrates optimal PMU placement for cost-effective real-time monitoring and complete system observability. The method simultaneously coordinates DGs and SCs through voltage-sensitivity and loss-sensitivity analysis, with specific emphasis on unbalanced three-phase radial distribution networks. The proposed approach is flexible and scalable, making it applicable to any radial feeder irrespective of feeder length, lateral complexity, or variations in the X/R ratio. This combination of MAS-based coordination, PMU-assisted monitoring, and joint DG–SC operation in unbalanced networks has not been reported in earlier literature and constitutes the key distinguishing feature of this study.
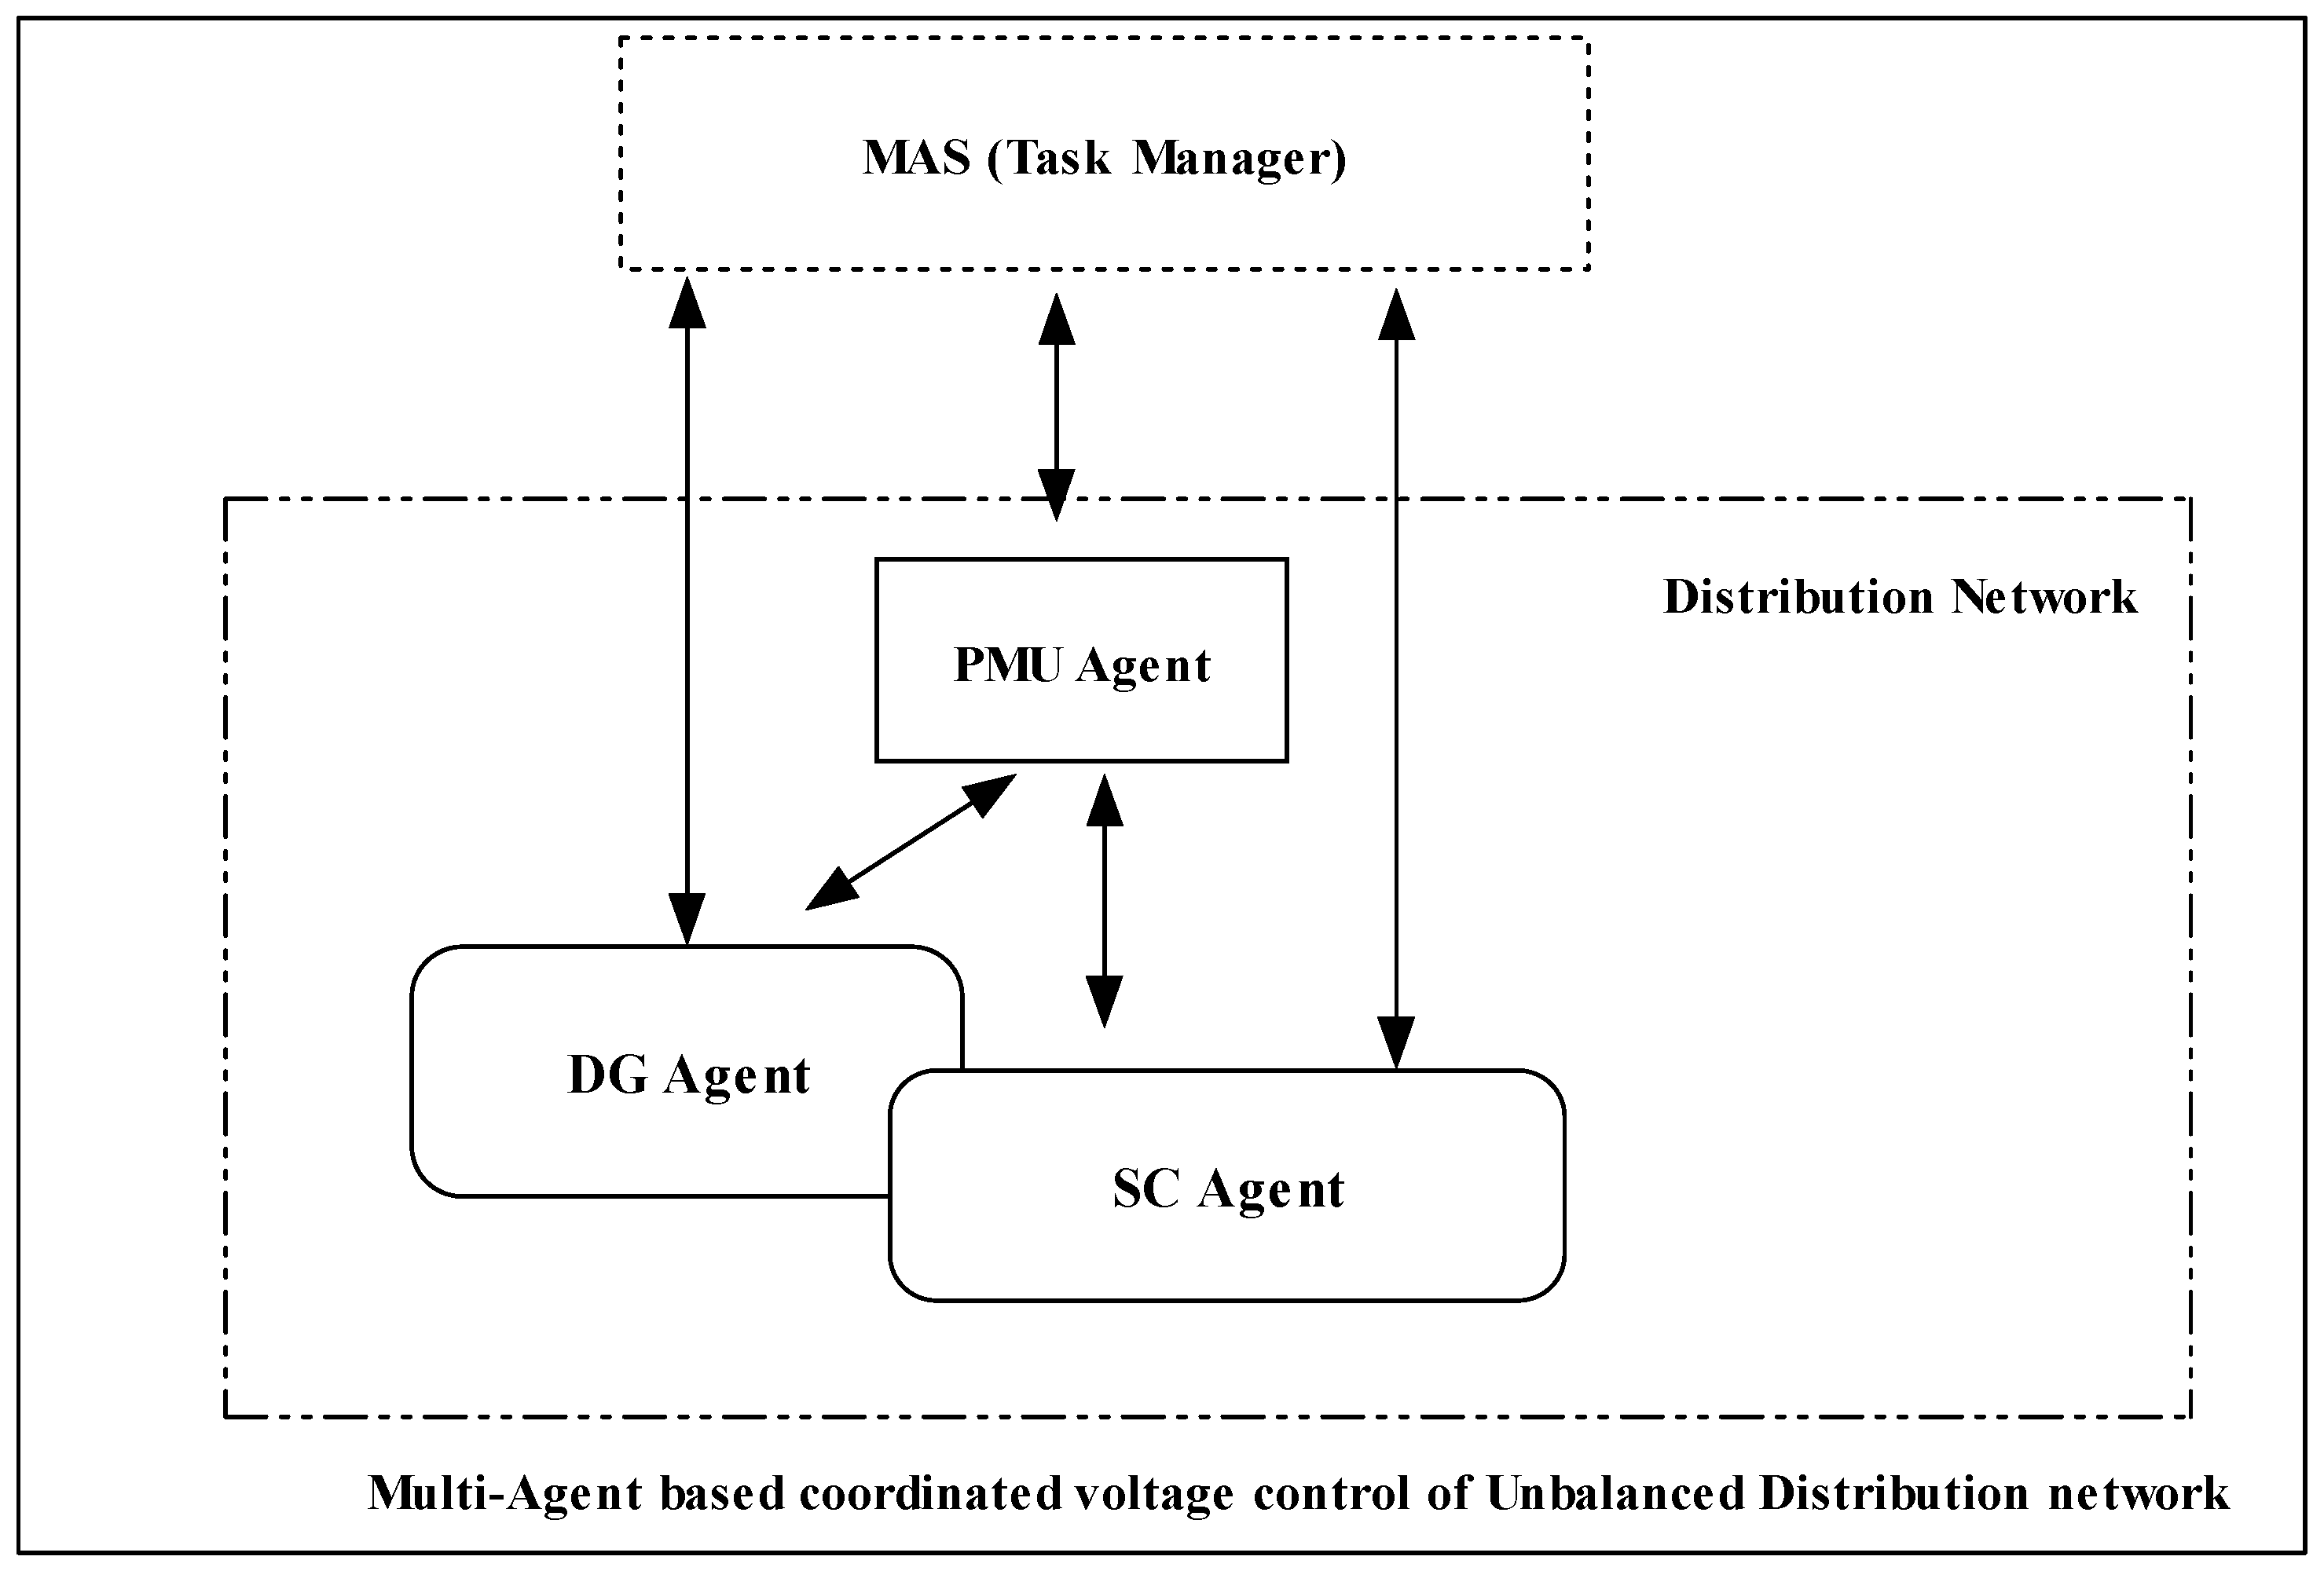
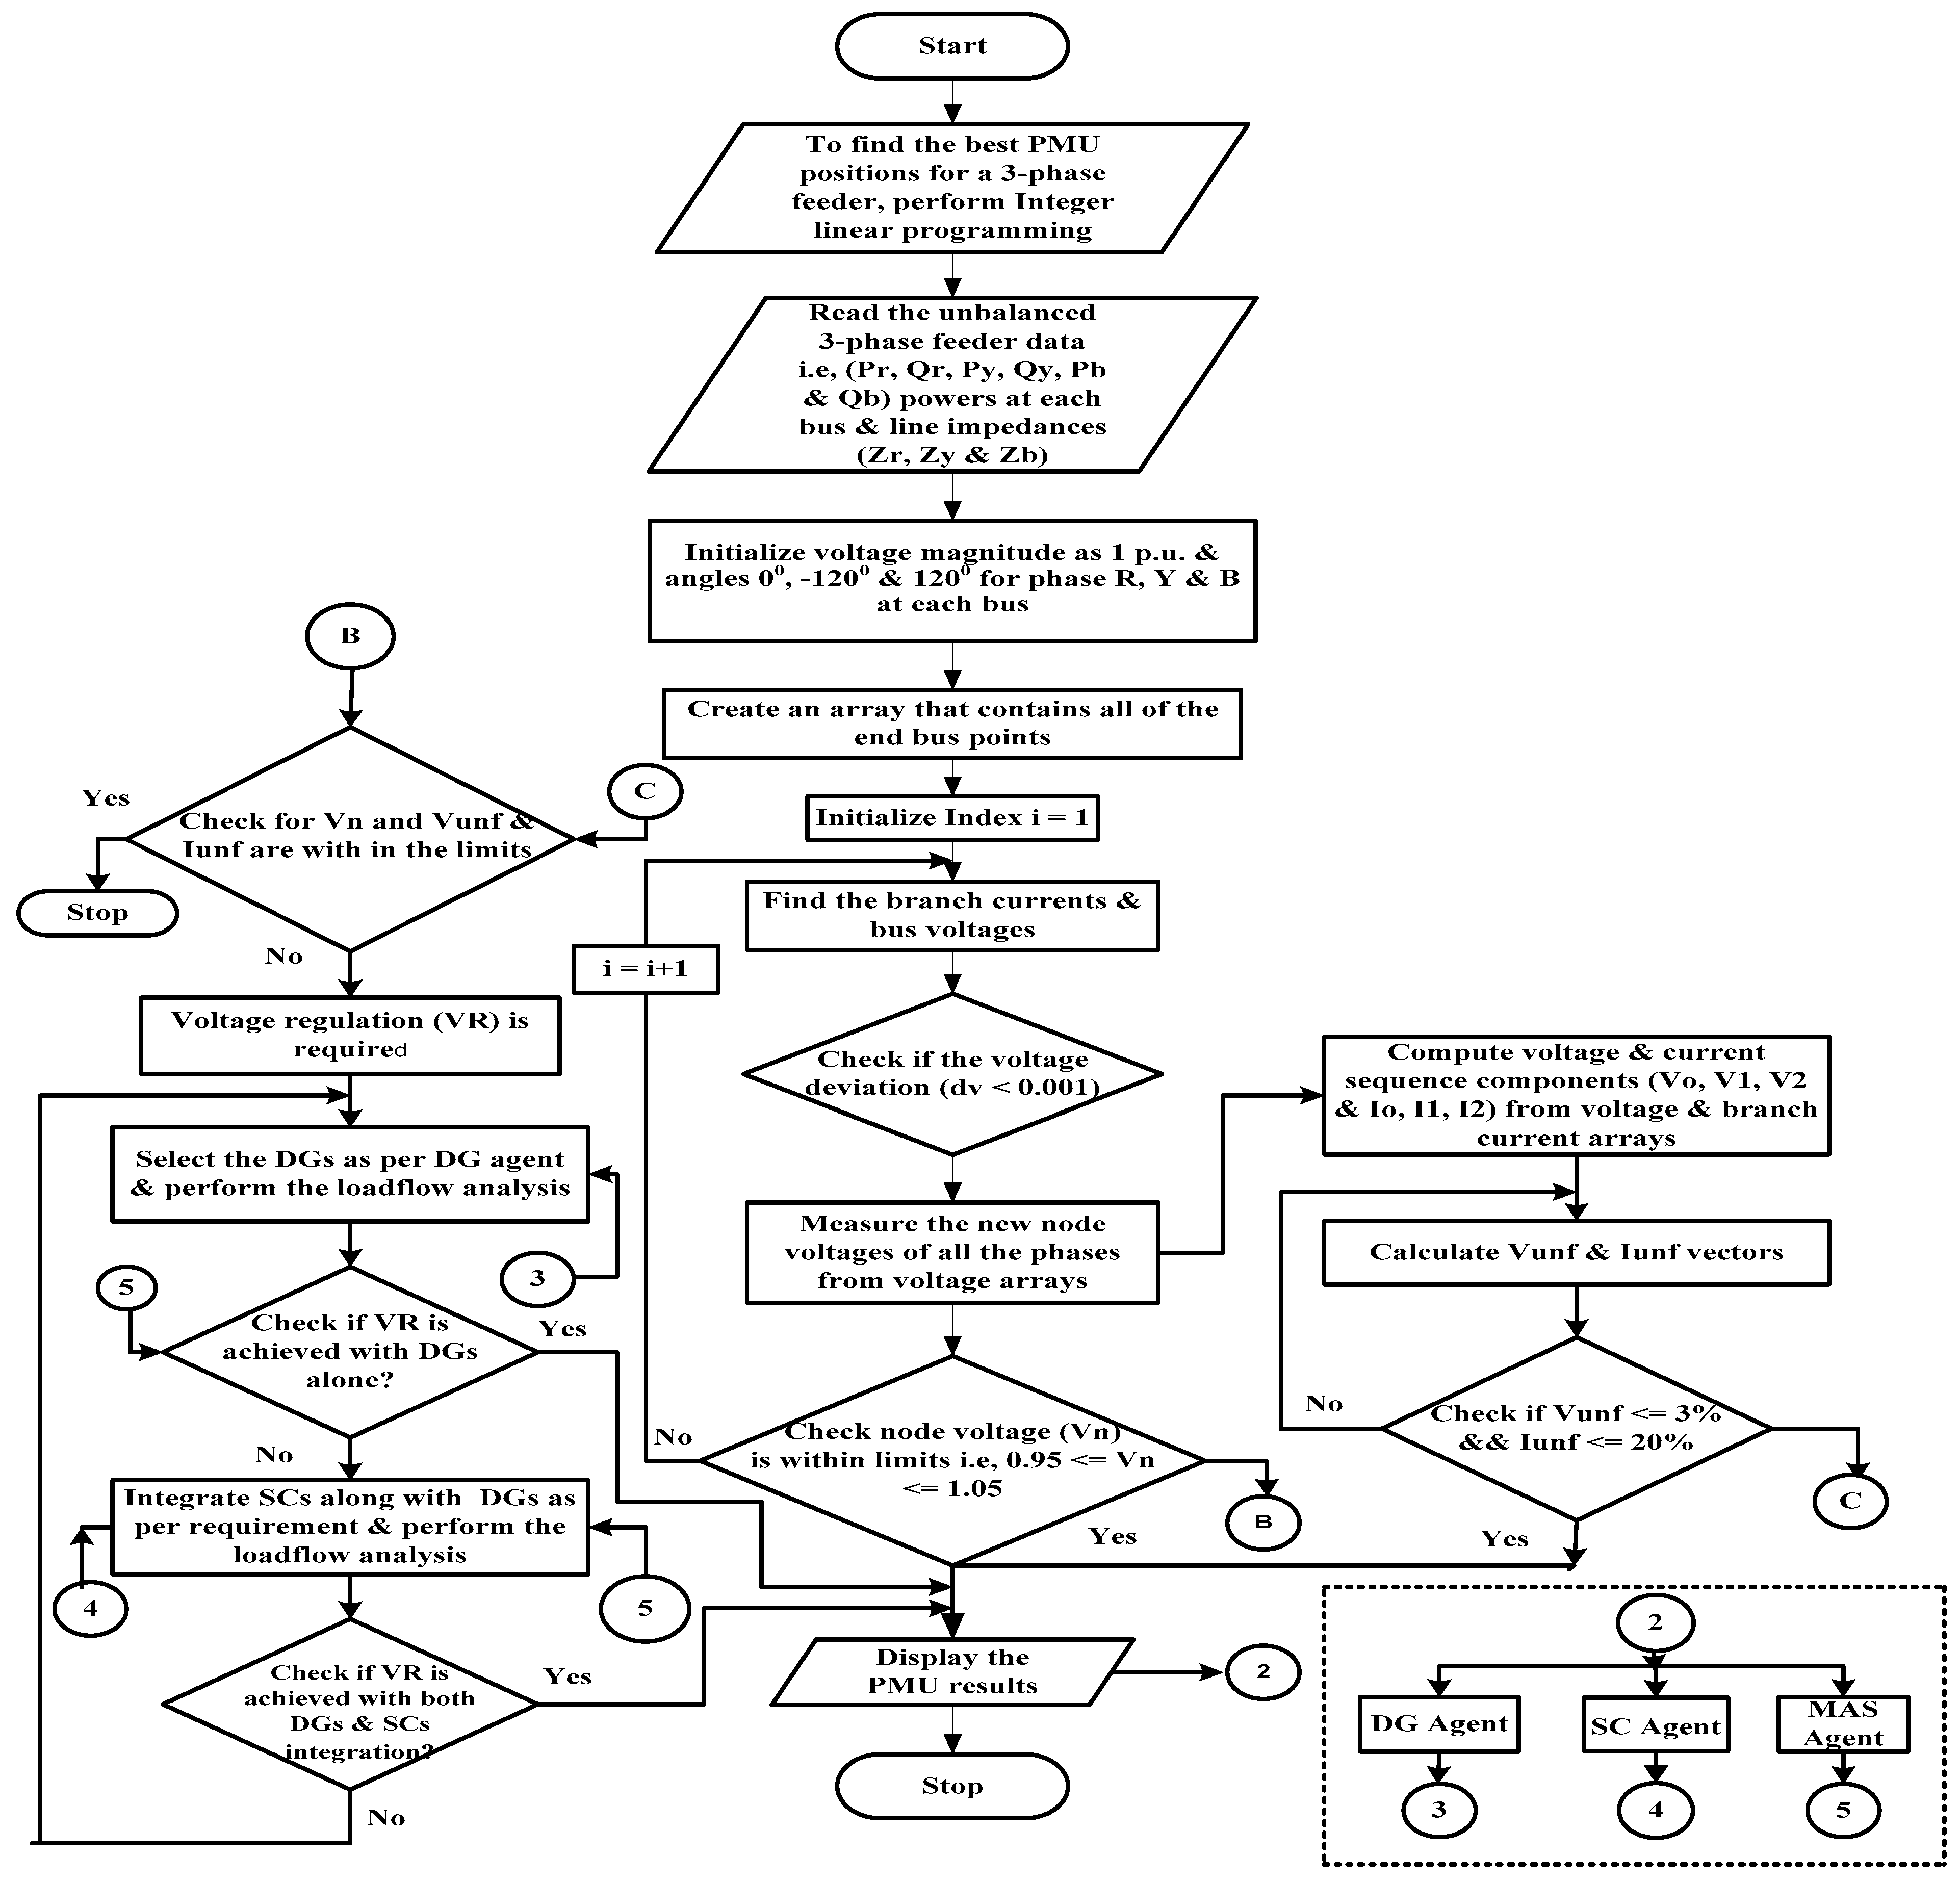
This paper presents a coordinated operation of DGs and SCs in an unbalanced distribution network for voltage regulation to minimize voltage deviation, power loss, and voltage and current balance factors and improve the overall network’s voltage profile. The MAS technique is employed in this work for optimal voltage regulator selection, and it is simulated on an IEEE 3-phase, 25-bus unbalanced radial distribution network.
The following are the major contributions of this paper:
- (1)
Introduced a Multi-Agent System (MAS) approach for optimal operation of Distributed Generators (DGs) and Switchable Capacitors (SCs) in unbalanced distribution networks, specifically targeting efficient voltage regulation.
- (2)
Integrates an optimal PMU placement strategy within the proposed MAS framework to enable cost-effective real-time monitoring and ensure full observability of unbalanced radial networks, thereby supporting the coordinated operation of DGs and SCs.
- (3)
The usage of PMUs helps to monitor the electrical parameters (voltage/current) via a conjoint time basis for synchronization, which helps the MAS controller get its agent’s data at specified timestamp events.
- (4)
The proposed technique can be applied to any UDN radial structure, regardless of the feeder length, innumerable laterals/sub-laterals, or X/R ratio fluctuations.
2. Problem Formulation
Inherently, distribution systems are unbalanced. An unbalanced system, as used in the context of electrical distribution systems, is one in which the three phases of the system (often denoted by the letters A, B, and C) do not have equal voltage magnitudes or phase angles. In an unbalanced system, one or more of the following conditions may exist:
- ➢
Voltage Magnitude Unbalance: The three phases’ voltages have different magnitudes. This indicates that a phase’s voltage may be higher or lower than the other phases.
- ➢
Phase Angle Unbalance: The phase angles of the voltages in the three phases are not evenly spaced at 120 degrees. This can lead to phase shifts between the phases, causing various issues in the system.
- ➢
Asymmetrical Load: The load connected to each phase is different. Some phases may carry significantly more load than others, leading to an uneven power distribution.
Systems can become out of balance for several reasons, such as an uneven load distribution, system flaws, or an unbalance in the generation sources. Managing unbalanced systems can be tricky since they can lead to problems like unstable voltage and fluctuations, which can lead to a rise in distribution system losses and decreased power quality and cause problems for connected equipment. Resources are not used effectively because some phases can be overloaded while others need to be utilized more. Research in this area, as mentioned in the previous context, is crucial for optimizing the performance of distribution networks, especially in the presence of distributed generation and other complex loads. Advanced control and regulation techniques are needed to address these challenges. To avoid catastrophic errors due to internal unbalances in the system, careful analysis of the distribution system with a detailed component model is required.
2.1. Feeder Modeling of 3-Phase Unbalanced Distribution Network
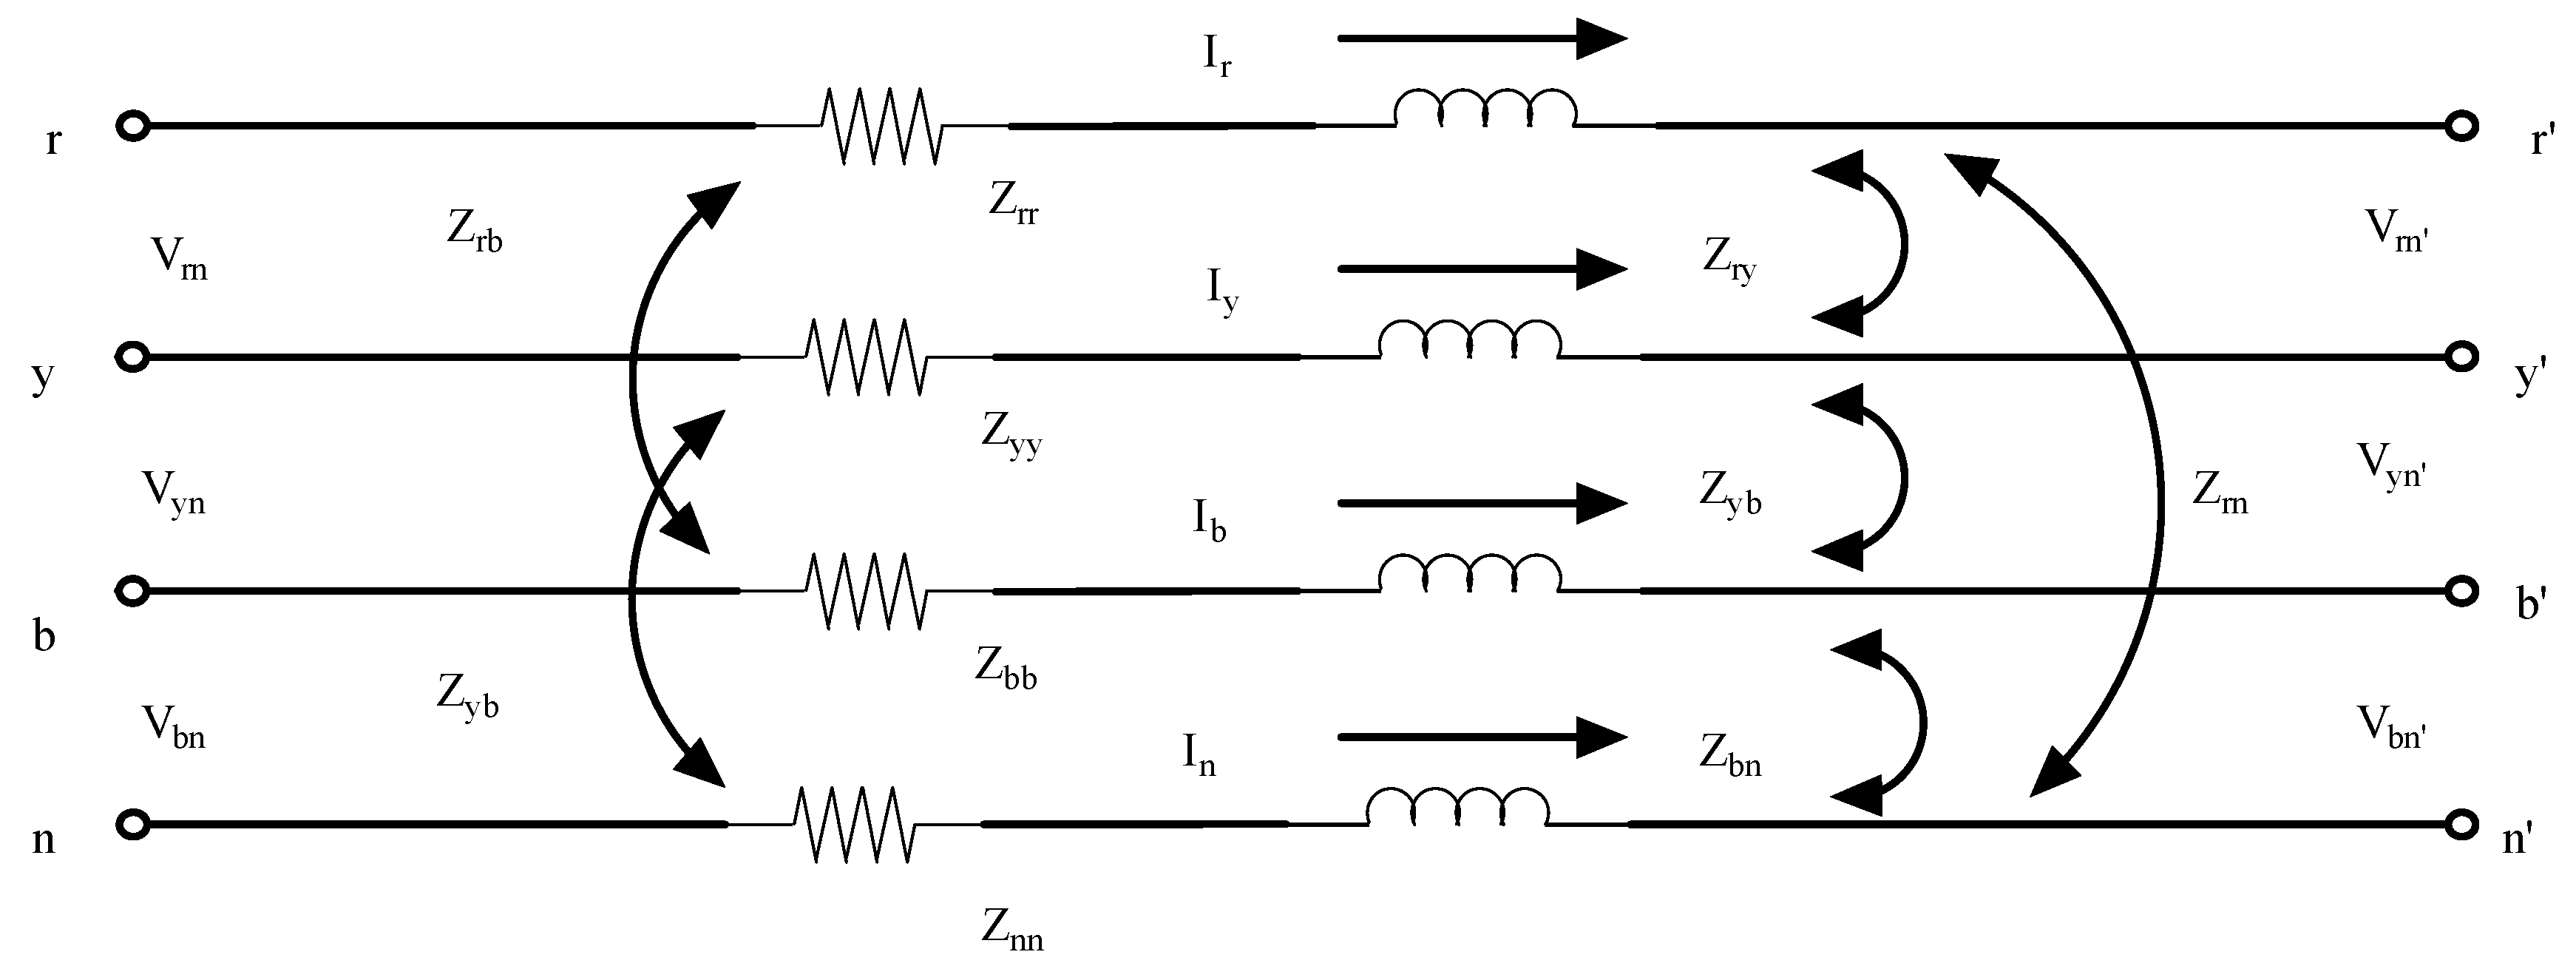
Since the distribution network is made up of single, two, and three phase non-converting phase lines serving unbalanced loads, mutual and self-impedance conditions of the line conductors need to be maintained, and the path of return conductor to earth for unbalanced current needs to be considered. Using modified Carson equations [
18], a 4 × 4 primitive impedance matrix can be written for a three-phase feeder with a neutral conductor, shown in
Figure 1.
Thus, the receiving end voltages (
Vr,
Vy,
Vb, and
Vn) are related to the sending end side (
Vr′,
Vy′,
Vb′, and
Vn′) of the network depicted in
Figure 1, as
After applying Kron’s reduction method, the neutral or ground wire’s effects are still present in the model, as shown in Equation (3). The phase impedance matrix is given as
The receiving end voltages can be correlated with the sending end voltages of the depicted feeder in
Figure 1 in the following manner:
The relevant load current injections
Iir,
Iiy, and
Iib for bus
i, corresponding to phases ‘
r’, ‘
y’, and ‘
b’, are calculated as a function of bus voltage
Vir,
Vir, and
Vir.
Power fed into the phaser of the line (
Figure 1) at the sending end bus is
Vr·(
Ir)*, and at the receiving end bus is
Vr′·(
Ir)*. Therefore, real and reactive power losses for phaser in the line (
) may be written as:
Similarly, for phase-
y and phase-
b 2.2. Need for Voltage Regulation in an Unbalanced Active Distribution System
2.2.1. Effect of DG Integration
DG integration makes the distribution system active rather than passive since it changes the power flow and voltage profiles. DG penetration into the distribution system (DS) will cause the voltage at the point of connection of the DG to rise above the receiving end voltage, and power will be flowing both directions [
19].
2.2.2. Effect of Unbalance in the Network
A voltage unbalance condition occurs when the line or phase voltages in a three-phase system deviate from their nominal balance state. A significant unbalance could drastically reduce equipment life cycles, speed up the additional component cycle, and significantly increase network operating and maintenance costs. A lower level of unbalance is desirable for improved system operation. According to IEEE standards, the percentage of unbalance is given in (11) and (12) is defined as follows [
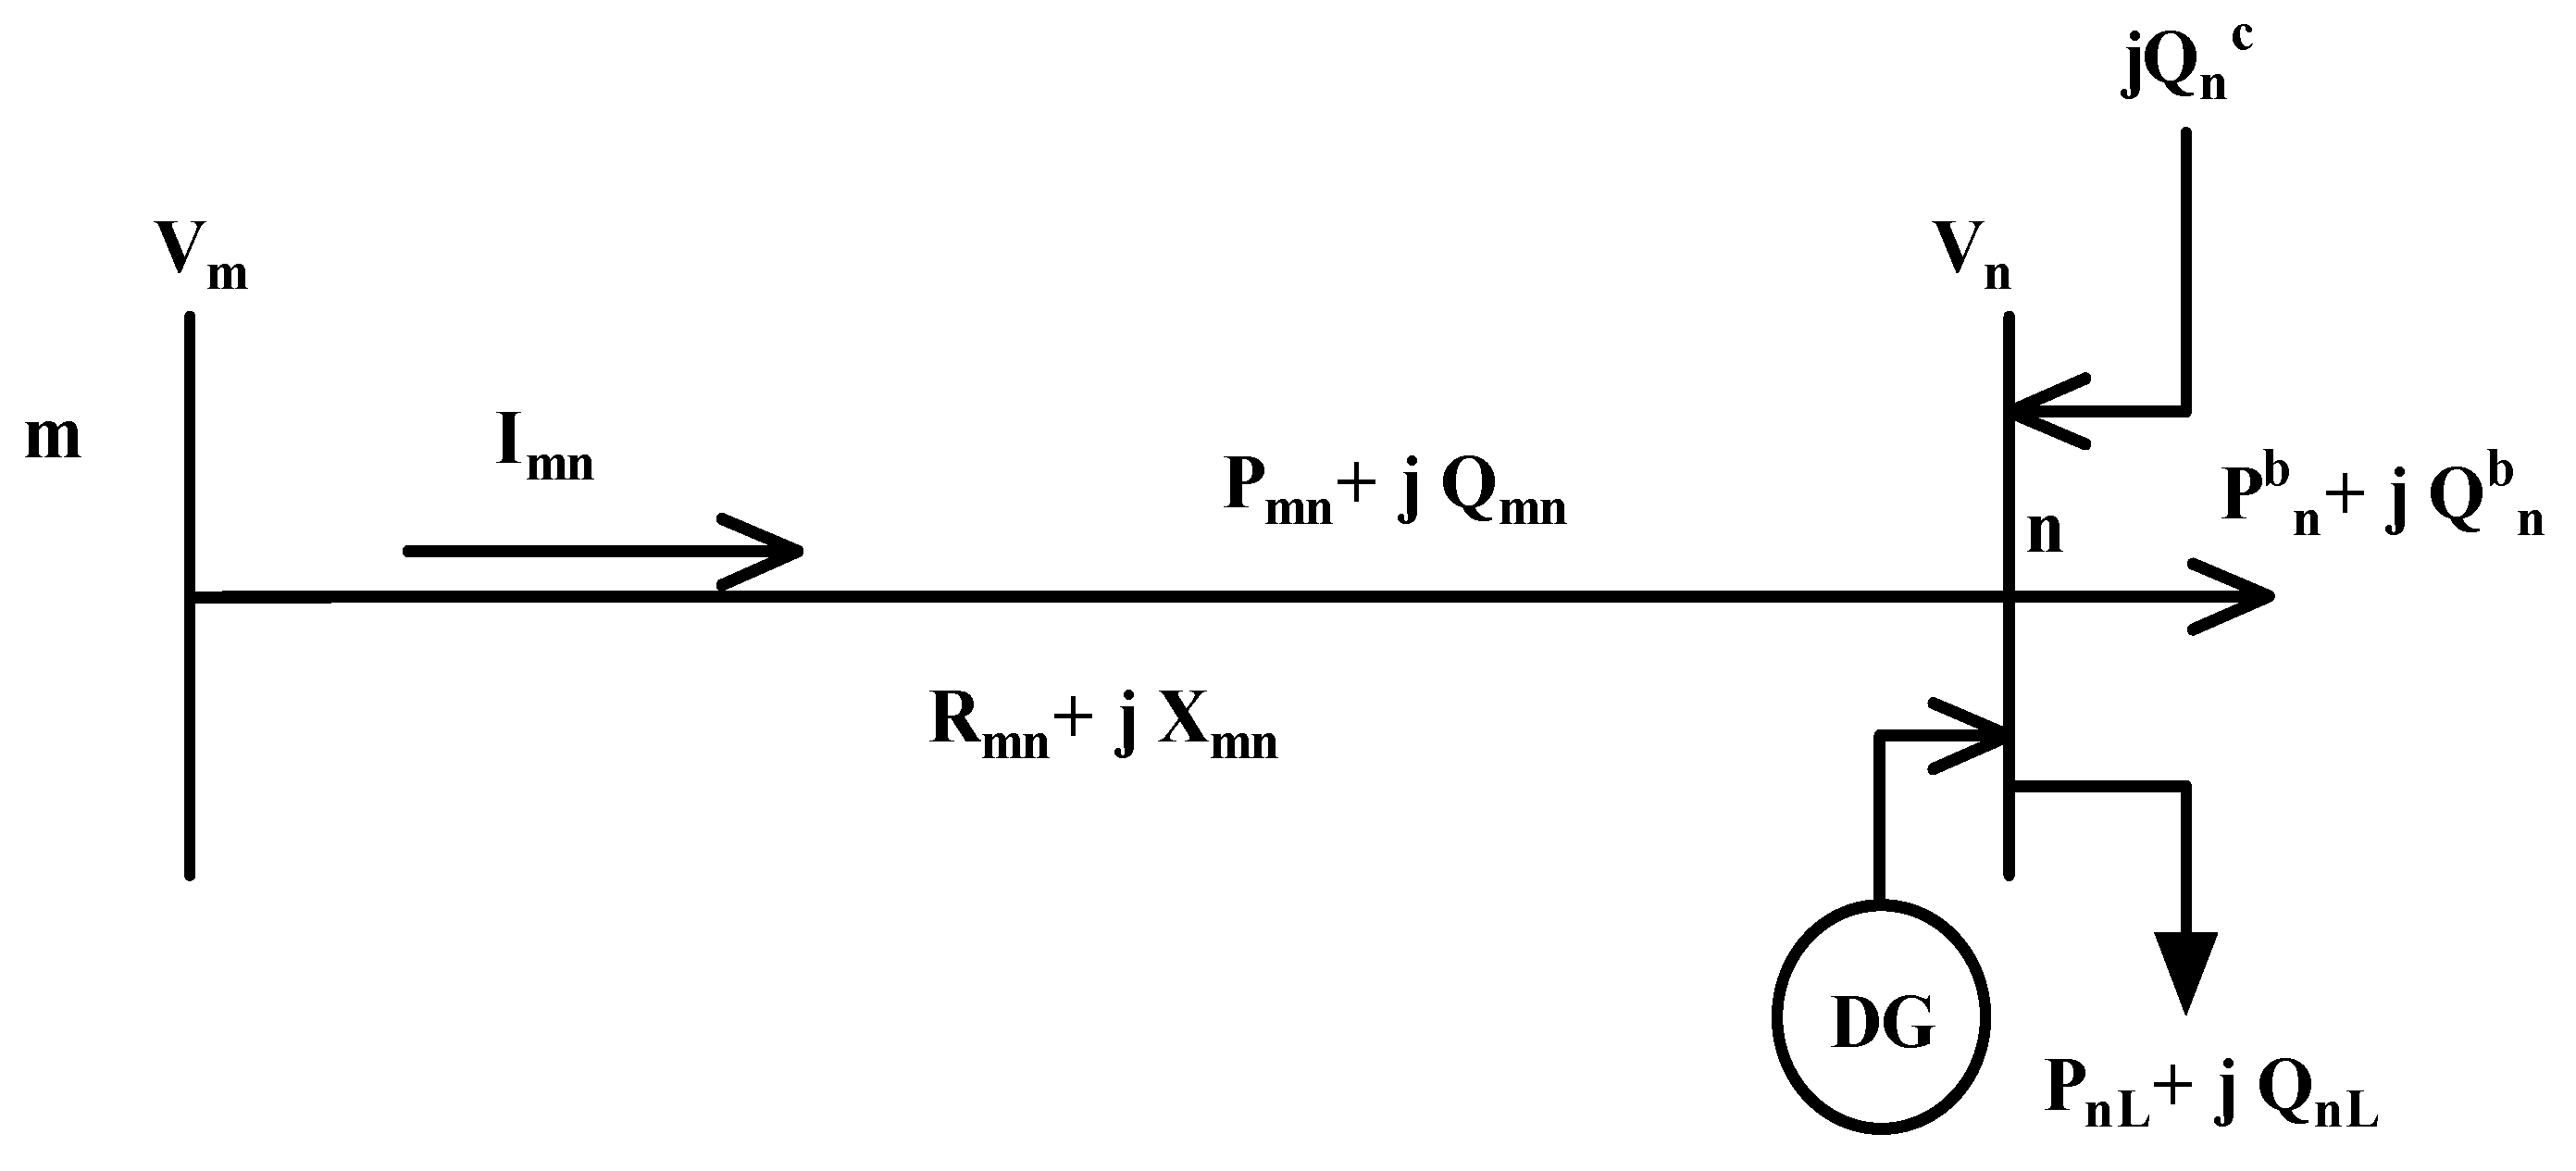
20]. A single line diagram of an electrical distribution network’s equivalent branch is shown in
Figure 2.
where
is the negative-sequence voltage component and
is the positive-sequence voltage component.
Current unbalance is caused by load deficiencies, which travel to the transformer and generate three-phase voltage unbalance. Even slight voltage unbalances considerably disrupt the current waveform on all the loads connected at the transformer level.
where
are the negative- and positive-sequence current components, respectively. According to IEEE standards, voltage unbalance should be less than 3%, and current unbalance should be less than 20% under normal operating conditions. The +ve (positive) and −ve (negative) sequence components of voltage and current are
V1,
V2 and
I1,
I2 respectively, while the voltage and current unbalance factors are
V2/
V1 and
I2/
I1. As per standards, the nodes are presumed to be in the normal operating range [
21,
35].
Historically, distribution networks were passive and radial, ensuring stability under most conditions; therefore, stability concerns were not considered when designing distribution networks. Nonetheless, as the load unbalance and DG penetration of networks grows, their contribution to network security increases over time. As a result, voltage regulation is essential in these circumstances.
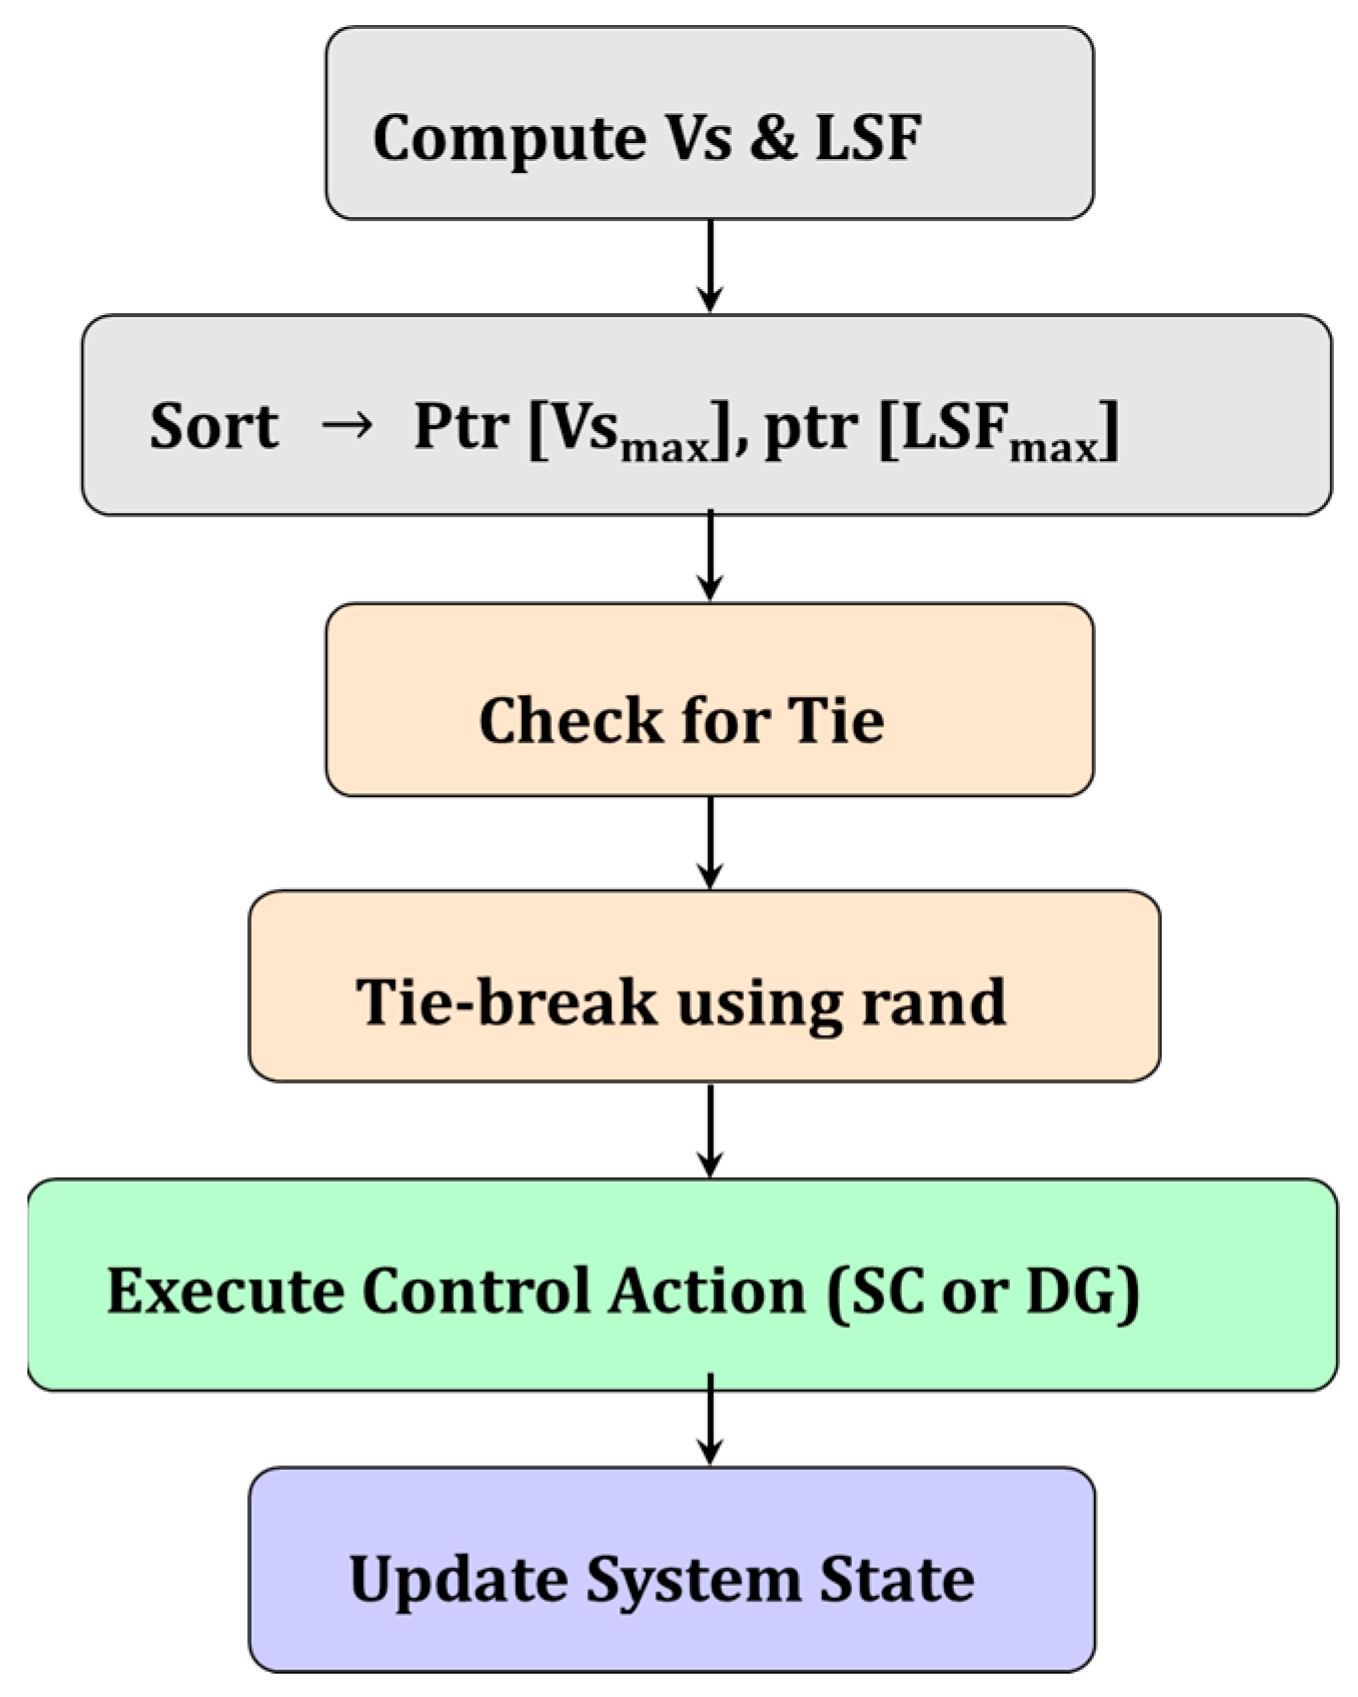
A sensitivity-based voltage regulation solution based on the MAS coordinated algorithm is implemented to overcome the aforementioned problems. For this study, two sensitivity techniques are being investigated as follows. The sensitivity-based methods for DG selection and capacitor placement are detailed in
Section 2.3 and
Section 2.4.
2.3. Sensitivity Matrix Formulation for Voltage Regulation Using DG
In an unbalanced distribution network, voltage profile optimization is a significant challenge that can be performed by selecting the optimal DG units. Therefore, satisfactory results can only be obtained if assigned to the most appropriate nodes. Nonetheless, determining the optimal voltage-sensitive bus installed for DG selection is difficult. Voltage sensitivity analysis has been addressed in various ways in the literature. This section describes the evaluation of buses that are the most sensitive to DG selection. Equations (13) and (14) represent the real and reactive power of a node in a ‘k’ bus network [
22,
23,
24].
From Equations (13) and (14), is the number of nodes to a specific node, and are the voltage magnitudes of the nth and mth nodes, and are the voltage phase angles at node m, n, and are the node admittance magnitude and angle.
For the k-bus network, Equations (13) and (14) represent ‘2n’ active power flow equations. Taking the partial derivative of (14) to voltage yields Equations (15) and (16).
As a result, the change in voltage equation at a node ‘
m’ in response to the change in
P and
Q on every system node ‘
n’ is reduced to (17)
The decoupled load flow nodal equation is expressed in matrix form as follows:
Equation (17) shows that the DG corresponding to node m is the one with the highest sensitivity value.
2.4. Loss Sensitivity Factor (LSF) Matrix Formulation for Capacitor Selection
Loss sensitivity analysis identifies the network’s sensitive buses to install shunt capacitors (SCs) [
25]. The buses with the highest LSF values are regarded as the most sensitive buses in the network. Equations (20) and (21) can indicate the active and reactive power losses that have occurred throughout branch “
mn”, respectively.
By taking partially derivative Equations (20) and (21) concerning reactive power injection, the
LSF value of every node in a distribution system is derived as follows.
Buses with high LSF values are designated as sensitive buses for the installation of shunt capacitors.
4. Results and Discussions
The proposed methodology is being used on a 25-bus, unbalanced 3-phase radial distribution system. The rated line voltage is 4.16 kV, the base MVA is 100, and the system data is given in [
31].
An ILP analysis is utilized to identify the best PMU location for the test system. By implementing MATLAB programming, the simulation is completed for comprehensive system observability. The single-line diagram of the unbalanced 25-bus radial distribution system, as depicted in
Figure 6, illustrates the network topology used in this study.
Table 1 shows the necessary number of PMUs and their positions in the test feeder for total system observability.
The percentage unbalance in the 3-phase feeder is considered as follows. It is assumed that the load in the R-phase remains the same as in a balanced system, and the Y-phase load is reduced by x% while the B-phase load is increased by y% from the base case.
The case study analysis considers three scenarios: a system without voltage regulators, DG integration, and SC and DG integration. A detailed discussion of each scenario follows.
4.1. Scenario1—Without DG/SC Integration
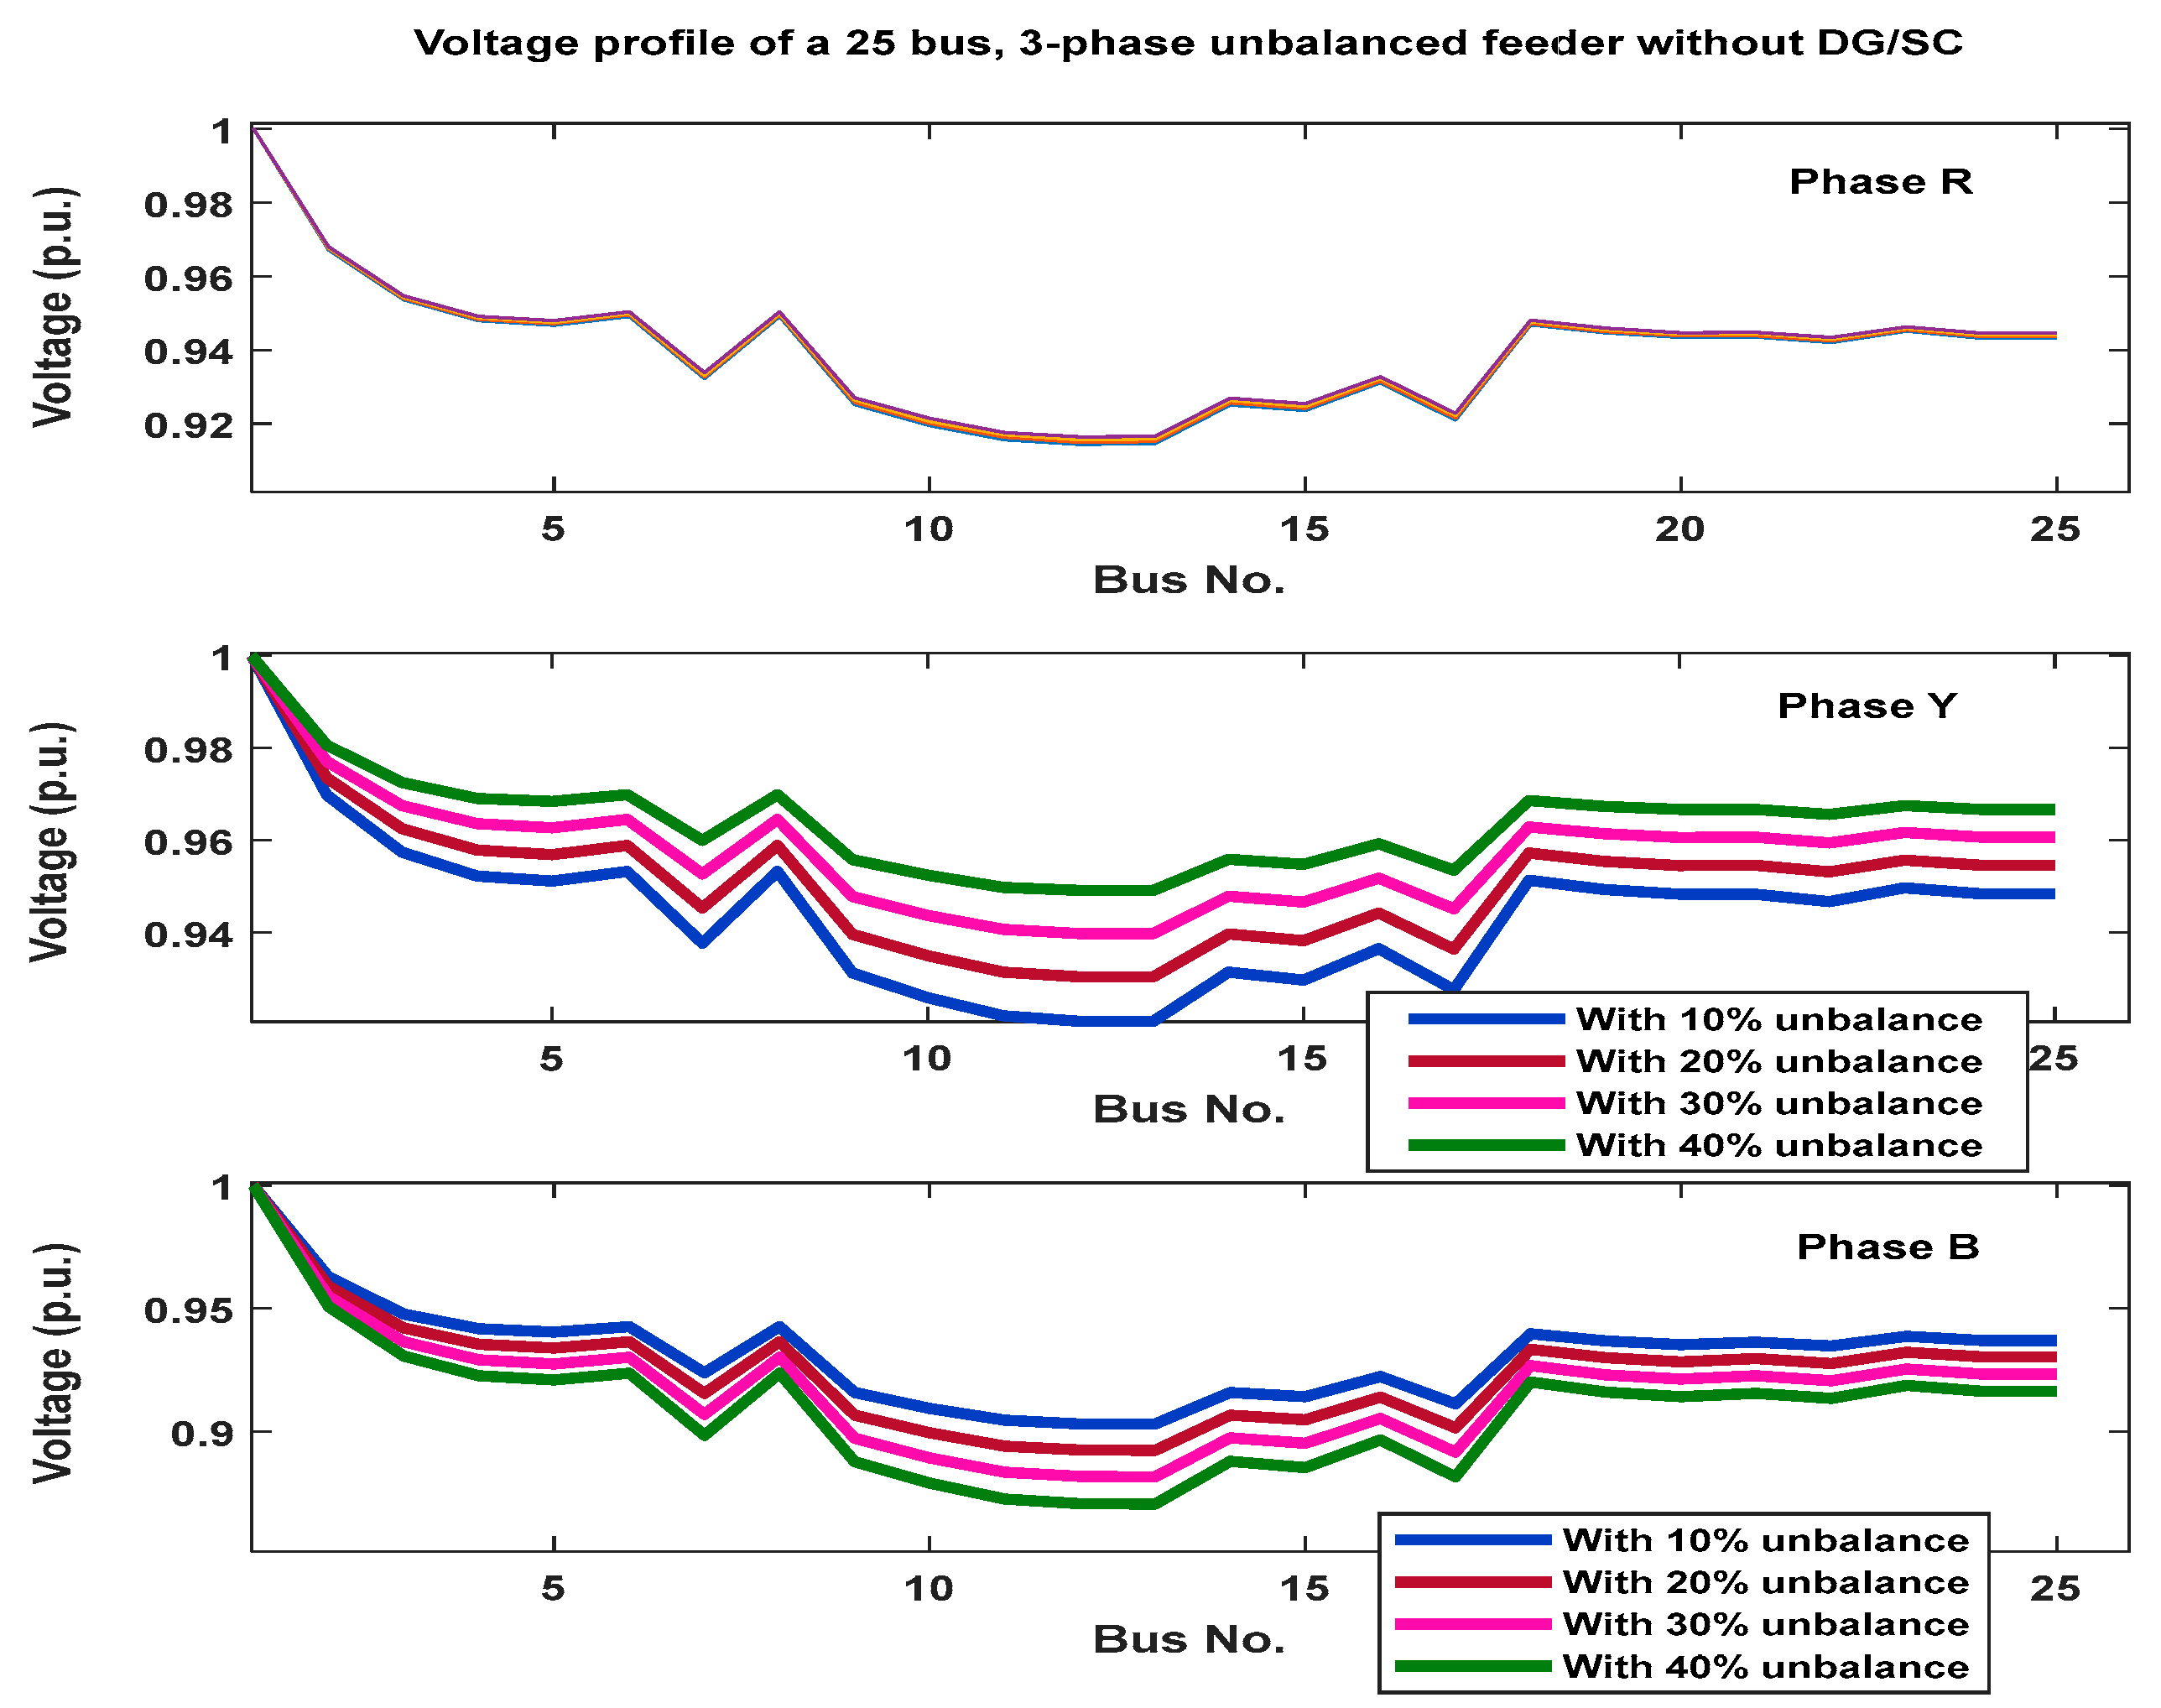
In this case, the percentage of load unbalance is taken in steps of 10%, 20%, 30%, and 40% to observe the effect of unbalance in the system without DG/SC integration. With 10% in the load unbalance, the total load of phase R is 1333.8 kVA, phase Y is 1226.2 kVA, and phase B is 1465.9 kVA; with 20% in the load unbalance, the total load of phase R is 1333.8 kVA, phase Y is 1089.96 kVA, and phase B is 1599.23 kVA; with 30% in the load unbalance, the total load of phase R is 1333.8 kVA, phase Y is 953.71 kVA, and phase B is 1732.50 kVA; and with 40% in the load unbalance, the total load of phase R is 1333.8 kVA, phase Y is 817.47 kVA, and phase B is 1865.77 kVA, with power factor (PF) = 0.8.
Table 2 presents voltage magnitudes (VRph, VYph, and VBph in p.u.) without DG/SC.
Figure 7 shows the voltage profile of 25-bus unbalanced 3-phase radial feeder networks without DG/SC using a PMU setup.
From the test results of scenario 1, as there is no change in load, the voltage profile of phase-R remains the same compared with the other two phases of the 3-phase feeder. The voltage profile of phase Y improved as the unbalance percentage increased, whereas the phase-B voltage magnitude profile was reduced with the increase in the percentage unbalance. Despite improvements in some phase voltage profiles, these unbalances caused some node voltage to fall below specifications, increasing the total power loss of the system.
Also, the analysis is being extended further by calculating the voltage and current unbalance factors of the above cases, which are tabulated in
Table 3. It is noticed that the voltage unbalance factors are within the standard limits (i.e., <3%), but the current unbalance factor is increased to above the limit (i.e., <20%) in one of the cases as the load unbalance increases. The corresponding voltage profile of the 25-bus, 3-phase unbalanced feeder under various unbalance levels without DG/SC integration is shown in
Figure 8.
4.2. Scenario2—With DG Integration
In this scenario, the percentages of load unbalance are taken as 30% and 40%, respectively, and DGs are incorporated as needed at each step of change in unbalance.
Table 4 displays the real power (Pr), apparent power (Py), and reactive power (Qr, Qy, and Qb) generated by each Distributed Generator (DG) for each of the specified unbalanced percentages (30% and 40%).
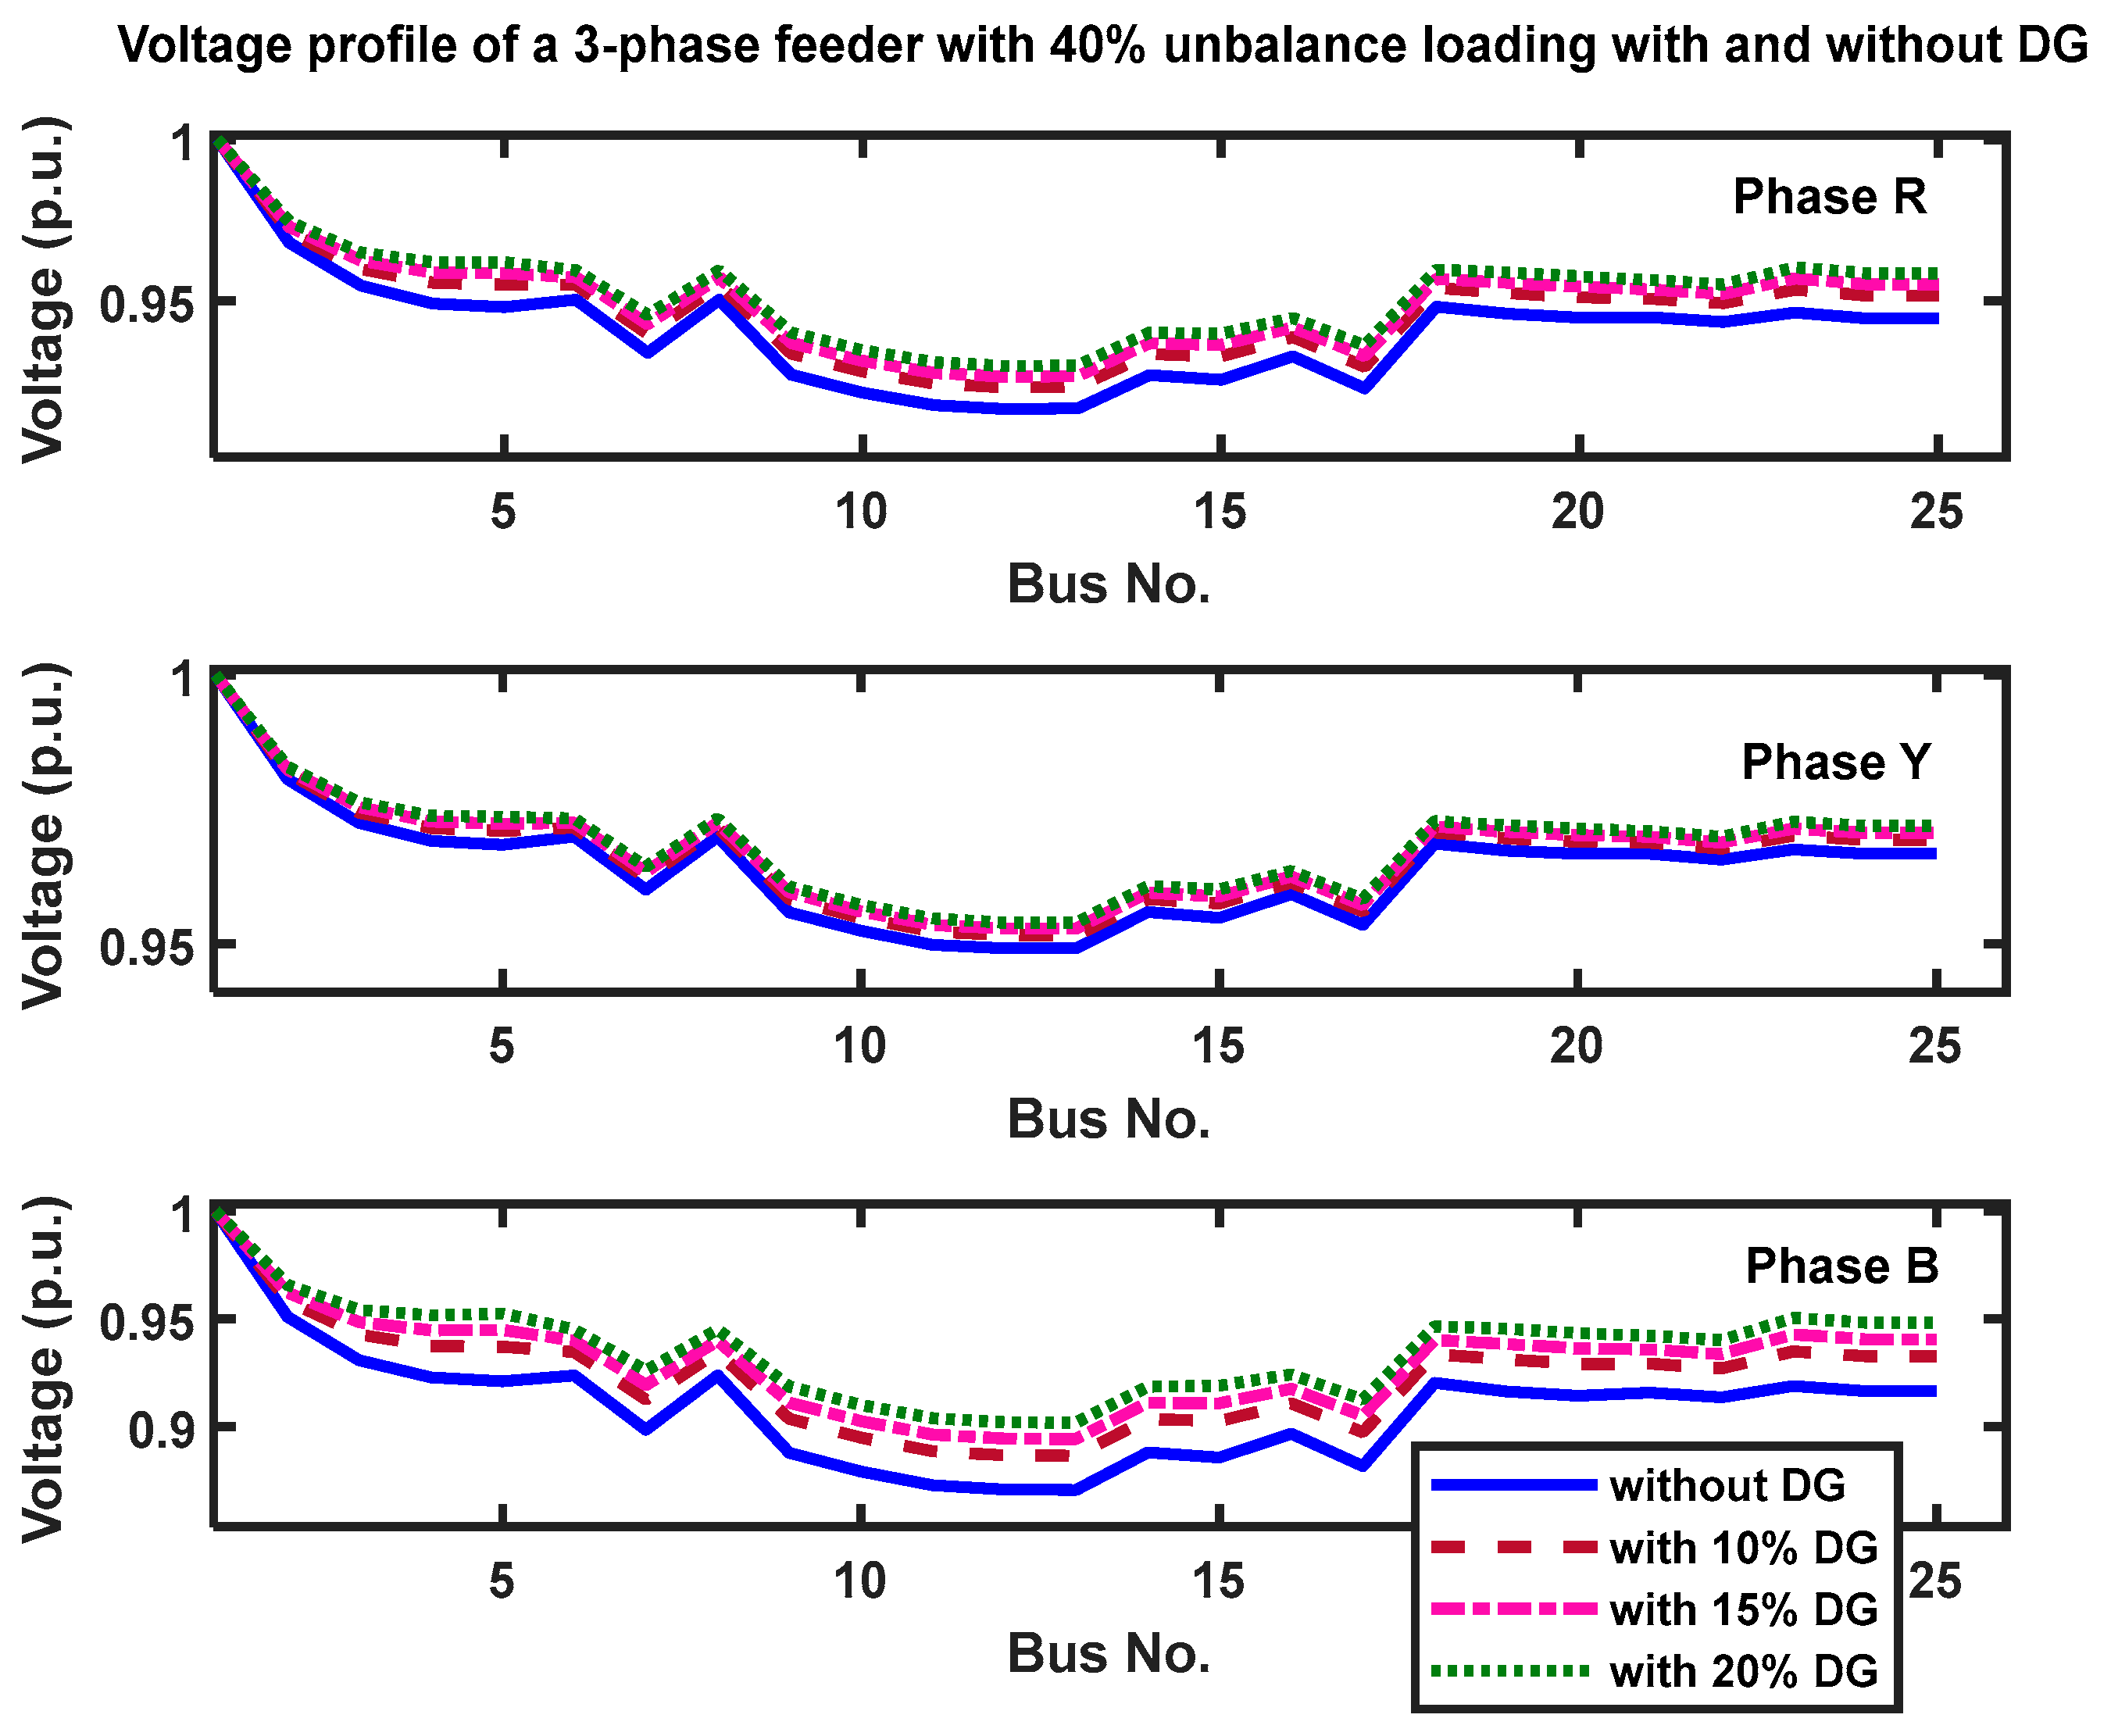
Figure 9 and
Figure 10 show the voltage profile,
Table 5 and
Table 6 compare voltage magnitude measurements (VRph, VYph, and VBph in p.u.), and
Table 7 and
Table 8 compare the voltage and current unbalanced factors of the test system with and without DG considering 30% and 40% unbalanced loading, whereas
Table 8 presents the total power loss of the network.
Table 5 represents the voltage magnitude (p.u.) results of the test system with 30% unbalanced loading, DG using PMU measurement. The table illustrates voltage magnitude results for a test system under unbalanced loading conditions, incorporating Distributed Generation (DG) at varying levels (10%, 15%, and 20%). It compares voltage magnitudes (VRph, VYph, and VBph) with and without DG. Through these comparisons, the impact of DG integration on system stability and voltage regulation can be observed, offering insights into the effectiveness of DG in mitigating voltage fluctuations and enhancing system performance under different loading conditions.
Table 6 provides data examining voltage and current unbalance factors under a 30% unbalanced loading scenario, while varying the levels of Distributed Generation (DG) penetration. It compares these factors across different DG penetration levels: without DG/SC, with 10% DG, 15% DG, and 20% DG. This comparison allows for an assessment of how the integration of DG impacts both voltage and current unbalance factors, providing insights into the effectiveness of DG in mitigating unbalance issues within the system.
Table 7 presents voltage magnitude results per unit (p.u.) obtained from PMU data under 40% unbalanced loading, both with and without Distributed Generation (DG). It compares voltage magnitudes for Red (VRph), Yellow (VYph), and Blue (VBph) phases across different DG penetration levels (0%, 10%, 15%, and 20%). This comparison enables an assessment of how DG integration influences voltage stability and regulation amidst unbalanced loading conditions.
Table 8 provides data that outline the voltage profile of a 3-phase feeder under a 40% unbalanced loading condition, comparing scenarios with and without Distributed Generation (DG). It further examines voltage and current unbalance factors across various DG penetration levels (0%, 10%, 15%, and 20%). This comparison allows for an assessment of how the integration of DG impacts the voltage profile and unbalance factors, providing insights into the effectiveness of DG in mitigating unbalance issues within the feeder system.
Table 9 presents total power loss data for a 25-bus, unbalanced 3-phase radial distribution system with varying levels of Distributed Generation (DG) integration. The first column denotes the percentage of unbalanced loading, with variations of 30% and 40%. The subsequent columns represent different levels of DG penetration. The second column shows the net real power loss in kilowatts (kW), while the last column displays the net reactive power loss in kilovolt-amperes reactive (kVAR). This data allows for an analysis of how DG integration impacts power losses under different degrees of unbalanced loading, providing insights into the system’s efficiency and performance.
The following are the main conclusions drawn from the test results of scenario 2:
- (a)
Voltage Profile Improvement: The voltage profiles of all three phases in the distribution system significantly improve by introducing DGs at different penetration levels. As a result, the system’s voltage levels are more consistent and closer to the intended nominal values.
- (b)
Reduction in Total Power Losses: The total power losses within the distribution network are significantly reduced as the DG penetration levels rise. DGs assist in reducing losses by producing power closer to the load centers.
- (c)
Compliance with Unbalance Limits: The voltage and current unbalance factors remain within the prescribed limits, demonstrating that the distribution system runs within the acceptable limits.
Nevertheless, some node voltages in each phase are still below the lower limit. Hence, a further improvement in voltage regulation is desirable.
4.3. Scenario3—With DG and SC Integration
In scenario 3, the percentage of load unbalance is considered the same as in previous cases. SCs with ratings of 300 kVAR, 150 kVAR, and 300 kVAR have been installed at buses 8, 10, and 18 together with the existing DGs to improve the system conditions further from the above two scenarios.
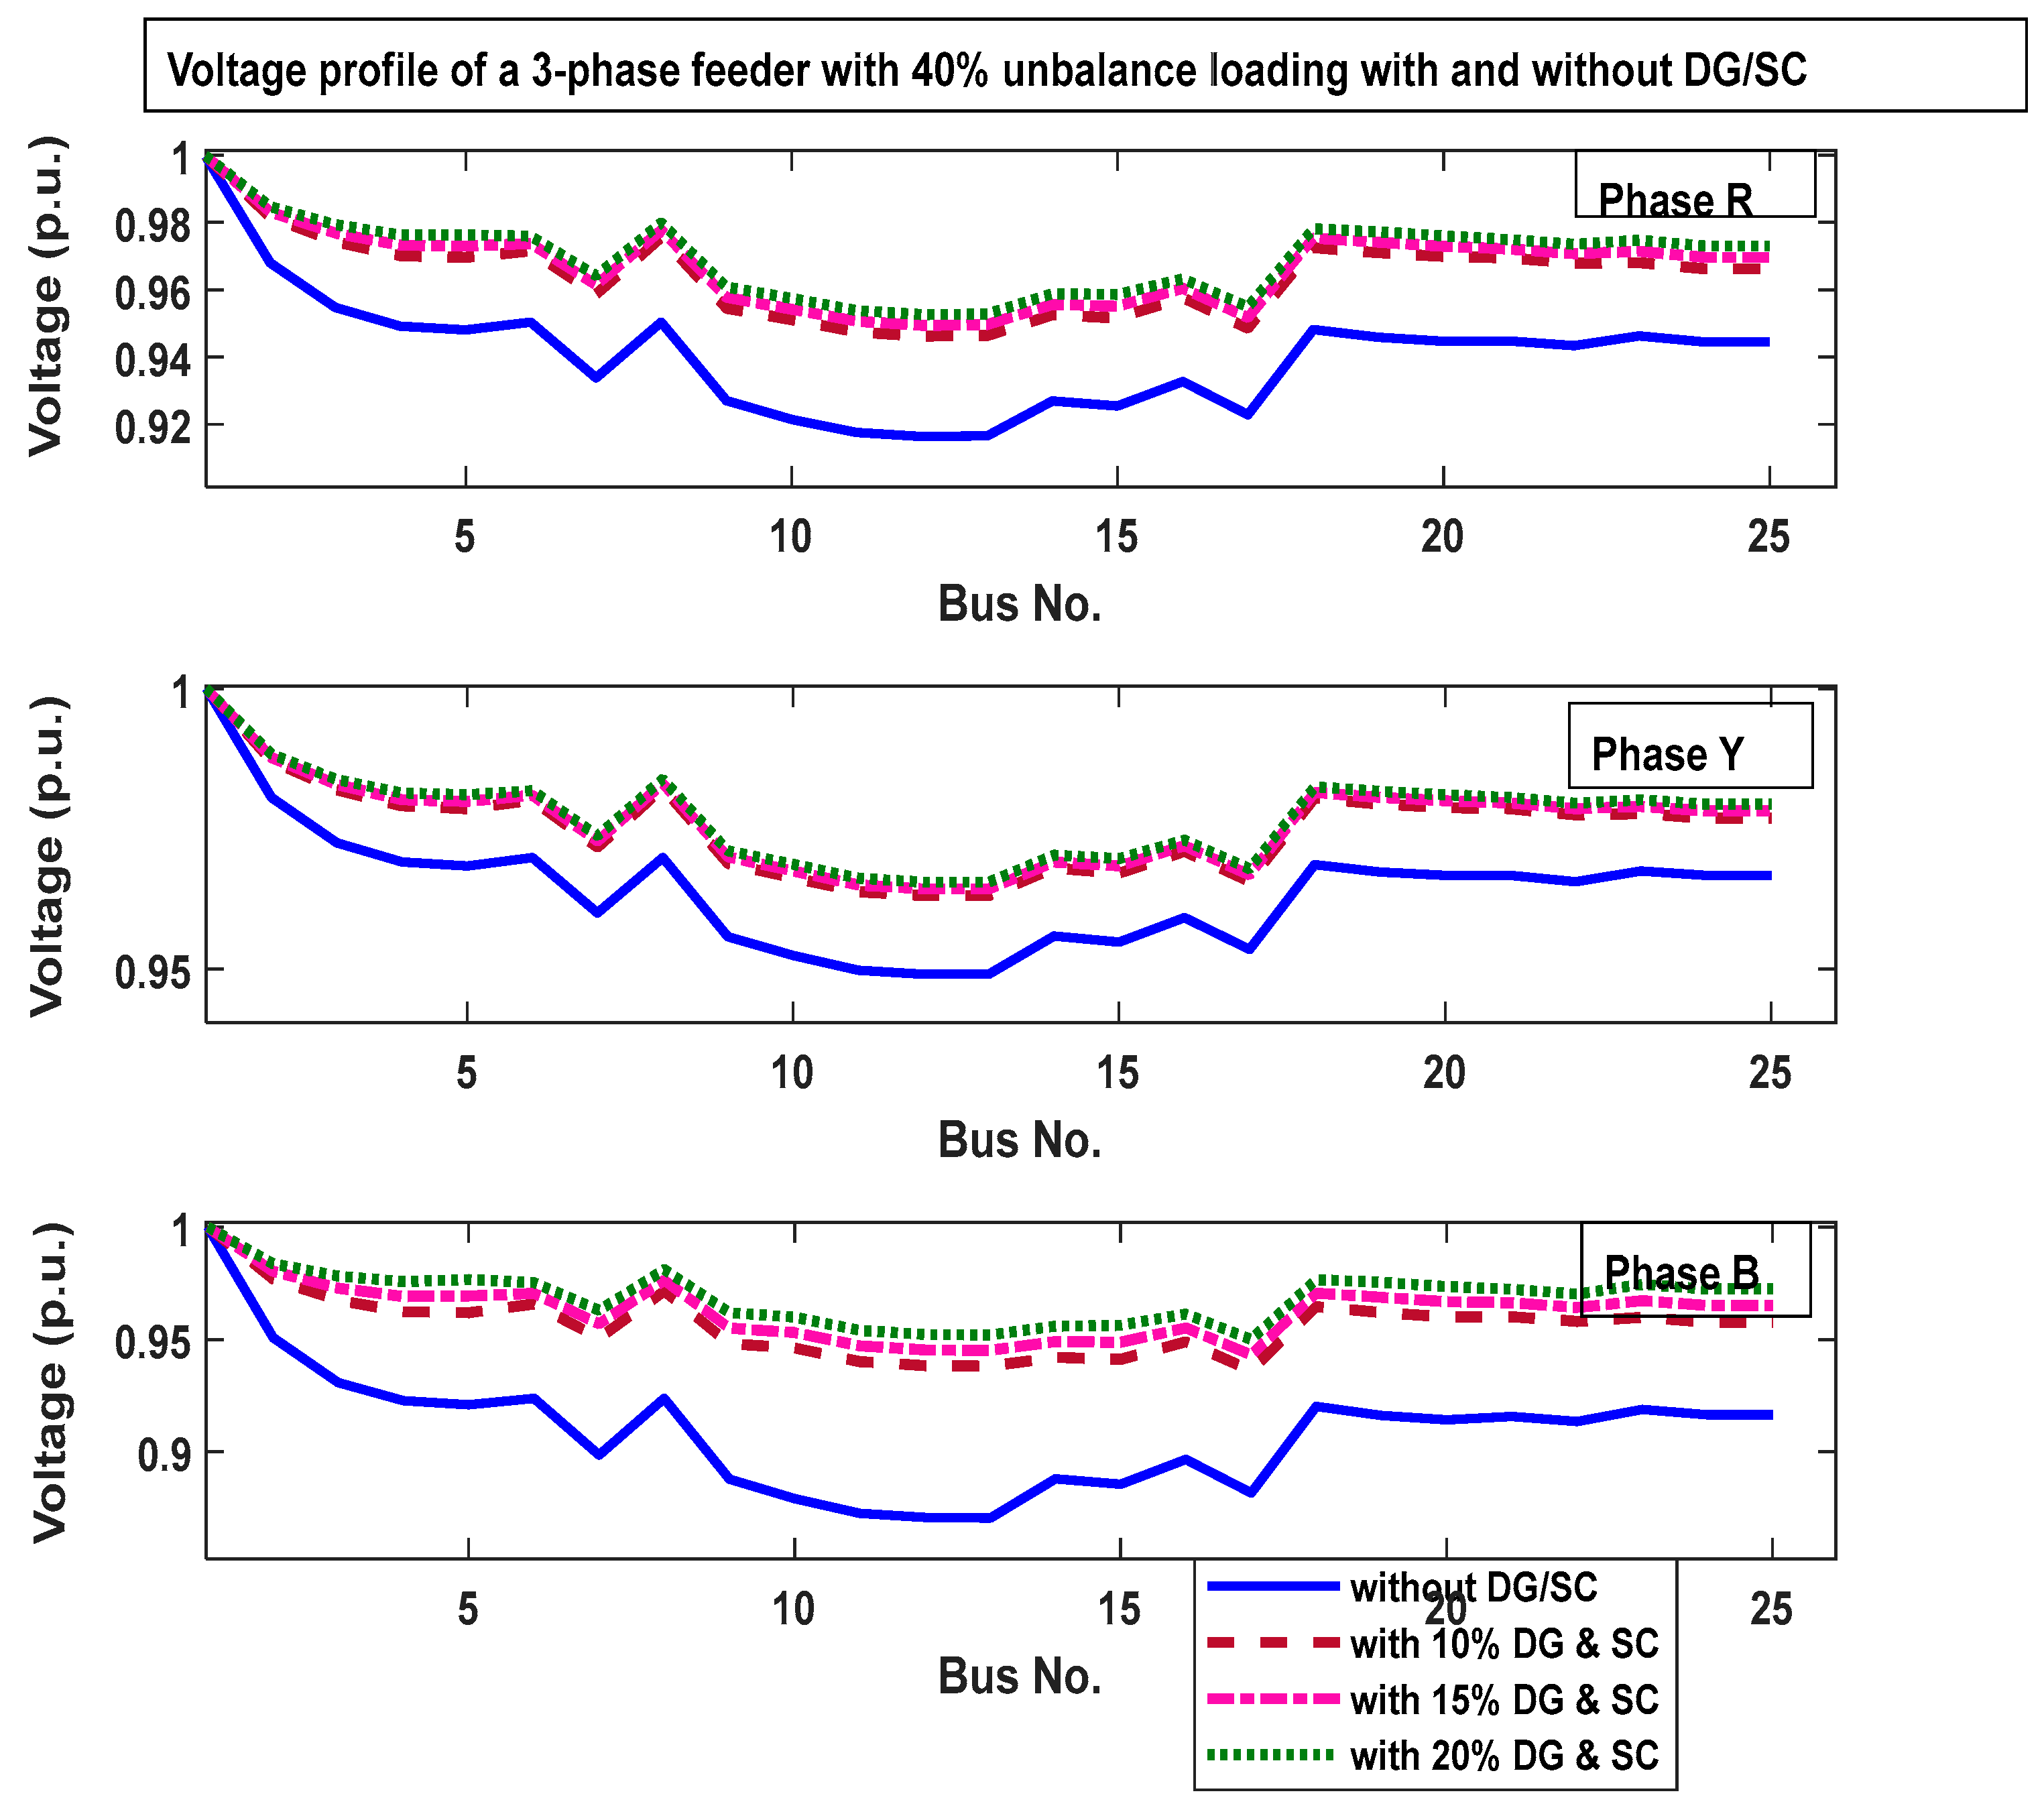
Figure 11 and
Figure 12 depict the voltage profile, while
Table 10 and
Table 11 compare voltage magnitude (VRph, VYph and VBph in p.u.) measurements, and
Table 12 and
Table 13 compare the voltage and current unbalanced factors of the test system with and without DG under 30% and 40% unbalanced loading, respectively.
Table 14 represents the network’s total power loss.
Table 10 presents voltage magnitude results (in p.u.) from PMU data in a system experiencing 30% unbalanced loading. It integrates Distributed Generation (DG) and shunt capacitor (SC). The first column shows voltage magnitudes for Red (VRph), Yellow (VYph), and Blue (VBph) phases without DG or SC. Subsequent columns display voltage magnitudes with increasing DG and SC integration (at 10%, 15%, and 20%). This data enables analysis of how DG and SC affect voltage stability and regulation under unbalanced loading, offering insights into their efficacy in enhancing system performance.
Table 11 presents voltage and current unbalance factors under a 30% unbalanced loading scenario, incorporating Distributed Generation (DG) and shunt capacitors (SC) at various penetration levels. The first column represents unbalance factors without DG or SC, while subsequent columns denote increasing levels of DG and SC integration (10%, 15%, and 20%). This data allows for an assessment of how the combination of DG and SC influences both voltage and current unbalance factors, providing insights into the effectiveness of DG and SC in mitigating unbalance issues within the system.
Table 12 presents voltage magnitude data in per unit (p.u.) obtained from Phasor Measurement Unit (PMU) readings. It analyzes the impact of integrating Distributed Generation (DG) and shunt capacitors (SC) under 40% unbalanced loading. The baseline column shows voltage without DG or SC. Subsequent columns indicate voltage with increasing DG and SC levels (10%, 15%, and 20%). This data aids in understanding the influence of DG and SC on voltage stability and regulation.
From the results of the three scenarios, it is observed that, without voltage regulating devices, as the load unbalancing increases in the distribution network, most of the node voltage magnitudes are below the lower limit. Though the voltage unbalance factors are within acceptable limits, the current unbalance factors are beyond the limit. When DGs and SCs are integrated into the network, considerable losses are minimized. The voltage profile is improved by bringing all node voltage magnitudes within limits. Also, the percentages of voltage and current unbalance factors are dropped compared to the unregulated scenario.
Table 13 presents voltage and current unbalance factors under a 40% unbalanced loading scenario, considering the integration of both Distributed Generation (DG) and shunt capacitors (SC) at various penetration levels (10%, 15%, and 20%). The first column represents unbalance factors without DG or SC, while subsequent columns display results with increasing levels of DG and SC integration. This data allows for an evaluation of how the combination of DG and SC impacts voltage and current unbalance factors, providing insights into their effectiveness in mitigating unbalance issues within the system. The
Table 14 illustrates the total power loss data for a 25-bus unbalanced 3-phase radial distribution system with integrated Distributed Generation (DG) and shunt capacitors (SC). It displays the percentage of unbalanced loading at 30% and 40%, while also presenting the net real power loss in kilowatts (kW) and net reactive power loss in kilovolt-amperes reactive (kVAR) across different levels of DG penetration. This data enables an assessment of how the integration of DG and SC impacts power losses under varying degrees of unbalanced loading, providing valuable insights into the efficiency and performance of the distribution system
The identified PMU locations for IEEE-34 or IEEE-123 bus test system and presented in
Table 15. Additionally, a validation process is conducted to ensure the accuracy and reliability of the proposed scheme. The procedure is explained in Algorithm 3 and corresponding results are given in
Table 16.
Validation involves closely examining the results produced by an algorithm. This algorithm serves the primary goal of confirming the connectivity of all buses to Phasor Measurement Units (PMUs). To do this, the buses were divided into two different vectors: one for the buses connected to the PMU and another for the ones not. A thorough inspection used a branch vector to compare every bus (Comp_vector) connected to the PMUs. The findings were then saved in a “Ver” vector (initialized as an empty vector) and then populated with the bus numbers related to PMU-connected buses. The “Ver” vector must contain all the outstanding bus (Out_bus) numbers for a system to be considered fully observable. On the other hand, an imperfect match signifies a deficiency in total observability, implying possible errors in the determined ideal PMU positions.
| Algorithm 3: Validation of Optimal PMU Placement Solution of Unbalanced radial networks |
Input: Number of nodes (n), branches (b), PMU locations (p), and outstanding buses (o). Initialize variables j = 1, o = 1, k = 1. Iterate through buses: a. If PMU[j] = 1: i. Store j in PMU bus[k]. ii. Increment j and i. b. Else, store j in Out bus[o]. i. Increment o and j. Check connectivity between PMU buses and branches: a. Initialize j, a, and k. b. Iterate through PMU buses and branches: i. If PMU bus[j] matches branch [k,2], store branch[k,1] in Ver[a]. ii. Increment a and k if there is a match. c. If k ≤ b, repeat step 4b. Check connectivity between outstanding buses and branches: a. Initialize j, a, and k. b. Iterate through outstanding buses and branches: i. If Out bus[j] matches Ver[k], store Out bus[j] in Comp[a]. ii. Increment a and k if there is a match. c. If k ≤ o, repeat step 5b. Verify system observability: a. If Comp equals Out bus, the system is thoroughly observable. b. Otherwise, the system is not thoroughly observable
|
4.4. Robustness and External Corroboration Across Test Systems
The proposed MAS controller relies on local measurements (positive/negative-sequence voltage V1, V2) and agent-level arbitration rules, with actuation through DG reactive power set-points and shunt capacitors. The sensitivity matrix used for selection depends on feeder impedance s and injections but does not require feeder-specific controller gains. Consequently, for radial distribution networks with per-section R/X in typical ranges and unbalance ≤5%, the following qualitative behavior holds: (i) minimum phase voltage improves monotonically with DG penetration up to the point of local over-voltage constraints; (ii) moderate SC sizing (≈10–15% of local kvar) reduces phase-spread without inducing excessive circulating reactive power; and (iii) under load growth up to ≈1.2 p.u., MAS coordination maintains Vmin within statutory limits provided DG support ≥20% of peak load.
Published studies on IEEE 33- and 69-bus feeders employing MAS-based coordination and sensitivity/OPF-guided voltage control report the same trends with respect to DG penetration, unbalance level, and reactive compensation. These reports indicate improvements in minimum bus voltage and reduced inter-phase dispersion comparable to those observed in our 25-bus case. Together with the mechanism above, this supports portability of the proposed scheme to standard feeders of different sizes and impedances. We will provide full IEEE 33-/69-bus scenario sweeps (voltage envelopes, losses, tap actions) as an extended dataset in a follow-up technical note.
