Article

Hydrogen Carriers for Renewable Microgrid System Applications

1
Argonne National Laboratory, Lemont, IL 60439, USA
2
Pacific Northwest National Laboratory, Richland, WA 99354, USA
*
Author to whom correspondence should be addressed.
Energies 2025, 18(21), 5775; https://doi.org/10.3390/en18215775
Submission received: 21 September 2025 / Revised: 21 October 2025 / Accepted: 30 October 2025 / Published: 1 November 2025

Abstract

Utility-scale energy storage can help improve grid reliability, reduce costs, and promote faster adoption of intermittent sources such as solar and wind. This paper analyzes the technical aspects and economics of standalone microgrids operating on intermittent power combined with hydrogen energy storage. It explores the feasibility of using dibenzyltoluene (DBT) as a liquid organic hydrogen carrier to absorb excess energy during periods of high supply and polymer electrolyte fuel cells to generate electrical energy during periods of low supply. A comparative analysis is conducted on three power demand scenarios (industrial, residential, and office), in conjunction with three alternative energy sources: solar, wind and wind–solar mix. A mixed system of solar and wind energy can maintain an annual average efficiency above 70%, except for residential power demand, which lowered the efficiency to 67%. A balanced combination of wind and solar power was the most cost-effective option. The current levelized cost of electricity (LCOE) for industrial power demand was estimated to 15 ¢/kWh, and it is projected to decrease to 9 ¢/kWh in the future. For residential power demand, the LCOE was 45% higher due to the demand profile. In comparison, battery storage is significantly more expensive than hydrogen storage, even with future cost projections, increasing the LCOE between 60 and 120 ¢/kWh.

1. Introduction

A microgrid is a group of interconnected loads and energy resources that acts as a single controllable entity [1,2,3,4]. Because it has its own energy resources, it can disconnect from the traditional grid and operate autonomously [5,6]. Microgrids come in a wide range of sizes, from a single facility to an entire district that produces the energy that it consumes. Over 461 microgrids are currently operating across the U.S., representing 3.1 GW of installed power according to the U.S. Department of Energy (DOE) [7]. While connected to the grid, a microgrid generally operates as a single load. But it can break off from the grid and operate on its own using local energy generation when the larger grid experiences interruptions such as storms and power outages. This is called a ‘stand-alone’ or ‘island’ grid [8,9]. For microgrids in remote areas where there is no connection to the larger grid, this mode may be their only option. In the island mode, the microgrid can be powered entirely by local power assets working together, including generators, renewables, and storage, to maintain the load.
While microgrids can reduce costs, improve reliability, produce cleaner power, and, in some cases, produce revenue via market participation with the larger grid, the use of higher levels of renewable resources can be challenging. Power systems are traditionally operated with synchronous generation to ensure a resilient, cheaper, and reliable power supply [10,11,12]. However, a desire to move towards diversified energy resources has enticed consumers and utilities to install more solar photovoltaic (PV) and wind-based generation. These energy sources are intermittent in nature and come with the challenges of power management, load balancing, grid security, and reliability of power supply [13,14,15]. The use of alternative technologies becomes especially challenging for the consistent operation of these microgrids, especially in the island mode [16,17]. Their effective operation and control are critical for maintaining stability in both grid-connected and islanded modes, optimizing resource utilization, and ensuring power quality. Recent studies highlight the growing role of advanced control strategies—including multi-agent systems, artificial intelligence, and predictive optimization—improving microgrid flexibility and efficiency [18,19]. At the same time, comprehensive reviews emphasize persistent challenges in architectures, protection, and scalability, underscoring the need for robust, adaptive control frameworks to fully realize the potential and cost effectiveness of microgrids in sustainable power systems [20,21].
To address this challenge, energy storage is needed [22,23]. For example, excess energy generation in the middle of the day is a concern in solar generation. Solar energy must either be curtailed or, in some way, stored. Another concern is the need for energy resources to ramp up quickly to meet massive power swings. In particular, the steep ramp in load demand and declining solar generation between about 5 and 8 p.m. pose challenges for the current electricity market structure [24,25,26]. Finally, there is the challenge of energy availability when renewables are not produced, either at night or on cloudy days for solar power and during calm days or even calm seasons for wind power.
Technologies that can serve the bulk energy storage landscape are limited: Pumped hydro and compressed air technologies are location-limited, and new deployment locations can be difficult to identify and license [27,28,29]. Battery technologies are limited by size and economics [30,31,32]. Studies have shown that the economics for large energy storage are not viable for batteries beyond 6–12 h [33]. Hydrogen-based energy storage has emerged as a promising complement to batteries, offering long-duration storage, seasonal balancing, and sectoral coupling opportunities [34]. Unlike conventional storage, hydrogen enables both electricity regeneration via fuel cells and cross-sector utilization in transport and industry, positioning it as a versatile energy carrier for future microgrids [35]. Recent research and operational projects highlight how hydrogen storage enhances microgrid reliability by supporting multi-day and even seasonal energy bridging, thus mitigating the volatility of renewables and meeting the rigorous resilience requirements of modern power systems [36,37]. Notably, the Calistoga Resiliency Center in California—North America’s largest utility-scale hybrid energy storage microgrid—integrates advanced hydrogen fuel cells with lithium-ion batteries and an intelligent energy management system (EMS) to deliver at least 48 h of continuous power, leveraging on-site liquid hydrogen tanks for refueling without service interruption [38]. Advanced control strategies, such as hierarchical economic model predictive control frameworks, have also been proposed to optimize the dynamic interaction between hydrogen devices, batteries, and renewable generation, improving both efficiency and cost-effectiveness [39]. Collectively, these advances underscore hydrogen’s role in extending the operational flexibility of renewable microgrids beyond the capabilities of short-duration storage alone.
The challenge of renewable microgrids becomes one of storing large quantities of hydrogen in a form that can easily be retrieved to be converted back into electricity. Hydrogen storage as a gas is the simplest approach, but achieving reasonable density requires that it is compressed to high pressures (350–700 bar) [40,41,42]. Liquefying hydrogen at 20 K increases volumetric density to ~71 kg H2/m3, enabling larger-scale transport and use in centralized hubs. The drawback is the high energy cost of liquefaction, consuming 30–40% of hydrogen’s energy content, along with boil-off losses and the need for specialized cryogenic infrastructure [43,44]. Significant research has emerged on ammonia’s application for hydrogen storage. The interest of ammonia as a chemical carrier stems from a very high volumetric hydrogen density (~108 kg H2/m3 equivalent) and benefits from a global infrastructure of ports, pipelines, and storage tanks [45,46]. However, there have been few available ammonia decomposition technologies for producing hydrogen, which is one of the key limitations for ammonia to be used as a hydrogen carrier [47,48]. Thermal–chemical decomposition is the most mature ammonia decomposition technology, but it requires high temperatures and/or pressure [48]. Some limitations, such as slow response time from a cold start and toxicity, make it unsuitable for distributed power generation and modular applications near populated areas [49].
This study evaluates the alternate approach of storing H2 reversibly in chemical bonds as liquid organic hydrogen carriers (LOHCs) [50,51]. LOHCs store hydrogen through reversible hydrogenation and dehydrogenation reactions. These compounds can be divided into two categories, two-way and one-way carriers, as shown in Table 1. With the two-way carrier, materials can be recycled many times, reducing the impact of the cost of the carrier. The one-way carrier requires transport only to its point of use and does not require its transport back to the regeneration facility [50]. However, it must be produced for each cycle. A variety of liquid hydrogen carriers have been studied to identify compounds that can produce hydrogen and, if necessary, be regenerated under modest temperature and pressure conditions with high thermal efficiency conversion. In general, these compounds are less flammable and more easily handled than hydrogen gas or liquid hydrogen. Dibenzyltoluene, for example, is predominantly utilized as a heat-transfer fluid for indirect heating and cooling across a range of industrial processes, such as those found in the chemical, plastics, and heat recovery sectors. In addition, multiple pilot-scale demonstrations have confirmed the practicality of DBT for hydrogen storage applications. Notably, Hydrogenious LOHC Technologies has implemented containerized hydrogenation–dehydrogenation systems based on DBT, facilitating the safe storage and transportation of hydrogen on a multi-ton scale [52]. It demonstrates outstanding thermal stability, is safe and non-volatile, and possesses a high boiling point of 390 °C, making it compatible with current fuel logistics [53,54]. In contrast to Class 1 flammable liquids like MCH and Toluene, DBT tanks are classified as Class IIIB, which allows for reduced stand-off distances and eliminates the need for dikes. This classification can substantially lower both the spatial requirements and the overall cost of implementing a DBT-based hydrogen carrier system, making it a more efficient option compared to more flammable alternatives or hydrogen itself [55]. It offers a volumetric density of ~57 kg H2/m3, higher than compressed hydrogen, and can be cycled many times without significant degradation.
The objective of this study is to evaluate the potential application of a liquid carrier-based hydrogen storage system at a renewable wind and/or solar energy farm to improve dispatchability and reduce power curtailment or deficits. This study advances beyond our previous work by shifting the focus from conventional battery-based storage analysis to a comprehensive evaluation of liquid organic hydrogen carriers (LOHCs) as a scalable solution for renewable energy dispatchability. Unlike earlier studies that focused on battery economics and performance, this work introduces a modular LOHC-based hydrogen storage system tailored for a 10 MW microgrid, with scalability to larger systems. It uniquely integrates techno-economic modeling with dynamic response characterization of the H18-DBT pair under intermittent renewable supply and demand transients. Furthermore, it presents a comparative framework that includes geologic hydrogen storage options (LRC, salt caverns, and buried pipes) and quantifies trade-offs in capacity factor, availability, and hydrogen inventory. This holistic approach provides new insights into the operational and economic viability of LOHCs in grid-scale renewable integration, offering a novel pathway distinct from prior battery-centric analyses.

2. Materials and Methods

2.1. System Configuration

The concept of a renewable islanded microgrid with energy storage consists of a wind or solar PV plant that produces intermittent power and supplies it to an isolated microgrid, such as a residential community, an office complex, or an industrial site. If the plant generates more power than the demand, the excess amount is fed to a low-temperature polymer electrolyte membrane water electrolyzer (PEMWE) to produce hydrogen, which is stored in a liquid carrier. During periods where the renewable plant produces zero or insufficient power, the liquid carrier is dehydrogenated to supply H2 to a polymer electrolyte membrane fuel cell (PEMFC) system that produces supplemental power required to balance the load on the grid.
The conventional stationary LOHC storage setup includes separate hydrogenation and dehydrogenation reactors. The hydrogenation reactor operates at low temperature/high pressure, and the dehydrogenation reactor operates at high temperature/low pressure to maximize thermodynamic driving forces for the respective reactions [56]. Flexible operation of such a two-reactor setup is limited by heating times and energies required to bring the respective reactors from standby conditions to operational conditions [57,58,59,60,61].
Jorschick et al. [59] demonstrated a dibenzyltoluene (H0-DBT)/perhydro dibenzyltoluene (H18-DBT) LOHC that can be hydrogenated and dehydrogenated in a single reactor with Pt on alumina catalyst at temperatures above 220 °C. It offers the advantages of a simpler LOHC storage layout and faster dynamics in switching from hydrogen charging to hydrogen release by just adjusting the pressure level in the reactor.
Based on the findings by Jorschick et al. [59,61], we formulated a system model for a renewable plant with DBT hydrogen storage, as shown in Figure 1. The overall system consists of four main components: (a) a renewable energy farm (wind, solar, or a combination of wind and solar), (b) a low-temperature PEM electrolyzer, (c) a low-temperature PEM fuel cell, and (d) the hydrogen storage system. The electrolyzer produces hydrogen at 30 bars, which is dried using temperature swing adsorption (TSA) and fed to the LOHC reactor for hydrogenation of DBT. The drying step is important because studies have shown that even a small amount of water in hydrogen causes catalytic side reactions with H0-DBT/H18-DBT, leading to the formation of CO, CO2, and CH4 [62,63,64,65].
The DBT storage system is centered around a single batch reactor, as illustrated in Figure 1. This reactor operates at a nominal temperature of 290 °C, with permissible limits between 270 °C and 310 °C [53]. These temperature boundaries are chosen to maximize the efficiency of both hydrogenation and dehydrogenation reactions [53]. Hydrogenation, an exothermic process with a ΔH of 65 kJ/mol-H2, permits the reactor’s pressure and temperature to rise to 30 bar and 310 °C, respectively, before cooling is initiated. For the dehydrogenation of H18-DBT, the reactor pressure decreases from 30 to 1.5 bar. As dehydrogenation is endothermic, additional heat—typically provided by a natural gas burner or, alternatively, hydrogen fuel—is required if the temperature falls below 270 °C.
During dehydrogenation, the product hydrogen is cooled to 70 °C and passes through a condenser at 40 °C to condense DBT vapor. Due to the low vapor pressure of DBT, essentially all DBT is condensed (hydrogen contains less than 10 ppb of DBT at the exit of the condenser). A purification system is included in the system to remove traces of DBT in the hydrogen, along with other trace impurities. Hydrogen is compressed to 10 bar using a three-stage compressor and is purified to fuel cell grade in a four-bed pressure swing adsorption (PSA) unit [66]. The hydrogen recovery is 90%, and the unrecovered hydrogen from the PSA tail-gas is burned to provide supplemental heat for the dehydrogenation process. The capacity of a large-scale, high-pressure batch reactor is restricted to 30,000 gallons (114 m3) [67,68]. A 10 MW system requires 30–110 parallel batch reactors, depending on the power demand profile and source of renewable energy. The balance of plant (BOP)—heat exchanger, condenser, compressor, and separation system—is shared among all reactors. The DBT reactor also serves as the LOHC storage tank.

2.2. Fuel Cell, Electrolyzer, and Battery Performance

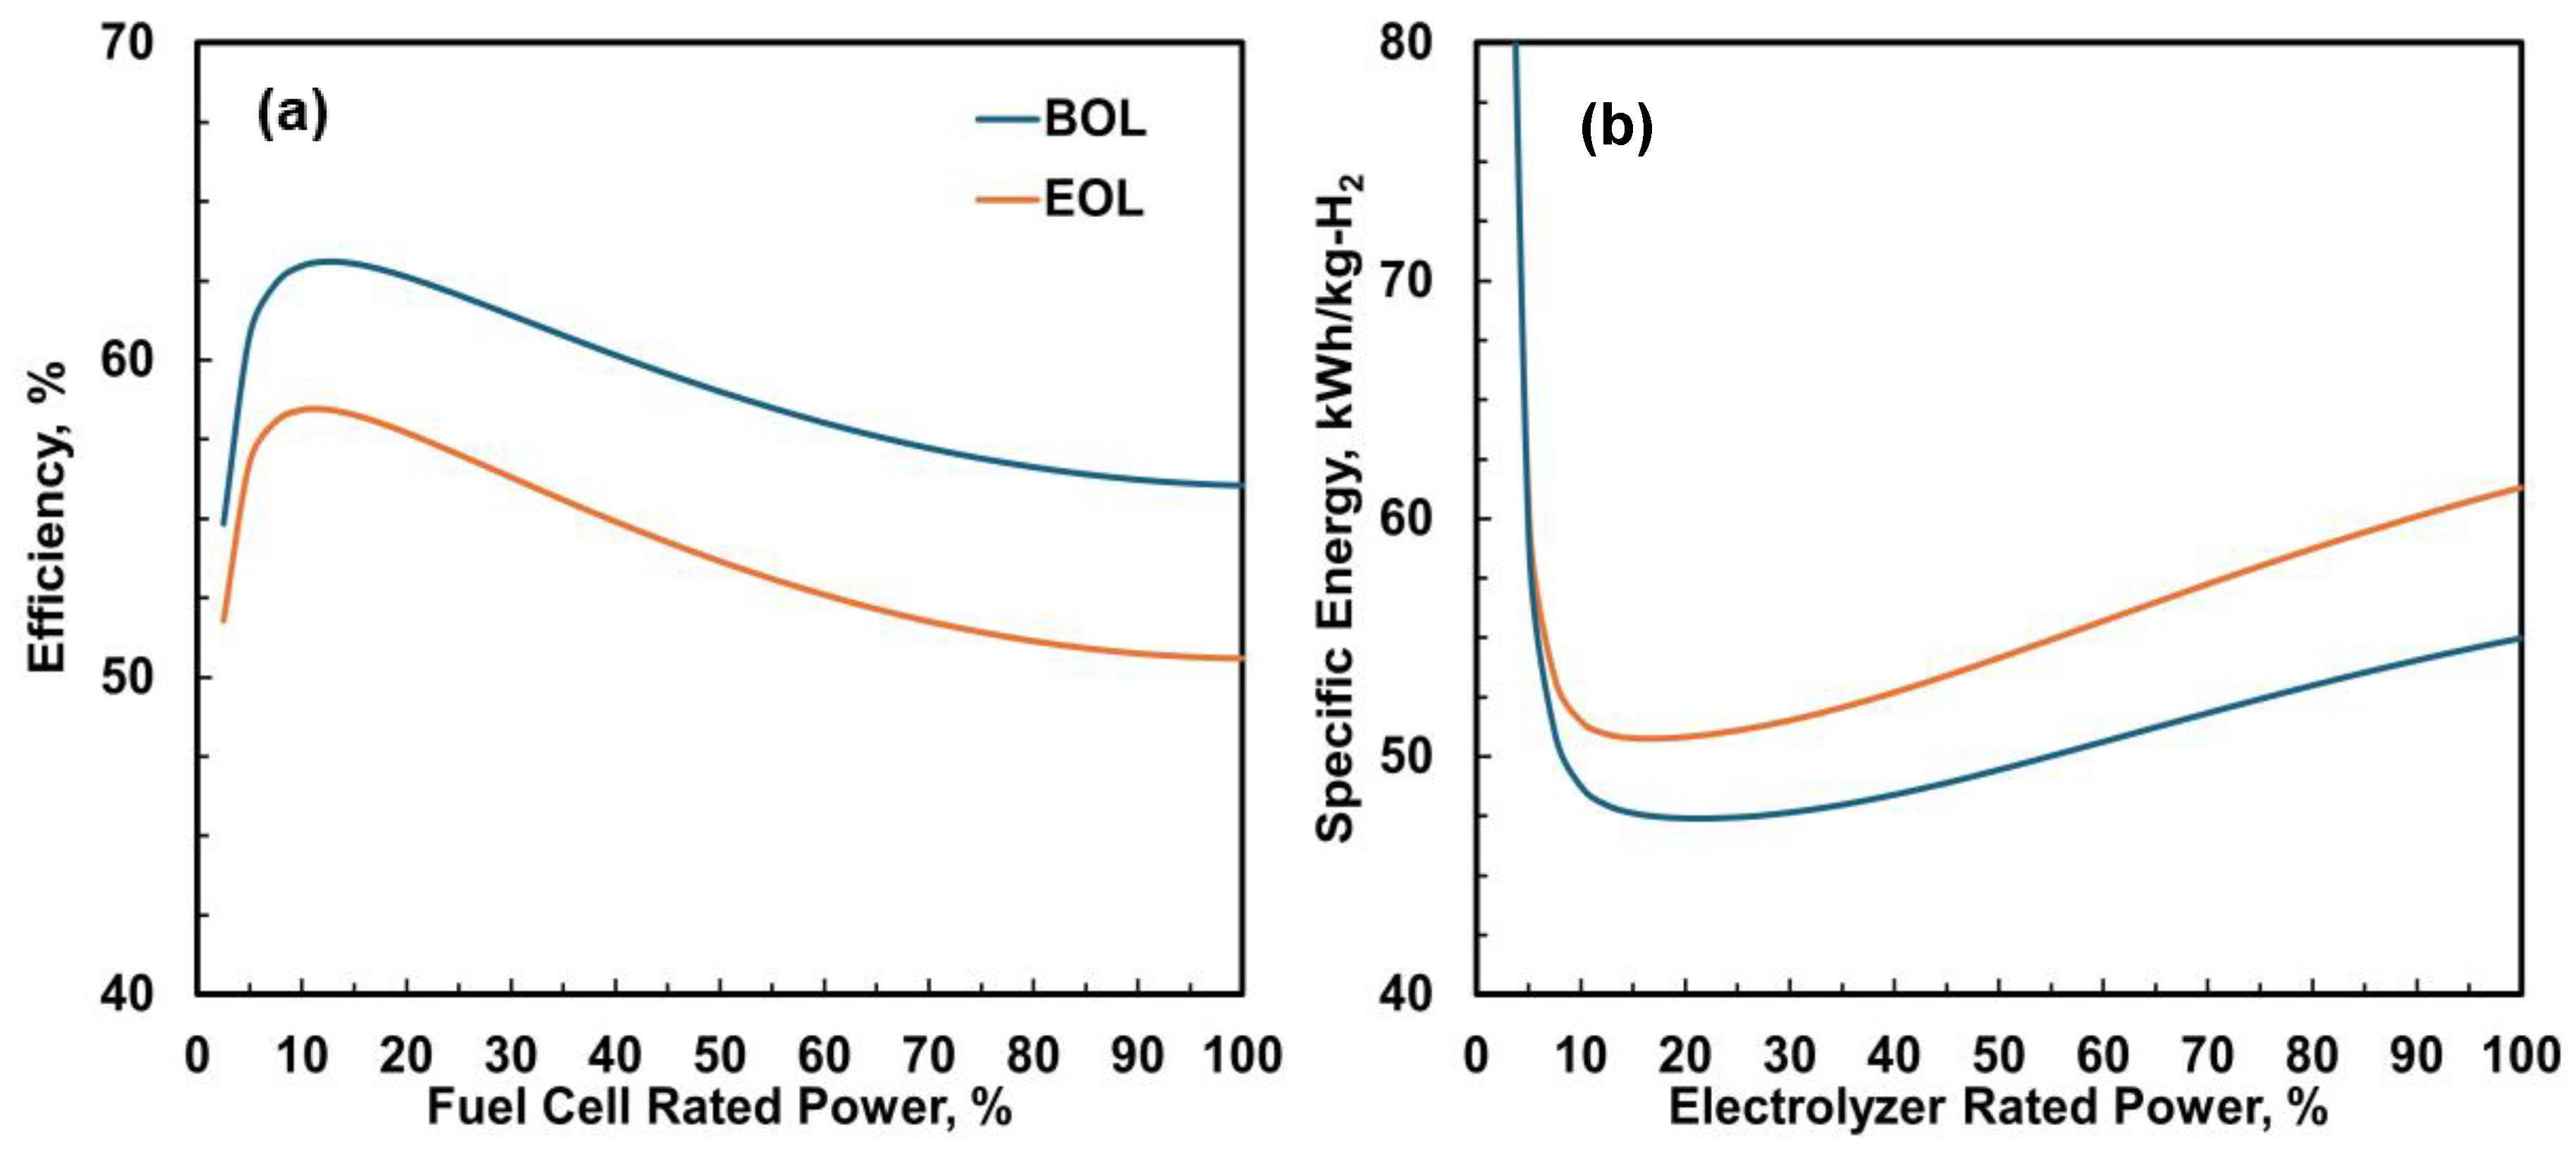
The polymer electrolyte fuel cell system (FCS) in this study is designed according to the targets for heavy-duty trucks, including liquid stack coolant, air management, active fuel recycling, and no external humidifier. Complete model equations and assumptions for the system model can be found in previous publications [69,70,71]. The FCS is scaled to meet the microgrid’s power demands at end-of-life (EOL), ensuring that the required power outputs are consistently achieved throughout the fuel cell stack’s operational life. Efficiency curves of the PEMFC system as a function of power percentage at beginning-of-life (BOL) and EOL are illustrated in Figure 2a. A decline in fuel cell efficiency from BOL to EOL is evident and attributed to catalyst surface area loss, identified as the primary mode of degradation impacting the stack’s longevity. Additionally, the practice of “voltage clipping,” commonly utilized in current fuel cell vehicles, was examined. Operating at higher voltages can accelerate degradation, but by implementing voltage clipping to prevent operation above peak efficiency points, it is possible to enhance efficiency across the duty cycle and extend the stack’s durability to 30,000 h before replacement becomes necessary.
Figure 2b presents the overall performance of the electrolyzer in terms of specific energy consumption in kWh/kg-H2 at 30 bar. System-specific energy consumption is defined as the ratio of the lower heating value (LHV) of H2 exiting the system boundary downstream of the TSA unit for water removal to the total external power supplied to the system, including the transformer/rectifier and other BOP components [72]. Energy consumption is dependent on current density (i.e., operational load), initially decreasing as current density is reduced but exhibiting a sharp rise at levels below 0.5 A/cm2.
Factors such as flammability limits and thermal neutrality generally restrict the system’s turn-down. Utilizing a recombination layer to electrochemically oxidize crossover hydrogen with crossover oxygen to generate water restricted the minimum turndown ratio of the stack to 3.5% of rated power before shutdown [72].
The fuel cell stacks utilized in this analysis are specifically designed for on-road heavy-duty vehicles (HDVs). To leverage the manufacturing economies of scale for both stack and balance-of-plant components, fuel cell stacks are typically sized at approximately 275 kW. These are then integrated into racks and modules containing standardized stacks, which are configured to drive larger systems via a single balance of plant (BOP) shared by all modules. The electrolyzer stack, on the other hand, features a nameplate capacity of 1 MW with a nominal rated stack voltage of 500–600 V achieved through 200–300 individual cells, each offering an active area of nearly 1000 cm2. To enhance efficiency, individual stacks are strategically shut down to align the rated power with optimal performance efficiency.
A small battery was also included in the system to be able to assist the electrolyzer during fast transients and to initially provide enough power for BOP components as the fuel cell ramps up to capacity, which is in the order of <1 min. Battery performance and lifetime are based on our previous work for lithium iron phosphate (LFP) batteries and comprehensively discussed in these references [69]. Briefly, we chose LFP batteries in this work as they have good cycling durability when maintained at a modest temperature and moderate energy density and provide a flat voltage–discharge curve. For optimal lifetime, we oversized the battery to operate between 80 and 20% of the state of charge (SOC) and limited the charge/discharge rate to a maximum of 0.5 kW/kWh, providing a 98% battery efficiency over a lifetime of 15 years [73,74].

2.3. Duty Cycles

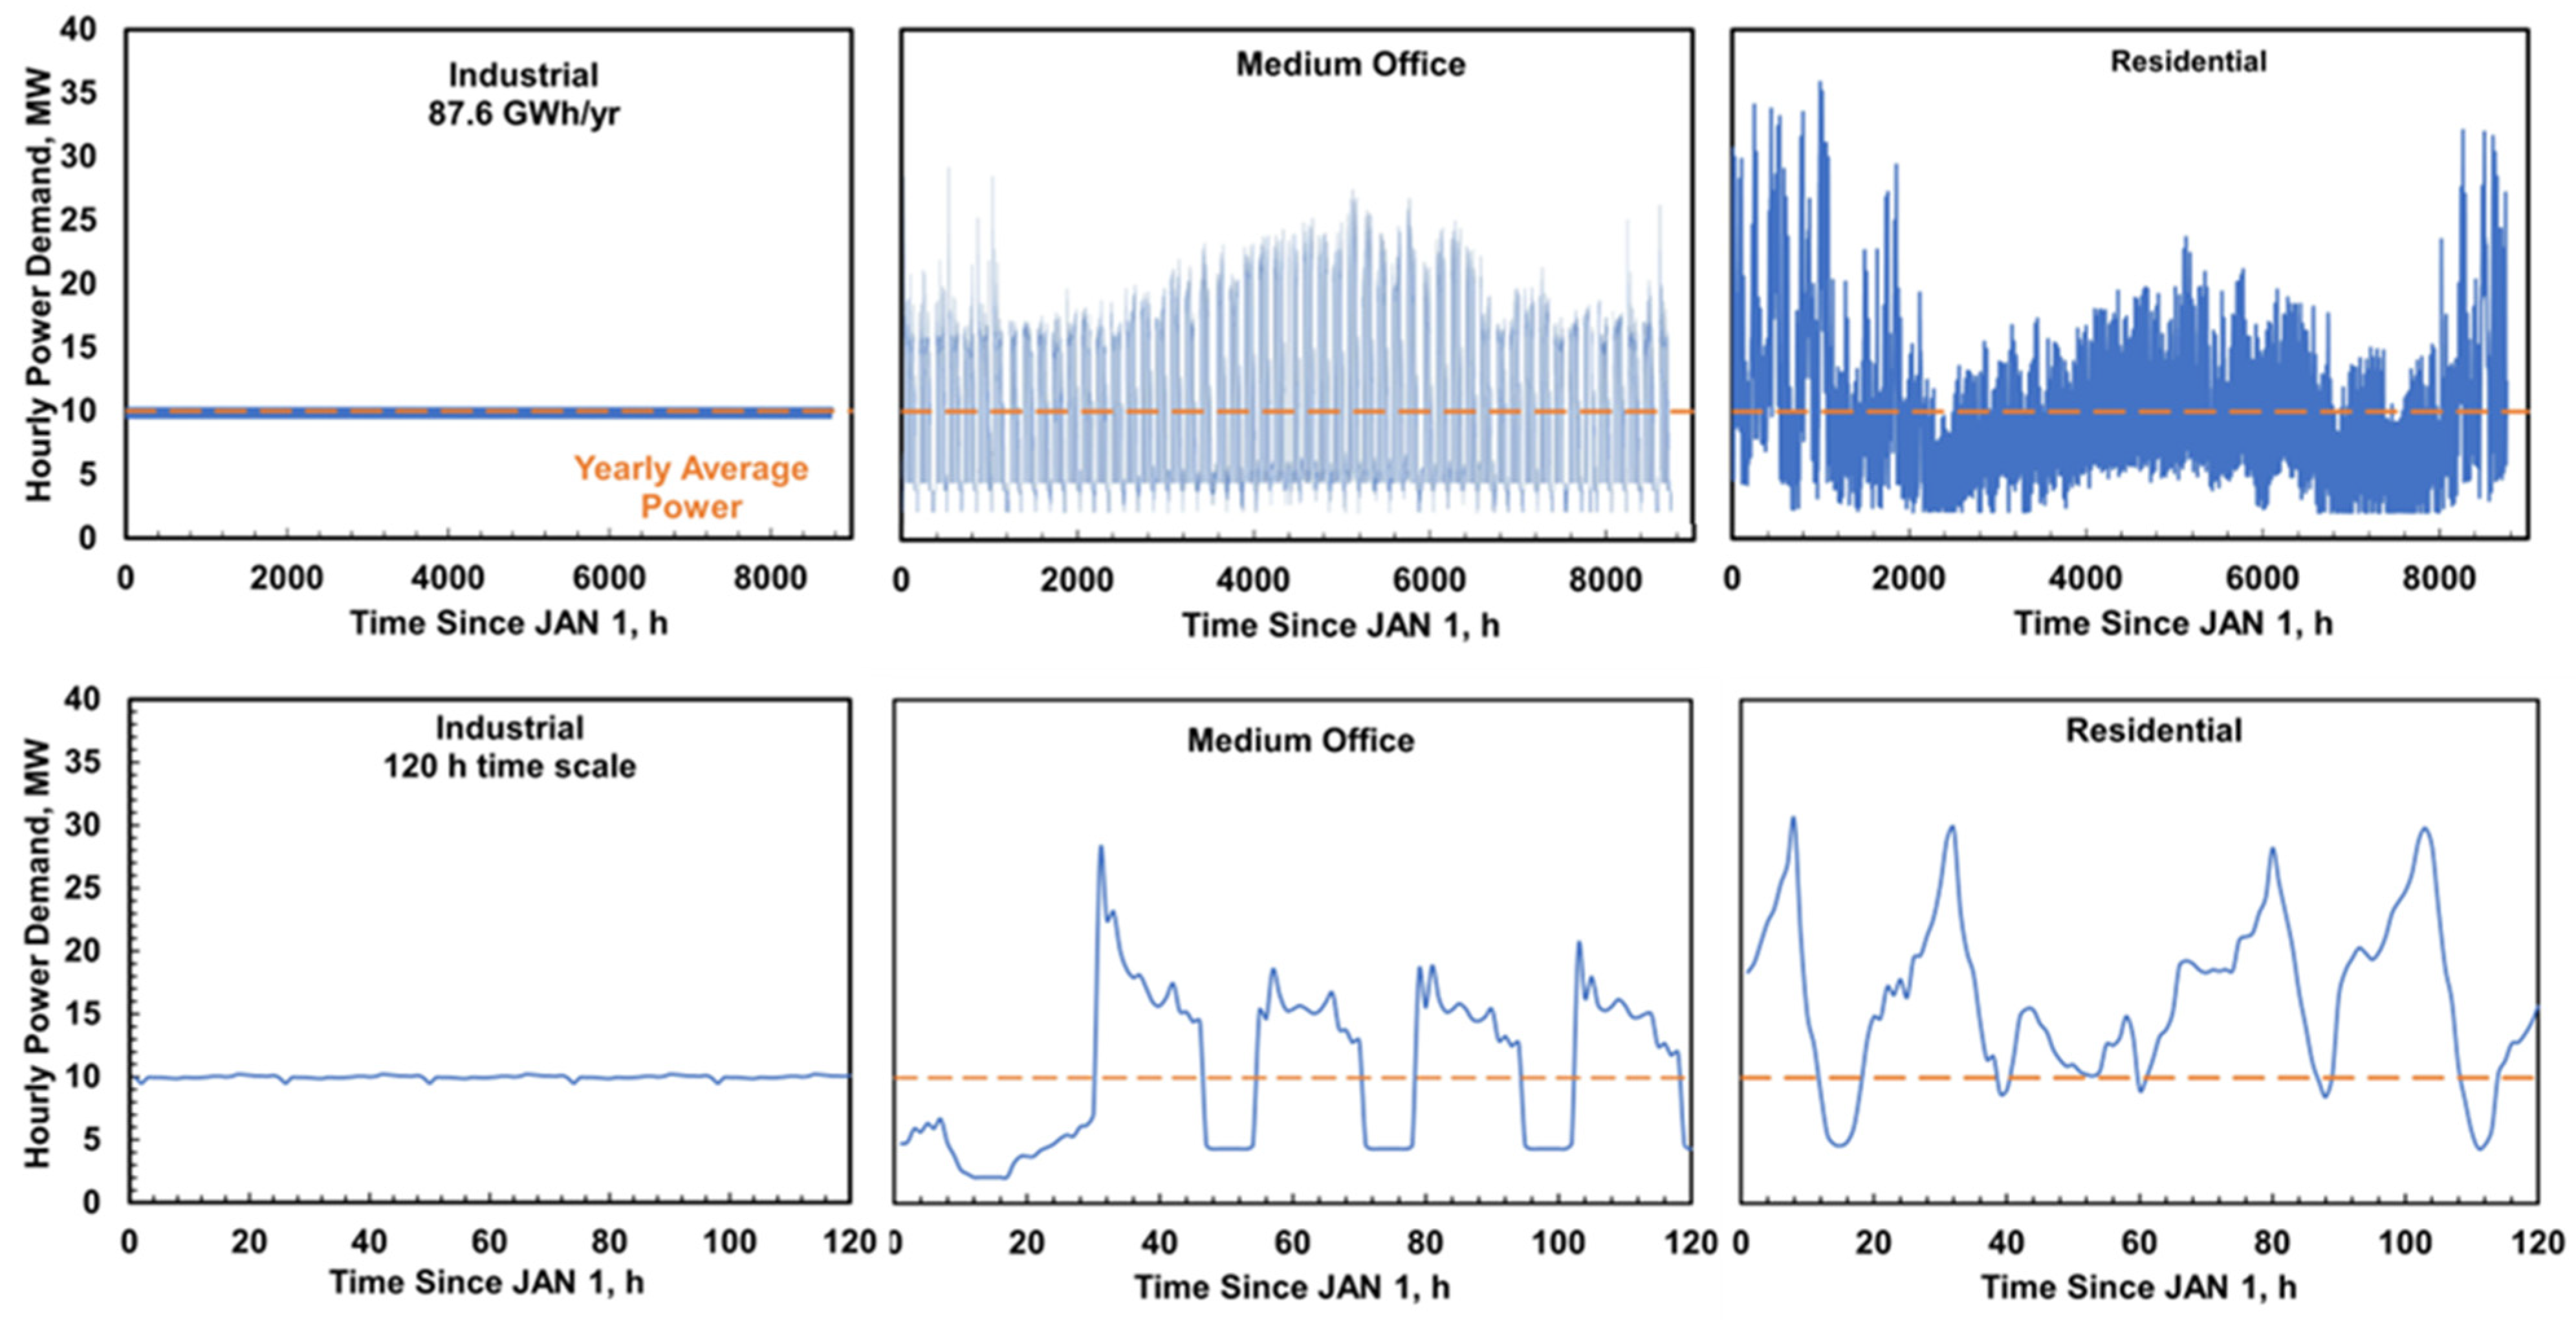
Figure 3 shows the demand power profiles for an industrial complex, a medium office, and a residential area in northwestern Texas (Amarillo, TX, USA) used in this study [75]. Data is provided in one-hour intervals throughout all days of the year. As the total energy demand differed between the three different scenarios, we normalized the power demand such that all cases require 87.6 GWh/year (or an average power of 10 MW).
The upper panel in Figure 3 presents the hourly power demand across the entire year. Residential and, to a certain extent, medium office sectors exhibit seasonal variations in demand, whereas the industrial power profile remains constant throughout the year. The lower panels present the power demand profiles over the first 120 h for a detailed view of daily power consumption. While the average power demand is 10 MW, office sectors and particularly residential areas experience substantial fluctuations throughout the day, with peaks reaching 30 MW and lows dropping to 2–5 MW. These pronounced daily variations in power demand, when integrated with intermittent energy sources, significantly influence the required capacity for energy storage, as well as the size of the fuel cell and electrolyzer systems.
Figure 4 illustrates the overlapping power demand of a medium-sized office and the power supply derived from wind, solar, or a combination of both over a seven-day period. In the case of wind energy, there are instances—particularly during hours of peak demand—where the power supply is minimal or nonexistent. To address this shortfall, hydrogen storage systems must compensate for the deficit, with the size of the fuel cell determined by the difference in power demand and supply. Moreover, the wind farm’s nameplate capacity must exceed peak power demand to ensure sufficient excess power is generated to produce adequate hydrogen for storage, thereby meeting power needs throughout the year.
Conversely, solar energy demonstrates better alignment between supply and peak demand. However, given its lower capacity factor compared to wind (21% vs. 46%), the required solar farm’s nameplate capacity must be scaled up relative to that of wind power.
This duty cycle shows an example of storage capacity and renewable farm sizes. We have evaluated this for all power demand profiles and determined electrolyzer and fuel cell size, storage requirement, and nameplate capacity for renewable energy. Besides pure wind or solar farms, we also consider a mix of wind/solar farms. Hourly data for all demand profiles [76], as well as wind and solar power [75], are documented in the Supplementary Materials (Demand and Supply Power tab).

2.4. Economic Assessment

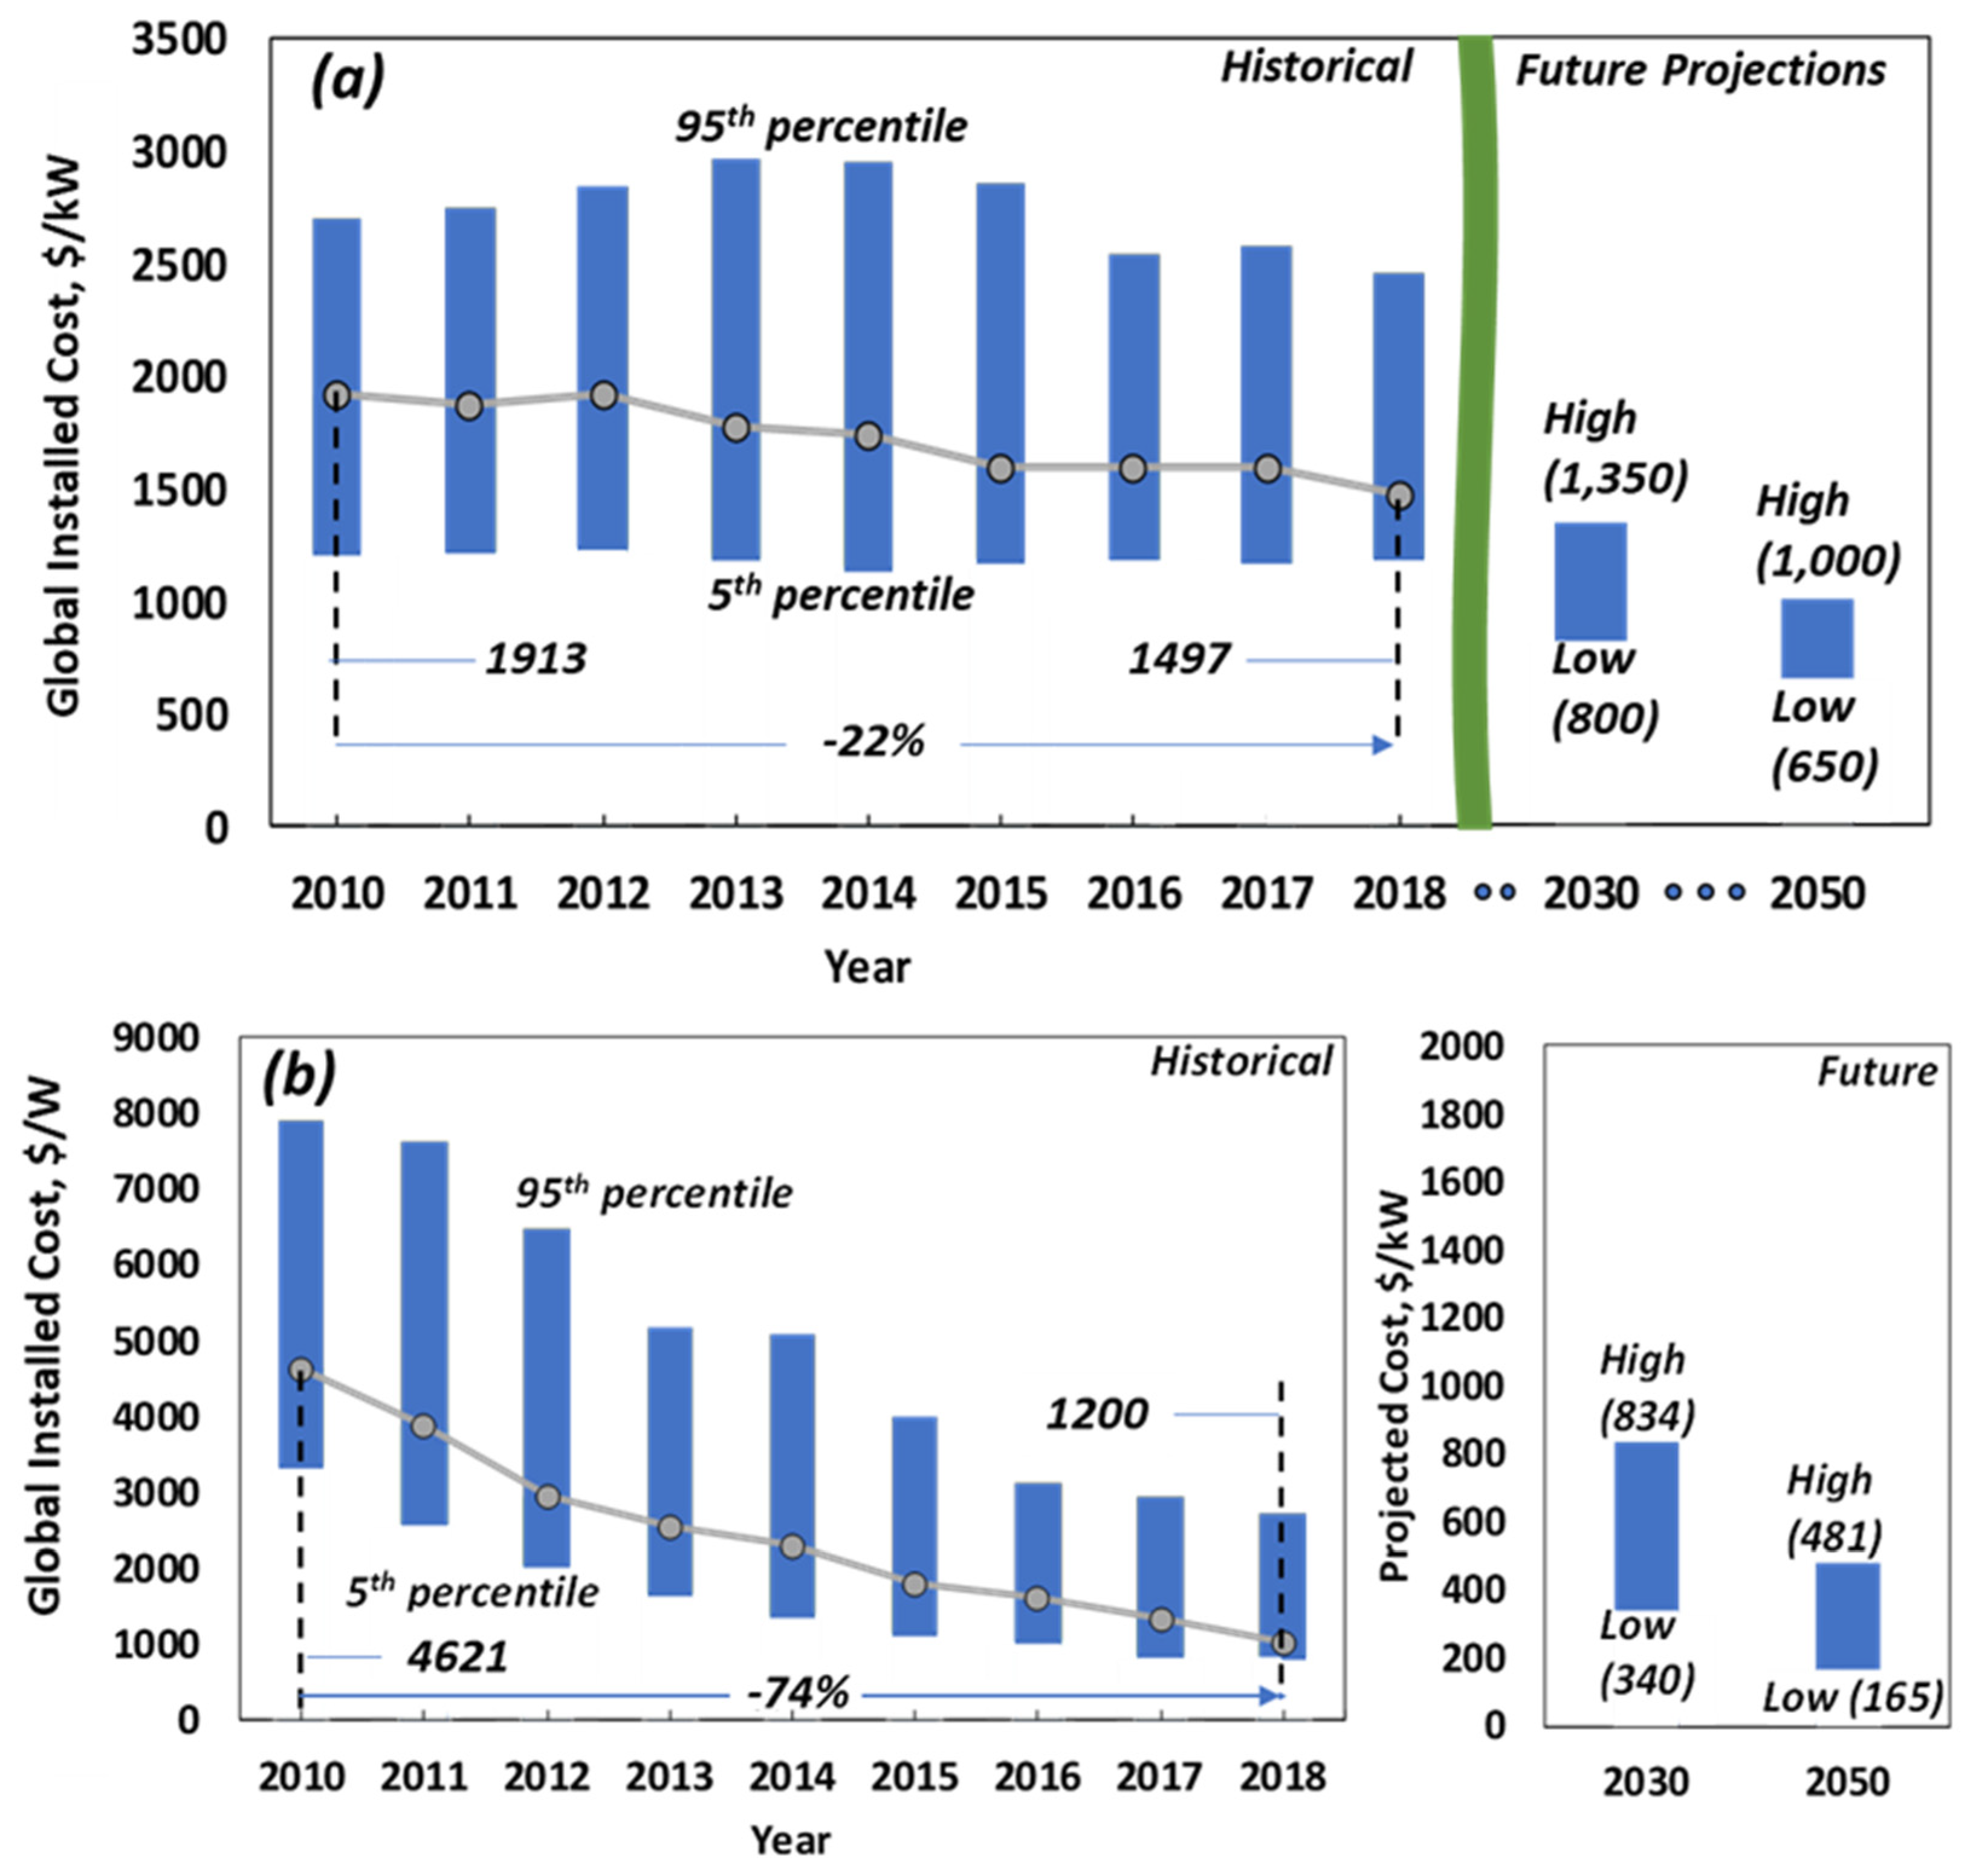
Figure 5 highlights historical and forecasted costs for land-based wind and utility-scale solar farms, as reported by the International Renewable Energy Agency (IRENA) [77,78]. The median (50th percentile) capital expenditure (CAPEX) of onshore wind farms is anticipated to decline from 1436 USD/kW in 2020 to 1050 USD/kW by 2030, while the median operating expenditure (OPEX) is expected to drop from 46 USD/kW annually to 26 USD/kW annually over the same period. In comparison, the median CAPEX for solar PV farms is projected to decrease significantly from 1080 USD/kW in 2020 to 550 USD/kW in 2030. Correspondingly, the annual OPEX for solar PV farms is forecasted to reduce from 8.70 USD/kW to 4.80 USD/kW. Solar plants, in 2020, already demonstrate lower CAPEX and OPEX compared to wind plants, and the reduction in CAPEX for solar is expected to be more pronounced by 2030. Furthermore, current and forecasted costs for installed wind and utility-scale PV systems show consistent alignment across various sources [79,80,81,82].
A recent study has assessed the current costs associated with the stack, mechanical balance of plant (m-BOP), and electrical balance of plant (e-BOP) for PEM water electrolysis systems (PEMWEs). At a high production volume of 10,000 units per year, these costs were estimated to be USD 342/kW, USD 36/kW, and USD 82/kW, respectively [83]. Additionally, the study projected that future costs would decline to USD 143/kW for the central PEMWE stack, USD 23/kW for m-BOP, and USD 68/kW for e-BOP. The end-of-life is defined by a criterion of 10% voltage increase from BOL operations, following any initial break-in or conditioning period, measured at the same current density. System lifetime is determined by the average degradation rate from BOL to EOL voltage, estimated at 40,000 h for current technology and 80,000 h for future systems.
The cost estimation for the fuel cell system aligns with the U.S. Department of Energy (DOE) objectives for Class 8 heavy-duty trucks [69]. The present cost reflects a production volume of 1000 units annually at USD 310 per kW, excluding the radiator. Projections indicate that by 2030, costs may decrease to USD 80 per kW, contingent on achieving a production scale of 100,000 units per year.
The evaluation of the storage system costs includes the DBT autoclave reactor; balance of plant (BOP) components such as pipes, condensers, compressors, and PSA; and the initial DBT inventory required for operation. The autoclave reactor’s maximum capacity is capped at 115 m3, with an installation cost of USD 334,000 per unit [67,68]. Although multiple reactors are utilized in parallel within the system, the BOP components are shared across all reactors, with costs determined by the peak hydrogen charge and discharge rates. Cost estimates for the system are derived from prior research utilizing methylcyclohexane-based carriers, adjusted as a function of capacity [50]
Currently, the market price of DBT is high, ranging from USD 4.8/kg to USD 6/kg, primarily due to limited demand. In 2018, the global market value for DBT was approximately USD 45 million, corresponding to an estimated 7500 million metric tons [84]. DBT is commonly utilized in sectors such as the chemical industry, pharmaceuticals, specialty chemicals, plastics, and rubber production. DBT production and recycling involve notable environmental and lifecycle considerations, shaped by factors such as feedstock origin, process energy demands, and recycling performance. Recent life cycle assessments (LCAs) show that transitioning DBT synthesis from conventional aromatic sources to plastic waste or biomass-based BTX (Benzene, Toluene, and Xylene) pathways can improve overall resource circularity and reduce reliance on virgin feedstock inputs [85,86,87]. However, biomass-based routes may increase freshwater use and eutrophication potential due to agricultural practices and land use intensity [86,88].
Producing toluene from biomass remains significantly more expensive, however, than from traditional fossil sources, with bio-based routes estimated to cost 2–3 times more per tonne due to feedstock variability and higher processing complexity [86,89,90]. The production process analyzed in this study is based on a European Union research report that evaluated the cost of DBT through established industrial pathways for transportation applications [91]. The methodology involves a process concept derived from patents and literature, implemented at various scales. The core process comprises two organic synthesis steps: (a) the UV-light-catalyzed synthesis of toluene and chlorine to form benzyl chloride and hydrochloric acid and (b) the FeCl3-catalyzed synthesis of benzyl chloride and toluene to produce monobenzyltoluene, dibenzyltoluene, and hydrochloric acid.
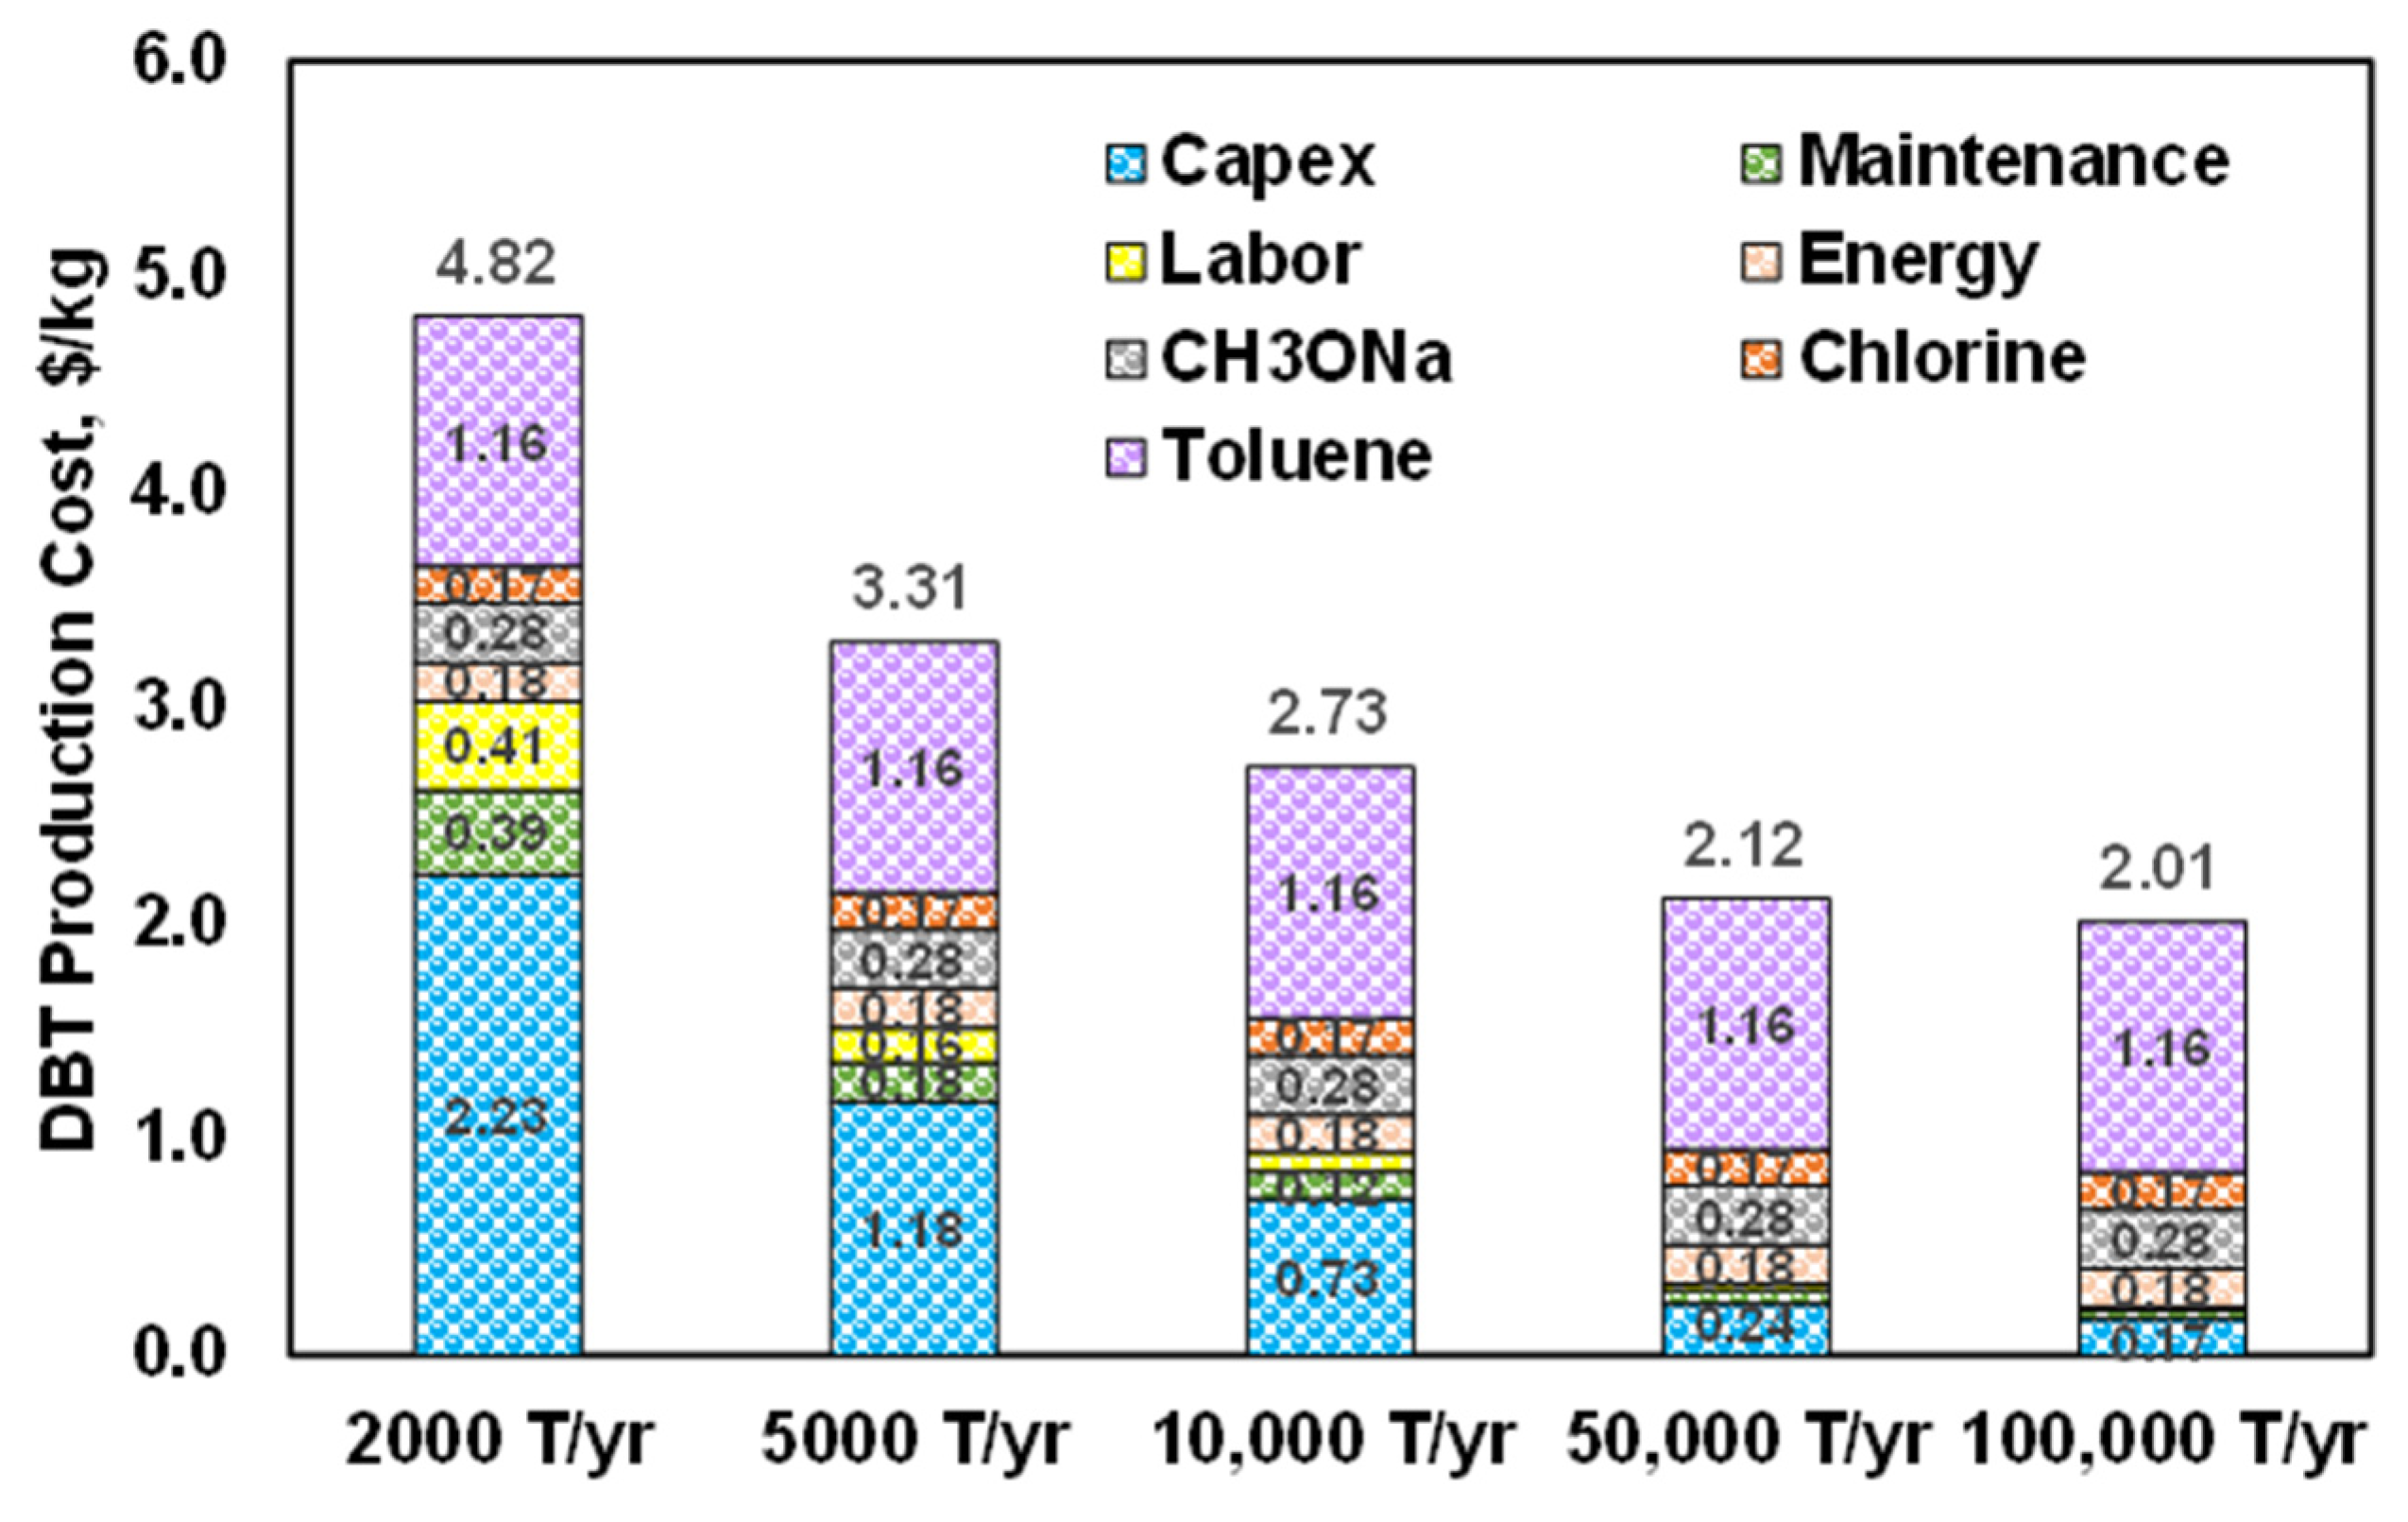
The relationship between DBT production cost and production volume is illustrated in Figure 6. The production volume accounts for both DBT and monobenzyl toluene (MBT) combined. The yield for DBT is 35%. At the current production volume of 2000 MT per year, the cost of DBT production is USD 4.82/kg, aligning with the present market value, assuming a toluene price of USD 750/MT. If the annual production volume increases to 100,000 MT, DBT production costs have the potential to decrease by more than 50% to USD 2.01/kg [91]. This scenario assumes a future case projection.
LCOE is calculated using the DOE H2A framework financial model [92]. Comprehensive details regarding capital and operating expenditures, as well as the underlying financial assumptions, are provided in the Supplementary Materials within the cost tabs.

3. Results and Discussion

3.1. Reactor Dynamics

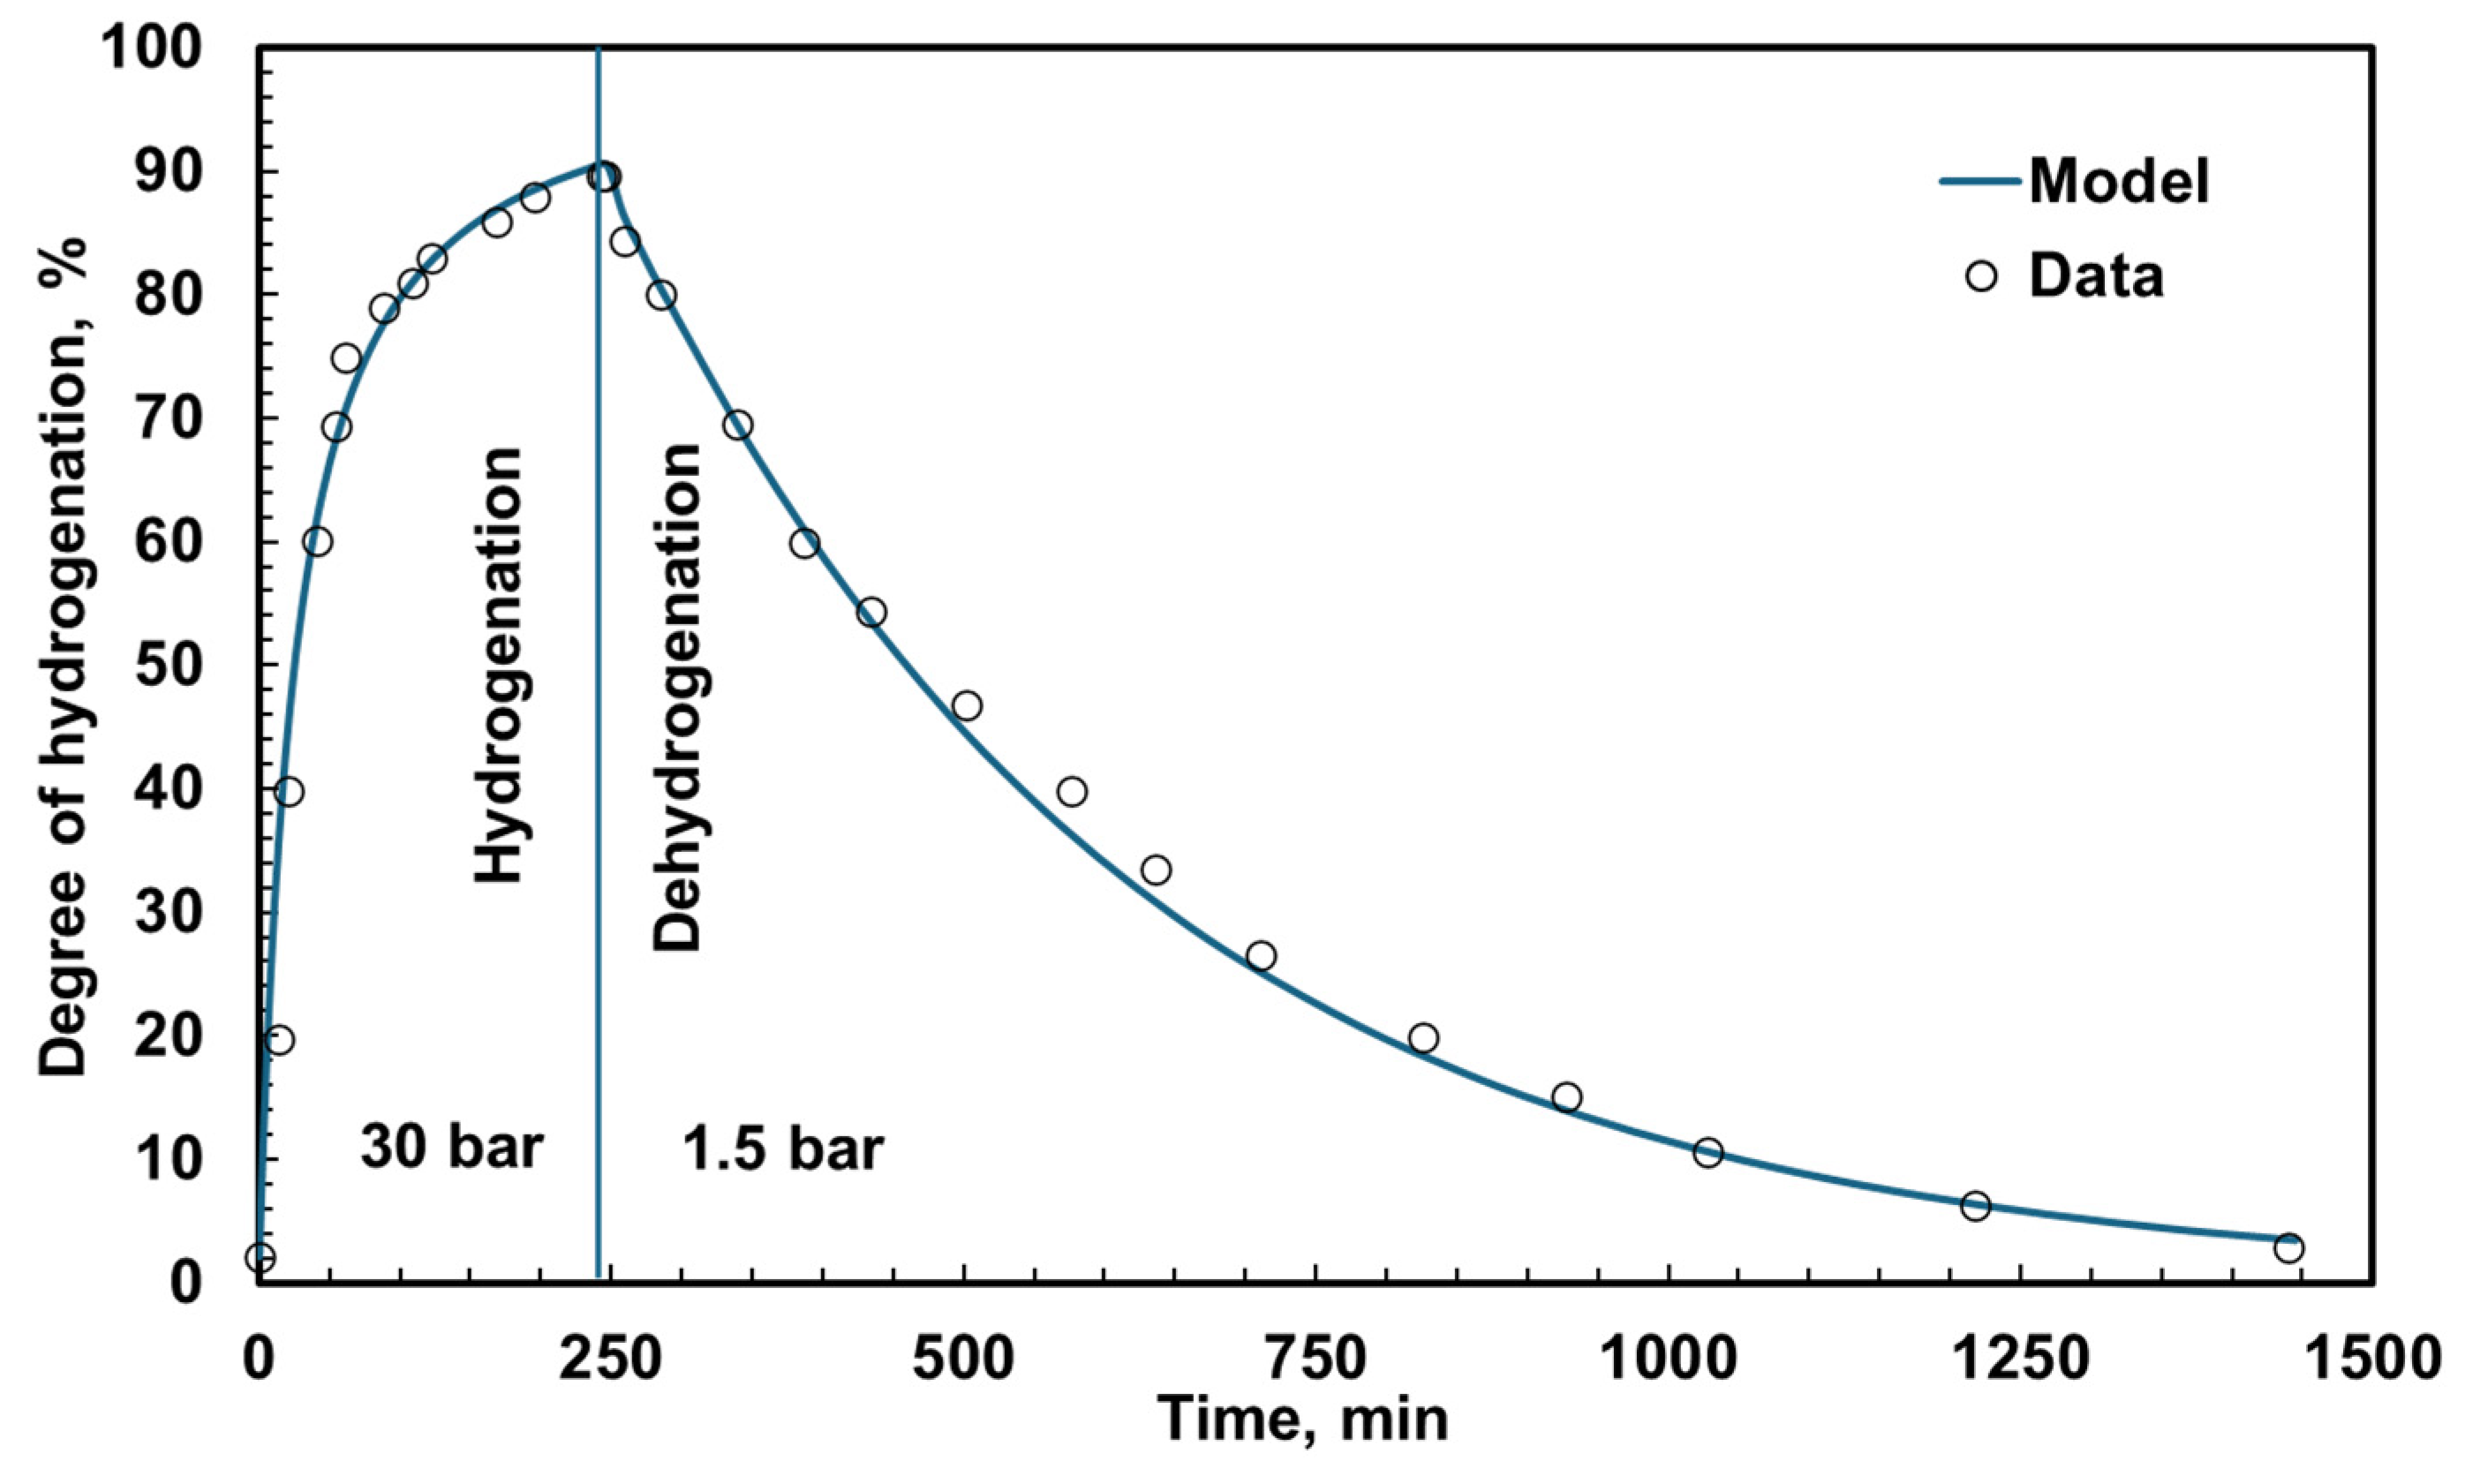
A kinetic model for the DBT reactor was formulated utilizing experimental data sourced from the literature [93,94]. In these studies, hydrogenation was performed at 30 bar, while dehydrogenation occurred at 1.5 bar. Both reactions took place in an autoclave maintained at a constant temperature, employing a Pt on alumina catalyst (0.015 mol-% Pt, corresponding to a 0.3 mass% Pt eggshell loading) [59]. The reference temperature for the experiments was set at 300 °C, although catalytic activity was also evaluated across a temperature range of 250 °C to 310 °C. Our analysis indicates that the hydrogenation kinetics are second order in H0-DBT conversion, and the dehydrogenation kinetics are first-order in H18-DBT conversion.
k T = A H e 4088 1 T R 1 T ,   H y d r o g e n a t i o n A D e 4088 1 T R 1 T ,   D e h y d r o g e n a t i o n
A H = 3.9 × 10 2 1 x 2
A D = 2.6 × 10 3 x
T R = 573   K
Figure 7 shows a favorable comparison between the modeled and measured degree of hydrogenation, DOH, in a 1450 min cycle, in which DOH reaches 90% after 250 min in the hydrogenation step and decreases below 10% after 1200 min in the dehydrogenation step. For the kinetic model applied in our system analysis, we have limited the operational temperature range to 270–310 °C. The lower bound was selected to ensure sufficiently rapid kinetics, while the upper limit was chosen to minimize secondary processes such as ring opening and cracking of DBT, which can adversely affect both the longevity of the organic liquid and the catalyst [59].
Kinetic investigations aimed at clarifying the effects of DBT stability and catalyst deactivation pathways under both hydrogenation and dehydrogenation conditions are sparse in the literature. To date, only a limited number of studies utilizing Pt/Al2O3 and Pt/C catalysts have been performed under conditions pertinent to the optimal operation of the pressure swing reactor concept [59,93]. Recently, Jorschick et al. [59] assessed the durability of a Pt catalyst in a hot pressure swing reactor, conducting 13 operational cycles over 405 h and evaluating various modes to enhance productivity while minimizing catalyst and LOHC degradation. Experiments were conducted at elevated temperatures, 250–300 °C, and hydrogen pressures up to 30 bar. Hydrogen productivity seemed to stabilize between the 6th and 9th cycles across all tested scenarios, despite a pronounced initial deactivation of the catalyst, which was attributed to conditioning. Although cleaning procedures could temporarily restore catalyst performance by clearing blocked Pt metal sites, the catalyst’s long-term effectiveness remained constrained by irreversible alterations to its active centers.
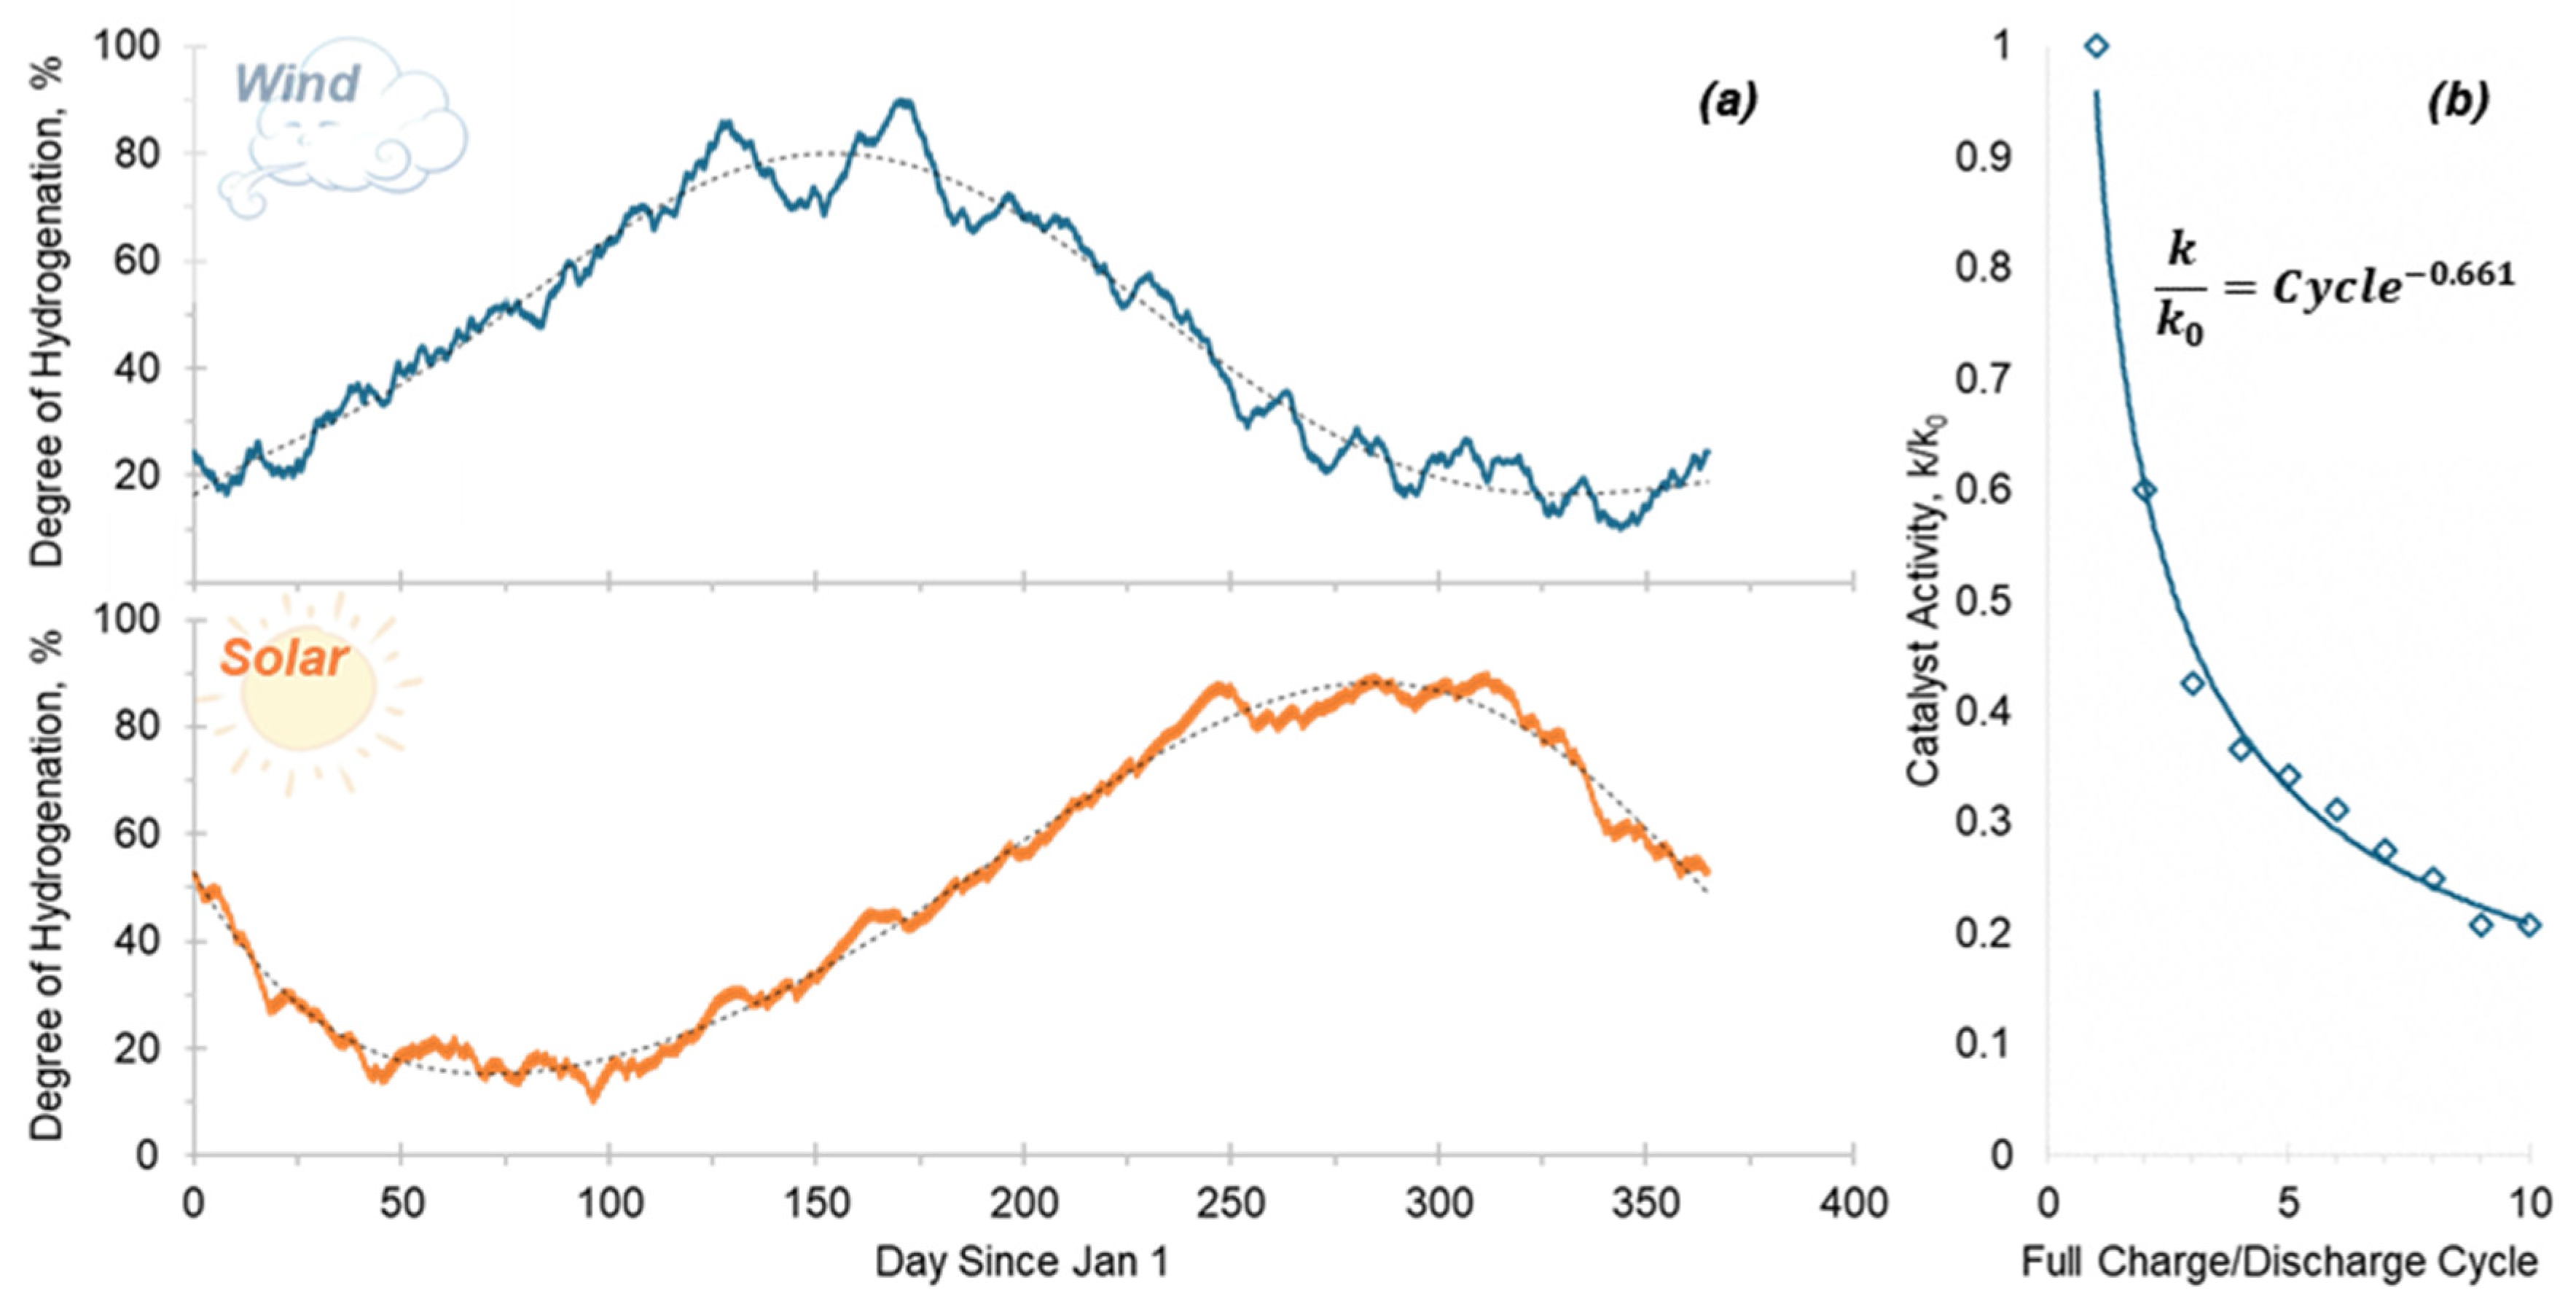
All intermittent energy is managed by storing hydrogen during periods of excess electricity generation and releasing it from storage when there is a shortfall in electricity supply. Figure 8a illustrates the cumulative liquid hydrogen storage required over the course of the year, with a particular emphasis on industrial power demand supported by wind and solar sources.
Storage levels are determined using hourly power demand and supply data to ensure that (a) hydrogen can be promptly released to meet fuel cell power requirements at any time, and (b) the amount of hydrogen stored at the start and end of the year is equal. Utilizing the kinetic model established with Equations (1)–(4), the degree of hydrogenation is consistently maintained between 10% and 90%. This approach ensures that reaction rates remain rapid and are not limited by kinetic constraints related to hydrogen uptake or release. As depicted in Figure 8a, the storage capacity exhibits pronounced seasonal variability.
For wind power, energy storage builds up during the first half of the year and is nearly depleted during the spring and summer months. Conversely, solar power follows the opposite pattern. Although from a broader perspective, the storage system appears to complete a single annual charge/discharge cycle, the aggregate daily charge and discharge events result in approximately four to five deep cycles each year. To guarantee reliable performance over ten deep cycles, as shown in Figure 8b, it was determined that replacing the catalyst every two years is a more cost-effective strategy for maintaining the necessary activity. This approach is preferable to increasing the DBT inventory and, consequently, the reactor size to improve kinetics.
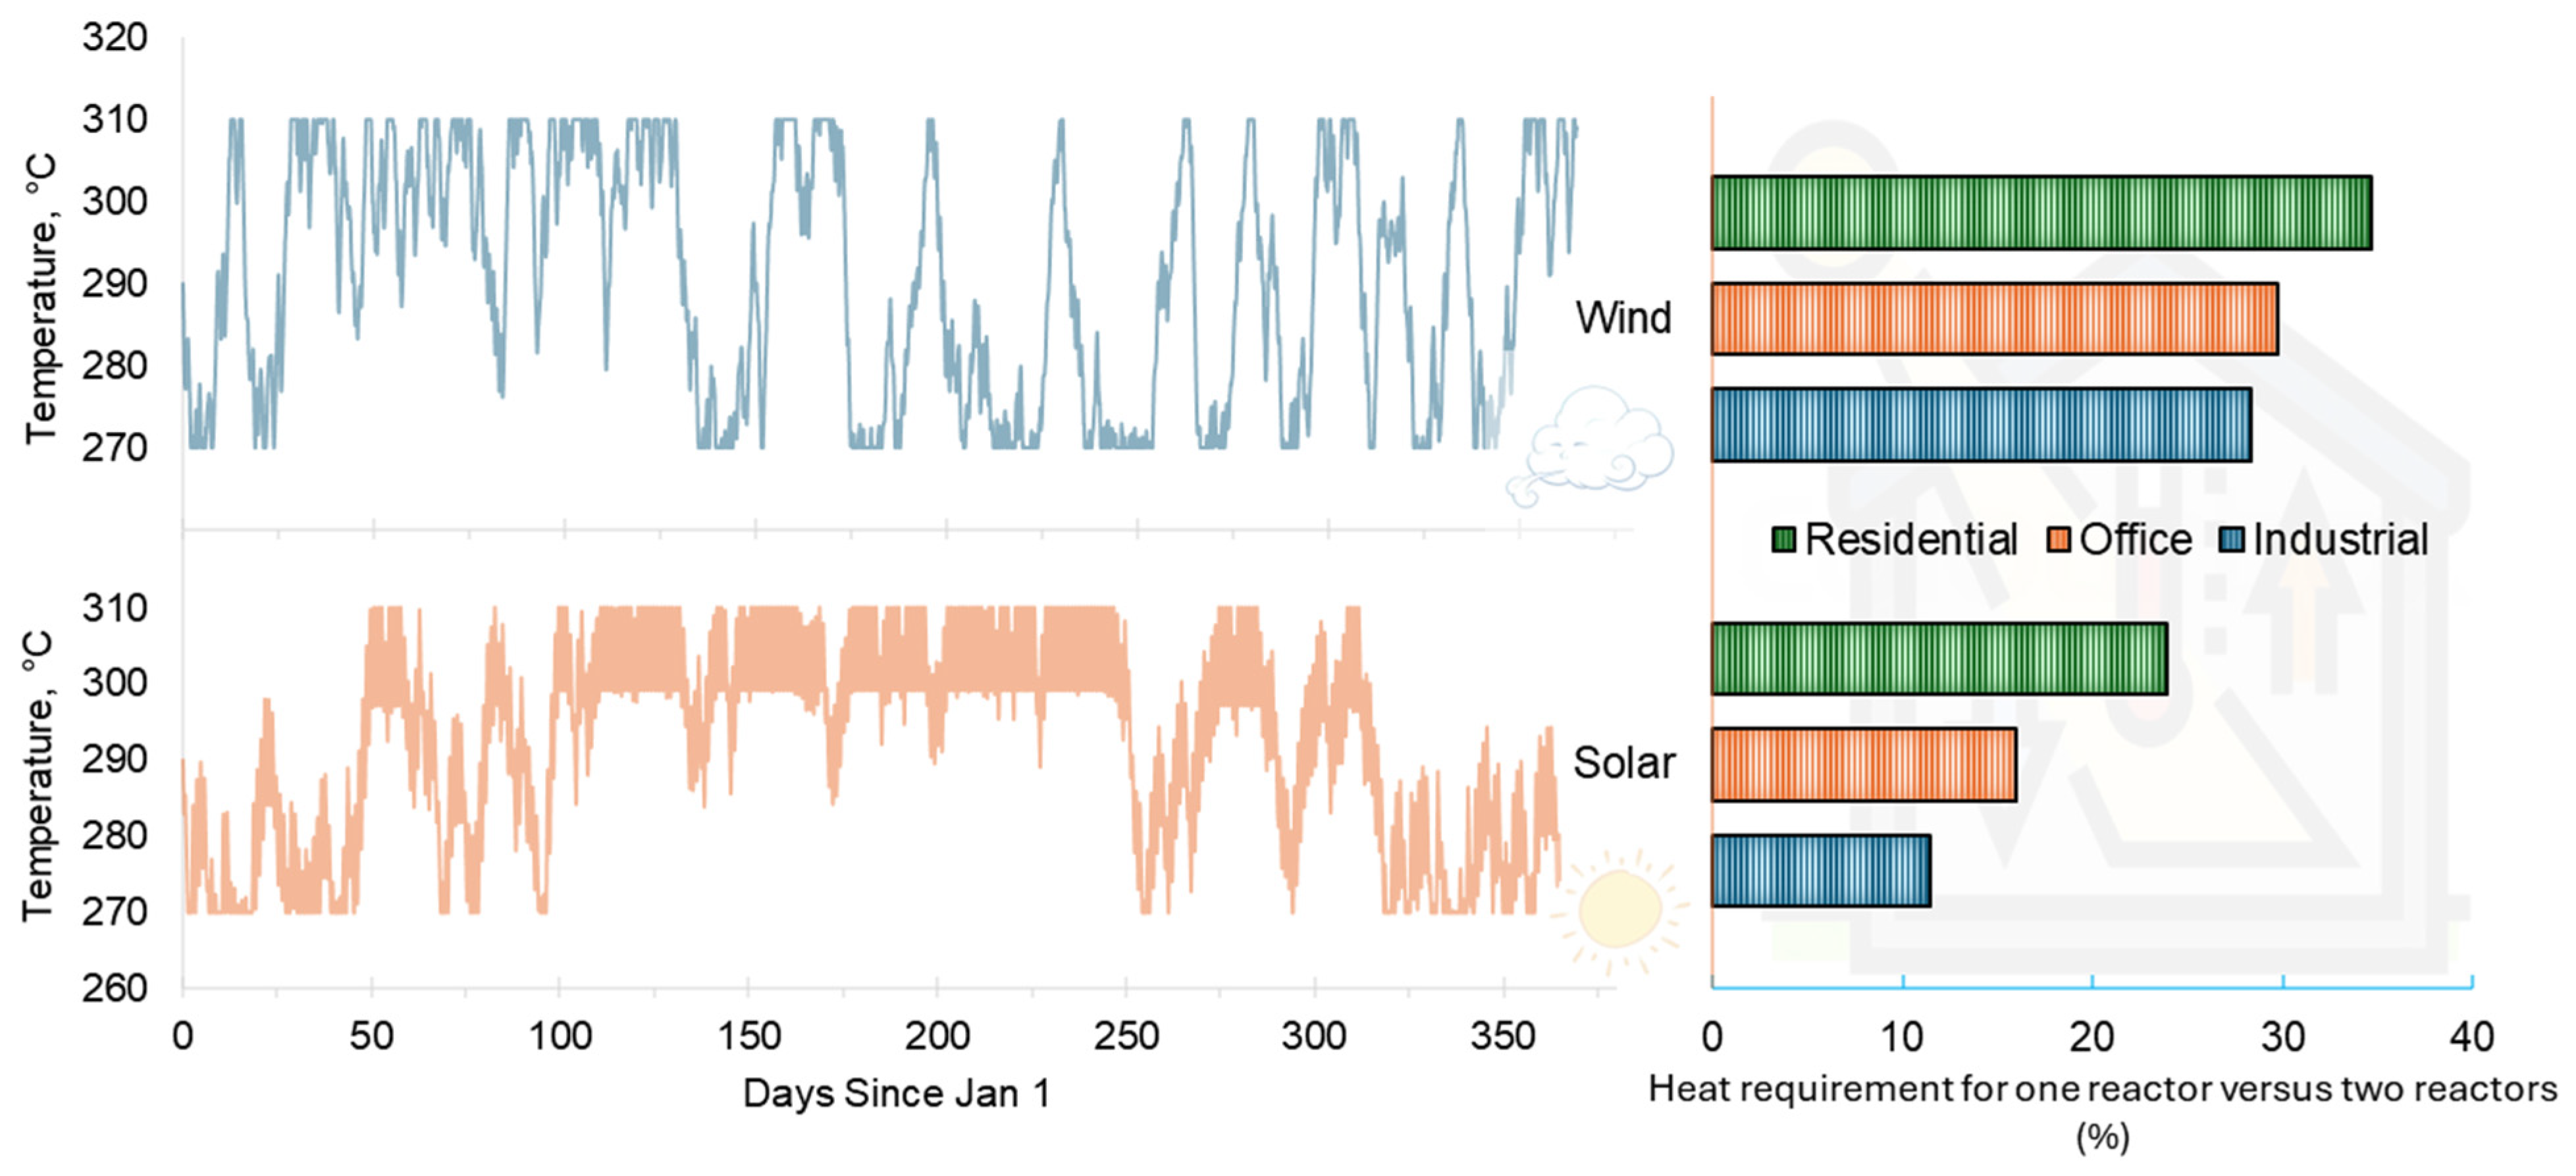
Traditionally, stationary LOHC storage systems use separate reactors for hydrogenation and dehydrogenation, with the hydrogenation reactor operating at lower temperatures and higher pressures, and the dehydrogenation reactor functioning at higher temperatures and lower pressures to leverage optimal thermodynamic conditions for each process. However, the flexibility of this dual-reactor setup is limited by the significant time and energy required to transition the reactors from standby to operational states. Integrating hydrogenation and dehydrogenation processes within a single reactor enhances thermal management, allowing for more efficient use of waste heat and minimizing thermal losses, thereby improving system responsiveness. Consequently, single-reactor DBT configurations offer a compelling solution for compact, responsive, and thermally optimized hydrogen energy systems. As illustrated in Figure 9, the single reactor’s temperature profile is shown for industrial applications operating under constant power, with energy supplied by wind and solar sources, respectively. The reactor reliably sustains temperatures within the 270–310 °C range. While uninterrupted operation at the desired temperature is not achievable without active heating or cooling, the reactor is able to operate adiabatically for extended intervals. This allows it to internally utilize the heat it generates, significantly decreasing the need for additional fuel. Consequently, overall energy consumption may be reduced to just 11–32% compared to systems that employ separate hydrogenation and dehydrogenation reactors.
DBT heat transfer fluids are typically utilized within a bulk temperature range of approximately 180–350 °C, with maximum film temperatures reaching up to 380 °C. These fluids generally provide reliable service for more than 10 years and have even reached over 30 years of operational life before being recycled through standard reclamation processes [95,96]. Conventional refurbishment includes vacuum distillation to remove light ends and heavy tars, along with filtration or adsorbent treatment to eliminate particulates and oxidation products. The main loss mechanisms during LOHC operation are over-dehydrogenation (aromatic condensation), cracking into light ends, and accumulation of heavy residues. By maintaining optimal operating conditions—such as a temperature window of approximately 290–320 °C, minimizing over-dehydrogenation, and ensuring dry conditions—side reactions are kept at a minimum, which allows for over 90% recovery of DBT with vacuum distillation and adsorbent cleanup at refurbishment intervals extending beyond 100 cycles [59]. Assuming four deep storage cycles per year for microgrid operation, the DBT inventory is expected to require replacement every 25–30 years. Annual DBT makeup is determined by the loss of light hydrocarbons, which are present at approximately 40 ppmv in the product hydrogen stream during dehydrogenation [65] (for detailed makeup estimates, please refer to the supplemental material).

3.2. System Performance

As discussed previously, the interplay between specific demand profiles and renewable energy sources determines the size of the electrolyzer, fuel cell, storage capacity, and the renewable energy farm nameplate capacity. Figure 10 illustrates these metrics across various power demand scenarios (medium office, residential, and industrial) for three renewable farm configurations: (i) 100% wind, (ii) 100% solar, and (iii) a 50% wind and 50% solar mix.
Figure 10(a1,a2) presents the yearly renewable energy estimates and nameplate capacities for each setup. The total annual energy demand across all cases is 87.6 GWh. Among the power demand profiles, renewable yearly energy output is lowest with the 50% mix configuration, requiring 125 GWh (or a 40 MW nameplate capacity energy farm). Due to their lower capacity factor, solar plants must be significantly oversized to fulfill the annual energy requirement. For instance, in the industrial demand scenario, a solar plant is required to generate up to 225 GWh/year (105 MW capacity), whereas in the residential case, it can be as low as 160 GWh/year (75 MW capacity). The comparatively lower nameplate capacity for residential solar farms stems from peak demand aligning closely with solar peak generation hours, typically between 8 am and 5 pm.
Figure 10(b1,b2) illustrates renewable energy efficiency (the ratio of energy required to energy produced) alongside hydrogen-equivalent storage capacity. A mix of solar and wind farms achieves an efficiency of 71% for industrial and office demand profiles, and slightly lower, 67%, for residential demand. Purely solar-powered farms demonstrate the lowest efficiency: about 40% for industrial and residential scenarios and 58% for medium office scenarios. The 50% renewable energy mix requires the lowest hydrogen-equivalent capacity for industrial and office energy demands: 200 MT. For residential demand, the storage capacity is higher, 400 MT, for wind and solar farms and highest for solar farms: 720 MT.
Figure 10(c1,c2) presents the calculated sizes of the electrolyzer and fuel cell. The required electrolyzer capacity remains relatively consistent across all power demand scenarios but varies significantly with the renewable energy source. The electrolyzer size ranges from 35 to 48 MW for wind and 50% mix scenarios and is significantly higher for the 100% solar scenario: 70–90 MW. The fuel cell capacity is smallest for the industrial power demand profile, a constant 10 MW, because of steady power requirements and significantly higher for medium office (30 MW) and residential cases (35 MW) because of the need to satisfy the peak daily power demand in the absence of intermittent power sources.
Figure 10(d1,d2) presents the hydrogenation and dehydrogenation capacities. The hydrogenation capacity is influenced by the configuration of the renewable energy farm: setups relying exclusively on wind energy or employing a 50% mixed renewable strategy achieve capacities between 15 and 20 metric tons (MTPD) of hydrogen equivalent. In contrast, a fully solar-powered configuration delivers a significantly higher hydrogenation capacity, reaching up to 40 MT in scenarios involving industrial power demand. Dehydrogenation capacity remains steady at 17 MT across all renewable energy configurations for industrial power demand but rises to 50 tons per day (TPD) for office power demand and up to 60 MT for residential power demand.

3.3. Levelized Cost of Electricity

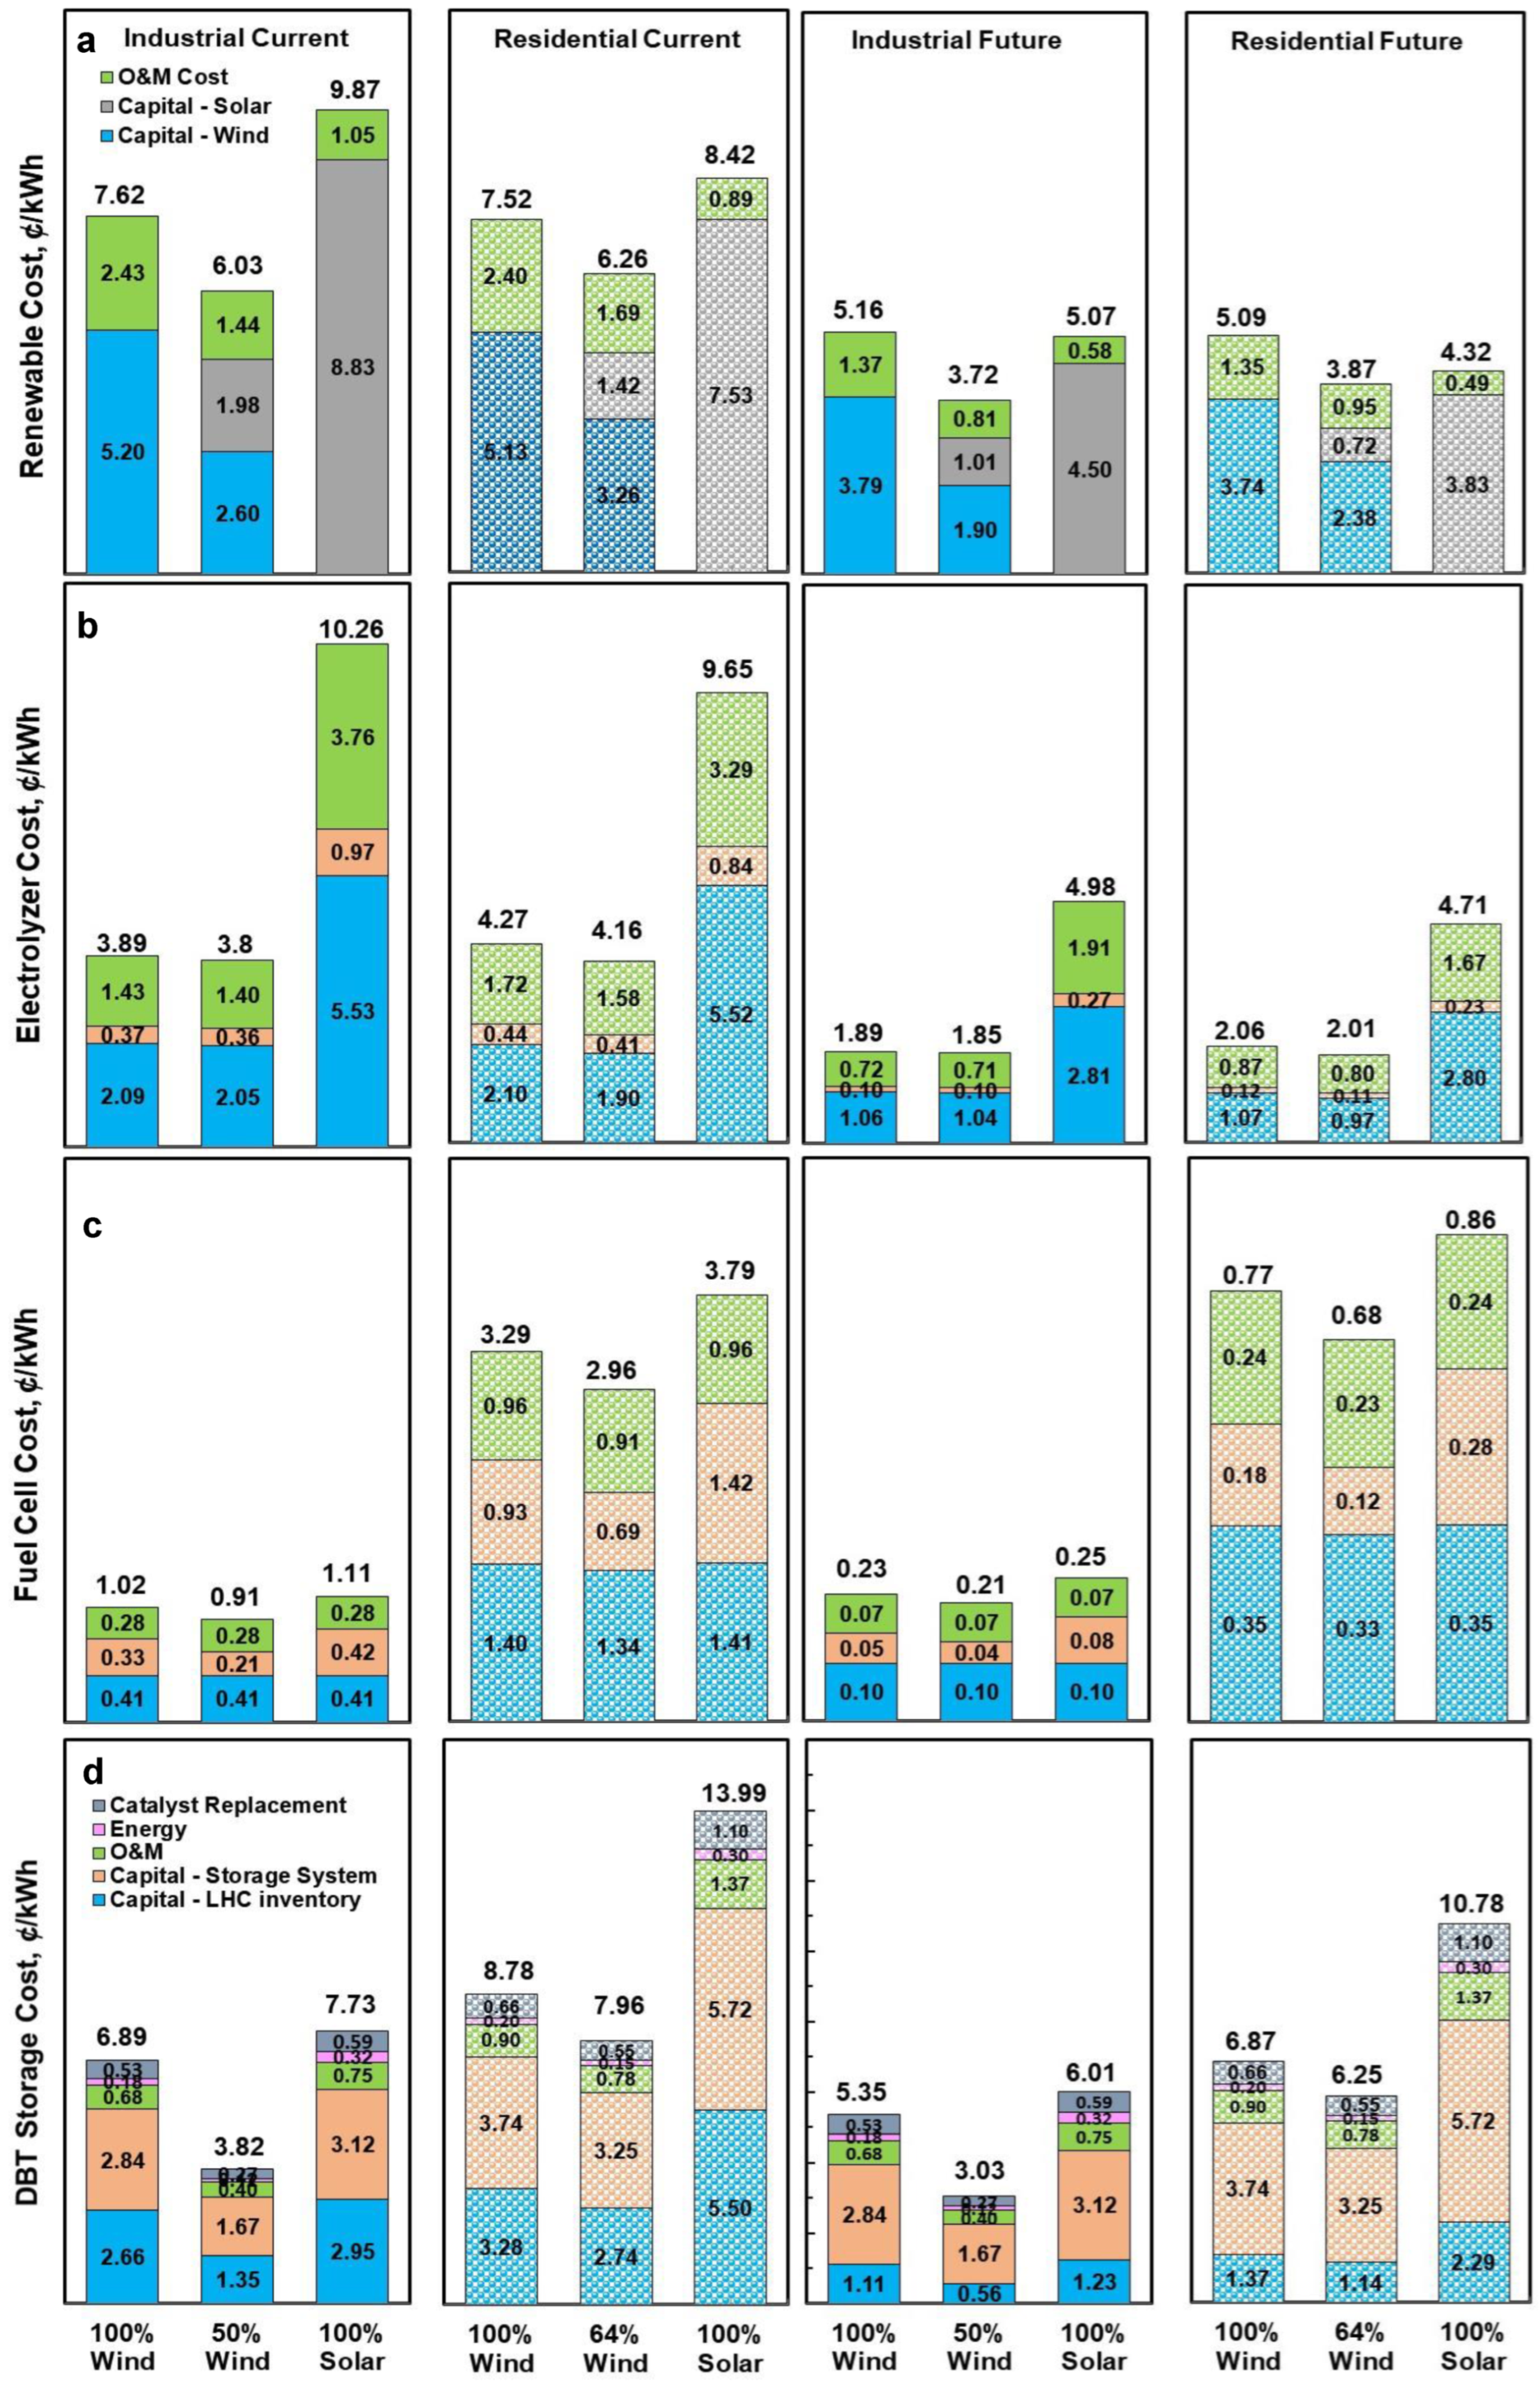
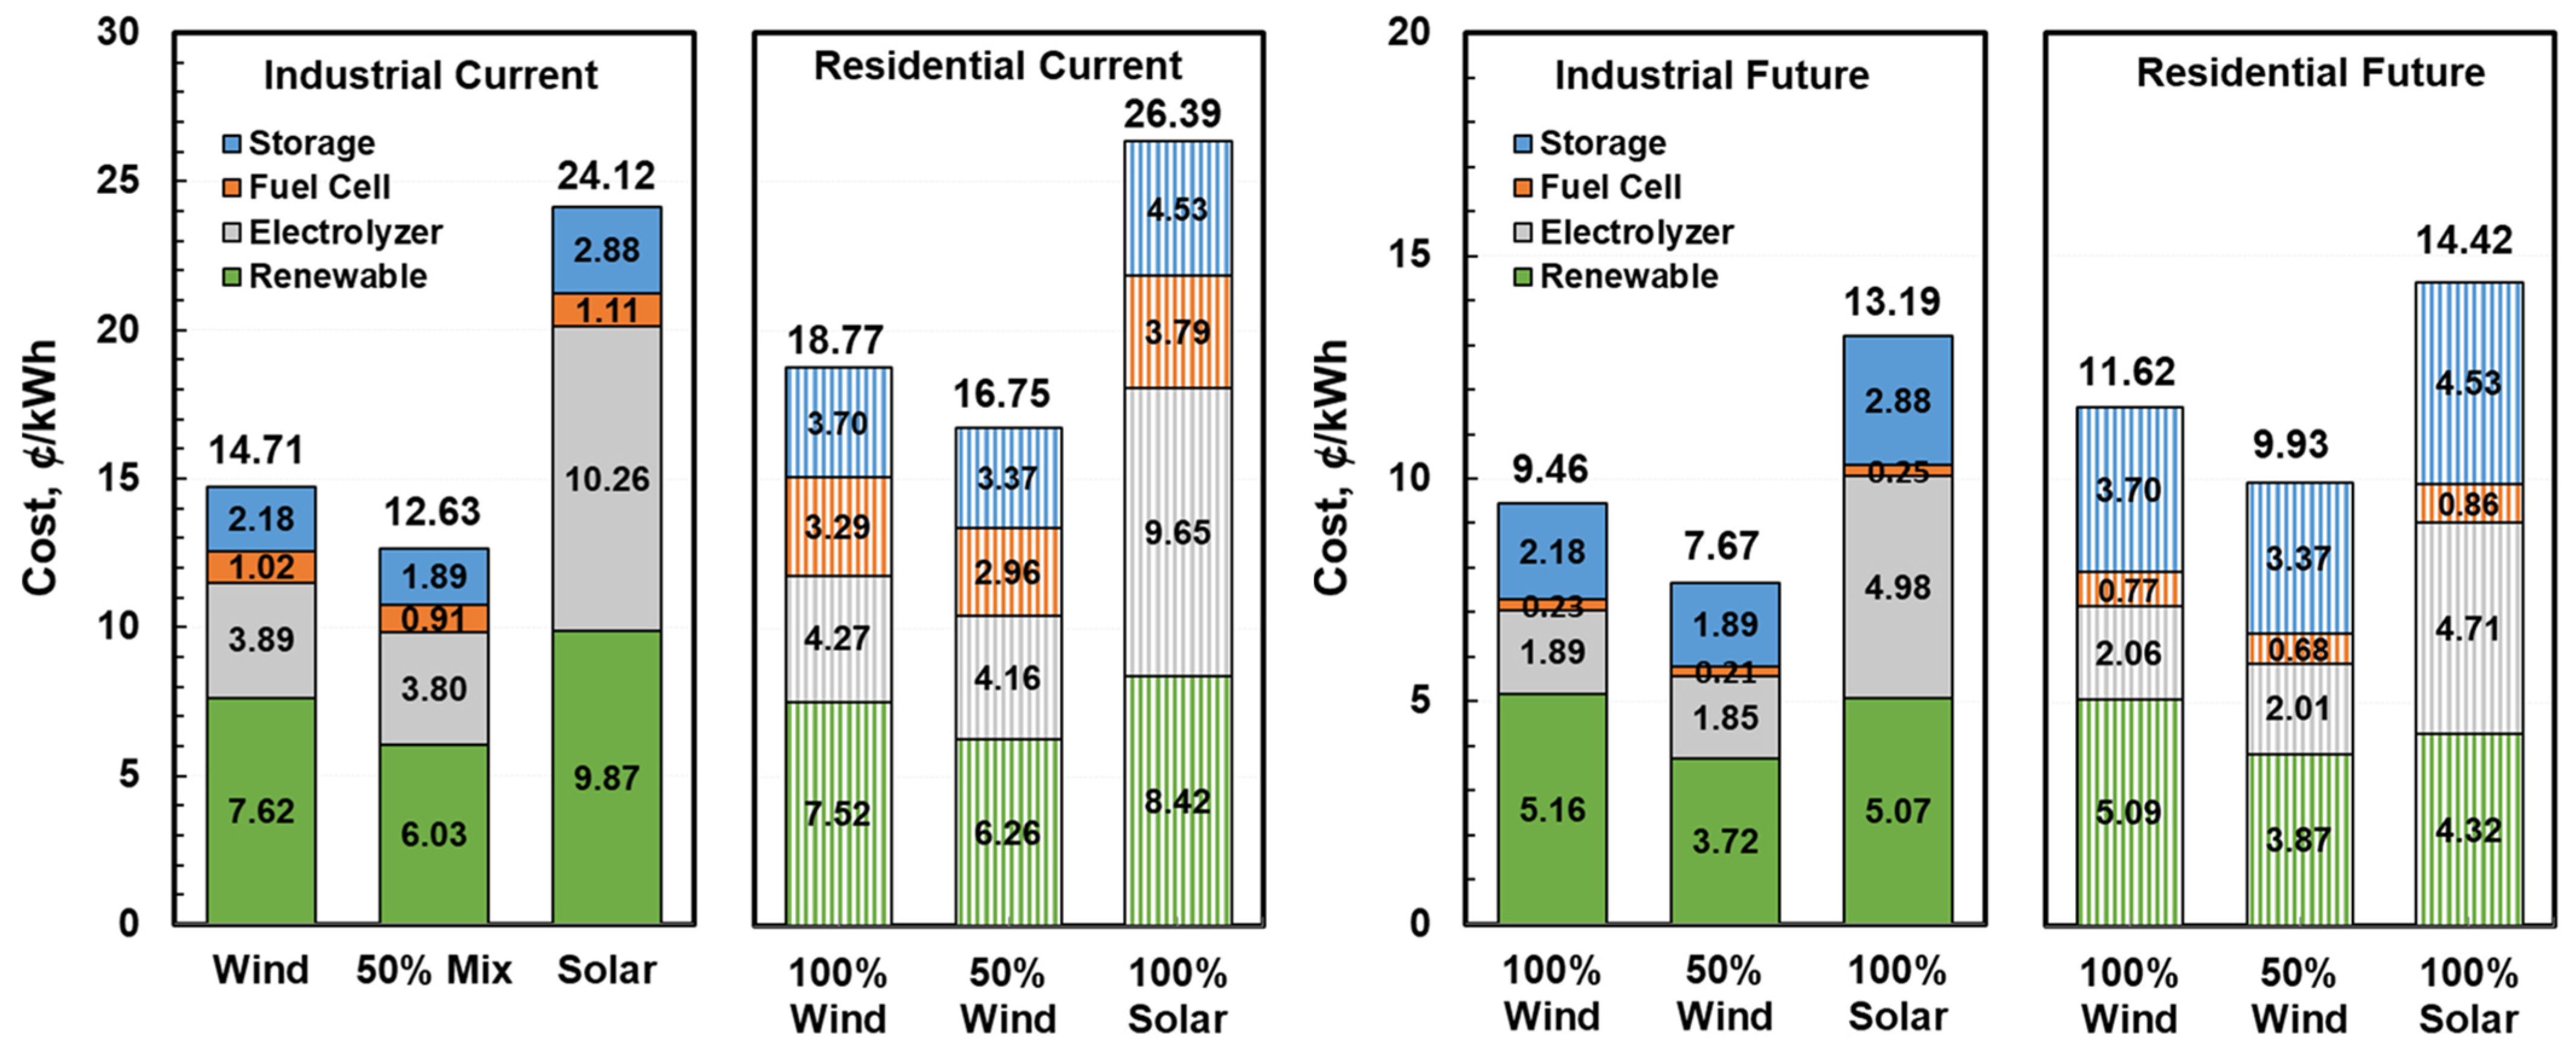
With the parameters for storage capacity, fuel cell and electrolyzer sizes, and renewable energy nameplate capacity established, the LCOE for the islanded microgrid system is analyzed. Figure 11 provides a detailed breakdown of the LCOE contributions from each component of the microgrid system.
Figure 11a summarizes the contribution of the levelized cost of renewable energy (LCRE) to LCOE. It shows LCRE parity between the industrial and residential power demands. The 50% renewable energy mix is the lowest LCRE option, and the solar power configuration is the highest LCRE option. Future LCRE projections suggest 40–50% possible savings in cost. The future LCRE is lowest for a 50% renewable mix, 3.72 ¢/kWh for industrial power demand, and highest for 100% wind or solar power, about 5.10 ¢/kWh.
Although solar systems require higher nameplate capacity compared to wind (100 MW versus 50 MW), the lower CAPEX and OPEX of photovoltaic technologies (50% lower than wind) partially compensate for LCRE. It is worth noting that the LCRE for renewable systems integrated within an islanded microgrid setup exceeds that of utility-scale wind or solar systems without storage and curtailment (2–3 ¢/kWh). This disparity arises from the larger nameplate capacity required to address inefficiencies inherent in storage systems, particularly the round-trip efficiency of electrolyzer and fuel cell systems.
Figure 11b summarizes the contribution of the levelized cost of the PEM water electrolyzer system (LCWE) to LCOE. Across different renewable energy sources, LCWE remains comparable between industrial and residential demand. In the current scenario for industrial demand, LCWE is smaller for a 100% wind and wind–solar mix, 3.8¢/kWh, than the 100% solar energy supply, 10.26 ¢/kWh. Future projections suggest more than a 50% reduction in LCWE.
Figure 11c summarizes the contribution of the levelized cost of fuel cell system (LCFC) to LCOE. LCFC is seen to depend weakly on the renewable energy source. In the current scenario, it is approximately three times higher for residential power demand, 2.96–3.79 ¢/kWh, than industrial power demand, 0.9–1.11 ¢/kWh. This cost differential is entirely due to the FC-rated power, which is 35 MW for residential power demand and 10 MW for industrial power demand. Looking forward, with a target cost of USD 80/kW for the fuel cell system, LCFC is projected to decrease significantly, by a factor of five, to reach 0.2 ¢/kWh in the industrial power demand scenario, making it the least expensive component of the microgrid system.
Figure 11d summarizes the contribution of levelized cost of the DBT hydrogen storage system (LCHS) to LCOE. Overall, LCHS is lowest for a 50% energy mix, followed by 100% wind and 100% solar. It is higher for residential demand than for industrial demand. For wind–solar mix, the current LCHS is 3.82 ¢/kWh for industrial demand and 7.96 ¢/kWh for residential demand. These are projected to decrease to 3.03 ¢/kWh and 6.25 ¢/kWh, respectively, if the forecasts for reduced DBT inventory costs are met.
Figure 12 presents the LCOE as the sum of LCRE, LCWE, LCFC, and LCHS. LCOE is the smallest for a 50% wind–solar energy mix. For industrial power demand, the current LCOE is 15 ¢/kWh, and it is projected to decrease to 9 ¢/kWh. The LCOE is higher for residential power demand, 22 ¢/kWh, with a projection to decrease to 13 ¢/kWh. Although the LCOE for these configurations is notably higher compared to renewable energy systems without storage or curtailment, it is important to emphasize that the added costs account for a fully autonomous islanded system capable of meeting power demands consistently throughout the year, despite the inherent intermittency of renewable sources. As a reference, the existing literature reports that solar thermal towers with energy storage achieve an LCOE ranging from 13 to 16 ¢/kWh [97].

3.4. Comparison with Other Storage Systems

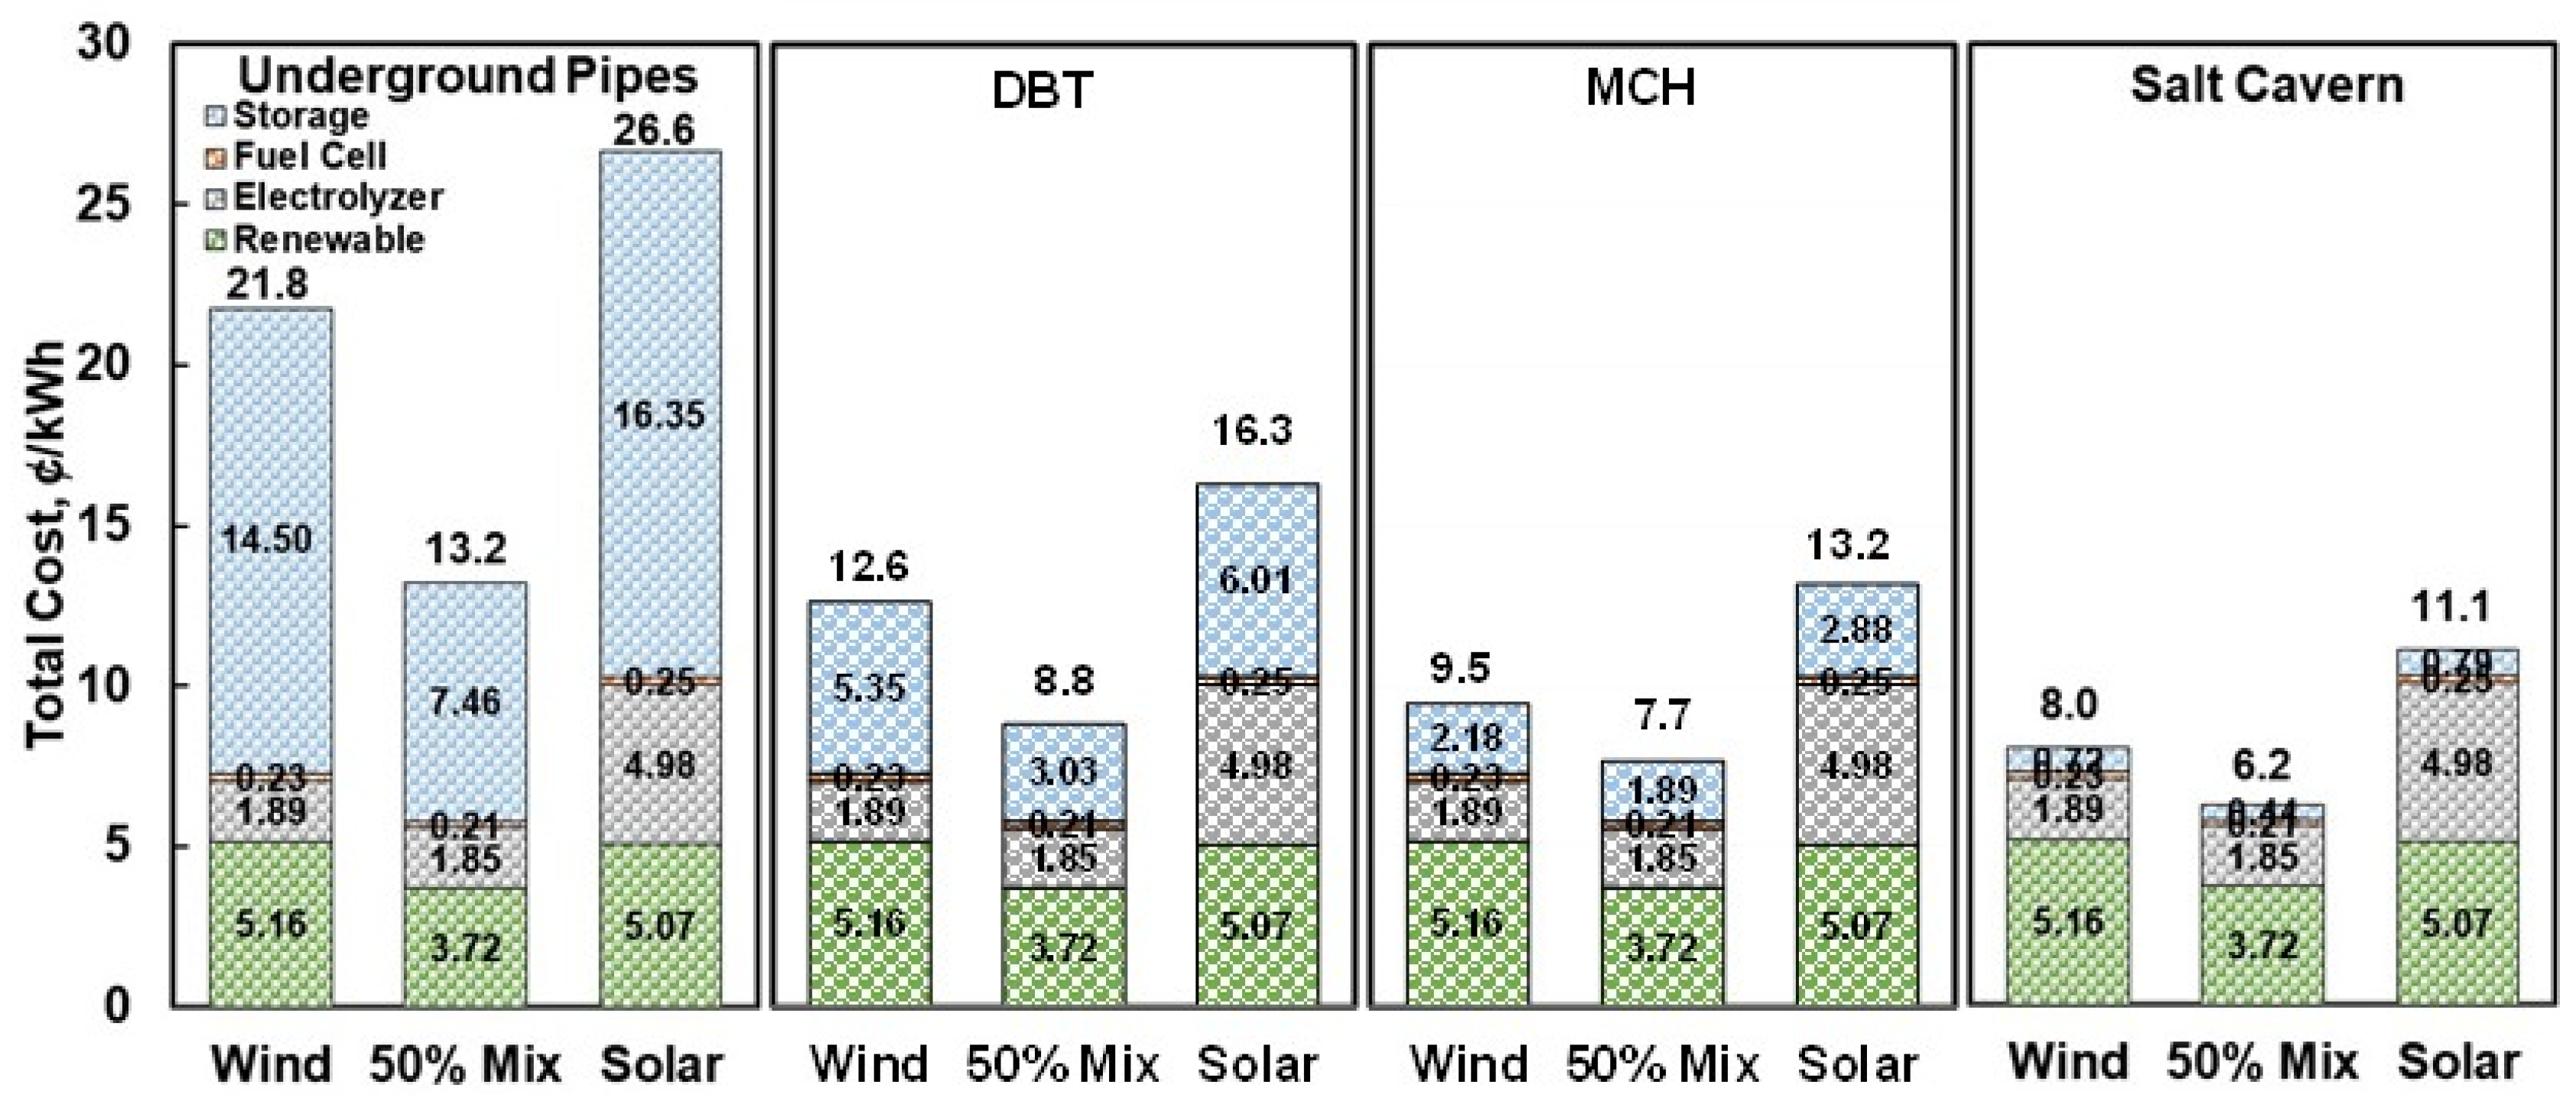
We extended our analysis to benchmark the LCOE for DBT storage against methods of bulk hydrogen storage in underground pipes, toluene/MCH carrier, salt caverns, and battery energy storage (BES). The technology, economics, and models of bulk hydrogen storage methods are discussed in recent publications [98].
Figure 13 compares the LCOE of the renewable microgrid with different hydrogen storage methods. In all cases, the life cycle costs of the renewable farm, electrolyzer, and fuel cell system are the same. For all storage methods in Figure 11, the LCOE is the lowest for a 50% wind/solar mix and highest for solar.
Considering the 50% wind/solar mix, toluene/MCH exhibits a 1.14 ¢/kWh LCOE advantage over the DBT system, mainly due to lower CAPEX and carrier inventory costs (USD 0.8/MT toluene versus USD 2.01/MT DBT). The toluene/MCH storage system contributes 25% to the overall LCOE compared to 34% for the DBT storage system. The most cost-effective storage option is salt caverns with 2.6 ¢/kWh lower LCOE than the DBT storage system and LCHS of only 0.44 ¢/kWh. The most expensive storage option is underground pipes with 4.4 ¢/kWh higher LCOE than the DBT storage system and LCHS of 7.46 ¢/kWh.
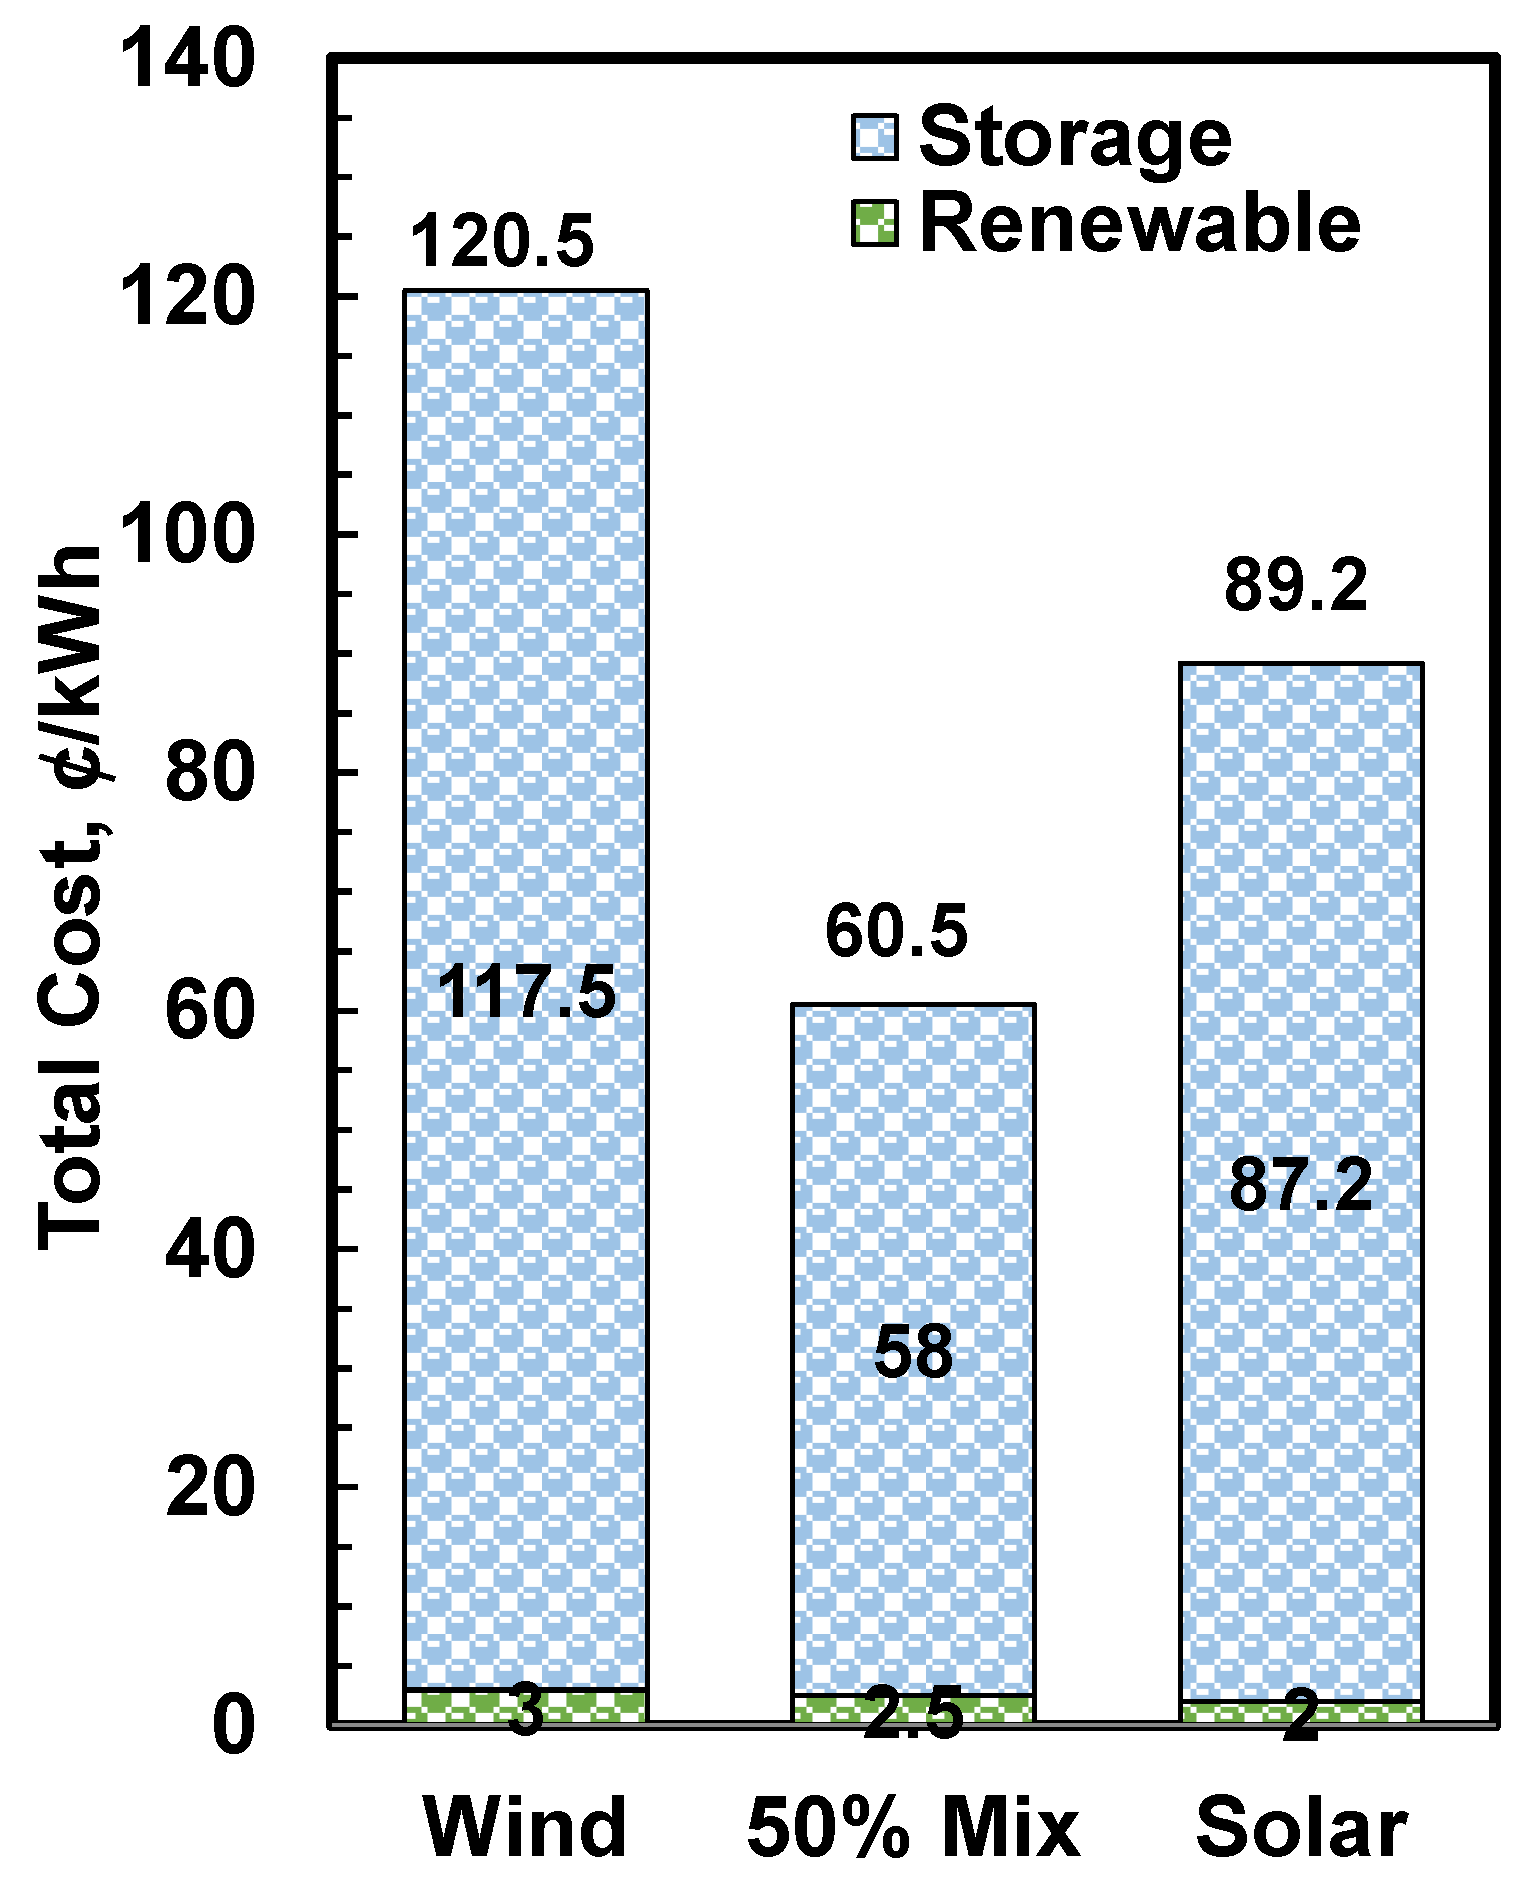
The BES system consists of a renewable energy farm paired with lithium-ion batteries. The required battery capacity ranges between 5 and 11 GWh for the industrial duty cycle with a constant power demand of 10 MW. The BES achieves 98% round-trip efficiency compared to the best case of 70% for the hydrogen storage system coupled to a 50% wind/solar mix. However, the total LCOE for an islanded microgrid with BES is prohibitive, particularly when accounting for seasonal storage requirements in Figure 13. Even at USD 80/kWh, the 2030 target for solid-state BES for vehicles, the LCOE of the islanded system with BES is nearly an order of magnitude higher, 60.5–120.5 ¢/kWh, than 8.8–16.3 ¢/kWh with DBT hydrogen storage. To achieve cost parity with the DBT system, the battery capital costs would need to be reduced drastically to 6–13 USD/kWh for the scenarios in Figure 14.

4. Summary and Conclusions

Islanded microgrids operate independently from the main grid using local energy sources, often renewables like wind and solar, which help lower emissions but introduce supply variability. This study developed a framework to evaluate seasonal storage needs, suitable technologies, and economic strategies for such systems. Focusing on hydrogen storage with a chemical carrier (DBT), the analysis considered solar, wind, and hybrid configurations across industrial, office, and residential demand profiles, all with a total annual demand of 87.6 GWh. The results highlight that solar systems need substantial oversizing due to lower capacity factors, especially for industrial and residential loads, with sizing of system components driven by the interplay between demand patterns and renewable supply.
Efficiency metrics reveal considerable variation across different configurations. The combination of wind and solar resources achieves an efficiency of 71% for industrial and office profiles, which decreases to 67% for residential applications. Solar-only setups result in the lowest efficiencies, around 40% for both industrial and residential demands and 58% for medium office requirements. Hydrogen-equivalent storage capacity is at its minimum for the 50% mix configuration, registering 200 MT for industrial and office profiles. However, it increases notably for residential scenarios, reaching 400 MT for wind and solar farms and up to 720 MT for configurations utilizing only solar.
Electrolyzer and fuel cell sizing are further influenced by demand levels and the chosen renewable sources. In mixed-source configurations, electrolyzer capacities range from 35 to 48 MW, while wind-exclusive scenarios see capacities escalate to 70–90 MW. Fuel cell capacities fluctuate in accordance with demand profiles, remaining low at 10 MW for industrial cases but rising to 30 MW and 35 MW for office and residential demands, respectively, to accommodate peak daily power needs.
A comparative analysis of various power demand scenarios indicates that the levelized cost of energy (LCOE) for industrial demand using DBT as a storage medium is estimated at 15 ¢/kWh, with projections suggesting a reduction to 9 ¢/kWh in the future. In contrast, residential power demand incurs a substantially higher LCOE—approximately 45% greater than industrial costs—primarily due to its variable nature. This study evaluated the LCOE associated with different hydrogen storage systems, including underground pipes, DBT, MCH, and salt caverns, as well as battery storage within a microgrid context. Hydrogen storage solutions exhibit stable costs across renewable farms, electrolyzers, and fuel cells. Notably, salt caverns emerged as the most cost-effective option, delivering an LCOE of 0.44 ¢/kWh for a 50% wind/solar energy mix. Conversely, underground pipes are more than twice as expensive as DBT at this mix, with corresponding costs of 13.2 ¢/kWh and 3.03 ¢/kWh, respectively. MCH storage provides a marginal LCOE benefit of 1.14 ¢/kWh over DBT, attributed to reduced capital investment and carrier inventory expenses. While battery storage achieves superior round-trip efficiency (98% compared to 70% for hydrogen systems), its LCOE is significantly higher—ranging from 60.5 and 120.5 ¢/kWh versus 8.8–16.3 ¢/kWh for DBT systems. The industrial duty cycles require battery capacities of 5–11 GWh, resulting in elevated costs even when factoring in a projected USD 80/kWh capital cost by 2030. To reach cost parity with DBT, battery capital costs would need to decrease to USD 6–13/kWh. Consequently, the high cost associated with batteries limits their feasibility for seasonal energy storage in islanded microgrid applications, making hydrogen-based storage solutions more viable.

Supplementary Materials

The following supporting information can be downloaded at https://www.mdpi.com/article/10.3390/en18215775/s1. Power Data—Supplementary—DBT (Excel Sheet). References [95,99] are cited in the supplementary materials.

Author Contributions

Conceptualization, D.D.P. and R.K.A.; methodology, D.D.P., R.K.A., A.T., P.V., and K.B.; software, D.D.P., P.V., and A.T.; formal analysis, D.D.P., P.V., A.T., and K.B.; investigation, D.D.P., R.K.A., P.V., K.B., and A.T.; data curation, D.D.P. and J.-K.P.; writing—original draft preparation, D.D.P., P.V., and K.B.; writing—review and editing, R.K.A.; visualization, D.D.P. and J.-K.P.; supervision, D.D.P. and R.K.A.; project administration, R.K.A.; funding acquisition, R.K.A. and D.D.P. All authors have read and agreed to the published version of the manuscript.

Funding

This research was funded by the U.S. Department of Energy (DOE), Office of Energy Efficiency and Renewable Energy (EERE), Hydrogen and Fuel Cell Technologies Office (HFTO), under contract DE-AC02: 06CH11357. The U.S. Government retains for itself, and others acting on its behalf, a paid-up nonexclusive, irrevocable, worldwide license in said article to reproduce, prepare derivative works, distribute copies to the public, and to perform and display this work publicly, by or on behalf of the Government.

Data Availability Statement

The original contributions presented in this study are included in the article material. Further inquiries can be directed to the corresponding author.

Acknowledgments

We acknowledge the support of Zeric Hulvey and Marika Wieliczko from HFTO in this study. Argonne National Laboratory, a U.S. Department of Energy Office of Science laboratory, is operated by UChicago Argonne, LLC, under Contract No. DE-AC02-06CH11357. Pacific Northwest National Laboratory, a U.S. Department of Energy Office of Science laboratory, is operated by Battelle Memorial Institute, under Contract No. DE-AC05-76RL01830.

Conflicts of Interest

The authors declare no conflicts of interest.

References

  1. Chandak, S.; Rout, P.K. The Implementation Framework of a Microgrid: A Review. Int. J. Energy Res. 2021, 45, 3523–3547. [Google Scholar] [CrossRef]
  2. Ahmad, S.; Shafiullah, M.; Ahmed, C.B.; Alowaifeer, M. A Review of Microgrid Energy Management and Control Strategies. IEEE Access 2023, 11, 21729–21757. [Google Scholar] [CrossRef]
  3. Abbasi, M.; Abbasi, E.; Li, L.; Aguilera, R.P.; Lu, D.; Wang, F. Review on the Microgrid Concept, Structures, Components, Communication Systems, and Control Methods. Energies 2023, 16, 484. [Google Scholar] [CrossRef]
  4. Microgrids. Available online: https://www.nrel.gov/grid/microgrids.html (accessed on 29 October 2025).
  5. Cagnano, A.; De Tuglie, E.; Mancarella, P. Microgrids: Overview and Guidelines for Practical Implementations and Operation. Appl. Energy 2020, 258, 114039. [Google Scholar] [CrossRef]
  6. Shahgholian, G. A Brief Review on Microgrids: Operation, Applications, Modeling, and Control. Int. Trans. Electr. Energy Syst. 2021, 31, e12885. [Google Scholar] [CrossRef]
  7. DOE EERE 2021. Available online: https://www.energy.gov/eere/iedo/articles/department-energy-releases-new-tool-tracking-microgrid-installations-united (accessed on 29 October 2025).
  8. Vandoorn, T.L.; De Kooning, J.D.M.; Meersman, B.; Vandevelde, L. Review of Primary Control Strategies for Islanded Microgrids with Power-Electronic Interfaces. Renew. Sustain. Energy Rev. 2013, 19, 613–628. [Google Scholar] [CrossRef]
  9. Raya-Armenta, J.M.; Bazmohammadi, N.; Avina-Cervantes, J.G.; Sáez, D.; Vasquez, J.C.; Guerrero, J.M. Energy Management System Optimization in Islanded Microgrids: An Overview and Future Trends. Renew. Sustain. Energy Rev. 2021, 149, 111327. [Google Scholar] [CrossRef]
  10. Bekhradian, R.; Sanaye-Pasand, M. A Comprehensive Survey on Islanding Detection Methods of Synchronous Generator-Based Microgrids: Issues, Solutions and Future Works. IEEE Access 2022, 10, 76202–76219. [Google Scholar] [CrossRef]
  11. Hossain, M.A.; Pota, H.R.; Hossain, M.J.; Blaabjerg, F. Evolution of Microgrids with Converter-Interfaced Generations: Challenges and Opportunities. Int. J. Electr. Power Energy Syst. 2019, 109, 160–186. [Google Scholar] [CrossRef]
  12. Abuagreb, M.; Allehyani, M.F.; Johnson, B.K. Overview of Virtual Synchronous Generators: Existing Projects, Challenges, and Future Trends. Electronics 2022, 11, 2843. [Google Scholar] [CrossRef]
  13. Kebede, A.A.; Kalogiannis, T.; Van Mierlo, J.; Berecibar, M. A Comprehensive Review of Stationary Energy Storage Devices for Large Scale Renewable Energy Sources Grid Integration. Renew. Sustain. Energy Rev. 2022, 159, 112213. [Google Scholar] [CrossRef]
  14. Al-Shetwi, A.Q.; Hannan, M.A.; Jern, K.P.; Mansur, M.; Mahlia, T.M.I. Grid-Connected Renewable Energy Sources: Review of the Recent Integration Requirements and Control Methods. J. Clean. Prod. 2020, 253, 119831. [Google Scholar] [CrossRef]
  15. Hossain, M.S.; Madlool, N.A.; Rahim, N.A.; Selvaraj, J.; Pandey, A.K.; Khan, A.F. Role of Smart Grid in Renewable Energy: An Overview. Renew. Sustain. Energy Rev. 2016, 60, 1168–1184. [Google Scholar] [CrossRef]
  16. Bihari, S.P.; Sadhu, P.K.; Sarita, K.; Khan, B.; Arya, L.D.; Saket, R.K.; Kothari, D.P. A Comprehensive Review of Microgrid Control Mechanism and Impact Assessment for Hybrid Renewable Energy Integration. IEEE Access 2021, 9, 88942–88958. [Google Scholar] [CrossRef]
  17. García Vera, Y.E.; Dufo-López, R.; Bernal-Agustín, J.L. Energy Management in Microgrids with Renewable Energy Sources: A Literature Review. Appl. Sci. 2019, 9, 3854. [Google Scholar] [CrossRef]
  18. Arévalo, P.; Ochoa-Correa, D.; Villa-Ávila, E. Optimizing Microgrid Operation: Integration of Emerging Technologies and Artificial Intelligence for Energy Efficiency. Electronics 2024, 13, 3754. [Google Scholar] [CrossRef]
  19. Juma, S.A.; Ayeng’o, S.P.; Kimambo, C.Z.M. A Review of Control Strategies for Optimized Microgrid Operations. IET Renew. Power Gener. 2024, 18, 2785–2818. [Google Scholar] [CrossRef]
  20. Grisales-Noreña, L.F.; Vega, H.P.; Montoya, O.D.; Botero-Gómez, V.; Sanin-Villa, D. Cost Optimization of AC Microgrids in Grid-Connected and Isolated Modes Using a Population-Based Genetic Algorithm for Energy Management of Distributed Wind Turbines. Mathematics 2025, 13, 704. [Google Scholar] [CrossRef]
  21. Punitha, S.; Subramaniam, N.P.; Vimal Raj, P.A.D. A Comprehensive Review of Microgrid Challenges in Architectures, Mitigation Approaches, and Future Directions. J. Electr. Syst. Inf. Technol. 2024, 11, 60. [Google Scholar] [CrossRef]
  22. Yekini Suberu, M.; Wazir Mustafa, M.; Bashir, N. Energy Storage Systems for Renewable Energy Power Sector Integration and Mitigation of Intermittency. Renew. Sustain. Energy Rev. 2014, 35, 499–514. [Google Scholar] [CrossRef]
  23. Castillo, A.; Gayme, D.F. Grid-Scale Energy Storage Applications in Renewable Energy Integration: A Survey. Energy Convers. Manag. 2014, 87, 885–894. [Google Scholar] [CrossRef]
  24. Denholm, P.; O’Connell, M.; Brinkman, G.; Jorgenson, J. Overgeneration from Solar Energy in California. A Field Guide to the Duck Chart; Strategic Energy Analysis Center: Golden, CO, USA, 2015. [Google Scholar]
  25. Freitas, S.; Brito, M.C. Non-Cumulative Only Solar Photovoltaics for Electricity Load-Matching. Renew. Sustain. Energy Rev. 2019, 109, 271–283. [Google Scholar] [CrossRef]
  26. Tabassum, S.; Rahman, T.; Islam, A.U.; Rahman, S.; Dipta, D.R.; Roy, S.; Mohammad, N.; Nawar, N.; Hossain, E. Solar Energy in the United States: Development, Challenges and Future Prospects. Energies 2021, 14, 8142. [Google Scholar] [CrossRef]
  27. Cobos, N.G.; Arroyo, J.M.; Alguacil, N.; Wang, J. Robust Energy and Reserve Scheduling Considering Bulk Energy Storage Units and Wind Uncertainty. IEEE Trans. Power Syst. 2018, 33, 5206–5216. [Google Scholar] [CrossRef]
  28. van der Linden, S. Bulk Energy Storage Potential in the USA, Current Developments and Future Prospects. Energy 2006, 31, 3446–3457. [Google Scholar] [CrossRef]
  29. Pickard, W.F.; Shen, A.Q.; Hansing, N.J. Parking the Power: Strategies and Physical Limitations for Bulk Energy Storage in Supply–Demand Matching on a Grid Whose Input Power Is Provided by Intermittent Sources. Renew. Sustain. Energy Rev. 2009, 13, 1934–1945. [Google Scholar] [CrossRef]
  30. Wadia, C.; Albertus, P.; Srinivasan, V. Resource Constraints on the Battery Energy Storage Potential for Grid and Transportation Applications. J. Power Sources 2011, 196, 1593–1598. [Google Scholar] [CrossRef]
  31. AL Shaqsi, A.Z.; Sopian, K.; Al-Hinai, A. Review of Energy Storage Services, Applications, Limitations, and Benefits. Energy Rep. 2020, 6, 288–306. [Google Scholar] [CrossRef]
  32. Abraham, K.M. Prospects and Limits of Energy Storage in Batteries. J. Phys. Chem. Lett. 2015, 6, 830–844. [Google Scholar] [CrossRef]
  33. Schoenung, S. Economic Analysis of Large-Scale Hydrogen Storage for Renewable Utility Applications; Sandia National Laboratories: Albuquerque, NM, USA; Livermore, CA, USA, 2011. [Google Scholar]
  34. Environmental and Energy Study Institute. Fact Sheet, Energy Storage (2019). 22 February 2019. Available online: https://www.eesi.org/papers/view/energy-storage-2019 (accessed on 29 October 2025).
  35. Qi, N.; Huang, K.; Fan, Z.; Xu, B. Long-Term Energy Management for Microgrid with Hybrid Hydrogen-Battery Energy Storage: A Prediction-Free Coordinated Optimization Framework. Appl. Energy 2025, 377, 124485. [Google Scholar] [CrossRef]
  36. California Hybrid Hydrogen Fuel Cell and Battery Storage Facility Is Now Online. Available online: https://pv-magazine-usa.com/2025/09/30/california-hybrid-hydrogen-fuel-cell-and-battery-storage-facility-is-now-online/ (accessed on 29 October 2025).
  37. Hybrid Microgrid Combines Hydrogen Fuel Cells with Battery Storage. Available online: https://www.powermag.com/hybrid-microgrid-combines-hydrogen-fuel-cells-with-battery-storage/ (accessed on 29 October 2025).
  38. Energy Vault, PG&E Launch ‘World’s First’ Ultra-Long Duration Hybrid Battery + Hydrogen Energy Storage Microgrid. Available online: https://www.power-eng.com/hydrogen/energy-vault-pge-launch-worlds-first-ultra-long-duration-hybrid-battery-hydrogen-energy-storage-microgrid/ (accessed on 29 October 2025).
  39. Guo, X.; Gu, F.; Liu, H.; Yu, Y.; Li, R.; Wang, J. Sustainable PV-Hydrogen-Storage Microgrid Energy Management Using a Hierarchical Economic Model Predictive Control Framework. Energy Inform. 2025, 8, 18. [Google Scholar] [CrossRef]
  40. Hua, T.Q.; Ahluwalia, R.K.; Peng, J.-K.; Kromer, M.; Lasher, S.; McKenney, K.; Law, K.; Sinha, J. Technical Assessment of Compressed Hydrogen Storage Tank Systems for Automotive Applications. Int. J. Hydrogen Energy 2011, 36, 3037–3049. [Google Scholar] [CrossRef]
  41. Hassan, I.A.; Ramadan, H.S.; Saleh, M.A.; Hissel, D. Hydrogen Storage Technologies for Stationary and Mobile Applications: Review, Analysis and Perspectives. Renew. Sustain. Energy Rev. 2021, 149, 111311. [Google Scholar] [CrossRef]
  42. Barthelemy, H.; Weber, M.; Barbier, F. Hydrogen Storage: Recent Improvements and Industrial Perspectives. Int. J. Hydrogen Energy 2017, 42, 7254–7262. [Google Scholar] [CrossRef]
  43. Zohuri, B. Cryogenics and Liquid Hydrogen Storage. In Hydrogen Energy; Springer International Publishing: Cham, Switzerland, 2019; pp. 121–139. [Google Scholar]
  44. Valenti, G. Hydrogen Liquefaction and Liquid Hydrogen Storage. In Compendium of Hydrogen Energy; Elsevier: Amsterdam, The Netherlands, 2016; pp. 27–51. [Google Scholar]
  45. Ezzat, M.F.; Dincer, I. Development and Assessment of a New Hybrid Vehicle with Ammonia and Hydrogen. Appl. Energy 2018, 219, 226–239. [Google Scholar] [CrossRef]
  46. Inal, O.B.; Zincir, B.; Deniz, C. Investigation on the Decarbonization of Shipping: An Approach to Hydrogen and Ammonia. Int. J. Hydrogen Energy 2022, 47, 19888–19900. [Google Scholar] [CrossRef]
  47. Cechetto, V.; Di Felice, L.; Gallucci, F. Advances and Perspectives of H2 Production from NH 3 Decomposition in Membrane Reactors. Energy Fuels 2023, 37, 10775–10798. [Google Scholar] [CrossRef]
  48. Lamb, K.E.; Dolan, M.D.; Kennedy, D.F. Ammonia for Hydrogen Storage; A Review of Catalytic Ammonia Decomposition and Hydrogen Separation and Purification. Int. J. Hydrogen Energy 2019, 44, 3580–3593. [Google Scholar] [CrossRef]
  49. Engelbrecht, N.; Chiuta, S.; Bessarabov, D.G. A Highly Efficient Autothermal Microchannel Reactor for Ammonia Decomposition: Analysis of Hydrogen Production in Transient and Steady-State Regimes. J. Power Sources 2018, 386, 47–55. [Google Scholar] [CrossRef]
  50. Papadias, D.D.; Peng, J.-K.; Ahluwalia, R.K. Hydrogen Carriers: Production, Transmission, Decomposition, and Storage. Int. J. Hydrogen Energy 2021, 46, 24169–24189. [Google Scholar] [CrossRef]
  51. Preuster, P.; Papp, C.; Wasserscheid, P. Liquid Organic Hydrogen Carriers (LOHCs): Toward a Hydrogen-Free Hydrogen Economy. Acc. Chem. Res. 2017, 50, 74–85. [Google Scholar] [CrossRef]
  52. Hydrogenious LOHC. Available online: https://hydrogenious.net/ (accessed on 29 October 2025).
  53. Jorschick, H.; Geißelbrecht, M.; Eßl, M.; Preuster, P.; Bösmann, A.; Wasserscheid, P. Benzyltoluene/Dibenzyltoluene-Based Mixtures as Suitable Liquid Organic Hydrogen Carrier Systems for Low Temperature Applications. Int. J. Hydrogen Energy 2020, 45, 14897–14906. [Google Scholar] [CrossRef]
  54. Held, M.; Rieck, A.; Bajohr, S.; Kolb, T. Hydrogenation of Dibenzyl Toluene—A Competing Side Reaction in Three Phase Methanation. Int. J. Hydrogen Energy 2025, 132, 166–173. [Google Scholar] [CrossRef]
  55. National Fire Protection Association. Flammable and Combustible Liquids Code. Available online: https://www.nfpa.org/codes-and-standards/nfpa-30-standard-development/30 (accessed on 29 October 2025).
  56. Modisha, P.M.; Ouma, C.N.M.; Garidzirai, R.; Wasserscheid, P.; Bessarabov, D. The Prospect of Hydrogen Storage Using Liquid Organic Hydrogen Carriers. Energy Fuels 2019, 33, 2778–2796. [Google Scholar] [CrossRef]
  57. Müller, K.; Stark, K.; Emel’yanenko, V.N.; Varfolomeev, M.A.; Zaitsau, D.H.; Shoifet, E.; Schick, C.; Verevkin, S.P.; Arlt, W. Liquid Organic Hydrogen Carriers: Thermophysical and Thermochemical Studies of Benzyl- and Dibenzyl-Toluene Derivatives. Ind. Eng. Chem. Res. 2015, 54, 7967–7976. [Google Scholar] [CrossRef]
  58. Müller, K.; Aslam, R.; Fischer, A.; Stark, K.; Wasserscheid, P.; Arlt, W. Experimental Assessment of the Degree of Hydrogen Loading for the Dibenzyl Toluene Based LOHC System. Int. J. Hydrogen Energy 2016, 41, 22097–22103. [Google Scholar] [CrossRef]
  59. Jorschick, H.; Dürr, S.; Preuster, P.; Bösmann, A.; Wasserscheid, P. Operational Stability of a LOHC-Based Hot Pressure Swing Reactor for Hydrogen Storage. Energy Technol. 2019, 7, 146–152. [Google Scholar] [CrossRef]
  60. Ali, A.; Kumar G, U.; Lee, H.J. Parametric Study of the Hydrogenation of Dibenzyltoluene and Its Dehydrogenation Performance as a Liquid Organic Hydrogen Carrier. J. Mech. Sci. Technol. 2020, 34, 3069–3077. [Google Scholar] [CrossRef]
  61. Jorschick, H.; Preuster, P.; Dürr, S.; Seidel, A.; Müller, K.; Bösmann, A.; Wasserscheid, P. Hydrogen Storage Using a Hot Pressure Swing Reactor. Energy Environ. Sci. 2017, 10, 1652–1659. [Google Scholar] [CrossRef]
  62. Wunsch, A.; Gapp, E.; Peters, T.; Pfeifer, P. Impact of Product Gas Impurities from Dehydrogenation of Perhydro-Dibenzyltoluene on the Performance of a 10 Μm PdAg-Membrane. J. Memb. Sci. 2021, 628, 119094. [Google Scholar] [CrossRef]
  63. Jorschick, H.; Vogl, M.; Preuster, P.; Bösmann, A.; Wasserscheid, P. Hydrogenation of Liquid Organic Hydrogen Carrier Systems Using Multicomponent Gas Mixtures. Int. J. Hydrogen Energy 2019, 44, 31172–31182. [Google Scholar] [CrossRef]
  64. Luschtinetz, T.; Sklarow, A.; Gulden, J. Degradation Effects on PEM Fuel Cells Supplied with Hydrogen from a LOHC System. Appl. Mech. Mater. 2016, 839, 165–169. [Google Scholar] [CrossRef]
  65. Bulgarin, A.; Jorschick, H.; Preuster, P.; Bösmann, A.; Wasserscheid, P. Purity of Hydrogen Released from the Liquid Organic Hydrogen Carrier Compound Perhydro Dibenzyltoluene by Catalytic Dehydrogenation. Int. J. Hydrogen Energy 2020, 45, 712–720. [Google Scholar] [CrossRef]
  66. Papadias, D.D.; Ahmed, S.; Kumar, R.; Joseck, F. Hydrogen Quality for Fuel Cell Vehicles—A Modeling Study of the Sensitivity of Impurity Content in Hydrogen to the Process Variables in the SMR–PSA Pathway. Int. J. Hydrogen Energy 2009, 34, 6021–6035. [Google Scholar] [CrossRef]
  67. Woods, D.R. Rules of Thumb in Engineering Practice; Wiley-VCH: Oakville, ON, Canada, 2007; ISBN 9783527312207. [Google Scholar]
  68. Silla, H. Chemical Process Engineering—Design and Engineering; Heinemann, H., Ed.; Marcel Dekker: New York, NY, USA, 2005. [Google Scholar]
  69. Ahluwalia, R.K.; Wang, X.; Papadias, D.D.; Star, A.G. Performance and Total Cost of Ownership of a Fuel Cell Hybrid Mining Truck. Energies 2022, 16, 286. [Google Scholar] [CrossRef]
  70. Borup, R.L.; Kusoglu, A.; Neyerlin, K.C.; Mukundan, R.; Ahluwalia, R.K.; Cullen, D.A.; More, K.L.; Weber, A.Z.; Myers, D.J. Recent Developments in Catalyst-Related PEM Fuel Cell Durability. Curr. Opin. Electrochem. 2020, 21, 192–200. [Google Scholar] [CrossRef]
  71. Ahluwalia, R.K.; Wang, X.; Peng, J.-K.; Konduru, V.; Arisetty, S.; Ramaswamy, N.; Kumaraguru, S. Achieving 5000-h and 8000-h Low-PGM Electrode Durability on Automotive Drive Cycles. J. Electrochem. Soc. 2021, 168, 044518. [Google Scholar] [CrossRef]
  72. Wang, X.; Star, A.G.; Ahluwalia, R.K. Performance of Polymer Electrolyte Membrane Water Electrolysis Systems: Configuration, Stack Materials, Turndown and Efficiency. Energies 2023, 16, 4964. [Google Scholar] [CrossRef]
  73. Ahluwalia, R.K.; Wang, X.; Star, A.G.; Papadias, D.D. Performance and Cost of Fuel Cells for Off-Road Heavy-Duty Vehicles. Int. J. Hydrogen Energy 2022, 47, 10990–11006. [Google Scholar] [CrossRef]
  74. Ahluwalia, R.K.; Peng, J.-K.; Wang, X.; Papadias, D.; Kopasz, J. Performance and Cost of Fuel Cells for Urban Air Mobility. Int. J. Hydrogen Energy 2021, 46, 36917–36929. [Google Scholar] [CrossRef]
  75. System Advisor Model. Available online: https://sam.nrel.gov/ (accessed on 29 October 2025).
  76. Commercial and Residential Hourly Load Profiles for All TMY3 Locations in the United States. Available online: https://data.openei.org/submissions/153 (accessed on 29 October 2025).
  77. IRENA. Future of Solar Photovoltaic: Deployment, Investment, Technology, Grid Integration and Socio-Economic Aspects (A Global Energy Transformation: Paper); International Renewable Energy Agency: Abu Dhabi, United Arab Emirates, 2019; Available online: https://www.irena.org/publications/2019/nov/future-of-solar-photovoltaic (accessed on 29 October 2025).
  78. IRENA. Future of Wind: Deployment, Investment, Technology, Grid Integration and Socio-Economic Aspects (A Global Energy Transformation Paper); International Renewable Energy Agency: Abu Dhabi, United Arab Emirates, 2019; Available online: https://www.irena.org/publications/2019/oct/future-of-wind (accessed on 29 October 2025).
  79. Vignesh, R.; Feldman, D.; Desai, J.; Margolis, R. U.S. Solar Photovoltaic System and Energy Storage Cost Benchmarks: Q1 2021; NREL: Golden, CO, USA, 2021. [Google Scholar]
  80. 2030 Solar Cost Targets. Available online: https://www.energy.gov/eere/solar/solar-energy-technologies-office-updated-2030-goals-utility-scale-photovoltaics (accessed on 29 October 2025).
  81. Wiser, R.; Bolinger, M.; Hoen, B.; Millstein, D.; Rand, J.; Barbose, G.; Darghouth, N.; Gorman, W.; Jeong, S.; Mills, A.; et al. Land-Based Wind Market Report: 2021 Edition; U.S. Department of Energy: Alexandria, VA, USA, 2021.
  82. Stehly, T.; Duffy, P. 2020 Cost of Wind Energy Review; NREL: Golden, CO, USA, 2020. [Google Scholar]
  83. Badgett, A.; Brauch, J.; Thatte, A.; Rubin, R.; Skangos, C.; Wang, X.; Ahluwalia, R.; Pivovar, B.; Ruth, M. Updated Manufactured Cost Analysis for Proton Exchange Membrane Water Electrolyzers; NREL: Golden, CO, USA, 2024. [Google Scholar]
  84. Dibenzyl Toluene Market Size. Available online: https://www.researchnester.com/reports/dibenzyl-toluene-market/3348 (accessed on 29 October 2025).
  85. Tulus, V.; Pérez-Ramírez, J.; Guillén-Gosálbez, G. Planetary Metrics for the Absolute Environmental Sustainability Assessment of Chemicals. Green. Chem. 2021, 23, 9881–9893. [Google Scholar] [CrossRef]
  86. Zuiderveen, E.A.R.; Caldeira, C.; Vries, T.; Schenk, N.J.; Huijbregts, M.A.J.; Sala, S.; Hanssen, S.V.; van Zelm, R. Evaluating the Environmental Sustainability of Alternative Ways to Produce Benzene, Toluene, and Xylene. ACS Sustain. Chem. Eng. 2024, 12, 5092–5104. [Google Scholar] [CrossRef] [PubMed]
  87. Modisha, P.; Bessarabov, D. Stress Tolerance Assessment of Dibenzyltoluene-Based Liquid Organic Hydrogen Carriers. Sustain. Energy Fuels 2020, 4, 4662–4670. [Google Scholar] [CrossRef]
  88. Cho, H.H.; Strezov, V.; Evans, T.J. Life Cycle Assessment of Renewable Hydrogen Transport by Liquid Organic Hydrogen Carriers. J. Clean. Prod. 2024, 469, 143130. [Google Scholar] [CrossRef]
  89. Straathof, A.J.J.; Bampouli, A. Potential of Commodity Chemicals to Become Bio-based According to Maximum Yields and Petrochemical Prices. Biofuels Bioprod. Biorefining 2017, 11, 798–810. [Google Scholar] [CrossRef]
  90. IMARC Group. Bio-Based Toluene Manufacturing Plant Project Report. Available online: https://www.imarcgroup.com/bio-based-toluene-manufacturing-plant-project-report (accessed on 29 October 2025).
  91. Hydrogen Supply and Transportation Using Liquid Organic Hydrogen Carriers (HYSTOC), H2020-JTI FCH-2017-1, Grant Agreement: 779694. 2019. Available online: https://cordis.europa.eu/project/id/779694 (accessed on 29 October 2025).
  92. DOE H2A Production Analysis. Available online: https://www.hydrogen.energy.gov/h2a_production.html (accessed on 29 October 2025).
  93. Ba, J.; Gao, R.; Shi, D.; Nessa, H.A.; Shi, C.; Zhang, X.; Pan, L.; Zou, J.-J. Progress in Catalysts for Hydrogen Storage/Release in MBT/DBT Based LOHCs: A Review. Chem. Commun. 2025, 61, 8619–8631. [Google Scholar] [CrossRef]
  94. Ali, A.; Khan, M.A.; Choi, H. Hydrogen Storage Prediction in Dibenzyltoluene as Liquid Organic Hydrogen Carrier Empowered with Weighted Federated Machine Learning. Mathematics 2022, 10, 3846. [Google Scholar] [CrossRef]
  95. Niermann, M.; Drünert, S.; Kaltschmitt, M.; Bonhoff, K. Liquid Organic Hydrogen Carriers (LOHCs)—Techno-Economic Analysis of LOHCs in a Defined Process Chain. Energy Environ. Sci. 2019, 12, 290–307. [Google Scholar] [CrossRef]
  96. Marlotherm Heat Transfer Fluids. Available online: https://info.eastman.com/marlotherm_lh_and_sh.html (accessed on 29 October 2025).
  97. Energy Storage Costs. Available online: https://www.irena.org/energy-transition/technology/energy-storage (accessed on 29 October 2025).
  98. Papadias, D.D.; Ahluwalia, R.K. Bulk Storage of Hydrogen. Int. J. Hydrogen Energy 2021, 46, 34527–34541. [Google Scholar] [CrossRef]
  99. Ji, X.; Louarn, E.; Fache, F.; Vanoye, L.; Bonhommé, A.; Pitault, I.; Meille, V. Analysis of Dibenzyltoluene Mixtures: From Fast Analysis to In-Depth Characterization of the Compounds. Molecules 2023, 28, 3751. [Google Scholar] [CrossRef]
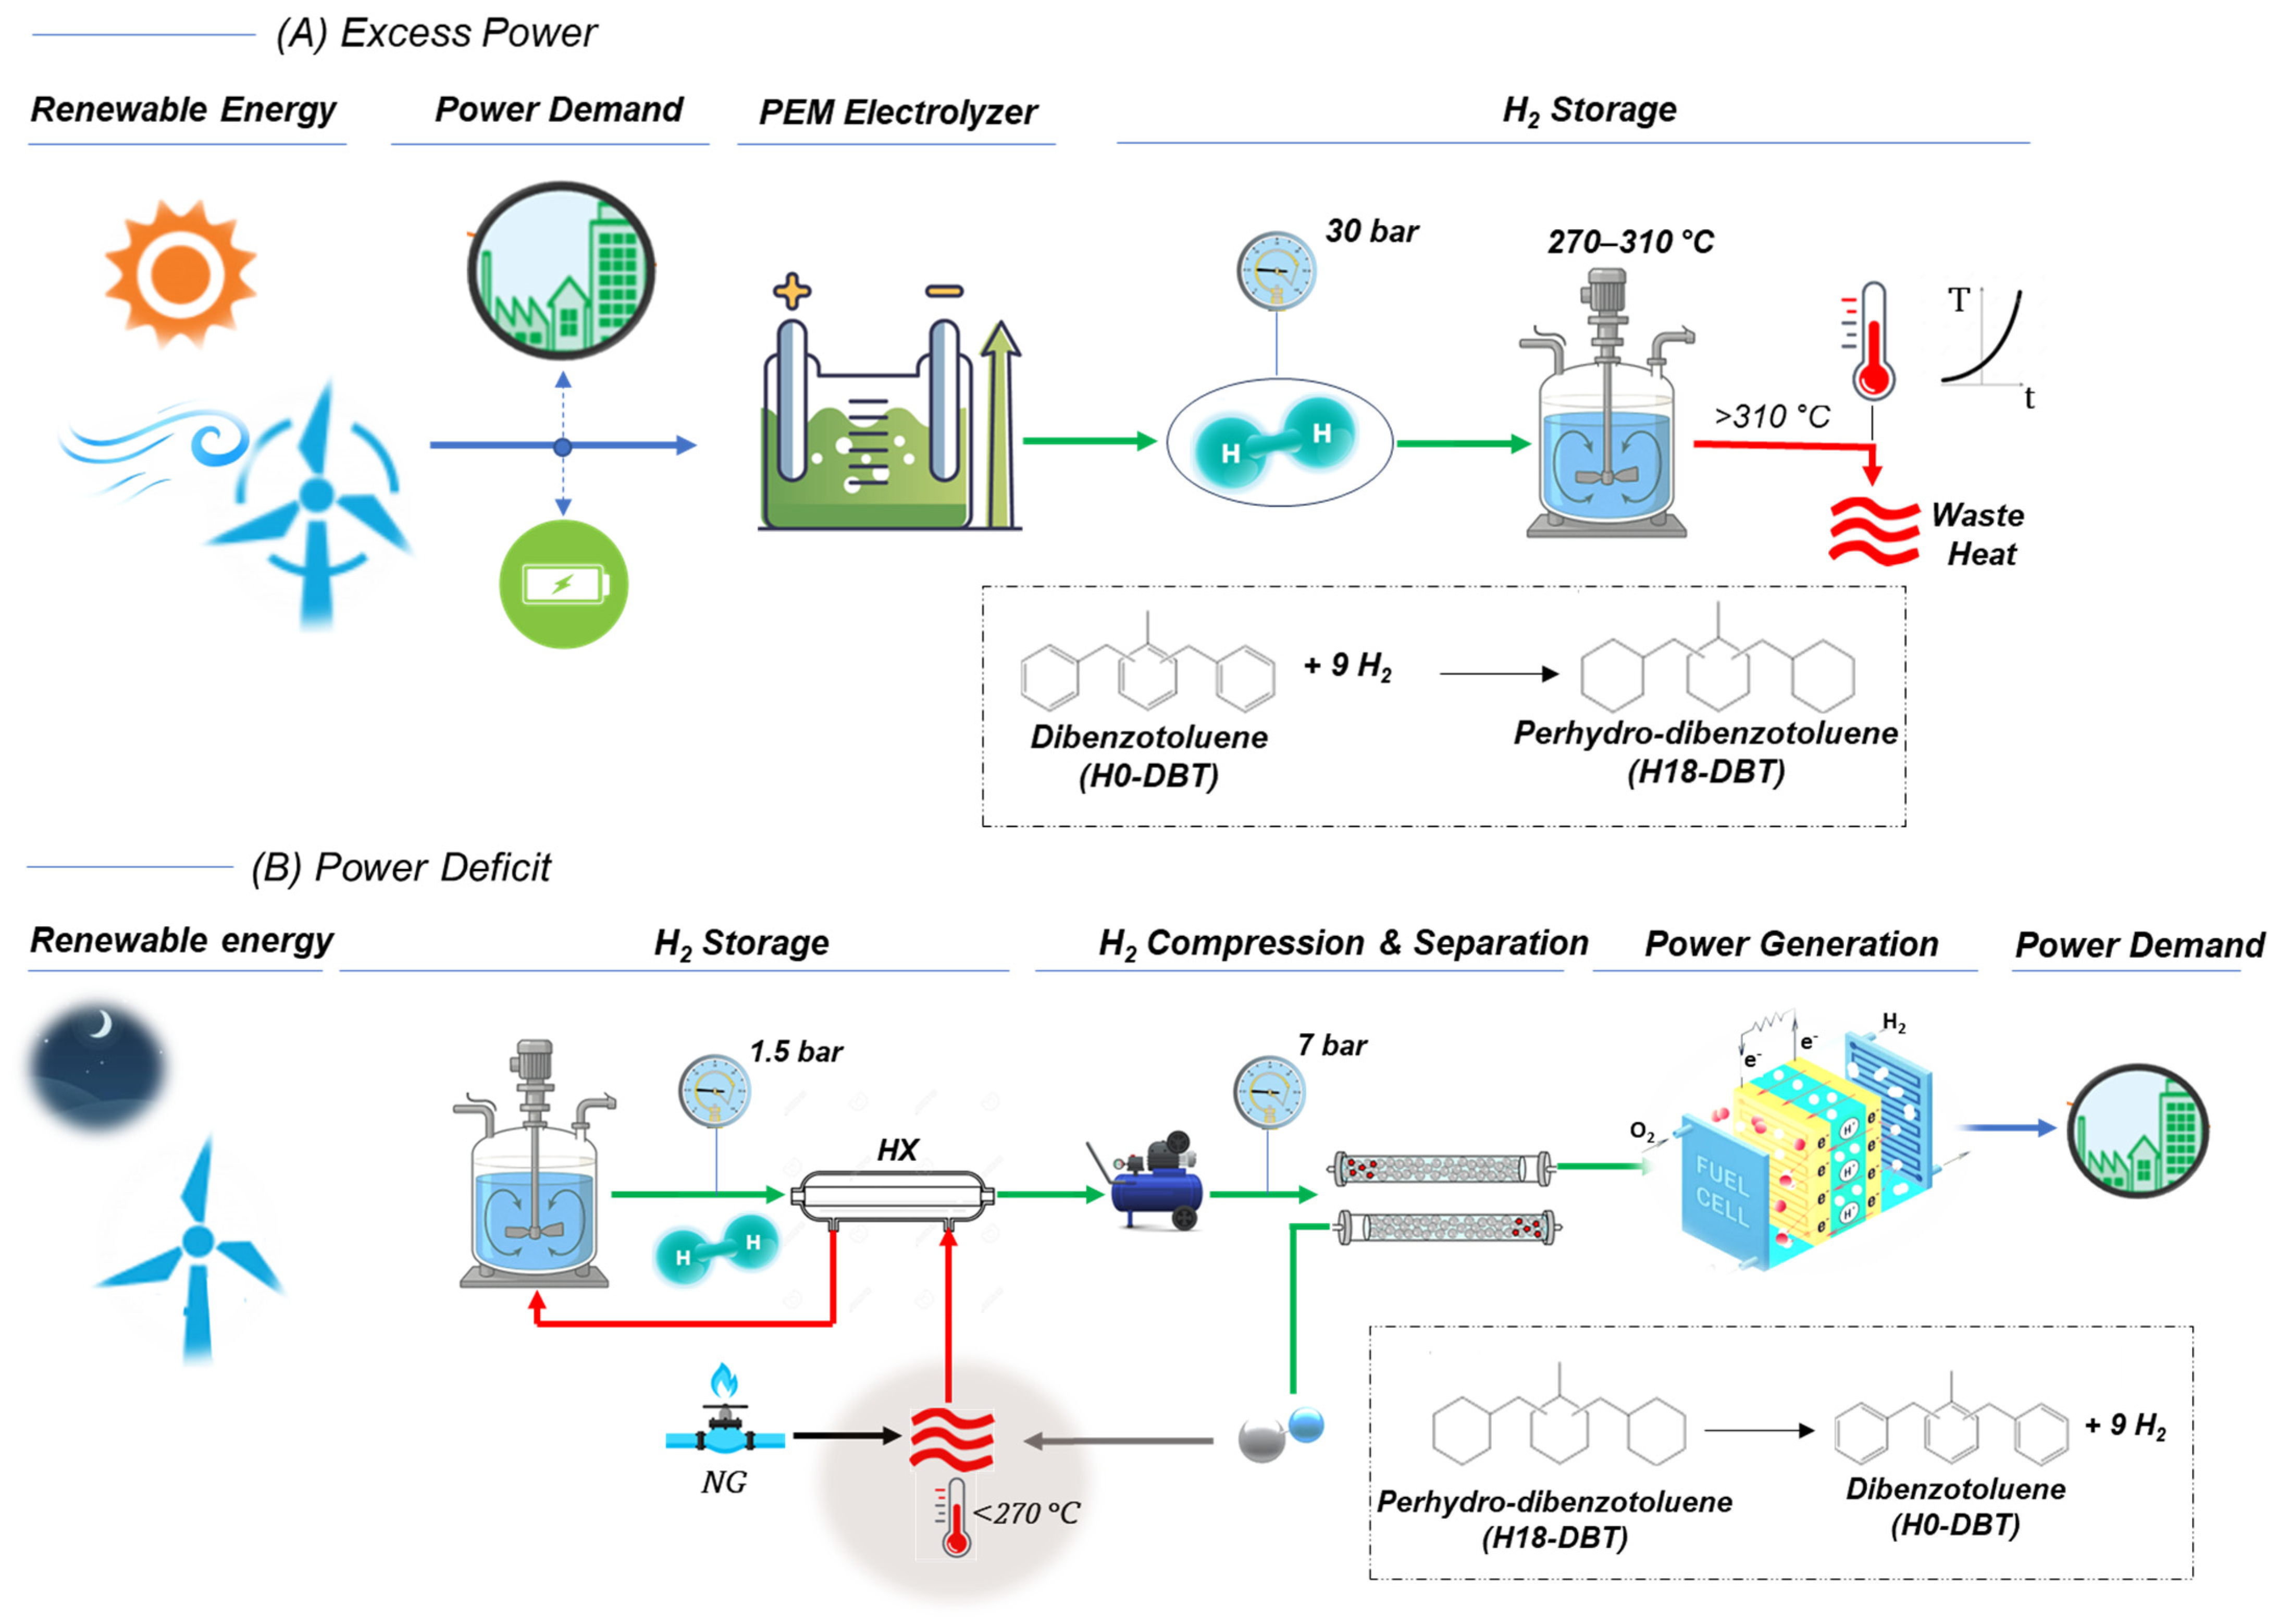
Figure 1. Schematic illustrating the DBT single reactor hydrogen storage process. Arrow colors denote the following: blue for power, green for H2, red for heat, gray for waste streams, and black for (NG).
Energies 18 05775 g001
Figure 2. (a) Steady-state fuel cell efficiency and (b) electrolyzer’s specific energy consumption.
Energies 18 05775 g002
Figure 3. Normalized hourly power demand profiles.
Energies 18 05775 g003
Figure 4. Power demand and supply profiles for a medium-sized office. Top panel = 100% wind; mid panel = 100% solar; lower panel = mix 50% wind/50% solar.
Energies 18 05775 g004
Figure 5. Historical and projected installed capital cost of (a) on-shore wind and (b) solar photovoltaic system.
Energies 18 05775 g005
Figure 6. Estimated DBT production cost at various scales.
Energies 18 05775 g006
Figure 7. Degree of hydrogenation/dehydrogenation, experimental vs. modeled performance at T = 290 °C [59].
Energies 18 05775 g007
Figure 8. (a) Annual hydrogen storage requirement for an industrial application of power demand with wind and solar as alternative energy. (b) Relative catalyst activity degradation as a function of hydrogen charge/discharge.
Energies 18 05775 g008
Figure 9. Annual single-reactor temperature data and corresponding energy reduction percentages, compared to a dual reactor system, are presented for industrial power demand.
Energies 18 05775 g009
Figure 10. Capacity and performance.
Energies 18 05775 g010
Figure 11. Levelized cost of micro-grid system components.
Energies 18 05775 g011
Figure 12. Total cost of the micro-grid system.
Energies 18 05775 g012
Figure 13. LCOE considers underground pipes, DBT, MCH, and salt caverns as a storage medium for hydrogen. The case considers industrial power demand with future cost projections.
Energies 18 05775 g013
Figure 14. LCOE considers a battery as a storage option.
Energies 18 05775 g014
Table 1. Hydrogen carriers, including both two-way and one-way carriers, as compared to liquid and compressed hydrogen. Molecular weight is based on the hydrogenated form.
Hydrogen Carrier CompoundMol. Wt.DensityGrav. Cap.Vol. Cap.ΔH°ΔS°
(g mol−1)(g cm−3)(wt. %)(g L−1)(kJ mol−1)(JK−1mol−1)
Liquid Hydrogen (20 K)2.020.0710070--
Compressed (350 bar)2.020.02610026--
Two-Way Carriers
H18-DBT (l)/DBT (l)290.400.926.25765120
Ethanol (l)/Ethyl acetate (l)46.070.7894.43536101
Methylcyclohexane/Toluene (l)98.190.776.24768119
1,4-Butanediol (l)/g-butyrolactone (l)90.121.0174.54643118
6 M Potassium Formate/Bicarbonate84.121.260.95122060
One-Way Carriers
Ammonia NH3 (l)/H2 + N217.030.6117.010846193
Methanol Reforming/H2 + CO232.040.79215.712544136
Formic Acid (l)/H2 + CO246.031.224.45332213
Disclaimer/Publisher’s Note: The statements, opinions and data contained in all publications are solely those of the individual author(s) and contributor(s) and not of MDPI and/or the editor(s). MDPI and/or the editor(s) disclaim responsibility for any injury to people or property resulting from any ideas, methods, instructions or products referred to in the content.