Abstract
Clean and sustainable electricity could be generated from hydrogen produced from renewable energy resources. This paper performs an assessment of Energy, Economic and Environmental (3E) potentials of hydrogen fuel cells for electricity generation in Vesleskarvet. This site is a remote area located in Antarctica and is being used as the base for South African National Antarctic Programme (SANAE IV). The hydrogen used as feedstock to the fuel cell was generated from the wind energy resource of Vesleskarvet using water electrolysis technique. Four large wind turbines—DE Wind D7, ServionSE MM100, Alstom E110 and Gamesa G128 designated as WT1, WT2, WT3 and WT4, respectively—were selected to determine which of them best matches the wind characteristics of the site for hydrogen production. Key results reveal that the capacity factor of the wind turbines is 62.78%, 58.37%, 63.80% and 57.94%, respectively. WT4 has the best annual hydrogen productions potential of about 307 tons per annum with the cost of electricity of 2.47 USD/kWh and payback period of 5.4 years. The wind turbine will prevent the use of 1.76 × 10⁶ litters of diesel fuel resulting in a reduction of CO2 and CO emission of 4.83 × 10⁶ and 1.37 × 10⁴, respectively.
1. Introduction
Vesleskarvet is a South African base located in Antarctica and is used for research purposes throughout the year in the area of physical sciences such as biology, marine, geology, oceanography, etc. [1]. Electricity and heat needs for the researchers as well as their research activities are met using diesel generators. In recent times, efforts have been geared towards using renewable energy resources to cut down on its carbon footprint as well as to reduce the high cost associated with diesel fuel which accounts for the bulk of running expenses at the location [2]. Of the various renewable energy sources in Antarctica, wind was identified as a resources which could help support the required electricity and heat demands [3]. In fact, Antarctica is known to have the best wind resources in the world [1], hence the need to determine how best this resource could be harnessed for energy support.
One of the reasons wind generators are often disregarded by the utility operators is the intermittent nature of wind speeds which could change at any given time thereby creating mismatch between the demands and supply. The incessant changeable nature of wind speeds could undermine the integrity of the grids and could also lead to an increase cost of ancillary services [4]. Storage technology has been identified as one of the strategies of mitigating the intermittent nature of wind power and one of the identified storage technologies is the use of hydrogen storage [5]. The stored hydrogen via electrolyser could be used to generate electricity via fuel cells thereby acting as good electricity storage. While hydrogen stores electricity in chemical form, the fuel cells converts back into electricity and deliver to the grid when required [6]. Hydrogen therefore has the capability to mitigate the intermittency in electricity generation by providing the required balance between surplus and shortage [7]. Hydrogen can totally replace conventional fossil fuels since it has properties (both physical and chemical) that are comparable to fossil fuel. Also, environmental pollution as well as transportation costs could be significantly reduced since hydrogen can be locally produced [8]. There are various ways to produce hydrogen; however, water electrolysis remains one of the most sustainable techniques for generating hydrogen using wind resources [9,10].
Different studies have explored the feasibility of hydrogen generation from wind energy in various parts of the world. For example, Apostolou and Enevoldsen [11] highlighted the potential of hydrogen as a versatile energy storage medium capable of enhancing the utilization of wind power. It was pointed out that wind–hydrogen coupled systems could support autonomous electrical networks as well as mitigate CO2 emissions significantly. Alavi et al. [12] conducted an assessment of wind energy potential for sustainable hydrogen production in the southeastern region of Sistan and Baluchestan, Iran. In their study, four wind turbines with capacities ranging from 300 kW to 900 kW were evaluated for hydrogen production using their wind turbine power curve and Weibull model. The result revealed that the EWT Directwind 500/54 turbine demonstrated superior performance, with the highest capacity factor of 50.77% at Lutak location. It was also reported that the turbine produced 39.82 tons of hydrogen per annum. In another separate investigation conducted by the same authors, Alavi et al. [13] performed a feasibility study on the use of wind energy systems for hydrogen production in Chabahar. It was concluded that Vestas V164 wind turbine presented the highest hydrogen production with the yearly value of 194.36 tons per annum. Kodicherla et al. [14] examined hydrogen production potential from wind resources at three selected sites in the Fiji Islands. In their study, six wind turbine models with varying rated capacities and design characteristics i.e., Polaris P15-50, Vestas V47, Polaris P50-500, Polaris P62-1000, WWD 1–60, and Vestas V110-2.0, were evaluated for comparative analysis. The authors revealed that Vestas V110-2.0 provided the highest capacity factors of 77.06% among the wind turbines for the station at Labasa in Fiji. A feasibility study on hydrogen production from wind energy resources of Ghardaia was investigated by Aiche-Hamane [15]. The analysis focused on estimating the hydrogen production rate of a 5 kW electrolyser supplied with electricity from a 10 kW wind turbine. The variation in monthly hydrogen production was also studied. The authors showed that hydrogen production rate from wind-hydrogen systems was greatly influenced by the height of wind turbines. It was also revealed that the maximum hydrogen production from wind resource of Ghardaia was in the month of May with the value of about 395 Nm3, while the minimum production was in the month of October with the value of 187 Nm3. In the work of Douak and Settou [16], an assessment of wind energy potential and economic prospects for hydrogen generation was carried out at three chosen sites in Algeria. Various wind turbines were also investigated in terms of capacity factor, energy production and hydrogen generation potential. It was found that variations in electricity cost have a substantial effect on the economics of hydrogen production, followed by electrolyser expenses and investment. Generally, hydrogen production is greatly influenced by both the location of the site as well as the choice of wind turbine employed. Research has shown that larger wind turbines favour hydrogen production at a lower cost compared to smaller wind turbines [17], hence larger wind turbines should come to mind when hydrogen production is the focus.
Hybrid renewable energies (i.e., consisting of two or more renewable energy sources) have also been utilised for the production of hydrogen. For example, the possibility of using excess energy from hybrids between hydropower and wind power for hydrogen production in Brazil has been conducted by Nadaleti et al. [18]. The authors concluded that 3 h of hydrogen production per day using surplus energy from the hybrid renewable energy farm would generate Nm3 It was also revealed that total of 42.78 MWh per annum excess power corresponding to 4.88 kW was utilized in the electrolyser per annum with the cost of energy of about 0.303 USD/kWh. Similarly, Sorgulu and Dincer [19] have utilised the hybrid of concentrated solar power and wind energy systems in combination with electrolyser, fuel cell and absorption cooling subsystems to supply power and hydrogen to a residential building. The results of the study showed that the hybrid system was both technically and economically viable, while also being efficient, sustainable, and environmentally benign. It was also revealed that a total of 42.78 MWh per annum excess energy, corresponding to a continuous power of 4.88 kW, was utilized in the electrolyser to produce hydrogen at the rate of 0.035 g/s by an electrolyser with a cell area of 50 cm2.
Some researchers have also conducted research on the economic viability of hydrogen production from wind energy generators: Ayodele and Munda [20] explored the financial practicality of producing hydrogen from wind-generated electricity from 15 locations in the coastal region of South Africa using 11 different wind turbines. It was concluded that site Napier presented the best yield of hydrogen production with 226.82 metric tons of hydrogen at 1.4 USD/kg using wind turbine (Gamesa G128) having a rated power of 4.5 MW, cut in, rated and cut-out wind speeds of 4 m/s, 13 m/s and 18 m/s, respectively. Techno-economic analysis of hydrogen refuelling stations powered by hybrid of wind and photovoltaics (PV) system was performed for Izmir-Cesme, Turkey using HOMER simulation software [21]. The authors revealed that the levelised cost of hydrogen generation was between USD7.526–7.866/kg indicating that renewable energy-based hydrogen refuelling stations could be implemented in İzmir–Çeşme, Turkey with economic feasibility. Igbal et al. [22] investigated the economic feasibility using wind energy potential of eight sites in Sindh province of Pakistan. The study demonstrated that producing renewable hydrogen using wind resources is financially sustainable at the levelized cost of 4.02–4.310 USD/kg-H2 depending on the amount of wind energy accessible for electricity production. It was also demonstrated that the total electricity that could be generated from wind power in Pakistan is 119,410 MW; this could generate approximately 5200 kg of hydrogen per day.
While hydrogen generation potential as well as its economic viability have been evaluated for many potential sites around the world, little has been done on the electricity generation potential derivable from such green hydrogen when used as a feedstock to fuel cells in a standalone system with the objective of generating electricity. Moreover, there is a paucity of literature on the environmental benefits of utilizing hydrogen-fuel electricity generators over diesel generators for remote locations. Since hydrogen can be produced at the point of use, stored and used for electricity generation when required, then hydrogen-based fuel cells can be used as a substitute for diesel generators that are currently being used at the SANAE IV station. Also, the variability issue associated with wind turbines can totally be eliminated. This paper therefore contributes in this direction by first evaluating the amount of hydrogen that could be produced from Vesleskarvet and then determining the electricity generation potential from such generated hydrogen for electricity generation via fuel cells. The economic and environmental benefits of such arrangement over diesel generator were also determined.
2. Site Description and Data Collection
Vesleskarvet Nunataks is located in Antarctica and it serves as a South African base for the National Antarctic Expedition usually referred to SANAE IV [23]. The site is located at latitude 71°40′22″ S and longitude 2°50′26″ W [24]. The site has abundant wind resources which could be a great potential for hydrogen production [1]. However, the site has the challenge of low temperature which can go as low as −40 °C during winters [25] and this could be detrimental to the operating design of wind turbines since they are designed to operate between temperatures of −10 °C and +40 °C [26]. In recent times, wind turbines are now equipped with heating devices that could allow them to operate in extreme weather conditions and this could be deployed in a site like Veslaskarvet [27]. The data used in this study to evaluate the potential of hydrogen production obtainable from Vesleskarvet consisted of daily average wind speed obtained at 10 m anemometer height over an eleven-year period. The data was obtained from the South African Weather Service (SAWS).
3. Methodology
This section presents the models used to determine the prospective of wind power of Vesleskarvet for the purpose of hydrogen production. The electricity generation potential of hydrogen fuel cells, the economic analysis as well as the environmental assessment models are also presented.
3.1. Wind Characteristics Model
It has been widely demonstrated that the two-parameter Weibull distribution provides a reliable model for representing wind speed variation accurately in many sites around the world. Therefore. This distribution function was adopted to model the wind speeds of Vesleskarvet as follows [28]:
where is the shape parameter (it has no unit) and is the scale parameter in (m/s) and it produced the information on how advantageous the wind resources of a site is; is the wind speed in (m/s). Both k and c can be determined using [28]:
where is the mean wind speed and is the standard deviation of the experimental wind speed, respectively. (.) is a gamma function and has characteristics as follows:
Equations (5) and (6) can be used to determine the average wind speed () and the standard deviation (). respectively.
where n is the quantity of wind speed data taken at the anemometer height and is the ith wind speed obtained.
Another important parameter that is used to describe the wind characteristics of a given site is the turbulence intensity (TI). It is defined as the ratio of the standard deviation of wind speeds to its mean value [29]. TI is a measure of the intensity of the wind velocity fluctuation in a given time period, and it is influenced by the terrain, atmospheric stability, and the wake effects produced by nearby turbines. A high level of turbulence reduces both the efficiency and lifespan of a wind turbine, whereas lower turbulence leads to improved performance and reduced maintenance needs [30]. Turbulence intensity varies from one site to another, and it is unique to each location.
3.1.1. Re-Defining Wind Speed to Turbine Hub Height
Wind speeds change with altitudes and most times, measurements are taken at a height different from the turbine hub height. It is therefore important to adjust the measured wind speeds from the anemometer height to the corresponding turbine hub height using the expression as follows:
where is the wind speed extrapolated to the turbine hub height and is the wind speed measured at the anemometer height . The exponential factor is determined by the surface roughness and stability of the atmosphere. It typically ranges between 0.05 and 0.5, with 0.14 being the most commonly used value for well-exposed sites [31]. In view of the fact that the selected site for this investigation is well exposed, a value of 0.14 is therefore adopted in this study. However, the shear exponent of this site could be subjected to further investigation.
3.1.2. Estimation of Capacity Factor and Electricity Generation Potentials of Wind Turbines
Capacity factor () is the ratio of actual energy produced by a wind turbine over a specific period to the amount of energy it will generate if the wind turbine is made to continuously operate at full rated power over the same time frame [32]. It is a function of the wind regime in which the wind turbine operates as determined by the shape and scale parameter of the wind resource at the site as well as the parameters at which the wind turbine is designed as determined by the cut-in, rated and cut-out wind speeds of the wind turbine. The capacity factor of a wind turbine at a particular site can be expressed as follows [33]:
where is the Weibull distribution function as given in (1). Also,
,
and
are the cut-in wind speed, rated wind speed and cut-out wind speed of the wind turbine, respectively. Equation (9) can be re-arranged to yield the following relations:
where is the incomplete gamma function of the lower type and can be written as (11):
Therefore, the electrical energy in kWh that can be produced over a specific period of time can be calculated using:
where is the capacity factor of the wind turbine, is rated power in kW of the wind turbine, t is the time under consideration in hours, is the gearbox transmission efficiency and is the efficiency of the generator and they are selected as 0.85 and 0.85, respectively [34]. Four large wind turbines with the technical data furnished in Table 1 are adopted in this paper for hydrogen production at the site (Vesleskarvet Nunataks). This is because the earlier study revealed that large wind turbines are best suited for hydrogen production compared to small or medium wind turbines [20].

Table 1.
Large Wind Turbine Technical Data [20].
3.2. Hydrogen Production Using the Wind Regime of Vesleskarvet Nunataks
In this paper the wind resources of Vesleskarvet are utilised mainly for hydrogen production and thereafter used for electricity generation using PEM fuel cell as depicted in Figure 1.
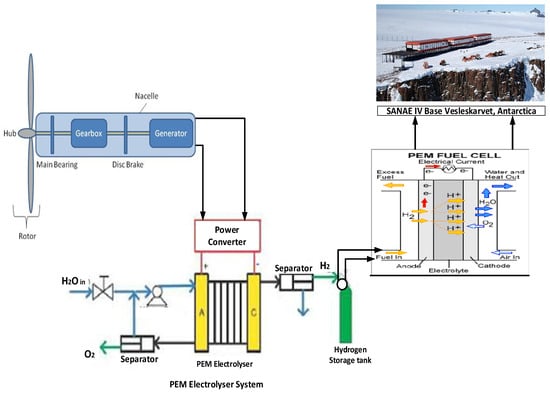
Figure 1.
Schematic diagram of hydrogen production for electricity generation at SANAE IV base (Vesleskarvet, Antarctica).
With the advent of advanced power electronics and local capacitor banks, the synchronous wind turbine can be made to supply the required frequency and voltage. Hydrogen is commonly produced using two main types of electrolysers: the alkaline electrolyser and the Proton Exchange Membrane (PEM) electrolyser. In this paper, a PEM electrolyser was adopted for hydrogen production. The PEM electrolysers first came into commercial usage in the 1960s by General Electric; it uses water as an electrolyte solution and a polymer electrolyte membrane. This helps to avoid the incessant recovery and recycling of the potassium hydroxide electrolyte solution which is seen as a disadvantage in alkaline electrolysers [35]. Moreover, the PEM electrolyser has higher efficiency compared to alkaline electrolysers; it has compact units which makes it appropriate for dynamic operations; and it responds faster to load changes. However, its disadvantage is that the electrode catalysts (platinum and iridium) and membrane materials are expensive, and their lifetime is not as long as that of alkaline electrolysers.
A 900 kW capacity PEM electrolyser which requires a DC electrical energy demand of 54 kWh [36] with water requirement of about 10.6 litres [37] for every 1 kg of hydrogen production was adopted in this paper. Hence, the quantity of hydrogen (kg) generated through the water electrolysis process can be determined using:
where is the wind turbine electrical output in kWh as calculated in (11), is the efficiency of the rectifier and is selected as 0.9 [37], is the energy requirement of the electrolyser, and for a typical PEM electrolyser it is assumed to be 54 kWh/kg [36]. The quantity of hydrogen generated in tons-H2 can be estimated by dividing the amount of hydrogen in kg () by 1000.
The required volume of water for hydrogen production, expressed in cubic meters, can be calculated as follows:
where is the density of water (i.e., 1 kg/m3).
3.3. Storage of Generated Hydrogen
Hydrogen generated from the Vesleskarvet wind resource via water electrolysis can be stored either in liquid state in cryogenic tanks or as gas in high pressure compressed gas cylinders. In this study, the hydrogen produced is assumed to be stored in its gaseous form within compressed gas cylinders.
Hence, the volume in m3 of the compressed hydrogen gas () can be evaluated as follows:
where is the quantity of hydrogen generated (kg) as determined in (13), is the compression efficiency and is taken as 95% [38], is the density of the compressed hydrogen gas given as 36 kg/m3 [39].
3.4. Fuel Cell Potential for Electricity Generation
Hydrogen based fuel cells are well known for their high efficiencies [19]. Hydrogen on its own is not an energy source but a carbon-free energy carrier with high density [40]. Generated and stored hydrogen either goes directly to a fuel cell to produce electricity or through a compressor to run the fuel cell at high pressure. The electrical energy output (kWh) obtainable from a fuel cell can be expressed as follows:
where is the hydrogen gas lower heating value and is taken as 33.3 kWh/kg [41], is the fuel cell efficiency taken as 0.6 [41], is the compressed hydrogen gas density in kg/m3.
3.5. Economic Model of Wind Turbine, Electrolyser and Fuel Cell
This section presents the estimation of the unit cost of energy from the wind turbine, the unit cost of hydrogen production using a PEM electrolyser, and the cost of electricity generation from a fuel cell generator. First, the capital costs of the wind turbine (), electrolyser (), hydrogen tank (HT) and the fuel cell () in USD were calculated from their specific costs, respectively as follows:
where , , and are the specific cost of wind turbine, electrolyser, fuel cell and Hydrogen tank, respectively, and are taken as 115 USD/kW [42], 900 USD/kW [36], 5700 USD/kW [43], 665USD/kg, respectively. Similarly, , , and are the rated capacity of the wind turbine, electrolyser, fuel cells and Hydrogen tank which are 2000 kW, 185 kW, 250 kW and 300 kg, respectively.
The unit cost of electricity generated by the wind turbine () is the cost per kWh that is usually obtained by discounting and spreading the investment, operation, and maintenance (O&M) expenses over the entire lifespan of the turbine (its life cycle cost, LCC), and then dividing this value by the total annual electricity generated, as expressed in Equation (21).
where LCC_WECS is the life cycle cost (LCC) of the wind energy conversion system and can be evaluated as follows:
where is the operation and maintenance cost of wind energy conversion system, A is the total number components that their costs are taken into consideration during the evaluation of LCC and in this case A = 5 (i.e., cost of installation, converter, civil work, battery bank as well as miscellaneous costs). The counting index is the percentage of cost of other components in fraction with respect to the capital cost of wind turbine. For example, is taken as: = fraction of installation cost with respect to capital cost of the wind turbine (10%), = fraction of converter cost with respect to capital cost of wind turbine (3%), = fraction of civil work cost with respect to capital cost of the wind turbine (9%), = fractional cost of battery bank (9%) and = fractional miscellaneous cost with respect to the capital cost of the wind turbine (7%) [44].
Similarly, the cost of hydrogen production () per m3 can be estimated as follows:
where is the life cycle cost of the electrolyser system as well as hydrogen storage and can be evaluated as follows:
where is the operational and maintenance cost associated with the electrolyser, B is the number of cost components taken into consideration in determining the LCC of the electrolyser and in this case B = 2. is taken as installation cost (12%) and stack replacement (40%) [43]. is taken as the installation cost of the hydrogen tank (10%).
Also, the cost of electricity generation using fuel cell () per kWh can be estimated using:
where is the life cycle cost of fuel cell and can be calculated as follows:
where is the operation and maintenance cost associated with fuel cells, is taken as installation cost of fuel cells (20%).
The operation and maintenance () cost is the cost associated with operating and maintenance of any of the wind turbine, electrolyser, the fuel cell and the tank over their lifetime and can be determined using:
where is the initial operation and maintenance cost for any of the wind turbine, electrolyser and fuel cell for the first year and are taken as 5% of the capital cost in each case [45]. It should be noted that the symbol “(.)” indicates either wind turbine, electrolyser or fuel cell as the case may be. The , are the current inflation and interest rates in South Africa, which are taken as 4.5% and 6.5%, respectively [46] while is the life time period of the project and is taken as 20 years.
3.6. Estimation of Environmental Benefits of Hydrogen Based Fuel Cell Electricity Generation
The environmental benefits of hydrogen was made based on the comparison with diesel fuel as diesel generators are the most common generating set used in electrification of remote communities. The amount of diesel fuel that could be displaced by hydrogen gas as well as the amount of emissions that could be avoided as a result of partial or complete combustion of diesel fuel are presented in this section.
3.6.1. Diesel Fuel Displacement by Hydrogen Gas
The amount of diesel fuel that would be displaced in litres () if diesel fuel is replaced by an equal amount of hydrogen gas for electricity generation in fuel cells was determined using (28). The displacement is based on the lower heating values (LHV) of diesel fuel with respect to that of hydrogen gas.
where is the efficiency of the diesel fuel generator which is taken as 33% [47,48,49], is the lower heating value of diesel fuel whose value is taken as 42.5 MJ per kg [50,51], is the density of diesel fuel and its value is taken as 0.837 kg per litre [52], 3.6 is used as the conversion factor from MJ to kWh.
3.6.2. Emission Mitigation by the Use of Hydrogen Gas in Fuel Cell
The two main emissions resulting from combustion of fossil fuels are carbon dioxide (CO2) and carbon monoxide (CO). CO2 is a greenhouse gas which traps heat in the Earth’s atmosphere resulting in global warming. CO is a pollutant that is of global concern because it is dangerously poisonous. It can cause suffocation if sufficient amounts are present in the surrounding air [53]. It does not give warning of its presence because it is colourless and tasteless and hence must be reduced in the atmosphere as much as possible. The amount of carbon dioxide emission () and carbon monoxide () emission (both in kg) that could be prevented in going into the surrounding air by using hydrogen- fuel cell electricity generator rather than diesel generator can be estimated using:
where is the specific emission of carbon dioxide per litre of diesel fuel taken as 2.7 kg/litre [54] while is the specific emission of carbon monoxide per litre of diesel fuel taken as 0.00766 kg/litre [54].
3.6.3. Hydrogen Fuel Cell Electricity Generation Avoidance Cost
Investments in wind turbine powered hydrogen-fuel cell electricity capacity will continue to avoid diesel fuel cost and carbon cost throughout the entire lifetime of the project. The cost of diesel fuel (USD) saved per time if diesel fuel is substituted with hydrogen gas can be calculated as:
where is the current price of diesel fuel in South Africa and is given as 0.870 USD/L [55].
The carbon dioxide avoidance cost of hydrogen-based electricity generators can be determined using:
where is the CO2 emission avoided (kg) by substituting hydrogen gas for diesel fuel as determined in (29), is the average price of carbon dioxide allowance and is given as USD29.5/tCO2 [56], the 1000 is used to convert kgCO2 to tCO2.
3.7. Payback Period
The interest of every investor is to know the probable period needed to recoup an investment, hence, the need to determine the payback period of the hydrogen-fuel cell based electricity generation system. Payback period is concerned with the number of periods (years) needed to pay back an initial investment with positive net income. Therefore, the payback period in years is determined as:
4. Results and Discussion
The results depicting the wind characteristics of Vesleskarvet, capacity factor and energy (electricity) generation potential of four selected wind turbines based on the wind energy resources of the Vesleskarvet are presented. Also, the hydrogen production potential of the wind turbines and the electricity generation potential of fuel cell are presented in this section. The economic viability of the project and environmental benefits accrue from the project are presented.
4.1. Characteristics of Wind Regime of Vesleskarvet
The monthly and annual wind characteristic of Vesleskarvet were examined by calculating the mean wind speed (), the standard deviation (), turbulence intensity (TI), the shape () and the scale parameters (). The results are presented in Table 2. The results revealed that the mean wind speed at 10 m anemometer height varies from January to December. The minimum wind speed 8.27 m/s occurs in January and the maximum wind speed 12.88 m/s occurs in August, while the annual average wind speed is 10.87 m/s. The standard deviation of the wind speed ranges between 4.67 m/s in January to 7.21 m/s in May. This indicates that the wind speeds deviate by a large amount from the mean wind speed resulting in a high value of turbulence intensity, although the turbulence intensity calculated using the mean wind speed and standard deviation would be influenced by synoptic and seasonal variations. The TI varies from 48.94% in March to 65.27% in May indicating that the wind speeds in the month of March are more steady compared to other months. The highest value calculated for the month of May reveals that the month of May is more turbulent compared to other months. The implication of this is that the energy extractable in the month of May could be lower compared to other months due to high level of turbulence. The scale parameter which indicates how peak the wind speeds are at the site ranges from 1.62 in the month of November to 2.17 in the months of February and March. The scale parameter which determines how windy the site is varies between 9.31 m/s in the month of January and 14.51 in the month of August. This indicates that August is the windiest month in the year while the January the least windy.
Table 2.
Wind Characteristics of Vesleskarvet Nunataks at 10 m anemometer height.
4.2. Capacity Factor and Electrical Power Generation Capacity of Wind Turbines
Capacity factor (Cf) gives the ratio of total actual energy produced by a wind energy conversion system over a period of time to the amount of energy it would have produced at full capacity at that period. Cf is a function of the design of the wind turbine, and it determines how a wind turbine matches well with the wind characteristics of the site. Therefore, the windiest site may not necessarily give the best capacity factor if the parameters of the wind turbine does not match well with the wind characteristics of the site. The electricity generation potential of wind turbines depends largely on the rated power of the wind turbine as well as the capacity factor. The monthly Cf and the electricity generation potential () of the four selected large wind turbines based on the wind resource of Vesleskarvet are presented in Table 3.
Table 3.
Monthly wind turbine capacity factors and electricity generation estimation of wind turbines using wind regime of Vesleskarvet for hydrogen production.
From the table (Table 3), the months of February and March present the best values of capacity factors across all the wind turbines, denoting that wind generators produced more power during these months compared to other months. One of the interesting results here is that these months (February and March) are not the windiest months at the site yet present the best Cf and energy generation potential. This is because these months present lower turbulence intensity compared to other months. The month of May presents the least value of capacity factor as well as least electricity generation potentials. This could also be attributed to the high value of turbulence intensity recorded in the month. Figure 2 shows the annual capacity factor as well as the annual electricity generation potential of the selected wind turbines. The figure reveals that wind turbine WT3 presents the best overall capacity factor with an overall annual capacity factor of 63.8% while WT4 has the lowest capacity factor (57.94%). However, the electricity generation capacity largely depends on the rated capacity of the wind turbine, hence the largest wind turbine (WT4) generates the highest electricity, with annual generating capacity of MWh. The least electricity generating turbine is WT1 with the annual generating capacity of MWh.
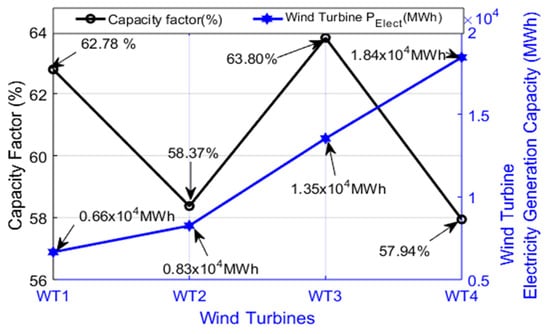
Figure 2.
Annual capacity factor and electricity generation capacity of the wind turbines.
4.3. Hydrogen Production Potential Using the Wind Regime of Vesleskarvet
The quantity of hydrogen produced by the electrolysers powered by the wind turbines () using the wind resource of Vesleskarvet, the compressed storable hydrogen gas as feedstock to the fuel cell () as well as the volume of water requirement for hydrogen production during the electrolysis of water () are furnished in Table 4. The table reveals that the highest hydrogen production occurs in the month of March across all the wind turbines. This is expected, since the Cf of the wind turbines are highest during this month. The lowest hydrogen production across the wind turbines is experience in the month of May. This may be attributed to the effect of high turbulence during this month, which reduces the performance of wind turbines for electricity generation. Generally, wind turbine WT4 presents the highest hydrogen production. This is in agreement with the earlier studies that hydrogen production is more favoured by larger wind turbines compared to the smaller ones [20]. The volume of water requirement for hydrogen production is also higher in the month of March. This is because more water is required to meet the requirement of hydrogen production during this month.
Table 4.
Monthly hydrogen generation potential, compressed hydrogen gas for storage and water requirement for the hydrogen production.
The annual hydrogen production, annual compressed hydrogen gas for storage and the annual water requirement are depicted in Figure 3.
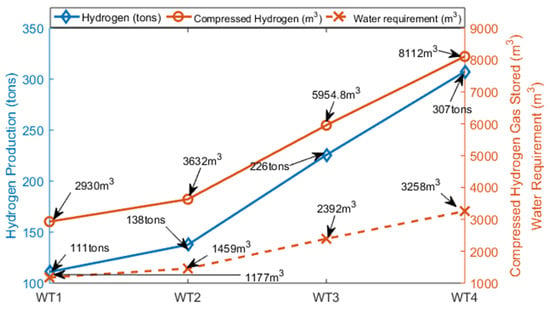
Figure 3.
Annual hydrogen production of the wind turbine based on the wind characteristics of the site, compressed hydrogen gas and water requirement for hydrogen production.
Figure 3 shows that the wind turbines WT1, WT2, WT3 and WT4 could produce about 111, 138, 226, and 307 tons of hydrogen annually, respectively. This translates into about 2930, 3632, 5954.8 and 8112 cubic metres (m3) of compressed hydrogen gas that could be stored annually, respectively. This shows a huge potential for hydrogen production from this site. The annual water requirements to achieve these levels of hydrogen production were calculated to be about 1177, 1459, 2392, and 3258 cubic metres (m3), respectively.
4.4. Electricity Generation Potential of Fuel Cell Using Hydrogen Generated
The compressed hydrogen gas could be used as feedstock to the PEM fuel cell for the purpose of electricity generation. The electricity generation potential of the fuel cell was determined using (16) and the results are depicted in Figure 4. The results reveal that the months of March and May experience the best and the least electricity generation potential across the wind turbines, respectively. The monthly electricity generation potential of the fuel cell using hydrogen produced from wind turbines WT1, WT2, WT3 and WT4 in the month of March are 198, 246, 402 and 552 MWh, respectively while that of May are 166, 205,336 and 455 MWh, respectively. The annual electricity generation potential of fuel cells using hydrogen feedstock generated by the wind turbines as depicted in Figure 5 are 2, 2.6, 4.3 and 5.8 GWh, respectively.
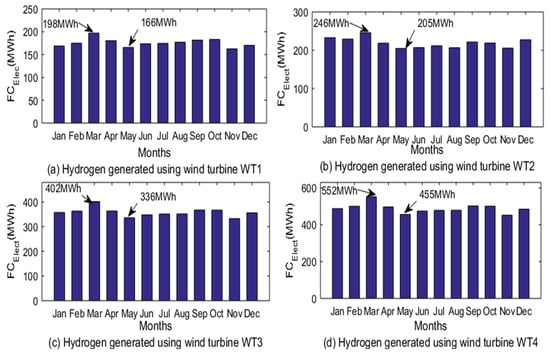
Figure 4.
Monthly electricity generation potential of fuel cells from the hydrogen produced using the wind resource of Vesleskarvet.
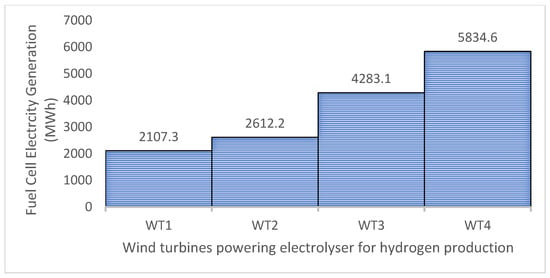
Figure 5.
Annual electricity generation potential from fuel cell using hydrogen generated from wind resource of Vesleskarvet.
4.5. Economic Analysis of Hydrogen Fuel Cell-Based Electricity Using Wind Resources of Vesleskarvet
The economic viability of any project is important for sustainability of such project. Therefore, the unit cost of electricity in kWh generated by the wind turbines, the cost of hydrogen production by the electrolyser as well as the cost of electricity generation by the fuel cell were calculated and the results are presented in Figure 6, Figure 7 and Figure 8, respectively.
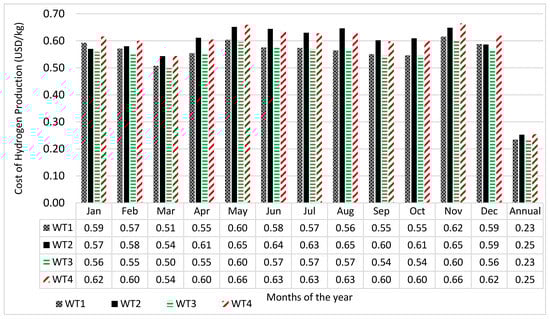
Figure 6.
Monthly variation in the cost of energy from wind turbine using wind energy resource of Vesleskarvet.
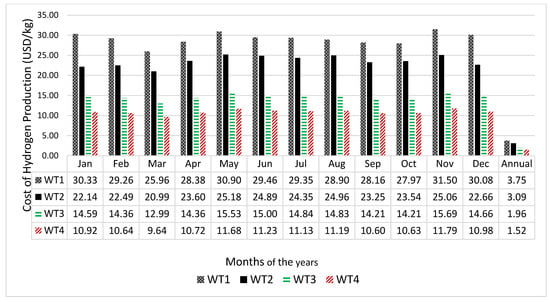
Figure 7.
Monthly variation in the cost of hydrogen production from electrolyser using wind energy resource of Vesleskarvet.
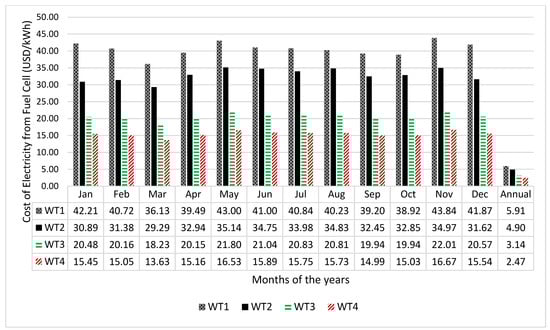
Figure 8.
Monthly variation in the cost of electricity generation from fuel cells using wind energy resources of Vesleskarvet.
Figure 6 reveals that wind turbine WT3 has the best unit cost of energy across all months while the most unfavourable cost of energy comes from WT4. The reason for WT3 presenting the best cost is due to the high-capacity factor of the wind turbine compared to the other turbines, indicating that the wind turbine operating parameters match well with the wind characteristics of the site. Generally, November presents the highest cost of energy across all the wind turbines. It should be noted that the cost of energy is higher when the wind turbines do not operate continually throughout the years. For example, the cost of energy when the wind turbines operate in the month of January only are 0.59, 0.57, 0.56 and 0.62 USD/kWh, respectively. However, if the wind turbines were to be operated continually throughout the year, the cost of energy for the wind turbine would be 0.235, 0.253, 0.231 and 0.254 USD/kWh, respectively. Similarly, the annual cost of hydrogen as depicted in Figure 7 are 3.75, 3.09, 1.96 and 1.52 USD/kg. Wind turbine WT4 presents the best cost of hydrogen production. This is expected due to the large size of the wind turbine compared to the other turbines [20]. Figure 8 depicts the annual cost of electricity at locations where fuel cells are deployed. The figure shows that the cost of electricity using fuel cells in which its hydrogen was generated by wind turbines WT1, WT2, WT3 and WT4 are 5.91, 4.90, 3.14, and 2.47 USD/kWh, respectively. Wind turbine WT4 (Gamesa G128) with cut-in wind speed of 4 m/s, rated wind speed of 13 m/s and cut-out wind speed of 18 m/s present the best cost of energy. When this cost is compared with the unit cost of electricity from the conventional generators in South Africa (0.132 USD/kWh [55]), then it is clear that the unit cost of electricity using fuel cells is far higher compared to the conventional generation. However, the environmental benefits of fuel cell electricity generators far outweigh those of the conventional electricity generators. If the environmental benefits were to be incorporated into the cost of energy, then the unit cost of electricity from the fuel cell generator may be more competitive with the convectional generation.
4.6. Environmental Benefits of Fuel Cell Electricity Generation
The environmental benefits of generating electricity from fuel cells were quantified by comparing it with the diesel generators which are generally used for standalone electrification in isolated locations. The amount of diesel fuel in litres () that would be displaced annually if diesel generators were to be replaced by fuel cell generators was calculated. Also, the amount of CO2 () and CO () emissions that would be saved from the environment annually was determined. The annual cost of diesel fuel () that would be avoided as well as the carbon dioxide avoidance cost () due to the use of hydrogen rather than diesel that would be gained was estimated. All the results are presented in Table 5. The results in the table reveal that huge amounts of savings can be made in terms of diesel fuel and emissions, indicating that the environmental benefits of fuel cells are huge compared to the diesel generator. The payback period (PBP) of the hydrogen production systems powered by wind turbines WT1, WT2, WT3 and WT4 were calculated to be 9.8, 8.6, 6 and 5.4 years, respectively. This is considered a good project since all the years are far less than the system lifetime of 20 years.
Table 5.
Benefits of hydrogen-based fuel cell electricity generation.
5. Conclusions
The economic potential and environmental assessment of hydrogen fuel cells for electricity generation using wind energy resources of Vesleskarvet have been performed. The following are concluded from the study:
- i.
- The daily mean wind speed of Vesleskarvet varies from 8.27 m/s in January to 12.88 m/s in August with annual daily average value of 10.87 m/s at 10 m anemometer height.
- ii.
- The turbulence intensity varies from 48.94% in March to 65.27% in May with annual average value of 57.94%
- iii.
- The shape parameter varies from 1.76 in June to 2.17 in February and March with annual average value of 1.81.
- iv.
- The scale parameter lies between 9.31 m/s in January to 14.51 m/s in August with average annual value of 12.23 m/s.
- v.
- The annual capacity factor and electricity generation potential for wind turbines (WT1, WT2, WT3, WT4) are (62.78%, 58.37%, 63.80% and 57.94%, respectively) and (6600 MW, 8300 MW, 13,500 MW and 18,400 MW, respectively).
- vi.
- The annual hydrogen production potential by the electrolyser powered by WT1, WT2, WT3 and WT4 are 111 tons, 138 tons, 226 tons, 307 tons, respectively.
- vii.
- The annual electricity generation potential of the fuel cell powered by the wind turbines are 2107.3, 2612.2, 4283.1, and 5834.6 kWh, respectively.
- viii.
- The annual costs of electricity generation of the wind turbines, electrolyser and fuel cell are (0.235, 0.253, 0.231, 0.254 USD/kWh), (3.75, 3.09, 1.96, 1.52 USD/kg) and (5.91, 4.90, 3.14, 2.47 USD/kWh), respectively.
- ix.
- The estimated payback periods for the project are 9.8, 8.6, 6 and 5.4 years
This paper could serve as scientific information for decision making at utilizing renewable energy resources for meeting the electricity as well as heating needs of the South African research base in Vesleskarvet, Antarctica. This paper assumed a constant fuel cell efficiency which does not take into consideration the extreme low temperatures in Antarctica (−40 °C) which could exacerbate reversible and irreversible degradation of fuel cells (e.g., membrane dehydration and catalyst poisoning). This could directly impact the cost of electricity (COE) and payback period in economic assessments. Therefore, in future research we will look into the long-term efficiency degradation of fuel cells in the Antarctic environment. We will also look into the possibility of utilizing hybrid systems for electricity generation rather than standalone renewable energy generation.
Author Contributions
Conceptualization, T.R.A.; Methodology, T.R.A.; Software, T.C.M.; Validation, A.A.Y. and A.S.O.O.; Formal analysis, T.C.M.; Investigation, T.R.A. and A.A.Y.; Resources, A.S.O.O.; Data curation, A.S.O.O.; Writing—original draft, T.R.A.; Writing—review & editing, T.C.M. and A.A.Y.; Visualization, T.C.M.; Project administration, A.S.O.O.; Funding acquisition, A.A.Y. All authors have read and agreed to the published version of the manuscript.
Funding
This research was funded by the South African National Research Foundation through Grant number 150573.
Data Availability Statement
The original contributions presented in this study are included in the article. Further inquiries can be directed to the corresponding author.
Conflicts of Interest
The authors declare that there is no any competing interest regarding the publication of this manuscript. The data that support the findings of this study are available from the corresponding author upon reasonable request.
References
- Tin, T.; Sovacool, B.K.; Blake, D.; Magill, P.; El-Naggar, S.; Lidstrom, S.; Ishizawa, K.; Berte, J. Energy efficiency and renewable energy under extreme conditions: Case studies from Antarctica. Renew. Energy 2010, 35, 1715–1723. [Google Scholar] [CrossRef]
- Teetz, H.W.; Harms, T.M.; Von-Backström, T.W. Assessment of the Wind Power Potential at SANAE IV base, Antarctica: A Technical and Economic Feasibility Study. Renew. Energy 2003, 28, 2037–2061. [Google Scholar] [CrossRef]
- Saner, C.B.; Skarvelis-Kazakos, S. Fuel Savings in Remote Antarctic Microgrids through Energy Management. In Proceedings of the 53rd International Universities Power Engineering Conference (UPEC), Glasgow, UK, 4–7 September 2018; pp. 1–6. [Google Scholar]
- Loza, B.; Minchala, L.I.; Ochoa-Correa, D.; Martinez, S. Grid-Friendly Integration of Wind Energy: A Review of Power Forecasting and Frequency Control Techniques. Sustainability 2024, 16, 9535. [Google Scholar] [CrossRef]
- Mariani, V.; Zenith, F.; Glielmo, L. Operating Hydrogen-Based Energy Storage Systems in Wind Farms for Smooth Power Injection: A Penalty Fees Aware Model Predictive Control. Energies 2022, 15, 6307. [Google Scholar] [CrossRef]
- Colbertaldo, P.; Agustin, S.B.; Campanari, S.; Brouwer, J. Impact of Hydrogen Energy Storage on California Electric Power System: Towards 100% Renewable Electricity. Int. J. Hydrogen Energy 2019, 44, 9558–9576. [Google Scholar] [CrossRef]
- Langmi, H. Special Report: Hydrogen Economy Vital Part of Sustainable Energy Future. 2017; pp. 1–2. Available online: https://www.dsti.gov.za/images/Hydrogen-economy-vital-part-of-sustainable-energy.pdf (accessed on 15 October 2018).
- Shadidi, B.; Najafi, G.; Yusaf, T. A Review of Hydrogen as a Fuel in Internal Combustion Engines. Energy 2021, 14, 6209. [Google Scholar] [CrossRef]
- Ashrafi, Z.N.; Ghasemian, M.; Shahrestani, M.I.; Khodabandeh, E.; Sedaghat, A. Evaluation of Hydrogen Production from Harvesting Wind Energy at High Altitudes in Iran by Three Extrapolating Weibull Methods. Int. J. Hydrogen Energy 2018, 43, 3110–3132. [Google Scholar] [CrossRef]
- Ishaq, H.; Dincer, I.; Naterer, G.F. Performance Investigation of an Integrated Wind Energy System for Co-Generation of Power and Hydrogen. Int. J. Hydrogen Energy 2018, 43, 9153–9164. [Google Scholar] [CrossRef]
- Apostolou, D.; Enevoldsen, P. The Past, Present and Potential of Hydrogen as a Multifunctional Storage Application for Wind Power. Renew. Sustain. Energy Rev. 2020, 112, 917–929. [Google Scholar] [CrossRef]
- Alavi, O.; Mostafaeipour, A.; Qolipour, M. Analysis of Hydrogen Production from Wind Energy in the Southeast of Iran. Int. J. Hydrogen Energy 2016, 41, 15158–15171. [Google Scholar] [CrossRef]
- Alavi, O.; Mostafaeipour, A.; Sedaghat, A.; Qolipour, M. Feasibility of a Wind-Hydrogen Energy System Based on Wind Characteristics for Chabahar, Iran. Energy Harvest. Syst. 2018, 5, 1–21. [Google Scholar] [CrossRef]
- Kodicherla, S.P.K.; Kan, C.; Nanduri, R.K. Likelihood of Wind Energy Assisted Hydrogen Production in Three Selected Stations of Fiji Islands. Int. J. Ambient Energy 2018, 41, 823–832. [Google Scholar] [CrossRef]
- Aiche-Hamane, L.; Belhamel, M.; Benyoucef, B.; Hamane, M. Feasibility Study of Hydrogen Production from Wind Power in the Region of Ghardaia. Int. J. Hydrogen Energy 2009, 34, 4947–4952. [Google Scholar] [CrossRef]
- Douak, M.; Settou, N. Estimation of Hydrogen Production using Wind Energy in Algeria. Energy Procedia 2015, 74, 981–990. [Google Scholar] [CrossRef]
- Thomas, J.; Irmas, C.; Starke, G.; Tully, Z.; Grant, E.; Riccobono, N.; Nagasawa, K.; Leighton, D.; Bay, C. The Hydrogen Wind Turbine: Design of a wind turbine optimised for hydrogen production. J. Phys. Conf. Ser. 2023, 2507, 012010. [Google Scholar] [CrossRef]
- Nadaleti, W.C.; Dos-Santos, G.B.; Lourenço, V.A. The Potential and Economic Viability of Hydrogen Production from the use of Hydroelectric and Wind Farms Surplus Energy in Brazil: A National and Pioneering Analysis. Int. J. Hydrogen Energy 2020, 45, 1373–1384. [Google Scholar] [CrossRef]
- Sorgulu, F.; Dincer, I. A Renewable Source based Hydrogen Energy System for Residential Applications. Int. J. Hydrogen Energy 2018, 43, 5842–5851. [Google Scholar] [CrossRef]
- Ayodele, T.R.; Munda, J.L. Potential and Economic Viability of Green Hydrogen Production by Water Electrolysis using Wind Energy Resources in South Africa. Int. J. Hydrogen Energy 2019, 44, 17669–17687. [Google Scholar] [CrossRef]
- Gokcek, M.; Kale, C. Techno-Economical Evaluation of a Hydrogen Refuelling Station Powered by Wind-PV Hybrid Power System: A Case Study for İzmir-Çeşme. Int. J. Hydrogen Energy 2018, 43, 10615–10625. [Google Scholar] [CrossRef]
- Iqbal, W.; Yumei, H.; Abbas, Q.; Hafeez, M.; Mohsin, M.; Fatima, A.; Jamali, M.A.; Jamali, M.; Siyal, A.; Sohail, N. Assessment ofWind Energy Potential for the Production of Renewable Hydrogen in Sindh Province of Pakistan. Processes 2019, 7, 196. [Google Scholar] [CrossRef]
- Ayodele, T.R.; Ognjuyigbe, A.S.O. Wind Energy Potential of Vesleskarvet and the Feasibility of Meeting the South African’s SANAE IV Energy Demand. Renew. Sustain. Energy Rev. 2016, 56, 226–234. [Google Scholar] [CrossRef]
- SAASTA. South African Based in Antarctica. Department of Science and Technology. 2014. Available online: https://www.dst.gov.za (accessed on 16 October 2025).
- Jordaens, P.J.; Milis, S.; Van Riet, N.; Devriendt, C. The Use of a Large Climate Chamber for Extreme Temperature Testing & Turbine Component Validation. In Proceedings of the European Wind Energy Conference (EWEA), Vienna, Austria, 4–7 February 2013; Messe Frankfurt: Frankfurt, Germany, 2013; pp. 1–6. [Google Scholar]
- Lacroix, A.; Manwell, J.F. Wind Energy: Cold Weather Issues; Renewable Energy Research Laboratory, University of Massachusetts: Amherst, MA, USA, 2000; pp. 1–17. [Google Scholar]
- Zhang, Z.; Zhang, H.; Zhang, X.; Hu, Q.; Jiang, X. A Review of Wind Turbine Icing and Anti/De-Icing Technologies. Energies 2024, 17, 2805. [Google Scholar] [CrossRef]
- Tsuanyo, D.; Mouangue, R.; Elé Abiama, P. Influence of Weibull parameters on the estimation of wind energy potential. Sustain. Energy Res. 2023, 10, 5. [Google Scholar] [CrossRef]
- Tai, S.-L.; Berg, L.K.; Krishnamurthy, R.; Newsom, R.; Kirincich, A. Validation of turbulence intensity as simulated by the Weather Research and Forecasting model off the U.S. northeast coast. Wind Energy Sci. 2023, 8, 433–448. [Google Scholar] [CrossRef]
- Zheng, X.; Yao, Y.; Hu, Z.; Yu, Z.; Hu, S. Influence of Turbulence Intensity on the Aerodynamic Performance of Wind Turbines Based on the Fluid-Structure Coupling Method. Appl. Sci. 2023, 13, 250. [Google Scholar] [CrossRef]
- Xu, C.; Hao, C.; Li, L.; Han, X.; Xue, F.; Sun, M.; Shen, W. Evaluation of the Power-Law Wind-Speed Extrapolation Method with Atmospheric Stability Classification Methods for Flows over Different Terrain Types. Appl. Sci. 2018, 8, 1429. [Google Scholar] [CrossRef]
- Mohanaravi, V.; Chandramouli, S.R.; Vijayaraghavan, S.; Ramakumar, K. Capacity factor and tip-speed ratio optimisation of a Darrieus wind turbine. Front. Energy Res. 2024, 12, 1417511. [Google Scholar] [CrossRef]
- Diyoke, C. A new approximate capacity factor method for matching wind turbines to a site: Case study of Humber region, UK. Int. J. Energy Environ. Eng. 2019, 10, 451–462. [Google Scholar] [CrossRef]
- Ayodele, T.R.; Jimoh, A.A.; Munda, J.L.; Agee, J.T. Capacity Factor Estimation and Appropriate Wind Turbine Matching for Napier and Prince Albert in The Western Cape of South Africa. In Proceedings of the 3rd International Renewable Energy Congress, Hammamet, Tunisia, 20–22 December 2011; pp. 1–6. [Google Scholar]
- Ogawa, T.; Takeuchi, M.; Yuya Kajikawa, Y. Analysis of Trends and Emerging Technologies in Water Electrolysis Research Based on a Computational Method: A Comparison with Fuel Cell Research. Sustainability 2018, 10, 478. [Google Scholar] [CrossRef]
- Hinkley, J.; Hayward, J.; McNaughton, R.; Gillespie, R.; Matsumoto, A.; Watt, M.; Lovegrove, K. Cost Assessment of Hydrogen Production from PV and Electrolysis; Report to ARENA as part of Solar Fuels Roadmap; Project A-3018; Commonwealth Scientific and Industrial Research Organisation: Canberra, Australia, 2016; pp. 1–4. [Google Scholar]
- Mohsin, M.; Rasheed, A.K.; Saidur, R. Economic Viability and Production Capacity of Wind Generated Renewable Hydrogen. Int. J. Hydrogen Energy 2018, 43, 2621–2630. [Google Scholar] [CrossRef]
- Lagorse, J.; Simoes, M.G.; Miraoui, A.; Costerg, P. Energy cost analysis of a solar-hydrogen hybrid energy system for stand-alone applications. Int. J. Hydrogen Energy 2008, 33, 2871–2879. [Google Scholar] [CrossRef]
- Zuttel, A. Hydrogen storage methods. Naturwissenschaften 2004, 91, 157–172. [Google Scholar] [CrossRef]
- Solomin, E.; Kirpichnikova, I.; Amerkhanov, R.; Korobatov, D.; Lutovats, M.; Martyanov, A. Wind-Hydrogen Standalone Uninterrupted Power Supply Plant for all-Climate Application. Int. J. Hydrogen Energy 2019, 44, 3433–3449. [Google Scholar] [CrossRef]
- Silveira, J.L.; Lamas, W.Q.; Tuna, C.E.; Villela, I.A.C.; Miro, L.S. Ecological Efficiency and Thermoeconomic Analysis of a Cogeneration System at a Hospital. Renew. Sustain. Energy Rev. 2012, 16, 2894–2906. [Google Scholar] [CrossRef]
- Genc, M.S.; Celik, M.; Karasu, I. A review on Wind Energy and Wind–Hydrogen Production in Turkey: A Case Study of Hydrogen Production via Electrolysis System Supplied by Wind Energy Conversion System in Central Anatolian Turkey. Renew. Sustain. Energy Rev. 2012, 16, 6631–6646. [Google Scholar] [CrossRef]
- Battelle Memorial Institute. Manufacturing Cost Analysis of 100 and 250 kW Fuel Cell Systems for Primary Power and Combined Heat and Power Applications; Battelle Memorial Institute: Columbus, OH, USA, 2016; pp. 1–249. [Google Scholar]
- Ayodele, T.R.; Jimoh, A.A.; Munda, J.L.; Agee, J.T. Viability and Economic Analysis of Wind Energy Resource for Power Generation in Johannesburg, South Africa. Int. J. Sustain. Energy 2014, 33, 284–303. [Google Scholar] [CrossRef]
- Ayodele, T.R.; Ognjuyigbe, A.S.O. Wind Energy Resource, Wind Energy Conversion System Modelling and Integration: A Survey. Int. J. Sustain. Energy 2015, 34, 657–671. [Google Scholar] [CrossRef]
- South-African_Reserve_Bank. SA Reserve Bank Keeps Interest Rates Unchanged. 2019. Available online: https://www.iol.co.za/business-report/economy/sa-reserve-bank-keeps-interest-rates-unchanged-18852714 (accessed on 8 November 2020).
- Envergent Technologies. The Production of Electricity from Wood and Other Solid Biomass; Envergent Technologies LLC: Des Plaines, IL, USA, 2010. [Google Scholar]
- ICF International. Diesel Generators: Improving Efficiency and Emission Performance in India; SHAKTI Sustainable Energy Foundation: New Delhi, India, 2014. [Google Scholar]
- Nizami, A.S.; Shahzad, K.; Rehan, M.; Ouda, O.K.M.; Khan, M.Z.; Ismail, I.M.I.; Almeelbi, T.; Basahi, J.M.; Demirbas, A. Developing waste biorefinery in Makkah: A way forward to convert urban waste into renewable energy. Appl. Energy 2016, 1–9, in press. [Google Scholar] [CrossRef]
- Demirbas, A.; Baluabaid, M.A.; Kabli, M.; Ahmad, W. Diesel Fuel from Waste Lubricating Oil by Pyrolitic Distillation. Pet. Sci. Technol. 2015, 33, 129–138. [Google Scholar] [CrossRef]
- Dincer, I.; Acar, C. Review and evaluation of hydrogen production methods for better sustainability. Int. J. Hydrogen Energy 2014, 1–8, in press. [Google Scholar]
- MIT. Units & Conversions Fact Sheet; Massachusetts Institute of Technology: Cambridge, MA, USA, 2007. [Google Scholar]
- Siskos, P.A.; Georgiou, P.P. Oxides of Carbon. Environ. Ecol. Chem. 2012, 1, 1–11. [Google Scholar]
- US Energy Information Administration. How Much CO2 is Produced by Burning Gasoline & Diesel Fuel; US Energy Information Administration: Washington, DC, USA, 2014.
- Global-Petro-Price. South Africa Diesel Prices. 2020. Available online: https://www.globalpetrolprices.com/South-Africa/diesel_prices/ (accessed on 10 November 2020).
- Krohn, S.; Morthorst, P.; Awerbuch, S. The Economics of Wind Energy; European Wind Energy Association: Brussels, Belgium, 2002; pp. 1–156. [Google Scholar]


Disclaimer/Publisher’s Note: The statements, opinions and data contained in all publications are solely those of the individual author(s) and contributor(s) and not of MDPI and/or the editor(s). MDPI and/or the editor(s) disclaim responsibility for any injury to people or property resulting from any ideas, methods, instructions or products referred to in the content. |
© 2025 by the authors. Licensee MDPI, Basel, Switzerland. This article is an open access article distributed under the terms and conditions of the Creative Commons Attribution (CC BY) license (https://creativecommons.org/licenses/by/4.0/).