1. Introduction
In response to the world’s demand for electricity and the immediate challenges of climate change, the majority of research on electric power sources has generally leaned towards renewable sources. Being located in East Africa, Ethiopia has been utilizing renewable energy to meet its current electricity demands, where hydropower has contributed the most at 92%, followed by wind power at 7% and geothermal energy at 1% [
1]. Even though the electric power dependence is on renewable energy resources, the access to electric power in rural communities is still low, with levels of access remaining at approximately 27% [
2].
Ethiopia is highly endowed with renewable resources. The country’s hydropower potential is reportedly estimated to be approximately 45 GW, while wind power potential is approximately 10 GW. Further, geothermal power is estimated at 5 GW, and solar irradiation ranges between 4.5 kWh/m2/day and 7.5 kWh/m2/day. Despite these vast resources, limited electricity access in rural areas is primarily due to the dispersed nature of settlements and geographical isolation. Off-grid distributed generation, therefore, offers a promising solution to enhance electricity accessibility. The main challenge for implementing these systems is determining the best locations.
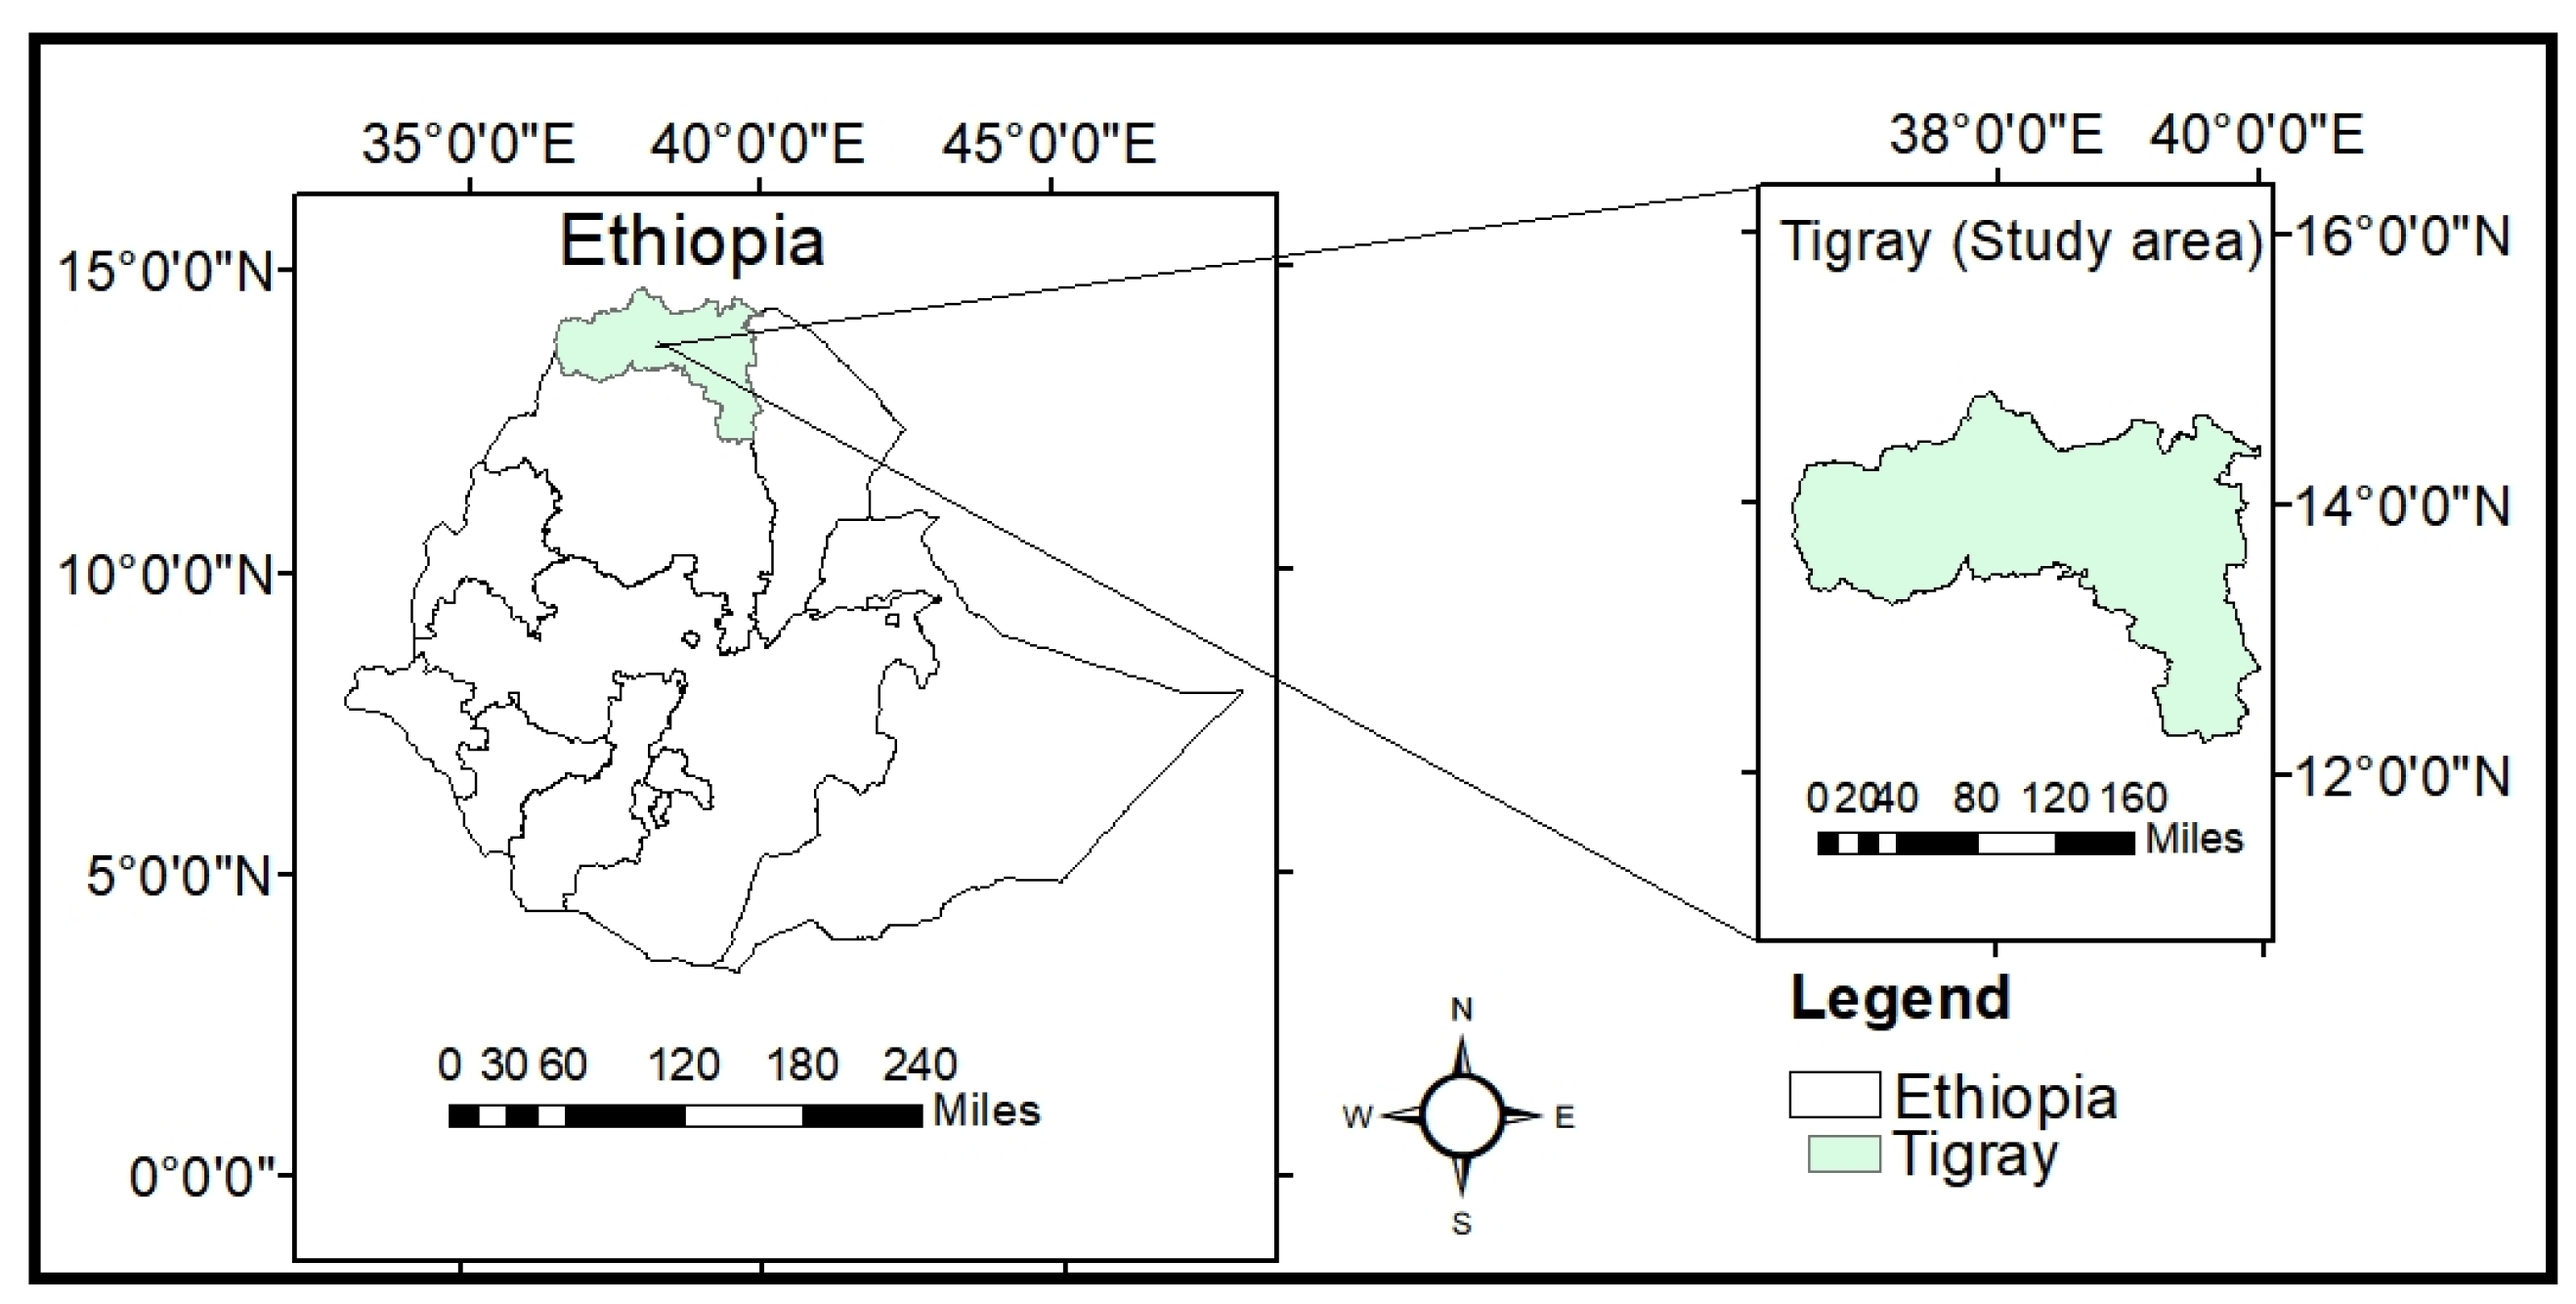
To address this challenge, this research aims to utilize both measured and remotely sensed data, combined with information from various organizations and geospatial models, to map potential zones for solar and wind energy. The study identifies optimal sites for off-grid hybrid wind–solar power generation by integrating the Analytical Hierarchy Process (AHP) and Geographic Information System (GIS) with Monte Carlo simulation. The research focuses on mapping suitable sites for off-grid wind, solar, and hybrid wind–solar systems to facilitate rural electrification in the Tigray Region, located in northern Ethiopia between latitudes 12–15° N and longitudes 36°30′–40°30′ E [
3]. The geographical location is presented in
Figure 1.
2. Literature Review
Various research has been conducted to analyze various combinations of energy resources suitable for rural electrification across different locations in Ethiopia, including Tigray. Among these is a case study paper by Alfa et al. [
4] which explores the feasibility of hybrid solar-wind-diesel power systems aimed at providing electricity to off-grid rural communities in the Tigray region of northern Ethiopia. By examining three case study villages, the authors conclude that these hybrid systems are viable for rural electrification. Additionally, research into a mixture of micro-hydro, solar, and wind power highlights both the technical and economic feasibility of implementing such systems in the same region [
5]. A techno-economic feasibility study has been conducted to assess a hybrid power system that integrates solar, wind, and fuel cell power sources with the aim of sustainably providing electricity to the rural village of Nifasso in Ethiopia [
6]. Solomon K. et al. [
7] present a comprehensive model of a stand-alone hybrid photovoltaic-wind system, which incorporates battery storage and diesel backup for cost-effective rural electrification in Tigray, Ethiopia. These studies propose the combination of two or more renewable energy sources, mainly wind and solar, supported by energy storage to provide access to electricity in rural areas.
Hence, based on this research, a hybrid wind-solar power system for off-grid electricity can offer a dependable power supply. But thorough planning and proper site selection are crucial to accomplishing this.
Research on the optimal site selection for wind and solar hybrid power generation has employed various methodologies. In several cities across the northwest region of Pakistan, the Analytic Hierarchy Process (AHP) was utilized in conjunction with the Delphi method for site selection [
8]. In China, the study conducted by Yunnan and Geng [
9] focused on site selection for wind-solar hybrid power stations, applying a decision-making framework rooted in the AHP method. Furthermore, an integrated approach that combined a linear regression model with Geographic Information Systems (GIS) and AHP methodologies was implemented to optimize the siting of wind and solar power plants, utilizing a globally evaluated site scoring system. Additionally, the Matter-Element Extension method, alongside its enhanced version, the Ideal Matter-Element Extension method, was deployed to assess hybrid renewable energy sites, with three regions in China serving as case studies [
10].
Barzehkar et al. explored the development of hybrid decision support systems that incorporate the Analytic Hierarchy Process (AHP), Geographic Information Systems (GIS), fuzzy logic, and a weighted linear combination approach for the identification of optimal locations for wind and solar farms. The relative importance of various indicators was determined by utilizing Super Decisions software, and critical factors were prioritized through AHP methodology, integrating layers within the GIS framework via a weighted linear combination approach [
11]. Effat and El-Zeiny [
12] combined AHP, the weighted linear combination method, and binary overlay techniques, resulting in three sub-models that generated separate suitability indices for solar radiation and wind power. From these indices, candidate sites for hybrid wind-solar power stations were selected. Additionally, Jun et al. [
13] utilised the ELECTRE-II method for the macro-site selection of wind/solar hybrid power stations. Consequently, seven operational wind/solar hybrid power stations were used as case studies for validation, demonstrating their effectiveness. Furthermore, the combination of AHP and GIS was employed to identify optimal areas for both solar and wind energy in four counties in Igdir province, Turkey: Tuzluca, Igdir Central, Karakoyunlu, and Aralik [
14]. Janke [
15] explored the identification of suitable areas for wind and solar farms using multicriteria GIS modelling techniques, while Aydin et al. [
16] identified priority sites for wind and solar energy systems separately using GIS. This approach demonstrated that the resulting maps can be overlaid to determine the most feasible locations for hybrid wind-solar photovoltaic systems.
Overall, the combination of the Analytic Hierarchy Process (AHP) of multi-criteria decision-making and Geographic Information Systems (GIS) is one of the most widely used methods for selecting suitable sites for wind, solar, and hybrid wind-solar power generation, and it has been used in this research.
Even though the Analytic Hierarchy Process (AHP) is a widely used multi-criteria decision-making method for complex tasks like site selection, validation techniques are necessary to enhance decision reliability. Since the weight and rank of the criteria in the Off-grid hybrid Wind-Solar site selection are based on the pairwise comparison of each factor, which is dependent on the judgment of experts, there is some level of uncertainty due to that. In order to reduce the level of uncertainty, sensitivity analysis of expert judgements is important and validates the provided decisions. Monte Carlo simulation (MCS) has emerged as a valuable tool for sensitivity analysis in renewable energy site selection. MCS can evaluate the impact of variations in decision criteria on site suitability, accounting for uncertainties in weather parameters and data variability across large areas [
17]. Monte Carlo Simulation (MCS) is a computational technique that uses random sampling to model complex stochastic systems and evaluate probabilities and statistical outcomes [
18]. MCS is particularly useful for understanding the impact of risk and uncertainty in prediction and forecasting models [
19]. Its implementation often relies on programming languages like Python [
18,
19]. MCS can evaluate the impact of variations in decision criteria on site suitability, accounting for uncertainties in weather parameters and data variability across large areas [
17]. It has also been applied to analyze solar site selection problems, incorporating multiple criteria such as solar radiation, proximity to infrastructure, and land characteristics [
20]. Hence, recent advancements propose integrating machine learning techniques with MCS to improve computational efficiency and accuracy in addressing various uncertainty dimensions in renewable energy planning [
21]. Building on these methodological advancements, this research integrates the Analytic Hierarchy Process (AHP) with Geographic Information Systems (GIS) and validates the decision weights through Monte Carlo Simulation (MCS). While many previous studies have focused on applying AHP–GIS for hybrid renewable site selection, there is a limitation in uncertainty analysis to examine the robustness of expert-derived criteria weights for off-grid hybrid wind-solar power site selection. By combining AHP, GIS, and MCS, this study aims to enhance the reliability of the site suitability assessment for off-grid hybrid wind-solar systems in the Tigray region of Ethiopia.
3. Methodology
3.1. Input Data
According to different literature reviews and expert opinions, the following input data presented in
Table 1 is used to identify the sites of hybrid wind-solar power for rural electrification, using the ArcMap 10.8 tools for further analysis.
3.2. Research Process Flow Chart
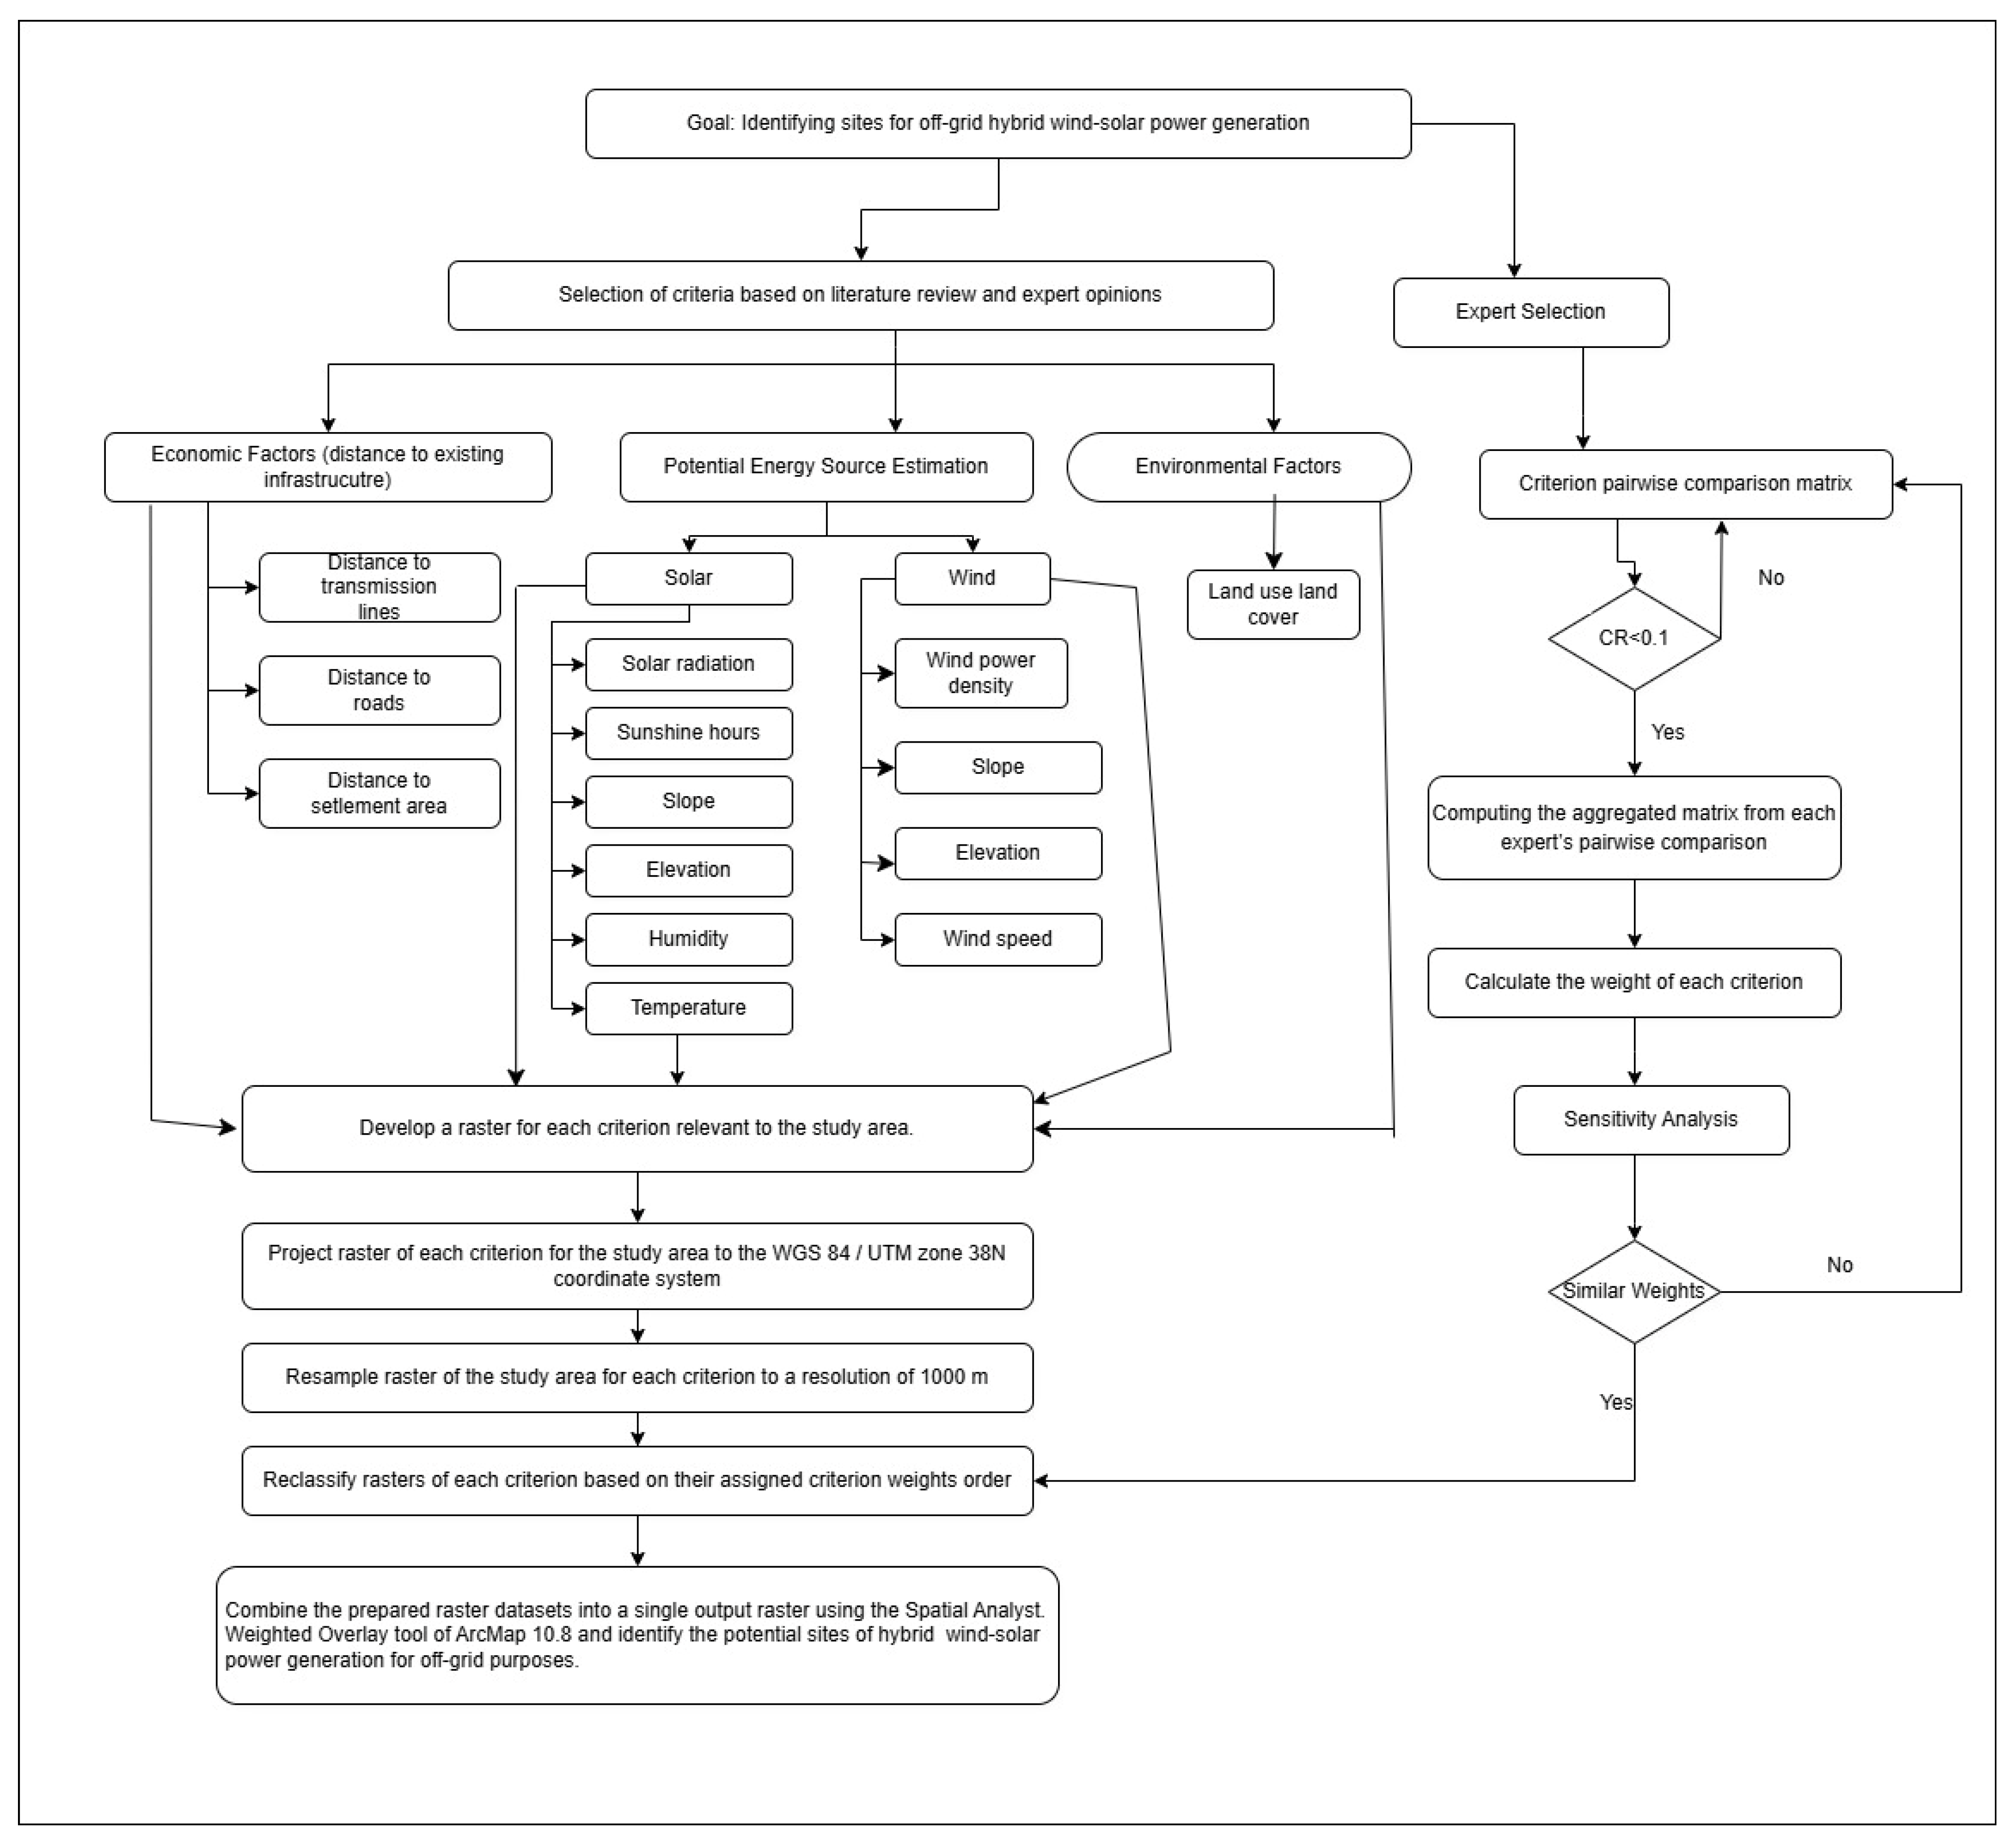
The methodology used in this research is summarised in
Figure 2. The process starts with site selection criteria and expert opinion and considers economic factors, environmental factors, and technology potential (solar and wind). Raster layers for each criterion are created, standardised in WGS 84/UTM Zone 37N, and resampled to a uniform resolution. Each raster is reclassified into suitability levels, and AHP is used to determine the criteria weights through expert comparisons, with a consistency ratio (CR) of less than 0.1. A sensitivity analysis for weight stability is done using a Monte Carlo simulation. After sensitivity analysis, the rasters are combined using ArcMap 10.8’s Weighted Overlay tool to generate a suitability map for off-grid wind–solar power generation sites.
3.3. Criteria for Solar Power Site Selection
Solar Radiation: The selection of sites for solar power installations is predominantly influenced by solar radiation, which is recognized as the primary criterion. A report published by the National Renewable Energy Laboratory indicates that regions with an average daily solar irradiance of 5 kWh/m
2 are economically viable for solar energy initiatives [
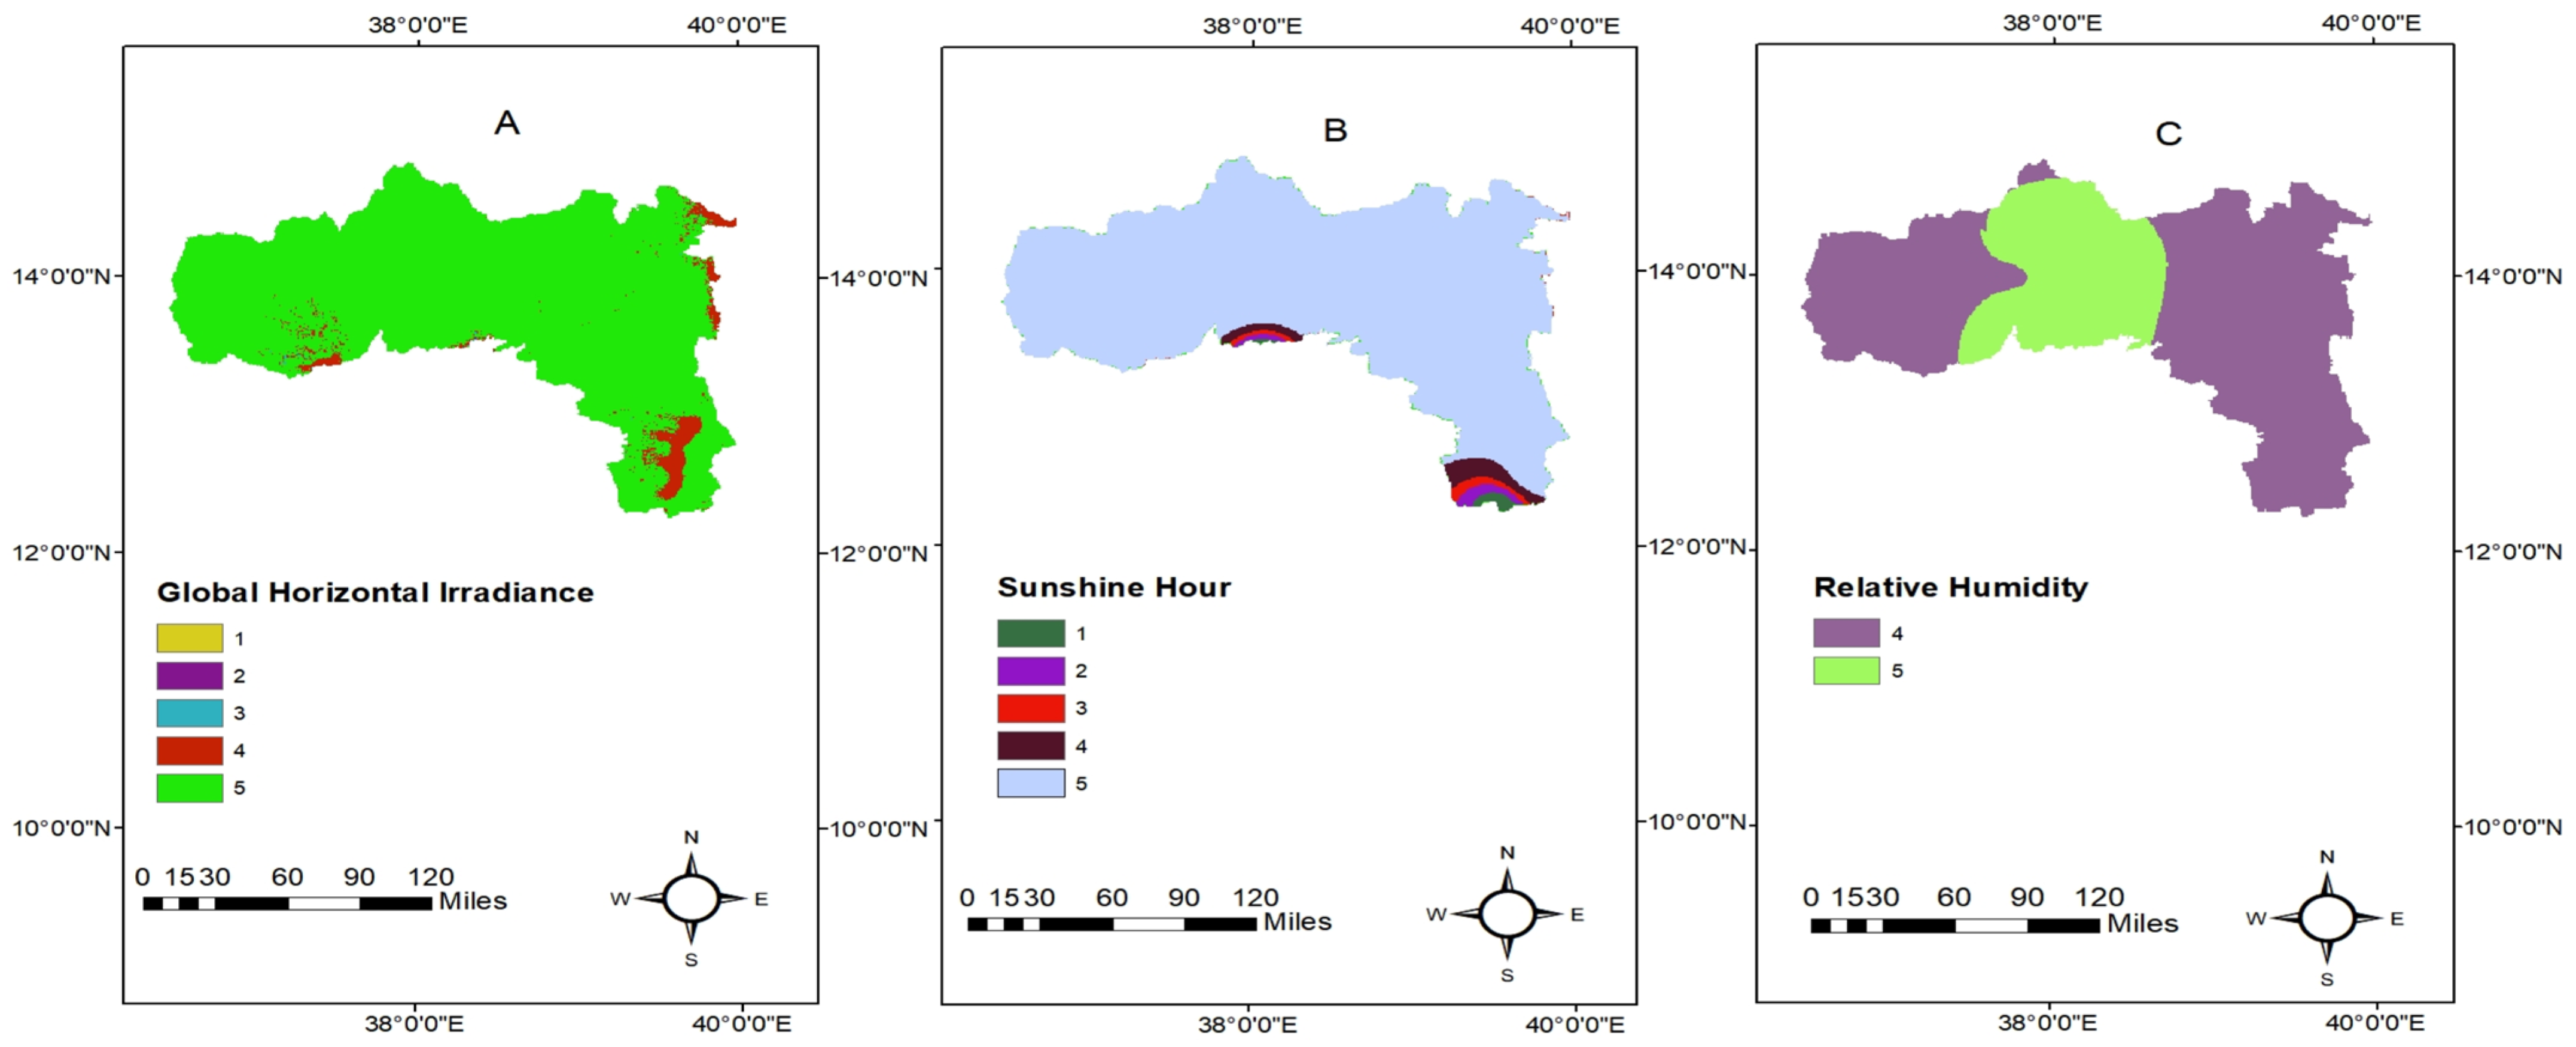
22]. For this study, the average daily global horizontal solar radiation raster data was extracted from the Global Solar Atlas. This dataset was presented as a raster with an initial resolution of 250 m, as demonstrated in
Figure 3C. The data was subsequently processed for projection and reclassification using Arc Map 10.8.
Sunshine Hours: The potential of an area is significantly influenced by the available solar radiation and the number of sunshine hours throughout the day. Data on sunshine hours for 15 distinct locations were obtained from the National Meteorology Agency—Tigray Branch [
23]. This dataset was converted into raster format using Inverse Distance Weighting (IDW) and further analyzed using ArcMap 10.8. The resulting raster representation, displayed in
Figure 3D, reveals that the average yearly sunshine hours range from a maximum of about 9 h to a minimum of around 7 h.
Aspect: The photovoltaic power plant’s geometrical setup is a critical factor, as it is capable of affecting the amount and duration of solar exposure. Regions like Tigray, located in the northern hemisphere, benefit from optimal solar radiation capture from the southern orientation. Shuttle Radar Topography Mission raster data, with a resolution of 90 m, was downloaded from Open Topography [
24]. This raster data is illustrated in
Figure 3F, and Arc Map 10.8 was utilised to process the data into the desired format.
Slope: Slope is a critical factor in the site selection of photovoltaic power plants. A slope raster was obtained from Open Topography [
24]. Areas with nearly flat surfaces are recommended since steep slopes can lead to self-shading of solar panels, reducing their efficiency and increasing the installation costs. According to Colak et al. [
25], a slope is considered unsuitable for site selection if it exceeds 20%. The slope raster is illustrated in
Figure 3E, where the slope varies from flat terrain to steep terrain at an angle of 64 degrees.
Temperature: Solar panel efficiency is significantly affected by temperature, with an optimal operating temperature of 25 °C. Temperatures above and below the optimal operating temperature lead to a reduction of efficiency in solar panels [
26]. The Global Solar Atlas [
27] was the source of the temperature data for the study, which was then refined to the desired resolution using Arc Map 10.8. The annual average temperature ranges from the highest 30 °C to the lowest 6.44 °C, as shown in
Figure 3B.
Humidity: Despite its minimal influence compared to temperature and sunlight duration, humidity has a negative influence on solar photovoltaic (PV) power generation [
28]. The National Meteorology Agency provided [
23] the humidity point data for 13 locations in the region. Inverse Distance Weighting (IDW) was used to process the data using ArcMap 10.8 and generate the raster shown in
Figure 3A. The minimum humidity is around 49%, and the maximum is around 54%.
3.4. Criteria for Wind Power Generation
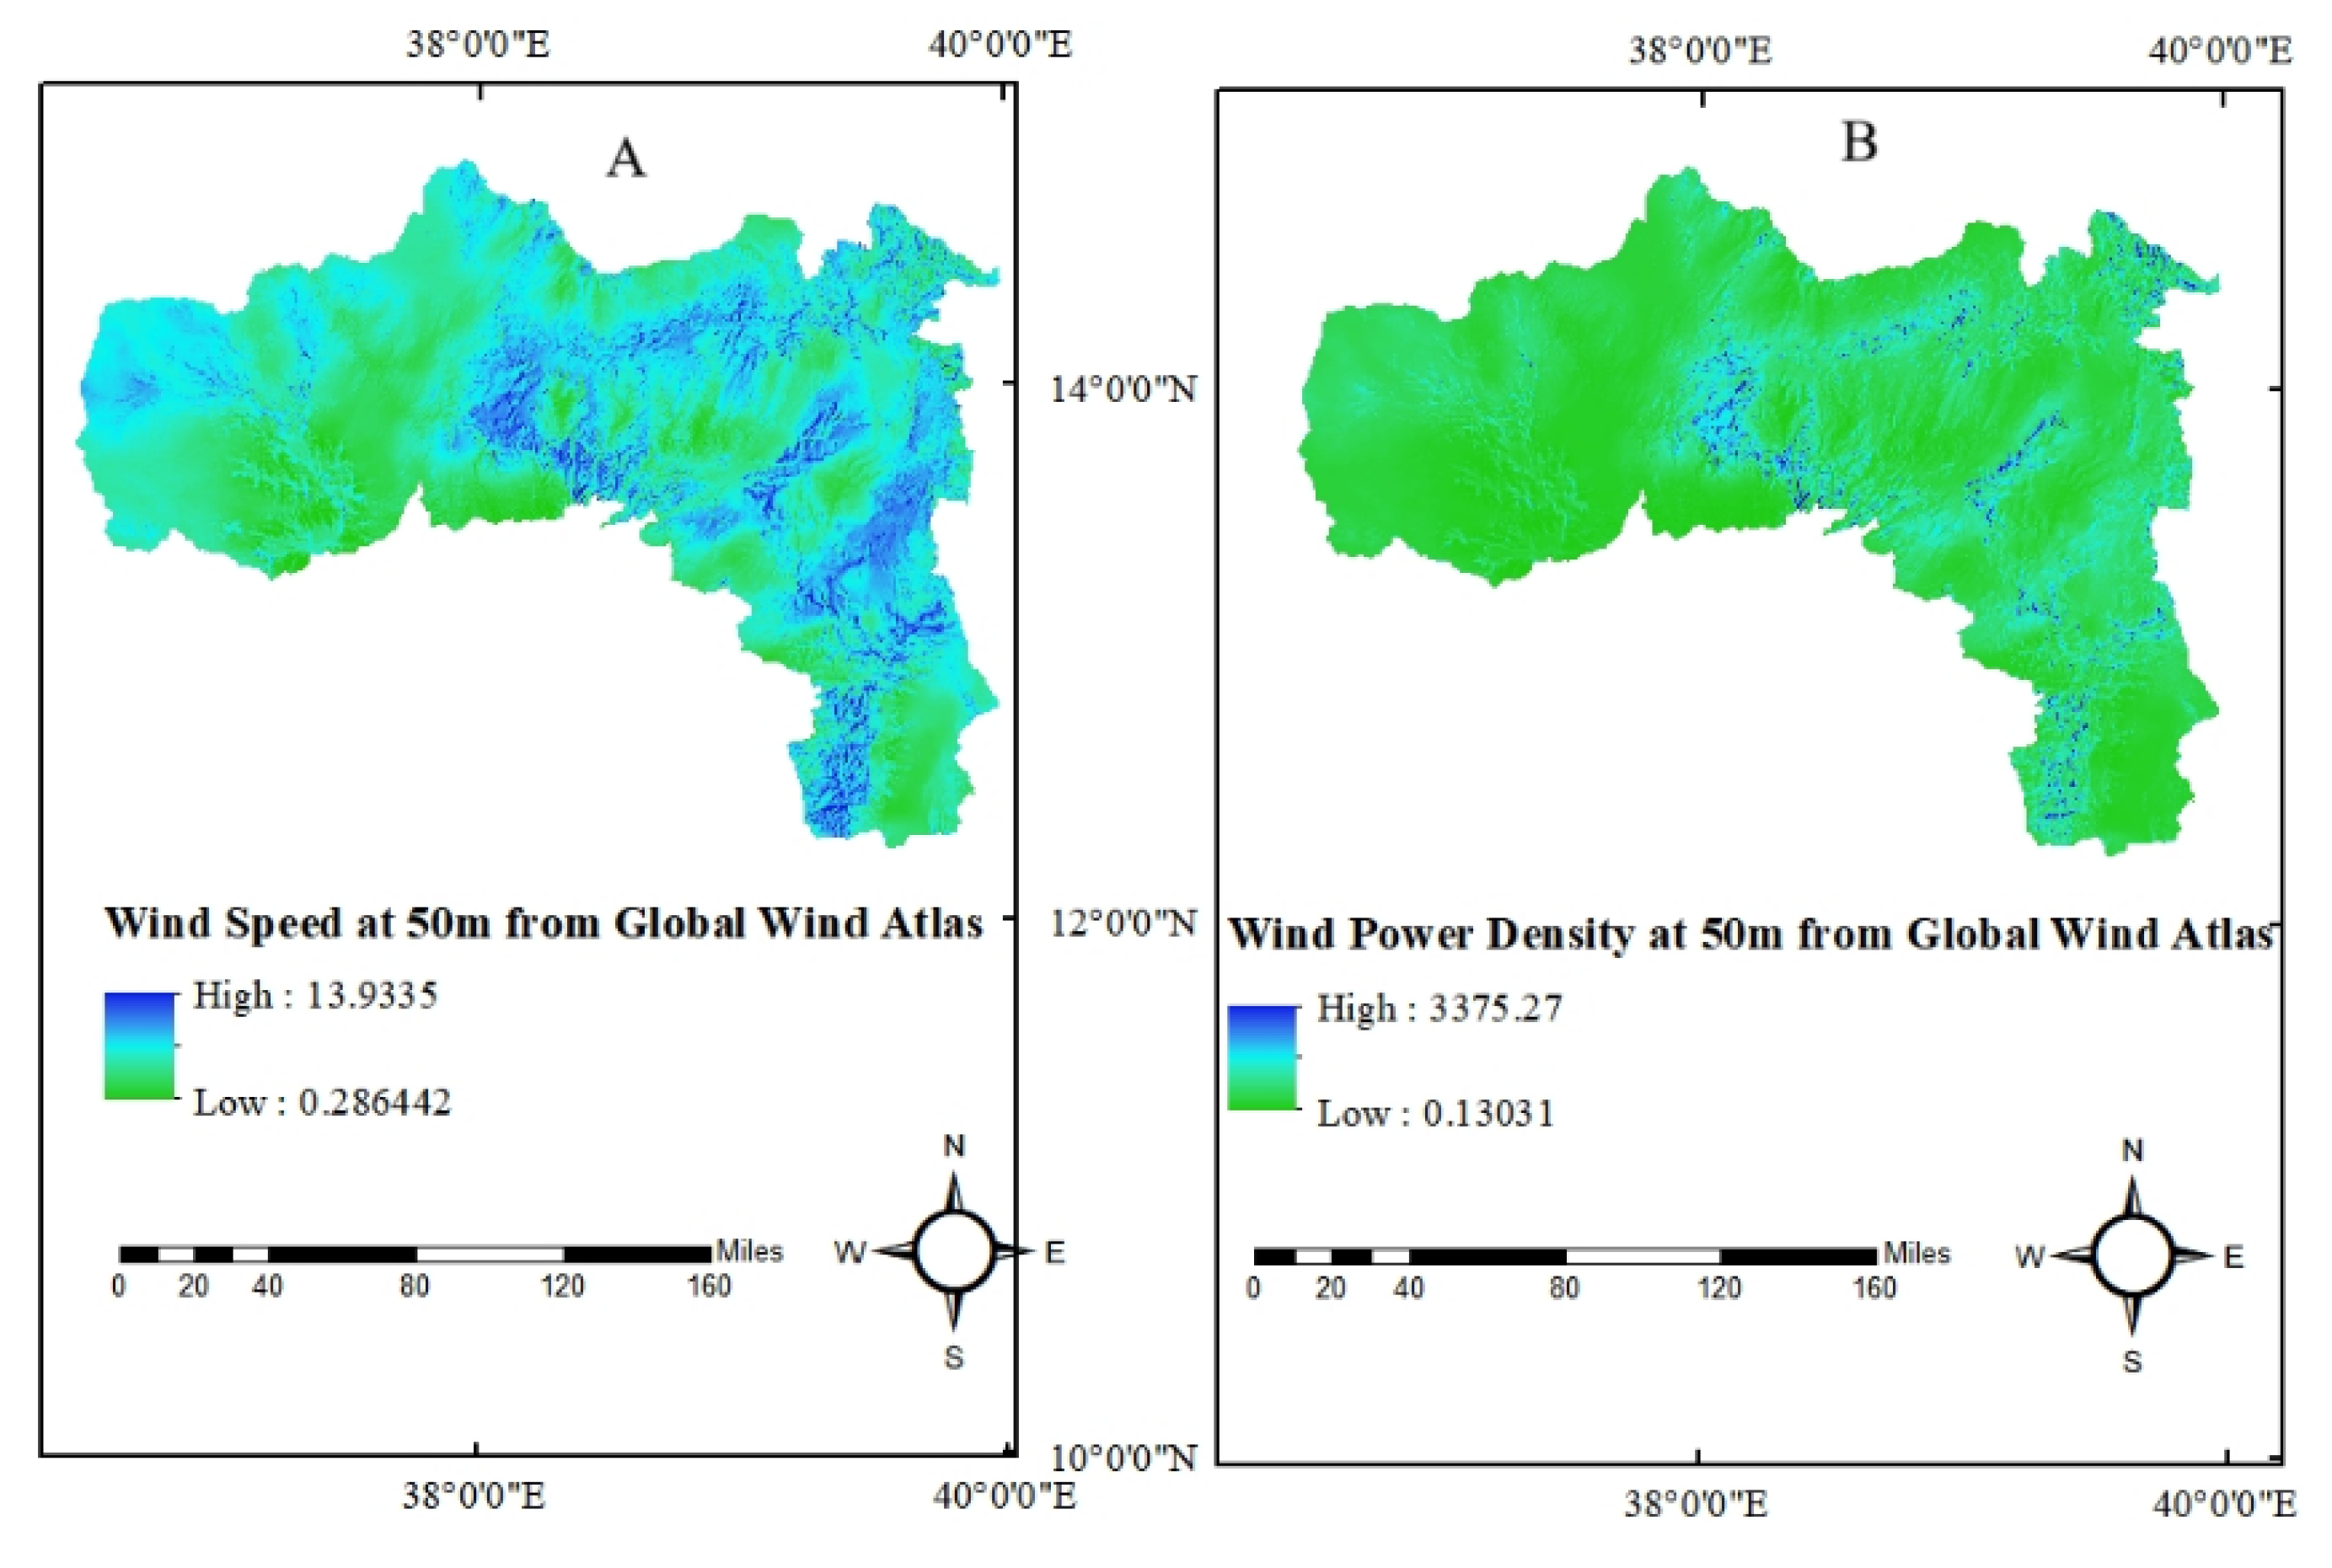
Wind speed: This is the most crucial factor, with the highest weight assigned to wind power site selection. In this research, we used wind speed raster data from the Global Wind Atlas [
29] at a height of 50 m. The wind speed ranges from a minimum of 0.28 up to a maximum of around 14 m per second, as shown in
Figure 4A. This wind speed data was processed into the desired raster format using Arc Map 10.8 and is reclassified based on the International Electro-Technical Commission wind speed class [
30].
Wind Power Density: This is one of the most critical factors in assessing the wind energy potential of a specific site [
31]. Raster data of the wind power density was downloaded from the Global Wind Atlas [
29] and then processed using ArcMap 10.8. The minimum value is 0.13 W/m
2, whereas the maximum value is 3375 W/m
2. The raster is shown in
Figure 4B. The reclassification of wind power density is based on the International Electro-Technical Commission classification [
30].
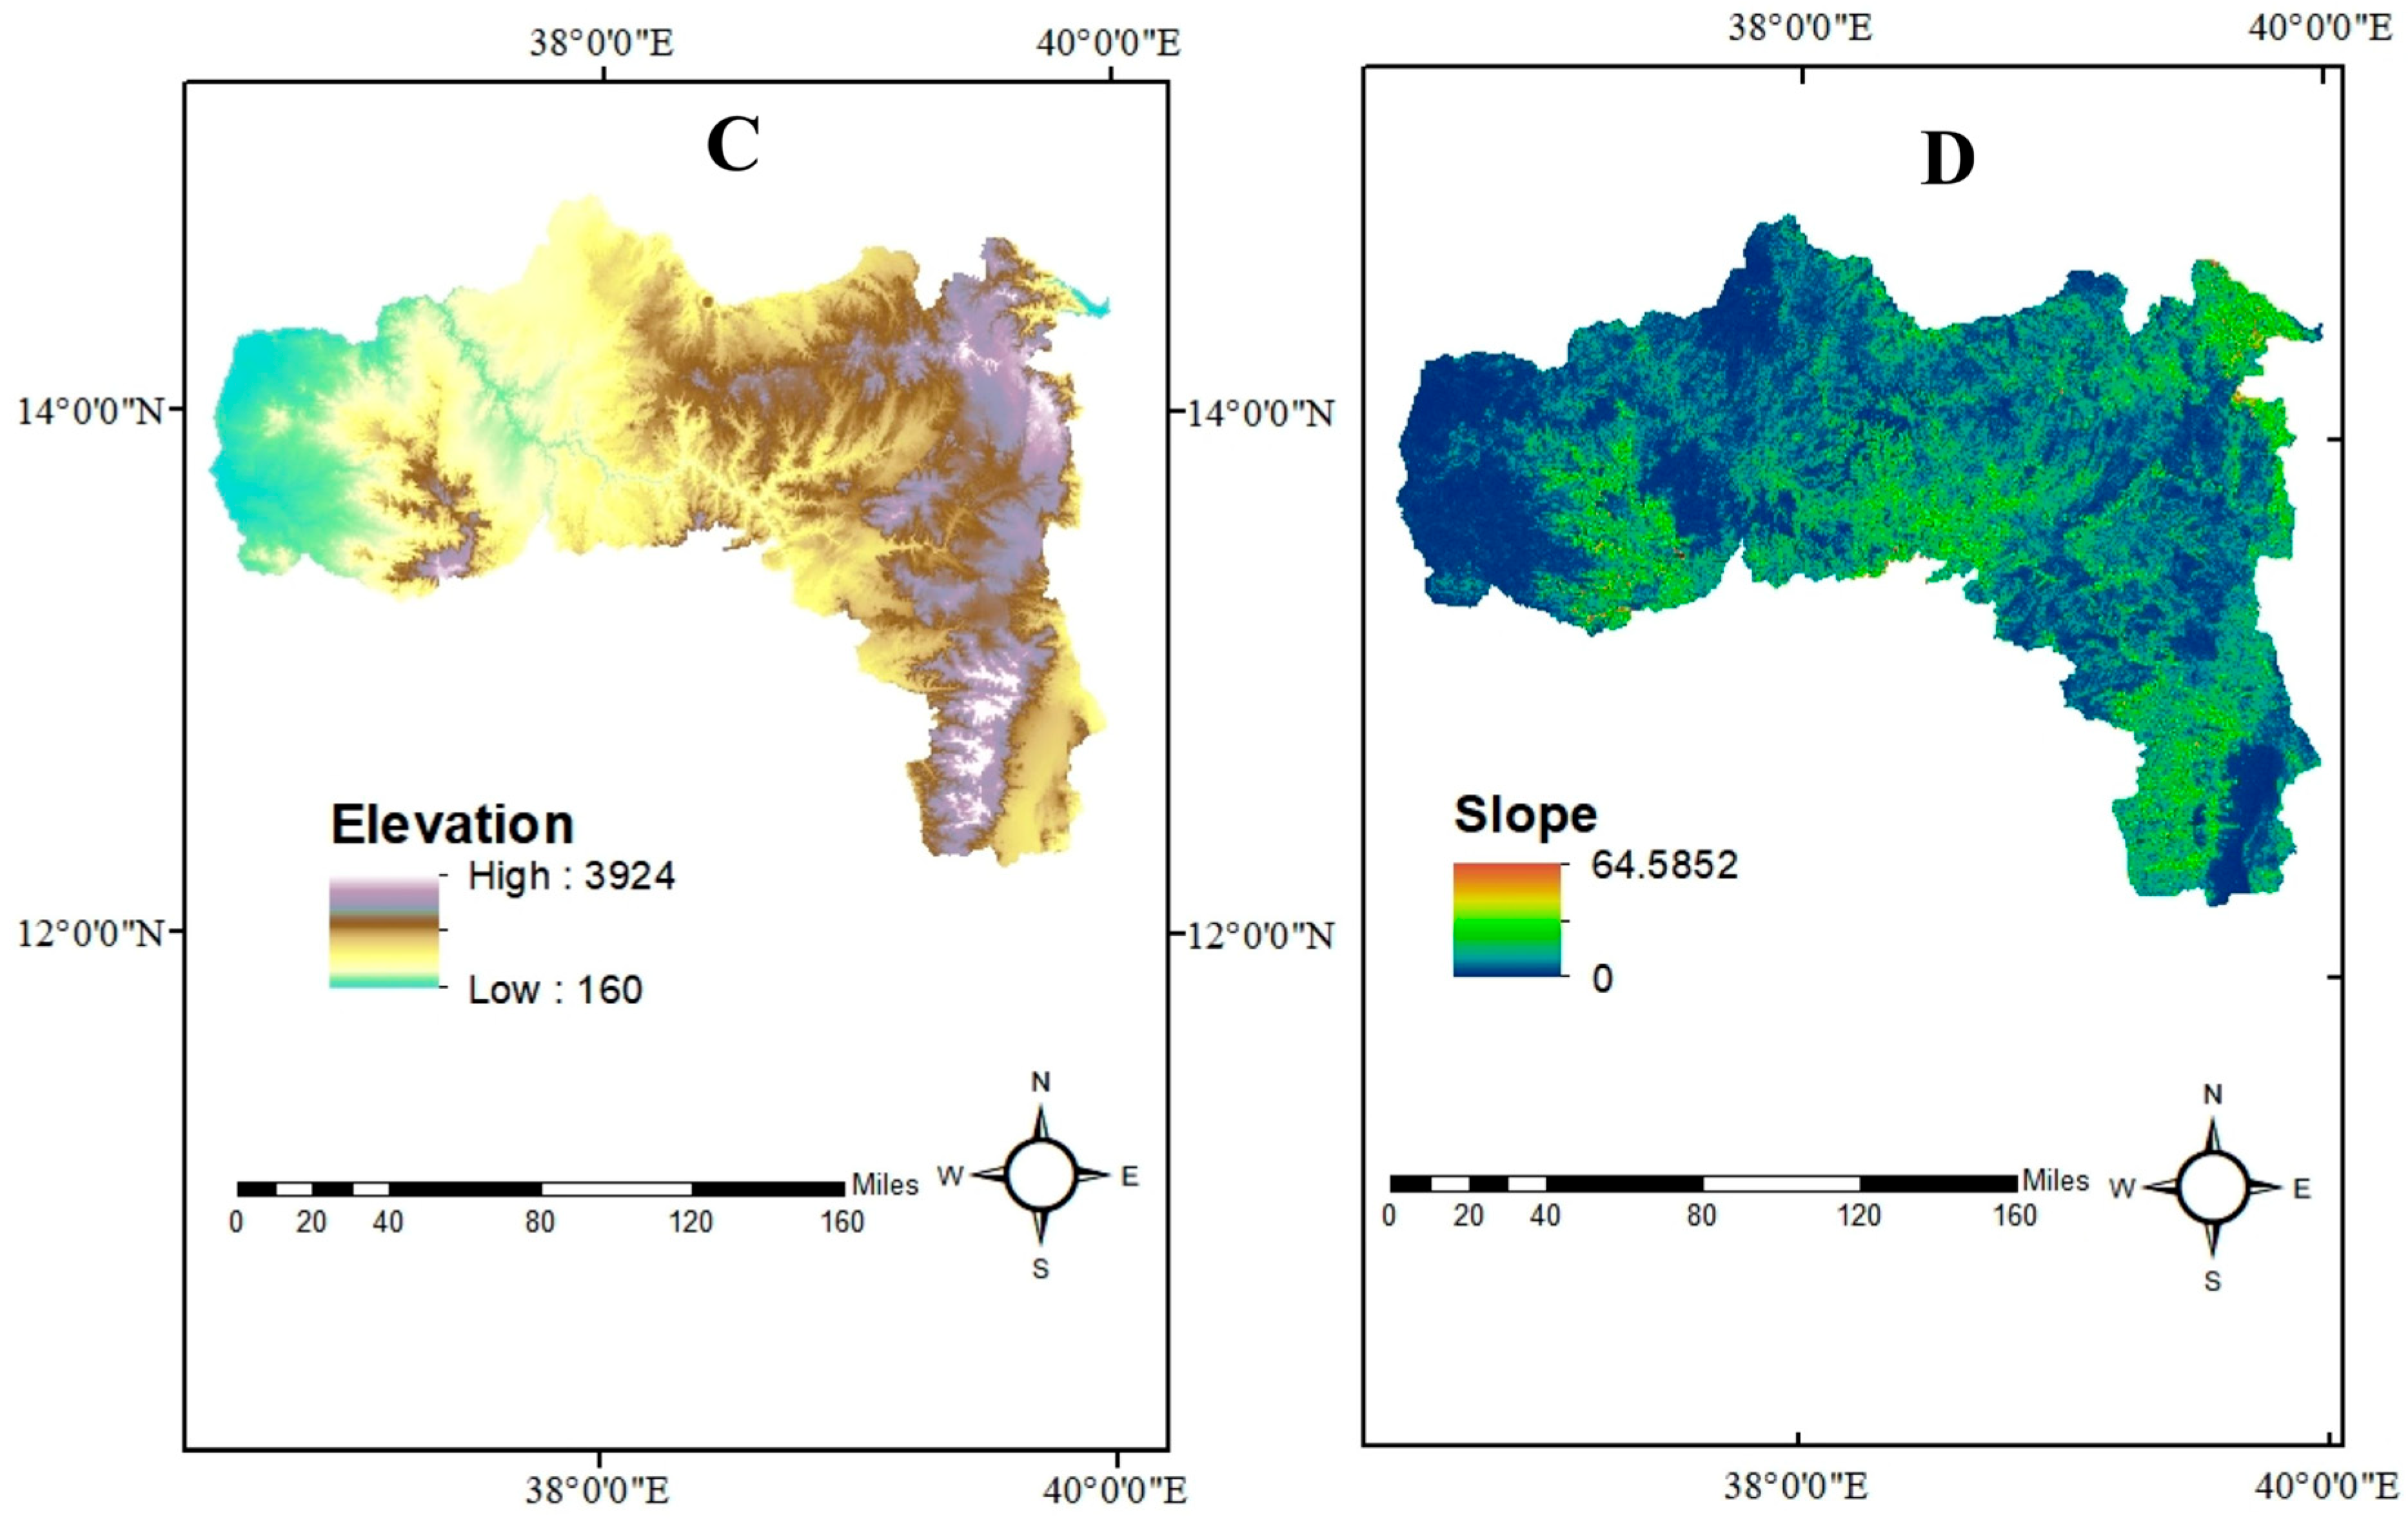
Elevation: Another factor that influences both the economic viability and resource potential of wind power generation is the elevation of the site. Elevation data were obtained from the Shuttle Radar Topography Mission (SRTM) [
24] and processed using Arc Map 10.8. The elevation ranges from 160 to 3914 m, and the raster representation is provided in
Figure 4C.
Slope: The construction of wind farms is significantly influenced by the slope of the site [
32]. Data from the Shuttle Radar Topography Mission [
24] have been used to process and generate the slope raster using ArcMap 10.8. The slope of the terrain ranges from 0 to 64 degrees, as illustrated in
Figure 4D.
3.5. Environmental and Economic Factors for Wind and Solar Power Site Selection
Land use land cover: Land use refers to how humans utilize a specific area, while land cover describes the physical characteristics of that area. When selecting sites for wind and solar power, barren land is the most preferred option, while areas with buildings and crops should be avoided [
33]. The land use and land cover map with a resolution of 10 m was downloaded from the Esri Sentinel-2 land cover explorer [
34], which is applicable for both wind and solar power site selection. The raster representation is provided in
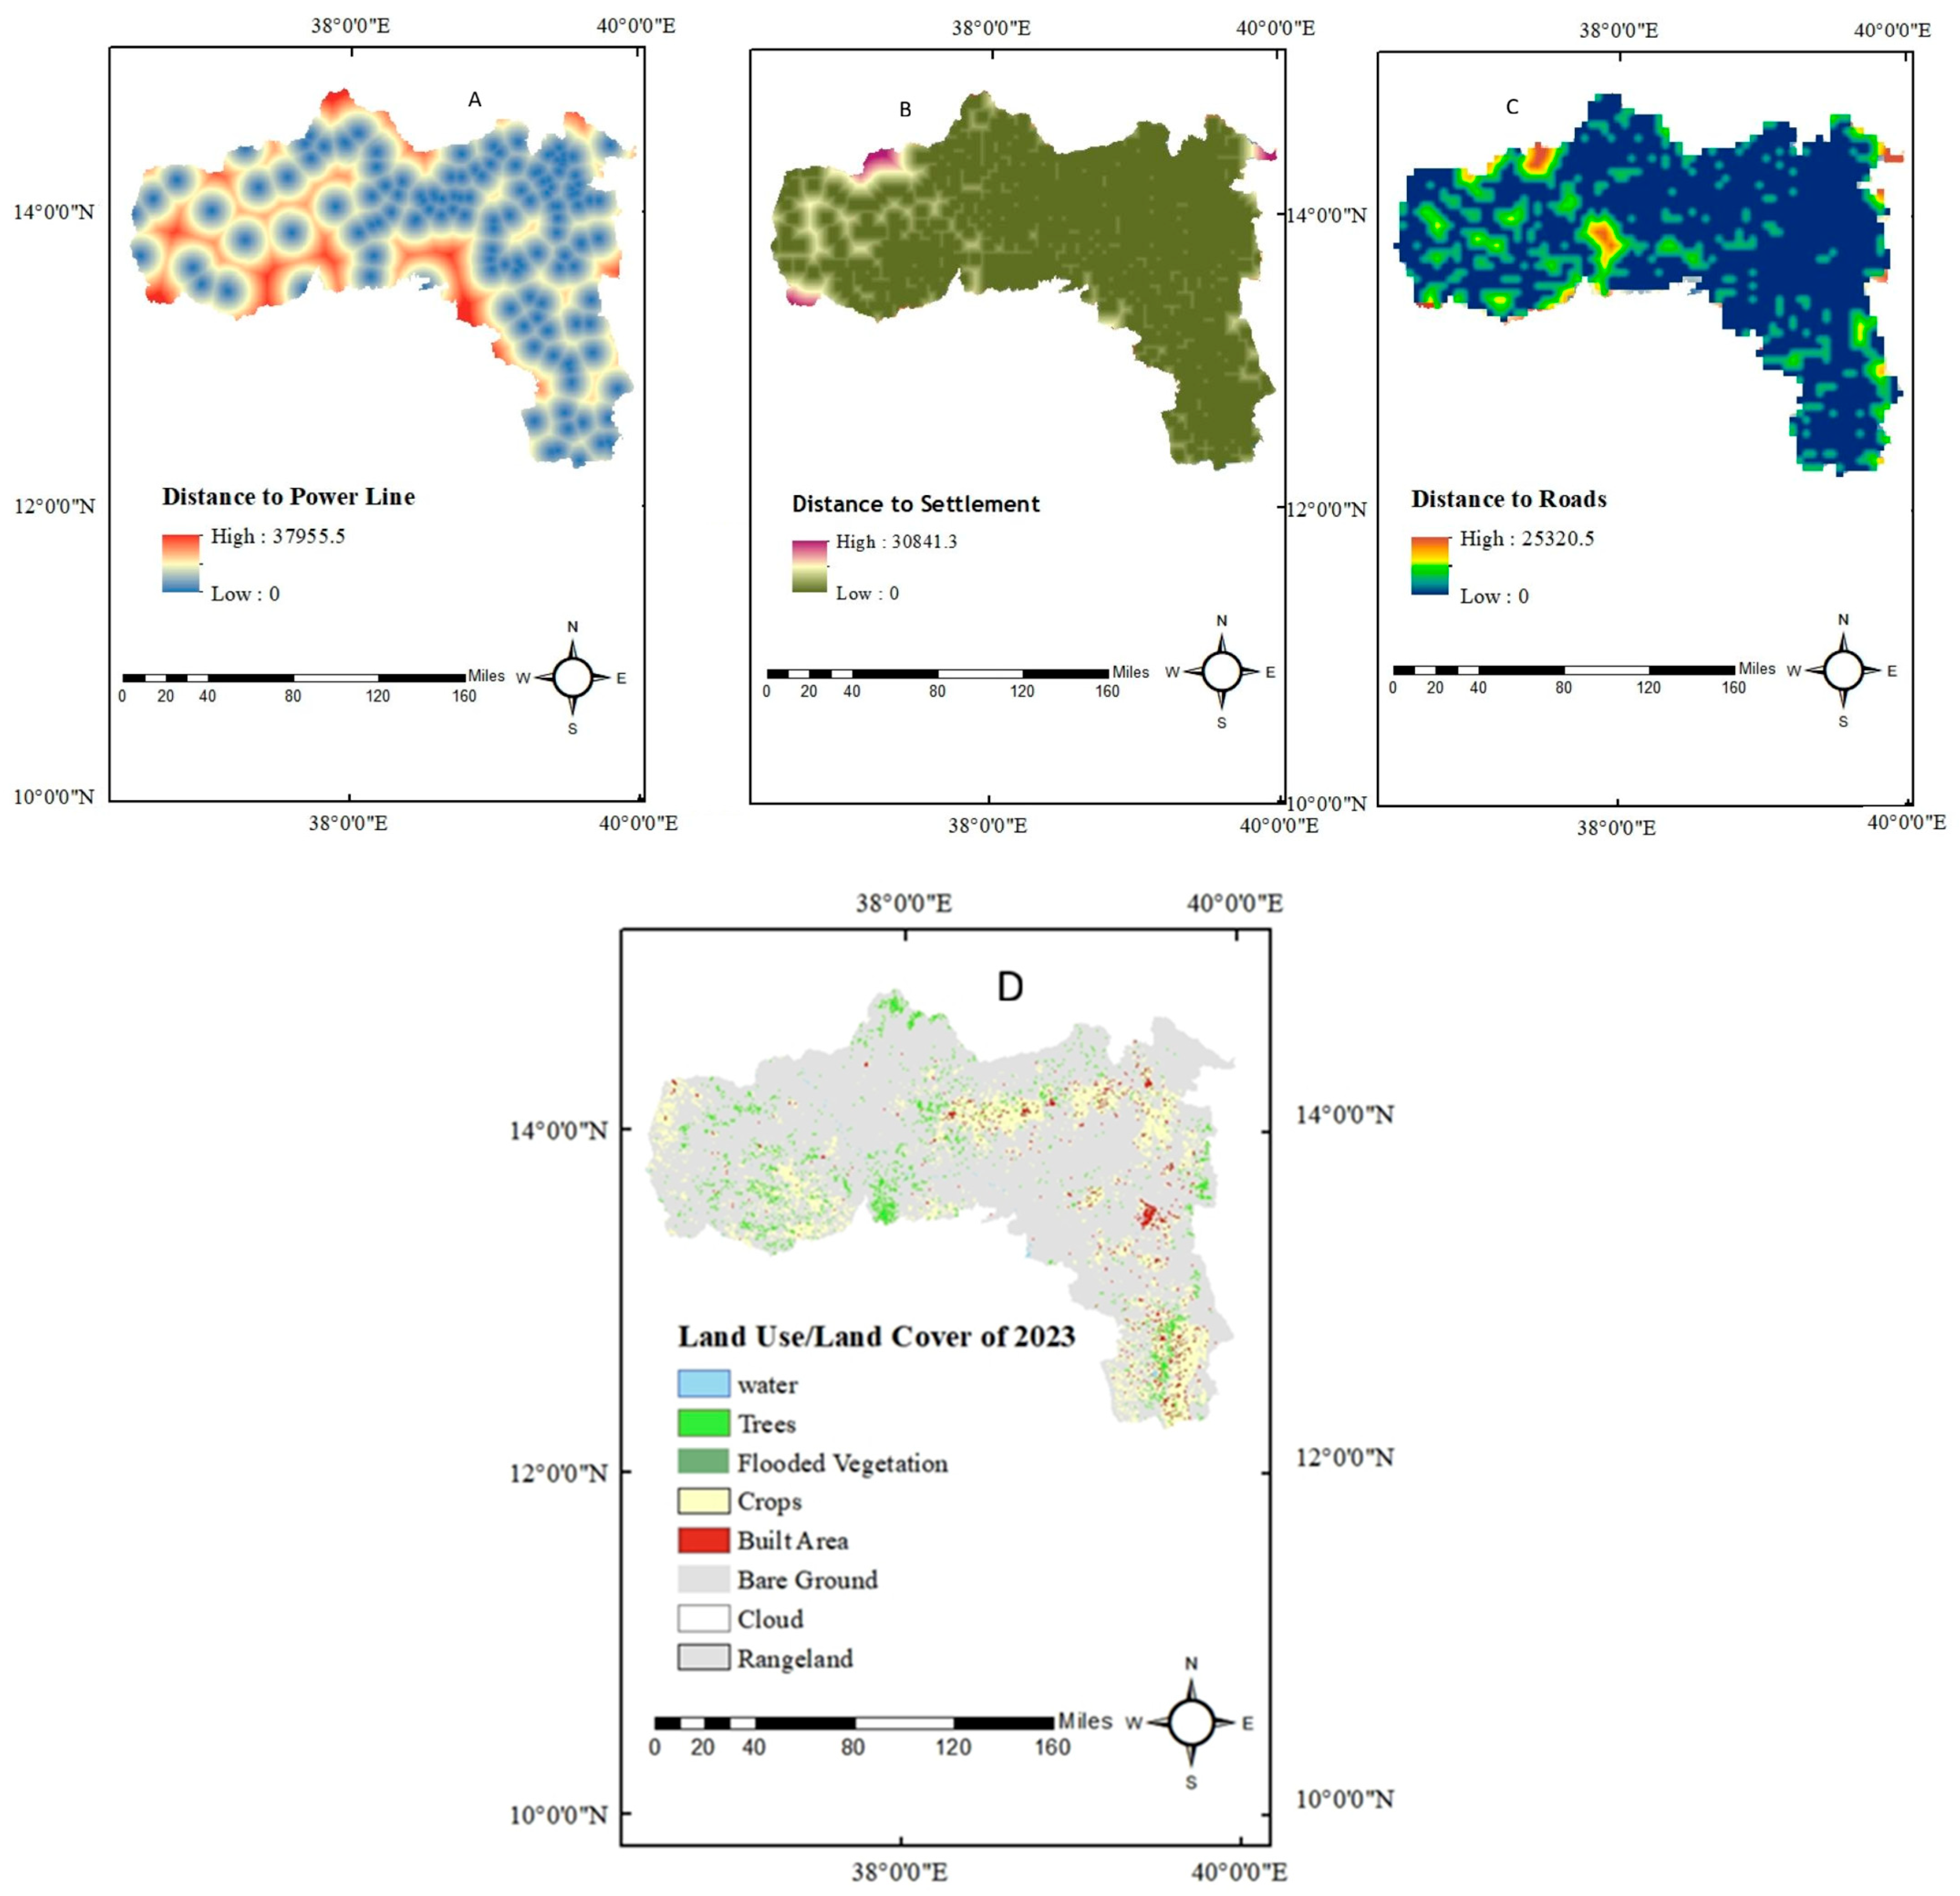
Figure 5D.
Distance to roads: The distance to roads is another important factor that influences the installation and cost of wind and solar power plants [
35,
36]. The farther a location is from roadways, the more difficult and costly it becomes. The distance from roads varies from a minimum of 0 up to approximately 25 km. The shape file for distance from roads was obtained from humanitarian data exchange services [
37]. The shape file is processed and converted into a raster using Arc Map 10.8, as illustrated in
Figure 5C.
Distance to Transmission Lines: The proximity of locations to transmission lines significantly impacts installation costs and influences the decision regarding the suitability of a site for off-grid or on-grid installations for both wind and solar power plants [
33,
38]. Rural areas that are far away from conventional grid power lines are best suited for off-grid electrification. The transmission line data was obtained from the Ethiopian Electric Utility-Tigray Branch. As shown in
Figure 5A, the distance to the power line varies from 0 to 38 km.
Distance to Residential Areas/Settlements: The suitability of a site for wind and solar power generation is influenced by its proximity to residential areas. Ideally, the closer a site is to these areas, the more advantageous it becomes. Data regarding the distance to settlement areas was obtained from the map server of Ethiopia [
39]. The corresponding raster is illustrated in
Figure 5B, and it varies from a minimum of zero to a maximum of 30 km.
3.6. Prioritizing Factors Using the Multi-Criteria Analytic Hierarchy Process
The Analytic Hierarchy Process (AHP) is a proven decision-making method that is effective in various areas, including the site selection of wind and solar power plants that involve complex decision-making. It provides a solution to decision-making problems through a hierarchical structure based on the qualitative judgments of experts and a nine-point scale to prioritize criteria through a pairwise comparison developed by [
40]. Uncertainty is a common challenge in decision-making processes. To address this, a sensitivity analysis is used to check the consistency of a decision in response to preferences for the criteria [
40,
41].
The decision-making process using AHP can be summarized in the following steps.
The first step was to define the problem and structure the Hierarchy, which involves breaking down the problem into a hierarchy of criteria, sub-criteria, and alternatives [
42]. Based on these, solar and wind power site selection criteria are identified from existing literature as given and described in
Section 3.3,
Section 3.4 and
Section 3.5.
After the identification of the criteria, the next step was comparing them in pairs based on their importance or preference using Saaty’s 1–9 scale [
43]. The nine-point Saaty’s scale for pairwise comparison criteria and its description are given in
Table 2.
Based on this scale, the pair-wise comparison of the factors for both wind and solar power site selection is conducted by experts from different stakeholders, and the composition of the experts is provided in
Table 3 The selection criteria for experts were based on the requirement of a minimum of a Bachelor’s degree in electrical engineering or renewable energy technology. For academicians, candidates were required to possess at least ten years of professional experience in both teaching and research pertinent to renewable energy, with a specific emphasis on wind and solar technologies. This professional experience includes comprehensive involvement in the planning and operational dimensions, feasibility studies, as well as the installation and maintenance of wind and solar energy systems. Utilizing these established criteria, thirteen experts were identified through purposive sampling from five distinct organizations actively engaged in renewable energy research, planning, feasibility analysis, installation, operation, and maintenance. Following the pairwise comparison by the experts, the next procedure was to calculate the weight vector to rank the criteria [
44].
Having a matrix of the pairwise comparison, matrix A, and a total of
n criteria, the weight vector is calculated as;
Equation (1) is used to obtain the normalized matrix
where weight
is the average of the normalized values across its row.
After calculating the weight of each criterion, the next step is to determine the eigenvalue and check the consistency of the experts’ judgments [
45]. The consistency of the evaluation is checked by using the consistency ratio.
λmax in Equation (3) is the maximum eigenvalue using the weight vector
W.
where
CI is the consistency index that quantifies the degree of inconsistency in the pairwise comparisons.
where
CR is the Consistency Ratio and RI is the Random Index, which is a predefined value based on the size of the matrix (
A) as given in
Table 4.
If CR < 0.1, the judgments are considered consistent. Among all the comparisons made, only one was inconsistent and had to be repeated.
Table 4.
RI values for matrix sizes.
Table 4.
RI values for matrix sizes.
| Size of Matrix | Random Consistency | Size of Matrix | Random Consistency |
|---|
| 1 | 0 | 6 | 1.24 |
| 2 | 0 | 7 | 1.32 |
| 3 | 0.58 | 8 | 1.41 |
| 4 | 0.90 | 9 | 1.45 |
| 5 | 1.12 | 10 | 1.49 |
3.7. Weighted Overlay Analysis
The Weighted Overlay tool in ArcMap 10.8 is an essential part of the ArcGIS Spatial Analyst extension. This research uses it to create the map for off-grid hybrid wind solar power. The tool is meant for multi-criteria evaluation and suitability modeling [
46]. It allows users to combine multiple raster datasets by giving different importance levels to each. This way, it produces a single output raster that shows overall suitability clearly. The Weighted Overlay tool systematically evaluates input data on a common scale that usually ranges from 1 to 9 or 1 to 5, along with Resolution, Extent, and Geographic reference system. It assigns weights to the input rasters and combines them accordingly. Locations that are more favorable for each input criterion are given higher values, where 9 or 5 indicates the most favorable. It is crucial that the total of the weights assigned to the input rasters equals 100 percent. Each layer is then multiplied by its respective weight. The results for each cell are summed to create the final output. The Weighted Overlay methodology works on the idea that factors deemed more favorable will correspond to higher values in the final raster, making it easier to find the best locations.
3.8. Sensitivity Analysis of the Rank and Weight of Criterias
In this research, in order to address the uncertainties inherent in the Analytic Hierarchy Process (AHP) judgment, a sensitivity analysis has been conducted on the aggregated matrix for both wind and solar energy site selection criteria, utilizing Monte Carlo Simulation within the Python environment. This analysis incorporates data from all participating experts to enhance the robustness of the findings. The core of the analysis is the Monte Carlo simulation, which runs 5000 simulations. The sensitivity analysis simulates the impact of judgment uncertainty on the output. A log-normal distribution is used to perturb the original judgments. In each of the 5000 simulations, the AHP weights are recalculated for the perturbed matrix using the eigenvector method. This generates a distribution of possible weights for each criterion and the frequency of each criterion’s rank during the entire simulation, and shows if the weight and rank of the factors vary due to a slight variation in the comparison matrix.
3.9. Economic Analysis
The mapping of the hybrid wind solar sites is supported by a preliminary economic analysis conducted primarily through the framework of the Levelized Cost of Energy (LCOE) for locations designated as highly suitable for an off-grid hybrid wind-solar power system using the Python environment. This power system combines wind turbines, solar photovoltaic technologies, and battery storage and an assessment of various configurations across a range of financial and technical contexts has been done.
The analysis uses a combination of different input data. The analysis uses the wind speed and Global Horizontal Irradiance as an input for each polygon. Based on this input the potential for generating solar and wind energy is influenced by several factors, including the availability of suitable locations for installations, the types of solar photovoltaic systems and wind turbines utilised, and the necessary infrastructure accompanying the facility. The potential for solar energy generation for a specific area can be estimated by using Equation (6).
where
is the solar potential,
is the annual mean horizontal solar irradiation measured in kilowatt-hours per square meter per day (kWh/m
2/day),
SA is the suitable land area (m
2),
AF is the area factor expressed as a percentage, and
is solar panel efficiency as a percentage [
47]. The area factor (AF) indicates the maximum coverage of solar panels while minimizing shadow and is assumed to be 70% as in [
48]. The efficiency of the solar panel is considered to be 22.45% as given by [
49]. Whereas the amount of wind power to be generated by an area identified as suitable can be quantified using Equation (7).
where
is the wind power potential (MW),
SA is the suitable land area (m
2), and
AF is the area factor (MW/m
2). Area factor
AF can be calculated as per Equation (8), which is provided below.
According to [
50] the spacing between small wind turbines along prevailing wind (downwind) should be greater than 5–7 rotor diameters (D), whereas crosswind spacing should be greater than 3–5 D. The wind turbine used for this analysis is a Aeolos-H 5000 w (a wind turbine produced by Aeolos wind based in London, UK) with a capacity of 5 kW and rotor diameter of 6.4 m [
51].
The required battery capacity of a specific site is determined based on Equation (9) as per [
52].
where,
Cbat: Required battery capacity
Eload: Daily energy consumption (Wh)
Naut: Days of autonomy (number of days battery should supply energy without recharging)
ηbat: Battery round-trip efficiency is taken as 0.9
DOD: Depth of Discharge is considered as 0.8
The load demand for each polygon identified as highly suitable is derived from population density data as provided in [
39] alongside the daily energy consumption per person specific to rural Ethiopian regions, as recommended by [
53].
The levelized cost of energy (LCOE) represents the average cost incurred per megawatt-hour (MWh) of electricity generated, serving as a crucial economic indicator for evaluating energy expenditures. It is determined by calculating the total lifetime costs associated with a specific energy generation project and dividing that figure by the total energy output produced throughout the project’s lifespan, as calculated using Equation (10) [
54].
where LCOE is the levelized cost of energy,
A is the annual total cost (the sum of the capital, operation and maintenance and replacement cost of each component),
t is the year of operation,
n is the lifetime in years,
Et,g is the annual energy produced and
i is the interest rate (%).
where
= solar capacity,
= wind capacity,
,
and
is the fraction of the total energy demand.
The capital expenditure (CAPEX) and operation and maintenance costs (OPEX) necessary for the calculation of the levelised cost of energy are considered as given in
Table 5.
In addition to the Capital and Operation costs, the LCOE is calculated based on the assumption that the system has a lifetime of 25 years and an interest rate of an average of 14.75% [
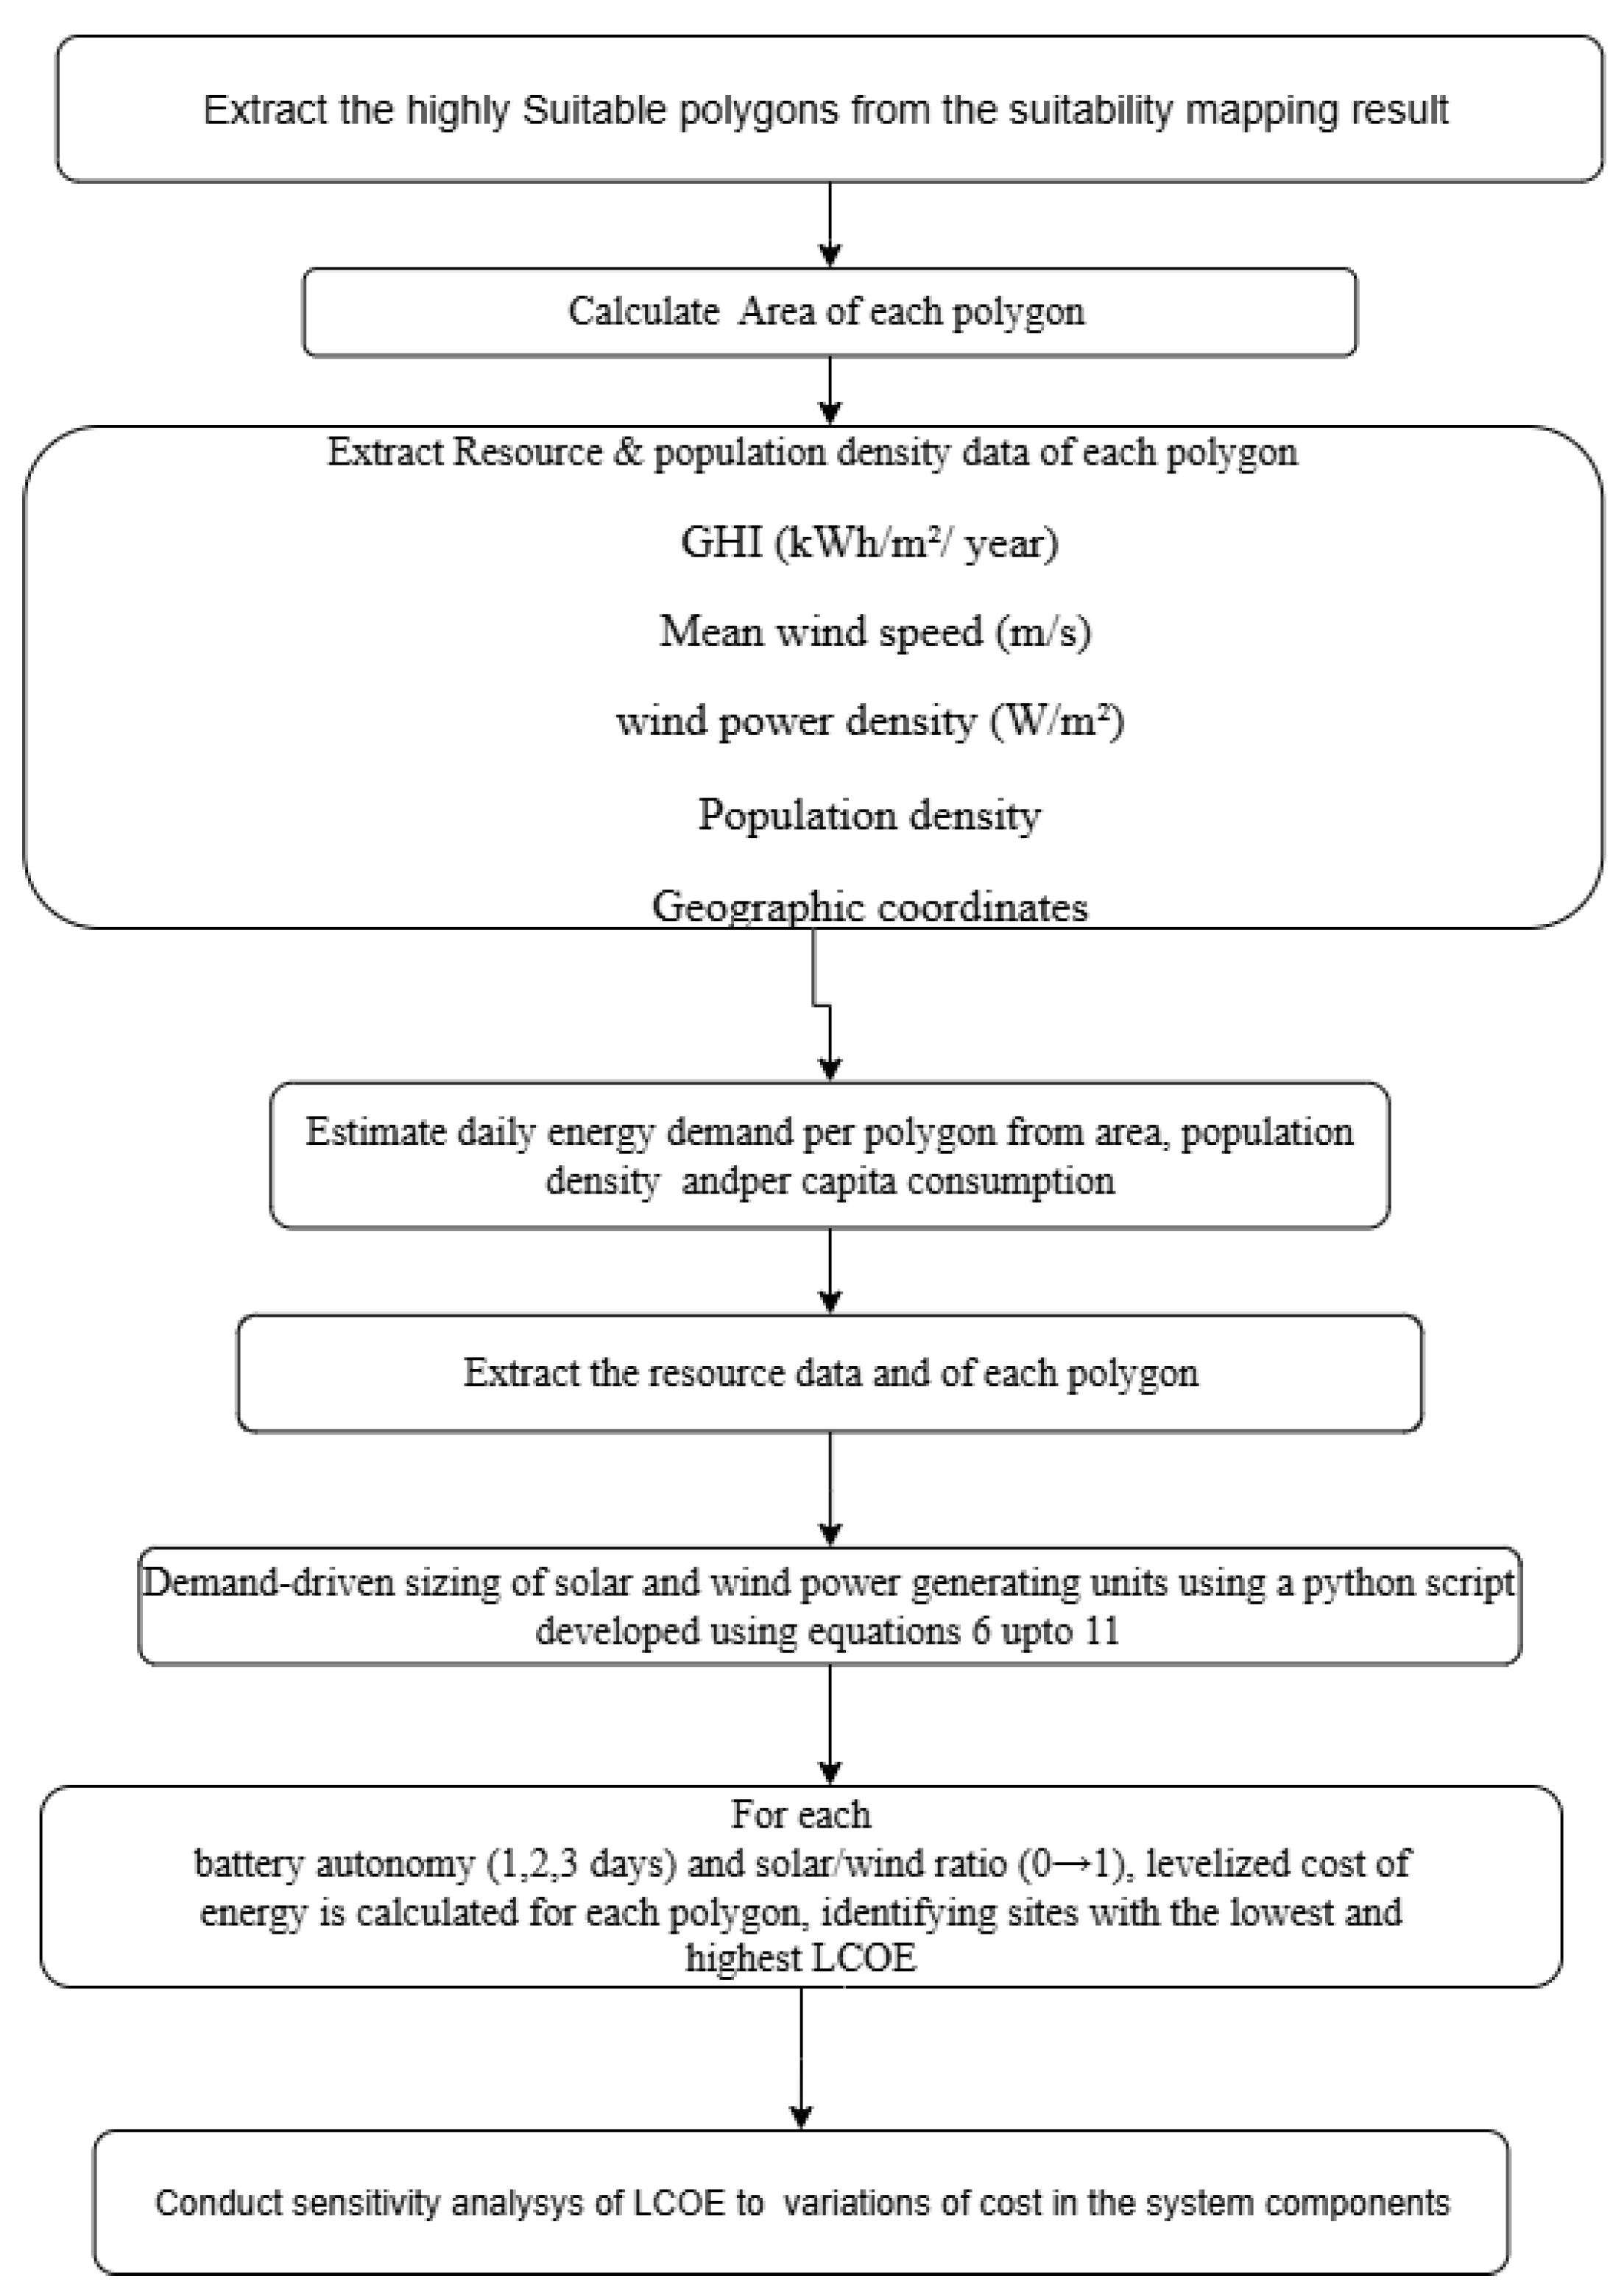
56]. The method used in the economic analysis can be summarised using
Figure 6.
The methodology begins with the identification of highly suitable polygons derived from the results of the suitability mapping. Following this, the area of each polygon is computed. Subsequently, relevant resource and demographic data are extracted for every polygon. Utilizing this data, the daily energy demand for each polygon is estimated, factoring in area, population density, and per capita consumption. The analysis proceeds with a demand-driven sizing of solar and wind power generation units, implemented through a Python script that applies Equations (6)–(11). For each combination of battery autonomy (ranging from 1 to 3 days) and solar/wind ratio (spanning from 0 to 1), the levelized cost of energy (LCOE) is calculated. Lastly, a sensitivity analysis of the LCOE is performed to evaluate the effects of cost fluctuations across various components of the system.
4. Results and Discussion
4.1. Results of Data Reclassification
Before the execution of the Weighted Overlay tool in ArcMap, essential preparatory steps were undertaken to ensure data compatibility and consistency. Initially, all 13 factors were obtained and converted into raster format. Point data, including variables such as sunshine hours and humidity, were interpolated utilizing methods of Inverse Distance Weighting for continuous variability. Meanwhile, vector data, encompassing features like roads and settlements, underwent standard conversion from vector to rasterization.
Although the input data are provided at various resolutions ranging from 10 to 250 m, it is imperative to process this data to a uniform resolution of 1000 m by 1000 m, despite the introduction of potential errors due to resampling. This standardization is crucial for maintaining a consistent cell size for each criterion for the geographic extent of the Tigray region. Categorical data, such as land use, were resampled using the Nearest Neighbor technique, while continuous variables, including temperature, underwent Bilinear Interpolation to preserve data integrity. Following this, each factor was reclassified into a standardized suitability scale spanning from 1 to 5, with this classification being informed by various literature sources. Ultimately, the integration of the rasters was achieved using the Weighted Overlay tool, which applied criterion-specific weights that summed to 100% and were established through the Analytical Hierarchy Process (AHP) and expert judgment. Each cell’s reclassified value was multiplied by its corresponding weight, resulting in the aggregation of the outcomes into a composite suitability raster.
Utilizing a combination of the Analytic Hierarchy Process and ArcMap 10.8, drawing on diverse input data from various organizations. The input data were processed into a raster format, ensuring that they maintained a consistent geographic coordinate system and UTM (Universal Transverse Mercator) system Zone 37N, and they have all been resampled to a resolution of 1000 by 1000 m with the same extent. Resampling to 1000 m is necessary for data consistency in Weighted Overlay, but it results in a coarse analysis. While it reduces computational time and complexity, it sacrifices local accuracy. The resulting suitability map will be useful for regional-scale identification of potential sites, rather than precise, local site selection.
The average weight assigned to each criterion, along with its classifications, is presented in
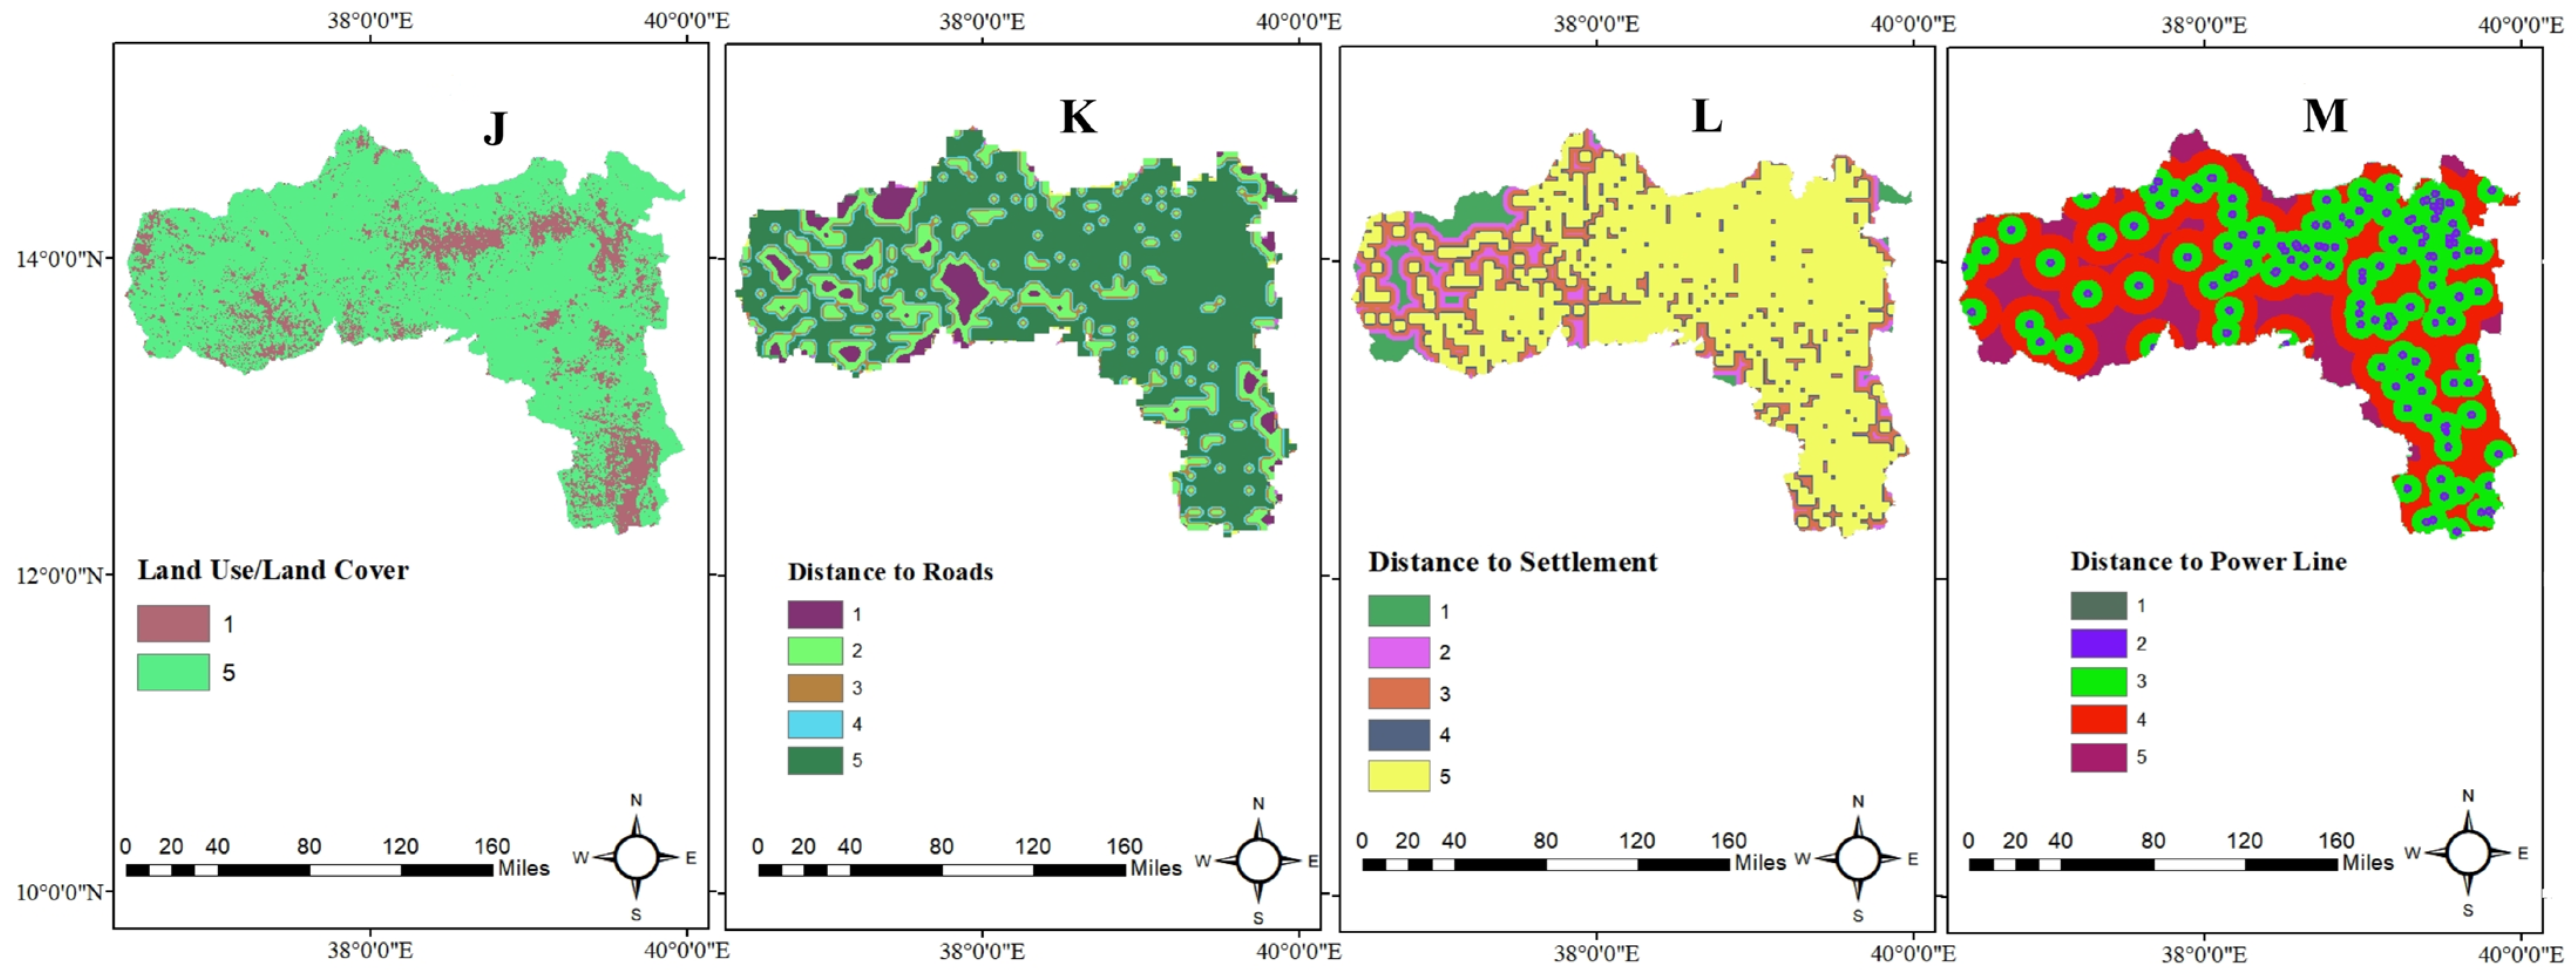
Table 6 based on the experts’ assessment. The factors have been prioritized utilizing the multi-criteria analytic hierarchy process. In addition to the ranking determined by the experts, each factor is categorized into five levels, with five indicating the highest suitability and one indicating unsuitability as the results can be seen from
Figure 7A–M. The rank and weight of the criteria are checked for reliability of the decisions by conducting a sensitivity analysis using Monte Carlo Simulation in the Python environment. This sensitivity analysis shows that the majority of the ranks given by the experts for each criterion are stable.
The rasters that have been reclassified based on the classifications found in
Table 6 and
Table 7 are presented below, and these have been utilized for the weighted overlay analysis.
According to the classification presented in
Table 6, the reclassification map for wind speed and solar radiation demonstrates the results outlined in
Table 8.
4.2. Result of Suitability Assessment
Following the reclassification of rasters, the subsequent phase involved the application of the ArcMap 10.8 Spatial Analyst weighted overlay tool. Initially, the rasters were integrated to create a composite raster representing potential locations for off-grid solar and off-grid wind installations, guided by the significance weights assigned to the respective criteria through the weighted overlay methodology. Subsequently, the results generated from these two off-grid rasters were combined utilizing the weighted overlay tool, ultimately producing a raster that delineates areas with potential suitability for off-grid hybrid wind-solar power installations.
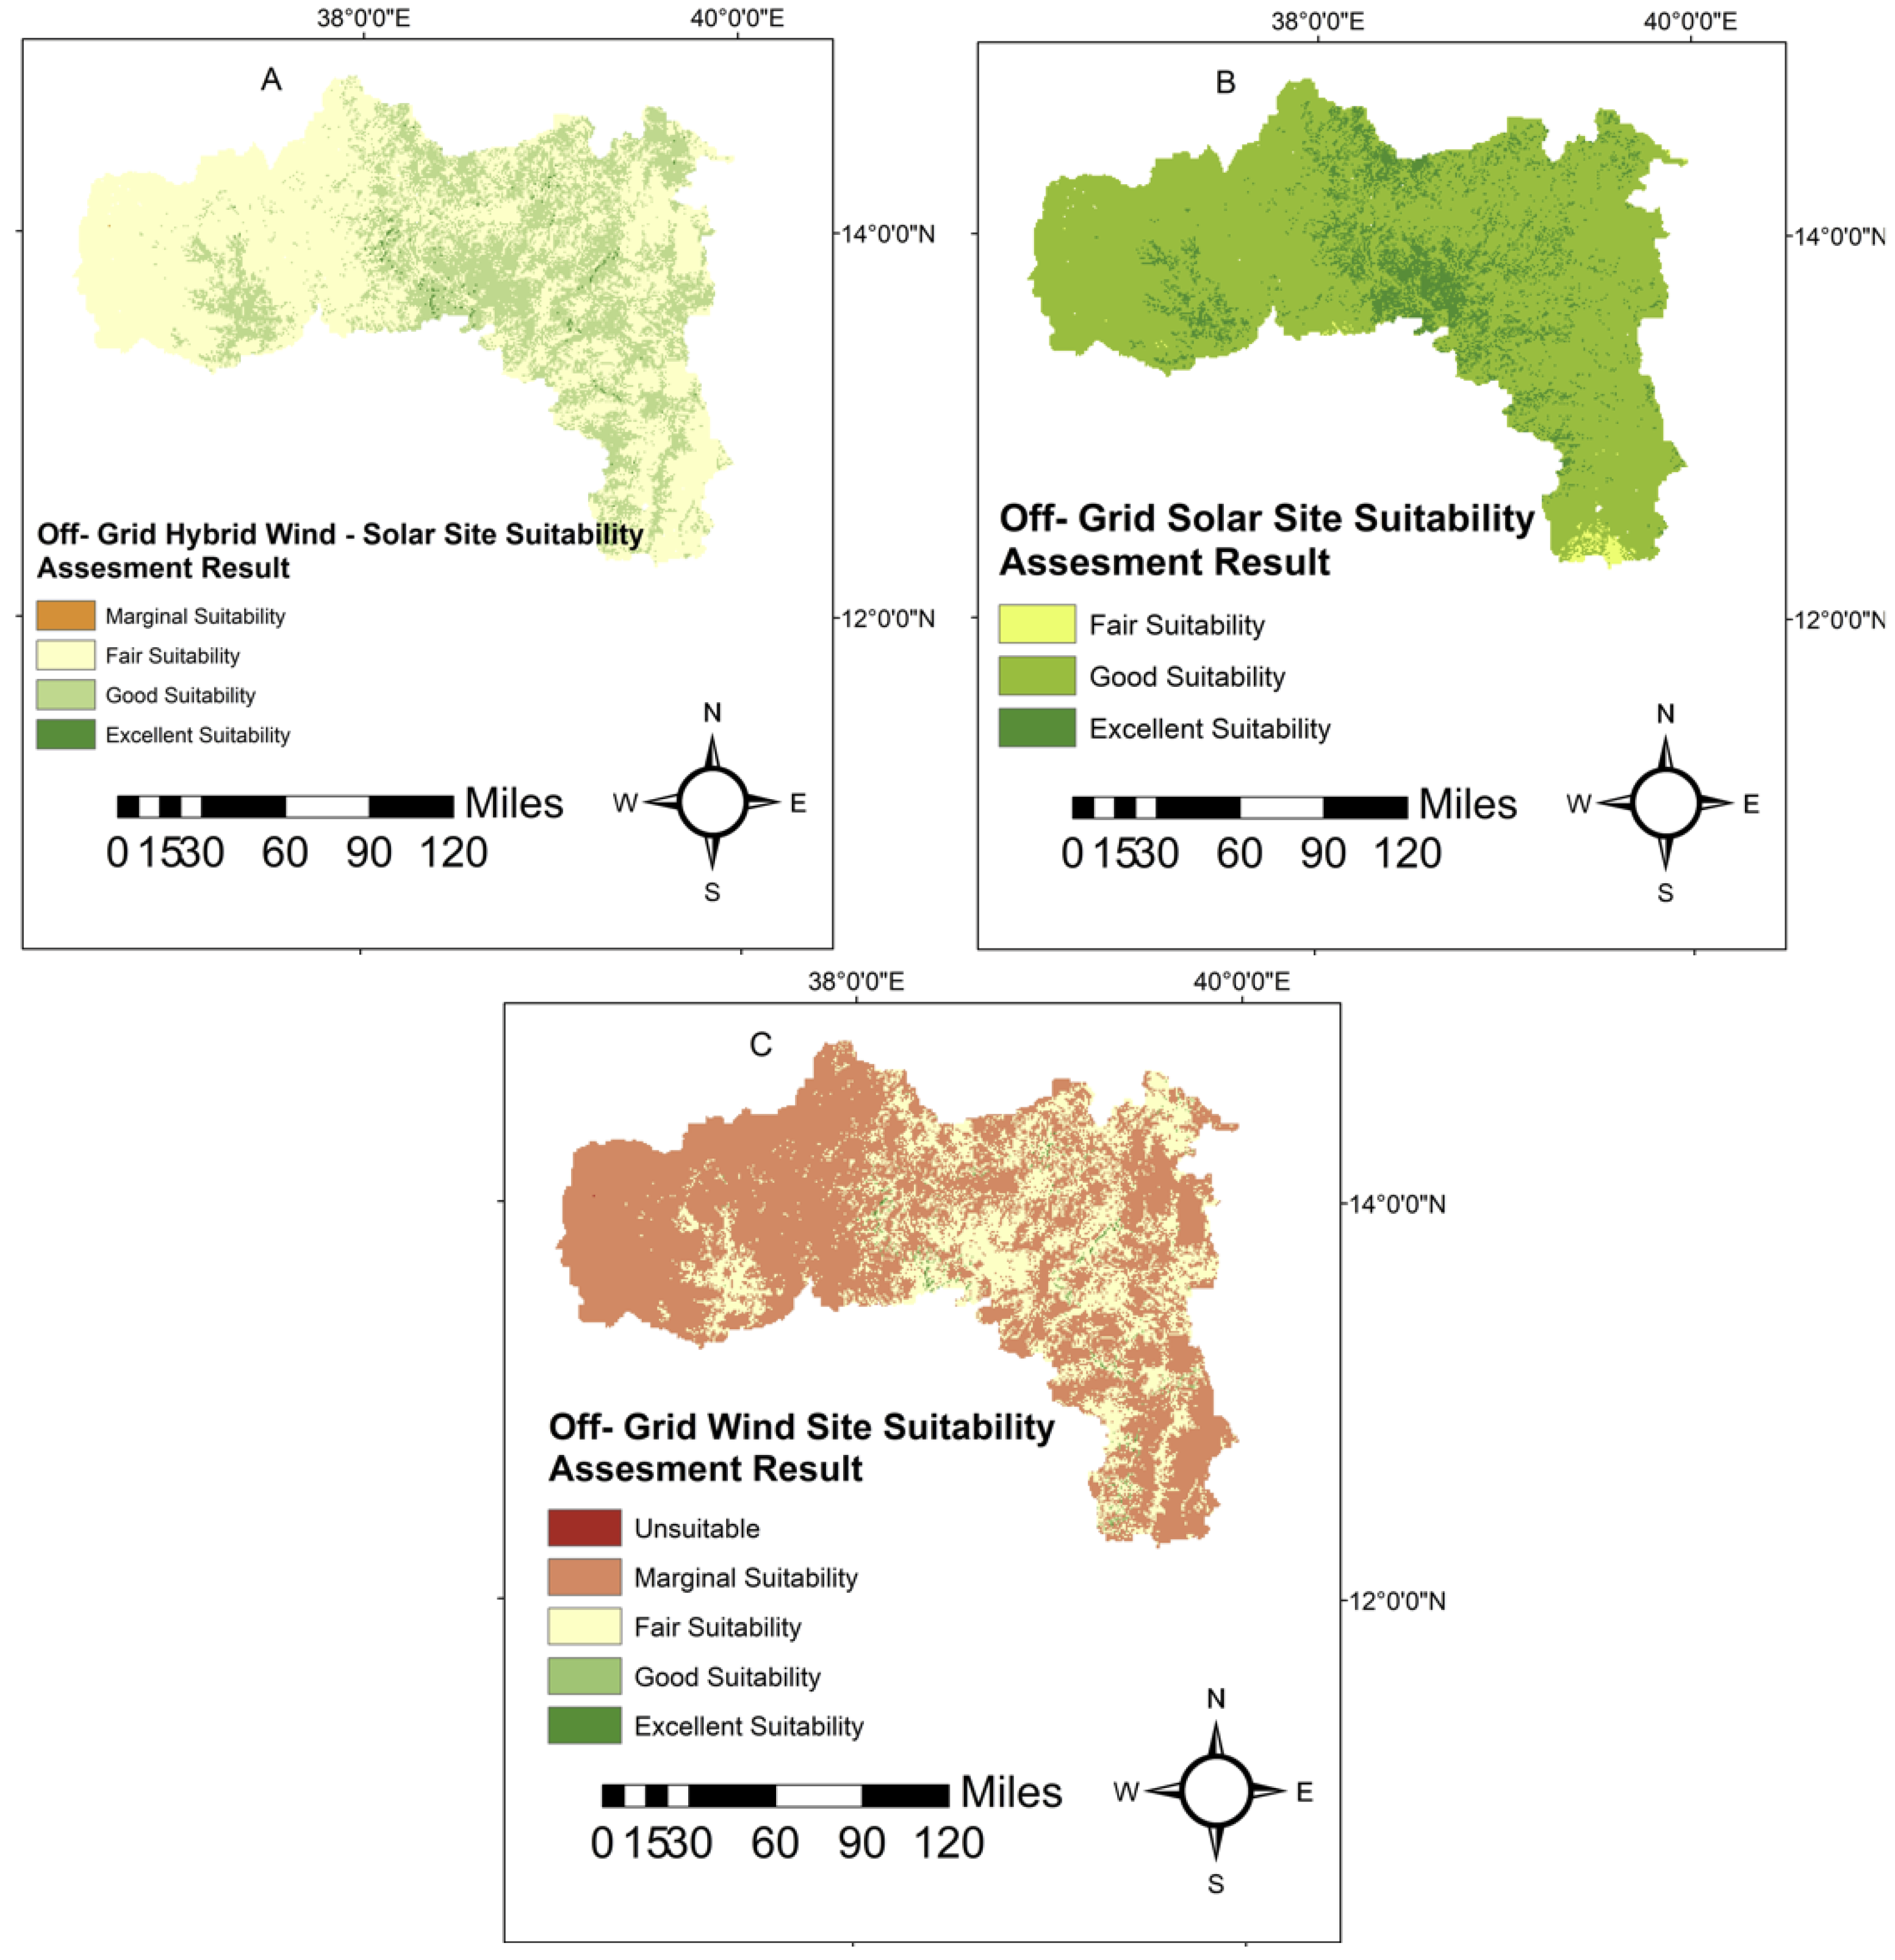
The suitability assessment results for wind and solar power sites intended for off-grid electrification in the Tigray region are illustrated in
Figure 8C and
Figure 8B, respectively. The suitability mapping uses a scale from 1 to 5, where 1 indicates unsuitability, 2 reflects marginal suitability, 3 denotes fair suitability, 4 represents good suitability, and 5 signifies excellent suitability. The assessments for off-grid wind and solar power generation are based on the datasets presented in
Figure 3, up to
Figure 5. The wind site suitability assessment reveals a gradient of suitability from highly suitable to unsuitable, while the solar power site suitability assessment indicates suitability ranging from highly suitable to marginal. Further specifics regarding the area associated with each suitability category can be referenced in
Table 8 and
Table 9.
For off-grid wind power generation, a total area of 76 km
2 is identified as excellent, as the raster shown in
Figure 8C shows. In contrast, a total area of 6469 km
2 is recognised as excellent for off-grid solar power generation, with the results provided in
Figure 8B.
The wind speed map derived from the Global Wind Atlas, classified according to the IEC wind speed class, indicates that an area of 773 km2 within the Tigray region is categorized as highly suitable for wind energy generation. Conversely, the Global Solar Atlas, through its reclassification of global horizontal irradiance, identifies an area of 50,163 km2 as highly suitable for solar energy applications. The results of the site suitability assessment for off-grid wind and solar power generation in the Tigray region reveal that areas of 76 km2 and 6469 km2 are classified as excellent for off-grid wind and off-grid solar power generation, respectively.
The final map of off-grid hybrid wind-solar power generation is shown in
Figure 8A, resulting from the integration of off-grid wind and off-grid solar raster using the Spatial Analyst weighted overlay tool, which is based on an Equal weight of 50% from Off-grid wind and 50% Off-grid solar in ArcMap 10.8. The Weighted Overlay tool computes the suitability score for each pixel by aggregating the reclassified and weighted values derived from the input criteria. In a hybrid wind-solar analysis, the integrated score leverages the advantages of both wind and solar energy resources. The Wind Suitability result (refer to
Table 9) evaluates a location solely based on wind-related factors, including wind speed and density, along with various constraints associated with these parameters. The Solar Suitability result (refer to
Table 10) assesses a location considering solar-related factors such as solar radiation, sunshine duration, and temperature, as well as relevant constraints. By combining the wind and solar suitability maps to produce the hybrid map (refer to results in
Table 11), the resultant pixel scores provide a comprehensive reflection of the potential offered by both energy resources. A site that may receive a rating of “Fair” or “Good” for wind, but “Excellent” for solar, is likely to attain a superior overall score in the hybrid model compared to its assessment within the wind-only model. Hence, an area of 177 km
2 is designated as excellent for off-grid hybrid wind-solar power systems, as can be seen in
Table 11. The assessment also identifies areas of good suitability measuring 447, 44,128, and 16,695 km
2 for off-grid wind, off-grid solar, and off-grid hybrid wind-solar power, respectively.
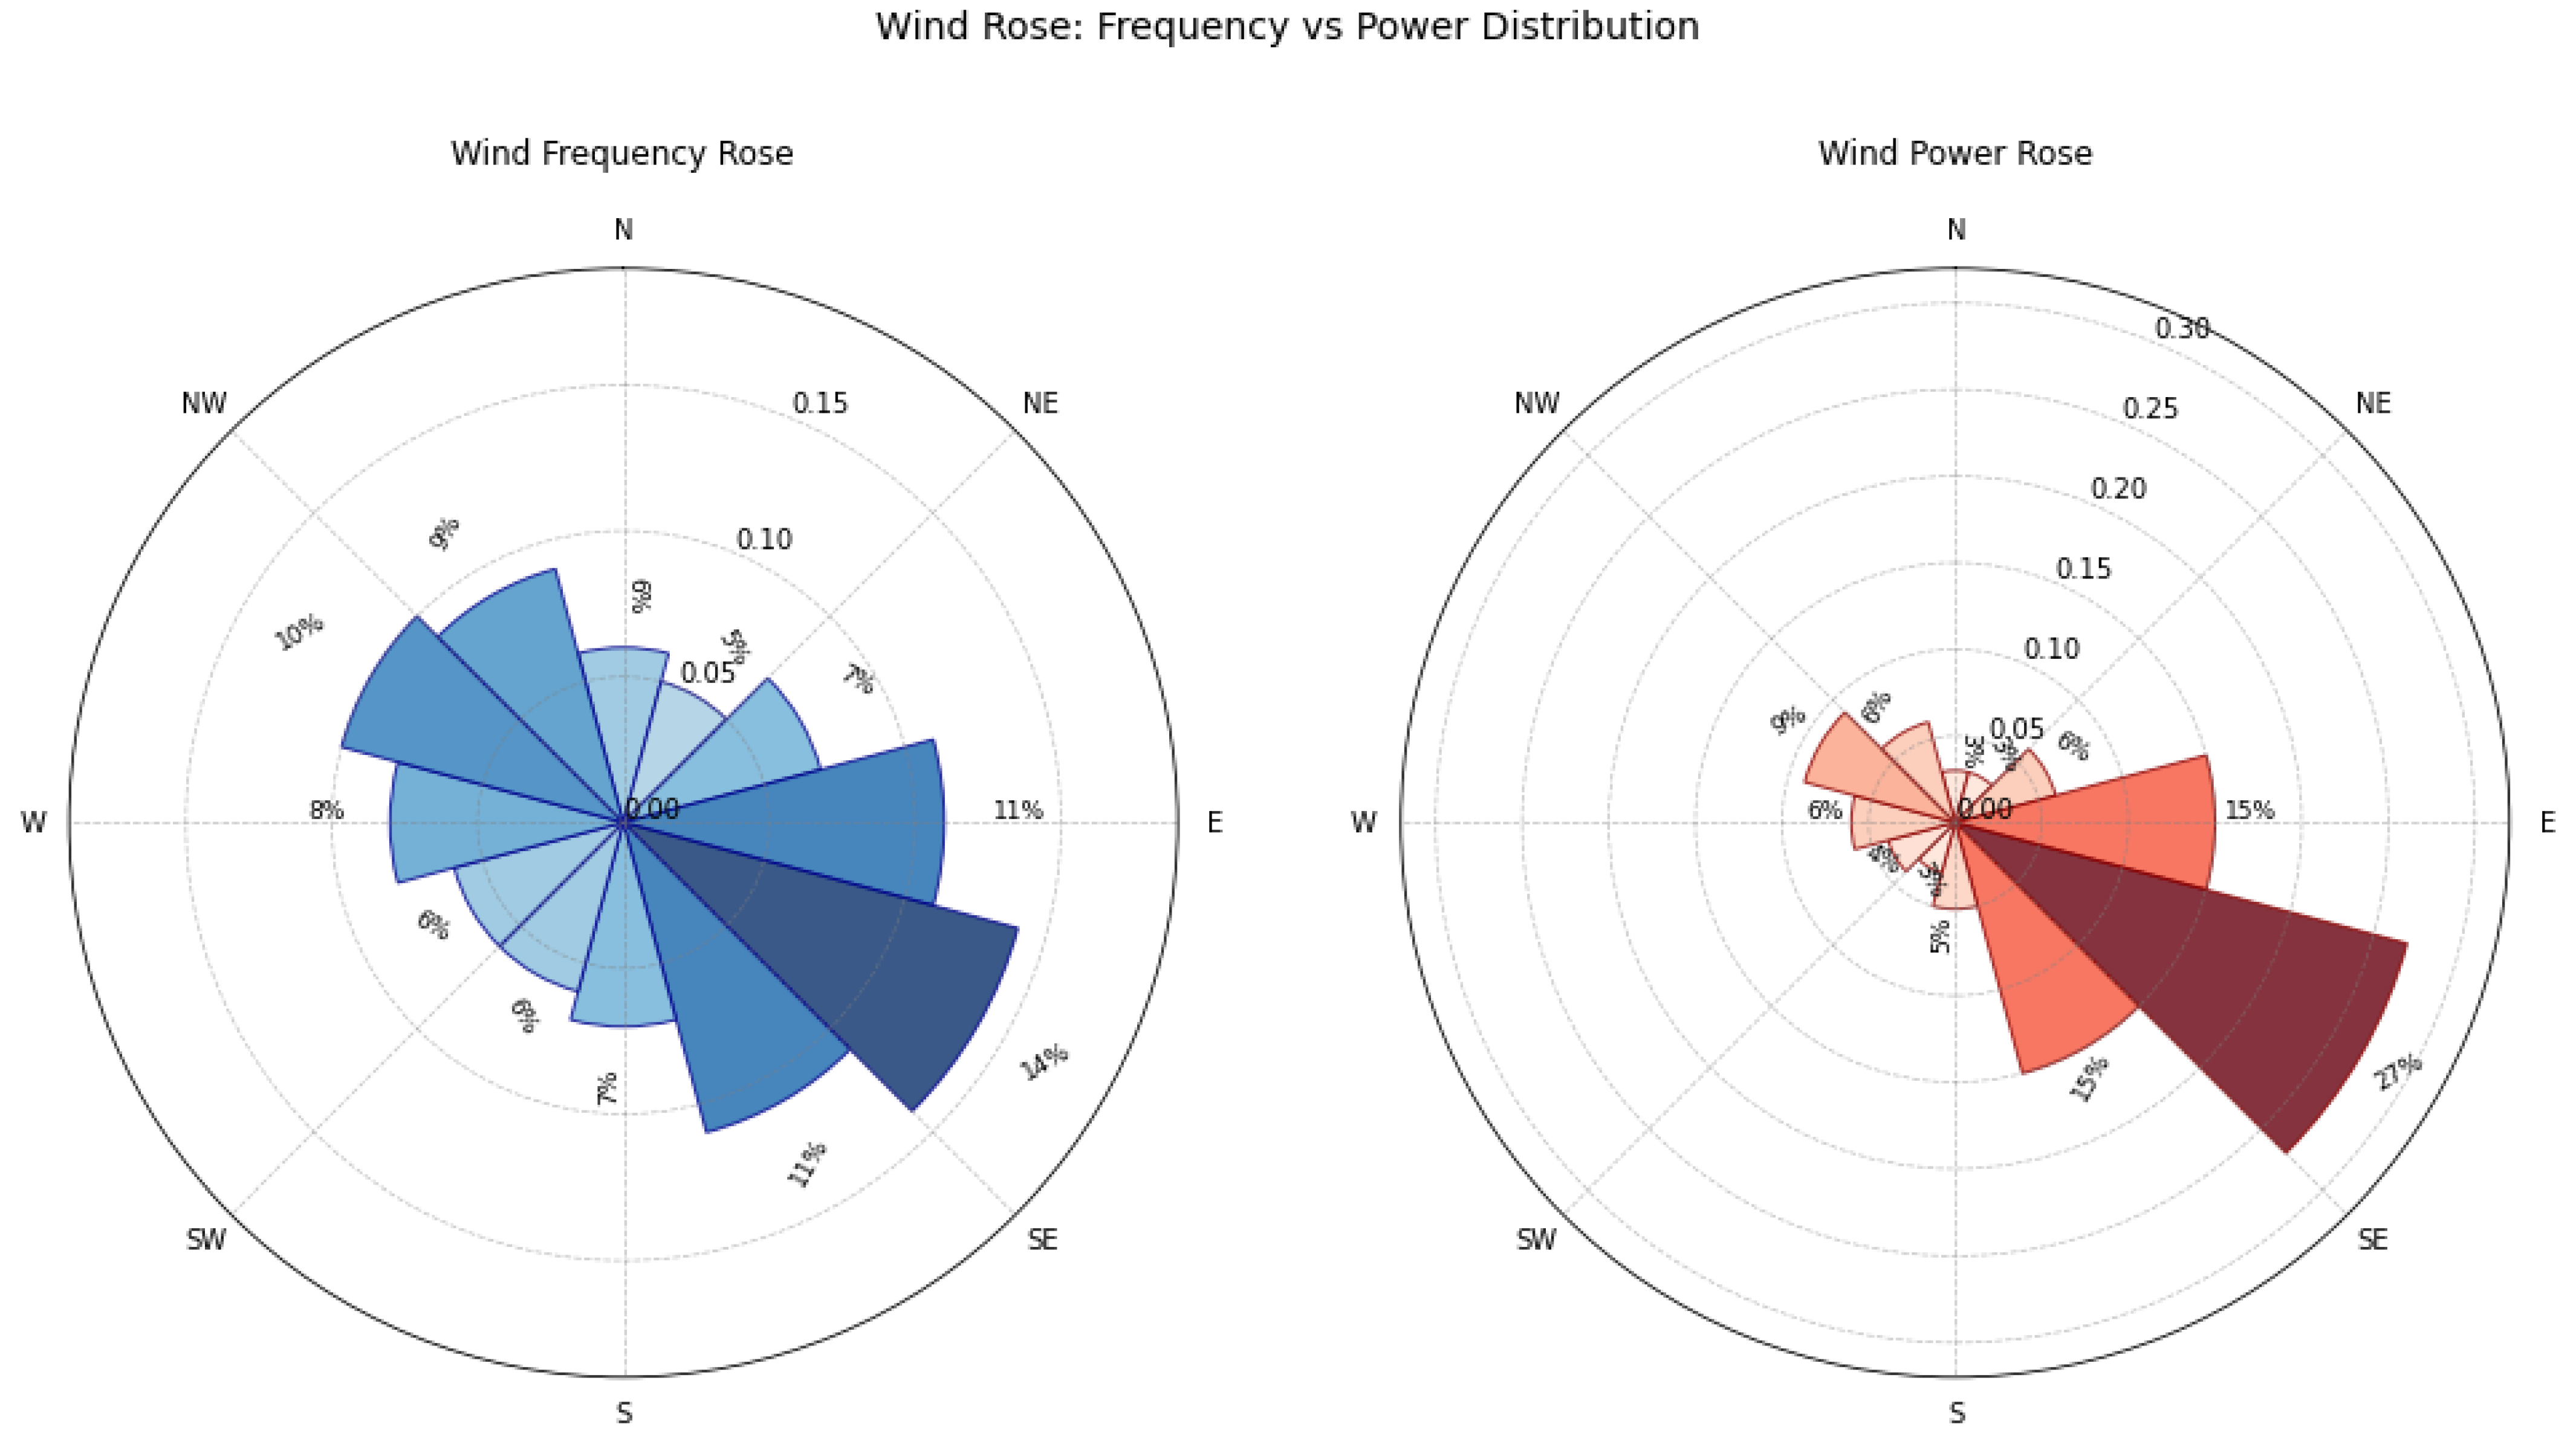
Wind Rose Analysis
Wind roses serve as a crucial element in the selection of wind turbines and the design of wind farms [
57].In light of the comprehensive analysis conducted for the site selection of hybrid wind-solar power systems aimed at rural electrification, gaining further insights into the prevailing wind resource direction is advantageous. This information is particularly valuable for researchers who plan to be engaged in the feasibility studies of specific sites and the implementation processes involved. The data is from the Global Wind Atlas [
29] and is presented in
Figure 9.
The regional wind rose analysis presents significant directional patterns pertinent to wind energy applications, with East-Southeast (ESE, 120°) identified as the predominant wind direction, occurring at a frequency of 14%. This is closely followed by East (E, 90°) at 11%, suggesting that these sectors present the highest potential for energy generation through turbine placement. Additionally, the contributions from West-Northwest (WNW, 300°) at 10% and West (W, 270°) at 8% indicate a bi-directional wind regime. Conversely, the minimal activity observed from North (0°) and South (180°), each at 6%, illustrates their limited contribution to energy production. For optimal energy development, it is recommended that wind turbines be oriented primarily towards the ESE (112.5°), where the wind efficiency maximizes, yielding a power contribution ratio of 1.93 times per frequency unit. Secondary alignment for turbine rows should consider the East (90°) and Southeast (135°) orientations. In assessing wind resources, the pronounced prevalence of ESE, in conjunction with elevated wind power contribution within these directions, establishes this sector as optimal for turbine positioning aimed at maximizing annual energy production (AEP).
4.3. Results of Monte Carlo Simulation
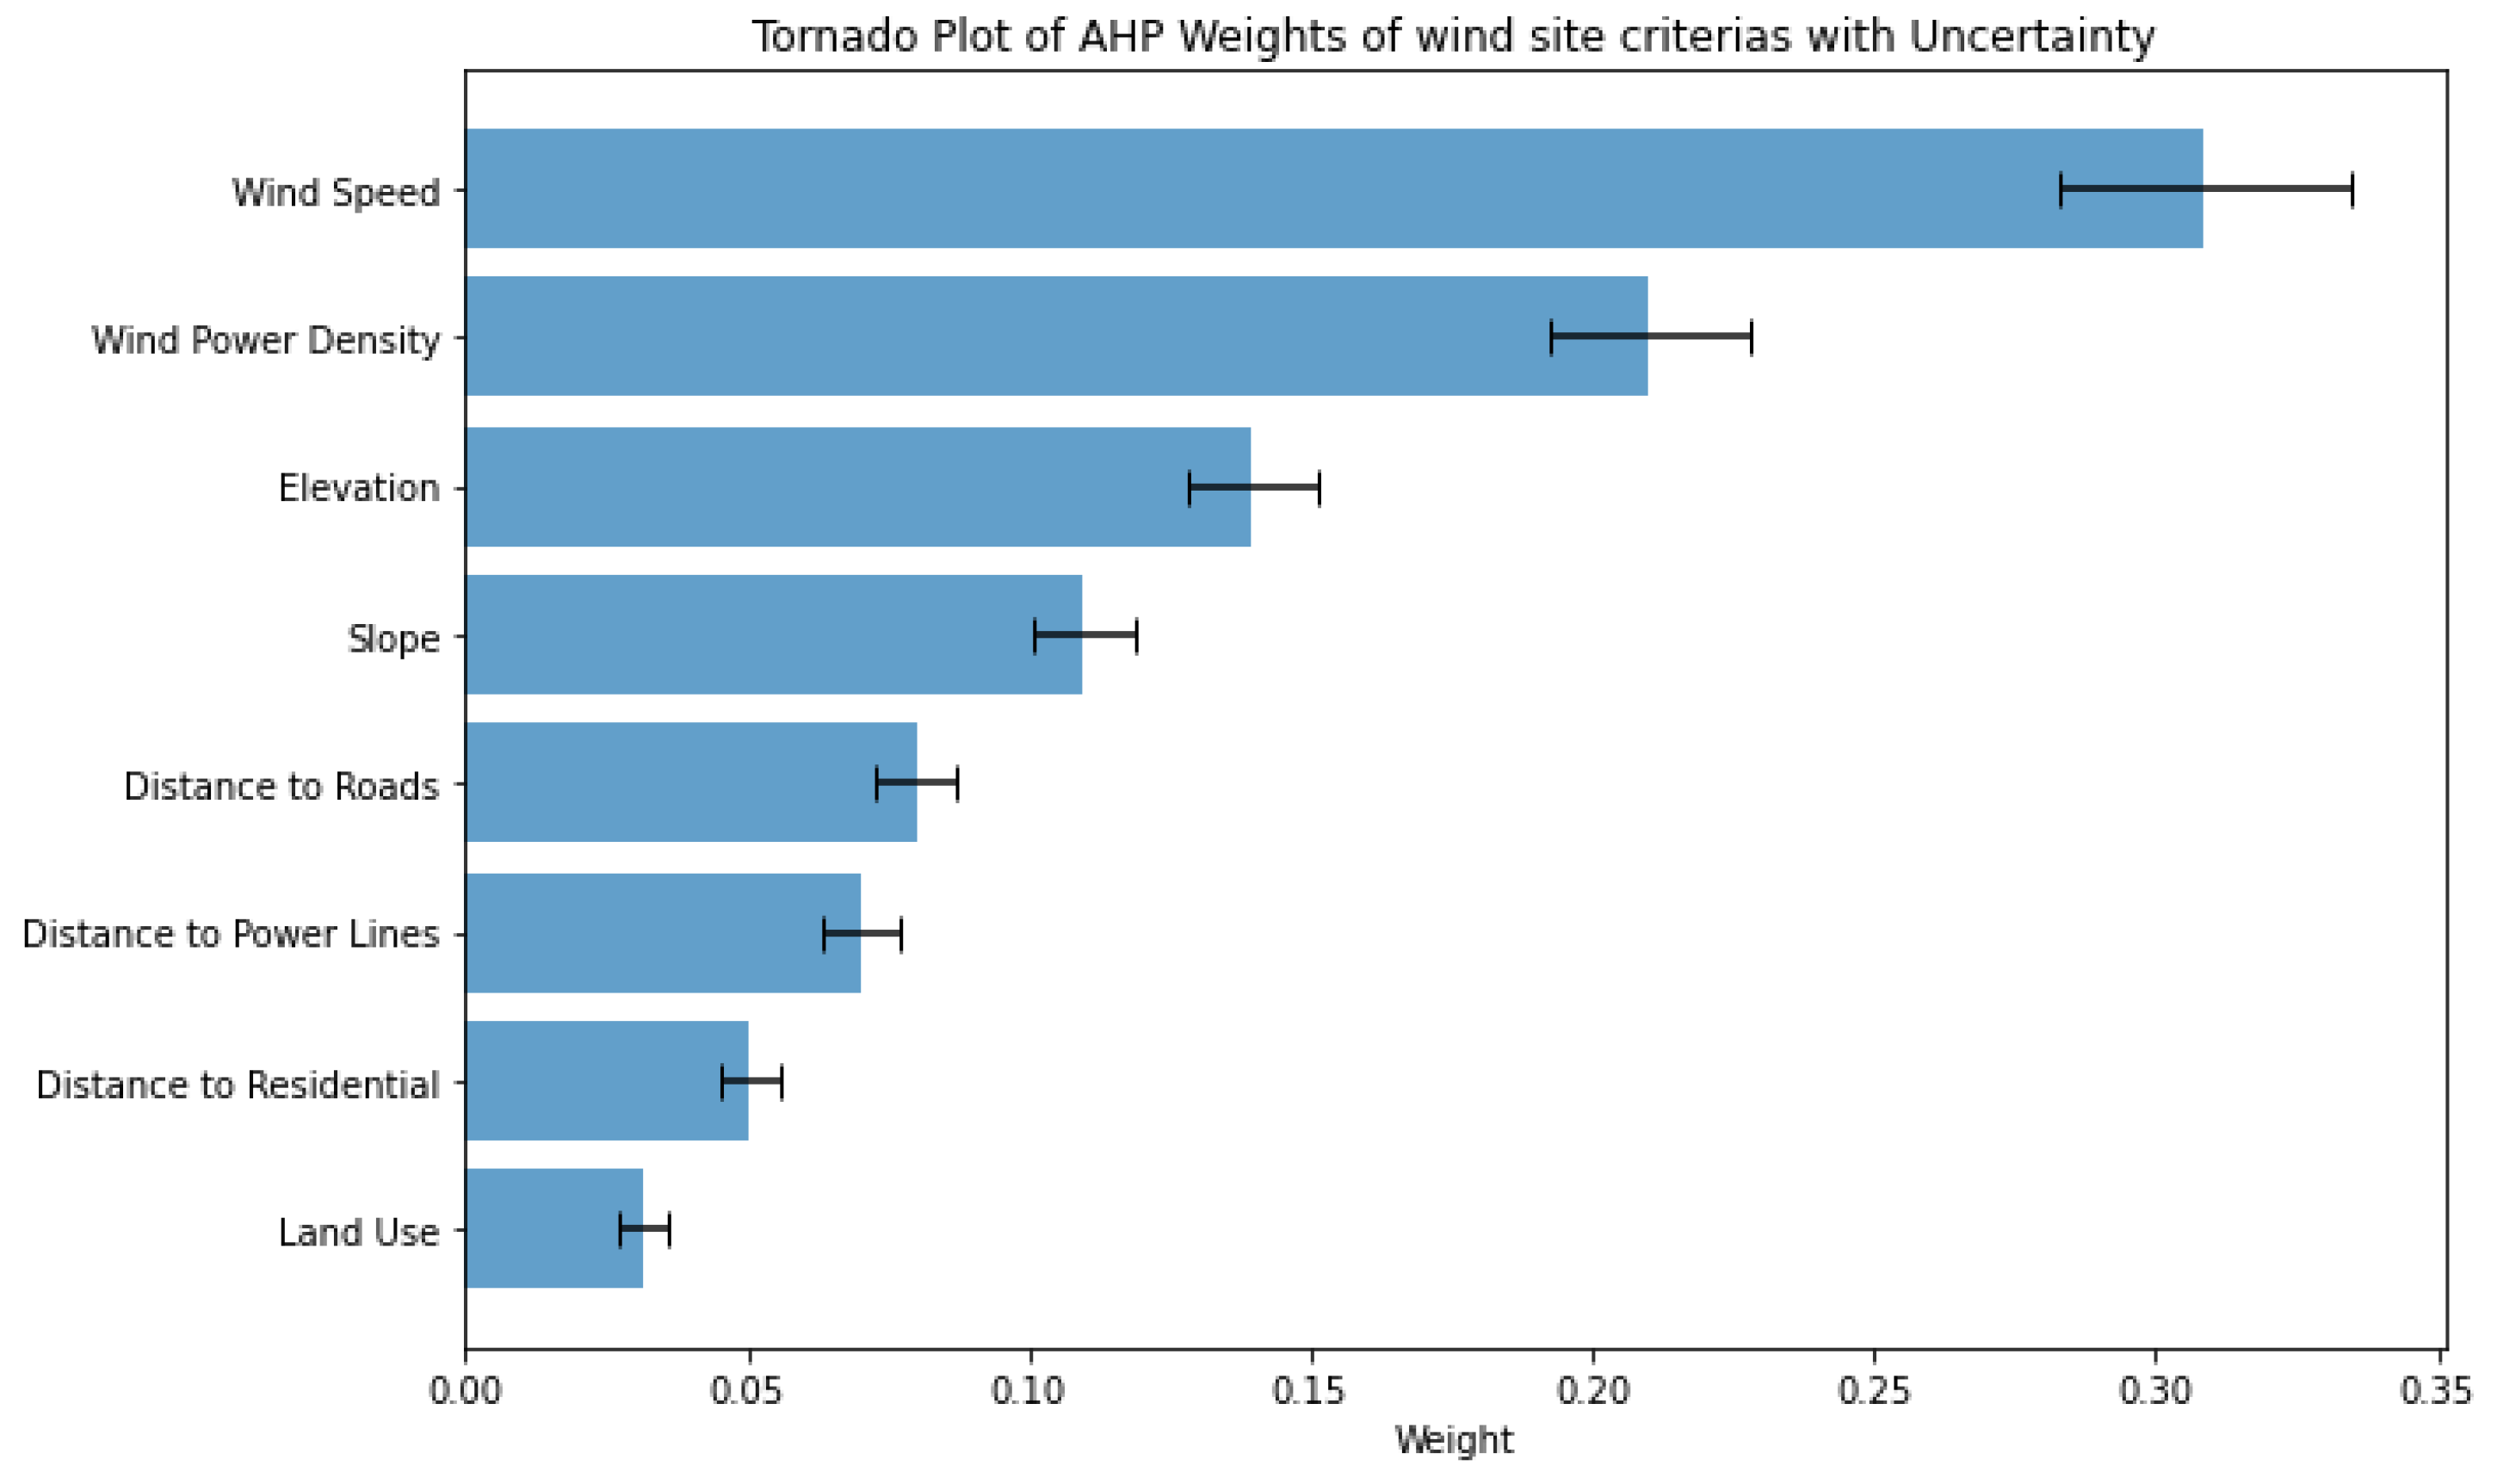
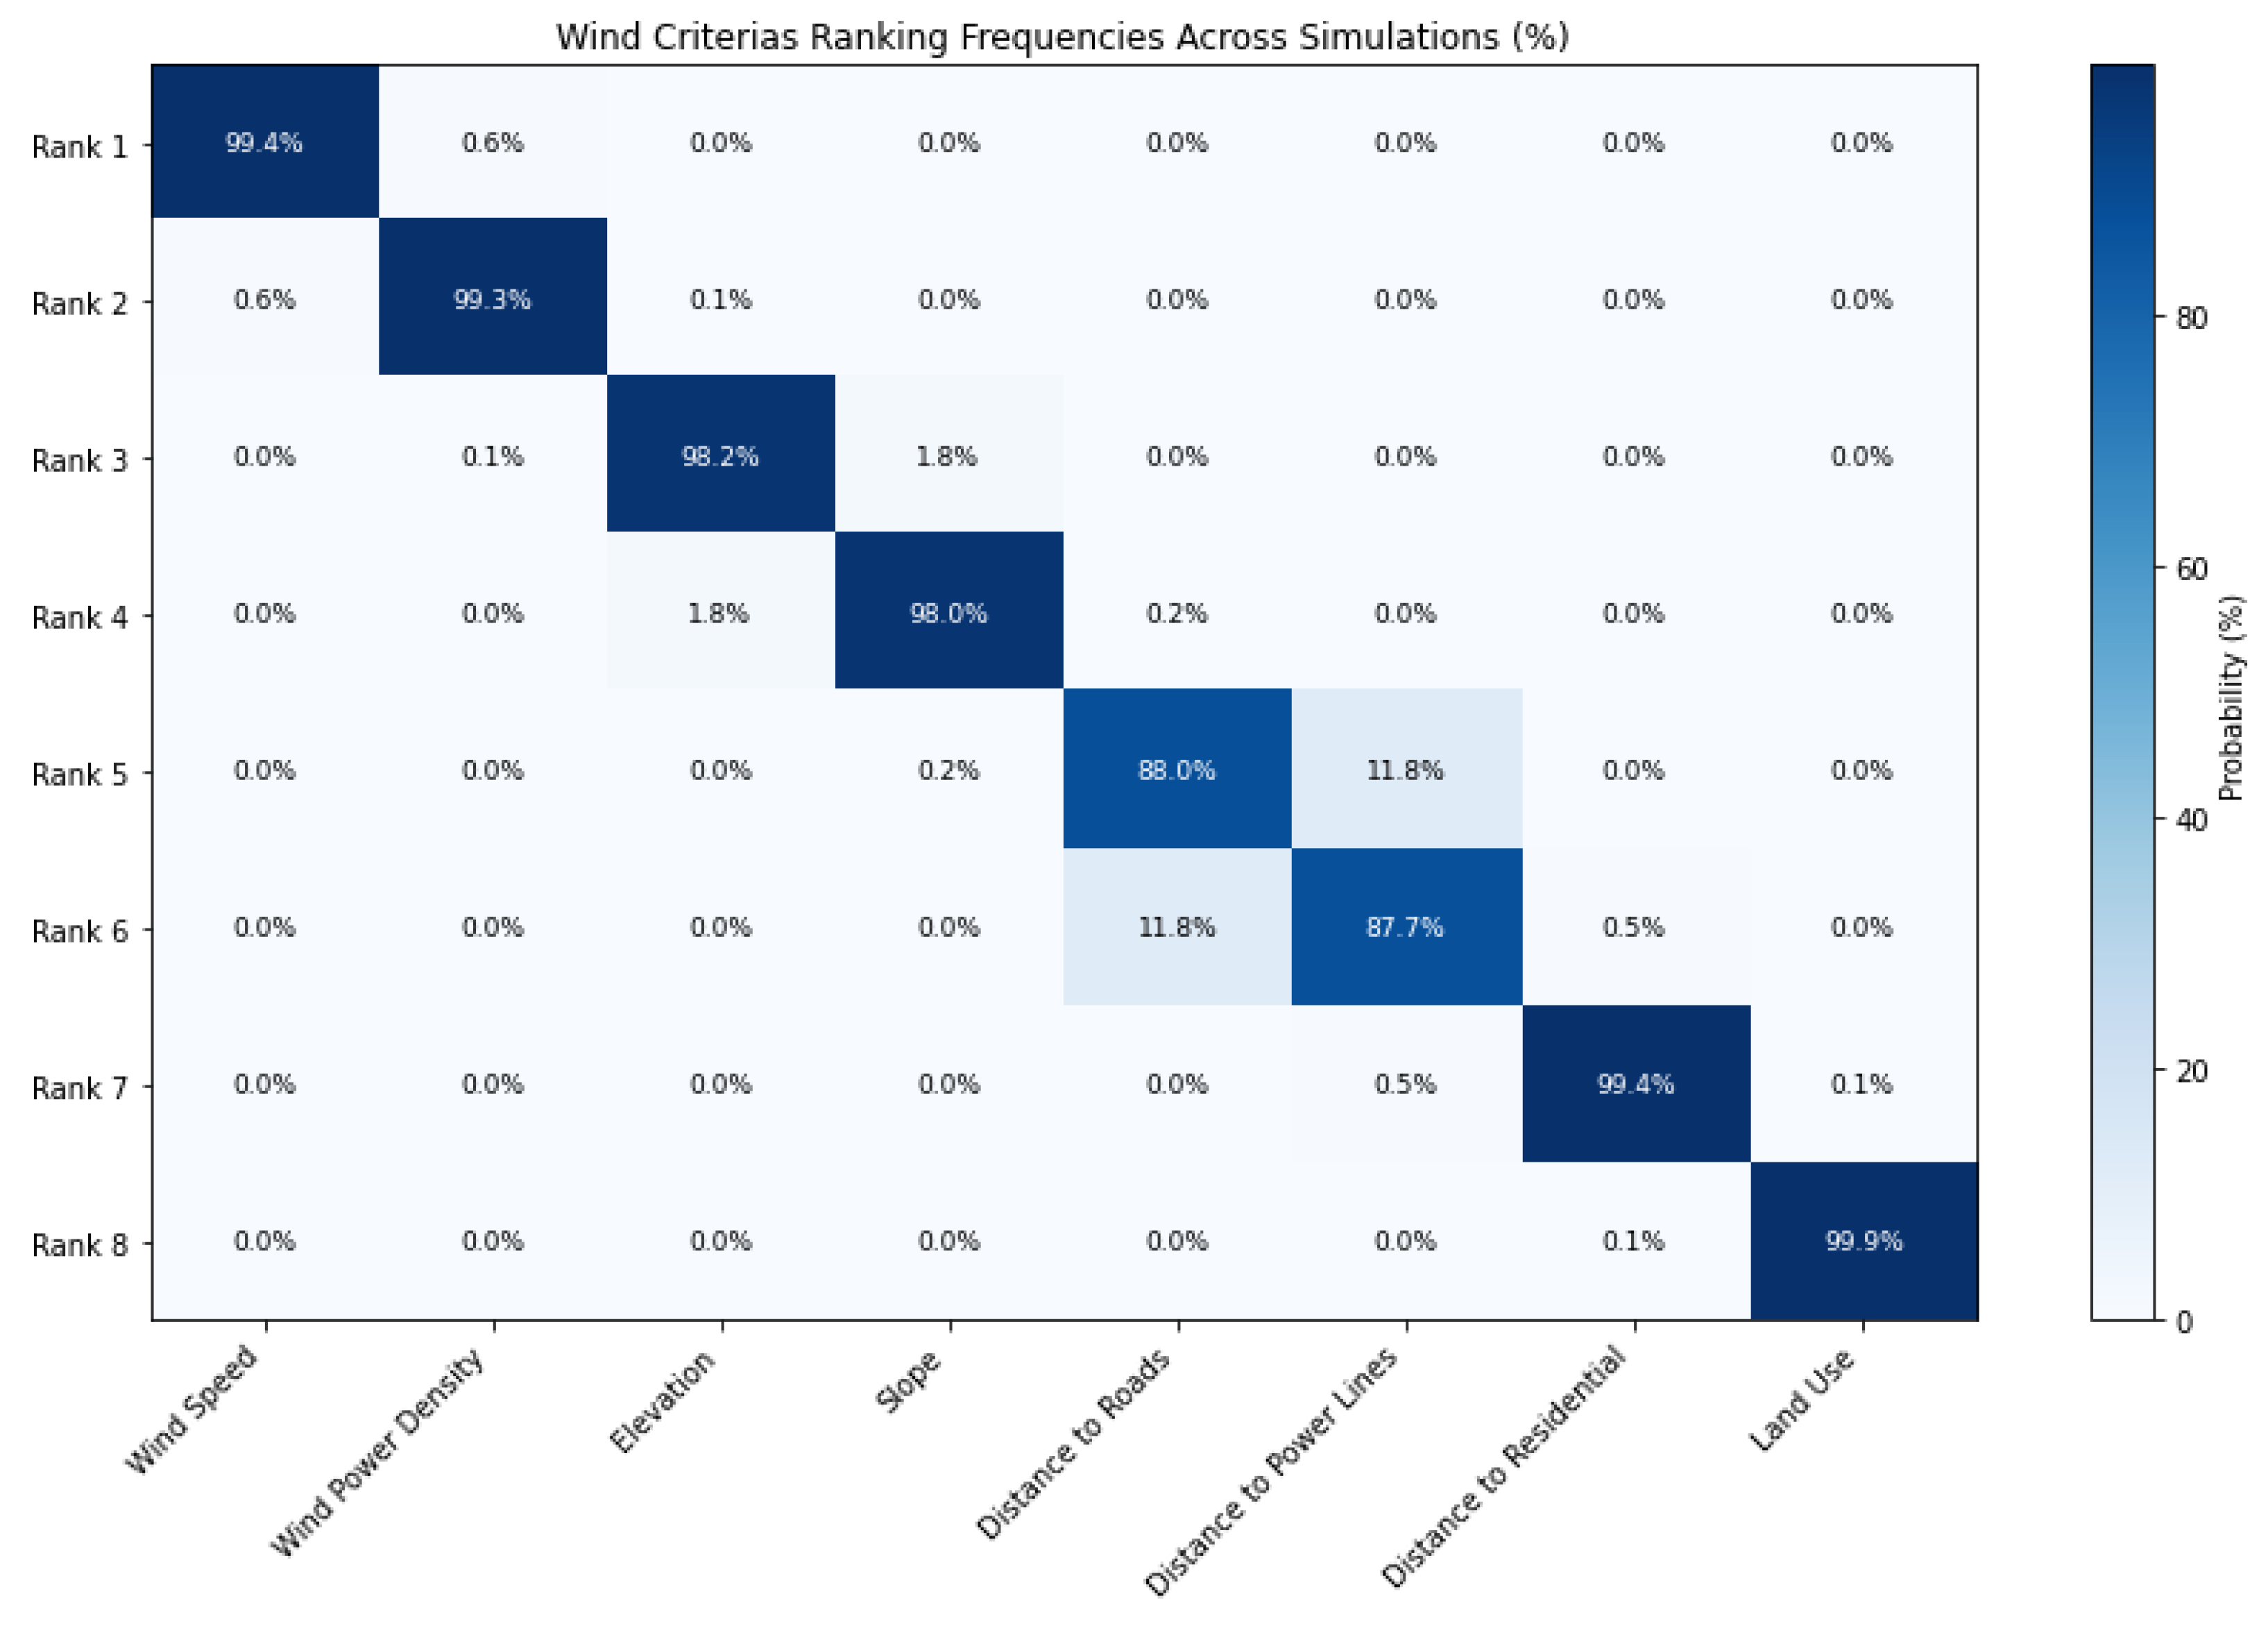
The Monte Carlo Simulation that has been conducted for sensitivity analysis in the weight and rank of the solar and wind factors yields results provided from
Figure 10,
Figure 11,
Figure 12 and
Figure 13.
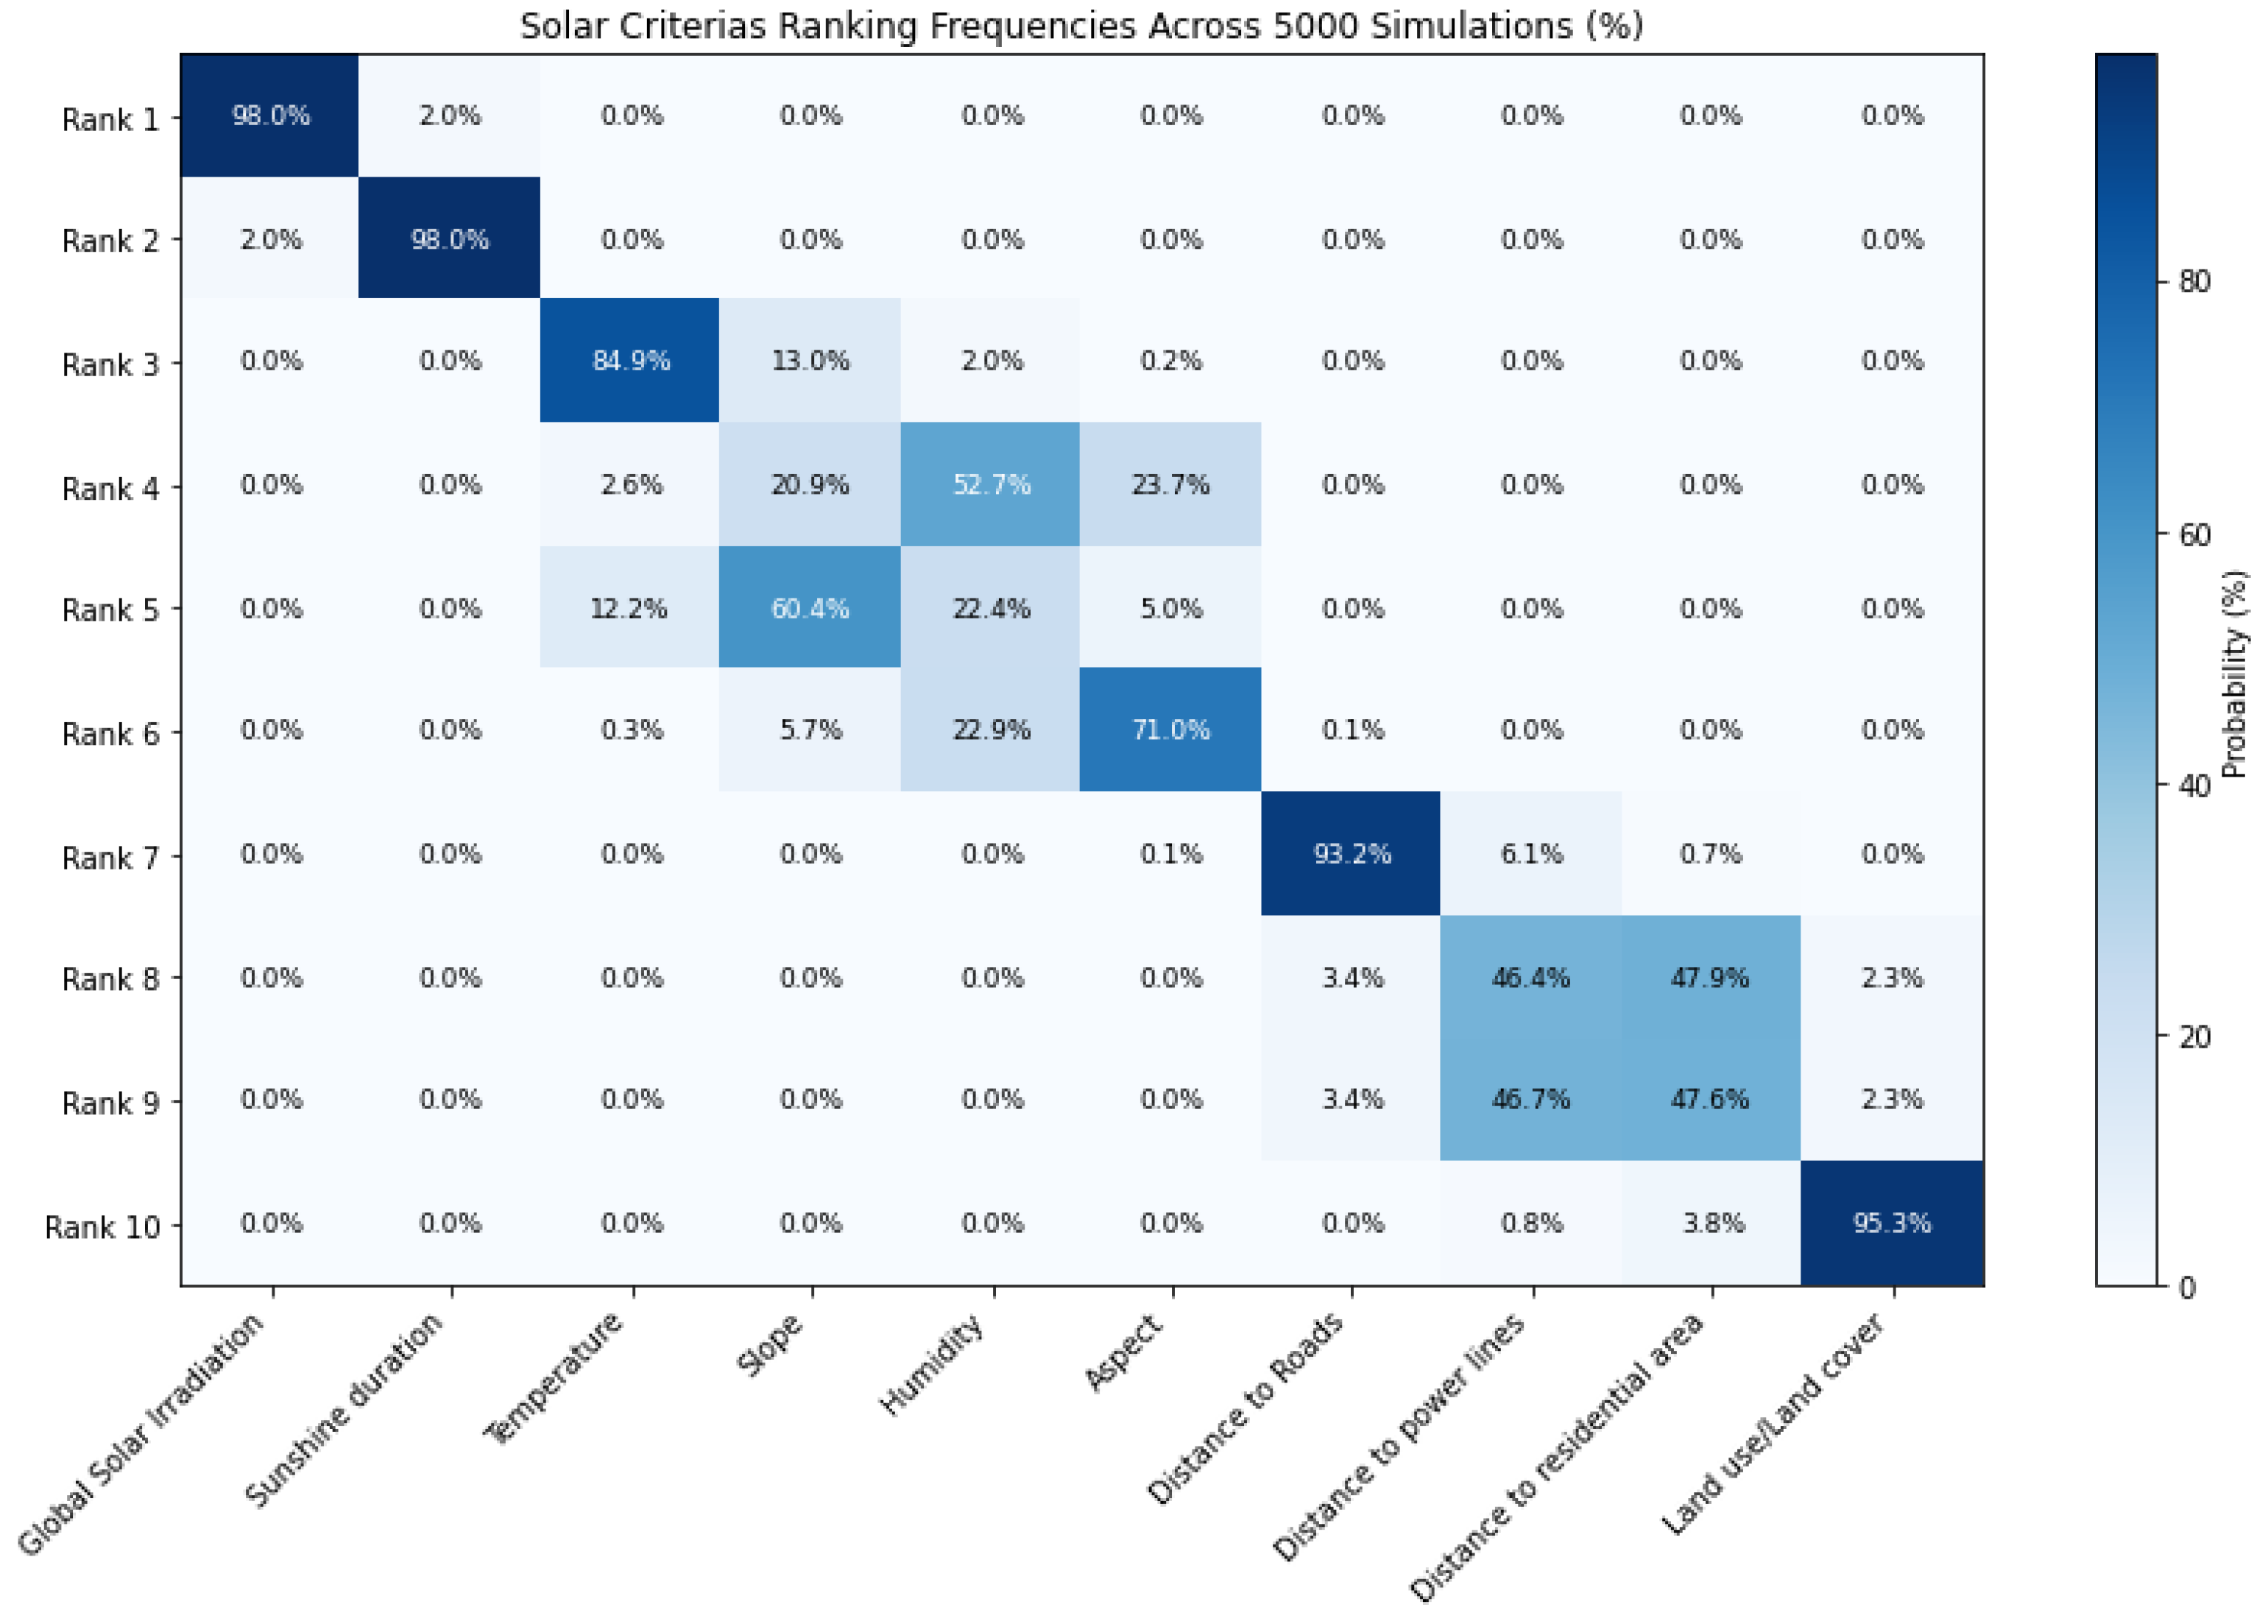
A prominent characteristic observed in the data is the pronounced diagonal alignment of dark blue cells. This pattern indicates that, across the majority of criteria, there exists a substantial probability (approaching 100% in many instances), as can be seen in
Figure 11, that these criteria will consistently attain a specific rank throughout the simulations. Such findings imply a high level of stability and reliability in the rankings for the outlined criteria. The Wind Speed achieves a 99.4% frequency of being ranked as the foremost criterion. This is intuitively sound, as wind speed is a crucial factor in wind resource assessment. The criterion Wind Power Density is similarly ranked second with a frequency of 99.3%. This is rational, given that wind power density directly derives from wind speed and serves as a vital metric for assessing energy generation potential. Wind Speed, ranked first, has only a 0.6% likelihood of being ranked second, and virtually no chance of falling to a lower rank. This finding suggests that the simulation results are not overly sensitive to minor fluctuations in input parameters for the majority of criteria. In conclusion, this Monte Carlo simulation plot effectively illustrates the robustness of rankings. The rankings for most criteria exhibit a high degree of stability and resilience across numerous simulation iterations. A distinct hierarchy is evident among the wind-related criteria, with Wind Speed and Wind Power Density consistently identified as the most critical, while Land Use ranks as the least significant.
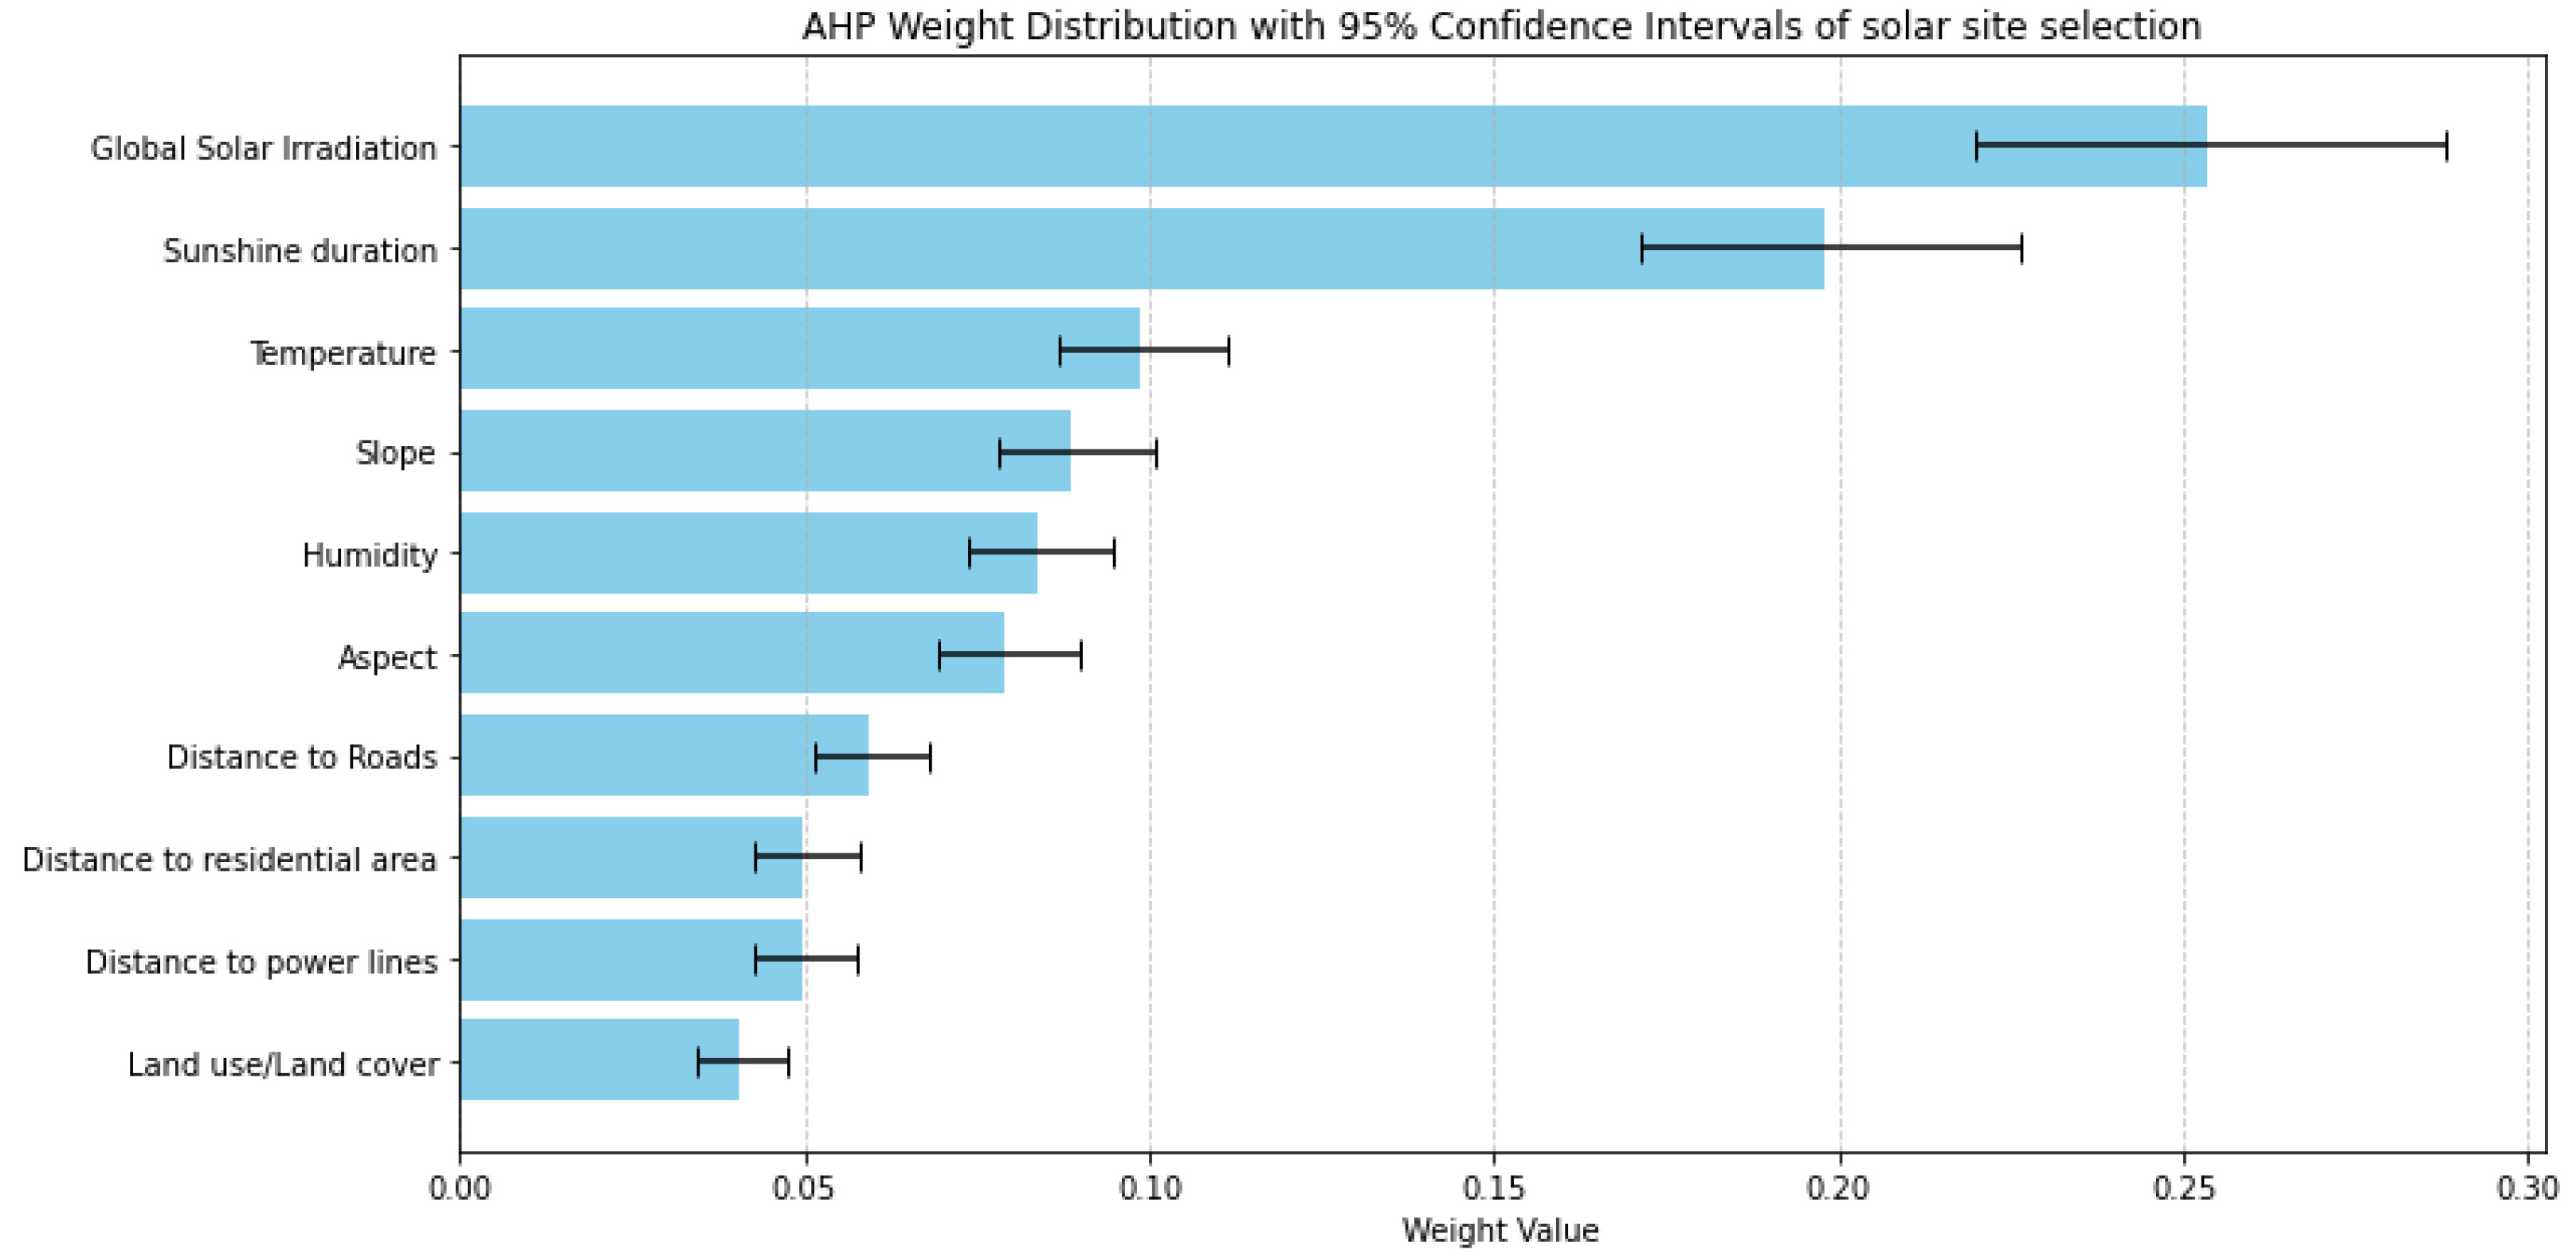
This AHP weight distribution graph for solar criteria Monte Carlo simulation, as shown in
Figure 12, clearly prioritizes solar resource availability (Global Solar Irradiation and Sunshine Duration) as the most critical factors for solar power plant siting. Environmental and topographic features (Temperature, Slope, Humidity, Aspect) form the next category of importance, with some overlap indicating similar influence. Finally, infrastructure and land use constraints are consistently deemed the least critical factors, although still considered in the overall decision-making process. The confidence intervals provide a valuable insight into the robustness and variability of these assigned weights, highlighting areas where criteria have clearly distinct importance versus those where their influence is more similar.
The methodology used for assessing solar site suitability exhibits a high level of rigor in reliably determining the significance of various criteria. The implementation of the Monte Carlo simulation, which reveals robust diagonal dominance for the extreme rankings, further substantiates the reliability of these classifications. The method demonstrates small sensitivity in the intermediate criteria, particularly regarding environmental and topographic elements such as Temperature, Humidity, Slope, and Aspect. The overlapping confidence intervals observed in the AHP weights, alongside the significant off-diagonal frequencies presented in the ranking, indicate a closely balanced relative importance among them, which is similar to the original judgement by the experts. Consequently, minor alterations in input data or expert judgments accounted for by the Monte Carlo simulation can result in slight adjustments to their specific ranking positions.
4.4. Results of Economic Analysis
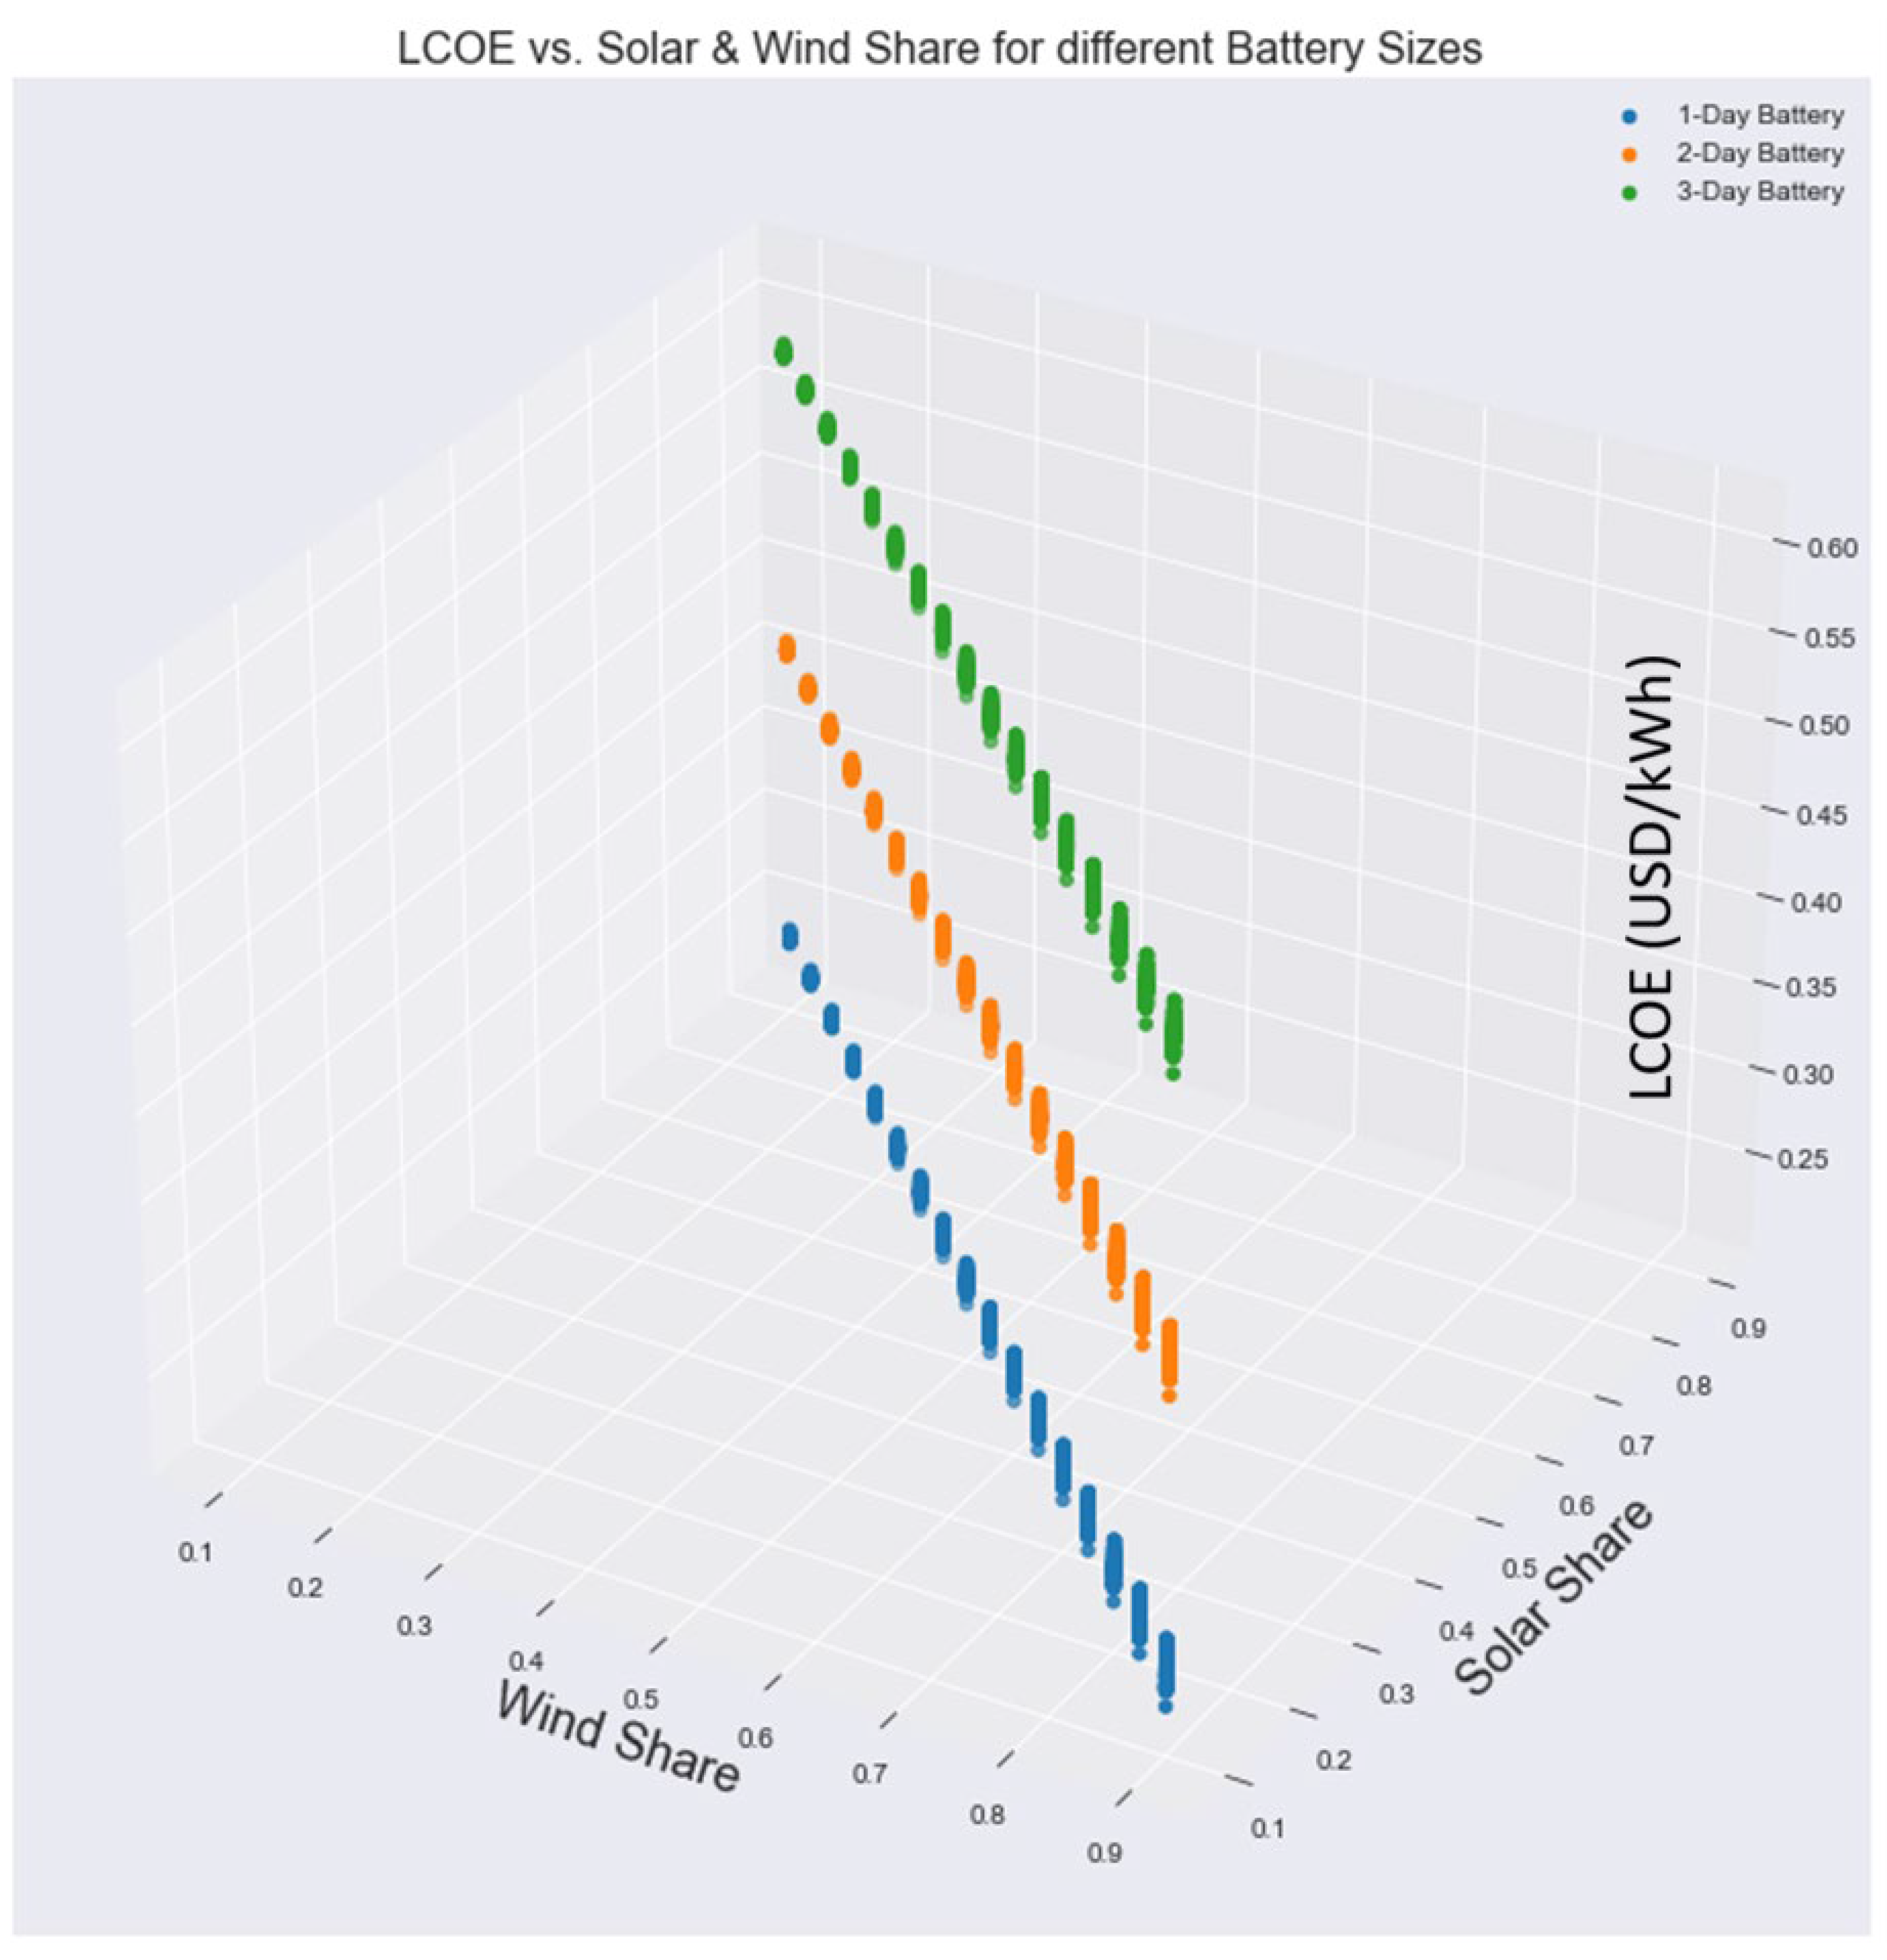
This economic analysis of the study area with the identified sites of mapping as highly suitable areas is performed to quantify the levelised Cost of Energy (LCOE) for various days of battery autonomy and Wind-Solar share. The inputs used for the analysis are capital, operational, and replacement costs of system components, Global Horizontal Irradiance (GHI), and wind speed, estimating energy demand from population density, as well as per capita consumption sizing and battery storage days. Using these inputs and utilizing the Python environment, the levelised cost of energy for different scenarios has been identified.
According to
Figure 14, the minimum cost achieved is
$0.23 per kWh with a battery storage size enough for a single day and
$0.58 per kWh for three days of battery storage. While the graph shows the bottom of the 1-Day Battery cluster clearly indicating that this configuration is the most economically viable, for a better reliability of off-grid hybrid systems, the objective is to minimize the cost, given that the reliability of the power supply is achieved. So there is a trade-off between LCOE, wind-solar share, and number of autonomy days.
The sensitivity analysis shown in
Figure 15 shows that the economic viability of off- grid hybrid solar–wind–battery systems is influenced by financial and storage-related factors more than generation costs. The discount rate emerges as the dominant risk driver, with even small increases substantially inflating the LCOE, underscoring the critical importance of securing low-cost financing for project feasibility. Battery CAPEX is the most influential technological factor, confirming that storage represents a significant share of total system costs and that future reductions in battery prices could significantly enhance affordability, while cost escalations could undermine viability. In contrast, PV and wind CAPEX exhibit lower sensitivity, suggesting resilience against market volatility in generation technologies and enabling more stable long-term investment planning. Overall, the findings highlight that project success depends on favourable financing conditions and affordable battery solutions, while solar and wind assets provide a relatively stable cost base, making storage and financial structuring the main factors for improving hybrid system competitiveness in rural electrification.
5. Conclusions
With the increasing demand for electrical energy and renewable energy being the main focus and solution for the future, wind and solar power have great potential to minimise energy deficiencies and provide clean sources of energy. Wind and solar technologies are mature, and previous resource assessments have shown significant potential for these renewable energy sources. A hybrid wind-solar power system can play a crucial role in increasing energy access for rural areas. This research aims to provide a suitability assessment map for rural electrification using off-grid hybrid wind-solar power, utilizing data from national and international sources. To do that, a Geographic Information System (GIS), together with an Analytic Hierarchy Process of the multi-criteria decision-making process and Monte Carlo simulation, was used. The data involved in the assessment fall mainly into three categories of data: Climate, Topography, and Infrastructure. The prioritization of these criteria is based on the Analytic Hierarchy Process’s pairwise comparison of criteria by thirteen experts from five organizations, selected based on their expertise and experience within the energy sector. These experts are engaged in various aspects of renewable energy, including research, feasibility studies, planning, installation, operation, and maintenance of wind and solar power systems. The expert assessment utilizing a pairwise comparison matrix identifies wind speed and wind power density as the highest-ranked factors in the selection of wind power sites. Conversely, Global Horizontal Irradiance and sunshine hours emerge as the leading criteria for solar power site selection. Following the determination of ranks and weights for each criterion within the solar and wind power site selection, a sensitivity analysis is executed through Monte Carlo simulation. This approach addresses the uncertainties inherent in the individual evaluations provided by the experts, thereby reinforcing the validity of the established ranking. Central to this analysis, the Monte Carlo Simulation conducts 5000 iterations. The sensitivity analysis employs a log-normal distribution to perturb the original judgments, effectively simulating the potential impact of judgment uncertainty on the resulting outputs. Based on this simulation, Wind Speed achieves 99.4% frequency of being ranked as the foremost criterion, and Wind Power Density is similarly ranked second with a frequency of 99.3%.
The Monte Carlo simulation for solar criteria underscores the significance of solar resource availability, specifically Global Solar Irradiation and Sunshine Duration. These metrics consistently rank as the most influential factors, achieving a remarkable 98% frequency of being positioned first and second. The sensitivity analysis further validates the original assessments made by the experts, confirming their consistency and stability. To compute the weight of each criterion, the Analytic Hierarchy Process was employed. Subsequently, the weighted overlay tool available in ArcMap 10.8 facilitated the generation of suitability maps by integrating diverse input data from multiple organizations. The input data were meticulously processed into raster format, ensuring uniformity in the geographic coordinate system, specifically utilizing the UTM (Universal Transverse Mercator) Zone 37N. Additionally, all datasets were resampled to a resolution of 1000 by 1000 m while maintaining the same geographic extent. The suitability assessment for the hybrid wind-solar site has been developed utilizing the weighted overlay tool, which equally considers the suitability maps for both off-grid wind and off-grid solar sites.
Based on the data from the Global Wind Atlas and Global Solar Atlas, the reclassification analysis reveals that an area of 773 km2 within the Tigray region is designated as highly suitable for wind energy generation. The wind frequency rose diagram illustrates a clear predominance of easterly wind flows, with the East-Southeast (ESE) direction exhibiting the highest frequency at 14%. This is closely followed by Q2.
The preliminary economic assessment reveals that the Levelized Cost of Energy (LCOE) is influenced by both the autonomy of battery storage and the proportion of wind-to-solar energy generation. The minimum cost of Levelized Cost of Energy is $0.23/kWh with a 1-day battery storage capacity. However, the cost rises to $0.58/kWh with a 3-day battery storage duration. This outcome implies that increasing battery autonomy and wind share leads to the costliness of systems, with the best economic results obtained in the 1-day battery storage segment. Higher storage duration and wind share increase reliability at a higher cost. The sensitivity analysis implies that the discount rate and the cost of batteries, CAPEX, are the key project viability variables, with PV and wind cost, CAPEX, playing lesser significance. Based on the recognition of the wind-solar resource complementarity and feasibility analysis of previous studies for specific locations in the Tigray region, such hybrid systems have been proposed before. This research will pave the way for implementing such systems based on this site suitability assessment result. This will contribute to informed decision-making in using Off-grid hybrid wind-solar power for rural electrification and supporting Ethiopia’s plan for the Sustainable Development Agenda. The limitation of the study is that different resolution datasets were standardized to a 1 km × 1 km resolution, which may not capture micro-level variations in terrain and land use, especially in areas of complex topography. Future studies should focus on integrating higher-resolution meteorological and topographical data, incorporating real-time field measurements, and expanding the analysis to include environmental impact and socio-economic assessments.
