Article

Distributed Hierarchical Control with Cost Optimization and Priority-Based Dispatch for Workplace EV Charging: A Field Study

DTU Wind and Energy Systems, Technical University of Denmark, 4000 Roskilde, Denmark
*
Authors to whom correspondence should be addressed.
Energies 2025, 18(21), 5581; https://doi.org/10.3390/en18215581 (registering DOI)
Submission received: 16 September 2025 / Revised: 15 October 2025 / Accepted: 20 October 2025 / Published: 23 October 2025
(This article belongs to the Special Issue Energy Management and Control System of Electric Vehicles)

Abstract

Electric vehicle (EV) charging presents both a challenge and an opportunity for modern power systems, particularly in workplace environments with grid constraints and dynamic energy pricing. This study presents a real-life implementation and experimental validation of a hierarchical distributed control system for smart EV charging. The proposed architecture combines upper-level receding horizon optimization with lower-level priority-based dispatch, enabling cost-efficient energy allocation and fair distribution among EVs. The system was deployed at the Risø campus of the Technical University of Denmark (DTU) and tested over two days under realistic operational conditions, including heterogeneous EV behavior and limited grid capacity. The control system demonstrated autonomous operation, responsiveness to price signals, and effective coordination between control layers. High energy delivery rates were achieved, nearly 100% on the first test day and close to 90% on the second, despite operating under a constrained energy budget. The study also documents practical challenges encountered during deployment, such as charger communication faults and EV-side issues, and proposes adaptation strategies. These results confirm the feasibility of distributed smart charging in real-world conditions and provide actionable insights for future implementations.

1. Introduction

The rapid adoption of electric vehicles (EVs) presents both challenges and opportunities for power grids [1,2]. On the one hand, uncontrolled EV charging can lead to local grid congestion, voltage drops, and transformer overloading, resulting in premature wear and tear, and consequently, the subsequent need for expensive replacement of network equipment [3,4]. On the other hand, EVs offer significant potential as flexible, controllable loads that can support grid stability, integrate renewable energy, and reduce peak demand [5,6,7]. However, smart charging should not only benefit the grid but also preserve user satisfaction to ensure further EV adoption. This is particularly relevant deployment of smart charging in areas with limited grid capacities and with natural clustering characteristics, such as urban charging stations, parking lots, and workplace facilities, where EVs can be controlled by charging point operators (CPOs) [8,9]. The workplace charging station is the focus of this study.
Smart charging can be implemented through various control architectures, each with distinct trade-offs [10,11]. The majority of studies focused on centralized architecture, where a single unit manages all charging decisions, offering global optimality; however, they often face robustness, privacy issues, and communication and computation bottlenecks [12]. Decentralized approaches, in contrast, allow each charger to act independently, thereby improving robustness and scalability, but often lacking coordination and optimality [13]. Distributed control architectures aim to combine the strengths of both: they introduce a hierarchical structure where a global controller sets high-level objectives, such as cost-driven optimizations, while local agents make real-time decisions based on local conditions and user inputs [14,15]. This hybrid approach has gained attention for its potential to deliver scalable, responsive, and user-aware smart charging solutions; therefore, the distributed architecture is adopted in this study.
A significant gap in current research is the lack of real-life testing of smart charging systems, with distributed architectures being even more rarely validated in field conditions. Most of the studies remain simulation-based or rely on laboratory setups with EV emulators, which cannot fully capture the complexities of real-world EV behavior, such as communication delays, hardware faults, or user unpredictability. In [16], the authors implement a real-time simulation for a distributed control algorithm for smart EV chargers that effectively manages line and transformer congestion. In [17], the authors propose a hybrid EV charging framework combining centralized mixed-integer linear programming (MILP) optimization scheduling with distributed genetic algorithm control, validated entirely through simulation on residential and commercial demand profiles. Amin et al. [18] propose a two-stage hierarchical multi-agent EV charging coordination framework that combines centralized grid optimization in terms of power losses and voltage deviations with distributed user-oriented power scheduling. They successfully demonstrate improved grid performance and user satisfaction across residential and workplace charging setups. Another variation of hierarchical control is considered in [19], where the authors develop an EV charging control strategy that combines centralized convex optimization for aggregator-level scheduling with distributed game-theoretic control at the EV level. Their simulation-based study demonstrates that the approach effectively flattens aggregate load curves, reduces energy costs, and converges rapidly to optimal charging profiles, even under varying user preferences and system conditions. In [20], the authors experimentally validate a fully distributed event-triggered control strategy for islanded DC EV charging stations, using hardware-in-the-loop setups with emulated EV loads operating under constant current, constant power, and constant voltage modes. Their approach achieves accurate current sharing among distributed generators without requiring a global communication structure, demonstrating reduced bandwidth usage and enhanced plug-and-play capability.
The real-life tests of smart charging predominantly deploy centralized architectures, which are easier to implement but less representative of scalable, future-proof solutions. In [21], the authors conduct a real-world pilot study of a centralized smart charging system coordinating residential EV loads via flexibility-differentiated pricing, demonstrating effective peak demand reduction and sustained user participation over 15 months. This project report [22] describes a large-scale field demonstration of smart charging with centralized architecture control, which was conducted across fleet, public, and fast-charging stations in Alameda County, California. The results show significant peak demand reductions and enable participation in electricity markets through real-time control and user engagement. Additionally, the study by Tamis et al. [23] provides a structured overview of multiple Dutch smart charging pilots, all conducted with real EVs and chargers in the field. These initiatives demonstrate centralized control of EV smart charging strategies, such as load shifting and energy curtailment, with a focus on grid impact reduction, cost optimization, and renewable energy integration.
Field validations of distributed hierarchical control systems remain scarce, leaving a critical gap in the experimental validation of such architectures. Previous experimental studies at the Technical University of Denmark (DTU) (e.g., [24,25,26]) have primarily focused on low-level coordination of EV chargers to deliver grid services such as frequency regulation and load management. These studies demonstrate distributed control schemes where local controllers autonomously manage EV charging based on user-defined priorities and grid signals. While they validate the feasibility of distributed control in real-world settings, their scope is limited to local-level control, without incorporating higher-level optimization or hierarchical decision-making.
This paper addresses that gap by presenting a real-life implementation and field validation of a distributed hierarchical control system for workplace EV charging. The proposed system combines upper-level receding horizon optimization with lower-level priority-based dispatch, and was deployed at the DTU Risø campus under realistic operational constraints. The main contributions of this study are as follows:
1.
Introduction and testing of a two-level control system, combining upper-level receding horizon optimization with lower-level priority-based dispatch, tailored for workplace EV charging under grid constraints.
2.
Proof-of-concept implementation of a distributed hierarchical control architecture for workplace EV charging, demonstrating autonomous operation under real-world conditions.
3.
Experimental performance validation of the system’s effectiveness in managing energy allocation, responding to dynamic price signals, maintaining grid compliance, and ensuring fair and adaptive charging through a lower-level priority-based dispatch algorithm.
4.
Documentation of real-life challenges encountered during deployment, along with adaptation techniques and actionable recommendations for future implementations of distributed smart charging systems.
The remainder of the paper is structured as follows. Section 2 describes the application framework of the control strategy. Section 3 presents the two-level distributed hierarchical control architecture, detailing the upper-level receding horizon optimization and the lower-level priority-based dispatch mechanism. Section 4 describes the physical implementation of the proposed control, including hardware and software configurations, communications, and data flows. Section 5 provides an overview of the field test setup, including test parameters, EV fleet characteristics, and observed user behavior. Section 6 analyzes the system’s performance across multiple dimensions—responsiveness to dynamic conditions at upper- and lower-levels, alignment between control layers, and energy delivery. Section 7 discusses real-life implementation challenges encountered during deployment and the adaptations made to address them. Finally, Section 8 summarizes the key findings and provides conclusions, recommendations, and future research prospects.

2. Application Framework

The application of the control algorithm described in this paper is targeted to the EV charging setups with the following characteristics:
1.
Grid connection limitations: Smart charging is essential to ensure that the total power drawn from the grid does not exceed predefined technical limits, thereby avoiding grid overloads and ensuring system stability.
2.
Slow chargers: Price optimization and energy management systems are particularly effective in setups where charging time can be flexibly managed. Therefore, fast chargers, whose primary objective is to provide necessary energy as quickly as possible, are not in the scope of this setup.
3.
Cluster of chargers or EV charging station: Aggregation of EV chargers into a cluster or charging station, connected to the same grid transformer, makes it possible to consider the charger loads as a single load unit in the control system.
4.
Local PV generation: EV charging setups can benefit from the presence of local renewable energy sources (RES), particularly photovoltaic (PV) systems. Therefore, this work considers both the presence and absence of such generation in the control system design.
Figure 1 illustrates the electrical configuration of a destination charging station that meets the above criteria and is considered in this work. The setup includes a Point of Chargers Connection (PCC), which serves as a local aggregation point for all chargers. The PCC can be viewed as a potential power bottleneck, with a capacity either equal to the transformer limit or defined independently. This constraint is taken into account in the control system to ensure safe and efficient operation.

3. Control Architecture Overview

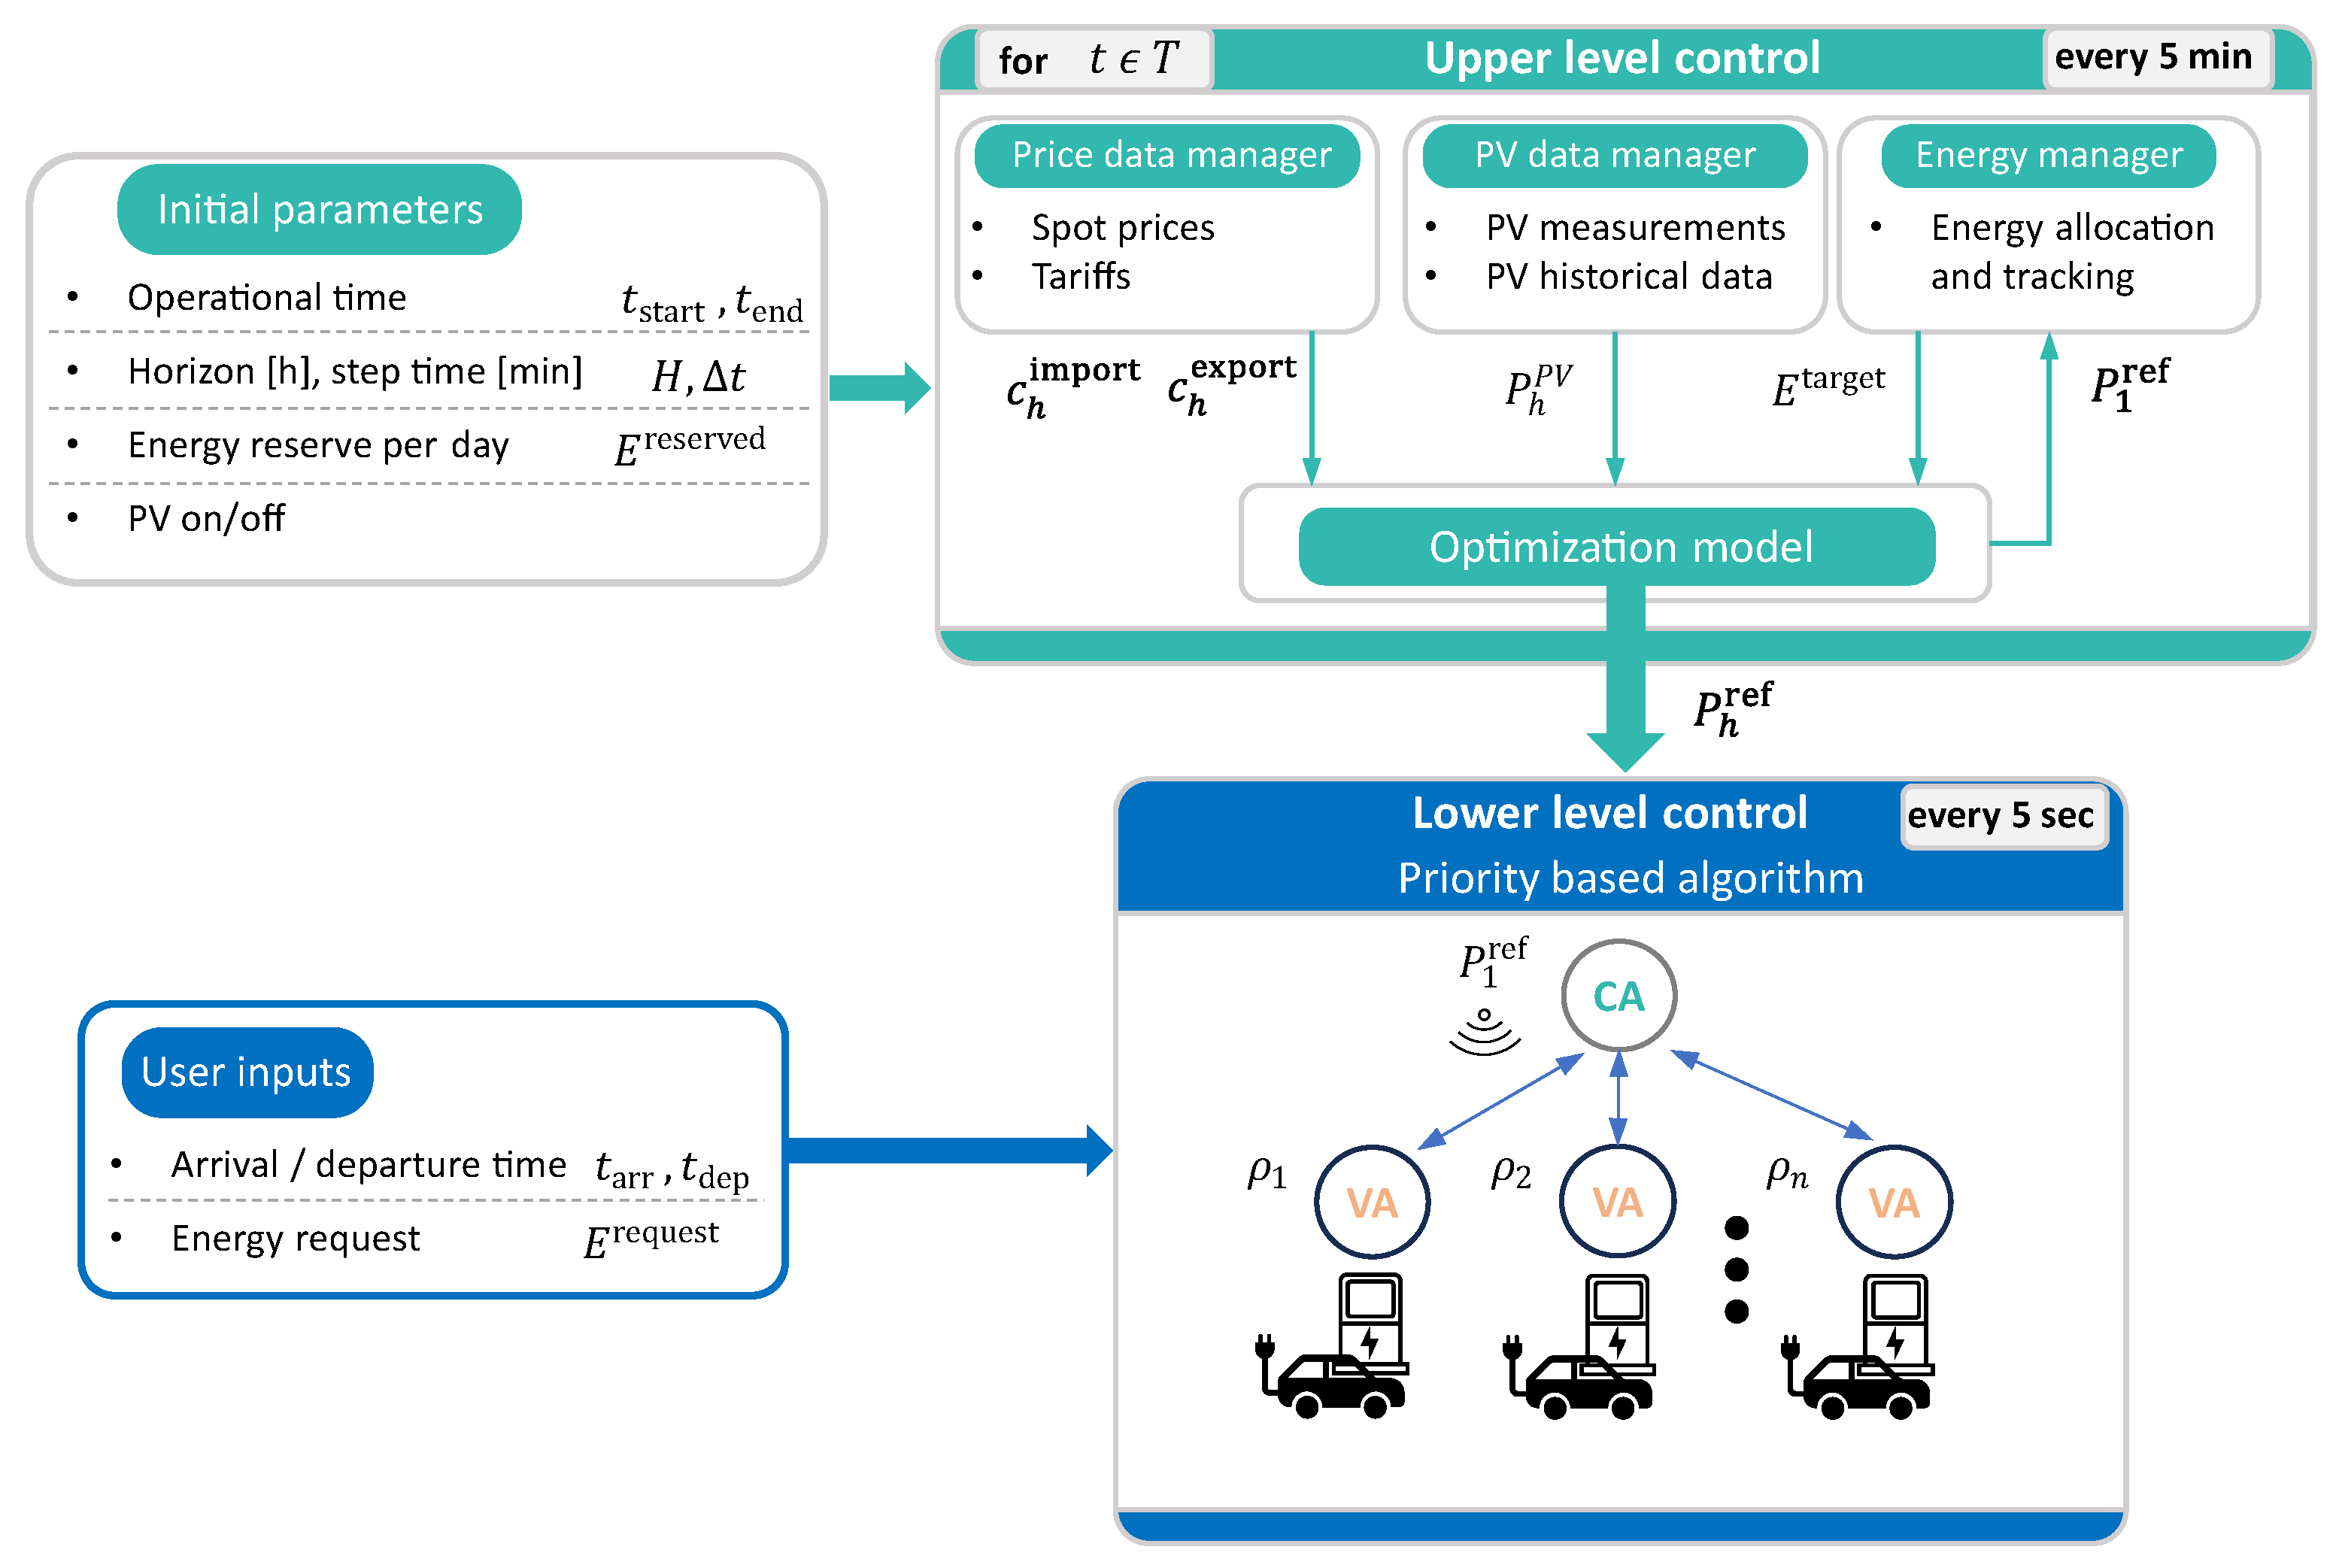
The distributed hierarchical smart charging algorithm described in this work delegates decision-making across two levels, as illustrated in Figure 2. This separation enables the system to address both global and local aspects of charging coordination. The upper-level control, which interfaces with external data sources, is responsible for optimizing the total power consumption of the charging station based on electricity prices, PV generation availability, grid limitations, and energy allocation tracking. The lower-level control handles local decision-making by receiving the power reference from the upper-level control and distributing the available power among individual EVs according to their charging priorities. This architecture supports scalable and flexible operation while ensuring compliance with technical constraints and responsiveness to user needs.

3.1. Upper-Level Control

The upper-level control is responsible for determining the total power reference for the charging station in a cost-efficient and grid-compliant manner. Its role is to optimize the station’s power consumption based on external signals and internal constraints, ensuring that energy usage aligns with both economic and technical goals. The upper-level control consists of the following modules:
  • Optimization model: The core component of upper-level control, which solves the optimization problem by minimizing electricity purchase cost under different constraints (power limitations, energy compliance, time constraints, etc.) and sets the power reference for the charging station.
  • Price data manager: Retrieves, processes, and supplies electricity price information to the optimization model, including day-ahead spot prices, distribution system operator (DSO) tariffs, transmission system operator (TSO) tariffs, and taxes.
  • PV data manager: Collects historical PV data and PV measurements and then prepares the PV data for the optimization model. It combines persistence-based forecasting with real-time measurement logic to capture both the current situation and the broader seasonal patterns. An extended explanation of the adapted PV data methodology can be found in [27].
  • Energy manager: Determines the target amount of energy to be consumed during the current model run. It tracks how much energy has already been allocated via previous power reference decisions and ensures that the total energy consumption is aligned within the predefined daily energy reserve. This module utilizes knowledge of the operational time window and the total energy reserve to guide allocation decisions dynamically.
The upper-level control logic operates in a receding horizon framework, where decisions are made over a moving time window. The terms receding horizon and rolling horizon are used interchangeably in the literature to describe the same concept: a sequential optimization strategy where only the first step of a time-windowed solution is implemented before re-solving the problem with updated inputs. In this paper, we use “receding horizon” following conventions in control theory (e.g., [28]), but it is fully equivalent to “rolling horizon optimization” used in operations research. At each step, the system observes a fixed planning horizon (e.g., 6 h), gathers updated input data, and solves an optimization problem. Only the first time step of the resulting horizon power reference sequence is implemented. The horizon then shifts forward after a step time (e.g., 5 min), new data are collected, and the process repeats. This approach allows the system to adapt dynamically to changing conditions, such as price fluctuations and PV availability, while ensuring compliance with grid constraints. The upper-level control allocates power reference only within the determined operational time of the charging station, and supplies at least the energy reserved per day. Algorithm 1 summarizes the receding horizon optimization workflow.
Algorithm 1 : Receding horizon optimization with PV and energy tracking
 1:
Time sets: Step duration Δ t ; Horizon time (Foreseen steps) h H ; Actual time (decision time) t T
 2:
Input: PV data availability setting (on/off), daily energy reserve E reserved , operational time window [ t start , t end ] , horizon time length H
 3:
Initialize: E allocated ( t 0 ) = 0
 4:
while True do
 5:
    if  t [ t start , t end ]  then
 6:
           P h ref ( t ) = 0                                                 ▹ Outside operational window
 7:
    else
 8:
        Retrieve electricity prices forecast c h import ( t ) , c h export ( t ) and PV data P h PV ( t )
 9:
        Energy target allocation procedure:
E remaining ( t ) = E reserved E allocated ( t ) E target ( t ) = E remaining ( t ) · N visible ( t ) N left ( t )
                      ▹ Scale target energy to a visible number of operational time steps
10:
        Solve optimization:
min H c h import ( t ) · P h import ( t ) c h export ( t ) · P h export ( t ) · Δ t + ξ · 10 5
11:
        Subject to:
P h ref ( t ) P PCC max P h ref ( t ) P min H P h ref ( t ) · Δ t E target ( t ) P h grid ( t ) = P h import ( t ) P h export ( t ) P h ref ( t ) = P h grid ( t ) + P h PV ( t )
12:
        Communicate the solution to the lower-level control: P h ref ( t )
13:
        Communicate the first step of the solution to the energy manager: P 1 ref ( t )
14:
         E allocated ( t ) + = P 1 ref ( t ) · Δ t
15:
    end if
16:
    Wait for next step time Δ t
17:
end while
After the initial parameter setting, which defines the operational time window, horizon, and step duration, daily energy reserve, and PV availability status, each execution cycle of the upper-level control proceeds as follows:
1.
Price loading: Retrieve the latest electricity prices and tariffs for the next horizon.
2.
PV loading: Collect current PV measurements and last day PV data, and generate a forecast.
3.
Energy allocation: Estimate the energy target required for the current run and track energy usage based on previous power reference allocations. The target is recalculated at each step by taking the remaining daily energy and proportionally scaling it to the number of visible operational steps ( N visible ) in the current optimization horizon relative to the total operational steps left for the day ( N left ). This approach prevents both overloading energy use early in the day and leaving too little for later, ensuring a balanced and consistent distribution throughout the entire operational period.
4.
Optimization model execution: Solve the problem of cost minimization under constraints, generate a power reference for the next horizon length, and pass it to the lower-level control logic and to the energy manager module.
The mathematical formulation of the optimization model is more extensively described in our previous work [29]. In this study, we extend the model by introducing energy tracking, which accounts for the actual power allocated to the station during the day. Previously, the fixed energy budget was distributed evenly across the planning horizon without considering real-time consumption. This enhancement improves responsiveness and ensures better alignment with actual charging behavior.

3.2. Lower-Level Control

While this paper focuses primarily on the upper-level scheduling and optimization of charging sessions, the local (charger-level) control implemented by the virtual aggregators (VAs) determines how the charging power is allocated among the EV charging sessions. The lower-level control consists of the following two main elements:
  • The state machine and scheduling logic, described in detail in [25], which governs the order and timing of charging session starts and stops.
  • The power sharing function, described in detail in [24], which determines how available power is distributed among simultaneously charging EVs.
The power reference decision P 1 ref is transferred from upper-level control to the cloud aggregator (CA) in lower-level control. Each VA then receives from CA the cluster power reference, P 1 ref , and the measured total power, P meas , at the PCC. The cluster power error is calculated as:
P error , PCC = P 1 ref P meas
From user inputs—requested energy E request and departure time t dep —each VA calculates its priority index ρ :
ρ = E request E charged ( t dep t 0 ) · P rated , EVSE
where E charged is the energy already delivered to the EV, t 0 is the current time, and P rated , EVSE is the charger’s rated power. The ρ value is exchanged among all VAs via the CA, allowing each charger to know
  • Its own priority share relative to the cluster;
  • Its position in the priority order;
  • The current operational state of other chargers.
This information is used both for power sharing in steady operation and for managing entry into charging through the state machine.
The VA state machine defines a set of operational modes that each charger can be in:
  • Idle: No EV connected or waiting to start.
  • Queue: EV is waiting for available capacity.
  • Initiation (Wait for Space, Take Minimum, Stabilize): Coordinated start-up sequence to smoothly integrate a new charging session without disrupting others.
  • Steady Operation: Either Single VA Steady (only one EV charging) or Multi VA Steady (multiple EVs charging), where power sharing is continuously adjusted by a PI control loop as
    K p = ρ , P error , PCC > 0 1 ρ , P error , PCC < 0
    P E V i ref = P E V i 1 ref + P error , PCC · K p
    This formulation implements a PI controller with a dynamic proportional gain K p and an integral gain K i equal to 1 ( P E V i 1 ref · K i ). This formulation ensures that high-priority sessions respond more strongly to positive errors and reduce less during negative errors, while low-priority sessions adjust in the opposite manner.
  • Making Space: All chargers freeze their power output, except for the charger serving the lowest-priority session (marginal EV), which reduces its power to create capacity for a higher-priority EV to start charging. A minimum power boundary is enforced. If the reduced allocation falls below this limit, the low-priority EV transitions back to the queue state until conditions allow re-entry.
  • Session Ended: A session is terminated either because the energy request is met or by user intervention.
Each VA communicates its state and priority index ρ to all other chargers through the CA. This enables full awareness of which EVs are charging, which are initiating, and which are waiting, so that each VA can take coordinated local actions without requiring a central real-time dispatcher.
In combination, the state machine and the power-sharing function ensure that the upper-level scheduler’s decisions on the order and timing of charging are executed fairly and smoothly at the charger level while adapting dynamically to fluctuations in the cluster’s reference power.

4. Physical Implementation of the Control Architecture

The actual physical implementation of the control architecture is described in this section.

4.1. Hardware

The layout of the charging station used in this study is shown in Figure 1. It is installed at the DTU Risø campus (the geographical location of the test site can be viewed on OpenStreetMap: https://www.openstreetmap.org/?mlat=55.689280&mlon=12.100050#map=19/55.689280/12.100050&layers=N (accessed on 9 October 2025)) and connected to a transformer with a power capacity of 43 kW, which also sets the limit at the station PCC. The charging station includes six chargers (see Figure 3c), and each charger has two plugs (see Figure 3b). Each plug can deliver up to 11 kW, meaning each charger can supply a total of 22 kW. The PV system used in this setup has a capacity of 20 kWp.
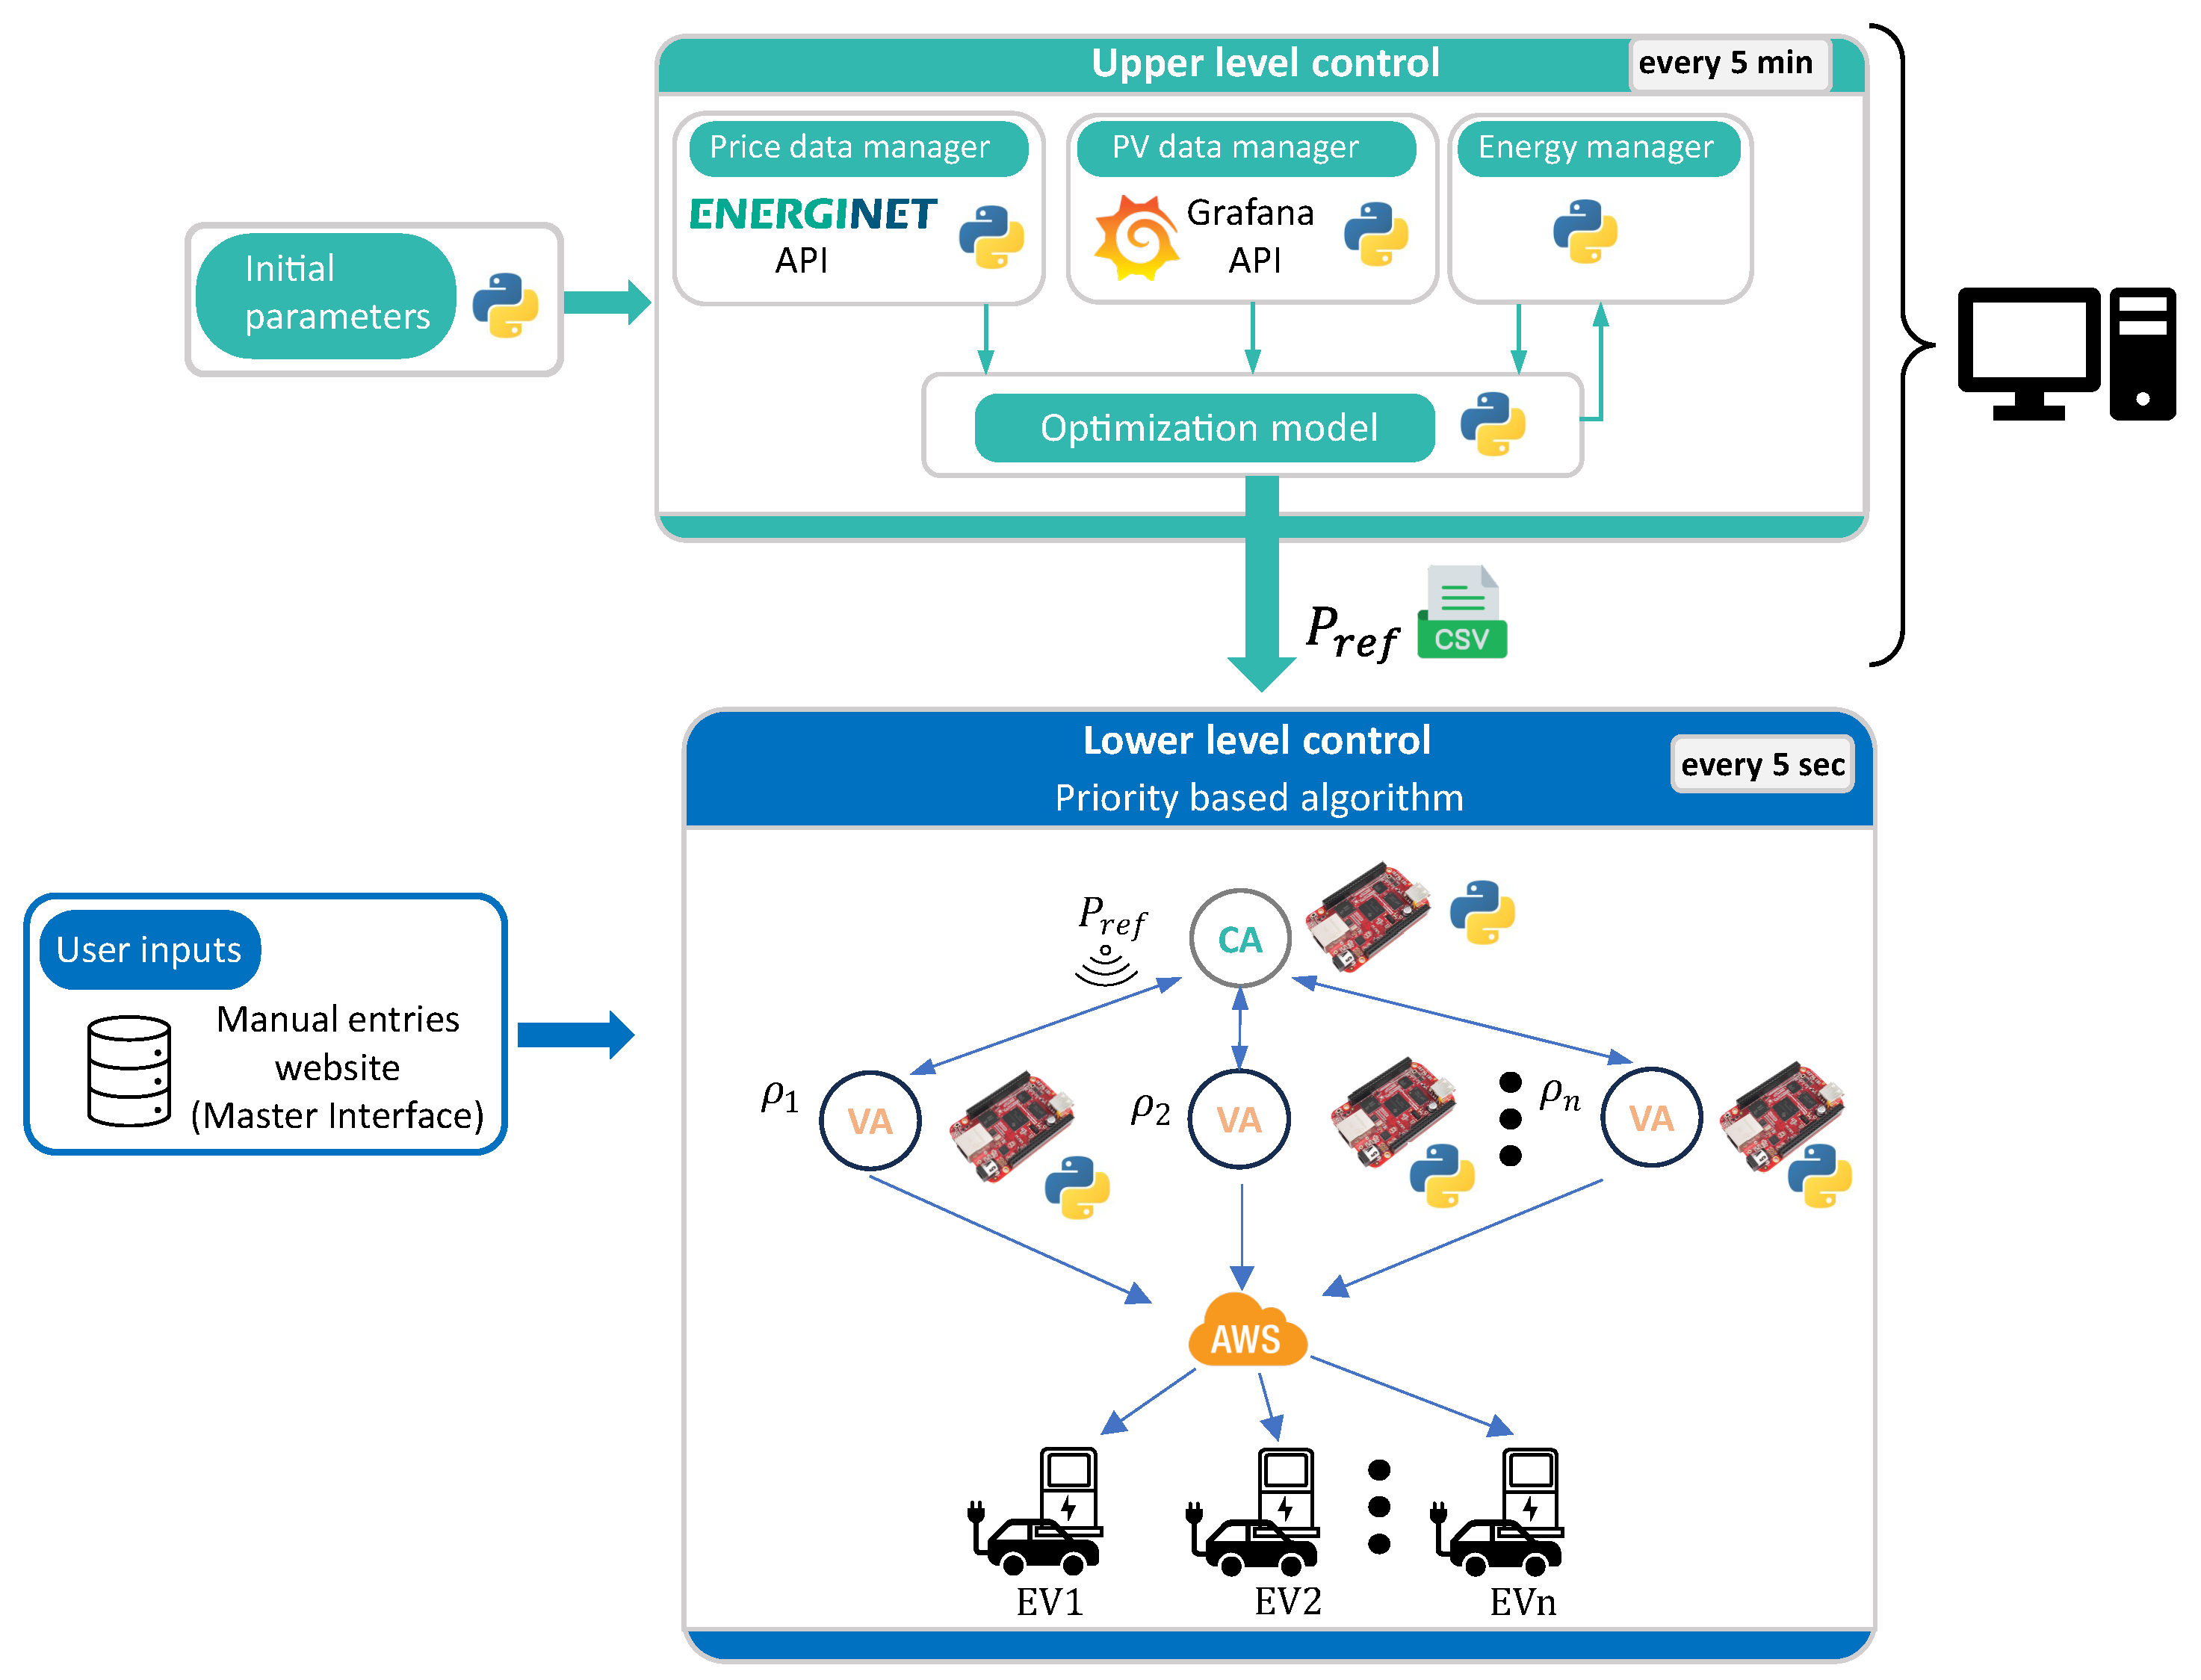
The upper-level control runs on a PC equipped with an HP 11th Gen Intel® Core™ i5-1145G7 processor at 2.60 GHz. The distributed lower-level control elements (CA and VAs) reside on industrial BeagleBone Black microcontrollers (BeagleBoard.org Foundation, Austin, TX, USA; manufactured by Element14, Leeds, UK).

4.2. Software

The software setups used for each control element and their communications are shown in Figure 4. The upper-level control consists of several Python 3.12.7 scripts running on a PC. Spot price data is retrieved via the Energinet DataHub API. At the same time, PV generation and system measurements are also collected via the API of an internal Grafana database, which includes both historical data and the latest measurements. Once the reference power value ( P ref ) is calculated, it is saved as a CSV file, which is then accessed by the lower-level control system. In the lower-level control, both the CA and the VAs run Python scripts and communicate with each other over Ethernet. Input data for the lower-level control is collected through a web-based master interface. The CA receives the reference power value ( P ref ) from the upper-level control and broadcasts it to all VAs. Each VA then determines the final power reference for its corresponding plug. These decisions are transmitted to the chargers via Amazon Web Services (AWS) cloud infrastructure. A detailed description of the lower-level control architecture and its implementation can be found in [24].

5. Field Tests Description

This section describes field tests, specifying the parameters used for upper-level control and summarizing the key characteristics of the EV charging sessions.

5.1. Parameters

Field tests have been conducted for two days in a row: 27 August (Test day 1) and 28 August (Test day 2), 2025. The temperature ranged between 17 and 21 °C, with no rain and partly cloudy skies on both days. The parameters for upper-level control are summarized in Table 1. The optimization horizon was set to six hours, with a step time of five minutes, and with the included PV system in the experiments. The six-hour horizon was selected based on data availability constraints: Energinet (Danish TSO) [30] publishes day-ahead spot prices at 14:00, which limits the usable forecast window to ten hours. In addition, our previous research [29] indicated that extending the horizon beyond six hours does not yield significant improvements in either energy delivery or economic performance, while requiring greater computational resources. The five-minute step time was chosen to balance temporal resolution and computational efficiency: long enough for EVs to adapt to a new dispatch signal before the next update, yet short enough to capture variability in PV generation and avoid missing rapid changes that longer intervals would overlook.
The operational time window for the station was limited to 10 h per day from 08:00 to 18:00, reflecting a. the working hours at the workplace and b. analyzed data from a similar charging station on the DTU Lyngby campus [31]. The daily energy reserve was set to 215 kWh, as half of the available energy of the same operational time without any optimization (430 kWh-10 h on the maximum power of 43 kW). The minimum power reference was set to 12 kW to ensure the ability of two EVs to charge simultaneously (8 A per phase). A small buffer was included to account for variability in vehicle and charger characteristics.

5.2. EVs

Each field test day involved multiple EV charging sessions at the station, capturing realistic workplace charging behavior. Unlike synthetic datasets, these sessions reflect the actual user inputs and EVs’ capabilities: real arrival and departure times; real requested energy, based on the actual state of charge of EVs; and vehicle charging capabilities. The fleet included single- and three-phase EVs with different maximum charging powers, adding heterogeneity to the test conditions.
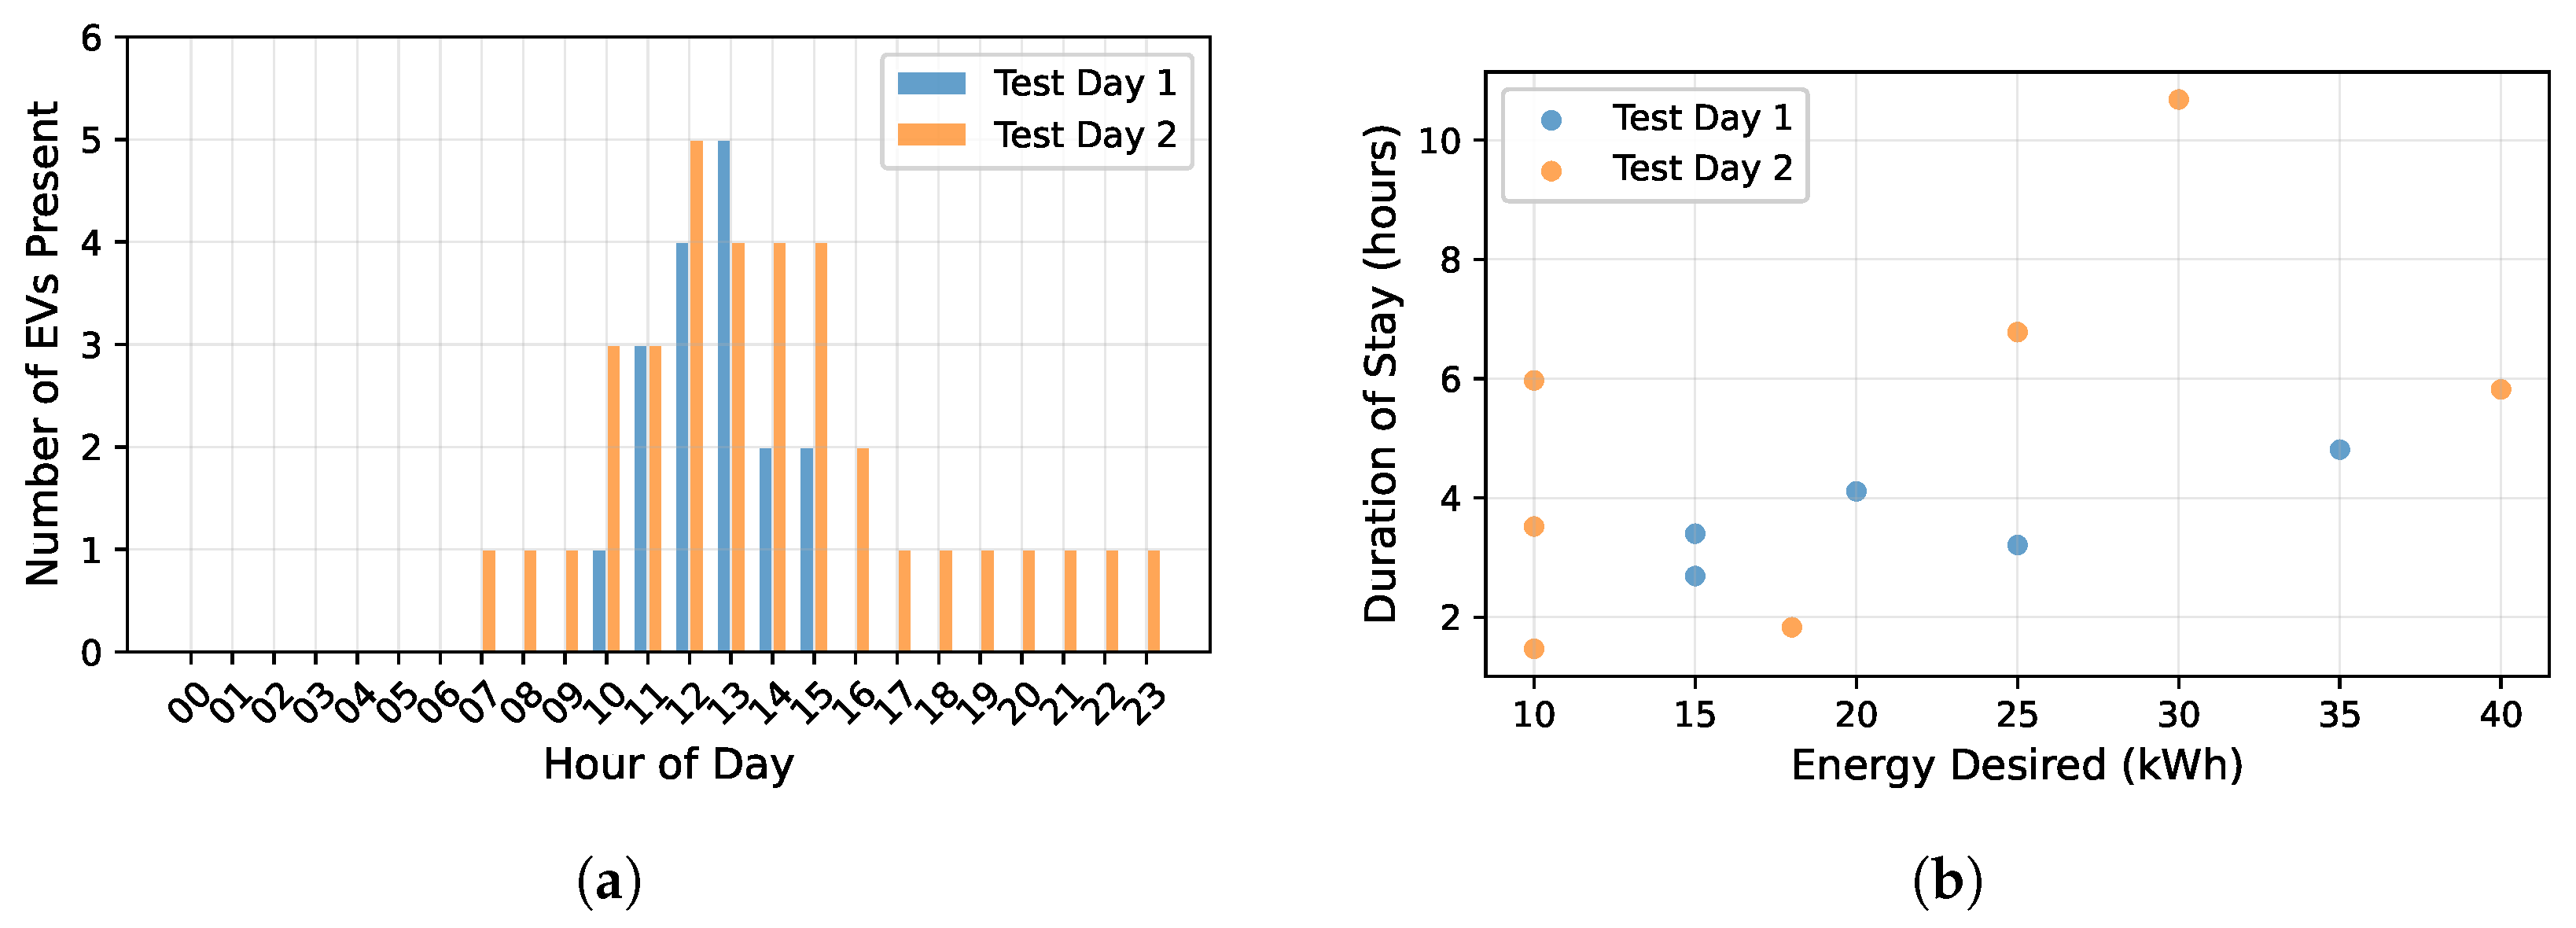
Figure 5a shows the hourly presence of EVs across the test days. The EVs were spread across the day and followed the pattern of working hours. The number of EVs at the station gradually increased until 12–13:00, reaching five EVs charging simultaneously for both days, and then gradually decreased during afternoon hours. Two EVs lay outside of normal working hours: one came early, another stayed late.
The sessions varied significantly in both requested energy and duration of stay, as illustrated in Figure 5b. The requested energy ranged from 10 kWh to 40 kWh, while durations spanned from less than 2 h to over 10 h. However, most of the sessions lasted less than 6 h and required an energy of 25 kWh or less.
These real-world conditions ensured that the evaluation captured practical constraints and user-driven variability, rather than idealized or uniform patterns.

6. Results

6.1. Upper-Level Control Performance

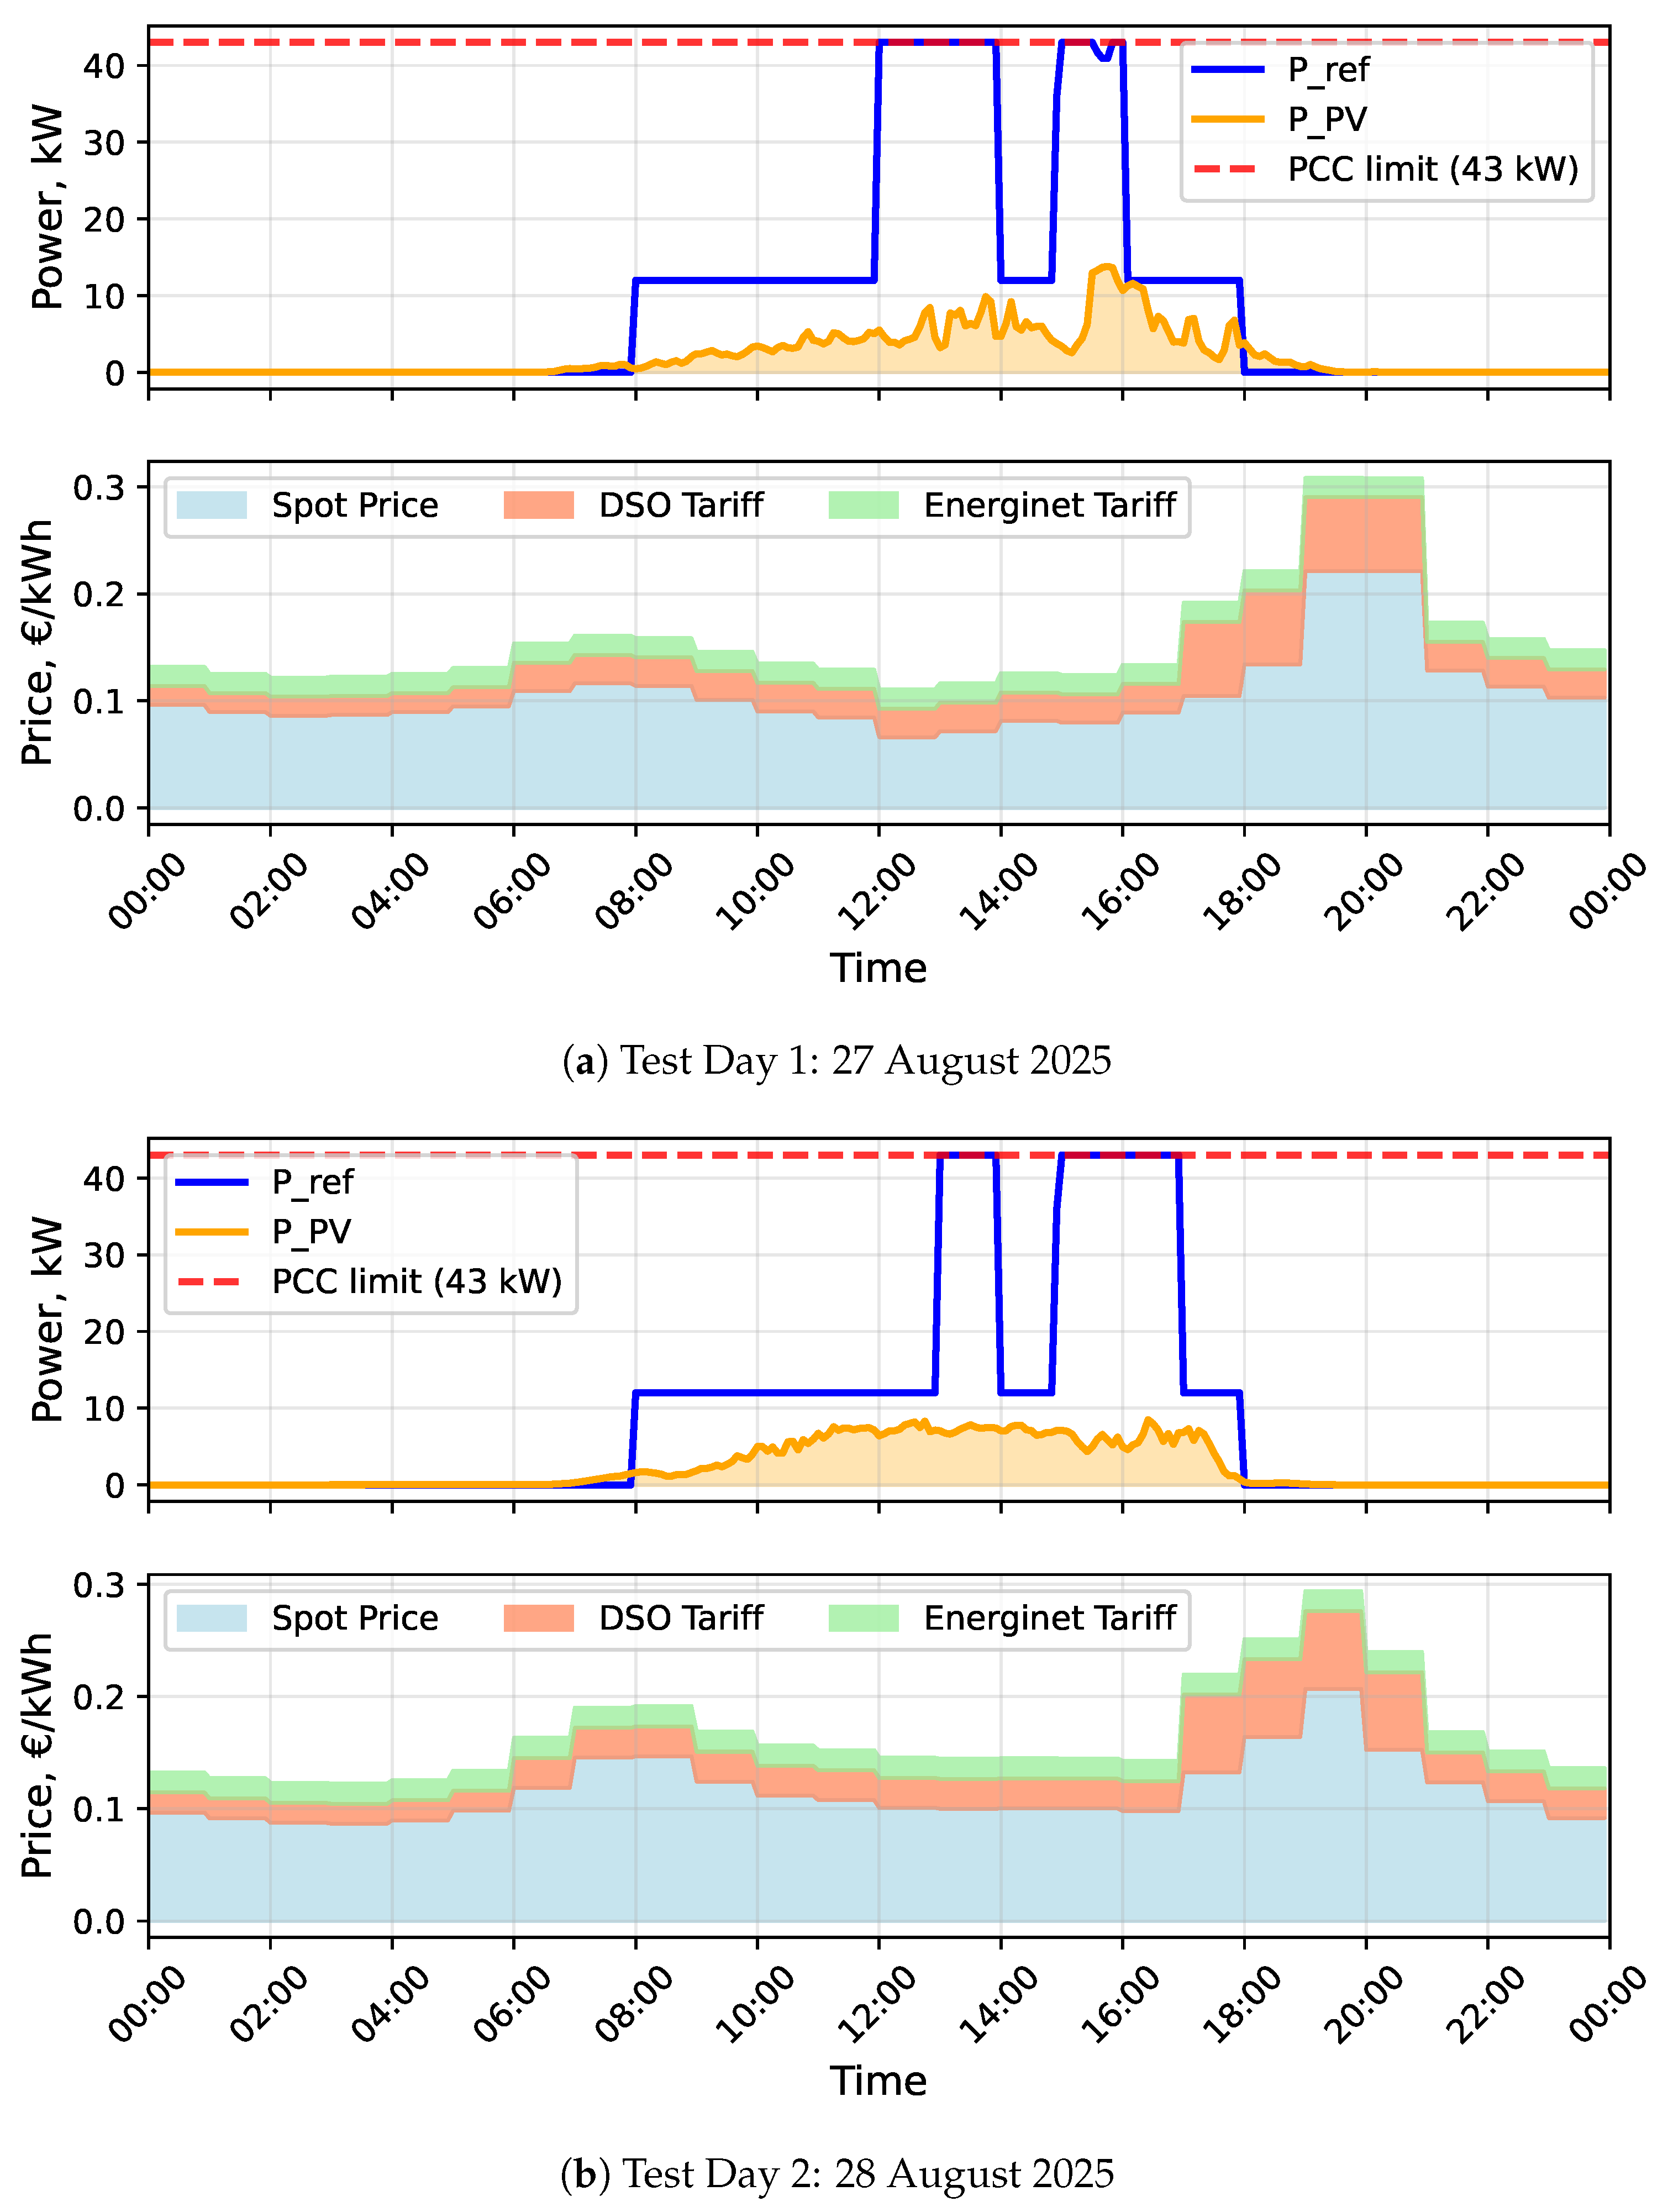
The behavior of the upper-level receding horizon optimization can be observed in Figure 6, which show the allocated power reference ( P ref ) with the electricity total price and its components (spot price, DSO tariff, and Energinet tariff), PV generation ( P pv ), and PCC limit.
The model successfully followed the operational time and PCC limit restrictions. The PV generation was lower than the minimum power reference of 12 kW for almost all the time during these days; therefore, we cannot observe the PV-following pattern of the control decisions. The prices of these two days also followed a close pattern with two distinct peaks: the first at 7:00–8:00 in the morning and second, a bigger peak (“cooking peak”) at 19:00–20:00. The upper-level control successfully captured price valleys and allocated the maximum power to these hours. Two distinguished peaks of P ref , reaching the maximum allowed power, are observed for both days. For Test Day 1, these peaks were from 12:00 to 14:00 and 15:00 to 16:00; for Test Day 2— from 13:00 to 14:00 and 15:00 to 17:00. The slight price variations during the big price valleys between 12:00 and 17:00 during both days determined the shapes of P ref allocations. Due to a slight increase in the price at 14:00 on Test Day 1, the model postponed maximum power allocation until this hour was over. For Test Day 2, in contrast, as the model foresaw the step to lower prices at 16:00, it waited to allocate a longer P ref peak to the last two hours of the price valley.

6.2. Alignment of Lower-Level EV Charging with Upper-Level Control Power Reference

Figure 7 presents the total EV cluster consumption compared to the upper-level power reference signal and the PCC limit (43 kW) for both experimental days. These plots provide insight into how effectively the lower-level control system respected the upper-level scheduling decisions. Overall, the strong alignment between upper-level control P ref and total EVs consumption is observed during both test days.
On Test Day 1 (Figure 7a), EVs are present between 09:00 and 16:00, which is highly aligned with workplace working hours. The EVs are following the reference power to a high degree with small discrepancies, which are discussed later. The first peak of P ref at noon is highly utilized by EVs. This reference peak is also aligned with EVs’ maximum presence at the station. The second peak is less utilized, as the majority of EVs have already left by that time. At times of minimum P ref , the EVs also successfully follow the allocation, and an especially solid trend is observed at the time between P ref peaks, with the EVs quickly reacting to the changes in power limitations. Oscillations around 11:00–12:00 and closer to 13:00 are related to failed starts of charging for two EVs. For these two EVs, the power space made by the marginal EV (EV with the lowest priority) was not sufficient to initiate charging. The observed oscillations correspond to the actions of the marginal EV, which attempts to reduce its power, and then increase it again when no other EV occupies the available power space. At 09:30, we can also observe overshooting of power from EVs. This overshooting is related to a communication error inside one of the chargers—the charger did not register user inputs correctly and fell to the default settings of allowed power for EVs of 11 kW per plug. The fault in the charger operation was immediately observed, and this charger was replaced with another. The spike did not affect the operation. The EV was connected and started charging right after replacement.
On Test Day 2 (Figure 7b), EVs are present from early morning till late evening/night. The P ref is also being followed to a high degree during this test day, especially in the morning, when we had a growing number of EVs present at the site. Closer to noon, there were also oscillations; however, this time it was the fault of communication on the EV’s side. The details of this event are described in the next subsection. Once the faulty EV left the station, the remaining EVs were able to grasp and utilize the first power peak of P ref , closer to 14:00. At 14:00, P ref fell back to minimum power, and the EVs followed. However, due to a higher number of active charging sessions at that time compared to Test Day 1, their total consumption exceeded the limitation of 12 kW. This happened due to the action of lower-level control logic that, once the session started, ensured the EV had a power supply of at least 2.1 kW per phase, which overwrote the upper-level control decision. This was performed to reduce the number of occasions for EVs to fall asleep during the charging pause. At 15:00, the second power peak of P ref occurred, and EVs followed the reference change. However, most of the EVs again started to disconnect at that time, and the allocated P ref was not harvested to the fullest. One car remained charging even after operational time for the same reason described above—lower-level guarantees a minimum charging power of 2.1 kW per phase for this car as its charging session remained active(i.e., the EV still required energy that had not yet been fulfilled, and the EV had not been disconnected).

6.3. Lower-Level Priority-Based EVs Charging

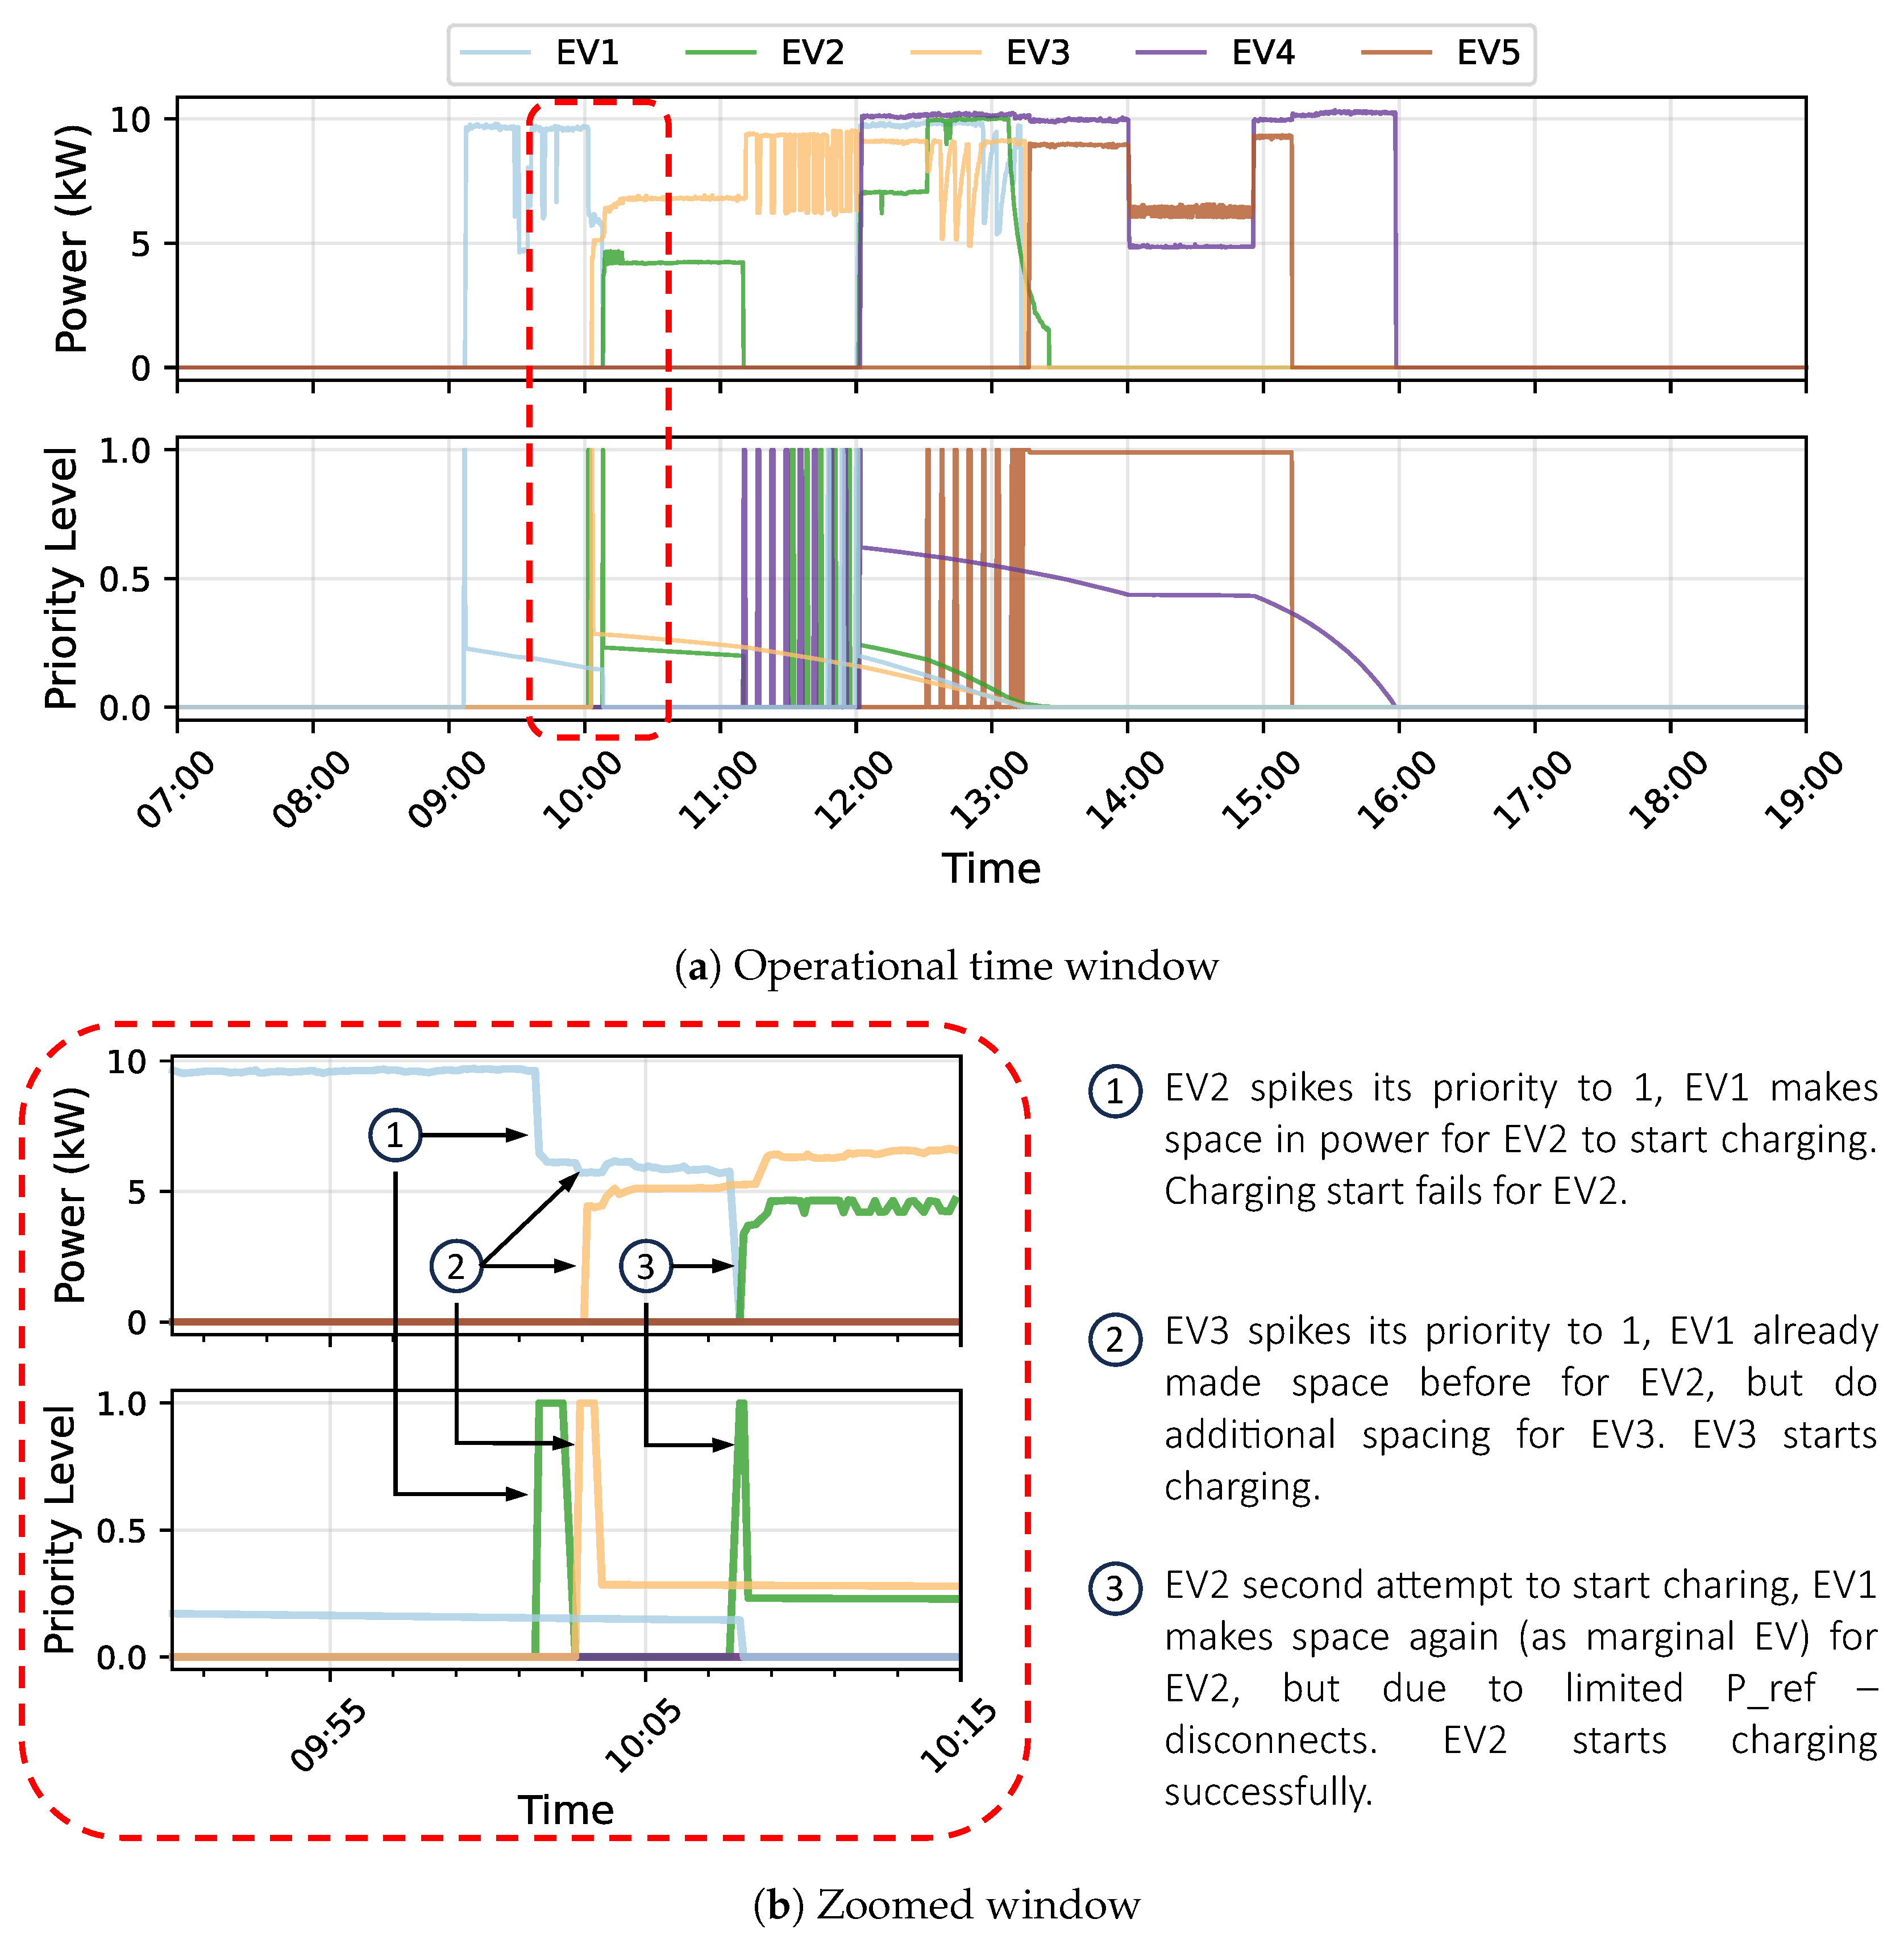
Figure 8 and Figure 9 present individual EVs’ charging powers and priorities for Test Days 1 and 2, respectively. Each figure consists of two subplots: the first subplot shows the whole operational time window for the test day with additional hours before and after (from 07:00 til 19:00), the second subplot highlights an interesting moment of the day for each of the test days— the moment itself is contoured in a red dashed box on the first subplot. During both test days, priority signals have been working as they were intended: deploying power scheduling, power sharing, and assisting with the start of charging sessions.
On Test Day 1, we can observe the logic of charging session initiation from Figure 8b. The EV1 was charging at full available power. Then, EV2 tried to start charging and spiked its priority to 1. EV1 followed and decreased its charging power to allocate room for EV2 to charge. However, that power gap was not enough for EV2. Right after the priority of EV2 fell back to 0, EV3 initiated its charging, spiking the priority to 1. EV1 allocated a little more room, and EV3 successfully started its charging. After 5 minutes, EV2 proceeded with its second attempt to initiate charging, so its priority became equal to 1, and the marginal EV1 disconnected in order to provide space for higher priority EV2. Subsequently, EV2 successfully started its charging. From Figure 8a, we can observe previously mentioned oscillations for Test Day 1 from 11:00 to 12:00 and from 12:30 to 13:15. These were similar situations in which marginal EVs did not reduce their power to accommodate newly arrived EVs; however, after several attempts, all EVs started charging and continued to charge successfully. The logic causing such oscillations was adjusted for Test Day 2.
The effect of improved power-sharing logic can be seen from Test Day 2, Figure 9a, at 10:30, where marginal EV5 disconnected to provide space for newly connected EV1. Right after EV1 successfully initiated charging, the EV5 also spiked its priority and started to charge again. Together, they entered a power-sharing mode. Another interesting event is shown in Figure 9b for the time between 12:00 and 16:00. Here, EV4 was trying to initiate charging unsuccessfully. Marginal EV1 was creating space for EV4; however, it could not start charging even though the space was more than enough, with almost 7 kW curtailment for the individual power reference of marginal EV. Then, EV5 took over the space, but it became disconnected from another initiation from EV4. All these charging oscillations from marginal EVs were happening until 13:00, when EV1 stopped to allocate space for the EV4 and thus for other EVs as well, and took all available power reference. Other EVs were trying to enter the charging at that time, but after several unsuccessful attempts, they went to sleep mode. Only after waking the cars up and EV4 leaving the station, the EVs started to charge at full capacity, utilizing the first power reference peak at that time. Nevertheless, all EVs have been successfully charging and fulfilling their energy request, which we cover in the next subsection.

6.4. Summary of EV Charging Sessions and Delivery Rates

Table 2 and Table 3 present the detailed outcomes of individual EV charging sessions for Test Day 1 and Test Day 2, respectively. Each table shows the EVs’ arrival, departure, and expected departure (used for priority calculations) times; overall duration of connection; desired and delivered energies; and energy delivery rate. This information allows us to evaluate the control system’s performance in terms of energy usage and system delivery rate. The test days are accessed with average delivery (Equation (5)) among EVs and overall system delivery (Equation (6)).
η a v g = 1 N i = 1 N η i = 1 N i = 1 N E i charged E i desired · 100 %
η s y s = i = 1 N E i charged i = 1 N E i desired · 100 %
On Test Day 1, a total of 110 kWh was requested across five EVs, of which 109.98 kWh was delivered; therefore, overall system delivery η s y s = 99.98%. The delivery efficiency rate ranges between 99.8 and 100% with the average delivery among EVs η a v g = 99.96%.
On Test Day 2, there were seven EVs, among which one could not start its charging and, therefore, its charging session was unsuccessful. The overall desired energy was 143 kWh across seven EVs, while the energy delivered was 111.81 kWh. Thus, the overall system delivery η s y s = 78.2%, including faulty EV4, and η s y s = 89.4% excluding it. The individual EVs’ delivery rates are also more diverse here compared to Test Day 1 and range between 74.7–100% for successfully started charging EVs. Thus, the average delivery is η a v g = 79.9%, including faulty EV4, and η a v g = 93.3% when excluding it.
Despite limiting the station’s daily energy allocation to 215 kWh—approximately half of its technical capacity—the actual energy requested by EVs was even lower. As a result, the control system was able to satisfy nearly all charging demands, achieving exceptionally high delivery rates. Test Day 1 reached almost 100% system delivery, while Test Day 2 also demonstrated strong performance (above 78%, including the unsuccessful session and nearly 90% when excluding it). These results confirm that, under realistic workplace conditions, the implemented control strategy can ensure efficient energy distribution even with a limited energy reserve and power curtailments.

7. Real-Life Implementation Experiences: Challenges and Adaptations

The inclusion of this section is motivated by the need to share practical insights and challenges encountered during the real-world implementation of the proposed EV charging control system. By documenting these experiences, we aim to provide a transparent account of the difficulties faced, the underlying causes, and the mitigation strategies applied—thereby contributing to the collective learning in the domain of smart EV charging.

7.1. Charger Communication Error and Hardware Faults

During Test Day 1, a communication fault in one of the chargers led to an unintended power overshoot. The charger failed to register user inputs and defaulted to its maximum allowed power output (11 kW per plug), temporarily violating the station’s power reference. The issue was quickly resolved by replacing the faulty charger. Although this did not impact the overall system performance, it underscored the importance of robust error detection in charger software and the necessity of fallback mechanisms for such cases.

7.2. Failed Initiations of Charging Sessions

On Test Day 1, several instances of EVs’ charging session initiation failures were observed. This happened due to a lack of available power spaces provided by marginal EVs. This led to power oscillations during power-sharing logic deployment (where several EVs should share available station power). The control logic was refined by increasing the power reduction from the marginal EV from 1.84 kW to 2.3 kW per phase (from 8 A to 10 A availability) for Test Day 2. This adjustment improved power-sharing logic performance on Test Day 2.

7.3. EV-Side Communications and Sleep Modes

On Test Day 2, one EV failed to start charging due to communication issues on its side. This EV repeatedly tried to initiate charging for one hour, reducing charging opportunities for other EVs, as the marginal EV was trying to accommodate this faulty EV. Eventually, due to these continuous faulty initiations, other EVs entered sleeping mode. Only after the faulty EV left and other EVs were awakened was the available power utilized fully. This event highlighted the need for improvements in EV side failure detection by control logic and deployment of a rapid fallback response of discontinuing such EV from control to not violate other EVs’ charging sessions.

7.4. Misalignment Between Upper- and Lower-Level Controls

The lower-level control system guarantees a minimum charging power (2.1 kW per phase) once a session is initiated, to prevent EVs from entering sleep mode during brief power curtailments. While effective in maintaining session continuity, this mechanism can occasionally lead to temporary overshoots of the power reference set by upper-level control. This behavior is not a fault of the system but rather a necessary safeguard built into the lower-level logic. Future implementations should develop coordination mechanisms that allow for dynamic negotiation between control layers.

8. Conclusions

This study presents a successful real-world implementation and validation of a distributed hierarchical control system for workplace EV charging, combining receding horizon optimization at the station upper-level with priority-based power allocations at the chargers lower-level. The system was deployed and tested for two days under realistic conditions, including grid constraints, dynamic electricity pricing, and heterogeneous EV behavior.
The results demonstrate that the proposed control architecture is both feasible and robust. All control sequences operated as expected. Upper-level control efficiently adapted to dynamic prices, while the lower-level control successfully distributed the available charging station power among EVs. The system achieved high energy delivery rates—nearly 100% on the first test day and close to 90% on the second—despite operating under a significantly constrained energy budget and a fixed operational time window. Specifically, the daily energy allocation was limited to just 215 kWh, which is approximately half of the station’s PCC limit and nearly six times lower than the combined maximum capacity of all chargers over the same period. This demonstrates the system’s ability to deliver efficient and fair energy distribution even under tight resource constraints.
Importantly, the field tests revealed several practical challenges, such as communications failure, EVs’ sleep modes, and others. These experiences highlight the importance of real-world testing to explore system-level interactions that are often overlooked in simulation studies.
Further work directions will be targeted in longer testing to explore model robustness further. Also, future studies could explore larger-scale deployments, i.e., including more chargers and EVs and/or several charging stations, as well as integration of vehicle-to-grid (V2G) capabilities.

Author Contributions

Conceptualization, A.M., J.M.Z., and M.M.; methodology, A.M., J.M.Z., S.S., and M.M.; software, A.M. and S.S.; validation, A.M. and S.S.; formal analysis, A.M.; investigation, A.M., S.S., J.M.Z., and M.M.; data curation, A.M.; writing—original draft preparation, A.M. and S.S.; writing—review and editing, A.M., J.M.Z., S.S., and M.M.; visualization, A.M.; supervision, J.M.Z., and M.M.; project administration, M.M.; funding acquisition, M.M. All authors have read and agreed to the published version of the manuscript.

Funding

This research was funded by the European Union’s Horizon 2020 research and innovation program through the EV4EU project (Grant Agreement No. 101056765) https://ev4eu.eu/.

Data Availability Statement

The original contributions presented in this study are included in the article. Further inquiries can be directed to the corresponding authors.

Acknowledgments

During the preparation of this manuscript/study, the author(s) used Microsoft M365 Copilot, version 19.2509.39151.0, to assist in the writing/editing of this manuscript for better readability. The authors have reviewed and edited the output and take full responsibility for the content of this publication.

Conflicts of Interest

The funders had no role in the design of the study; in the collection, analyses, or interpretation of data; in the writing of the manuscript; or in the decision to publish results.

Abbreviations

The following abbreviations are used in this manuscript:
AWSAmazon Web Services
CACloud Aggregator
CPOCharge Point Operator
DSODistribution System Operator
DTUTechnical University of Denmark
EVElectric Vehicle
MILPMixed-Integer Linear Programming
PCCPoint of Chargers Connection
PCPersonal Computer
PVPhotovoltaic
RESRenewable Energy Sources
TSOTransmission System Operator
VAVirtual Aggregator
V2GVehicle-to-Grid

Nomenclature

 Sets and indices
TSet of decision times (actual time indices)
tDecision time index, t T
HPlanning horizon (set of foreseen steps); | H | is horizon length [steps]
hIndex of step in the planning horizon, h H
 Parameters
Δ t Step duration [min]
HHorizon length [hours]
t start , t end Operational time window
E reserved Daily energy reserve [kWh]
P PCC max Maximum power at PCC [kW]
P min Minimum cluster power [kW]
P rated , EVSE Rated power of EVSE (charger) [kW]
PV on/offBinary flag for PV data availability ( { 0 , 1 } )
 Decision and state variables
P h ref ( t ) Cluster power reference for horizon H at time t [kW]
P 1 ref ( t ) First-step cluster power reference [kW]
P h PV ( t ) PV power forecast for horizon H at time t [kW]
P h grid ( t ) Net grid power (import > 0, export < 0) [kW]
P h import ( t ) Grid import power [kW]
P h export ( t ) Grid export power [kW]
c h import ( t ) Import electricity price [€/kWh]
c h export ( t ) Export electricity price [€/kWh]
E allocated ( t ) Cumulative energy allocated up to time t [kWh]
E remaining ( t ) Remaining daily energy at time t [kWh]
E target ( t ) Energy target for current optimization run [kWh]
N visible ( t ) Number of operational steps visible in horizon [–]
N left ( t ) Number of operational steps remaining in day [–]
ξ Slack variable for objective function
 Lower-level control variables
P meas Measured total power at PCC [kW]
P error , PCC PCC power error for PI controller [kW]
P EV i ref Power reference for EVi [kW]
E request User-requested energy for a session [kWh]
E charged Energy delivered so far to EV [kWh]
t dep Declared departure time
t 0 Current time when priority is evaluated
ρ Priority index [–]
K p Proportional gain in lower-level control [–]
K i Integral gain in lower-level control ( K i = 1 ) [–]

References

  1. IEA. Global EV Outlook 2025—Analysis. Available online: https://iea.blob.core.windows.net/assets/7ea38b60-3033-42a6-9589-71134f4229f4/GlobalEVOutlook2025.pdf (accessed on 15 September 2025).
  2. Vishnu, G.; Kaliyaperumal, D.; Jayaprakash, R.; Karthick, A.; Kumar Chinnaiyan, V.; Ghosh, A. Review of Challenges and Opportunities in the Integration of Electric Vehicles to the Grid. World Electr. Veh. J. 2023, 14, 259. [Google Scholar] [CrossRef]
  3. Unterluggauer, T.; Hipolito, F.; Rich, J.; Marinelli, M.; Andersen, P.B. Impact of cost-based smart electric vehicle charging on urban low voltage power distribution networks. Sustain. Energy Grids Netw. 2023, 35, 101085. [Google Scholar] [CrossRef]
  4. Jones, C.B.; Lave, M.; Vining, W.; Garcia, B.M. Uncontrolled Electric Vehicle Charging Impacts on Distribution Electric Power Systems with Primarily Residential, Commercial or Industrial Loads. Energies 2021, 14, 1688. [Google Scholar] [CrossRef]
  5. Striani, S.; Sevdari, K.; Calearo, L.; Andersen, P.B.; Marinelli, M. Barriers and Solutions for EVs Integration in the Distribution Grid. In Proceedings of the 2021 56th International Universities Power Engineering Conference: Powering Net Zero Emissions, UPEC 2021—Proceedings, Middlesbrough, UK, 31 August–3 September 2021. [Google Scholar] [CrossRef]
  6. Tirunagari, S.; Gu, M.; Meegahapola, L. Reaping the Benefits of Smart Electric Vehicle Charging and Vehicle-to-Grid Technologies: Regulatory, Policy and Technical Aspects. IEEE Access 2022, 10, 114657–114672. [Google Scholar] [CrossRef]
  7. Ahmad, A.; Khalid, M.; Ullah, Z.; Ahmad, N.; Aljaidi, M.; Malik, F.A.; Manzoor, U. Electric Vehicle Charging Modes, Technologies and Applications of Smart Charging. Energies 2022, 15, 9471. [Google Scholar] [CrossRef]
  8. Mogire, E.; Kilbourn, P.; Luke, R. Smart Charging for E-Mobility in Urban Areas: A Bibliometric Review. Energies 2025, 18, 4655. [Google Scholar] [CrossRef]
  9. Diaz-Londono, C.; Maffezzoni, P.; Daniel, L.; Gruosso, G. Flexibility of Electric Vehicle Chargers in Residential, Workplace, and Public Locations Based on Real-World Data. In Proceedings of the EUROCON 2023—20th International Conference on Smart Technologies, Torino, Italy, 6–8 July 2023; pp. 354–359. [Google Scholar] [CrossRef]
  10. Han, X.; Heussen, K.; Gehrke, O.; Bindner, H.W.; Kroposki, B. Taxonomy for Evaluation of Distributed Control Strategies for Distributed Energy Resources. IEEE Trans. Smart Grid 2018, 9, 5185–5195. [Google Scholar] [CrossRef]
  11. Dahiwale, P.V.; Rather, Z.H.; Mitra, I. A Comprehensive Review of Smart Charging Strategies for Electric Vehicles and Way Forward. IEEE Trans. Intell. Transp. Syst. 2024, 25, 10462–10482. [Google Scholar] [CrossRef]
  12. Richardson, P.; Flynn, D.; Keane, A. Local versus centralized charging strategies for electric vehicles in low voltage distribution systems. IEEE Trans. Smart Grid 2012, 3, 1020–1028. [Google Scholar] [CrossRef]
  13. García-Villalobos, J.; Zamora, I.; San Martín, J.I.; Asensio, F.J.; Aperribay, V. Plug-in electric vehicles in electric distribution networks: A review of smart charging approaches. Renew. Sustain. Energy Rev. 2014, 38, 717–731. [Google Scholar] [CrossRef]
  14. Nimalsiri, N.I.; Mediwaththe, C.P.; Ratnam, E.L.; Shaw, M.; Smith, D.B.; Halgamuge, S.K. A Survey of Algorithms for Distributed Charging Control of Electric Vehicles in Smart Grid. IEEE Trans. Intell. Transp. Syst. 2020, 21, 4497–4515. [Google Scholar] [CrossRef]
  15. Kisacikoglu, M.C.; Erden, F.; Erdogan, N. Distributed Control of PEV Charging Based on Energy Demand Forecast. IEEE Trans. Ind. Inform. 2018, 14, 332–341. [Google Scholar] [CrossRef]
  16. Ardakanian, O.; Keshav, S.; Rosenberg, C. Real-time distributed control for smart electric vehicle chargers: From a static to a dynamic study. IEEE Trans. Smart Grid 2014, 5, 2295–2305. [Google Scholar] [CrossRef]
  17. Abdullah Al Nahid, S.; Qi, J. A Hybrid EV Charging Approach Based on MILP and a Genetic Algorithm. Energies 2025, 18, 3656. [Google Scholar] [CrossRef]
  18. Amin, A.; Mahmood, A.; Khan, A.R.; Arshad, K.; Assaleh, K.; Zoha, A. A Two-Stage Multi-Agent EV Charging Coordination Scheme for Maximizing Grid Performance and Customer Satisfaction. Sensors 2023, 23, 2925. [Google Scholar] [CrossRef]
  19. He, C.; Zhang, Z. An efficient hierarchical electric vehicle charging control strategy. Int. J. Robust Nonlinear Control 2023, early view. [Google Scholar] [CrossRef]
  20. Wang, R.; Tian, X.; Wei, Z.; Sun, Q.; Wang, P. Fully distributed energy management strategy for DC bus charging stations with three charging modes. Sci. Rep. 2025, 15, 1009. [Google Scholar] [CrossRef] [PubMed]
  21. Alexeenko, P.; Bitar, E. Achieving reliable coordination of residential plug-in electric vehicle charging: A pilot study. Transp. Res. Part D: Transp. Environ. 2023, 118, 103658. [Google Scholar] [CrossRef]
  22. Black, D.; Yin, R.; Wang, B. Smart Charging of Electric Vehicles and Driver Engagement for Demand Management and Participation in Electricity Markets California Energy Commission; Technical Report; California Energy Commission: Sacramento, CA, USA, 2019. [Google Scholar]
  23. Tamis, M.; Hoed, R.v.d.; Thorsdottir, H. Smart charging in the Netherlands. In Proceedings of the European Battery, Hybrid & Fuel Cell Electric Vehicle Congress, Geneva, Switzerland, 14–16 March 2017. [Google Scholar]
  24. Striani, S.; Pedersen, K.L.; Engelhardt, J.; Marinelli, M. Experimental Investigation of a Distributed Architecture for EV Chargers Performing Frequency Control. World Electr. Veh. J. 2024, 15, 361. [Google Scholar] [CrossRef]
  25. Pedersen, K.L.; Striani, S.; Engelhardt, J.; Marinelli, M. Implementation of priority-based scheduling for electric vehicles through local distributed control. In Proceedings of the IEEE PES Innovative Smart Grid Technologies Europe, ISGT EUROPE 2024, Dubrovnik, Croatia, 14–17 October 2024. [Google Scholar] [CrossRef]
  26. Zunino, P.; Engelhardt, J.; Striani, S.; Pedersen, K.L.; Marinelli, M. Frequency Control in EV Clusters: Experimental Validation and Time Response Analysis of Centralized and Distributed Architectures. In Proceedings of the IEEE PES Innovative Smart Grid Technologies Europe, ISGT EUROPE 2024, Dubrovnik, Croatia, 14–17 October 2024. [Google Scholar] [CrossRef]
  27. Malkova, A.; Zepter, J.M.; Marinelli, M. Online optimization of a workplace electric vehicle charging station under grid constraints. IET Conf. Proc. 2023, 2023, 120–126. [Google Scholar] [CrossRef]
  28. Rawlings, J.; Mayne, D.Q. Model Predictive Control: Theory and Design; Nob Hill Publishing: San Francisco, CA, USA, 2009. [Google Scholar]
  29. Malkova, A.; Zepter, J.M.; Marinelli, M.; Korpås, M. Which control management strategies are best suited for EV charging stations? A comparison of price optimization and machine-learning approaches [Under review]. IEEE Trans. Transp. Electrif. 2025, in press. [Google Scholar]
  30. Energinet Day-Ahead Spot Prices. 2025. Available online: https://energidataservice.dk/tso-electricity/DayAheadPrices (accessed on 15 September 2025).
  31. Secchi, M.; Zepter, J.M.; Marinelli, M. Centralised Smart EV Charging in PV-Powered Parking Lots: A Techno-Economic Analysis. Smart Cities 2025, 8, 112. [Google Scholar] [CrossRef]
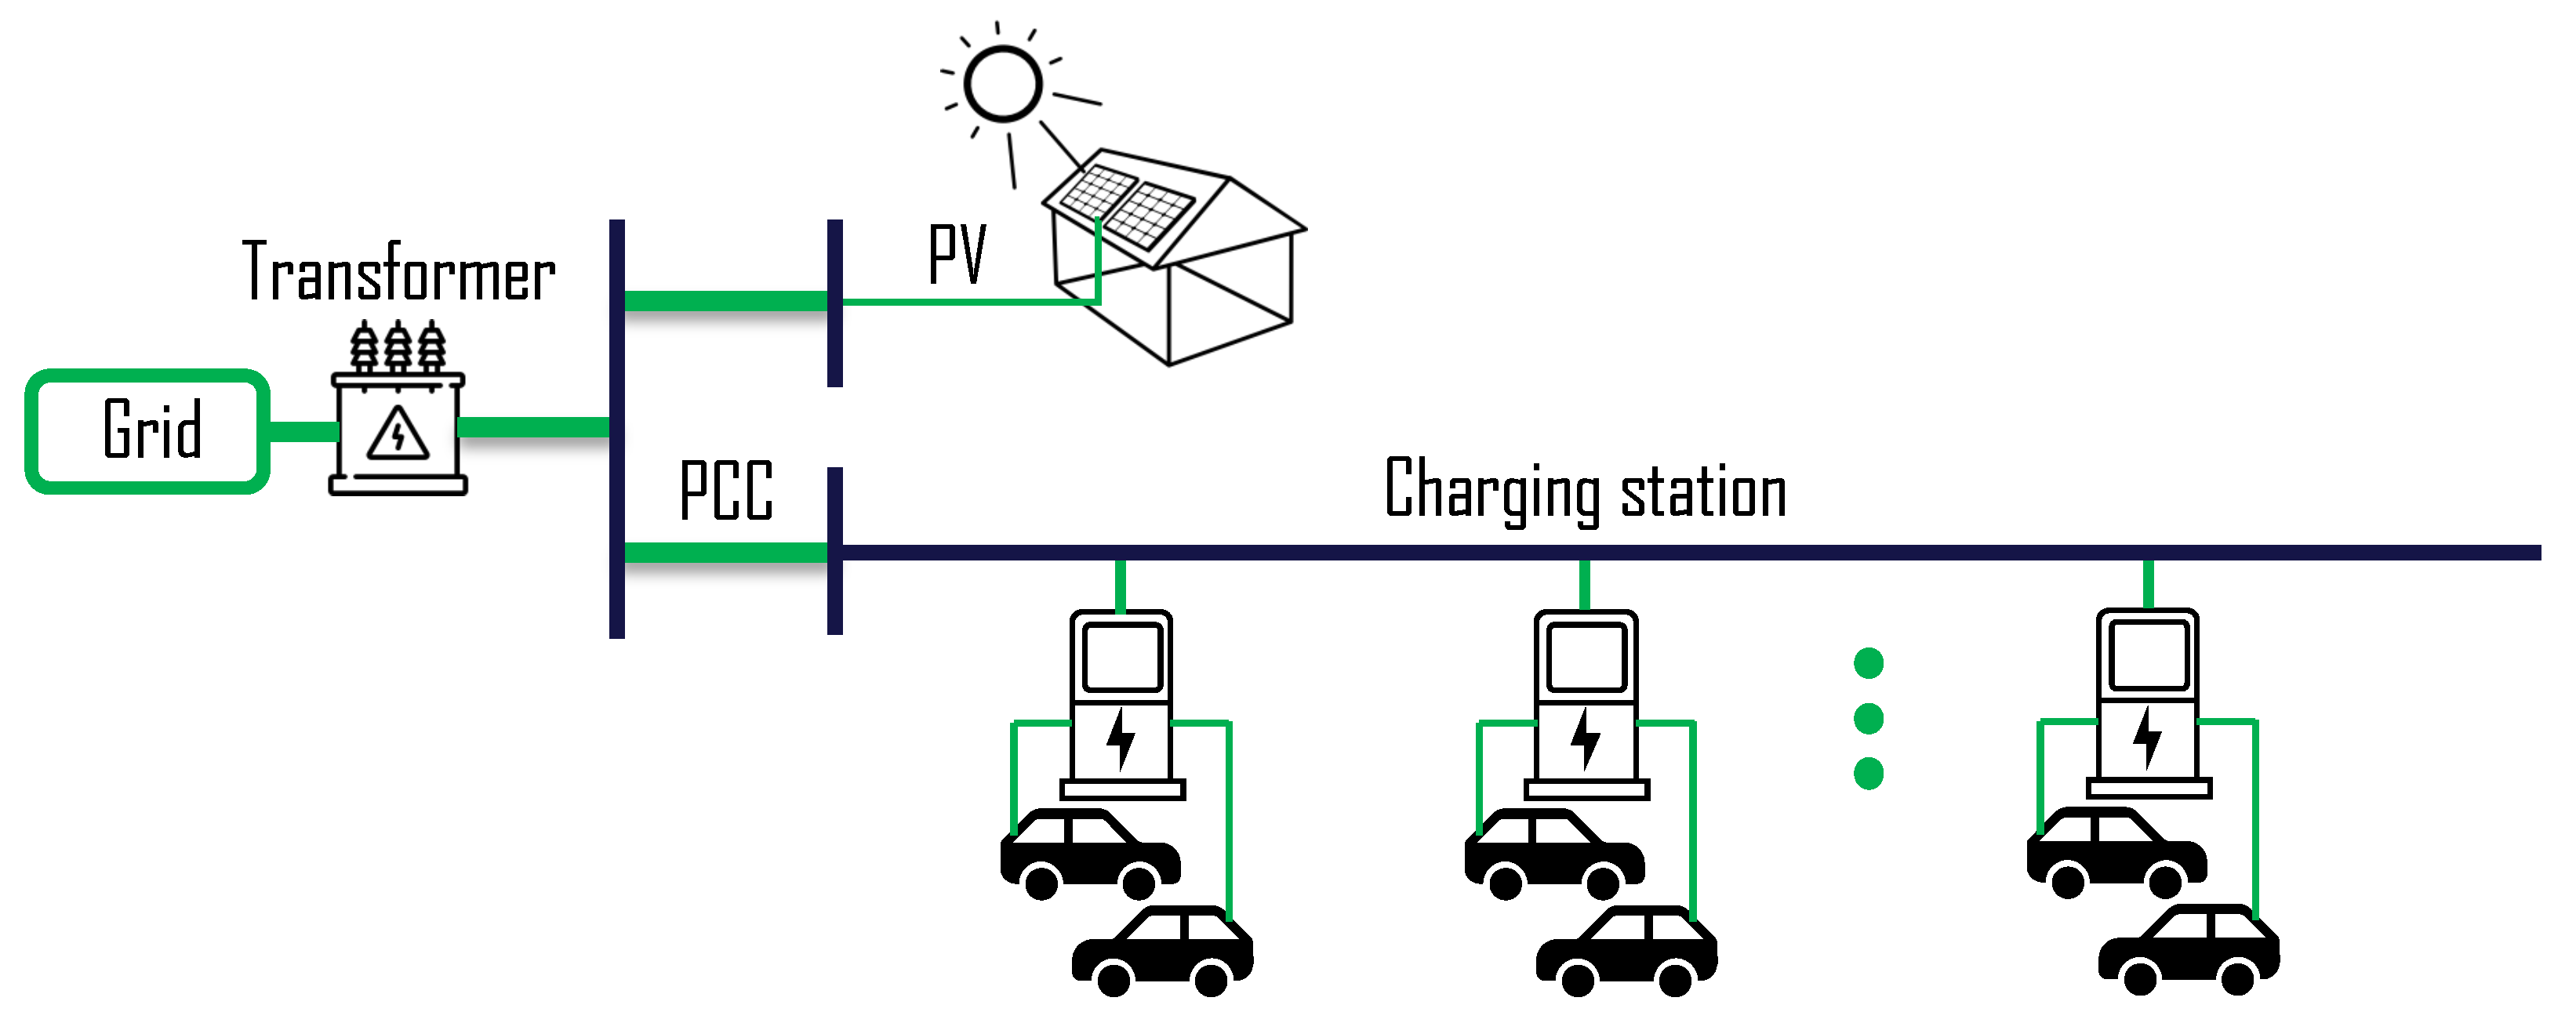
Figure 1. Electrical connection of the charging station setup.
Energies 18 05581 g001
Figure 2. Control architecture overview: two-level control layout.
Energies 18 05581 g002
Figure 3. EV charging station at DTU Risø campus parking lot. (a) Location (source: OpenStreetMap); (b) Charger unit; (c) Parking lot setup.
Energies 18 05581 g003
Figure 4. Control architecture overview: software components and communication links.
Energies 18 05581 g004
Figure 5. (a) Hourly EV presence during the two experimental test days. (b) Requested energy and duration of stay for all EV sessions across both test days.
Energies 18 05581 g005
Figure 6. Upper-level control results for Test Day 1 (a) and Test Day 2 (b). Top plot: power reference signal, available PV generation, and grid connection limit. Bottom plot: total electricity price components, including spot price, DSO tariffs, and Energinet tariffs (TSO tariffs).
Energies 18 05581 g006
Figure 7. Tracking of the upper-level power reference by the aggregated EV charging consumption for Test Day 1 (a) and Test Day 2 (b).
Energies 18 05581 g007
Figure 8. Test Day 1: Correlations between individual EVs’ charging power (top plot) and their priorities (bottom plot) for time 07:00–19:00 (a) and zoomed window 9:50–10:15 (b).
Energies 18 05581 g008
Figure 9. Test Day 2: Correlations between individual EVs’ charging power (top plot) and their priorities (bottom plot) for time 07:00–19:00 (a) and zoomed window 12:00–16:00 (b).
Energies 18 05581 g009
Table 1. Upper-level control initial parameters.
ParameterValue
Horizon (h)6
Step time (min)5
PV (on/off)on
Operational time08:00–18:00
Energy reserve (kWh)215
Minimum power reference (kW)12
Table 2. Charging session summary for Test Day 1 (27 August 2025).
Session IDArrival TimeDeparture TimeExpected Departure TimeDuration [h]Energy Desired [kWh]Energy Charged [kWh]Delivery Rate [%]
EV109:0613:1217:044.112020100.0
EV210:0113:2515:583.401515100.0
EV310:0213:1418:003.212525100.0
EV411:0915:5817:104.813535100.0
EV512:3115:1214:302.691514.9899.8
Table 3. Charging session summary for Test Day 2 (28 August 2025).
Session IDArrival TimeDeparture TimeExpected Departure TimeDuration [h]Energy Desired [kWh]Energy Charged [kWh]Delivery Rate [%]
EV109:4316:3016:006.782524.7398.9
EV215:1901:5918:0010.683022.4074.7
EV309:5615:5415:005.97109.9199.1
EV411:5313:4316:001.831800.0
EV506:4312:3215:305.824034.7786.9
EV613:5015:1815:301.471010100.0
EV711:4915:2016:503.521010100.0
Disclaimer/Publisher’s Note: The statements, opinions and data contained in all publications are solely those of the individual author(s) and contributor(s) and not of MDPI and/or the editor(s). MDPI and/or the editor(s) disclaim responsibility for any injury to people or property resulting from any ideas, methods, instructions or products referred to in the content.