Article

Study on Ultrasonic Phased Array Inspection Method of Crack Defects in Butt Joints of Multi-Layered Steel Vessel for High-Pressure Hydrogen Storage

1
School of Mechanical and Automobile Engineering, South China University of Technology, Guangzhou 510640, China
2
Guangdong Institute of Special Equipment Inspection and Research Foshan Branch, Foshan 528000, China
*
Author to whom correspondence should be addressed.
Energies 2025, 18(20), 5419; https://doi.org/10.3390/en18205419
Submission received: 13 September 2025 / Revised: 7 October 2025 / Accepted: 8 October 2025 / Published: 14 October 2025
(This article belongs to the Special Issue Safety of Hydrogen Energy: Technologies and Applications)

Abstract

The full multilayer high-pressure hydrogen storage vessel plays an important role in hydrogen refueling stations. However, these vessels may fail after a certain period due to crack formation, necessitating periodic inspections. Among the various parts, the butt joints connecting the thick-walled nozzles and hemispherical heads represent critical and challenging areas for inspection. In this study, a one-shot multi-receiver defect detection and localization method is developed based on the ultrasonic phased array method. In order to verify the feasibility of the method, the interaction between the ultrasonic wave and the crack defects at the key position of the butt joint is analyzed based on finite element, enabling the accurate localization of crack tips; an experimental specimen was designed and fabricated, and a corresponding phased array detection test was conducted to validate the method.

1. Introduction

With the increasing global concern about carbon emissions, hydrogen energy is regarded as one of the important choices for a clean energy source [1,2,3,4,5]. The rapid growth of the hydrogen industry depends heavily on advances in storage technology, which is reflected in the growing number of hydrogen refueling stations. Fully multilayered high-pressure hydrogen storage vessels are widely used and play an important role in China’s hydrogen refueling stations [6,7]. Over time, full multi-layer high-pressure hydrogen storage vessels may fail due to cracks and other reasons. Therefore, in order to ensure the safety and stability of fully multi-layered high-pressure hydrogen storage vessels during use, it is necessary to carry out regular inspections and health monitoring, which involves the non-destructive testing of pressure vessels. Different inspection methods are applicable to different vessel structures, and suitable inspection methods should be selected according to the structural characteristics of the vessel.
The butt joint of the thick-walled nozzles and hemispherical head in the full multilayer high-pressure hydrogen storage vessel is a critical and challenging area for inspection; the section diagram of the butt joint is shown in Figure 1. Due to their complex structure and large thickness, if cracks are generated inside the butt joint region during service, a special detection method needs to be developed to locate the defects.
A review of domestic and international research on non-destructive testing (NDT) methods for hydrogen storage containers shows that current efforts are primarily focused on developing specialized testing technologies tailored to specific container types, which is manifested in two aspects: the development of dedicated equipment to meet the specific testing needs of different containers, and the enhancement of detection accuracy based on existing NDT techniques. These two aspects of the research have achieved some progress and have been applied in practical projects, but there are corresponding limitations. Acoustic emission detection technology is generally used for dynamic assessment of damage during the hydraulic test of pressure vessels, which is irreversible and cannot be used for defect detection of butt joints of full multi-layer high-pressure hydrogen storage containers; conventional radiographic inspection technology is generally used for defect detection during the manufacturing stage of containers, such as defects in the raw materials, which is difficult to be applied to the defect detection of the full multi-layer high-pressure hydrogen storage containers after molding [8,9,10,11,12]; eddy current testing is currently limited to assessing raw materials and is not suitable for use after the container has been formed. Additionally, this method imposes strict requirements on both the geometry and electromagnetic properties of the test object, and it can only detect surface-level defects. As such, it is not applicable for inspecting the butt joint structures in fully multilayered high-pressure hydrogen storage vessels [13,14,15,16,17]. In the application of multilayer hydrogen storage vessel inspection, conventional ultrasonic testing techniques present certain limitations. The widely used pulse reflecting technique suffers from limited sound field coverage and insufficiently intuitive imaging [18]. Time of flight diffraction technique is susceptible to noise interference and lacks the ability to directly reconstruct defect morphology [19]. Phased array ultrasonic testing (PAUT) is an innovation and improvement developed on the basis of conventional ultrasonic testing. Therefore, it not only retains the advantages of traditional ultrasonic testing, but also extends its applicability to the inspection of more complex structures [20]. The most significant difference between PAUT and conventional ultrasonic testing lies in the probe design. By varying the arrangement of elements and precisely controlling the excitation timing of each element, PAUT enables the ultrasonic beam to be focused and steered within the inspected object, thereby achieving multiple forms of inspection. Nardo et al. developed an optimized phased array ultrasonic testing (PAUT) technique for the detection and sizing of hydrogen-induced cracking (HIC) type defects [21]. De Zuniga et al. developed an ultrasonic phased array signal filtering system for thick austenitic stainless steel, which enables the selection of effective and usable weld inspection information, thereby improving the efficiency of ultrasonic phased array testing [22]. Yin et al. developed a novel flexible ultrasonic phased array probe, which can be applied to inspection of objects with complex curved surfaces, and experimentally verified the effectiveness of this probe for imaging [23].
When using ultrasonic technology to detect the butt joints of hydrogen storage containers, due to the special characteristics of the container structure, it is necessary to extend the phased array probe into the inner wall surface of the nozzles for detection [24]. Several challenges are encountered during actual inspection. The distance between the acoustic excitation point and the target inspection area ranges from 100 mm to 120 mm, making defect detection and localization difficult; compared to conventional welds, butt joints have a more complex structure and a significantly thicker cross-section; the sound wave in the austenitic stainless steel attenuation is serious, affecting defect localization When the ultrasonic phased array inspection technology is applied to the inspection of butt joints of hydrogen storage vessels, no relevant research has been carried out for the crack defects in the critical positions of butt joints of hydrogen storage vessels. At the same time, due to the special characteristics of the structure of the full-multilayer high-pressure hydrogen storage vessel, it is difficult for the existing conventional phased array inspection technology to solve the problem of detecting such defects, especially at the service stage.
Therefore, this study developed a one-shot multi-receiver defect detection and localization method, based on finite element analysis of the interaction between ultrasonic waves and crack defects at key locations of butt joints, to achieve the localization of crack endpoints. Based on the experimental test blocks designed and fabricated, corresponding phased-array detection tests were carried out to validate the feasibility of the detection method.

2. One-Shot, Multi-Receiver Defect Location Method

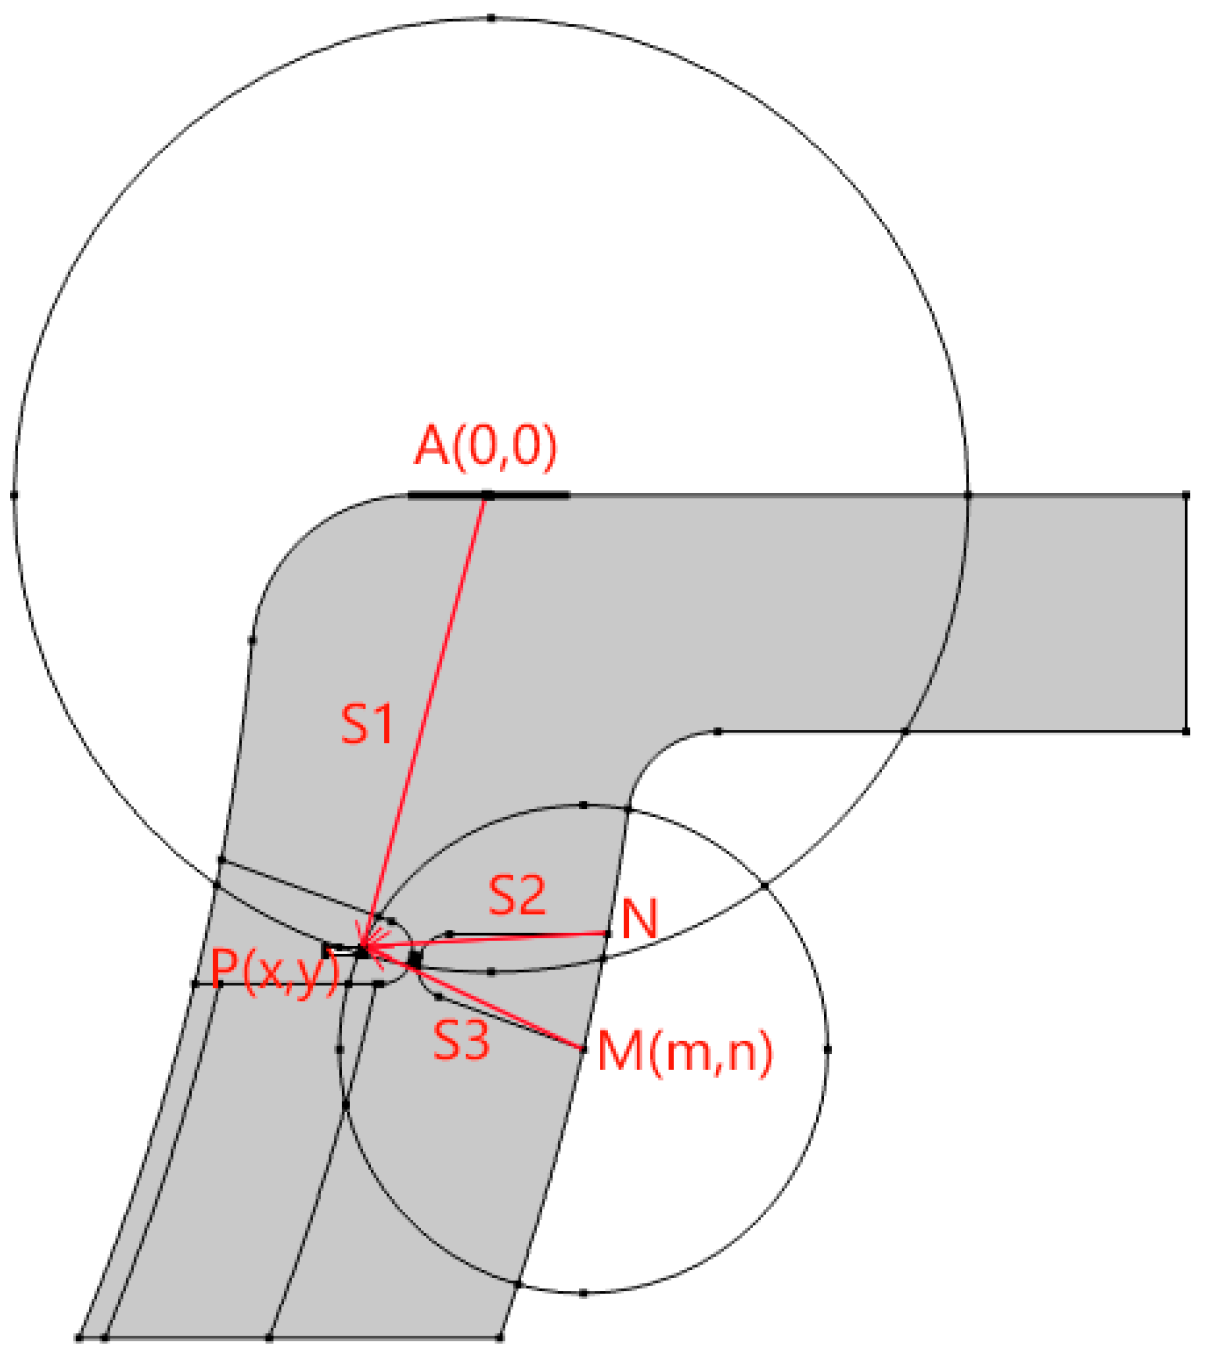
The hydrogen storage vessel head is made of austenitic stainless steel welded to Q345R, and the part to be inspected is the butt joint area with double U-bevels. It is known from previous studies that austenitic stainless steel has coarse grains and high acoustic attenuation coefficients, and the high attenuation, as well as the coarse grains, lead to more scattering. Therefore, a custom-made curved surface-coupled phased-array probe is placed on the inside of the nozzles, at point A as shown in Figure 2, to achieve focusing and at the same time, a large-angle deflection can be realized without moving the probe, which can cover the whole area of the weld seam under this cross-section, in order to satisfy the detection demand in the radial direction. The surface-coupled phased array probe is placed on the inner surface of the nozzles as the transmitting and receiving probes, and is located in the deepest part where good coupling can be achieved; the second receiving probe is placed on the outer surface of the nozzles, between the surfaces MN, and the two points M and N are the two limit positions in this area. The surface-coupled phased array probe emits longitudinal waves on the inside of the nozzles, and waveform conversion occurs at the weld seam and defects, generating reflected and transmitted waves, which propagate to the surface-coupled phased array probe and the receiving probe located on the outside wall of the nozzles, and are received by the two probes. In the transmission and reception process, the acoustic wave travelled as shown in Figure 2, the acoustic wave starts from point A and propagates to the defect at point P with a travel distance of S1, and then the defect echo propagates to the receiving probe with a travel distance of S1, S2 and S3, respectively, of which S2 and S3 are the travel distance of the defect echo propagating to the two limit positions.
From the A-sweep signal integration of the synthetic acoustic beam, the waveforms of the excitation signal, the structural echo and the defect echo can be identified. Based on the time difference between the defect echo and the excitation signal, the distance S1 travelled by the excited ultrasonic wave propagating in the structure and returning from the defects to be picked up by the boundary probe can be calculated, and based on this distance, it can be determined that the defects are located in the circumference of a circle with the center point of the boundary probe as the center and S1 as the radius of the circle. Similarly, according to the point probe data can be determined to point probe position as the center of the circle, and the intersection of the two circles is the location of the defect. The key to the positioning of defects in the determination of ultrasonic propagation time, this paper through the excitation signal and defects in the peak echo point detection time value to determine.
The excitation and receiving probe center point A as the coordinate origin (0, 0), so the relative position of the second receiving probe M point is also determined, set to (m, n), defect point P is set to (x, y), so there are Equations (1) and (2):
S 1 = x 2 + y 2
S 2 = x - m 2 + y - n 2
The calculated distance S1 of the excited ultrasonic wave propagating in the structure and returning to the boundary probe when encountering the defect, and the distance S2 of the ultrasonic wave reflected from the defect to the point probe are, respectively, substituted into Formulas (1) and (2). The coordinates (m, n) of the point probe are known values, and the horizontal and vertical coordinate values of the defect point P can be solved by simultaneously establishing two binary equations.
The one-shot, multi-receiver defect location method places two receiving probes on the outer surface of the butt joint of a full multi-layer hydrogen storage vessel. In practical inspection applications, this method is relatively easy to implement without causing damage to the vessel itself. Moreover, processing the ultrasonic signals received by multiple probes enables more precise localization of defects.

3. Results of Phased Array Inspection of Butt Joints

3.1. Experimental System

In order to validate the one-shot multi-receiver defect detection method in Section 2, an ultrasonic phased array experiment was carried out. The ultrasonic phased array system used in this study consists of the following components: CTS-PA22T1 phased array total focus imaging system: pulse generator transmit voltage is a bipolar square wave, the range of 45–100 V, step 1.0 V, 10.0 V, pulse width range of 10–600 ns, step 1.0 ns, 10.0 ns; receiver bandwidth range of 0.5–19 MHz, gain range of 0–55 dB, step 1.0 dB, step 1.0–10.0 dB; 64-array transducer: the center frequency of the array element is 5 MHz, the center distance of the array element is 0.6mm, and the length of each array element is 10 mm. CTS-PA22T1 is used to calculate the focusing law, and a customized phased array probe is connected to CTS-PA22T1 to excite and receive ultrasonic waves.
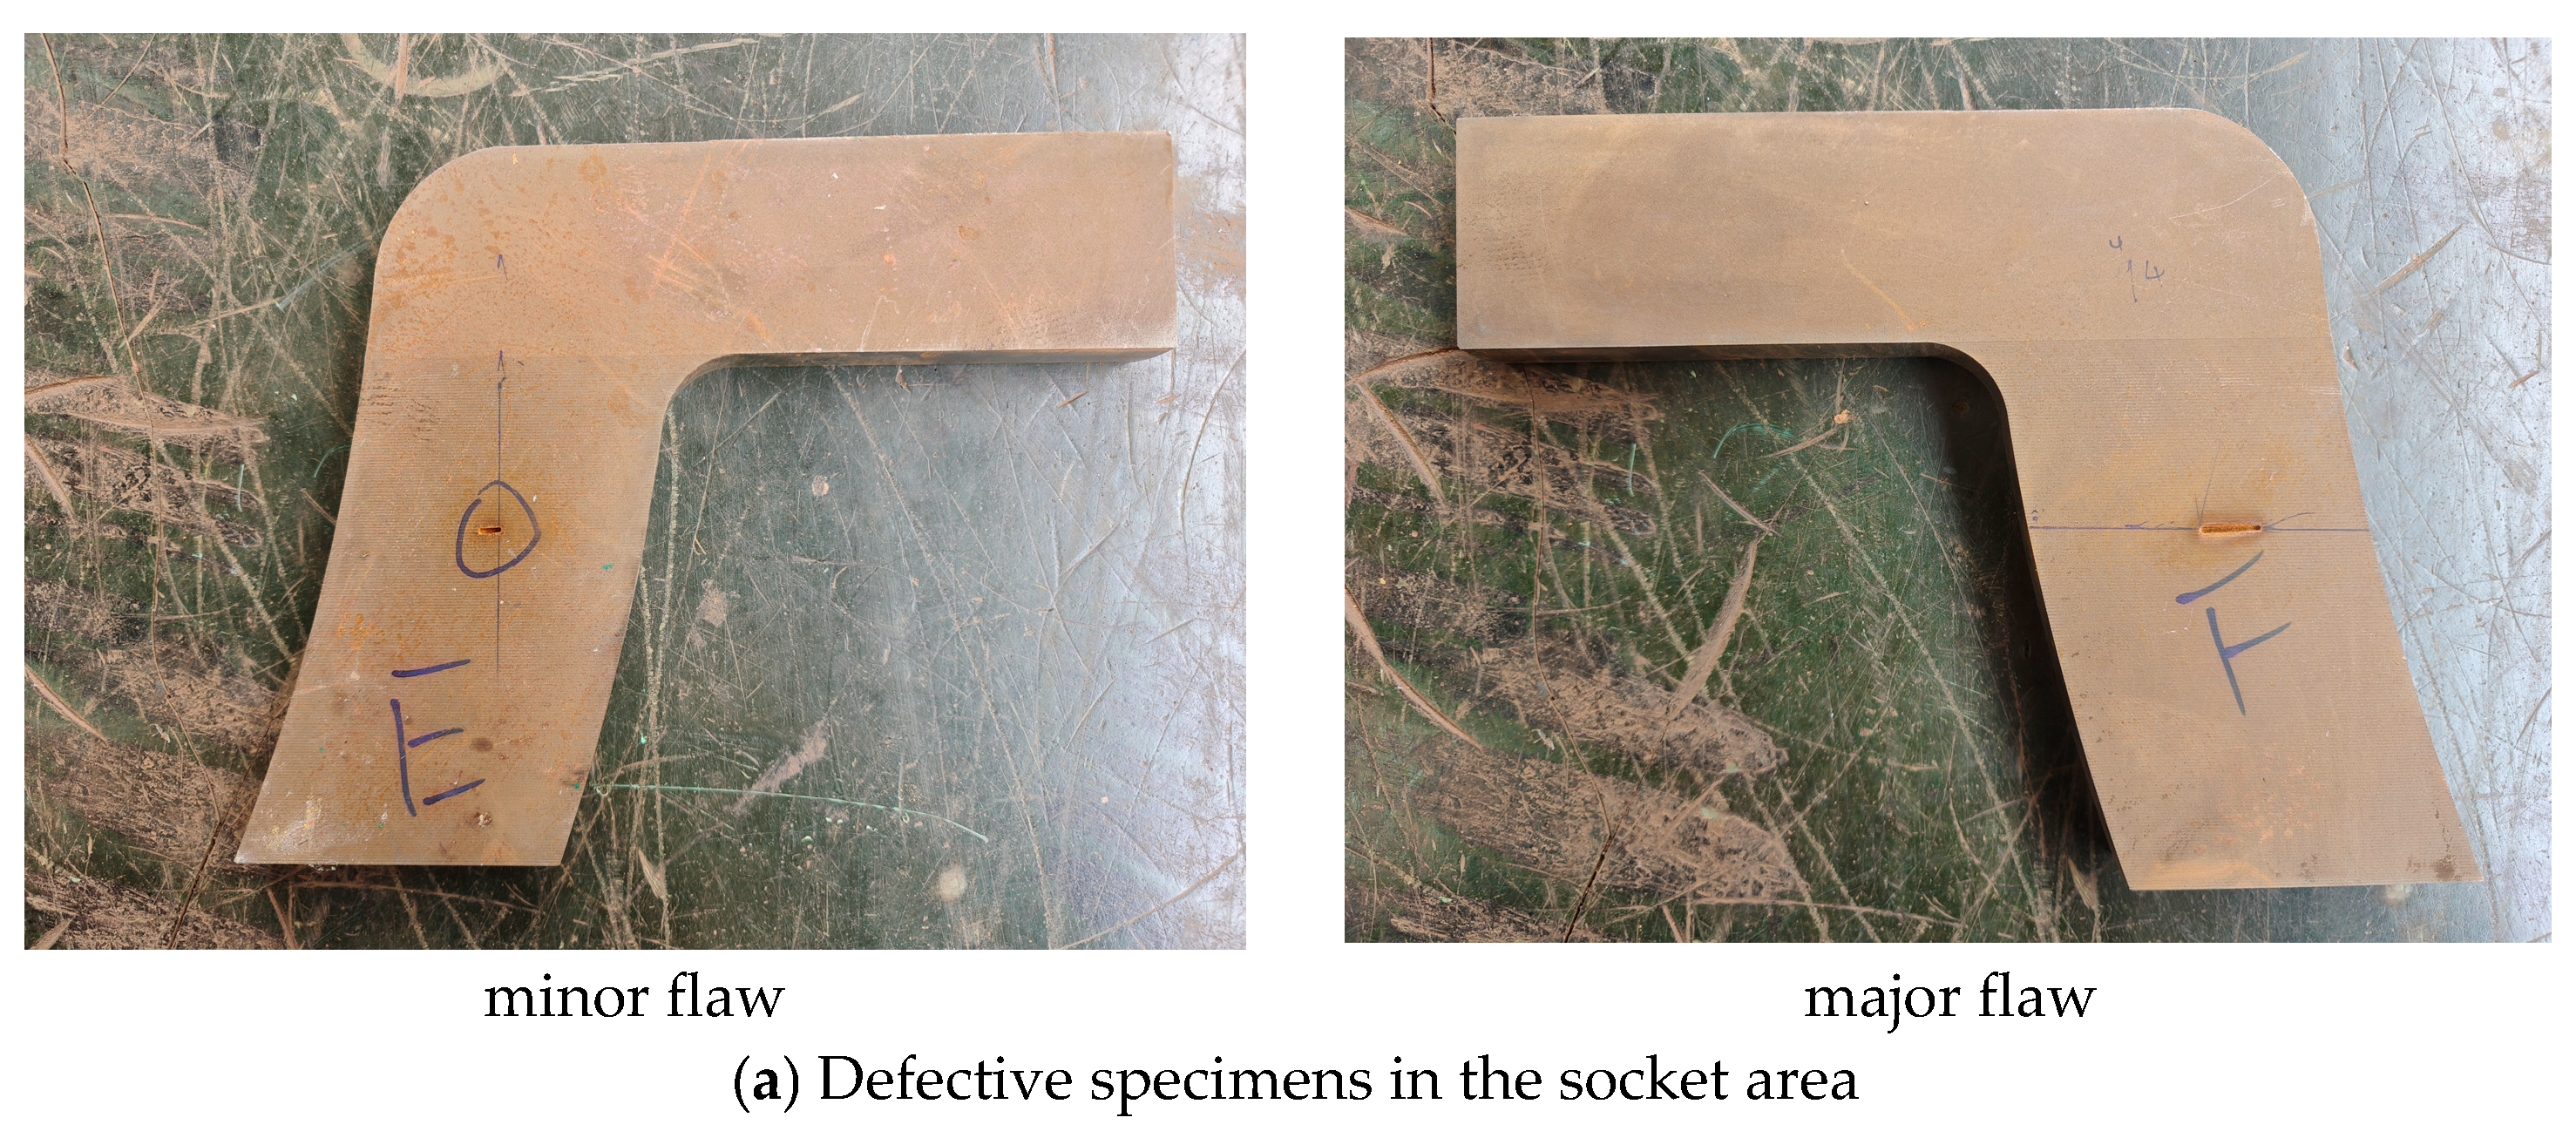
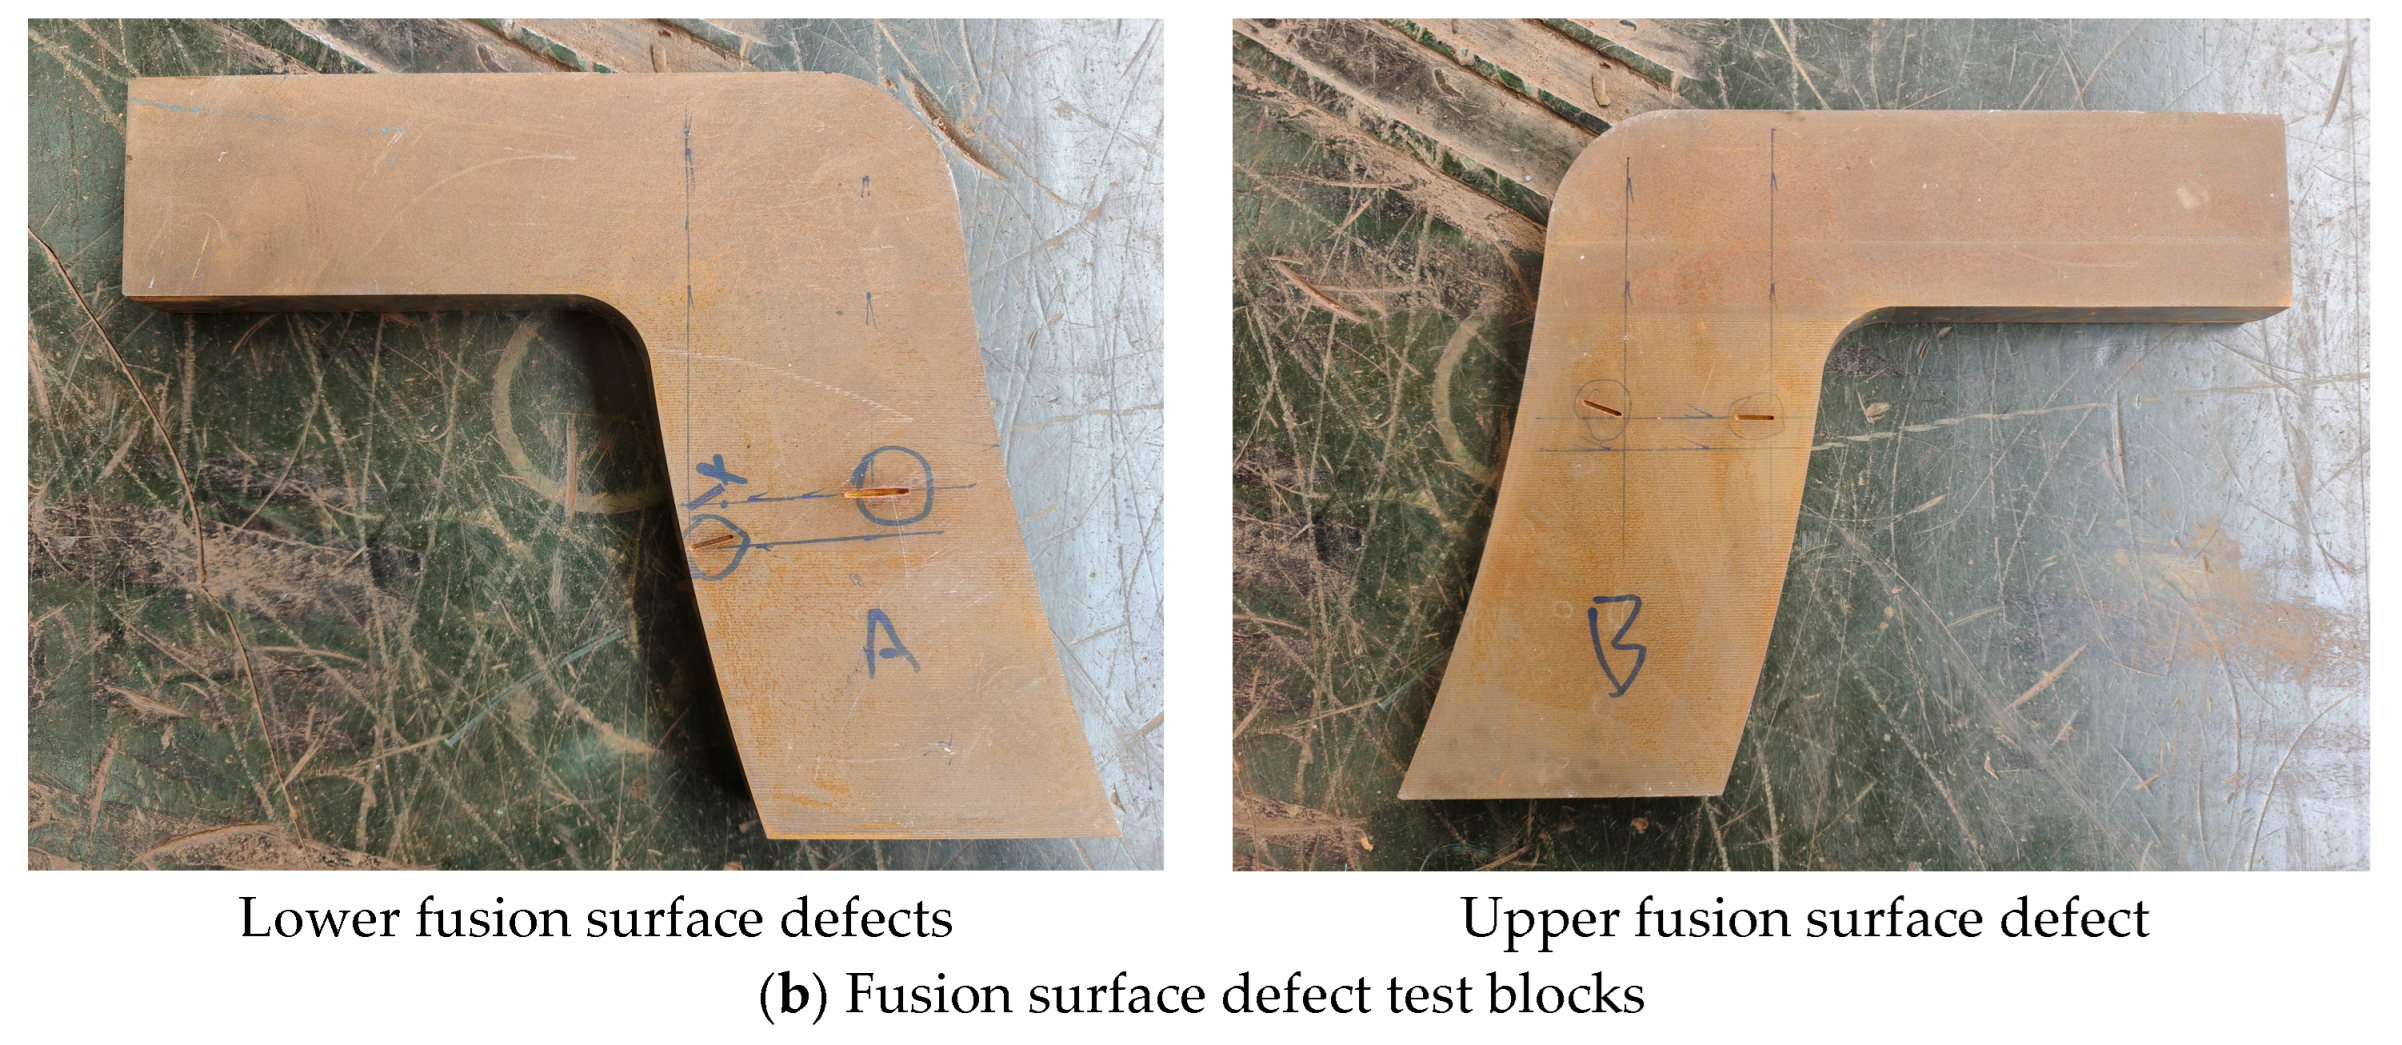
The comparison test block is shown in Figure 3. In hydrogen storage vessels, the “socket area” refers to the region where multilayer heads are welded together. If cracks form near this area, they are typically caused by interactions between adjacent layers. If a crack occurs in the vicinity of the casing area (the multi-layer head is welded together, so it is called casing area), it is impossible to tell whether it is the signal reflected from the delamination or the signal reflected from the defect due to the influence of the layers. Therefore the cracks of different lengths are set on both sides of the test block, with length × width × depth of 5 mm × 1 mm × 8 mm and 15 mm × 1 mm × 8 mm, respectively, and the physical figure is shown in Figure 3a; service-induced defects are also prone to occur in the vicinity of the fusion surface of the butt joints of the hydrogen storage vessel, and so artificial defects are processed in the other test block, and two faceted crack defects are set up in the vicinity of the upper and lower fusion surface, each taking into account the angle of the defects with the detection surface as well as the depth of the defects. A total of four faceted crack defects (10 mm × 1 mm × 8 mm) were machined—two near the upper fusion surface and two near the lower fusion surface. Their specific locations are illustrated in Figure 3b.

3.2. Detection Results of Crack Defects in the Socket Area

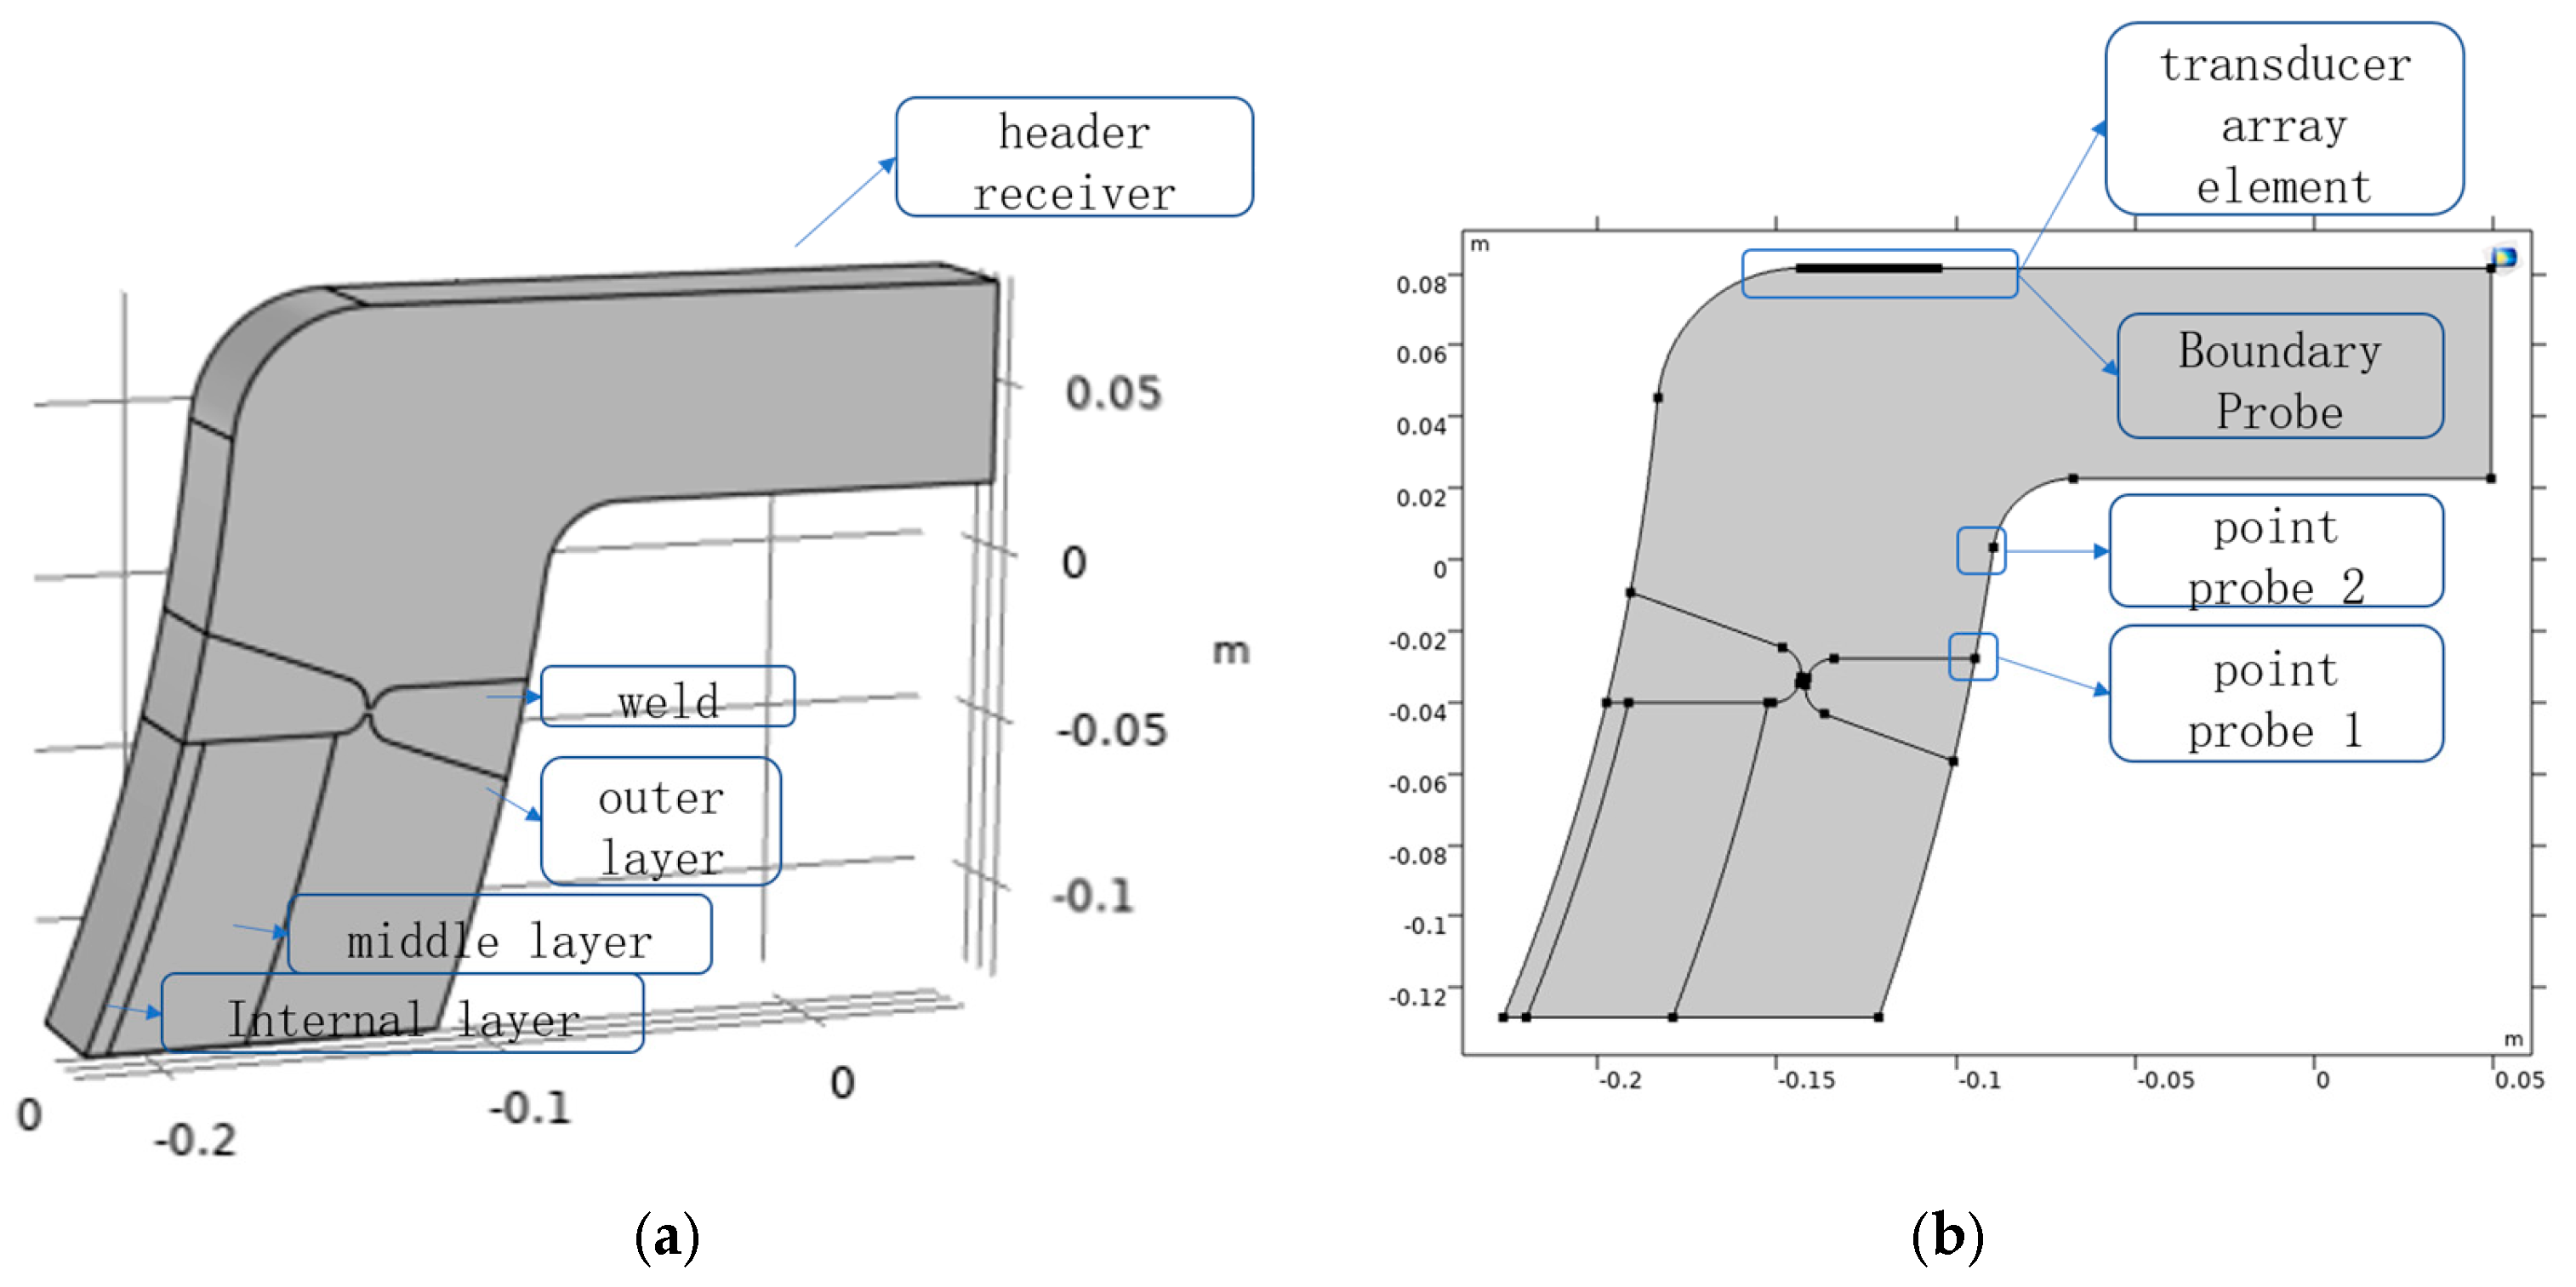
Based on the spatial configuration of the phased array probe and the simulated test block of the multilayer butt joint, a 1:1 two-dimensional model of the hydrogen storage vessel’s butt joint was developed, along with a corresponding ultrasonic phased array focusing model. The receiving probes were simulated by placing both boundary and point probes on the surface of the model. Point Probe 1 and Point Probe 2 represent the two boundary positions on the vessel’s outer surface, used to capture both the direct wave and reflected echo signals. The collected direct and reflected wave signals are analyzed to localize the defects, as illustrated in Figure 4. Since the array elements of the ultrasonic phased array transducer are arranged in a one-dimensional linear configuration, the probe can be considered to perform inspection on the cross-section of the vessel. Therefore, a two-dimensional simulation of a selected cross-section of the model is conducted in order to improve computational efficiency, and the phased array elements and boundary probe are replaced by a solid line of the same length as the width of the phased array element and the spacing of the array element, and the same Gaussian-window-modulated sinusoidal function is applied to the solid line. The expression is given by Equation (3). When the beam is not deflected, each array element is sequentially excited based on the delay times shown in Figure 5, allowing the emitted ultrasonic waves to focus within the structure.
Y = 10 - 6 exp - t - 2 T 0 2 0.5 T 0 2 ×   sin ( 2 π f 0 t )

3.2.1. Acoustic Field Simulation of Small Defects in the Socket Area

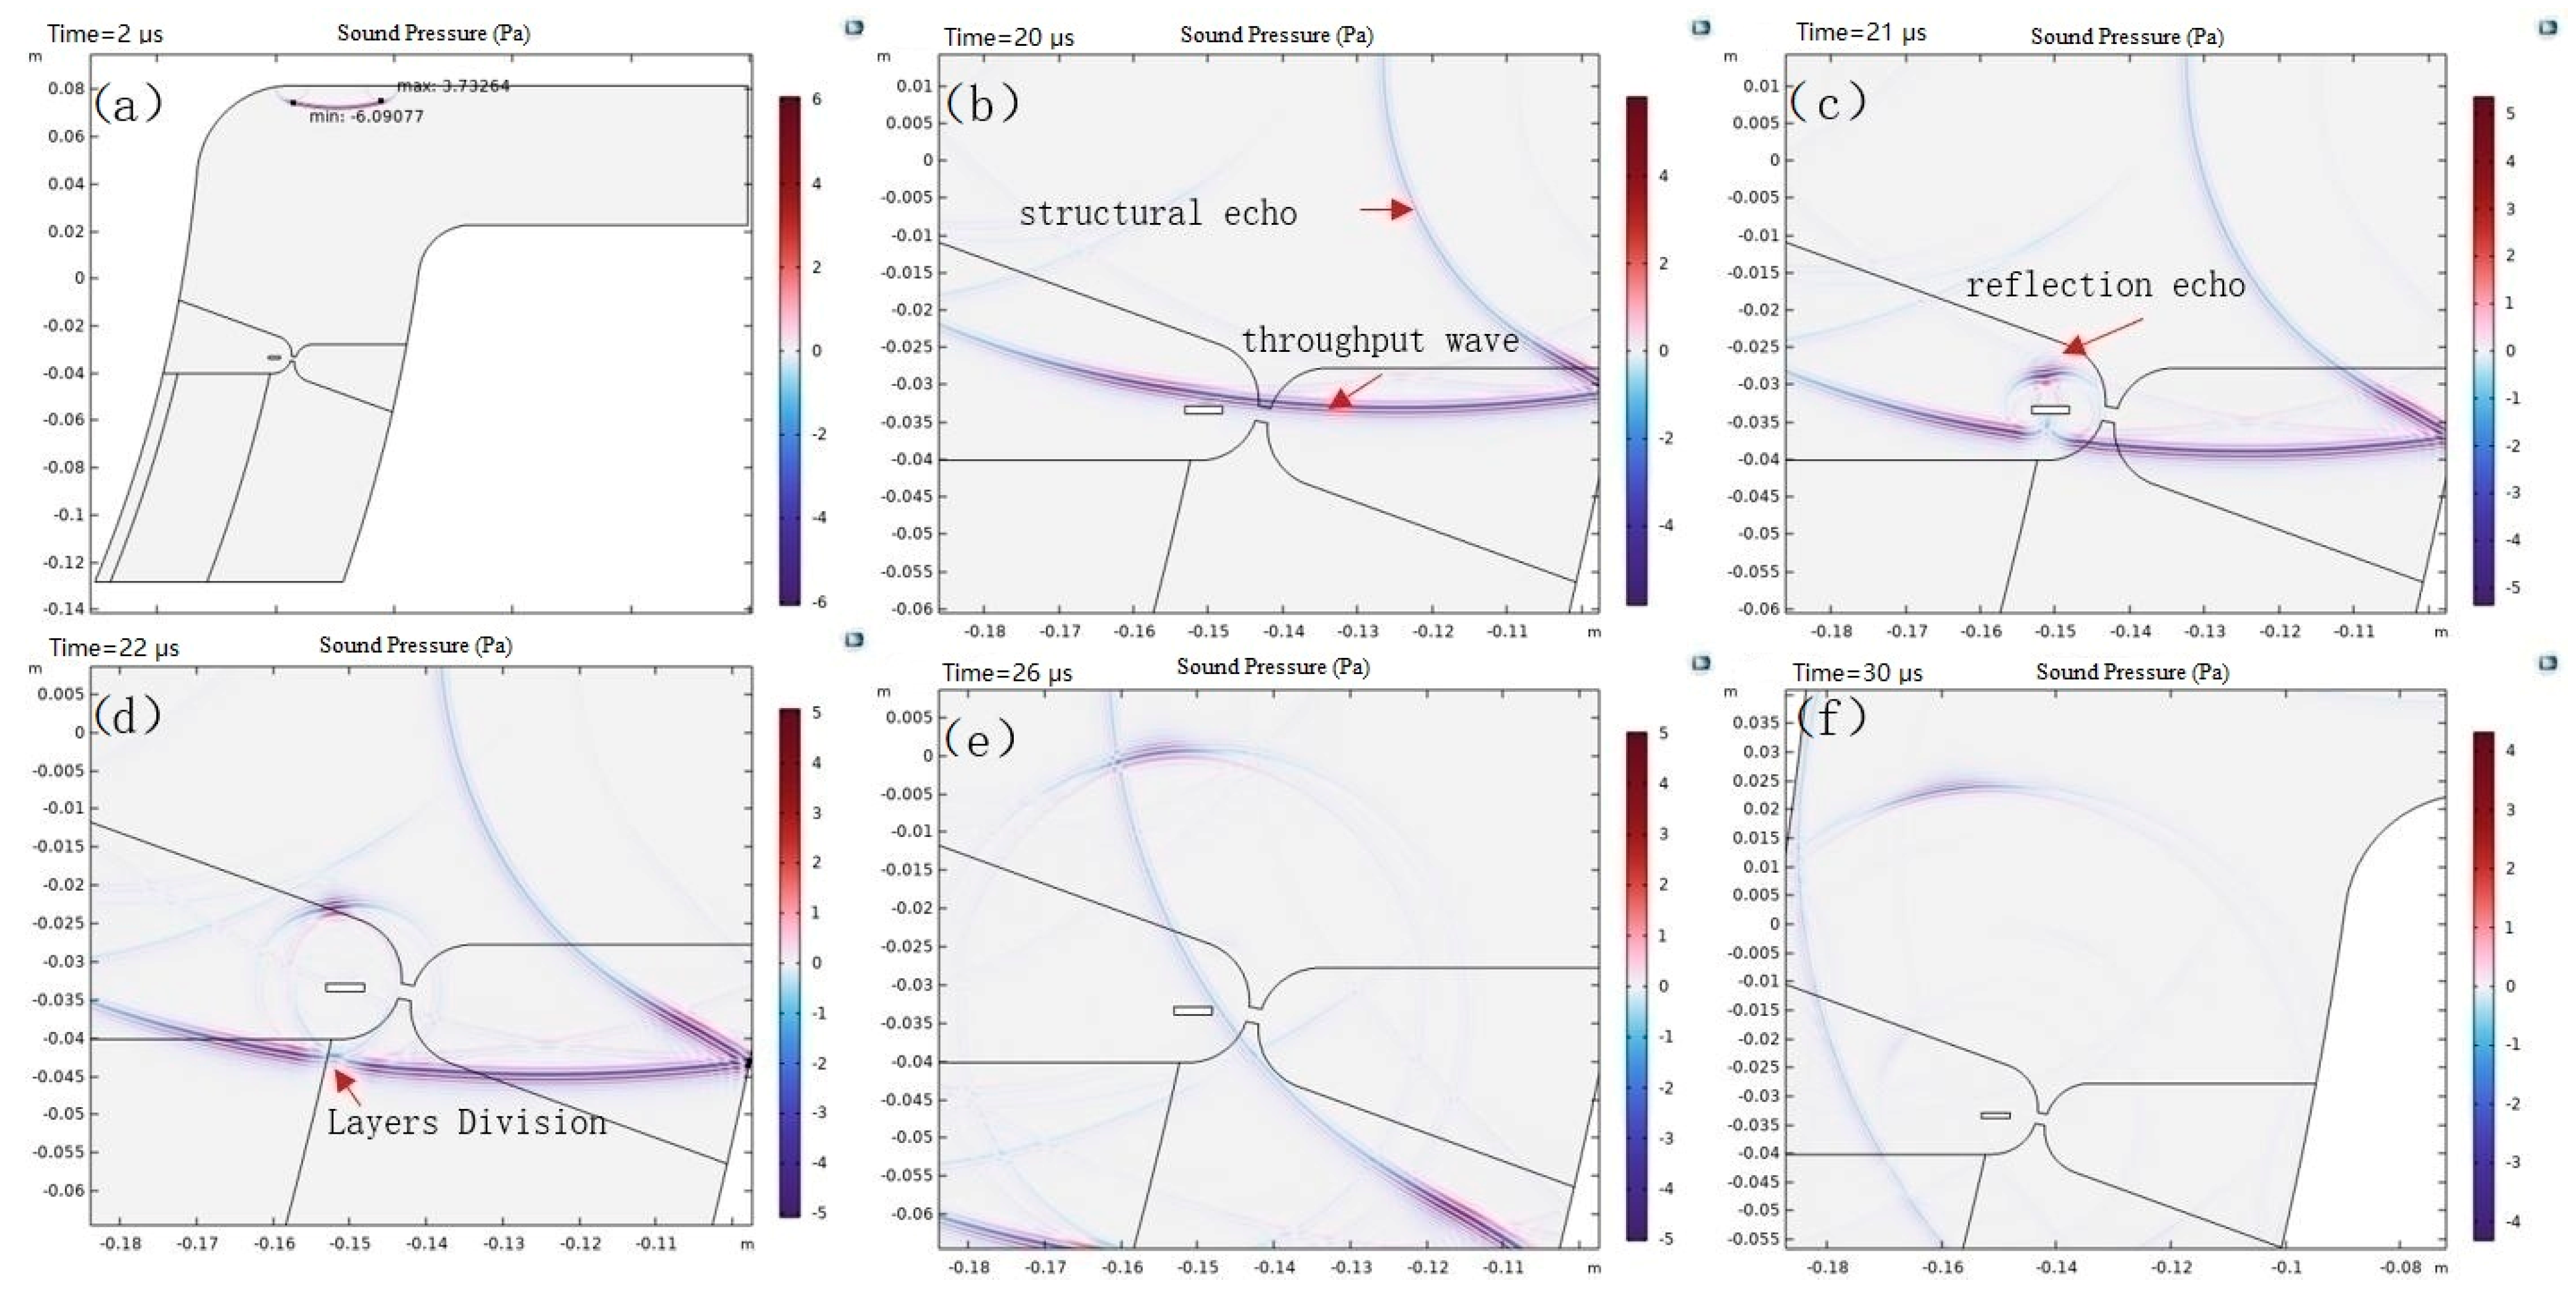
In order to observe the ultrasonic propagation inside the structure, the ultrasonic propagation images at different time nodes during the transient simulation were intercepted. Figure 6 shows the simulation results of the small crack defect in the casing area. The interaction between the phased-array acoustic beam and the crack defect is clearly visualized in real time. The images provide an intuitive and accurate representation of the wave behavior. Figure 6a shows the moment when the acoustic wave begins to converge. Figure 6b captures the wave just before it interacts with the crack, where internal structural echoes are visible; Figure 6c is the moment when the acoustic wave has been reflected at the defect, and the propagation direction and the phase of the reflected wave have been changed. Figure 6d–f show that the reflected wave does not propagate vertically upward but rather at an angle. This angle aligns with the normal direction of the defect surface, which is due to the fact that the incident ultrasonic beam is not perpendicular to the defect face. This is because the propagation direction of the ultrasonic beam is not perpendicular to the reflection surface of the defect, but exists at a certain angle; in addition, it can also be seen from Figure 6c, due to the existence of the two end angles of the crack, end-angle diffraction occurs at the end angle, and the diffracted echoes propagate to the two sides and are picked up by the setup point probe. Because the diffracted echoes originate from different locations, they arrive at the point probes at slightly different times. Due to the difference in the excitation position of the two diffracted echoes, there is also a difference in the time to reach the point probe, and the distance between the two end corners of the defect, i.e., the length of the defect, can be determined by the time difference.

3.2.2. Acoustic Field Simulation of Large Defects in the Socket Area

Similarly, Figure 7 shows the simulation results for a large crack defect in the casing area, clearly illustrating its interaction with the phased-array ultrasonic beam. Figure 7a shows the moment when the acoustic beam first makes contact with the right tip of the defect; it can be seen that the propagation direction of the reflected echo is the same as that of the reflected echo from the small crack defect in Figure 7b, but the energy is more concentrated and the amplitude is higher. This is because the defect reflective surface is larger and more sound waves are reflected, and it can also be seen that the sound waves at the delamination are less than those of the small crack defects at the corresponding positions, which proves that the signals generated by the large defects in the socket area are easier to distinguish from those generated by the delamination when performing the discrimination of the defects. From Figure 7c,d, it can be observed that, compared with small crack defects, the time difference between the diffraction echoes at both ends of large crack defects is greater. This is because, as the crack defect increases in size, the propagation path of the diffraction echoes from the two crack tips to the probe becomes longer.

3.2.3. Defect Localization Simulation in the Socket Area

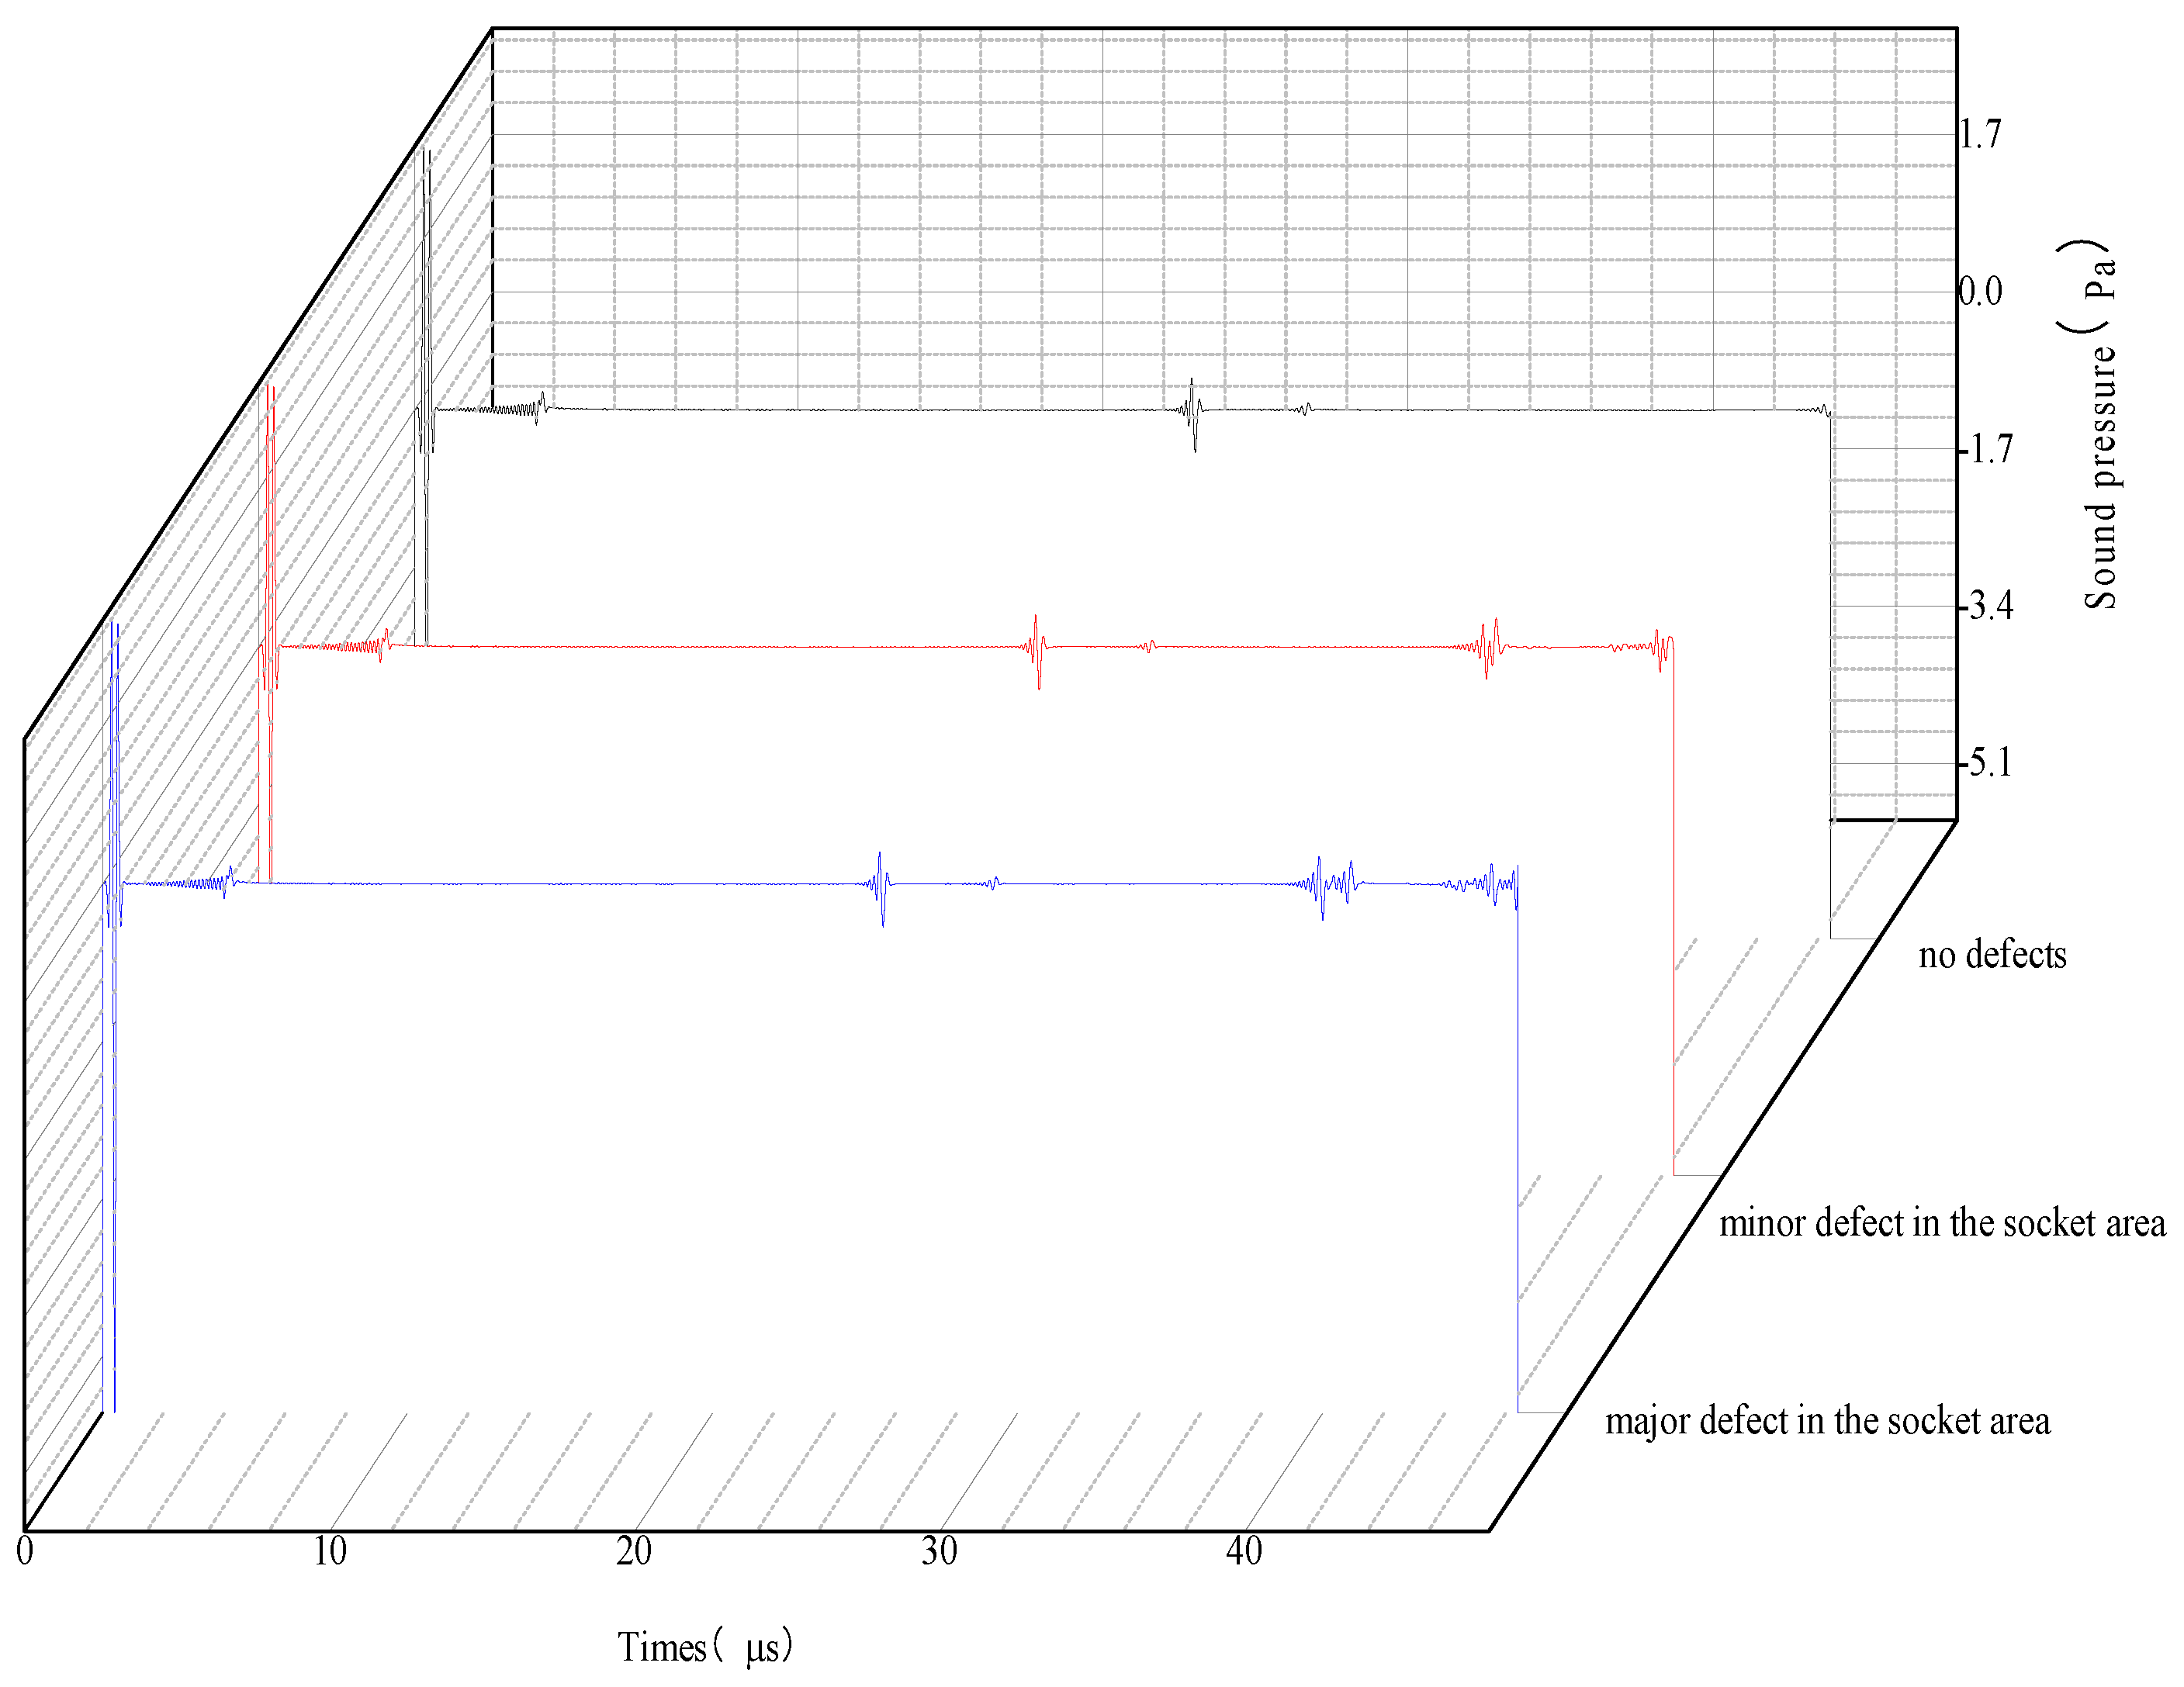
Figure 8 presents the A-scan signals received by the boundary probe when the synthetic acoustic beam encounters defects of various sizes in the socket area. These signals are compared with those obtained from a defect-free model. In the A-scan plots, the horizontal axis represents the wave travel time through the structure, while the vertical axis indicates the acoustic pressure amplitude.
Figure 8 shows that the amplitude of defect echoes received by the boundary probe is higher for large defects in the socket area than for small ones. This observation supports the earlier conclusion that larger reflective surfaces produce stronger acoustic wave reflections with higher energy.
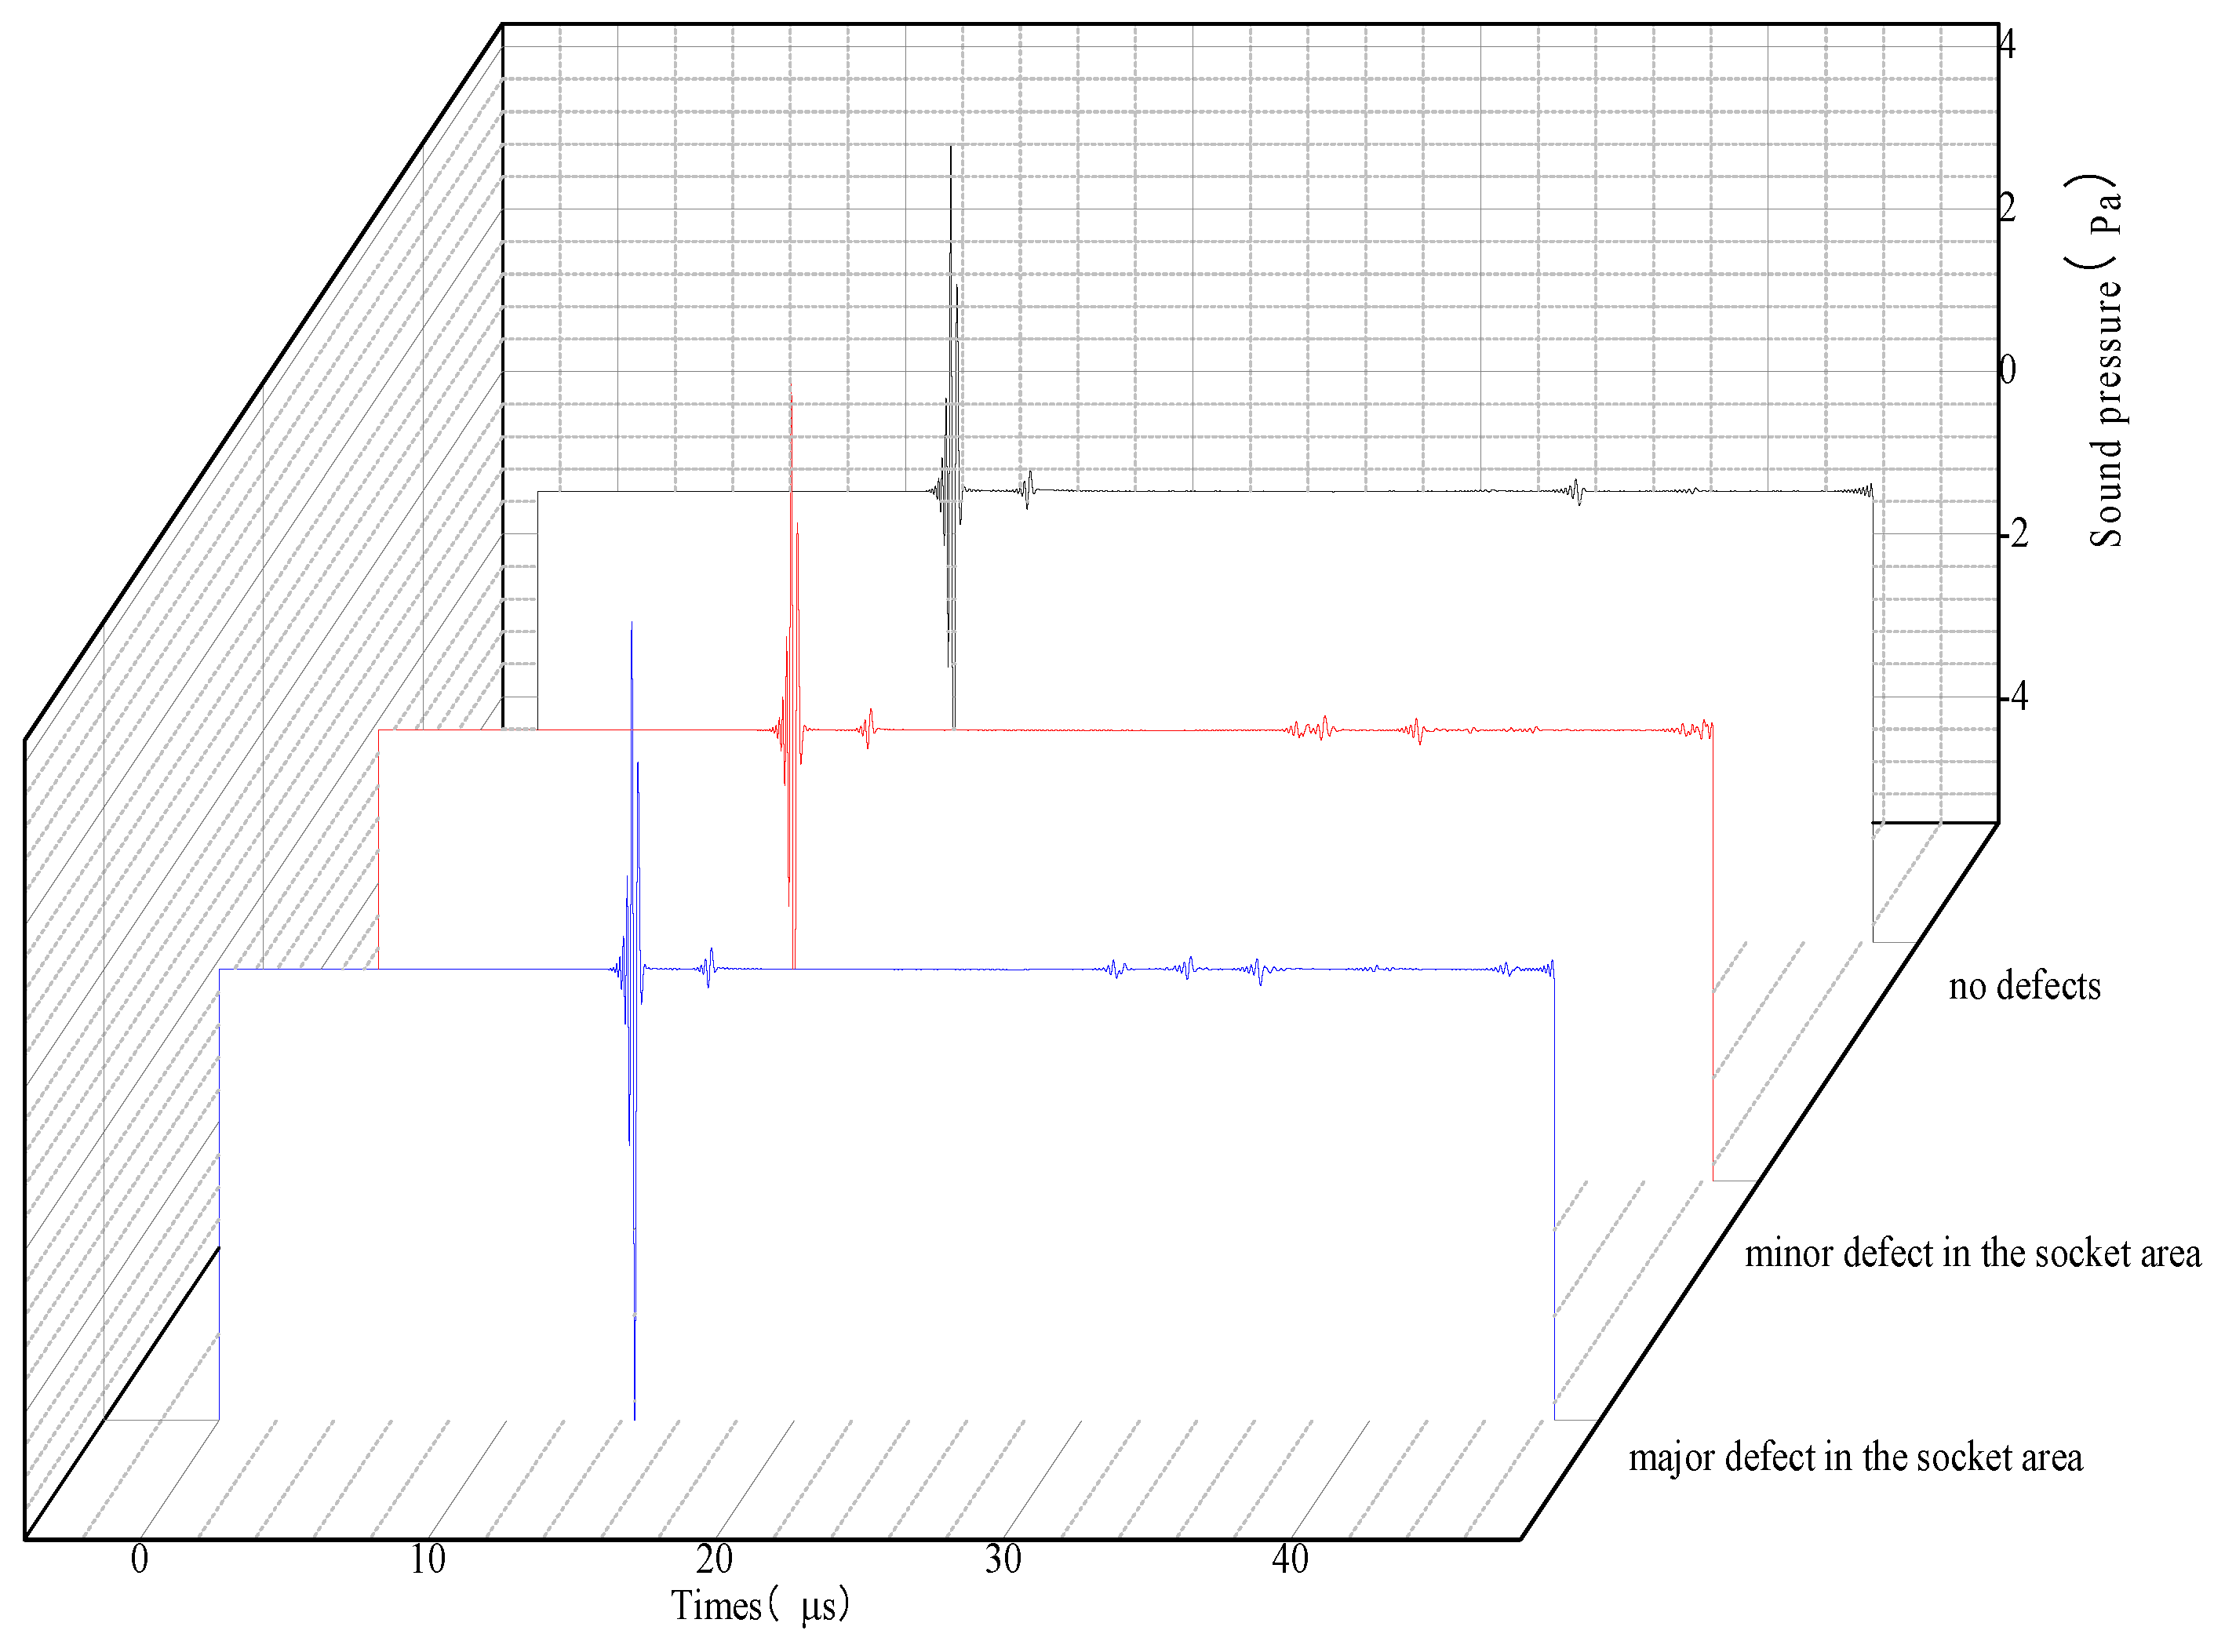
The A-scan signal received by point probe 1 is shown in Figure 9, and the difference between the A-scan signal when there are no defects and the A-scan signal when there is a defect lies in what is shown in the highlighted area, i.e., the two end-angle diffraction echoes of the defect. From the figure, it can be clearly seen that two poles appear in the end angle diffraction echo, and these two poles are closer together in the A-scan signal of a small defect in the socket area, while the two end angle diffraction echoes are farther apart in the A-scan signal of a large defect in the socket area. Similarly, the A-sweep signals collected by point probe 2 are shown in Figure 10, and a comparison of Figure 9 and Figure 10 shows that point probe 2 receives the straight-through wave earlier than point probe 1, whereas point probe 2 receives the two end-point diffracted echoes of the defects later than point probe 1, which is due to the fact that the distance of the acoustic wave that propagates to point probe 2 after being reflected by the defects is farther than that of the distance that propagates to point probe 1.
With the boundary probe data as well as the point probe 1 or 2 data, the localization of defects can be achieved, and the results are shown in Table 1 and Table 2.
By comparing the positioning results in Table 1 and Table 2, it can be seen that the simulated positioning results of the right endpoint are more in line with the standard results, but there is a large error in the positioning results of the left endpoint, especially the positioning results of the left endpoint of the large defect. This is due to the fact that the end angle diffraction generated by the left end point of the defect propagates over a longer distance in the structure, and at the same time, the end angle diffraction also passes through the joint surface of the nozzles and the weld, leading to an increase in the error in the positioning of the left end point. Comparing the positioning results of point probe 1 and point probe 2, it can be seen that for both large and small defects, the results calculated from the data collected by point probe 2 are more accurate and have a smaller error, so that when placing the receiving probe, it is more favorable for the detection of defects in the socketed area when placed close to point probe 2.

3.2.4. Defect Localization Through Experimentation in the Socket Area

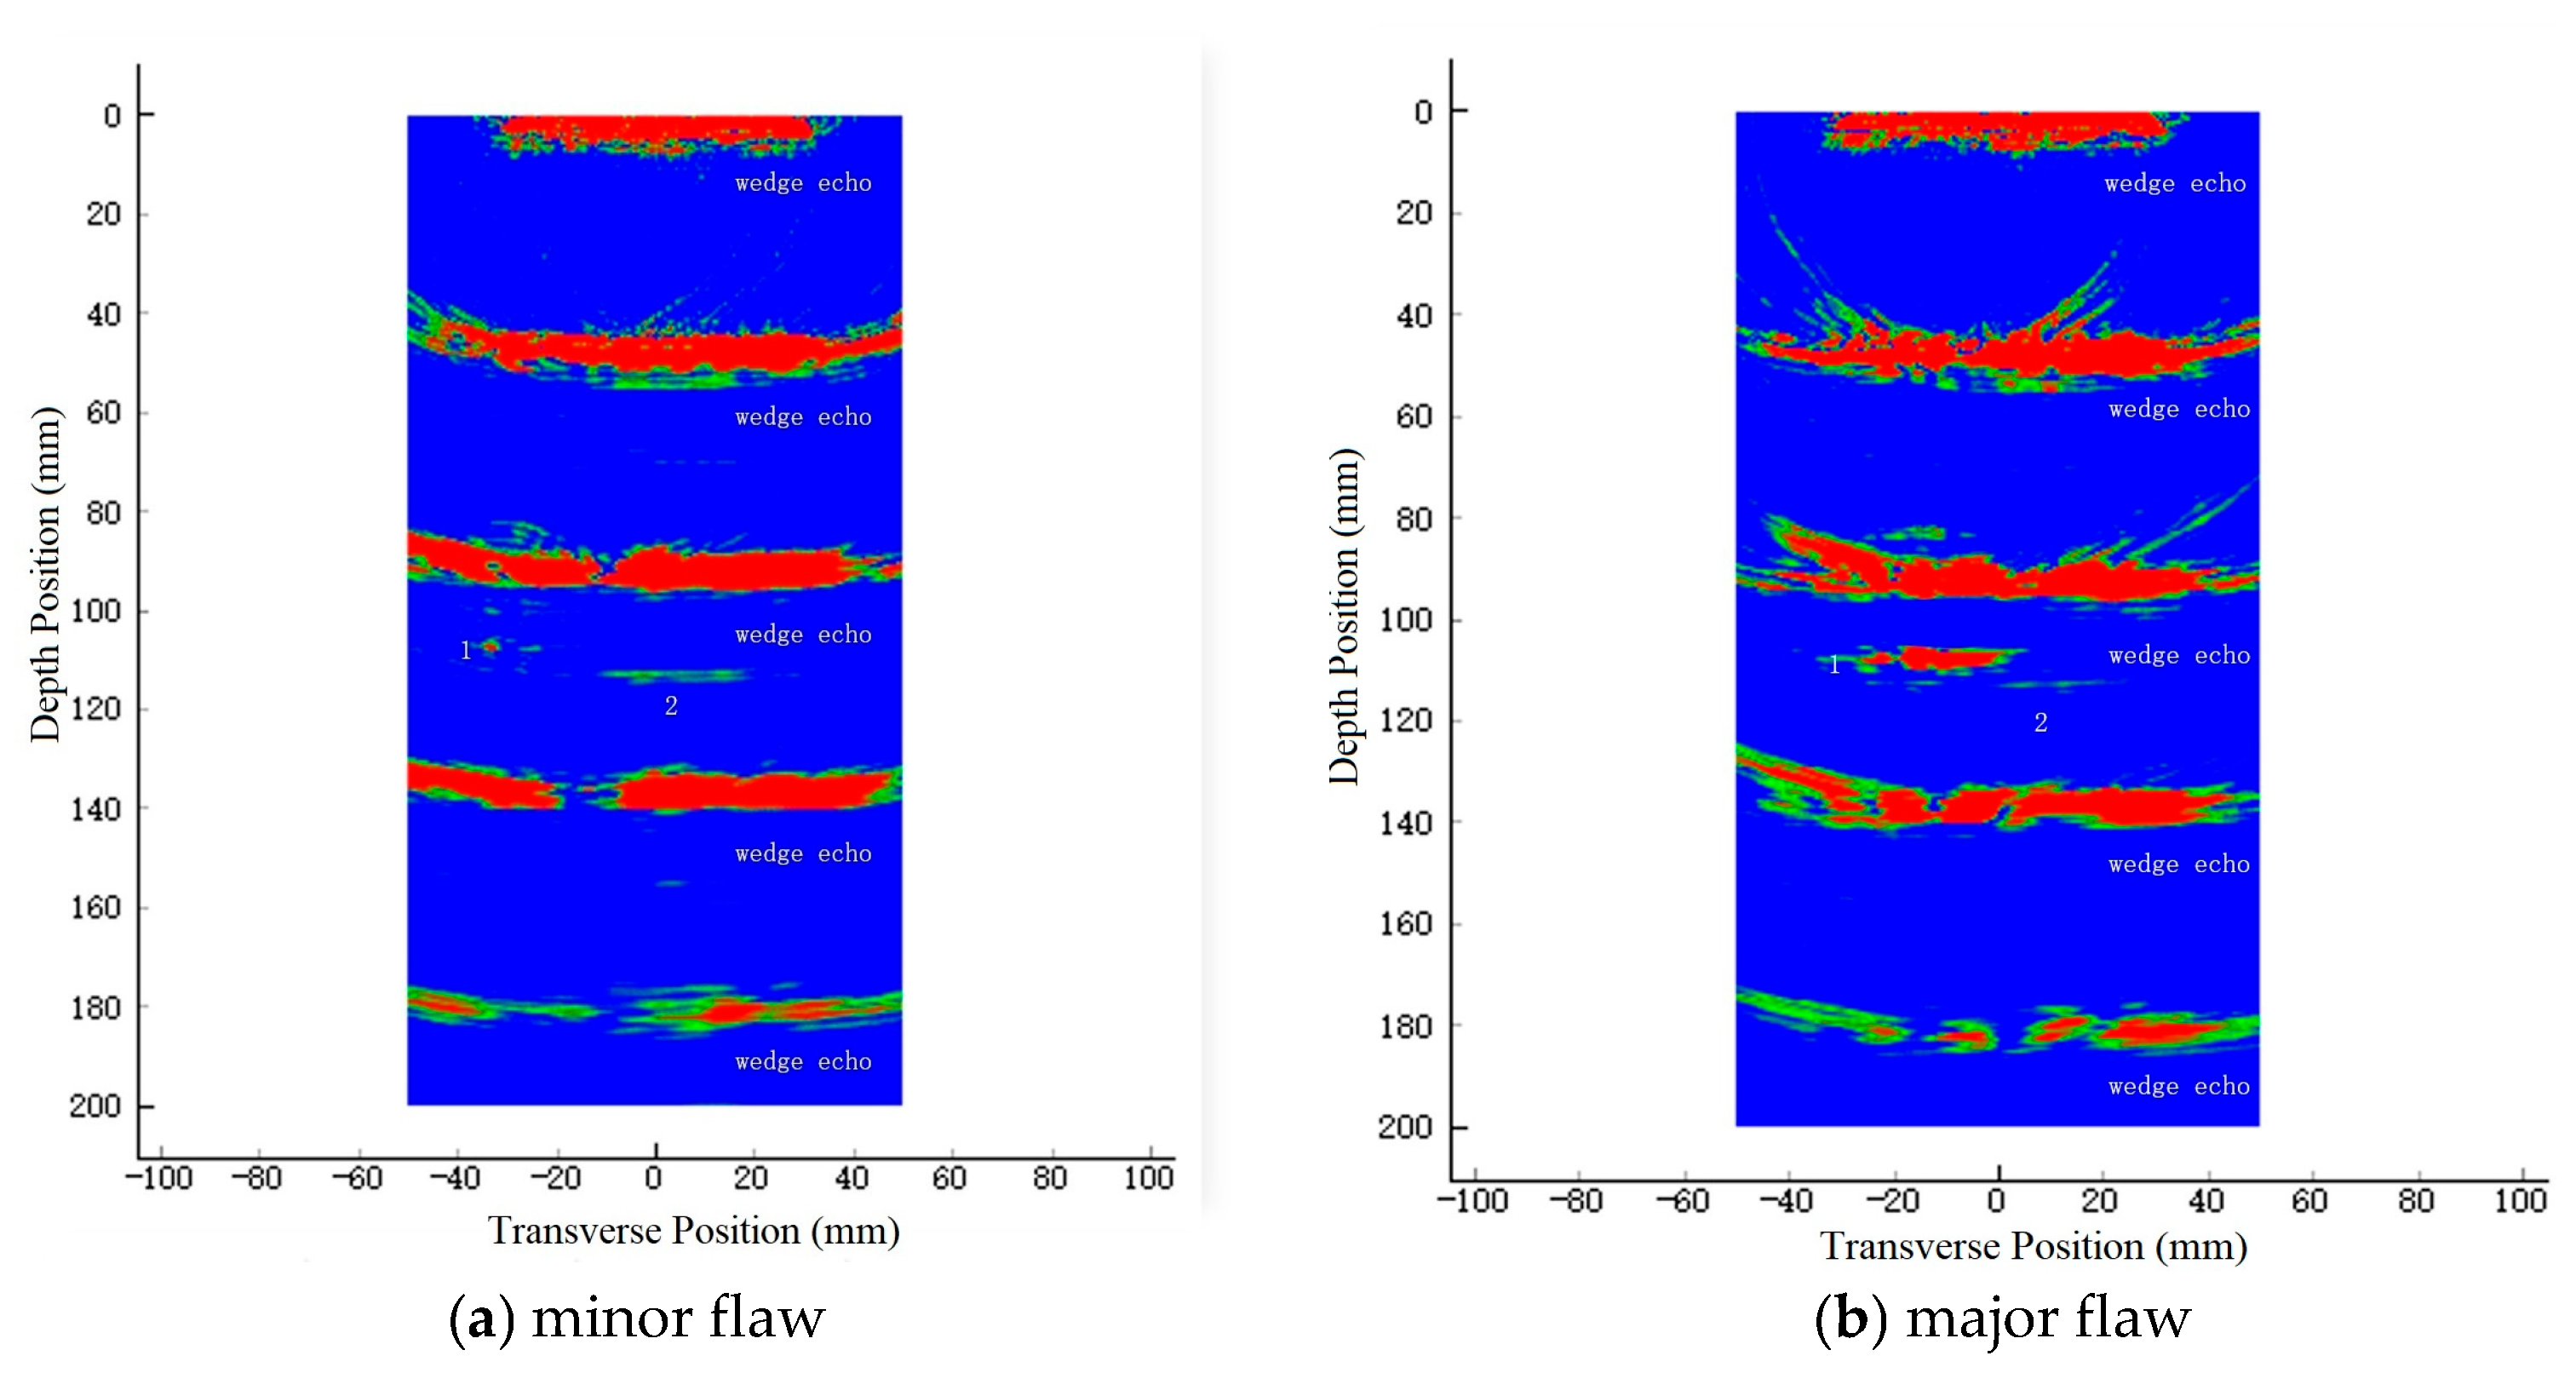
For the detection of defects in the socketed area, the gain was set to −31 dB, the transmit voltage was set to 90 V, the pulse width was 290 ns, the pulse repetition frequency was 4000 Hz, and the imaging detection results were obtained as shown in Figure 11. As shown in the figure, the most prominent features are the multiple echoes from the wedge, followed by the two regions labeled as Region 1 and Region 2. Regions 1 and 2 can be clearly distinguished, and region 1 has a higher echo energy. Since all ultrasonic inspection methods are based on comparison, it was found during the inspection of the specimen that no matter how the probe was moved, the image of region 2 did not change, and the comparison of the structure of the specimen showed that region 1 was the image of the small defects in the socket area. Through analysis of the experimental setup and specimen configuration, region 2 was identified as the distorted wave arising from the bottom reflection of the wedge block.
The ultrasonic A-scan signal at the highest amplitude is extracted, and the end-angle diffraction echo received by the second probe can be used to obtain the time difference between the waveforms, and the positional information of the defect is calculated using the speed of sound. Therefore, the depth of the defects is used as an example to verify the effectiveness of the one-shot multi-receiver defect detection and localization method developed in this work. The defect information recorded directly by the instrument and the results calculated by the second receiving probe are shown in Table 3.
For small and large defects in the socketed area, the depth errors of the actual detection are 2.70 mm and 3.00 mm, respectively, while the errors calculated by the waveforms are 0.84 mm and 1.89 mm, respectively, and the depth errors of the defects derived from the direct detection are larger than the depth errors calculated by the simulation. It is evident that research on ultrasonic phased array technology for complex structures, such as hydrogen storage container docking joints, remains highly significant. Although ultrasonic phased array technology can detect defects within these complex structures, further optimization and enhancement of its detection accuracy and precision are still necessary in practical applications.

3.3. Fusion Surface Inspection Results

3.3.1. Acoustic Field Simulation of the Double Defect Model on the Lower Fusion Surface

In order to observe the ultrasonic propagation inside the structure, the ultrasonic propagation images at different time points during the transient simulation were intercepted. Figure 12 shows the simulation results of the defects on the lower fusion surface. Figure 12a captures the moment just before the ultrasonic wave reaches and interacts with the defect. Figure 12b shows the moment when the ultrasonic wave and the defect 1 (from left to right, defect 1, defect 2) have already acted and reflected, and the direction of reflection is related to the angle of incidence, and at this time the ultrasonic wave has not yet acted with the defect 2, and at this time, the picture also includes the structural echo; Figure 12c captures the moment when the direct wave has already interacted with Defect 2 and reflected, while the structural echo has not yet reached the defect; at the moment shown in Figure 12d, the through wave and the structural echo have both interacted with defect 2 and reflected, and the two beams of waveforms propagate in different directions with a certain time difference, and the ultrasonic waves are subsequently received by probe 1 in the form of different energies. Figure 12e,f illustrate the convergence of the reflected wave after interacting with the structural wall. A noticeable shift in the location of maximum sound pressure is observed.

3.3.2. Acoustic Field Simulation of the Double Defect Model on the Upper Fusion Surface

When a defect is located on the upper fusion surface of the weld, the angle between the defect’s reflective surface and the incident ultrasonic wave is smaller due to the double U-shaped weld geometry. This results in a focusing effect, producing higher sound pressure at the receiver compared to defects on the lower fusion surface. Additionally, defects on the upper fusion surface are closer to the ultrasonic source, resulting in a shorter propagation path. This leads to lower attenuation and higher received sound pressure, making these defects easier to detect than those on the lower fusion surface. In order to observe the wave-defect interaction on the upper fusion surface, the ultrasonic propagation images at different time nodes were intercepted, as shown in Figure 13.
In Figure 13a, the ultrasonic wave first interacts with Defect 3 (leftmost in the figure), producing a reflected echo and altering part of the wave’s propagation direction. Figure 13b shows the moment when the ultrasonic wave has interacted with both defects, generating reflected echoes. End-angle diffracted waves from both defect tips can also be observed propagating outward. At the same time, the structural echo is about to reach Defect 4. At the moment shown in Figure 13c, the structural echo encounters Defect 4, resulting in secondary reflection. Therefore, the signal received by the point probe is expected to contain not only end-angle diffraction echoes but also a reflected wave peak caused by the structural echo interacting with the defect. In Figure 13d, Point Probe 1 receives the first diffraction echo generated by the right tip of Defect 4. Figure 13e shows the gradual convergence of the reflected echoes from both defects. In Figure 13f, the boundary probe successively receives the reflected echoes from Defect 3 and Defect 4. These two signals are temporally close, as also shown in the A-scan signal, where the two wave peaks appear at nearly the same time.

3.3.3. Defect Localization Simulation on the Fusion Surface

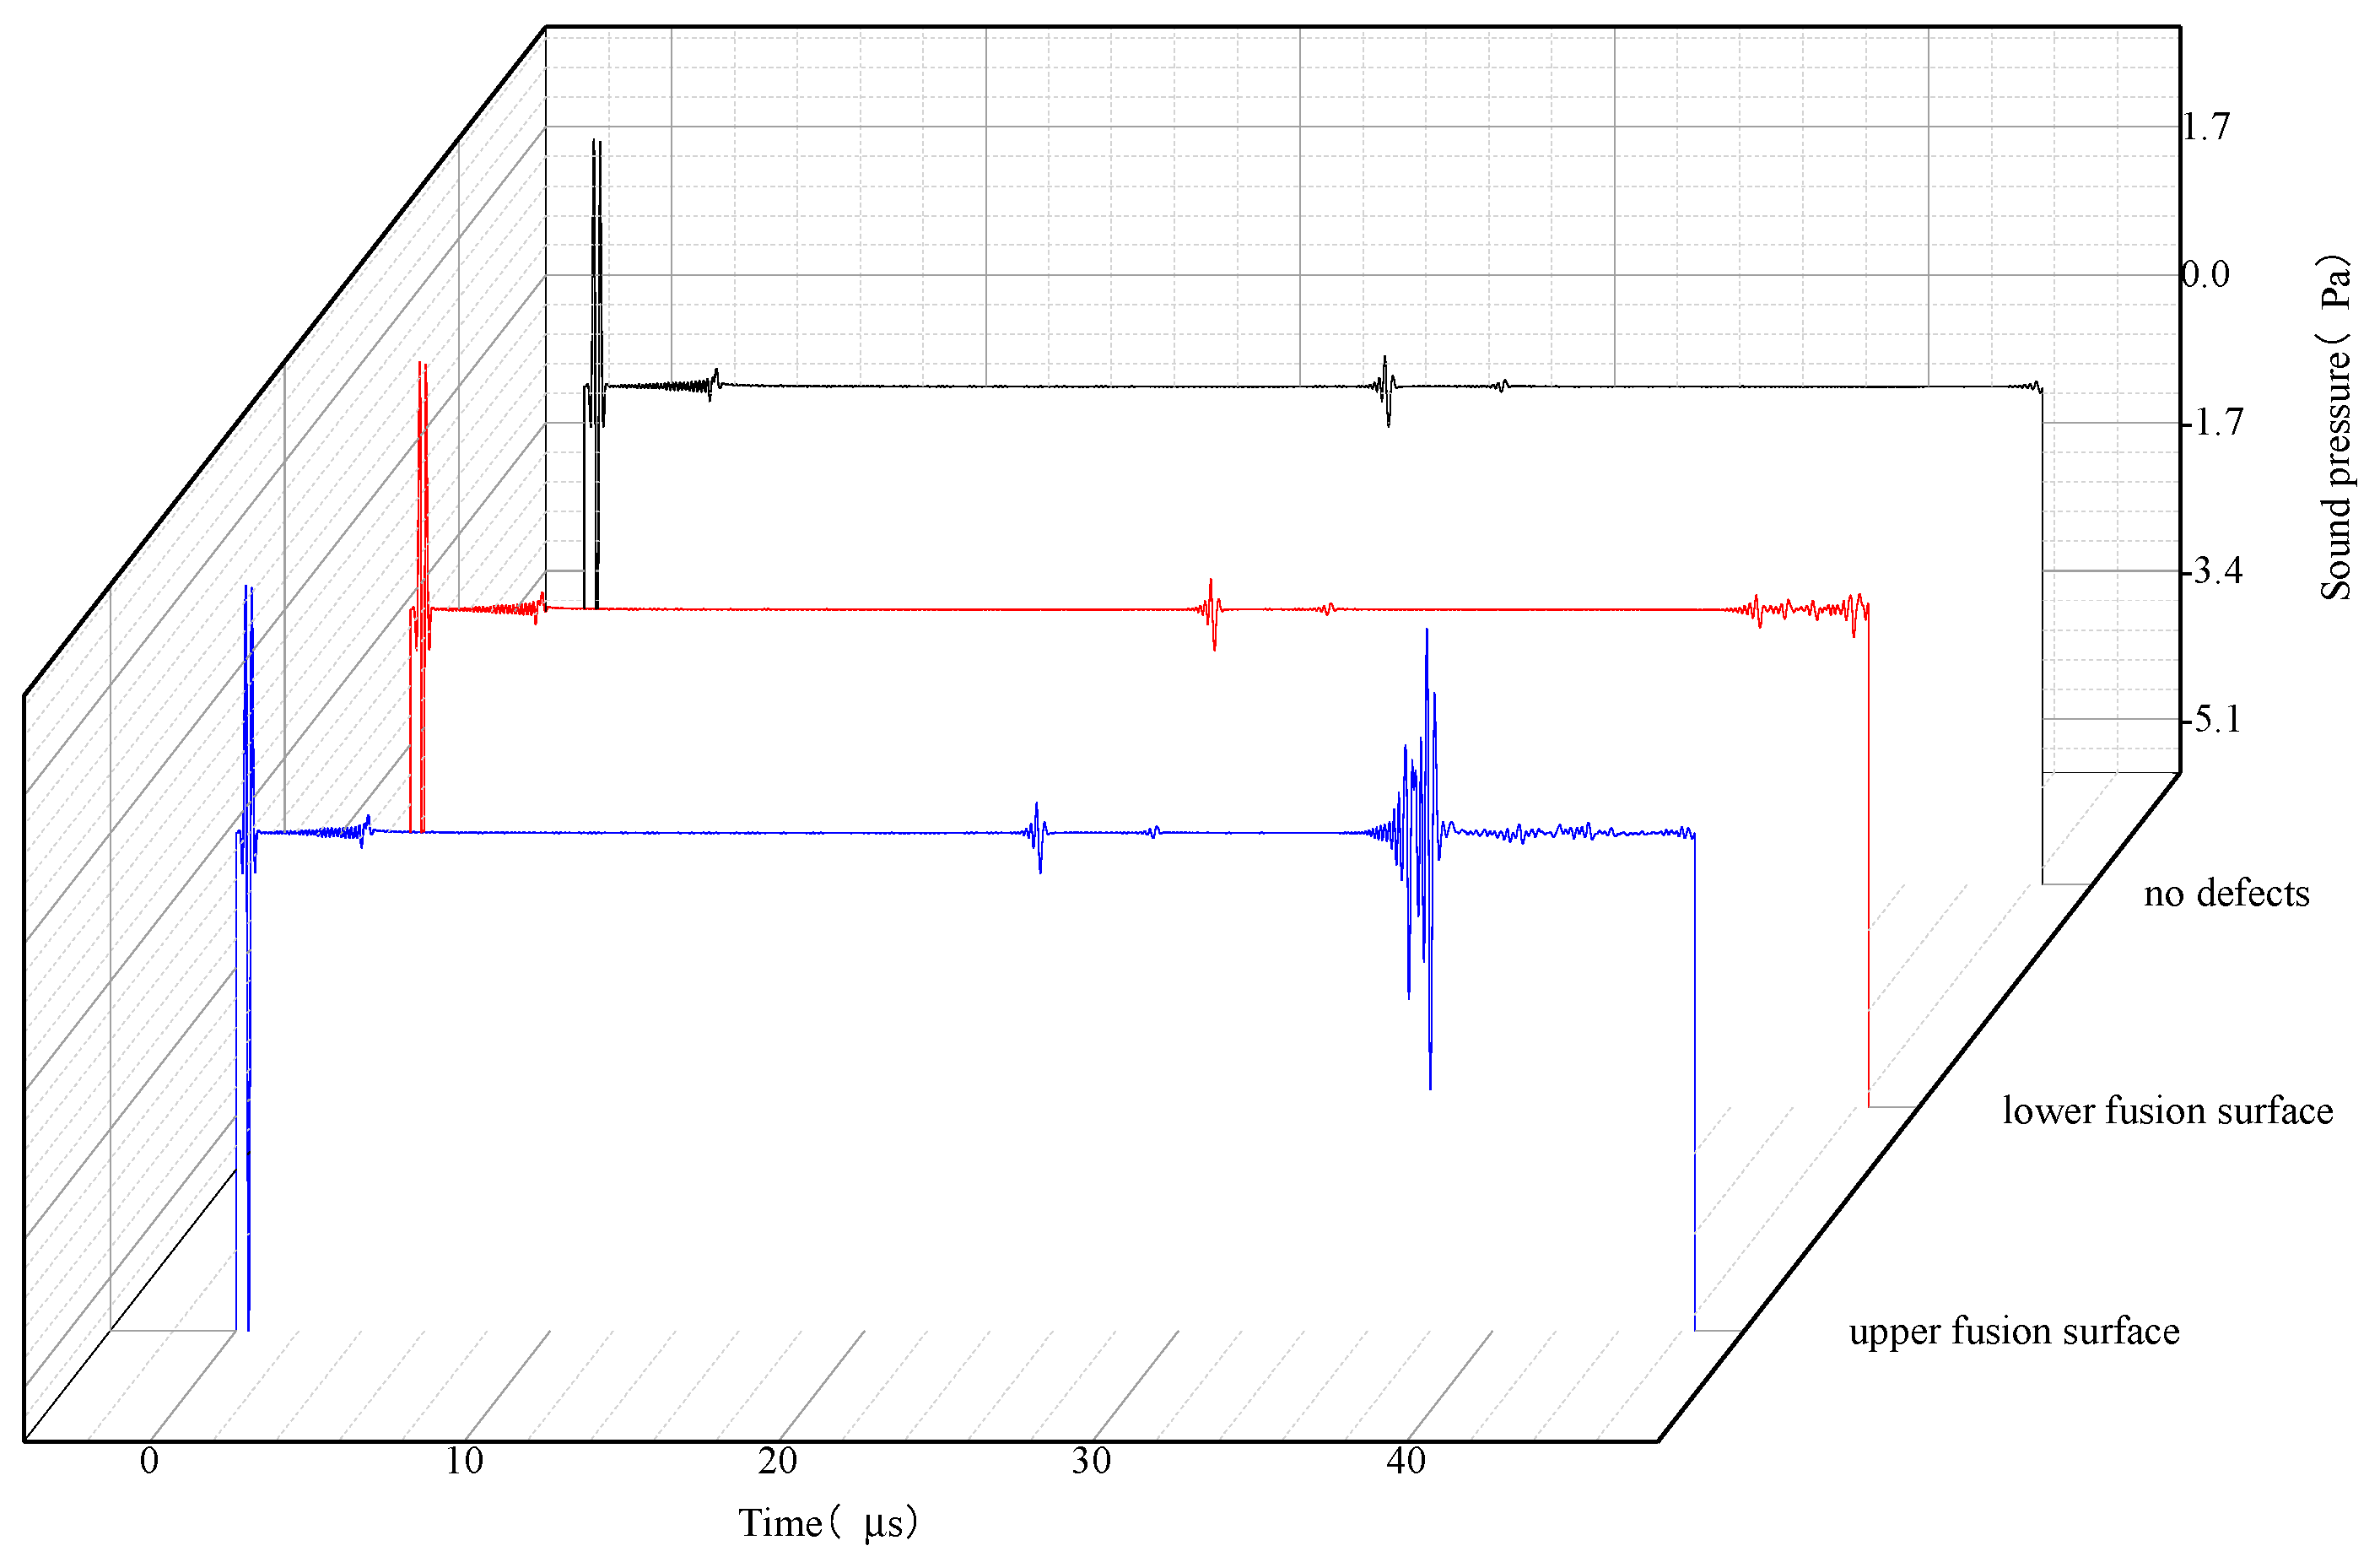
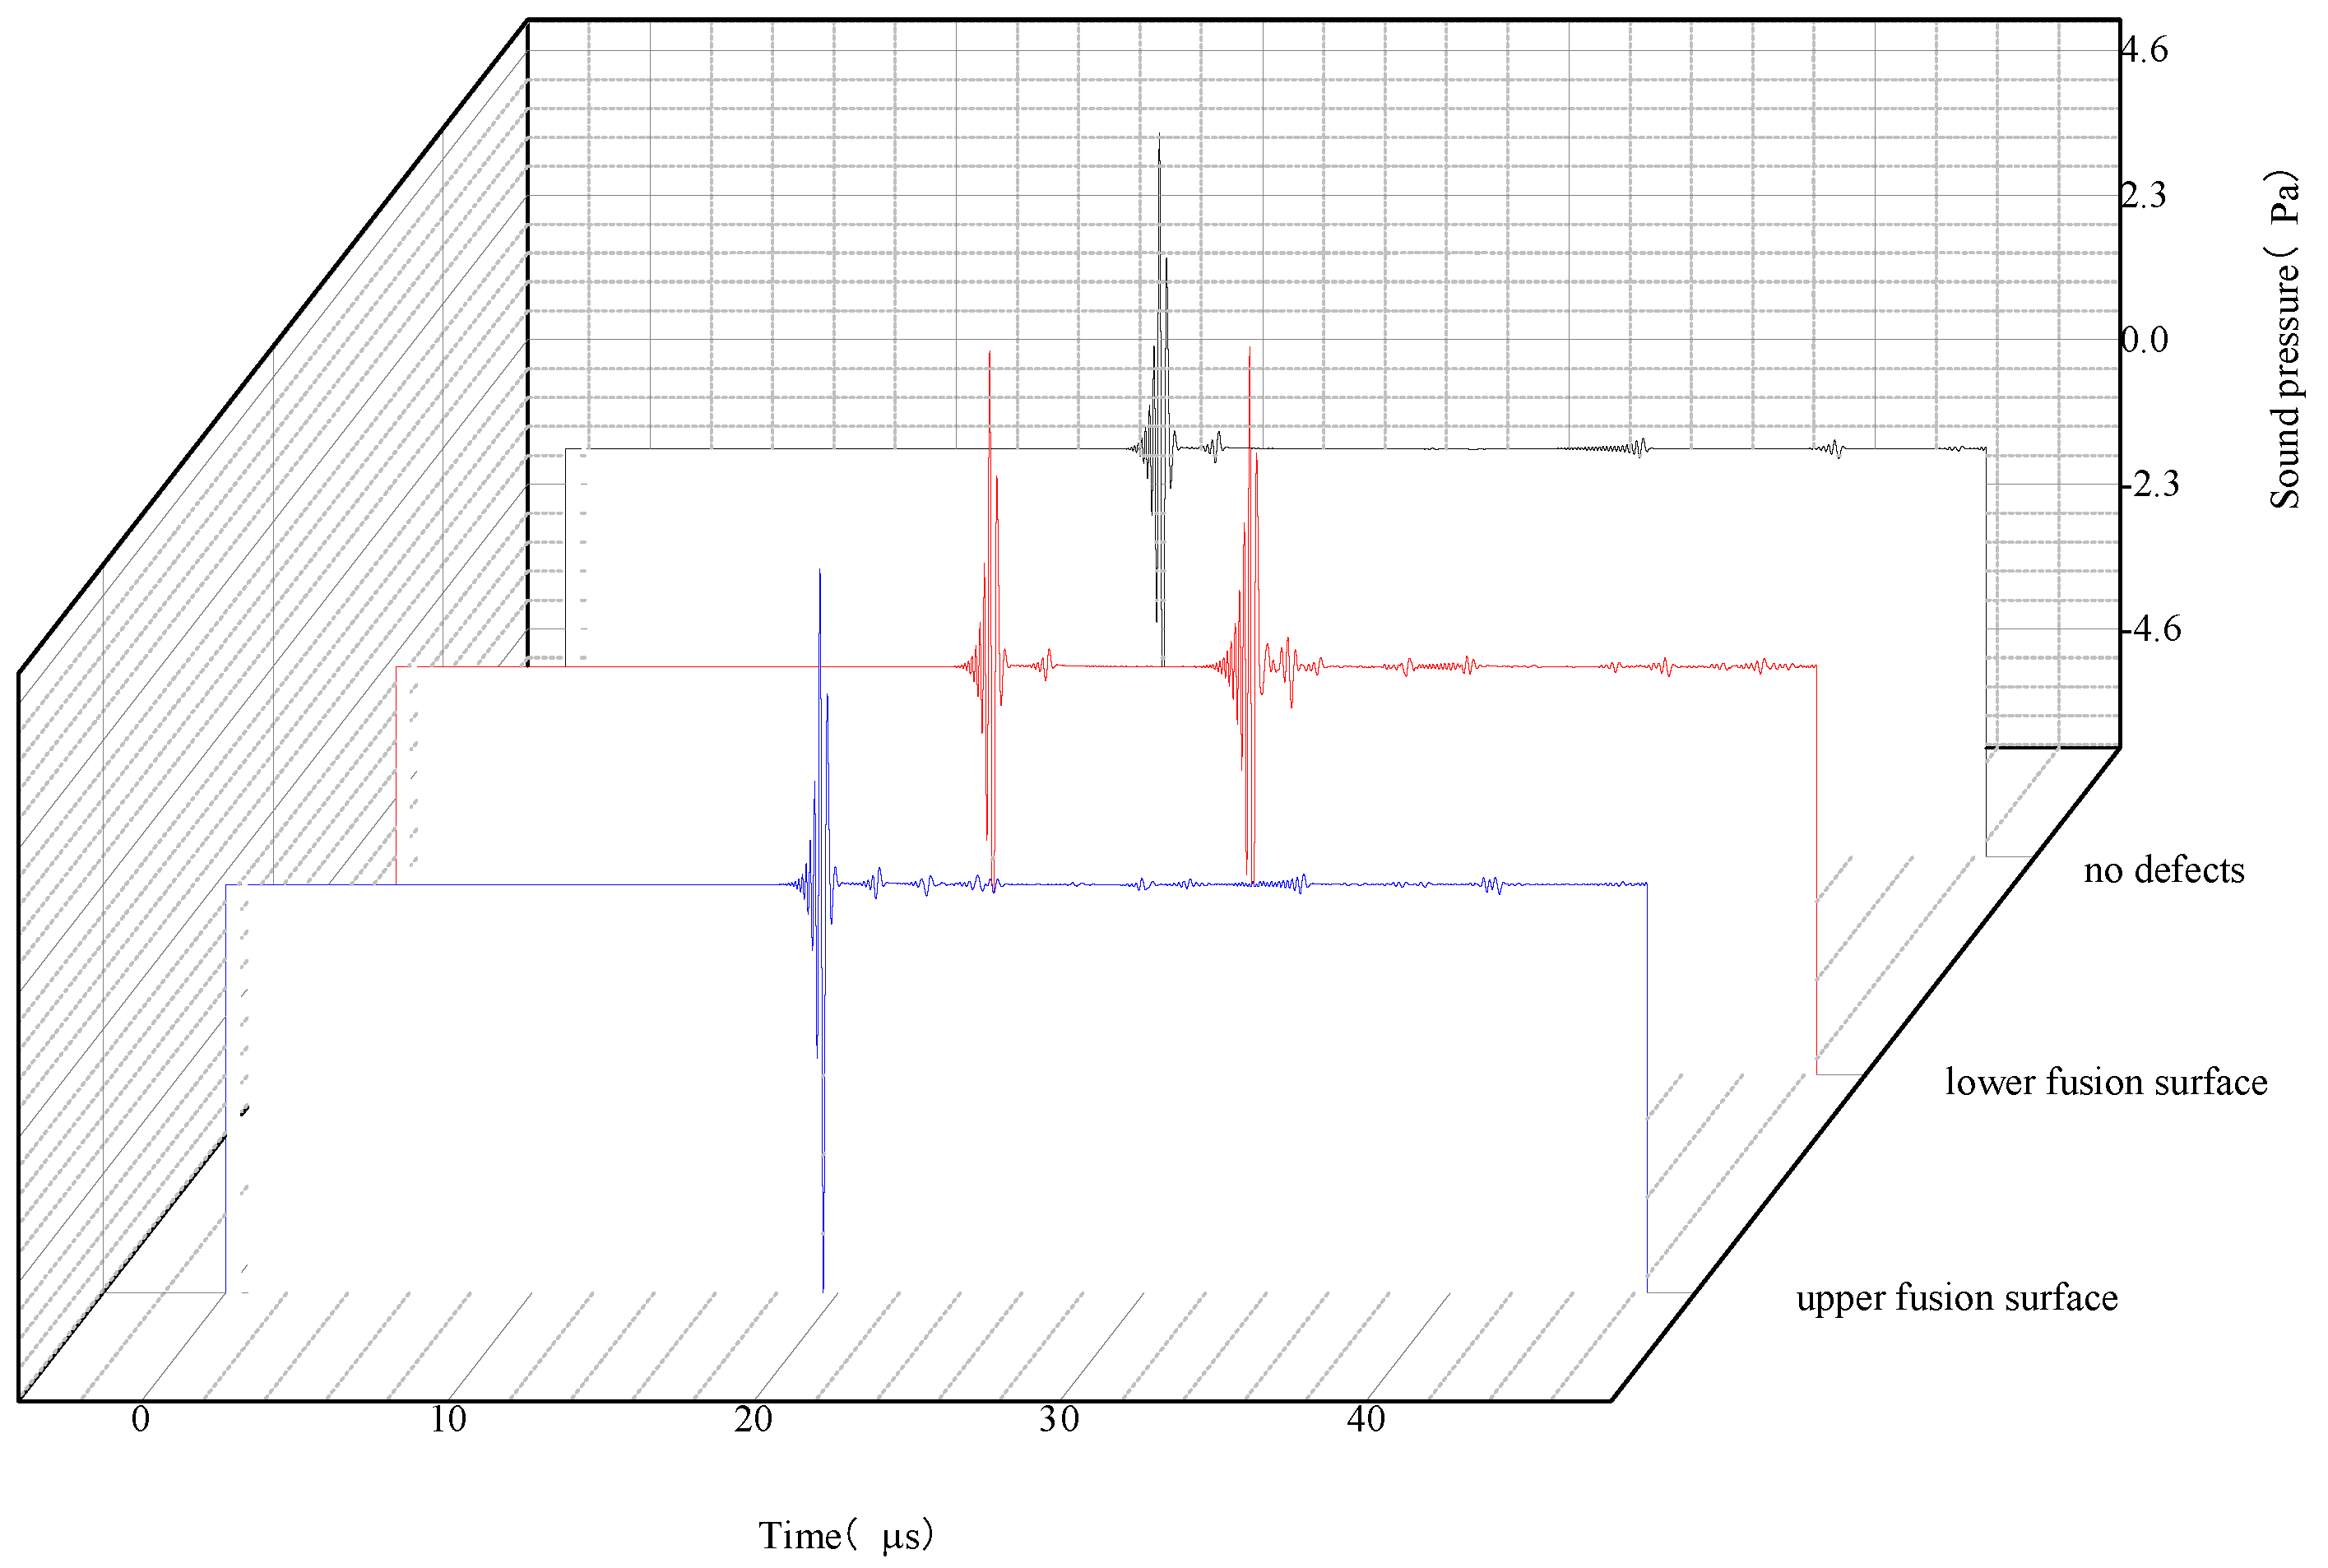
As shown in Figure 14, the initial waveform is the excitation signal of the intermediate array element with a time of 0.40 μs and then the perturbation between the array elements is picked up by the boundary probe, followed by the arrival of the structural echoes of the phased-array synthesized acoustic beam encountering the boundary, and finally, the defect echoes, of which those of Defect 3 and Defect 4 arrive at an earlier time as compared to those of Defects 1 and Defects 2, and the energy of the echoes can also be seen to be significantly higher. Due to the fixed position of the phased array probe, defects near the fusion surface can be localized based on the time difference between the excitation signal and the defect echo.
The echo signal received by point probe 1 is shown in Figure 15. When a defect is present in the structure, the echo signal clearly differs from that of a defect-free condition, as indicated by the boxed area in the figure. Among the observed signals, the reflected echo from defect 2 on the lower fusion surface exhibits the highest sound pressure amplitude. On the lower fusion surface defect, the arrival time of the end angle diffraction echo of defect 2 is earlier than the arrival time of the end angle diffraction echo of defect 1. On the upper fusion surface defect, the arrival time of the end angle diffraction echo of defect 4 is earlier than the arrival time of the end angle diffraction echo of defect 3.
The echo signal received by point probe 2 is shown in Figure 16. As seen in conjunction with Figure 12, the end-angle diffraction echoes from the defects on the lower fusion surface are overlapped with the structural echoes, making it impossible to accurately determine their peak arrival times.
Calculations of defect localization were carried out based on the provided waveforms of the boundary probe and point probe 1, combined with the localization principles Equations (1) and (2). The following Table 4, Table 5, Table 6 and Table 7 are the calculated results for each defect localization:
As shown in the tables above, the localization errors for the left endpoints of the defects are generally larger than those for the right endpoints. This is because the diffracted echo from the left end point of the defect passes through the reflective surface of the defect, resulting in an error in the reception time when it is received by the point probe 1. It can also be seen in the above results that the localization results of defect 2 and defect 4 are better than the localization results of defect 1 and defect 3, with defect 1 having the worst localization results and defect 4 having the best localization results. This is because the end-angle diffraction echoes of defects 1 and 3 have the longest propagation distance in the weld seam and part of the energy is reflected by defects 2 and 4, while for defect 1, which is located far away from the boundary probe and point probe 1, it is the most difficult to detect and has the worst accuracy, and for defect 4, the end-angle diffraction echo is subject to the least interference.

3.3.4. Defect Localization Through Experimentation on the Fusion Surface

Similarly, by rotating the probe so that the ultrasonic wave generated by the probe interacts with the defects on the upper fusion surface, the defective specimen on the fusion surface of the butt joint of the hydrogen storage vessel was detected, and the results of the defects on the lower fusion surface are shown in Figure 17. As illustrated in the figure, in addition to the wedge echo, three distinct regions can be clearly identified—labeled as Region 1, Region 2, and Region 3. Regions 1 and 2 correspond to fusion surface defects, while Region 3 represents the distorted wave arising from the bottom reflection of the wedge block.
The defect information recorded directly by the instrument and the results calculated by the second receiving probe are shown in Table 8. As shown in the table, the detection accuracy for defects located on the upper fusion surface is higher than that for defects on the lower fusion surface. This is because the upper fusion surface defects are located near the upper edge of the weld, closer to the inspection surface, resulting in stronger reflected acoustic energy. In contrast, defects on the lower fusion surface are farther from the detection surface and closer to the lower edge of the weld, leading to weaker reflected signals and increased localization errors for actual inspection.

4. Conclusions

(1)
For the inspection of butt joints between thick-walled nozzles and hemispherical heads in full multi-layer high-pressure hydrogen storage vessels, this paper develops an one-shot, multi-receiver defect location method: a customized curved surface-coupled phased-array probe is inserted into the inner wall of the nozzles and located in the deepest part of the nozzles where a good coupling can be achieved for transmitting and receiving ultrasonic waves; the second receiver probe is placed on the outer surface of the nozzles to capture end-angle diffracted echoes. In this study, an ultrasonic phased array inspection model for the butt joint of a full multilayer hydrogen storage vessel was established based on the one-shot, multi-receiver defect location method. However, this simulation model is limited to two-dimensional simulations, and it still presents certain limitations in detecting specific types of defects in three-dimensional models. Further in-depth research can be conducted on this aspect in future work.
(2)
The surface of the simulation results shows that the simulated positioning results of the right end point of the defects are more in line with the standard results, but there is a large error in the positioning results of the left end point, especially in the positioning results of the left end point of the large defects. The results calculated by using the data collected from the point probe 2 are more accurate and have smaller errors, so the receiving probe is placed close to the point probe 2 during the actual inspection. The experimental results show that the imaging of large defects in the socketed area is good. In the case of the same depth of small and large defects, the reflection surface of large defects is wider, the acoustic wave reflection energy is stronger, and it is easier to detect. For the results of the depth positioning of defects, the error in the depth of defects derived from detection is greater than that calculated through the simulation.
(3)
In the simulation of the double-defect model with fusion surfaces, echo peaks from both defects appear in the computational domain and propagate at specific angles. On the lower fusion surface double-defect model, the difference in the peak value of the defect echo between the two defects exists; while on the upper fusion surface double-defect model, the difference in the defect echo energy between the two defects is smaller than in the former. In the localization of defects, it is not possible to use the data of point probe 2 to obtain the peak time of each defect. Therefore, in actual detection, the receiving probe is positioned closer to Point Probe 1 to better detect defects along the fusion surface. The experimental results show that both defects can be clearly distinguished in the imaging results. The defect on the right side exhibits better imaging quality; for double defects located on the upper fusion surface, the third-order reflected echo from the left-side defect overlaps with other signals in the same region. As a result, left-side defects with similar depths are less likely to be identified, increasing the risk of missed detection. Whether it is for the defect depth recorded in the actual inspection process or for the defect depth calculated by the oblique probe, the defect detection accuracy of the upper fusion surface is higher than that of the lower fusion surface.

Author Contributions

B.D. contributed to conceptualization, methodology, formal analysis, investigation, and writing—original draft; Z.W. contributed to methodology, investigation and writing—original draft; R.Y. contributed to methodology, data curation and visualization; C.Z. contributed to writing—review & editing, supervision, project administration. All authors have read and agreed to the published version of the manuscript.

Funding

This research was supported by Foshan Science and Technology Innovation Projects (No. 2320001007402).

Data Availability Statement

The original contributions presented in this study are included in the article.

Conflicts of Interest

The authors declare no conflicts of interest.

References

  1. Zhou, C.; Yan, R.; Wang, H.; Huang, Y.; Xue, J.; Li, J.; Li, X.; Han, W. Advancements in hydrogen embrittlement of selective laser melting austenitic stainless steel: Mechanisms, microstructures, and future directions. J. Mater. Sci. Technol. 2025, 230, 219–235. [Google Scholar] [CrossRef]
  2. Zhou, C.; Yang, Z.; Chen, G.; Li, X. Optimizing hydrogen refueling station layout based on consequences of leakage and explosion accidents. Int. J. Hydrogen Energy 2024, 54, 817–836. [Google Scholar]
  3. Zhang, F.; Zhao, P.; Niu, M.; Maddy, J. The survey of key technologies in hydrogen energy storage. Int. J. Hydrogen Energy 2016, 41, 14535–14552. [Google Scholar] [CrossRef]
  4. Evro, S.; Oni, B.A.; Tomomewo, O.S. Carbon neutrality and hydrogen energy systems. Int. J. Hydrogen Energy 2024, 78, 1449–1467. [Google Scholar] [CrossRef]
  5. Chang, X.; Ma, T.; Wu, R. Impact of urban development on residents’ public transportation travel energy consumption in China: An analysis of hydrogen fuel cell vehicles alternatives. Int. J. Hydrogen Energy 2019, 44, 16015–16027. [Google Scholar] [CrossRef]
  6. Zheng, J.; Liu, X.; Xu, P.; Liu, P.; Yang, J. Development of high pressure gaseous hydrogen stor-age technologies. Int. J. Hydrogen Energy 2012, 37, 1048–1057. [Google Scholar]
  7. Xu, P.; Zheng, J.; Liu, P.; Chen, R.; Kai, F.; Li, L. Risk identification and control of stationary high-pressure hydrogen storage vessels. J. Loss Prev. Process Ind. 2009, 22, 950–953. [Google Scholar]
  8. Pepin, J.; Lainé, E.; Grandidier, J.-C.; Castagnet, S.; Blanc-vannet, P.; Papin, P.; Weber, M. Determination of key parameters responsible for polymeric liner collapse in hyperbaric type IV hydrogen storage vessels. Int. J. Hydrogen Energy 2018, 43, 16386–16399. [Google Scholar]
  9. Laureys, A.; Van Stappen, J.; Depover, T.; Cnudde, V.; Verbeken, K. Electrochemical hydrogen charging to simulate hydrogen flaking in pressure vessel steels. Eng. Fract. Mech. 2019, 217, 106546. [Google Scholar] [CrossRef]
  10. Liu, J.; Wang, L.; Song, Z.; Zhou, W.; Ma, L. Features of acoustic emission and micro-CT of 3D-printed continuous Kevlar fiber-reinforced composites during progressive damage under flexural load. J. Appl. Polym. Sci. 2022, 139, 52296. [Google Scholar] [CrossRef]
  11. Silva, L.; dos Santos, V.; Paciornik, S.; Mertens, J.; Chawla, N. Multiscale 3D characterization of discontinuities in underwater wet welds. Mater. Charact. 2015, 107, 358–366. [Google Scholar] [CrossRef]
  12. Padilla, E.; Chawla, N.; Silva, L.; dos Santos, V.; Paciornik, S. Image analysis of cracks in the weld metal of a wet welded steel joint by three dimensional (3D) X-ray microtomography. Mater. Charact. 2013, 83, 139–144. [Google Scholar] [CrossRef]
  13. Rocha, T.J.; Ramos, H.G.; Ribeiro, A.L.; Pasadas, D.J. Magnetic sensors assessment in velocity induced eddy current testing. Sens. Actuators A Phys. 2015, 228, 55–61. [Google Scholar] [CrossRef]
  14. Cardoso, F.A.; Rosado, L.S.; Franco, F.; Ferreira, R.; Paz, E.; Cardoso, S.F.; Ramos, P.M.; Piedade, M.; Freitas, P.J.P. Improved Magnetic Tunnel Junctions Design for the Detection of Superficial Defects by Eddy Currents Testing. IEEE Trans. Magn. 2014, 50, 1–4. [Google Scholar] [CrossRef]
  15. Rosado, L.S.; Gonzalez, J.C.; Santos, T.G.; Ramos, P.M.; Piedade, M. Geometric optimization of a differential planar eddy currents probe for non-destructive testing. Sens. Actuators A Phys. 2013, 197, 96–105. [Google Scholar]
  16. Chen, G.; Zhang, W.; Pang, W. Koch curve fractal geometry excitation probe for eddy current non-destructive testing. Measurement 2018, 124, 470–478. [Google Scholar] [CrossRef]
  17. Xiao, Q.; Feng, J.; Xu, Z.; Zhang, H. Receiver Signal Analysis on Geometry and Excitation Parameters of Remote Field Eddy Current Probe. IEEE Trans. Ind. Electron. 2022, 69, 3088–3098. [Google Scholar]
  18. Zhu, X.; Gao, X.; Wang, L.; Zhou, X.; Peng, J. Application of Ultrasonic Flaw Detection in Non-destructive Test. Mod. Electron. 2010, 33, 112–116. [Google Scholar] [CrossRef]
  19. Zhou, H. Research on Key Technologies of Automatic Ultrasonic TOFD Imaging for Thin Welding Seam. Ph.D. Thesis, Zhejiang University, Hangzhou, China, 2014; pp. 38–98. [Google Scholar]
  20. Opačić, M.; Sedmak, A.; Bakić, G.; Milošević, N.; Milovanovic, N. Application of advanced NDT methods to assess structural integrity of pressure vessel welded joints. Procedia Struct. Integr. 2022, 42, 1185–1189. [Google Scholar] [CrossRef]
  21. Nardo, R.M.; Cerniglia, D.; Lombardo, P.; Pecoraro, S.; Infantino, A. Detection, characterization and sizing of hydrogen induced cracking in pressure vessels using phased array ultrasonic data processing. Procedia Struct. Integr. 2016, 2, 581–588. [Google Scholar] [CrossRef]
  22. de Zuniga, M.O.; Dans, A.; Megna, T.; Prinja, N.; Camacho, A.M.; Rodríguez-Prieto, A. Data-driven automatic validation of phased-array ultrasonic-testing data acquisitions of welds in thick austenitic stainless-steel plates for the ITER vacuum vessel manufacturing. Fusion Eng. Des. 2025, 211, 114806. [Google Scholar] [CrossRef]
  23. Yin, S.; Zhang, S.F.; Chen, Y.; Zhong, C.; Li, R.; Su, Y. Bendable Phased-Array Ultrasound Transducer for Imaging on Curved Surfaces. ACS Nano 2025, 19, 8030–8039. [Google Scholar] [CrossRef] [PubMed]
  24. Yu, T.; Guo, W.; Miao, C.; Zheng, J.; Hua, Z. Study on inserted curved surface coupling phased array ultrasonic inspection of multi-layered steel vessel for high-pressure hydrogen storage. Int. J. Hydrogen Energy 2021, 46, 18433–18444. [Google Scholar] [CrossRef]
Figure 1. Sectional view of butt joint: (1) thick-walled nozzle, (2) butt joint, (3) hemispherical head.
Energies 18 05419 g001
Figure 2. Schematic diagram of defect location.
Energies 18 05419 g002
Figure 3. Comparison test block.
Energies 18 05419 g003aEnergies 18 05419 g003b
Figure 4. Simulation Model of defect-free butt joint. (a) Geometric model of defect-free butt joint (b) The ultrasonic phased array focusing model.
Energies 18 05419 g004
Figure 5. Array delay at depth of focus of 30 mm.
Energies 18 05419 g005
Figure 6. Ultrasonic propagation of small cracks in the socket area. (a) t = 2 μs; (b) t = 20 μs; (c) t = 21 μs; (d) t = 22 μs; (e) t = 26 μs; (f) t = 30 μs.
Energies 18 05419 g006
Figure 7. Ultrasonic propagation of large cracks in the socket area. (a) t = 20 μs; (b) t = 21 μs; (c) t = 24 μs; (d) t = 30 μs.
Energies 18 05419 g007
Figure 8. Comparison of A-scan signal integration of boundary probes for defects in the socket area.
Energies 18 05419 g008
Figure 9. Comparison of integration of point probe 1 A-scan signals for defects in the socket area.
Energies 18 05419 g009
Figure 10. Comparison of integration of point probe 2 A-scan signals for defects in the socket area.
Energies 18 05419 g010
Figure 11. Imaging of minor flaw in the socket area.
Energies 18 05419 g011
Figure 12. Ultrasonic propagation of the double defect model on the lower fusion surface. (a) t = 21 μs; (b) t = 22 μs; (c) t = 24 μs; (d) t = 25 μs; (e) t = 28 μs; (f) t = 32 μs.
Energies 18 05419 g012
Figure 13. Ultrasonic propagation of the upper fusion surface double defect model. (a) t = 19 μs; (b) t = 20 μs; (c) t = 21.8 μs; (d) t = 23 μs; (e) t = 31 μs; (f) t = 3.6 μs.
Energies 18 05419 g013
Figure 14. Comparison of A-scan signal integration of boundary probes for defects on the fusion surface.
Energies 18 05419 g014
Figure 15. Comparison of point probe 1 A-scan signal alignment for defects on the fusion surface.
Energies 18 05419 g015
Figure 16. Comparison of integration of point probe 2 A-scan signals for defects on the fusion surface.
Energies 18 05419 g016
Figure 17. Imaging of defects on the fusion surface.
Energies 18 05419 g017
Table 1. Probe 1 simulation results of defect localization.
Actual Coordinates of the Right Endpoint Pright/mmCalculated Coordinates of the Right Endpoint P1/mmInaccuracies/mm
minor flaw(−23.83, −114.50)(−24.96, −113.81)(1.13, 0.69)
major flaw(−18.83, −114.50)(−20.03, −114.04)(1.20, 0.46)
Actual Coordinates of the Left Endpoint Pleft/mmCalculated Coordinates of the Left Endpoint P2/mmInaccuracies/mm
minor flaw(−28.83, −114.50)(−30.61, −112.43)(1.78, 2.07)
major flaw(−33.83, −114.50)(−36.28, −109.96)(2.45, 4.54)
Table 2. Probe 2 simulation results of defect localization.
Actual Coordinates of the Right Endpoint Pright/mmCalculated Coordinates of the Right Endpoint P1/mmInaccuracies/mm
minor flaw(−23.83, −114.50)(−24.18, −113.98)(0.35, 0.52)
major flaw(−18.83, −114.50)(−19.31, −114.17)(0.48, 0.33)
Actual Coordinates of the Left Endpoint Pleft/mmCalculated Coordinates of the Left Endpoint P2/mmInaccuracies/mm
minor flaw(−28.83, −114.50)(−29.94, −113.34)(1.11, 1.16)
major flaw(−33.83, −114.50)(−35.96, −111.04)(2.13, 3.46)
Table 3. Results of locating defects in the socket area.
Defect TypeActual Depth/mmDepth of Detection/mmSimulation Results/mm
minor flaw114.50111.80113.66
major flaw114.50111.50112.61
Table 4. Defect 1 simulation positioning results.
Actual Coordinates/mmCalculate Coordinates/mmInaccuracies/mm
left endpoint(−46.33, −120.00)(−48.88, −116.24)(2.55, 3.76)
right endpoint(−36.33, −120.00)(−38.78, −117.65)(2.45, 2.35)
Table 5. Defect 2 simulation positioning results.
Actual Coordinates/mmCalculate Coordinates/mmInaccuracies/mm
left endpoint(4.27, −129.58)(2.07, 127.15)(2.20, 2.43)
right endpoint(13.67, −133.00)(11.67, −130.77)(2.00, 2.23)
Table 6. Defect 3 simulation positioning results.
Actual Coordinates/mmCalculate Coordinates/mmInaccuracies/mm
left endpoint(−45.73, −100.00)(−43.38, −103.66)(2.35, 3.66)
right endpoint(−36.33, −103.42)(−34.28, −106.70)(2.05, 2.65)
Table 7. Defect 4 simulation positioning results.
Actual Coordinates/mmCalculate Coordinates/mmInaccuracies/mm
left endpoint(−1.33, −110.00)(−3.23, −108.20)(1.90, 1.80)
right endpoint(8.67, −110.00)(6.93, −108.57)(1.74, 1.43)
Table 8. Fusion surface defect localization results.
Defect TypeActual Depth/mmDepth of Detection/mmSimulation Results/mm
lower fusion surfaceDefect 1120.00118.40116.95
Defect 2133.00128.33128.96
upper fusion surfaceDefect 3100.0097.85105.18
Defect 4110.00108.70108.39
Disclaimer/Publisher’s Note: The statements, opinions and data contained in all publications are solely those of the individual author(s) and contributor(s) and not of MDPI and/or the editor(s). MDPI and/or the editor(s) disclaim responsibility for any injury to people or property resulting from any ideas, methods, instructions or products referred to in the content.