Article

A Data-Driven Decision-Making Tool for Prioritizing Resilience Strategies in Cold-Climate Urban Neighborhoods

by
Ahmed Nouby Mohamed Hassan
* and
Caroline Hachem-Vermette
Department of Building, Civil and Environmental Engineering (BCEE), Concordia University, Montreal, QC H3G 2W1, Canada
*
Author to whom correspondence should be addressed.
Energies 2025, 18(20), 5421; https://doi.org/10.3390/en18205421 (registering DOI)
Submission received: 23 August 2025 / Revised: 3 October 2025 / Accepted: 5 October 2025 / Published: 14 October 2025

Abstract

Cold-climate urban neighborhoods face mounting energy and thermal risks from extreme weather and power outages, creating trade-offs between different resilience capacities and objectives. This study develops a scalable, data-driven decision-making tool to support early-stage prioritization of resilience strategies at both the building component and neighborhood levels. A database of 48 active and passive strategies was systematically linked to 14 resilience objectives, reflecting energy- and thermally oriented capacities. Each strategy–objective pair was qualitatively assessed through a literature review and translated into probability distributions. Monte Carlo simulations (10,000 iterations) were performed to generate possible outcomes and several scores were calculated. Comparative scenario analysis—spanning holistic, short-term, long-term, energy-oriented, and thermally oriented perspectives—highlighted distinct adoption patterns. Active energy strategies, such as ESS, decentralized RES, microgrids, and CHP, consistently achieved the highest adoption (A) scores across levels and scenarios. Several passive measures, including green roofs, natural ventilation with passive heat recovery, and responsive glazing, also demonstrated strong multi-objective performance and outage resilience. A case study application integrated stakeholder-specific objective weightings, revealing convergent strategies suitable for immediate adoption and divergent ones requiring negotiation. This tool provides an adaptable probabilistic foundation for evaluating resilience strategies under uncertainty.

1. Introduction

Climate change is reshaping environmental, social, and infrastructural systems in urban areas worldwide, including cold-climate regions like Canada. These regions are exposed to a wide range of hazards—heatwaves, ice storms, and heavy rainfall events—that threaten both infrastructure and public health. Between 1948 and 2016, Canada recorded a 0.6 °C rise in peak summer temperatures and a 3.3 °C increase in the coldest winter temperatures, accompanied by more frequent heavy precipitation events [1]. Such changes translate into severe impacts: the 2021 western Canada heat dome caused hundreds of heat-related deaths and overwhelmed emergency services [2], while the 1998 North American Ice Storm resulted in widespread outages, fatalities, and secondary risks such as carbon monoxide poisoning from unsafe heating practices [3,4,5,6]. These cases underscore how shifting climate patterns intensify extreme events, increasing risks for urban populations in cold climates.
Urban systems, particularly energy infrastructure, are highly vulnerable to these hazards, which increase energy demand [6] and damage power systems [7], leading to outages that disrupt essential services and endanger public health [8]. In cold-climate cities, the consequences are acute: power loss during winter storms or summer heatwaves can be life-threatening for vulnerable communities like the elderly or the chronically ill [9]. For example, the 2018 Quebec heatwave caused over 200 deaths [10], and the 2013 Toronto ice storm left one million residents without electricity for days, resulting in hospitalizations and fatalities from exposure [4]. These impacts underscore the urgent need for urban resilience frameworks that enhance system capacity and communities to absorb, recover from, and adapt to disruptions while maintaining critical functions [11,12].
Urban energy resilience manifests at multiple levels. At the building component level, passive survivability refers to a building’s ability to keep habitable indoor environments during power outages and energy system interruptions [13,14]. At the neighborhood level, resilience appears in the concept of thermal resilient communities (TRCs), where urban areas can resist and recover from heatwaves across multiple scales, such as microclimate, buildings, and individuals [15]; in physical access to emergency shelters during crises [16]; and in hybrid infrastructure, where built and green infrastructures are integrated for resisting climate-related hazards [17]. Also, energy efficiency contributes to resilience across both levels by focusing on reducing demand, enhancing overall performance, and reducing vulnerability to supply disruptions [18].
Urban resilience involves four key capacities: adaptive—proactive measures before disruptions [19]; absorptive—maintaining function during disruptions [19]; restorative—efficient recovery afterward [20]; and transformative—long-term systemic change [21]. These can be mapped onto two temporal stages: short-term resilience, represented by the absorptive capacity, and long-term resilience, encompassing adaptive, restorative, and transformative capacities [22]. Figure 1 shows the temporal representation of the resilience stages.
Various building component and neighborhood resilience strategies exist in these stages, yet a strategy may have conflicting impact across stages. At the building component level, energy efficiency strategies like enhanced insulation and air tightness are essential for reducing demand and thus reducing vulnerabilities to failures [23,24], contributing to the long-term stage. However, during outages caused by heatwaves, if not properly managed with ventilation, these strategies can inadvertently trap heat, elevating indoor temperatures to dangerous levels [13,25,26]. At the neighborhood level, decentralized renewable energy systems offer critical advantages during disruptions. They provide enhanced resilience and local energy independence during outages [27], supplying power to essential services like water pumping, emergency shelters, or healthcare facilities. However, under normal operating conditions, despite their benefits, they may face challenges related to grid infrastructure demands, overproduction management, and partial renewable capacity utilization under normal operating conditions [27].
Resilience objectives span across social, economic, and environmental dimensions, forming the foundation of a holistic understanding of urban resilience. These dimensions are shaped by a wide range of sectoral focuses, including energy, thermal, water, food, mobility, and infrastructure systems. In the context discussed here, the focus is on energy- and thermal-oriented objectives. Strategies can differ in their impact on such objectives. For example, active strategies such as energy storage systems and microgrids focus on energy-oriented objectives such as improving energy efficiency and providing energy for critical services during disruptions [18,28,29,30] while green infrastructure strategies are more focused on thermally oriented ones such as reducing the urban heat island effect and enhancing thermal resilience [15,31,32,33]. There are some correlations among objectives; however, this categorization helps identify the main and secondary intentions of a strategy.
Urban areas function as complex adaptive socio-ecological systems, where technical, economic, environmental, and social factors are interconnected [34]. Consequently, resilience strategies combine multiple attributes, leading to differing stakeholder priorities. For example, high-efficiency heat pumps align with environmental goals but are costly for low-income households [35], while centralized energy systems enable efficient large-scale management yet may lack adaptability to local needs, reducing social acceptance [36].
Resilience strategies often interact, producing either synergies or conflicts [37,38]. For instance, pairing urban greenery with water-sensitive design cools cities and boosts groundwater recharge, reducing reliance on potable water for irrigation [38]. In contrast, higher urban density can limit space for parks, open areas, and urban agriculture, worsening heat stress in compact neighborhoods [37]. These conflicts underscore the need for planners to balance density goals with green infrastructure to optimize urban resilience.
These four complexities, shown in Figure 2, of temporal conflicts, focuses of objectives, synergies and conflicts among strategies, and strategies attributes hinder the process of well-informed decision-making in early design stages, a crucial process for achieving urban resilience [39,40]. This makes it very challenging for stakeholders to select and evaluate strategies for their cases [41]. Early decision-making should involve various stakeholders, consider trade-offs between different objectives, and incorporate iterative resilience assessments and scenario-making to prepare for future uncertainties [40].
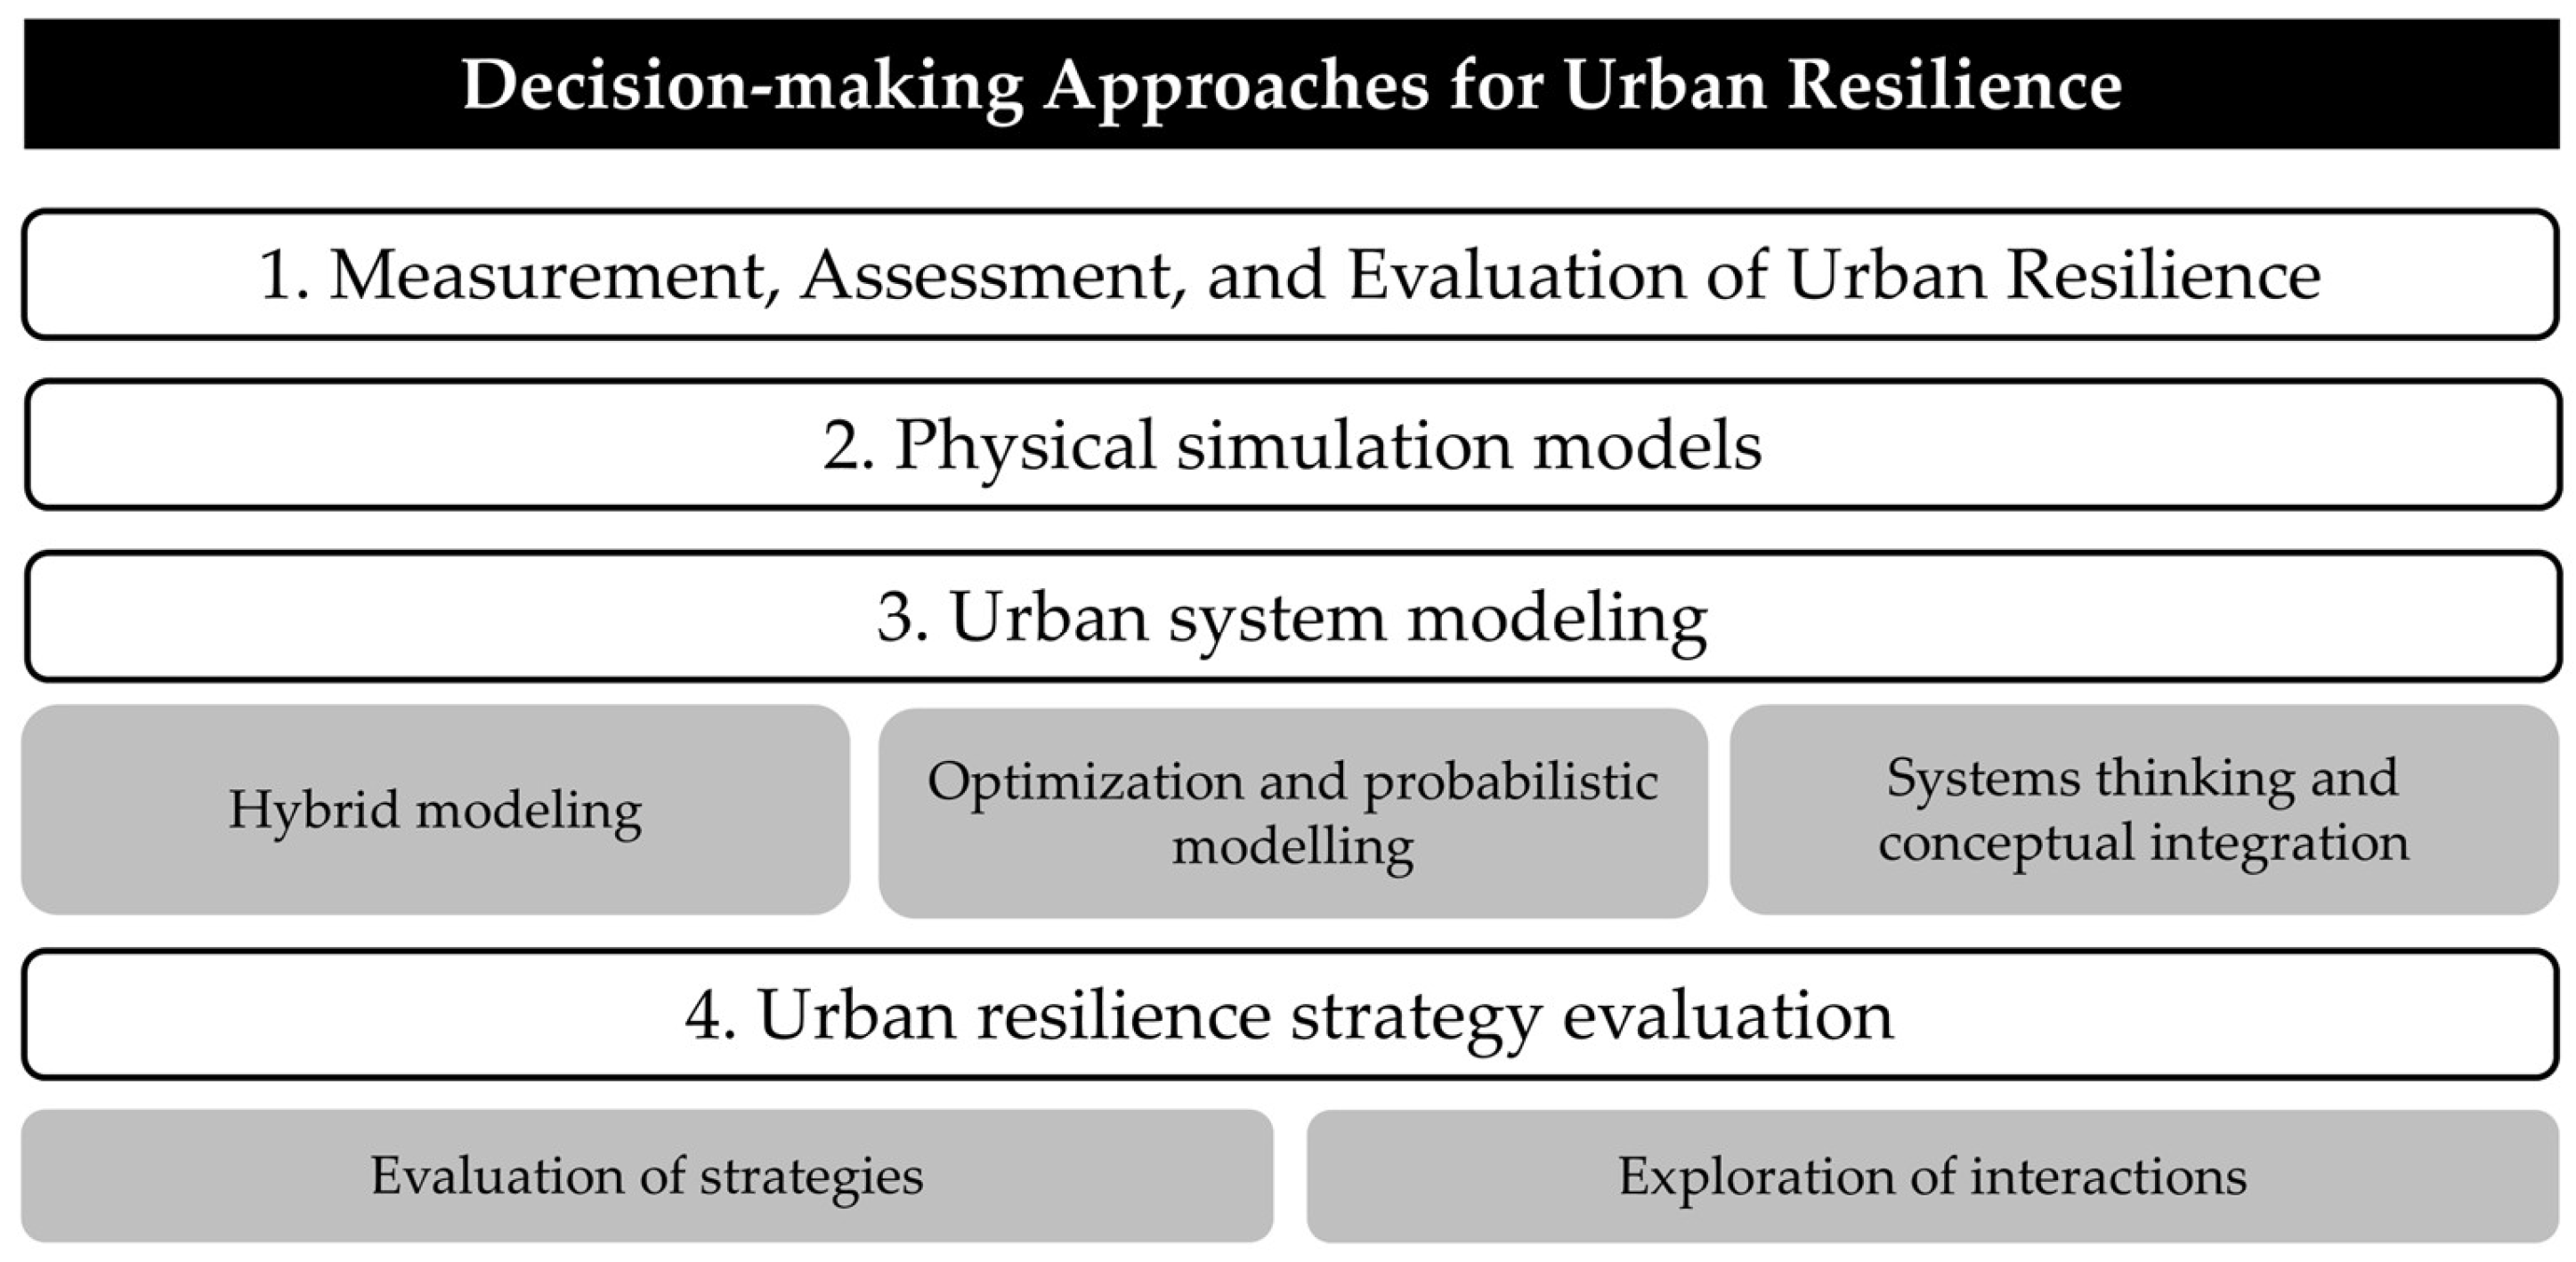
The existing literature on urban resilience decision-making techniques can be grouped into four broad categories (Figure 3). The first is measurement, assessment, and evaluation frameworks (e.g., UCRA, Sendai Framework, City Resilience Index, UNDRR Scorecard) [42,43,44,45,46], which provide structured indicators but are resource-intensive, retrospective, and require local adaptation. The second is physical simulation models (e.g., EnergyPlus, Envi-met, Rhino/Grasshopper plugins) [47,48], which can optimize design alternatives but demand significant expertise, assumptions, and computational power. The third, urban systems modeling, represents urban dynamics through computational tools such as system dynamics, agent-based, and location–allocation models [49,50]. Sub-approaches of this category include hybrid modeling that combines multiple techniques for scenario planning [51,52], optimization and probabilistic modeling for resilience assessment and resource allocation [53,54], and systems thinking for integrating resilience across domains [55,56]. While powerful, these models are conceptually complex, technically demanding, and risk oversimplifying real-world systems.
The fourth category, urban resilience strategy evaluation, is the least developed and focuses on assessing or comparing strategies rather than cases or designs. This includes evaluating specific strategies, such as prioritizing neighborhood solar energy projects based on cost, technical aspects, environmental impact, and social acceptance [41]. It also involves exploring interactions, including synergies—like combining urban greenery with building energy efficiency for amplified benefits [38]—and conflicts, such as tensions between green belt policies and flood zoning [37]. Despite their relevance, such studies remain scarce, and empirical evidence on integrated strategies is limited.
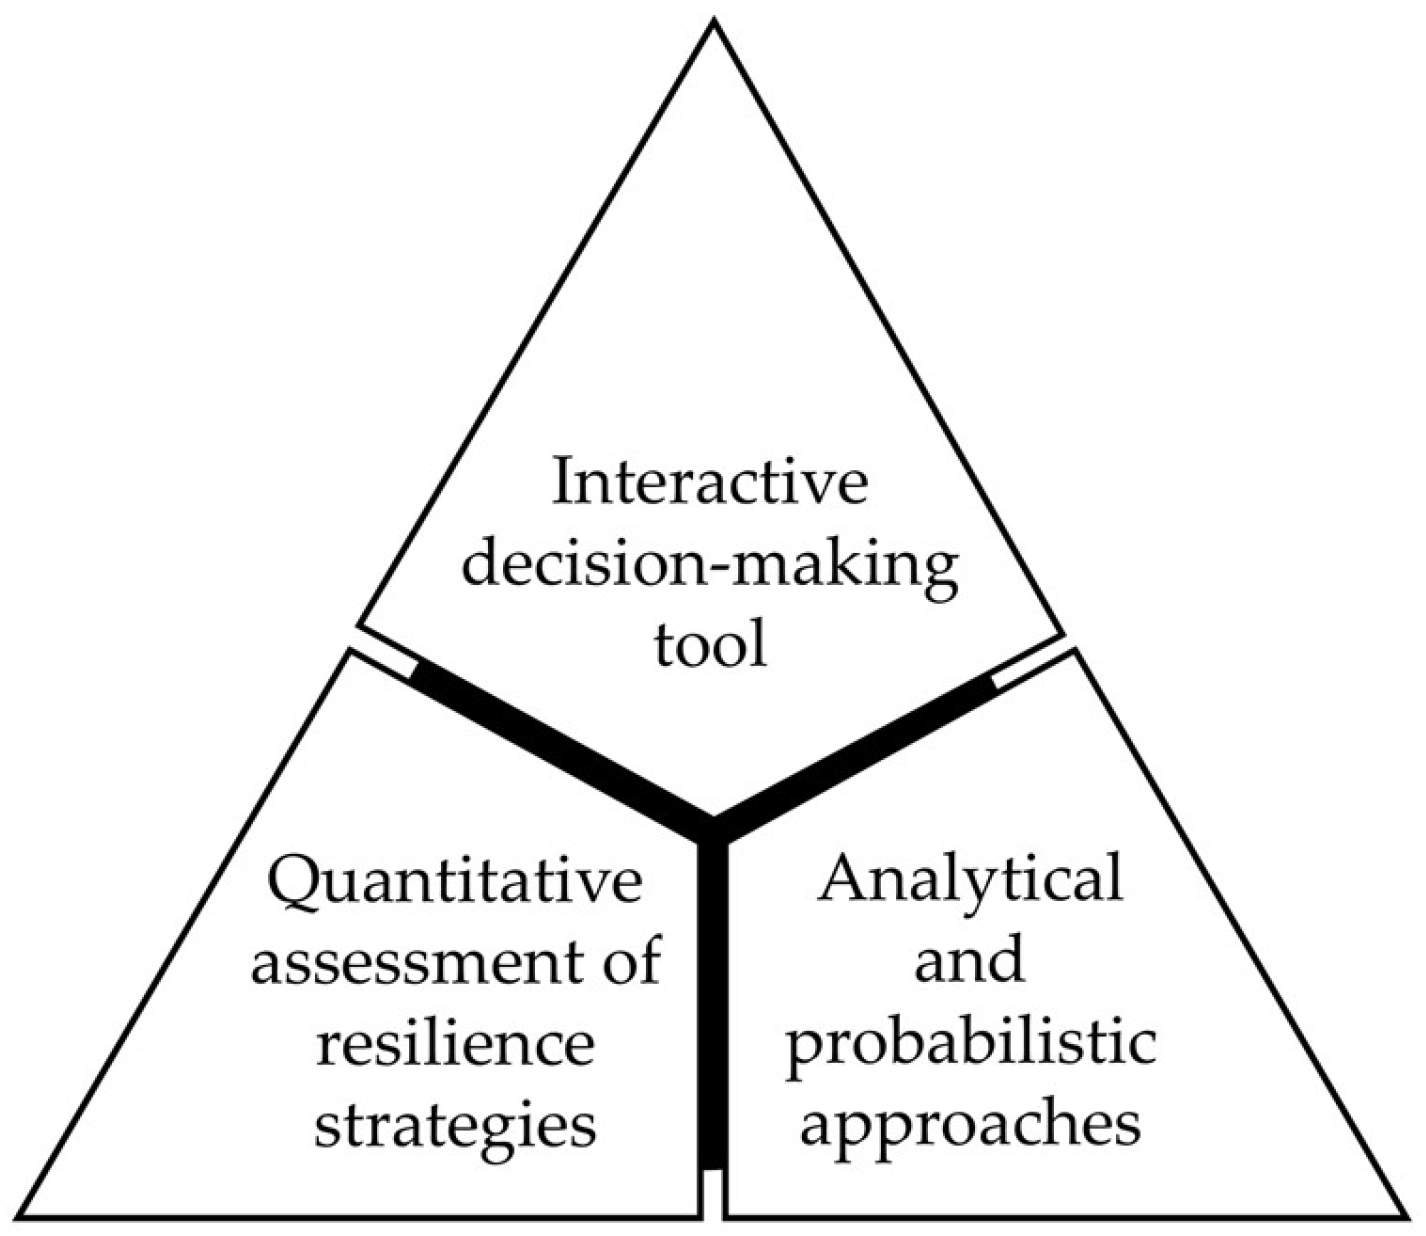
From this literature review, various research gaps appear, conceptually shown in Figure 4. First, the assessment of strategies rather than the designs or cases is very rare in the literature. Second, interactive decision-making instead of general guidelines is lacking. Finally, there is a need for probabilistic approaches that incorporate uncertainties.
Thus, the objective of this study is to develop an early decision-making data-driven tool for evaluating resilience strategies in cold-climate urban areas at both the building component and neighborhood levels. This will work as a screening tool for helping in prioritizing the set of strategies that will be designed and further explored later.

2. Materials and Methods

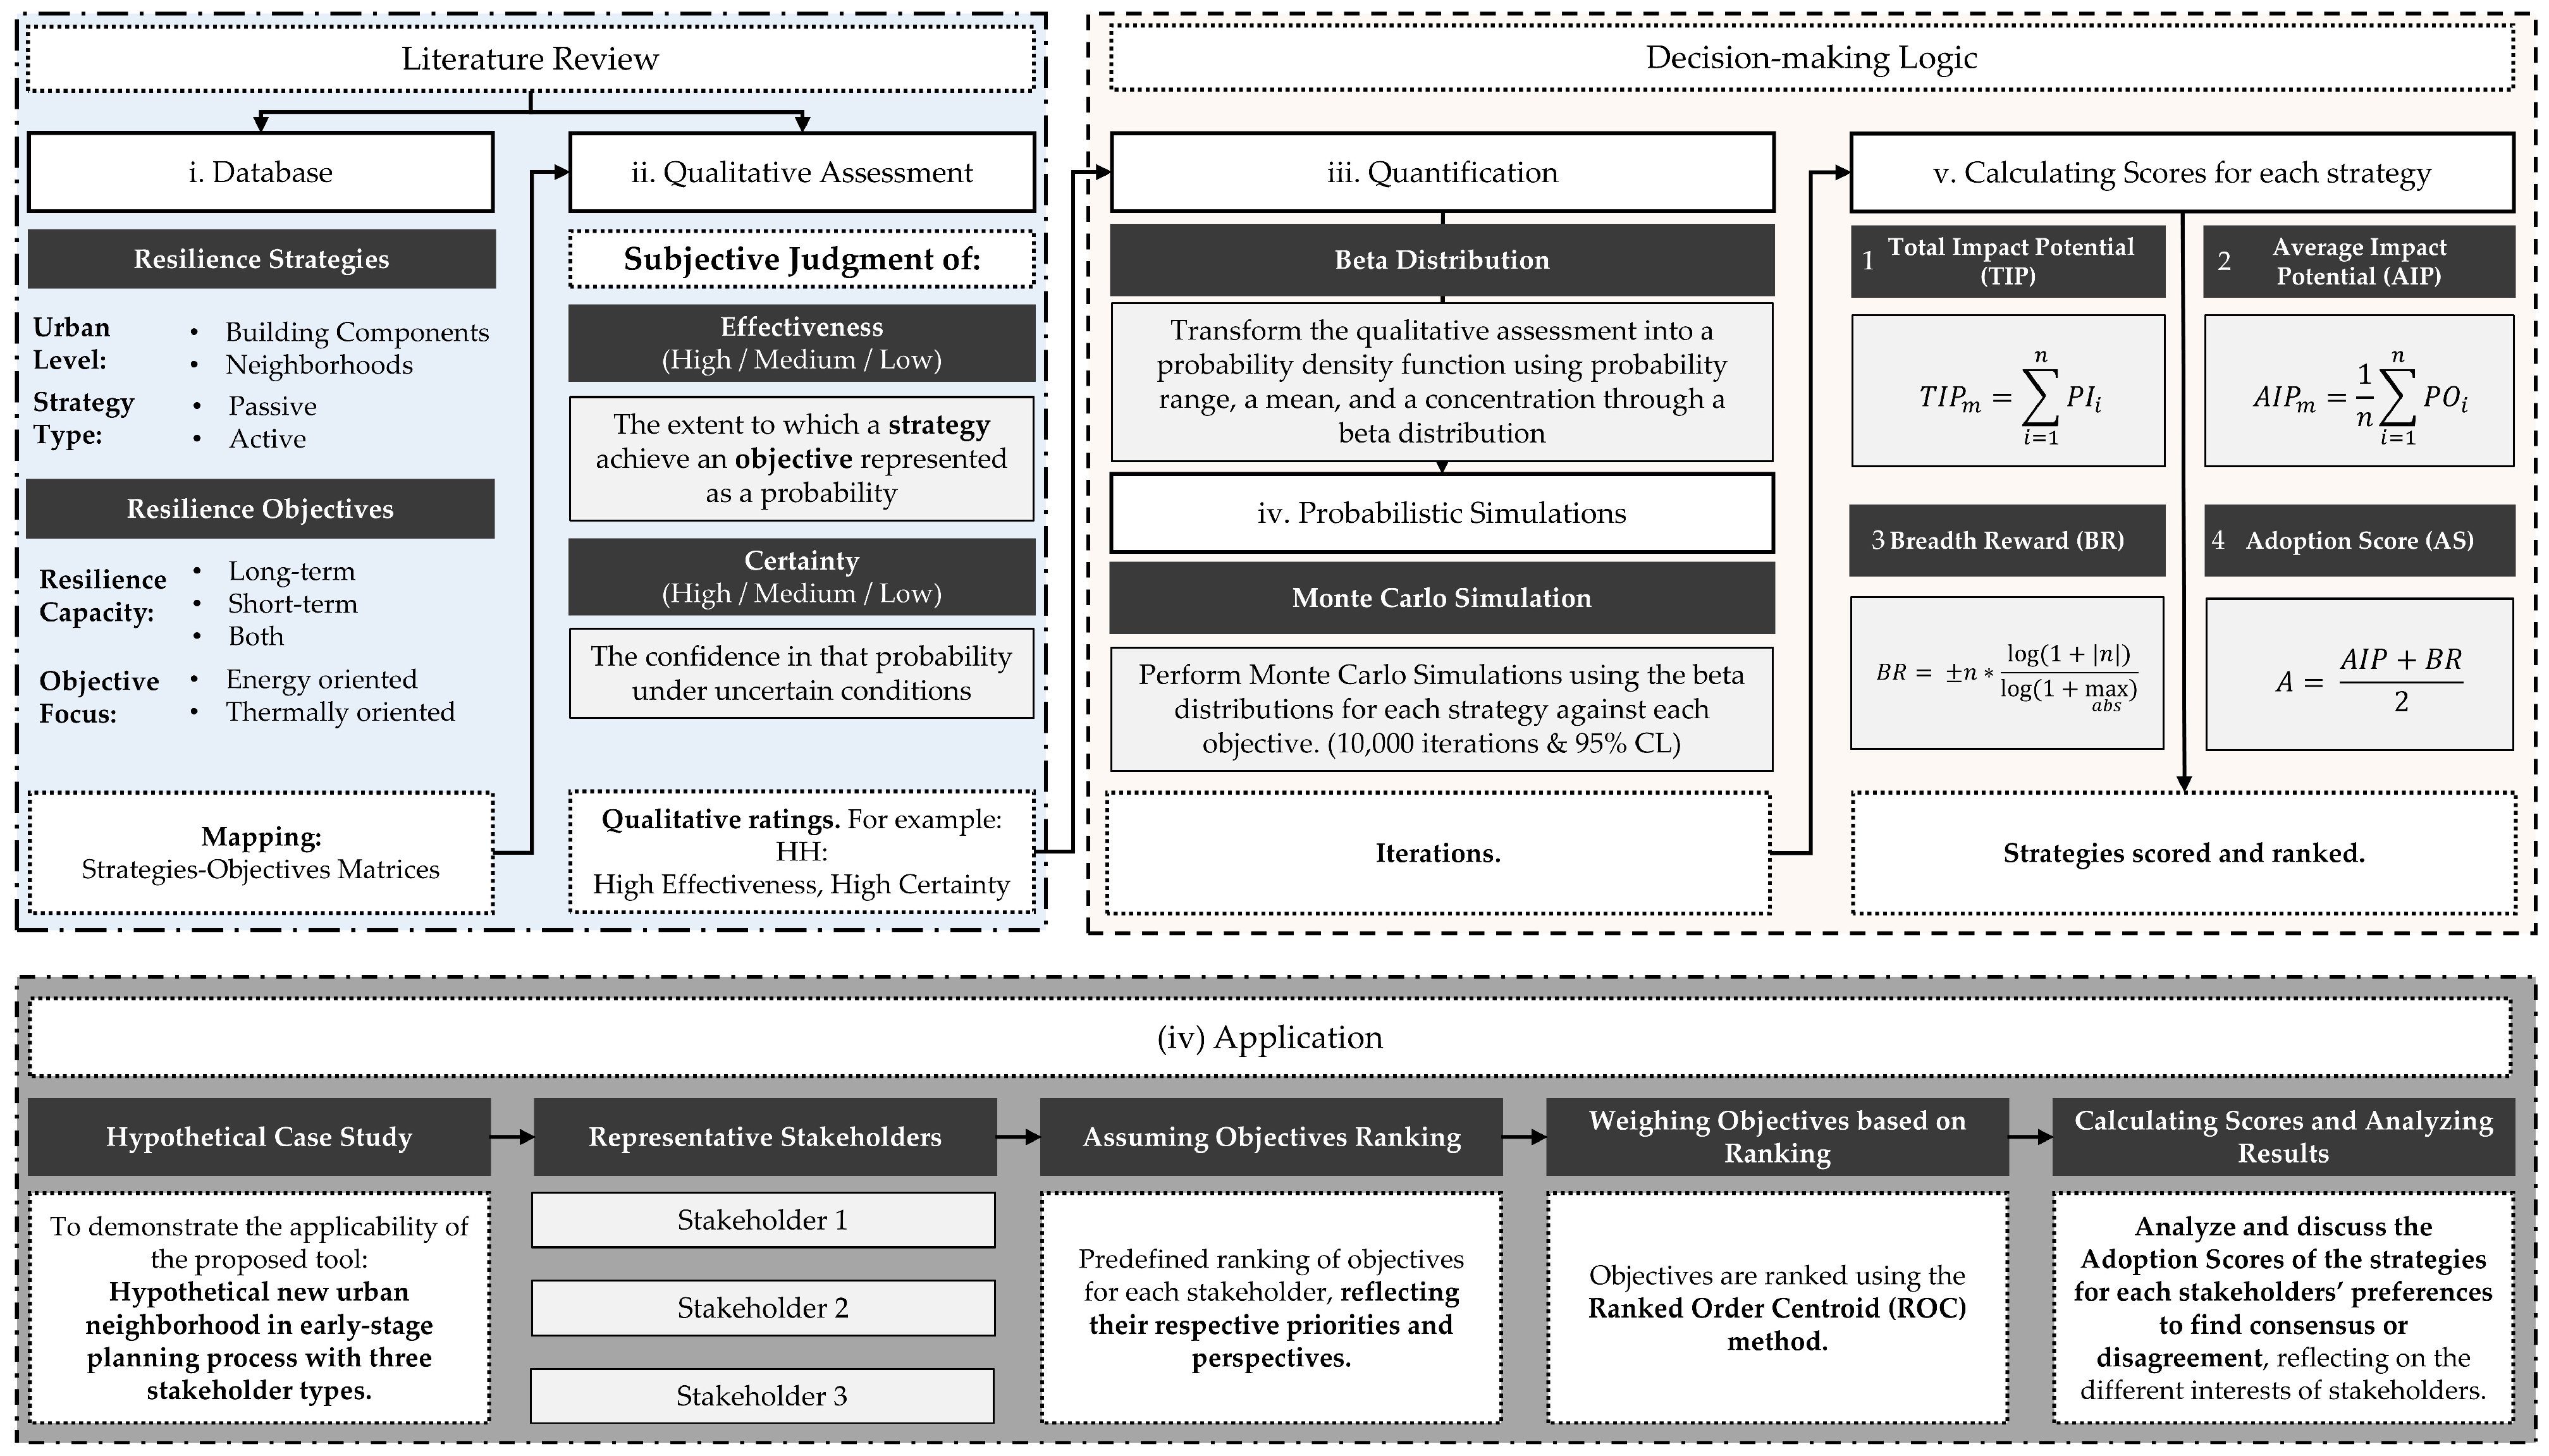
This research adopts an integrated decision-making approach to evaluate passive and active resilience strategies at both the building component and neighborhood scales in cold-climate regions, specifically those classified as Dfb under the Köppen system (humid continental, warm summers, cold snowy winters). A data-driven framework is proposed, addressing two key complexities from the literature—resilience capacities and objectives—through five steps: (i) Database Creation: mapping and linking strategies to objectives; (ii) Qualitative Assessment: integrating subjective assessment of effectiveness and performance certainty of strategies; (iii) Quantification: converting qualitative data into probability density functions to capture uncertainty; (iv) Probabilistic Simulations: using Monte Carlo to model future outcomes; (v) Calculating Scores: producing decision-making scores; and (iv) Application: applying the tool to a hypothetical case study. Figure 5 illustrates the methodology.
(i) Database:
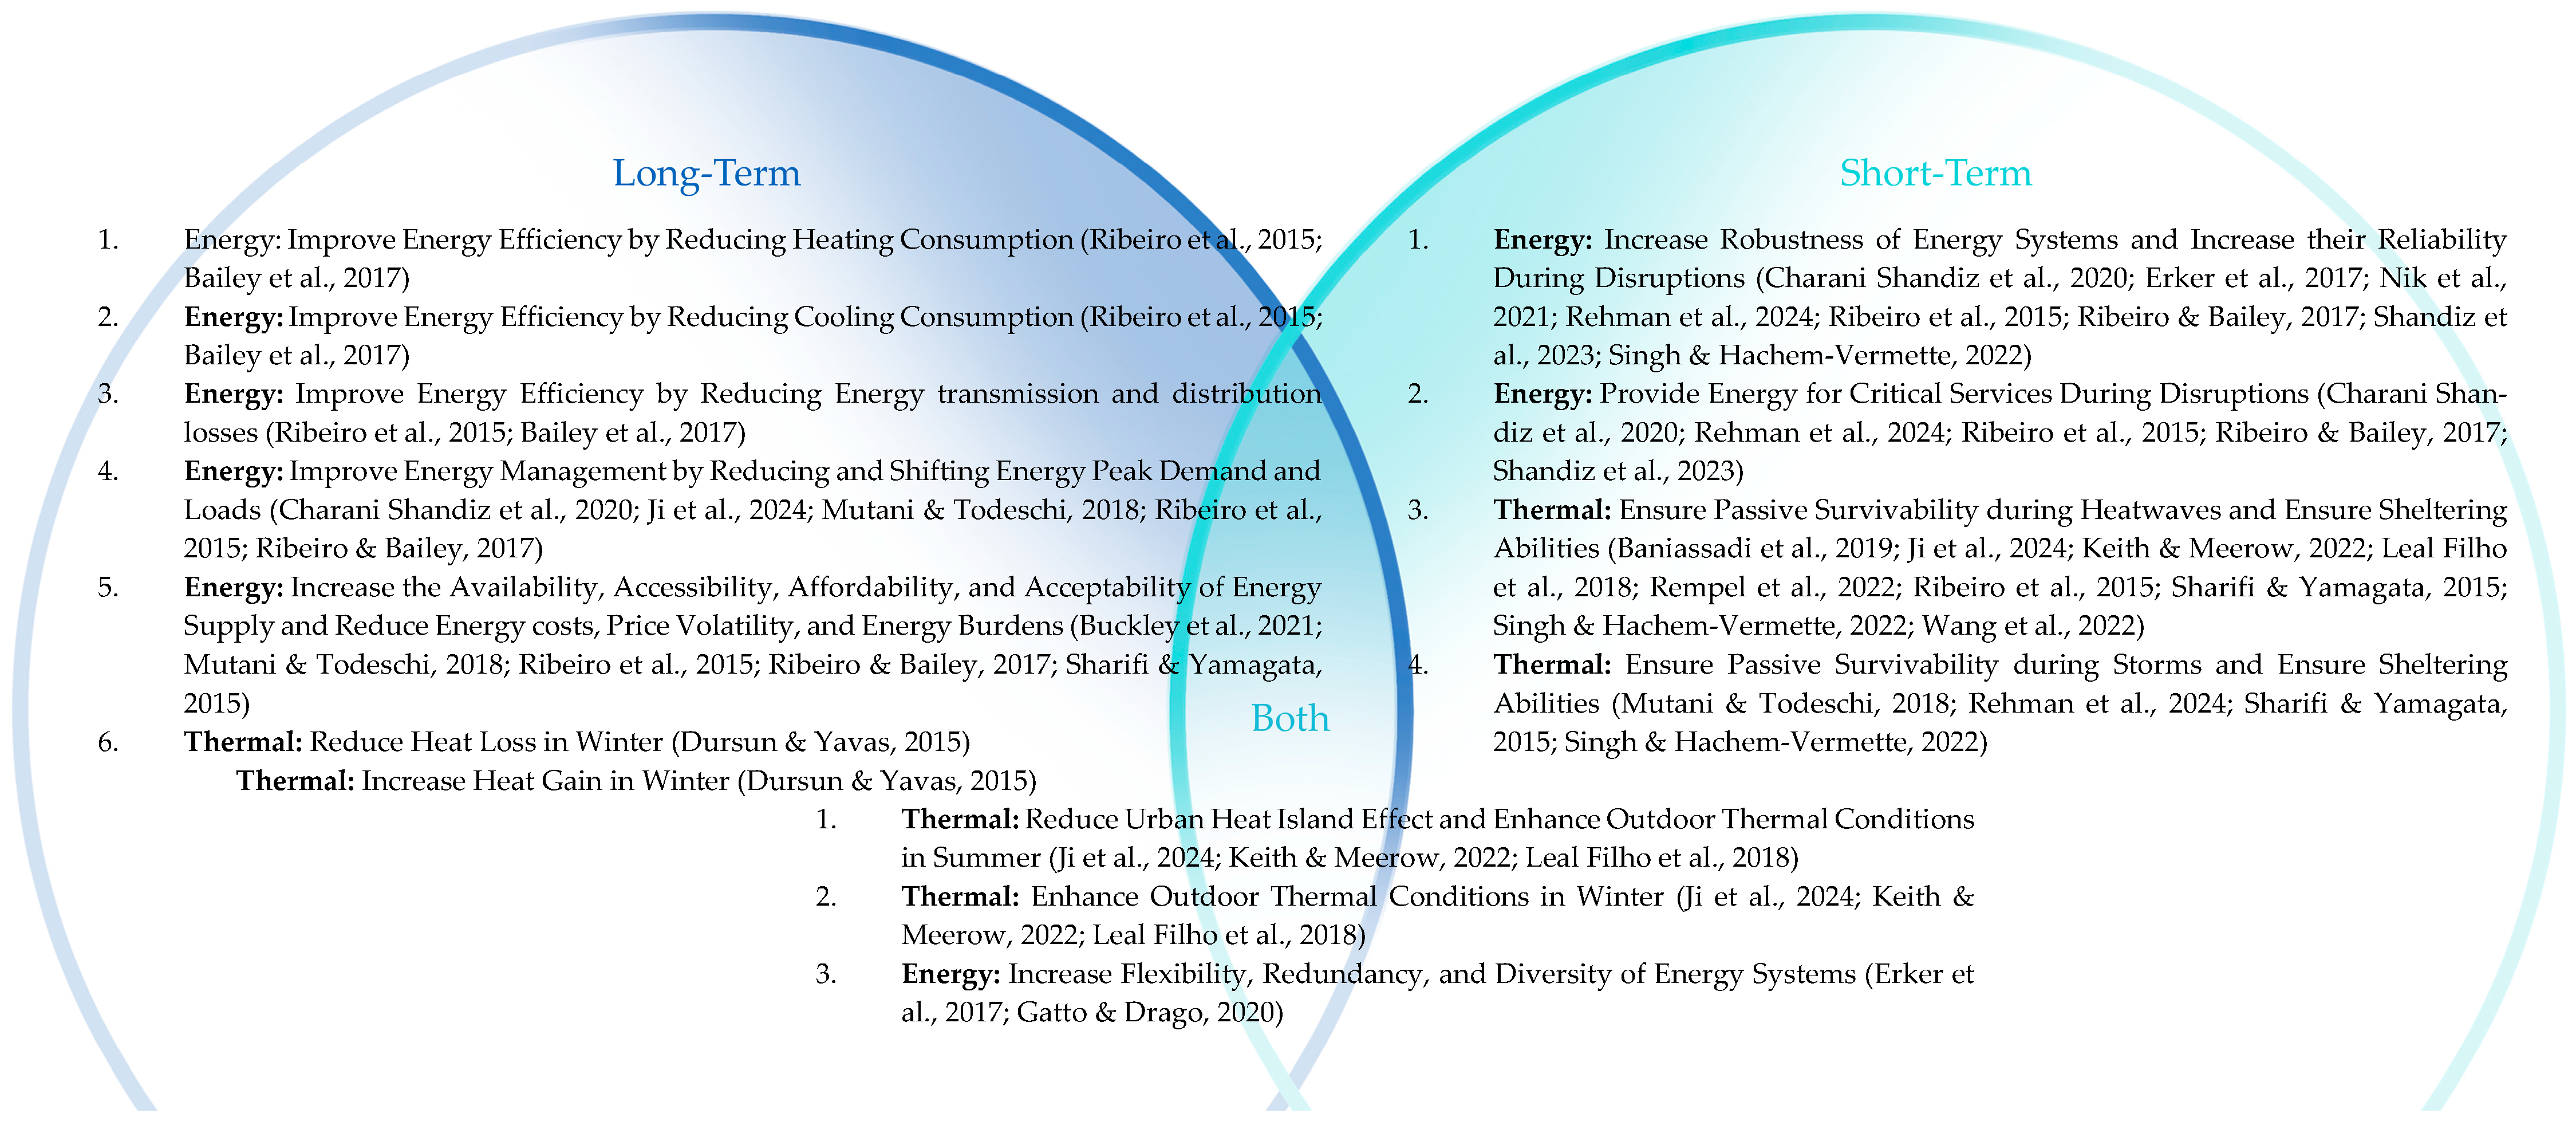
According to the defined scope, resilience objectives and strategies were identified from the relevant literature. The objectives were classified based on their contribution to resilience capacities—short-term, long-term, or both—and their primary focus, whether energy-oriented or thermally oriented. Strategies were classified by their urban level (components or neighborhood) and by their type (passive or active). Each strategy was then mapped to the corresponding resilience objective based on evidence from the literature, indicating whether the strategy has an impact that is positive or negative on each objective. The objectives are shown in Figure 6. In total, there are 14 objectives. Seven of them contribute to long-term resilience capacity, four contribute to short-term resilience capacity, and three contribute to both resilience capacities. There are eight that contribute to energy-oriented objectives and six that contribute to thermally oriented objectives.
Table 1 and Table 2 show the databases of strategies in the two urban levels. Appendix A contains a detailed description of these strategies.
(ii) Qualitative Assessment:
After forming the strategies database, evidence from the literature was extracted for each strategy against each defined objective based on two parameters: (i) Effectiveness: captures the extent to which the strategy can achieve its intended objective; and (ii) Certainty: reflects how confident we can be in that effect, given contextual, implementation, and operational uncertainties. Both were rated subjectively by the authors as high, medium, or low based on interpretation of the available literature. This gives each strategy a two-letter qualitative assessment. For example, (HH) refers to a strategy that has high effectiveness achieving an objective and high certainty in performance. A (NHH) refers to a strategy with high effectiveness and high certainty negative impact.
For example, employing RES—such as solar thermal collectors or photovoltaics—is an active strategy applicable at both the neighborhood and building component levels. RES has high effectiveness in improving the reliability of energy systems during disruptions. However, their performance might have low certainty due to intermittency and strong dependence on contextual factors. In contrast, building envelope insulation, a passive strategy at the building component level, demonstrates high effectiveness in reducing heating consumption and high certainty that this impact will be realized. This two-layer approach provides a deeper, more nuanced assessment that incorporates both the expected strength of a strategy’s impact and the confidence in that expectation. Table 3 shows the qualitative assessment rates. Table 4 and Table 5 show the qualitative assessment of strategies at the building component and neighborhood levels, respectively. To elaborate, a strategy with an HH assessment in a specific objective means it has high effectiveness and high certainty in achieving that objective. Having an N at the beginning of the assessment means the impact of the strategy is negative in the objective in question.
(iii) Quantification:
In decision analysis theory, multi-objective decision analysis often involves estimating the probability that a specific alternative will achieve a given objective, then organizing these estimates into an objectives–alternatives matrix [146]. The overall utility of each alternative is calculated by summing its probabilities across all objectives. These probabilities can be derived from direct observation, subjective expert judgment, or a Bayesian approach that combines both [146]. However, such methods typically produce deterministic probabilities, which may overlook uncertainty arising from context dependency and variations in implementation. To address this, we propose representing probabilities as ranges, [0.2, 1.0] for positive impacts and [−1.0, −0.2] for negative impacts, allowing for high levels of uncertainty to be incorporated and enabling more meaningful, context-sensitive comparisons among strategies.
The Beta distribution is used to model these probabilities due to its flexibility in capturing different uncertainty patterns. A concentration parameter (κ) controls the spread: higher κ indicates greater certainty (narrower spread), while lower κ reflects higher uncertainty (wider spread). This allows integration of qualitative assessments—Effectiveness as the mean probability and Certainty as the spread—into a probability model for each strategy–objective pair. The Beta distribution parameters are calculated as follows:
κ = α + β
μ = α α + β
α = κ     μ
β = κ     ( 1 μ )
Although the Beta distribution is defined on [0, 1], it can be scaled to custom ranges.
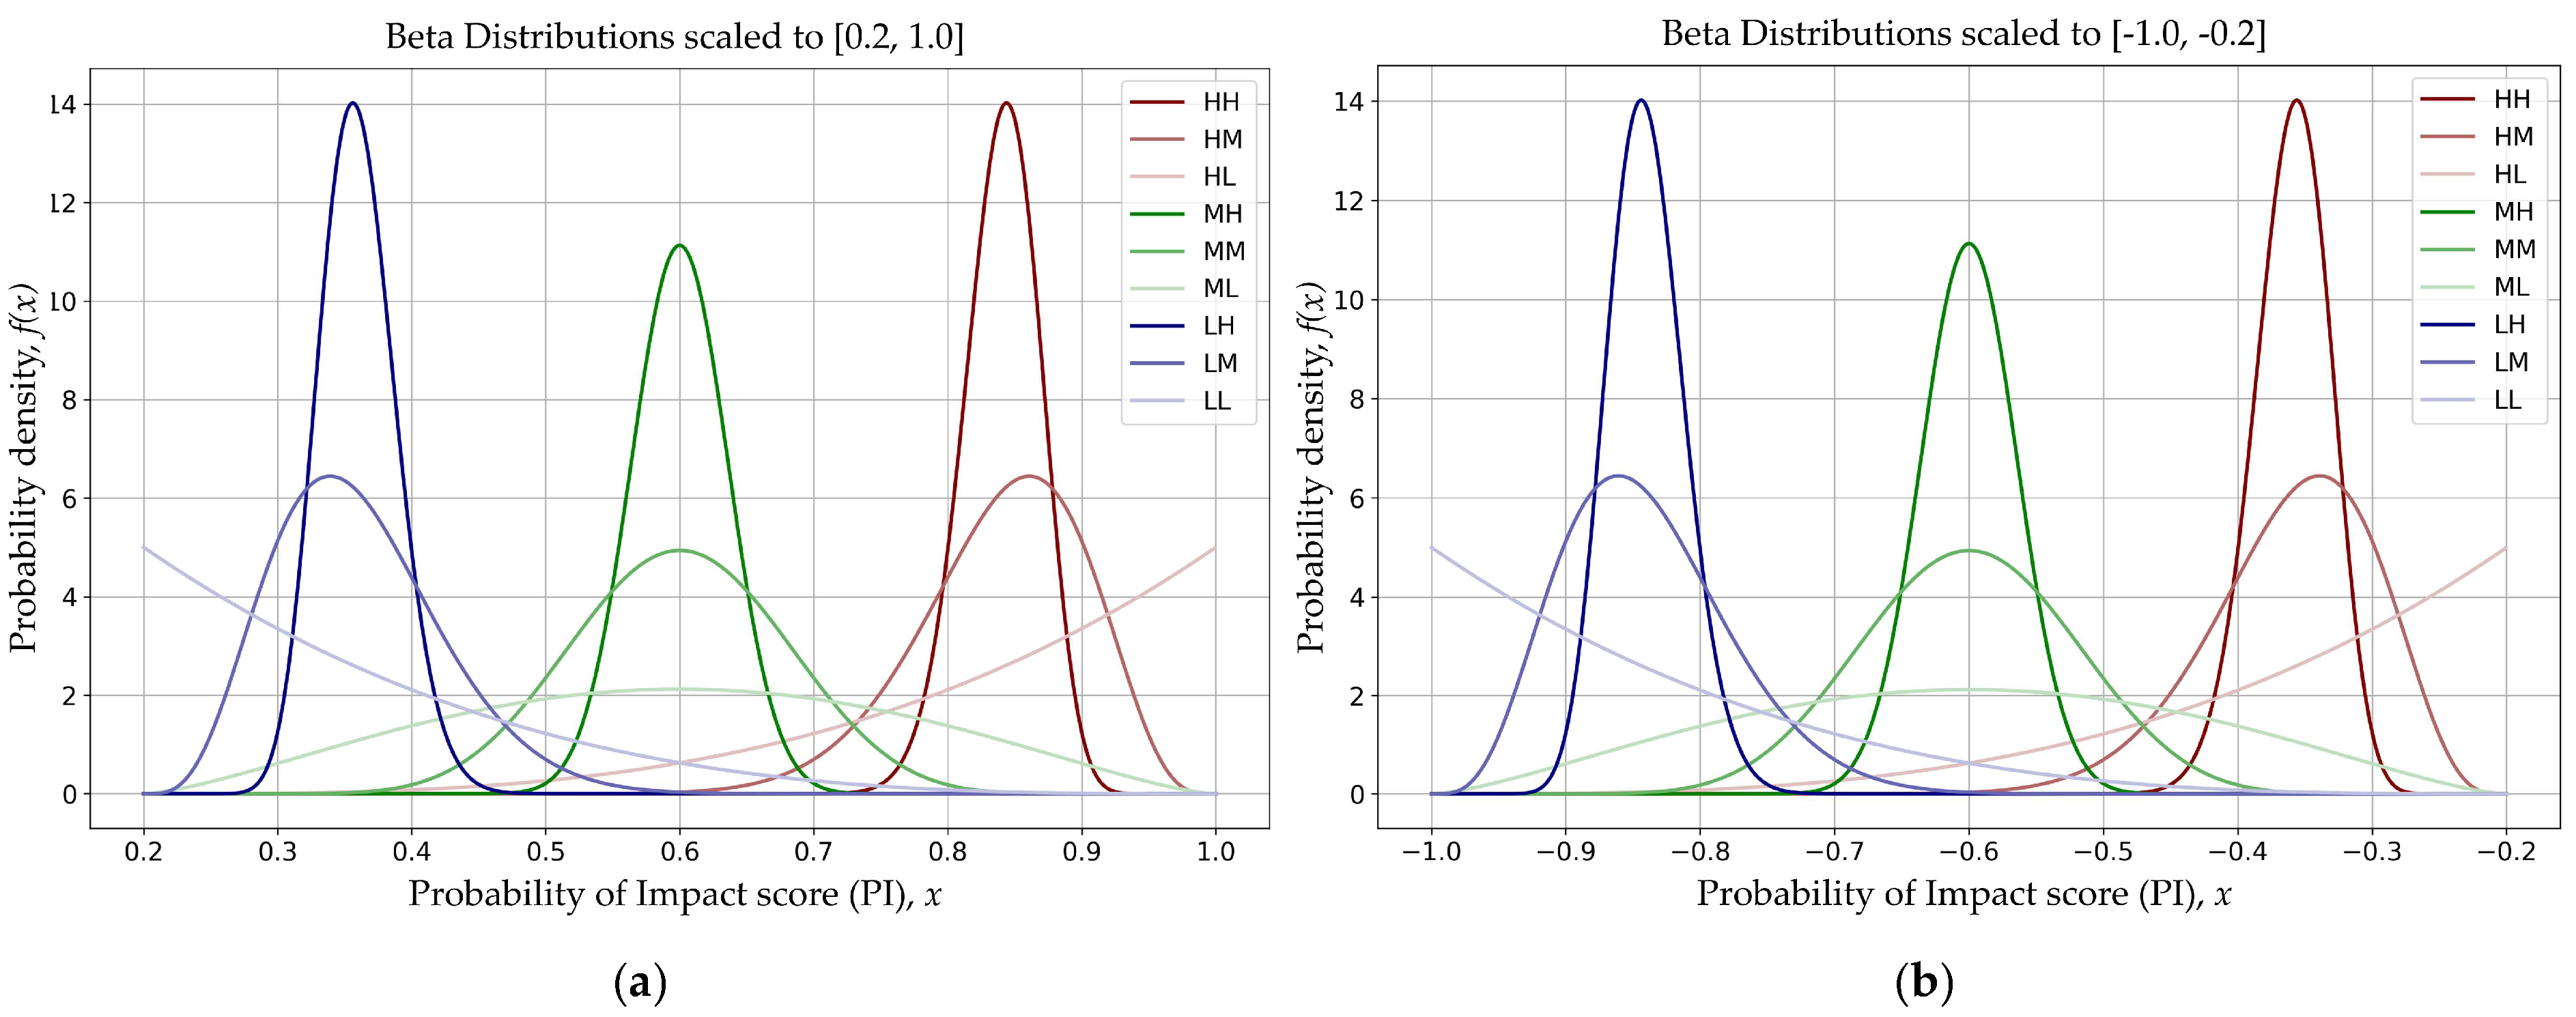
Table 6 and Table 7 show the assumed means in the original and scaled ranges, while Figure 7 illustrates probability distribution functions for different cases of strategy effectiveness (impact strength) and certainty (confidence in impact).
(iv) Probabilistic Simulations:
Monte Carlo simulations (MCS) are applied to capture the uncertainty inherent in strategy performance by running thousands of probabilistic iterations. This approach combines random value generation with statistical probability distributions, enabling a realistic representation of possible outcomes. In our framework, effectiveness (mean probability) and certainty (spread) values from the qualitative assessment are used to parameterize Beta distributions for each strategy–objective pair. MCS then samples across these distributions—10,000 iterations at a 95% confidence level, as synthesized from urban studies literature [147,148,149,150,151,152]—to estimate the range and likelihood of outcomes. Iterations were performed using a customized Python code.
To evaluate the reliability of simulation outputs, the coefficient of variation (CoV) is calculated, which expresses relative dispersion as the ratio of the standard deviation to the mean. A threshold of 30% is adopted based on the literature [153], with lower values indicating higher reliability. Since CoV becomes unstable when mean values are near zero, the interquartile range (IQR) is used to assess spread in such cases, ensuring comparability of results with other strategies with stable CoV values. CoV can be calculated through Equation (5):
C o V = σ μ     100
σ: standard deviation of the data. μ: mean of the data.
(v) Calculating Scores:
For each strategy, every Monte Carlo iteration produces a probability of impact score for each objective i (PIᵢ). These PIᵢ scores form probability distributions from which statistical measures—such as the mean, best-case (95th percentile), and worst-case (5th percentile) values—can be derived. To enable a holistic comparison of strategies, the Total Impact Potential (TIP) is calculated by summing the PIᵢ values across all objectives affected by the strategy, whether the influence is positive or negative according to Equation (6):
T I P m = i = 1 n P I i
Here, TIPₘ is the Total Impact Potential of strategy m, n is the number of objectives addressed, and PIᵢ is the probability of impacting objective i. To provide a scaled measure, TIP is normalized by the number of objectives addressed, producing the Average Impact Potential (AIP) in Equation (7):
A I P m = 1 n i = 1 n P I i
This represents the average probability of impact per objective for a strategy. However, it does not reward strategies with more objectives. To solve this, a Breadth Reward score (BR) is introduced, based on a logarithmic diminishing returns function. This approach rewards strategies that address more objectives while avoiding disproportionate favoritism toward those with excessive counts. The score is calculated with Equation (8):
B R =   s i g n n log 1 + n l o g ( 1 + m a x _ a b s )
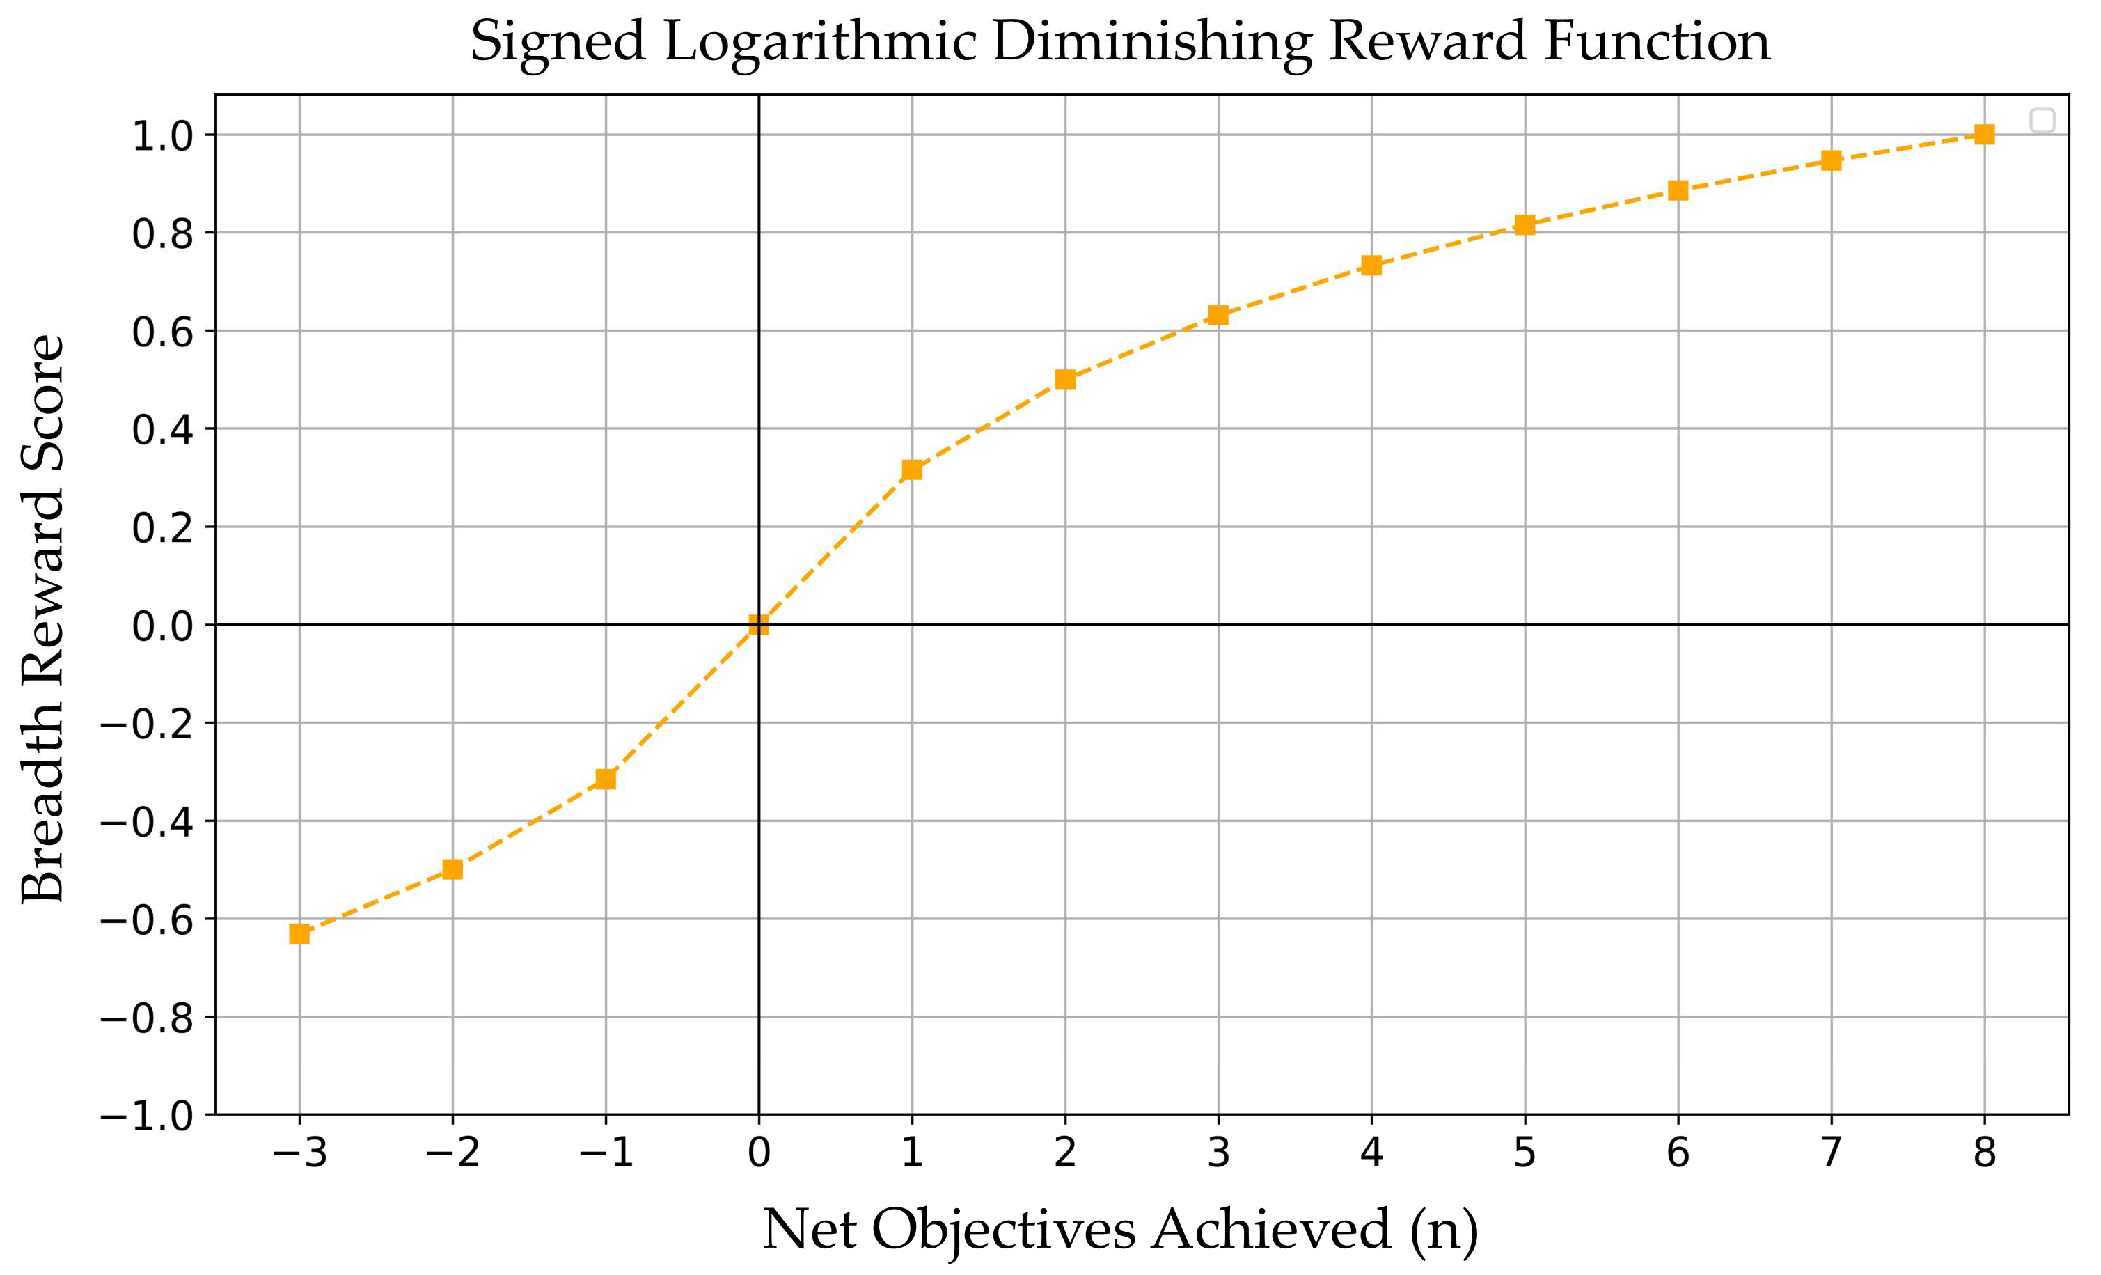
where n is the net number of objectives impacted by the strategy, and (max_abs) is the maximum absolute net number of objectives observed in the database. This ensures normalization within the range [−1, 1]. The use of the signed logarithmic scale allows for capturing both positive and negative contributions, while also reducing the influence of outliers. Figure 8 shows a visual representation of this scoring model, showing how scores increase at a decreasing rate and symmetrically account for negative impacts. Table 8 shows the exact result for net objectives achieved.
Finally, to provide a single intuitive measure for decision-making, the Adoption (A) score combines the normalized performance (AIP) with the Breadth Reward (BR) in Equation (9):
A =   A I P + B R 2
This integration ensures that strategies are evaluated not only for their average probability of impact but also for the number of objectives they address.
(vi) Application:
To illustrate the applicability of the proposed decision-support tool, the tool was applied to a hypothetical new urban neighborhood. This demonstrates the framework’s processes without requiring real-world data, while highlighting its relevance for early-stage urban planning and resilience assessment. This involved several steps:
  • Stakeholder Identification and Objectives: Three representative stakeholders were assumed with distinct priorities reflecting typical urban planning contexts (Figure 9).
From the set of 14 objectives, the 7 most important objectives for each stakeholder were assumed and ranked according to their strategic priorities.
  • Objective Weighting Using Ranked Order Centroid (ROC): The ranked objectives were then converted into numerical weights using the Ranked Order Centroid (ROC) method. This approach assigns decreasing weights from the most to the least important objective while ensuring the total sum of weights equals one for each stakeholder. ROC provides a simple yet effective method to incorporate ordinal preferences into quantitative analysis, particularly suitable when precise utility values are unavailable. The weight for an objective at rank i ( w i ) is calculated by Equation (10):
w i = 1 n k = i n 1 k
where n is the total number of objectives and i is the rank of the objective. Table 9 shows the weights:
  • Probabilistic Simulations: Monte Carlo simulations were performed to account for uncertainty in the strategy’s potential impact on each objective for each stakeholder.
  • Calculating Scores: Scores were calculated while taking the objectives’ weights into account. TIP is normalized by weighted equal sum, producing the Weighted Impact Potential (WIP), an equivalent to AIP score, through Equation (11):
    W I P m = i = 1 n w i P I i
The Breadth Reward (BR) score and Adoption (A) score are then calculated according to previous equations. These scores demonstrate how different strategies perform according to diverse priorities, highlighting trade-offs among stakeholders.

3. Results

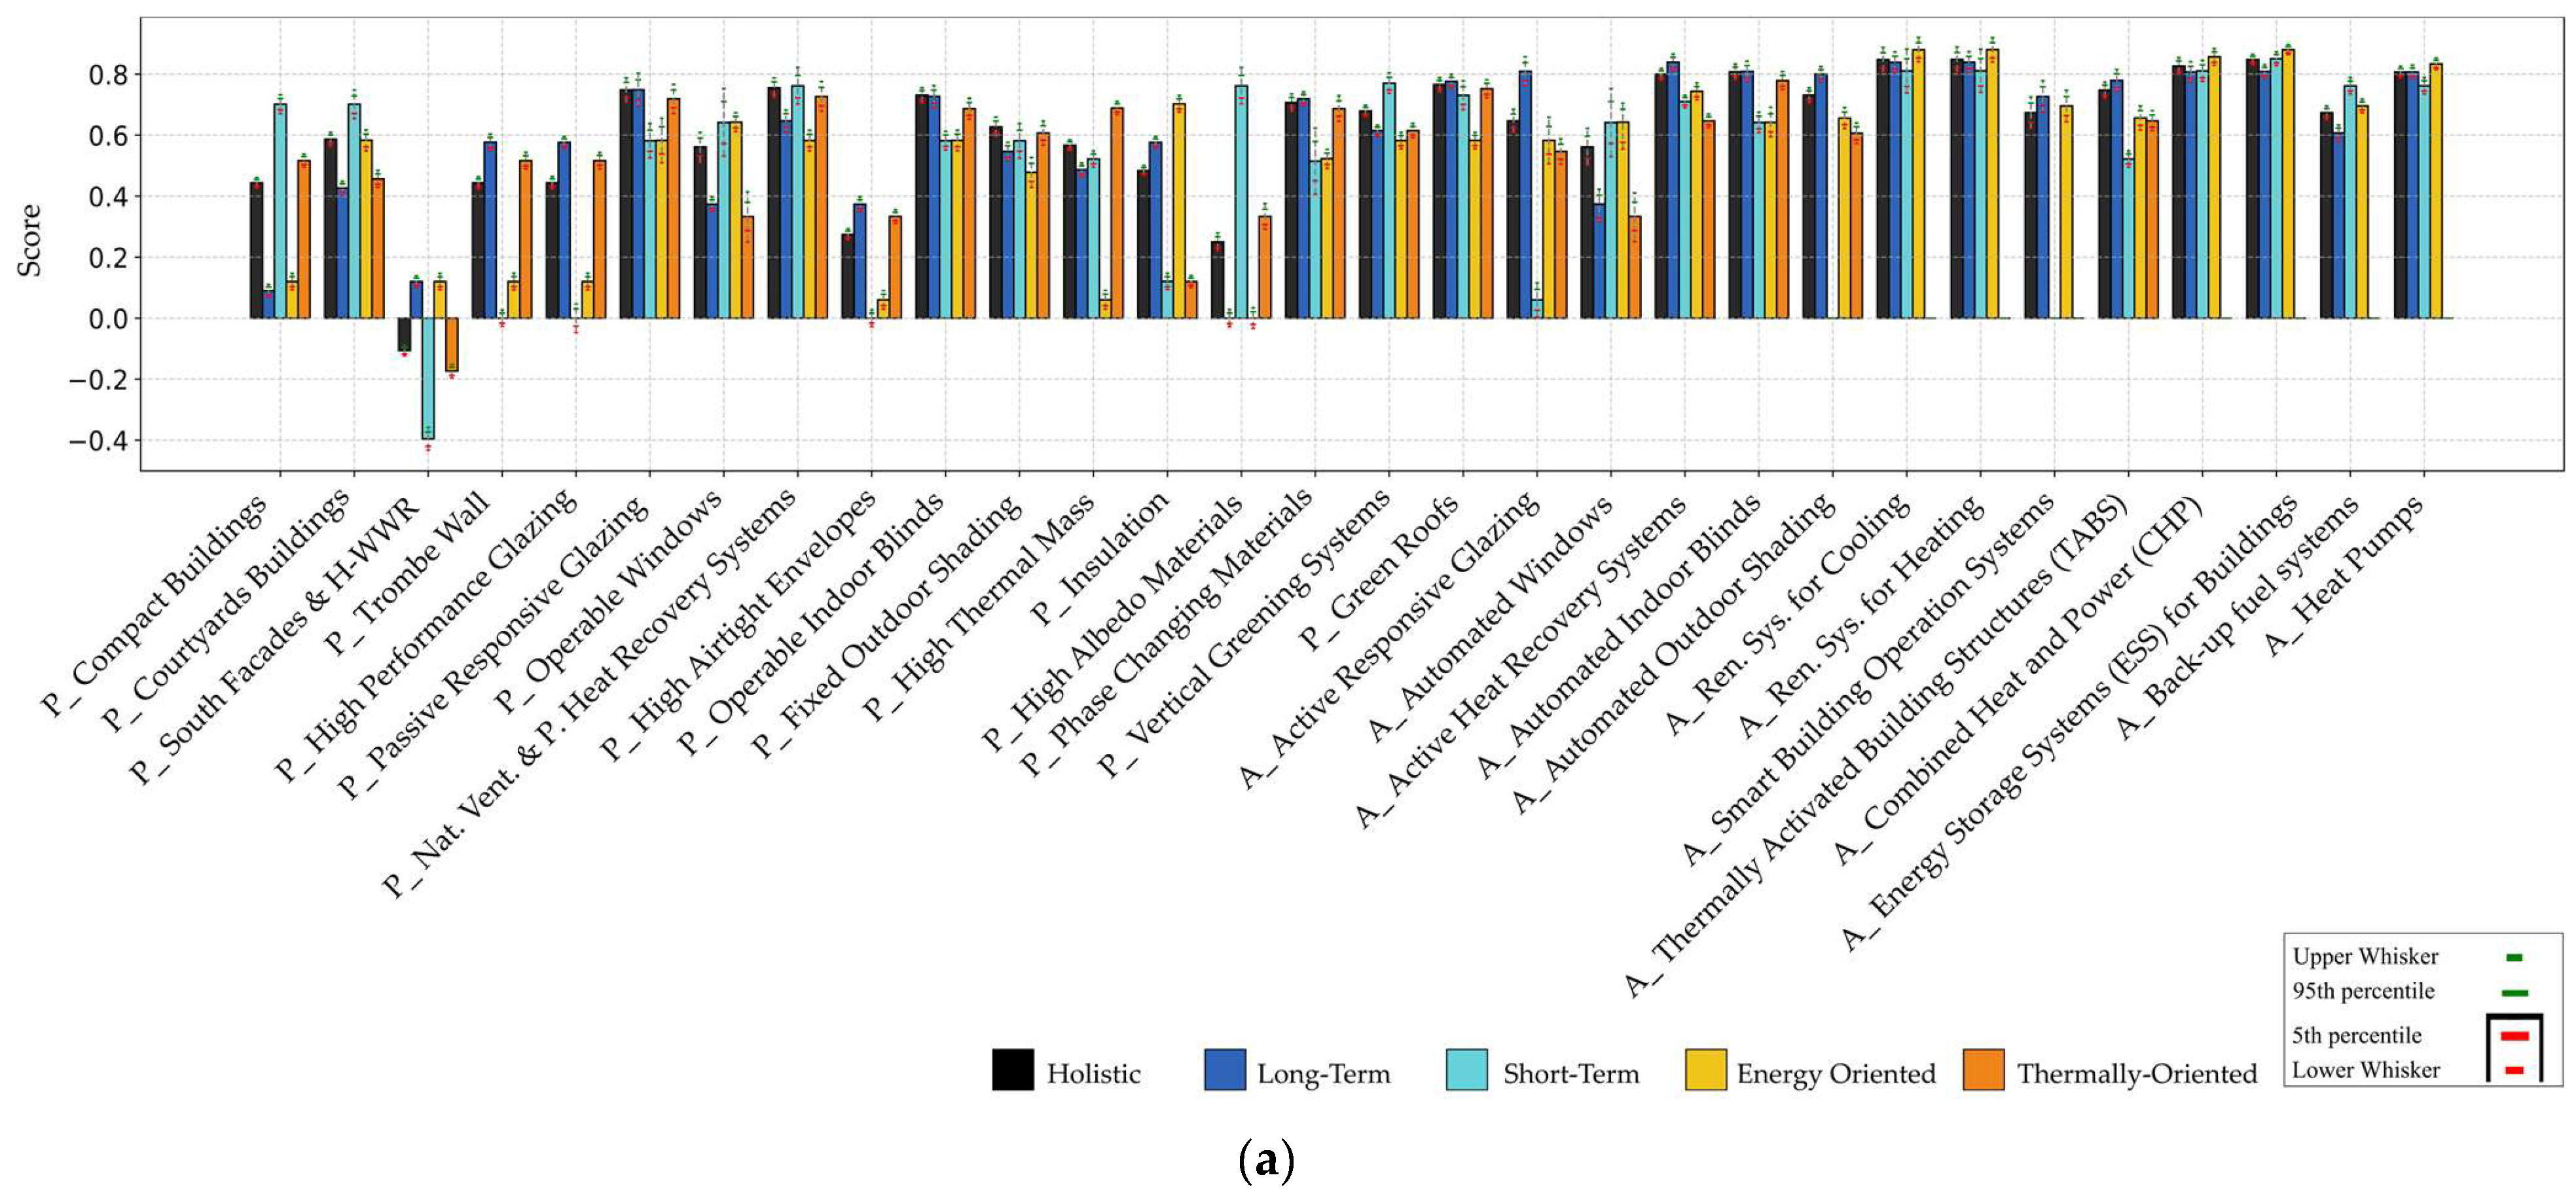
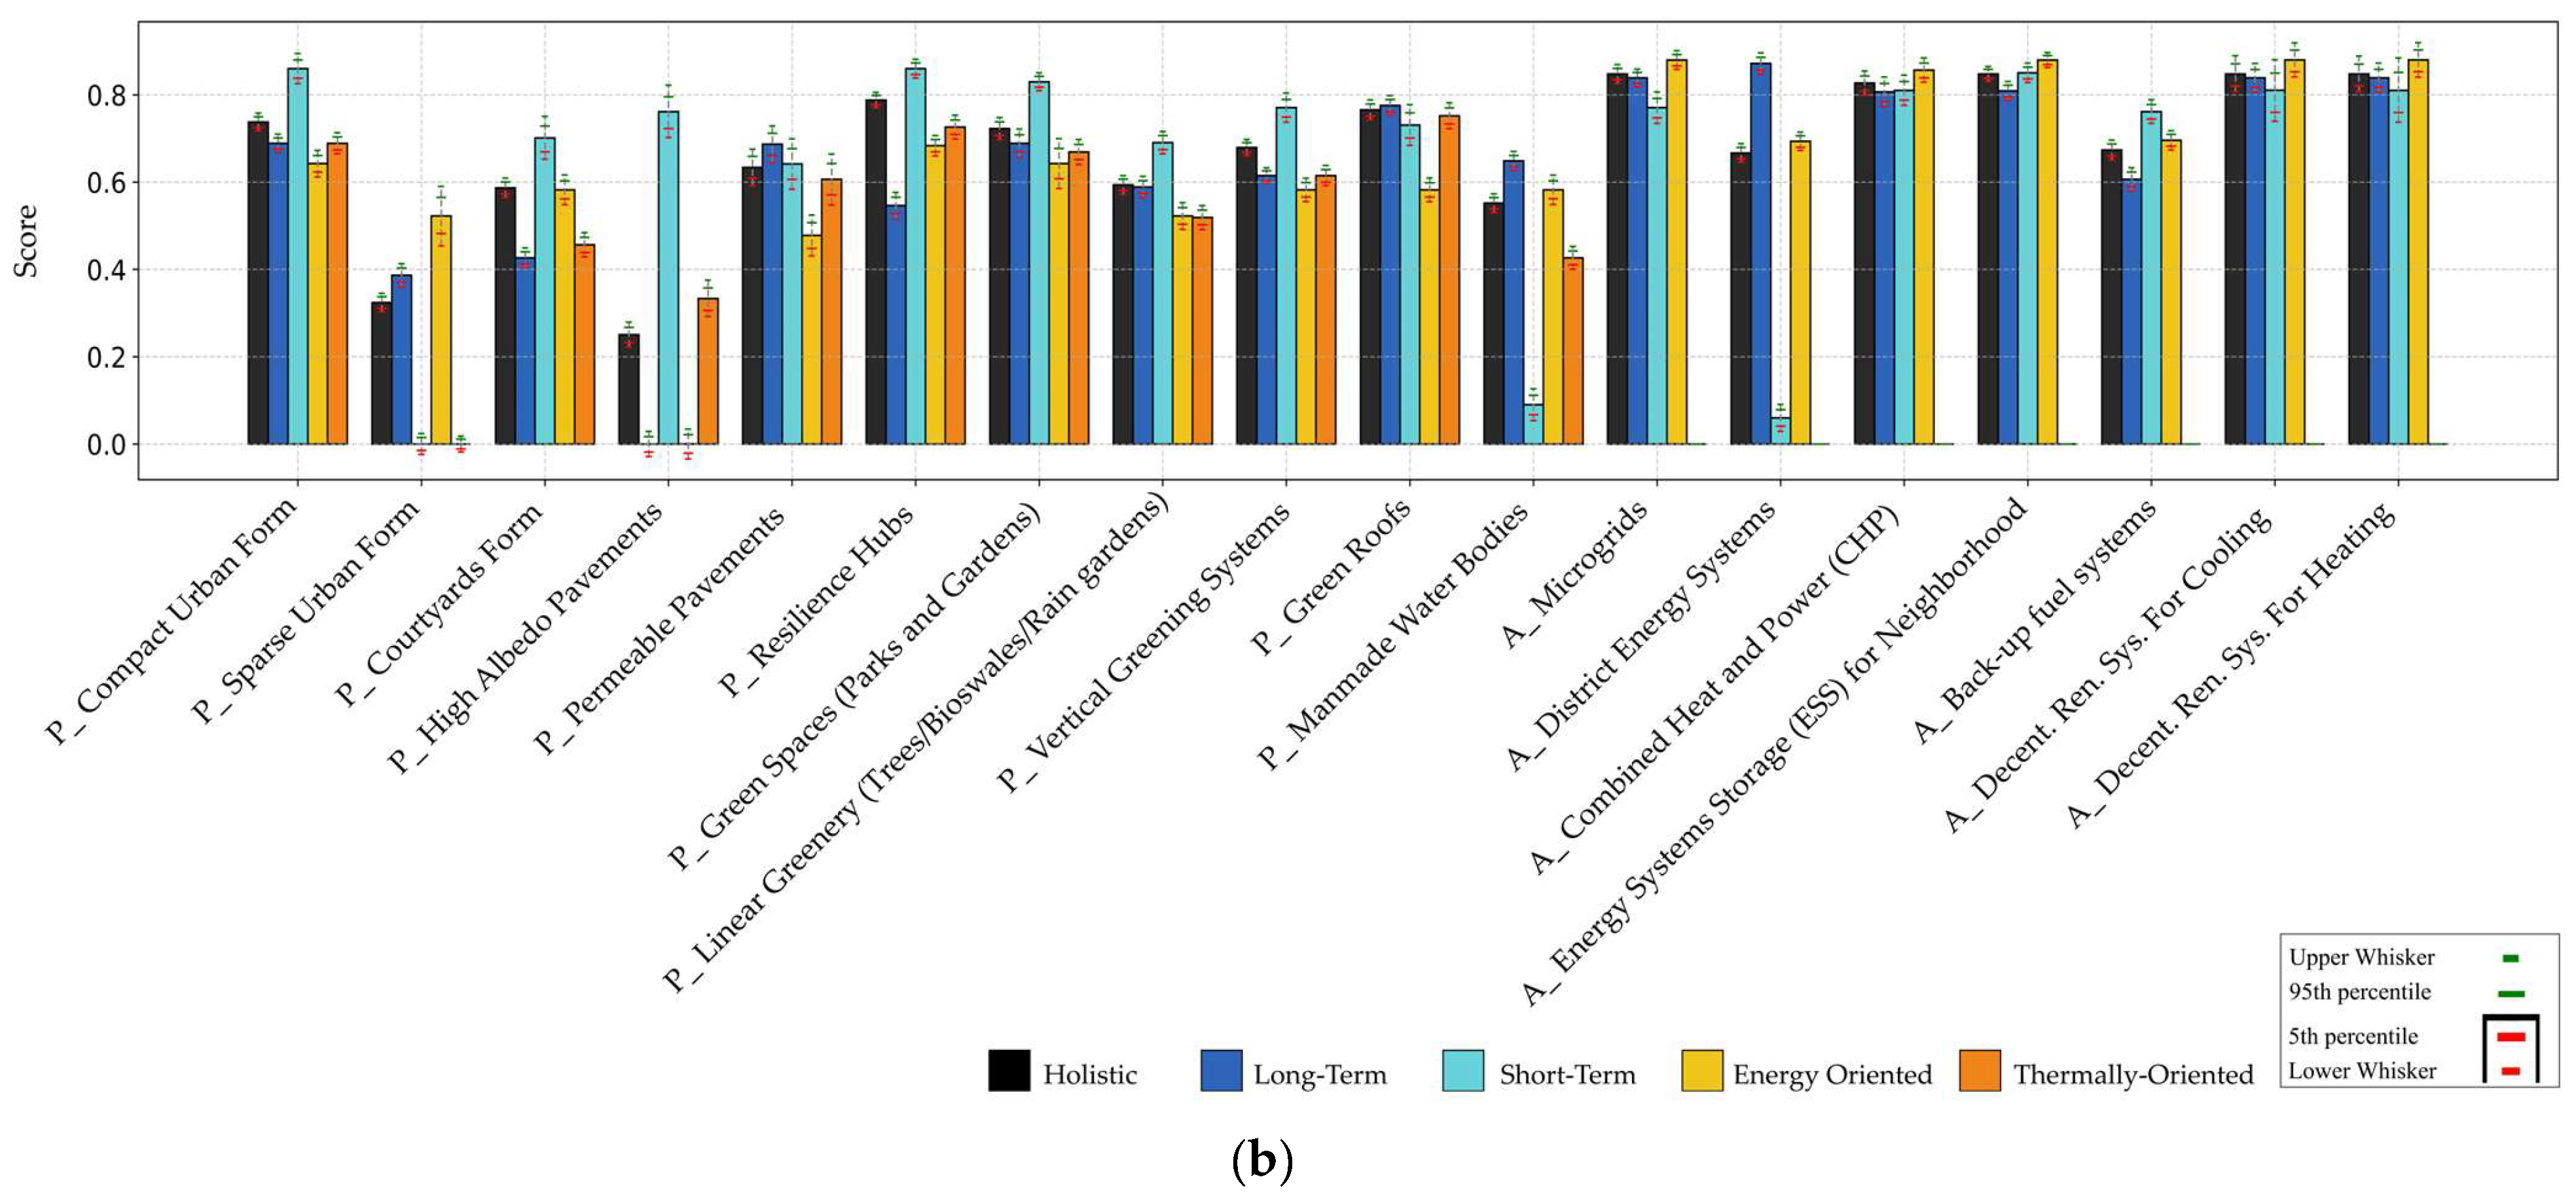
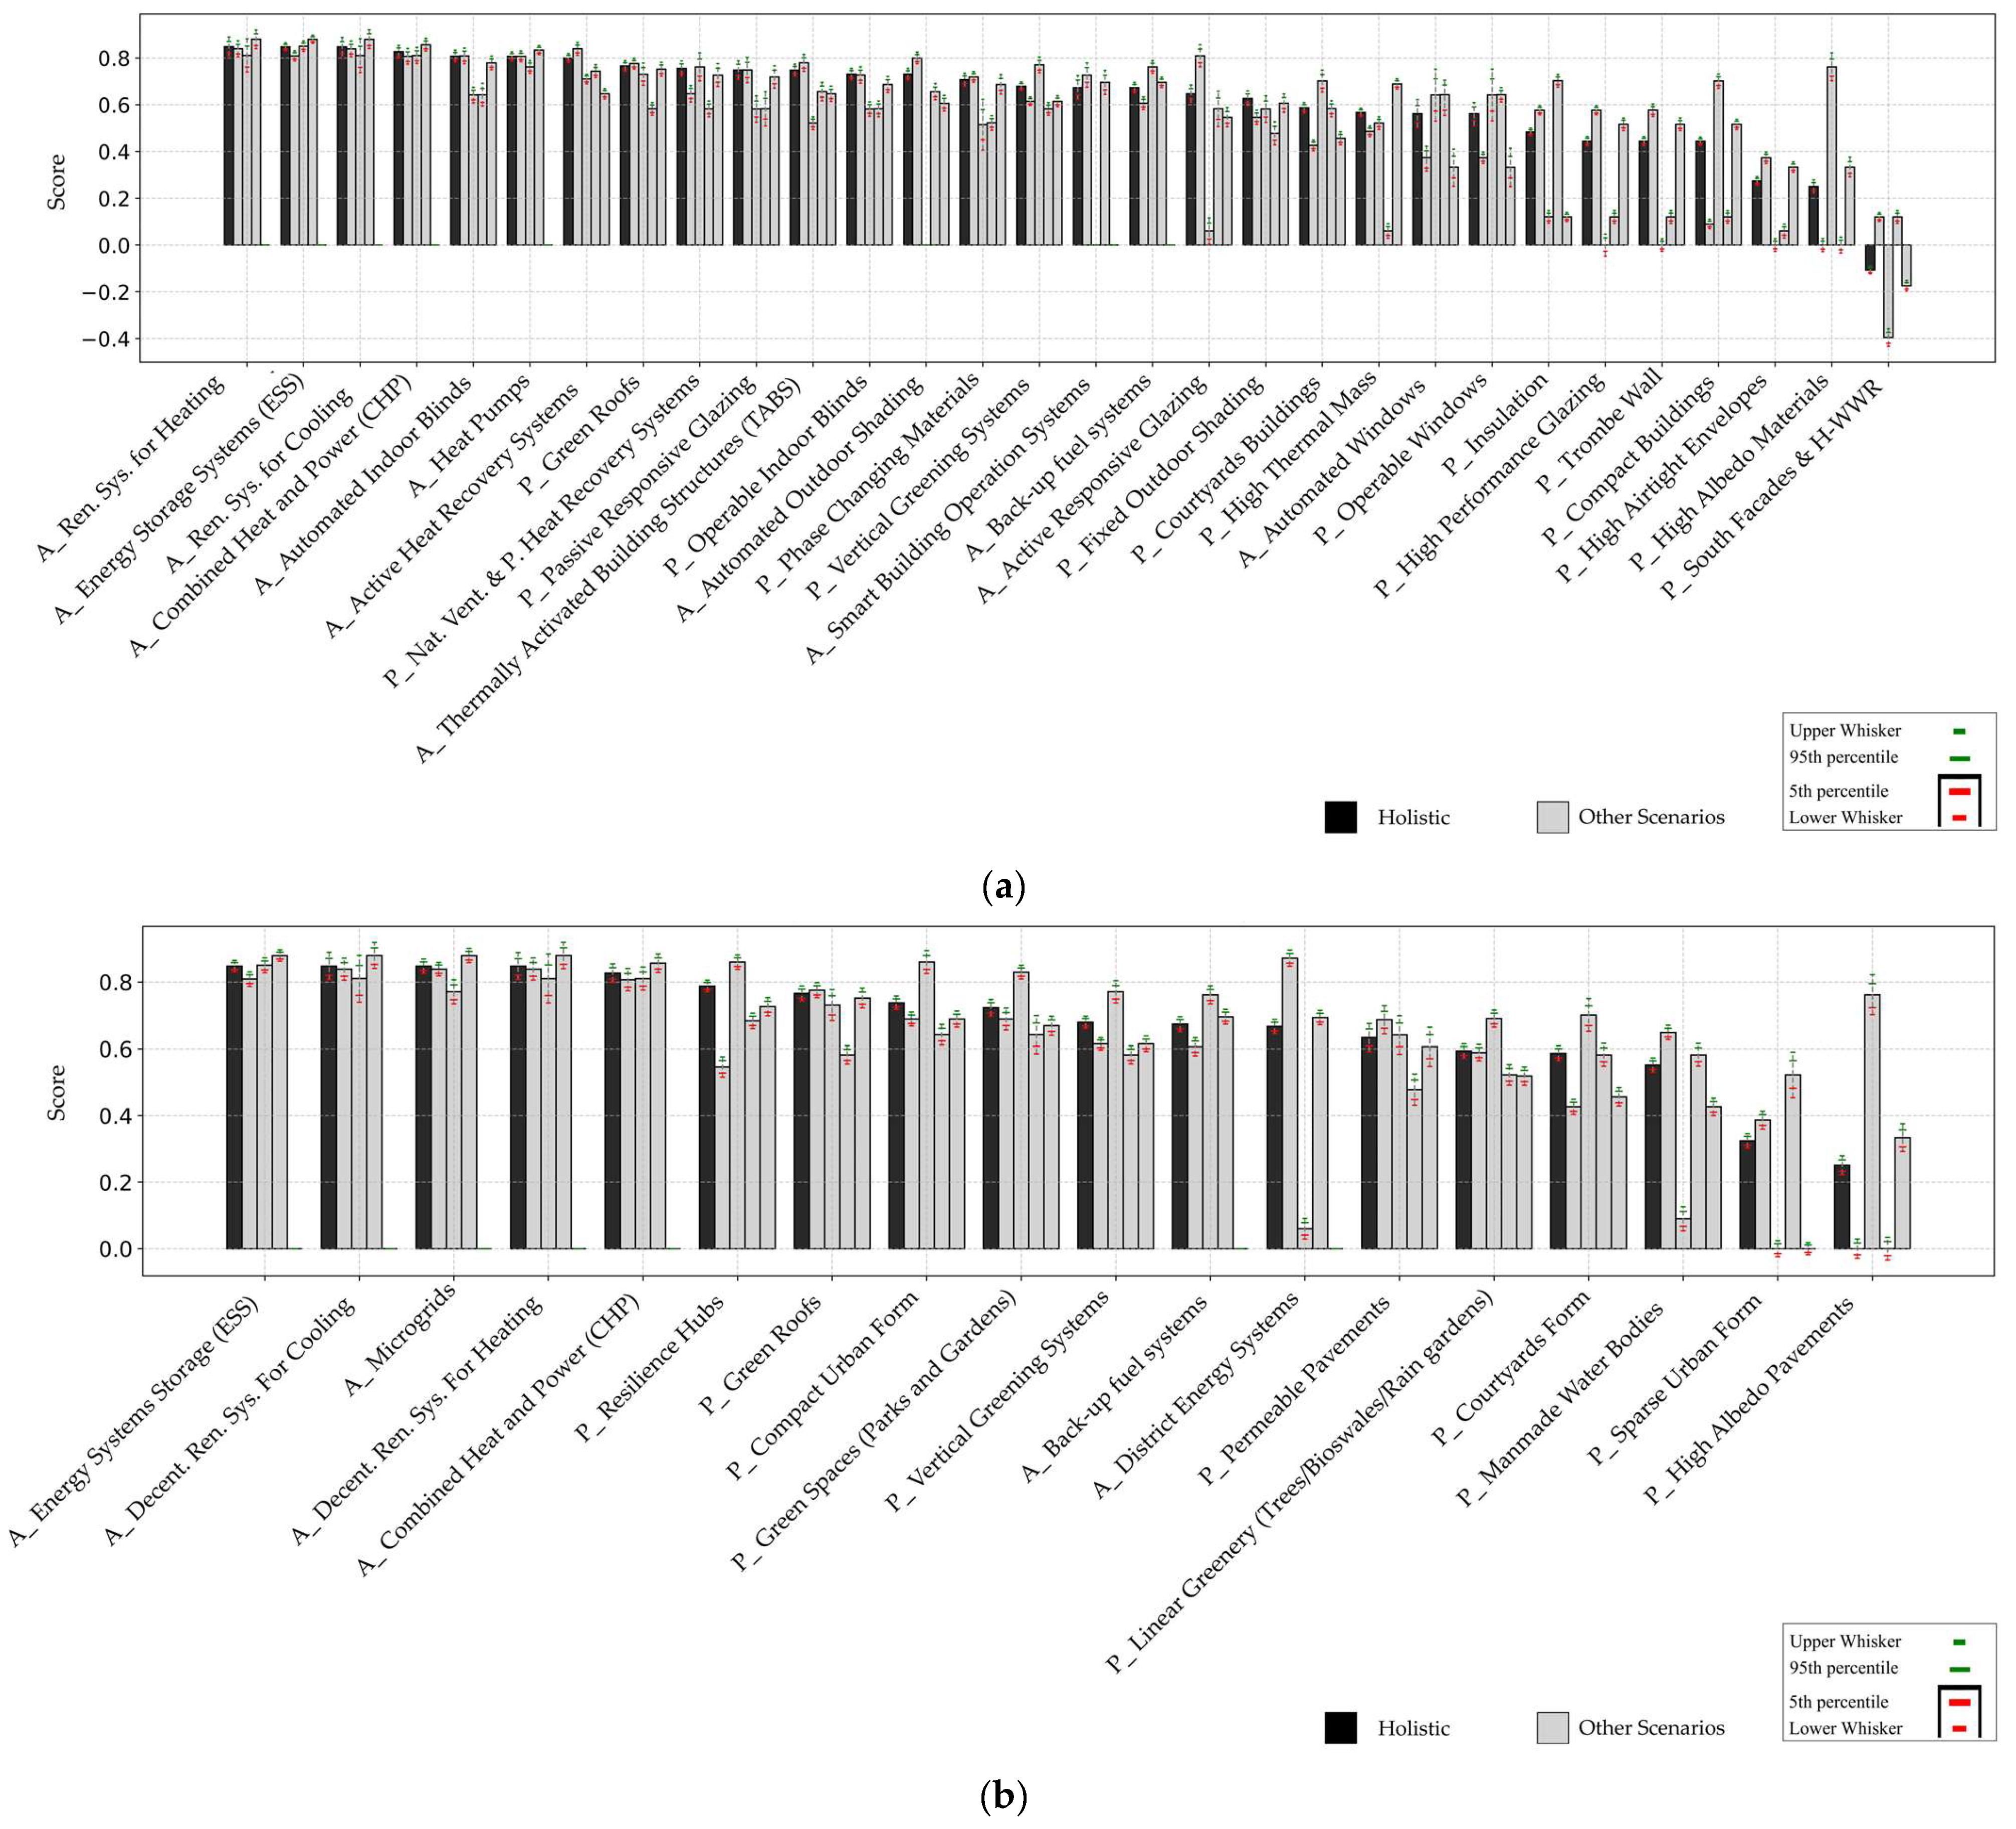
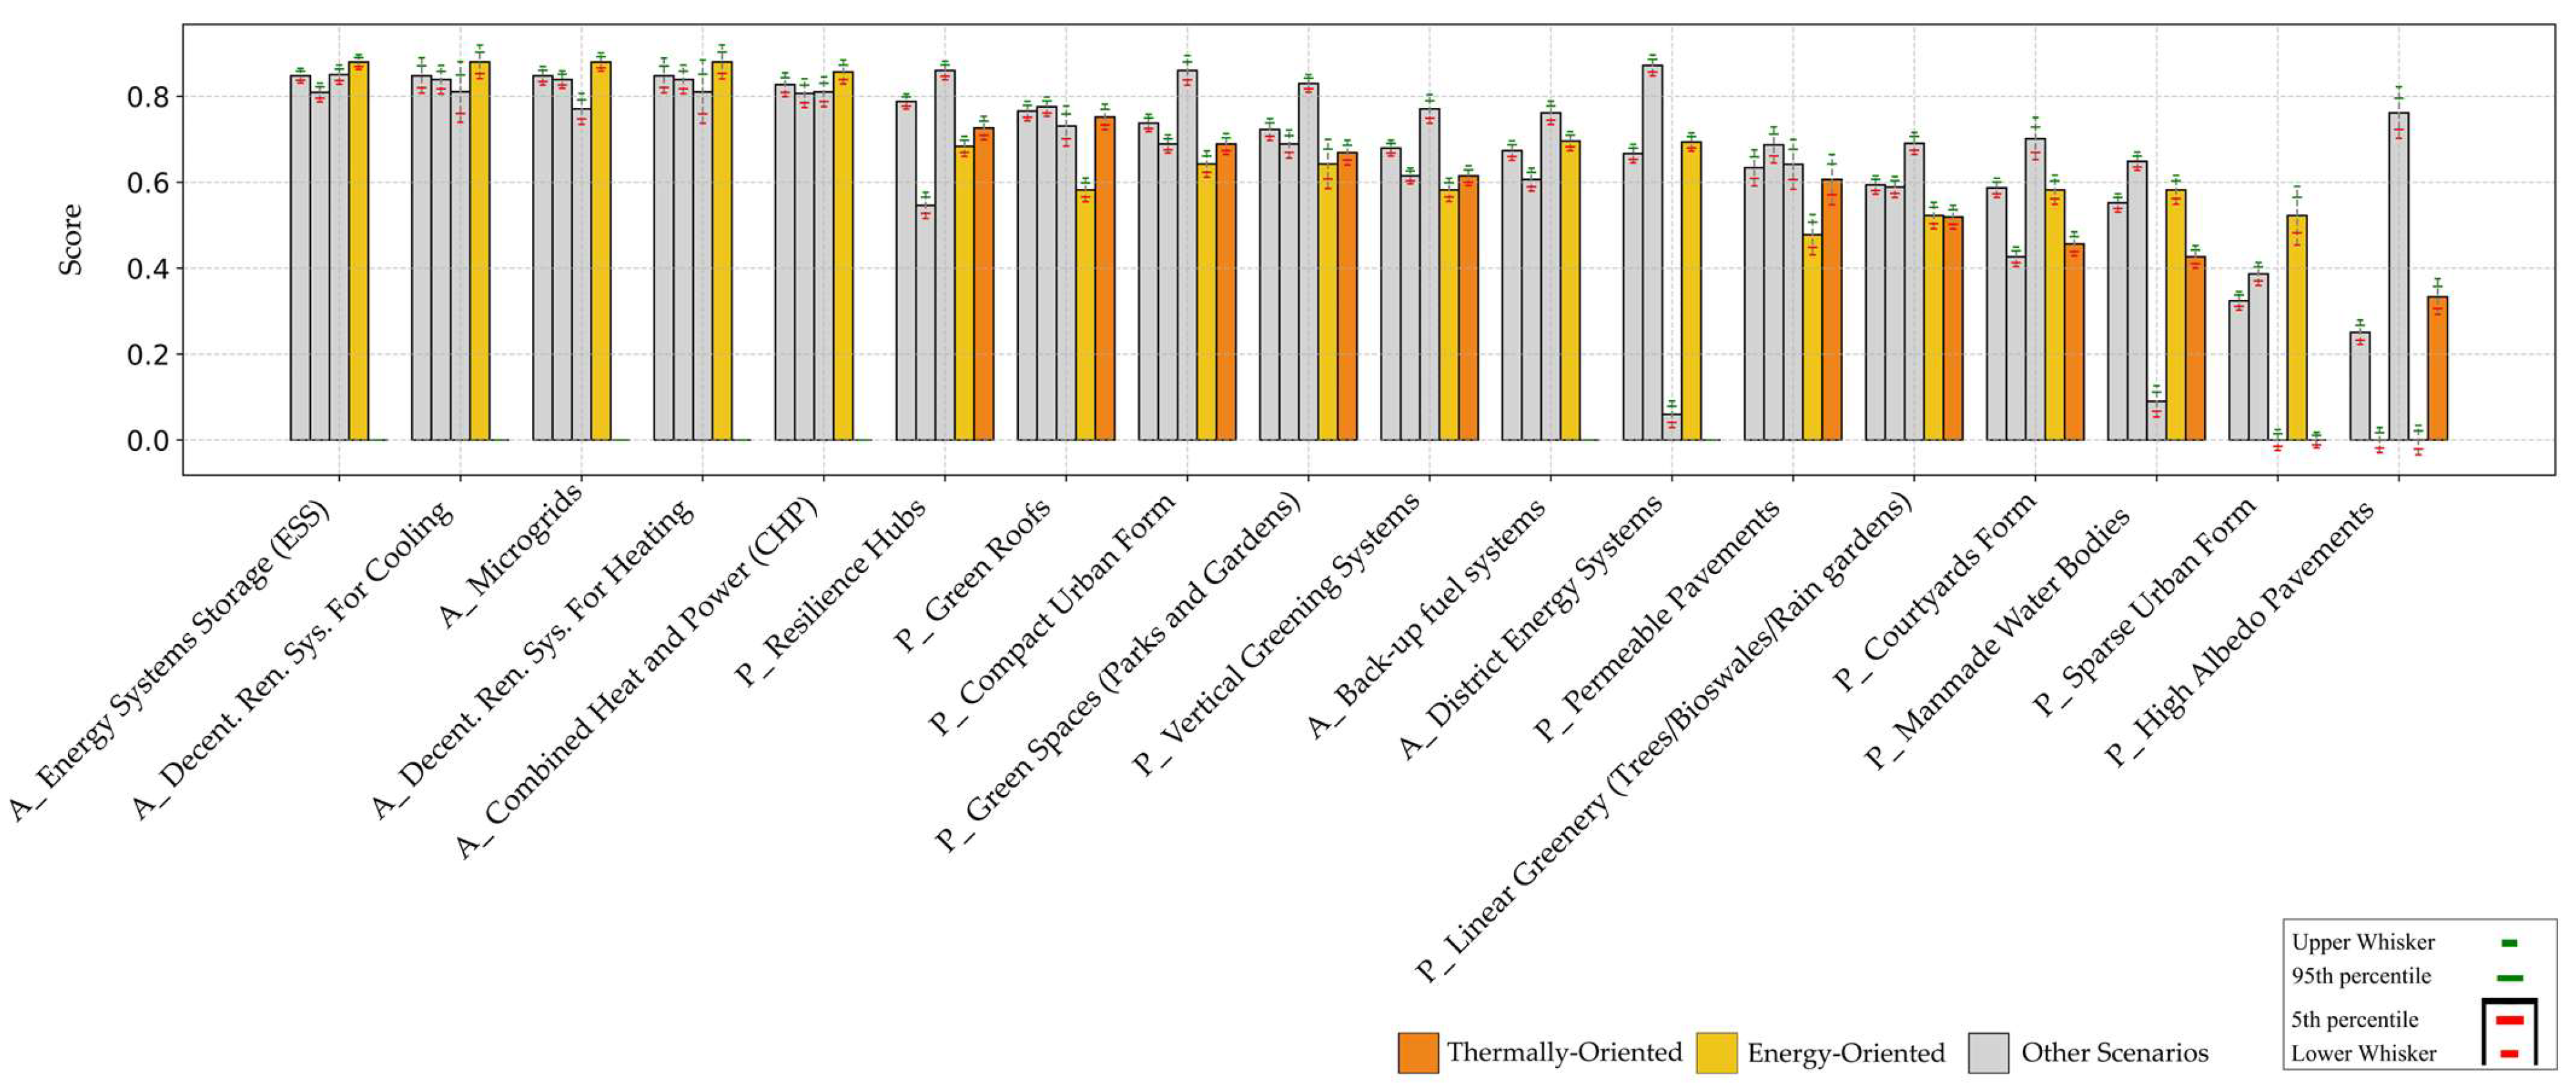
The results at both the building and neighborhood levels are explored across five main scenarios: (i) Holistic, where all objectives are considered; (ii) Long-Term, addresses objectives with long-term resilience capacity; (iii) Short-Term, addresses objectives with short-term resilience capacity; (iv) Energy-Oriented, addresses objectives with an emphasis on energy; and (v) Thermally Oriented, addresses objectives with an emphasis on thermal aspects. Adoption (A) scores are presented as they account for the cumulative probability of impacting the objectives and the number of objectives each strategy achieves. Figure 10 shows the results of the adoption scores for the building component and neighborhood levels.

3.1. Holistic Scenario

At the building component level, seven strategies scored 0.80 mean adoption (A) score or more. These are ESS for buildings (0.85), RES for heating/cooling (0.85/0.85), CHP (0.83), automated indoor blinds (0.81), heat pumps (0.81), and active heat recovery systems (0.80). These are active strategies that highly contribute to many objectives. Other building strategies exhibited intermediate adoption (A) scores, ranging from 0.44 to 0.77. Notable examples include green roofs (0.77), natural ventilation with passive heat recovery systems (0.76), and passive responsive glazing (0.75). Highly endorsed strategies such as insulation (0.48), high thermal mass (0.57), high-performance glazing (0.44), and Trombe wall (0.44) scored medium adoption (A) scores.
At the neighborhood level, the highest-scoring strategies were similarly dominated by active measures. ESS for neighborhoods (0.85), microgrids (0.85), decentralized RES for heating and cooling (0.85/0.85), and CHP (0.83) achieved the top adoption (A) scores. Passive strategies, including resilience hubs (0.79), green roofs (0.77), compact urban form (0.74), and green spaces (0.72), followed closely. Low-ranking strategies were predominantly passive, with high-albedo pavements (0.25) and sparse urban form (0.32), receiving the lowest adoption (A) scores. District energy systems scored 0.67, indicating a moderate adoption level, while green and blue infrastructure generally achieved medium to high adoption, evaluated primarily in terms of energy and thermal performance. Figure 11 shows the strategies ranked by their means in the holistic scenario at the building component and neighborhood levels, respectively.

3.2. Long-Term vs. Short-Term Scenarios

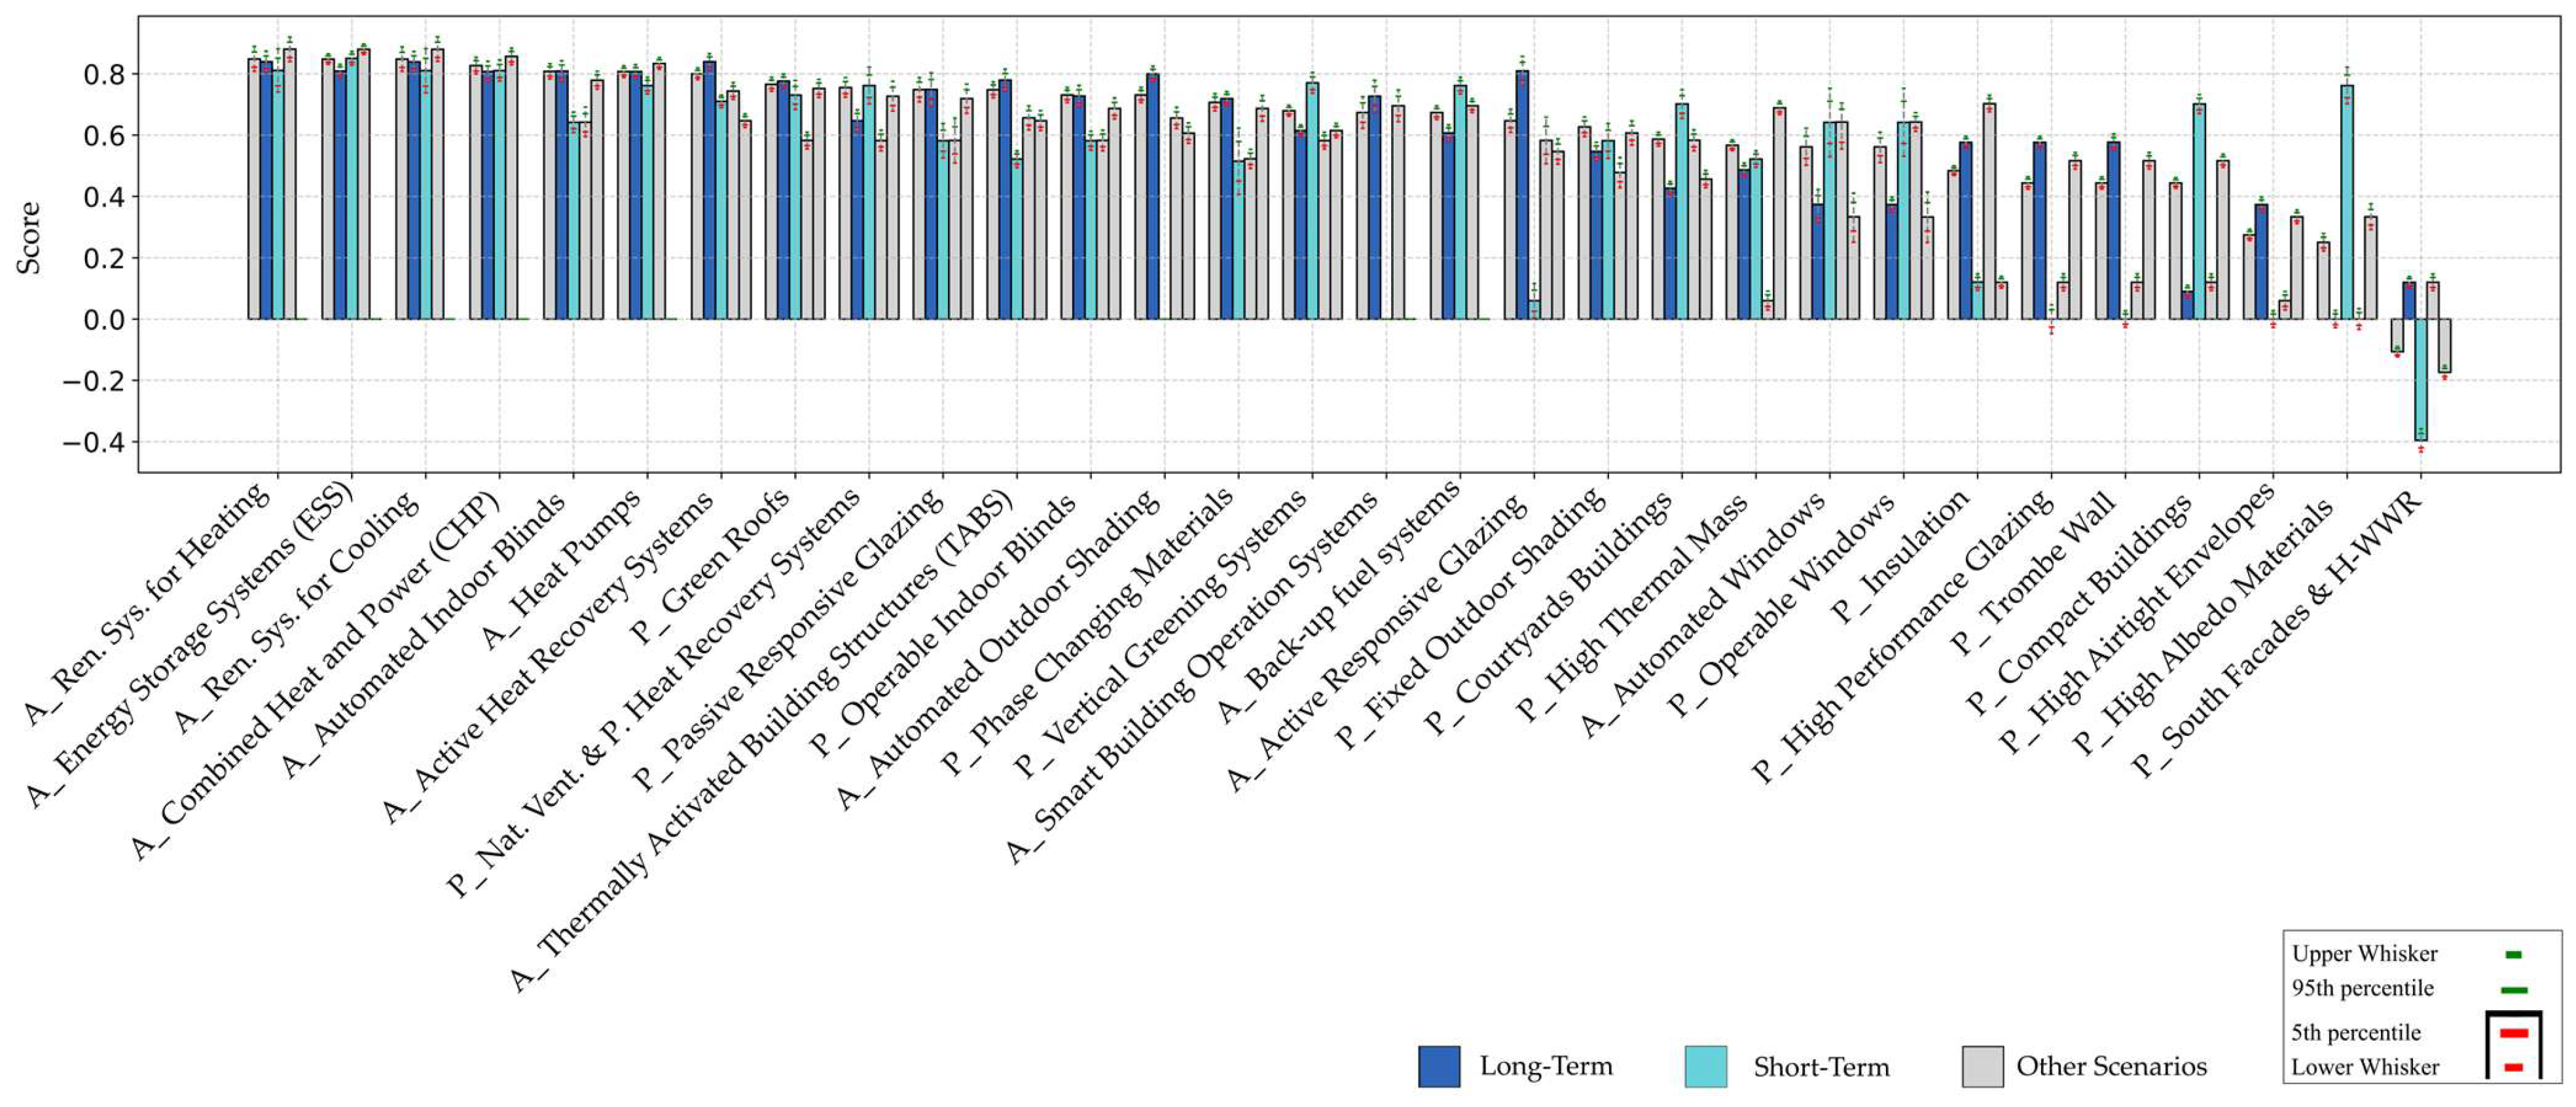
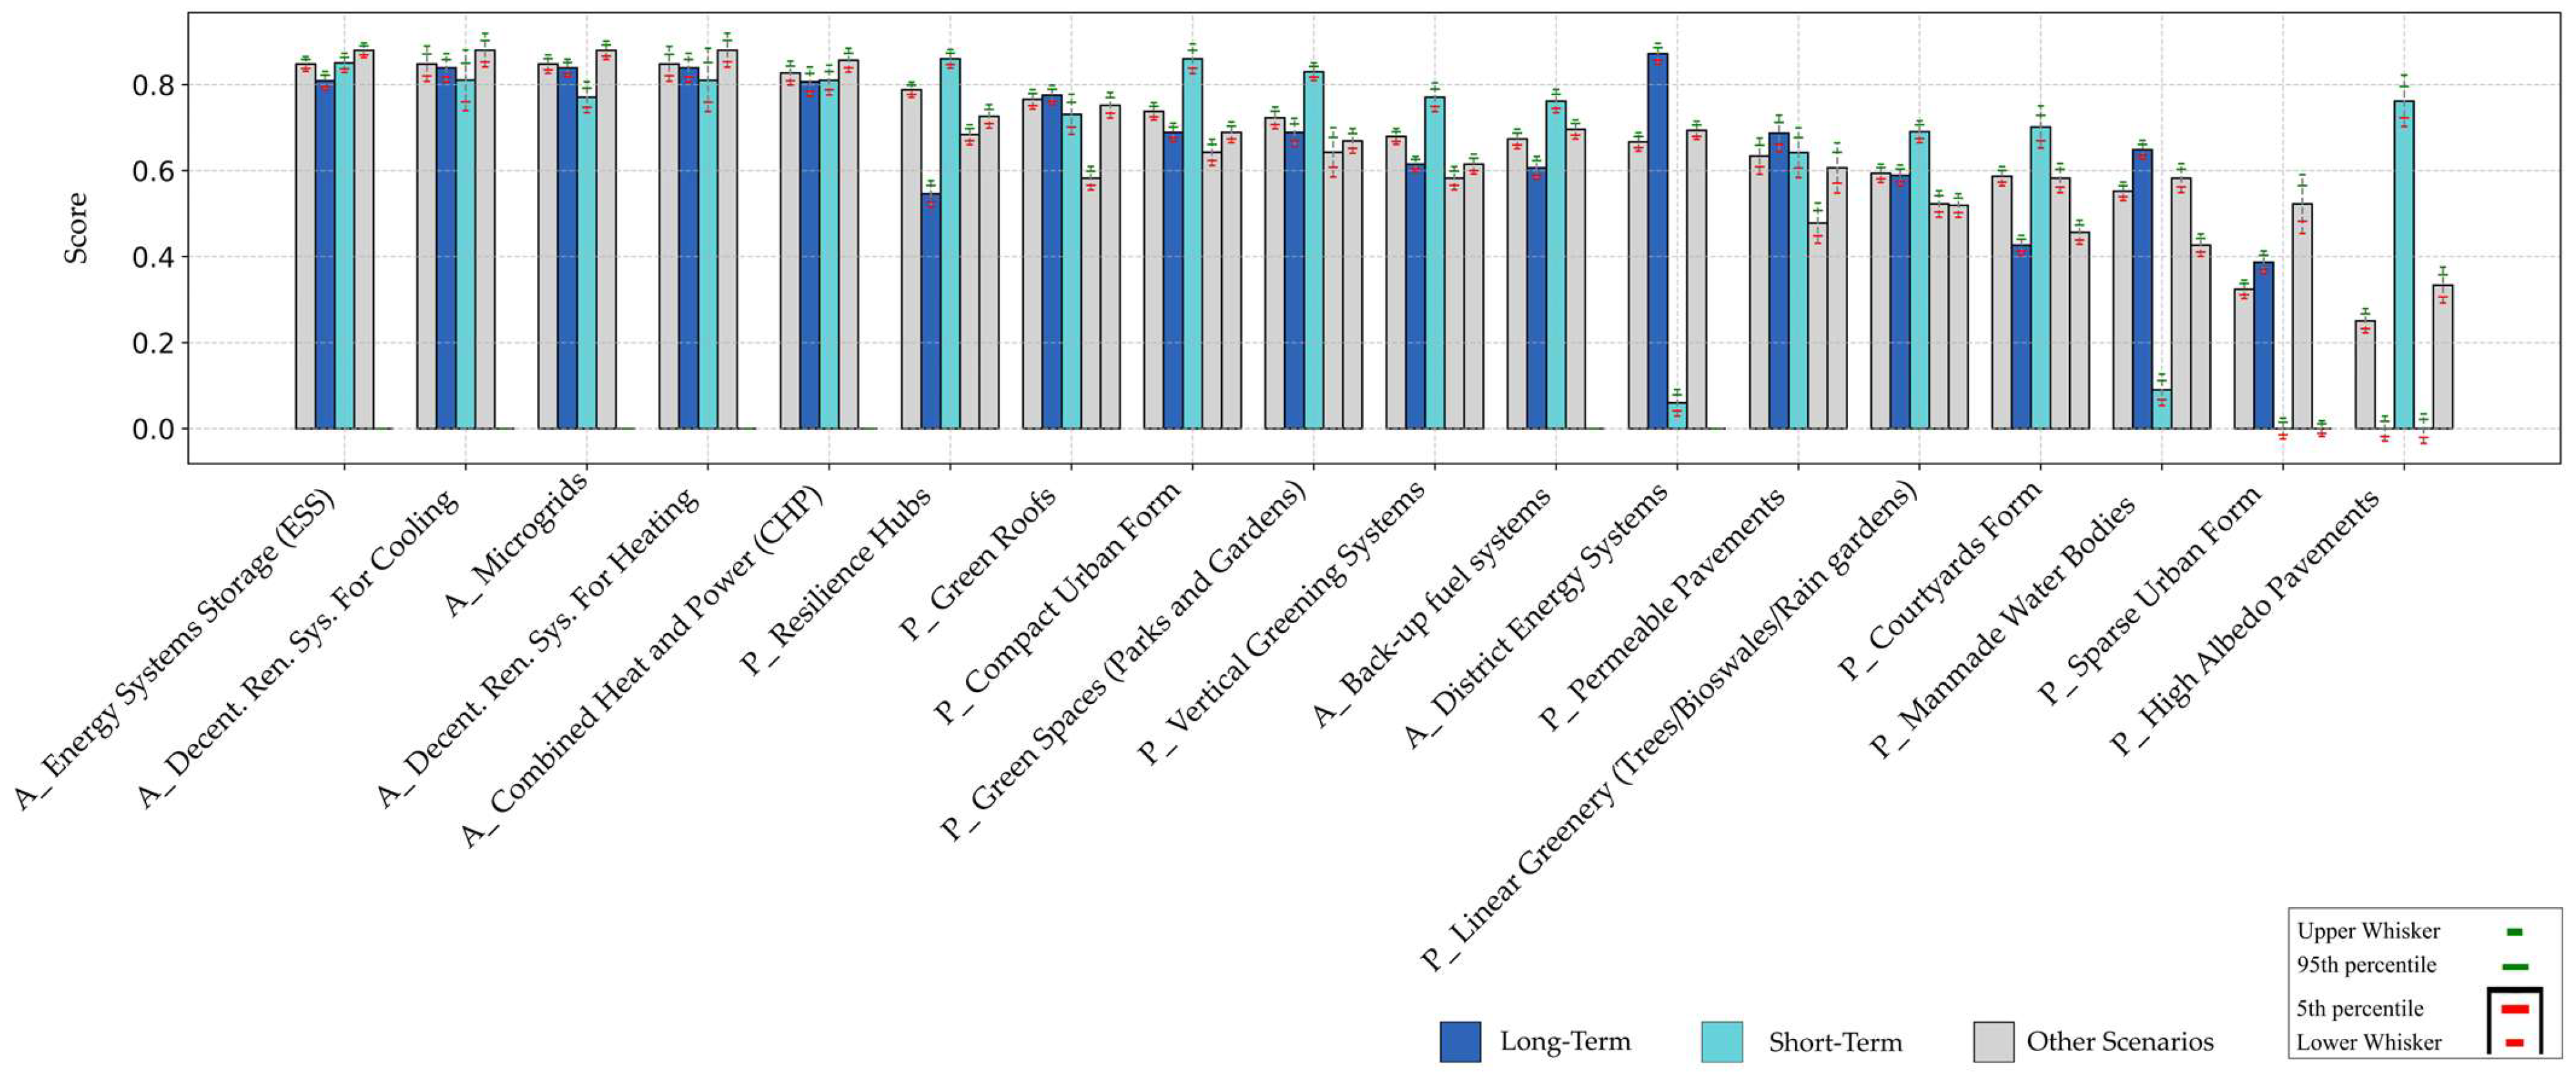
The comparative analysis of resilience strategies across long-term (L) and short-term (S) capacities reveals significant variation in adoption (A) scores at both the building component and neighborhood levels. A group of strategies emerged as high performers in both capacities, indicating their sustained and robust applicability. At both levels, these include RES for heating and cooling (L: 0.84, S: 0.81), ESS (L: 0.81, S: 0.85), CHP (L: 0.81, S: 0.81), and green roofs (L: 0.78, S: 0.73). Additionally, at the building components level, active heat recovery systems (L: 0.84, S: 0.71) and heat pumps (L: 0.81, S: 0.76) scored high, while microgrids showed high performance at the neighborhood level.
Another trend was noticed as several strategies, while demonstrated effectiveness in the long term, demonstrated limited short-term impact. At the building component level, these strategies include active responsive glazing (L: 0.81, S: 0.06), automated outdoor shading (L: 0.80, S: 0.00), and smart building operation systems (L: 0.73, S: 0.00). At the neighborhood level, district energy systems (L: 0.87, S: 0.06) showed high long-term scores but low short-term performance.
On the other hand, a contrary trend exists. At the building component level, compact buildings (L: 0.09, S: 0.70) and operable windows (L: 0.37, S: 0.64) fall into this category. High-albedo materials (L: 0.00, S: 0.76) exhibited similar behavior at both urban levels. At the neighborhood level, resilience hubs (L: 0.55, S: 0.86) and courtyard forms (L: 0.43, S: 0.70) also showed higher short-term benefits.
The last category includes strategies that score low in both resilience capacities. At the building component level, these are high airtight envelopes (L: 0.37, S: 0.00) and south-facing facades with a high window-to-wall ratio (L: 0.12, S: −0.40). At the neighborhood level, sparse urban form (L: 0.39, S: 0.00) falls into this category. Figure 12 and Figure 13 show the strategies adoption (A) scores in the long- and short-term scenarios at building component and neighborhood levels.

3.3. Energy Oriented vs. Thermally Oriented Scenarios

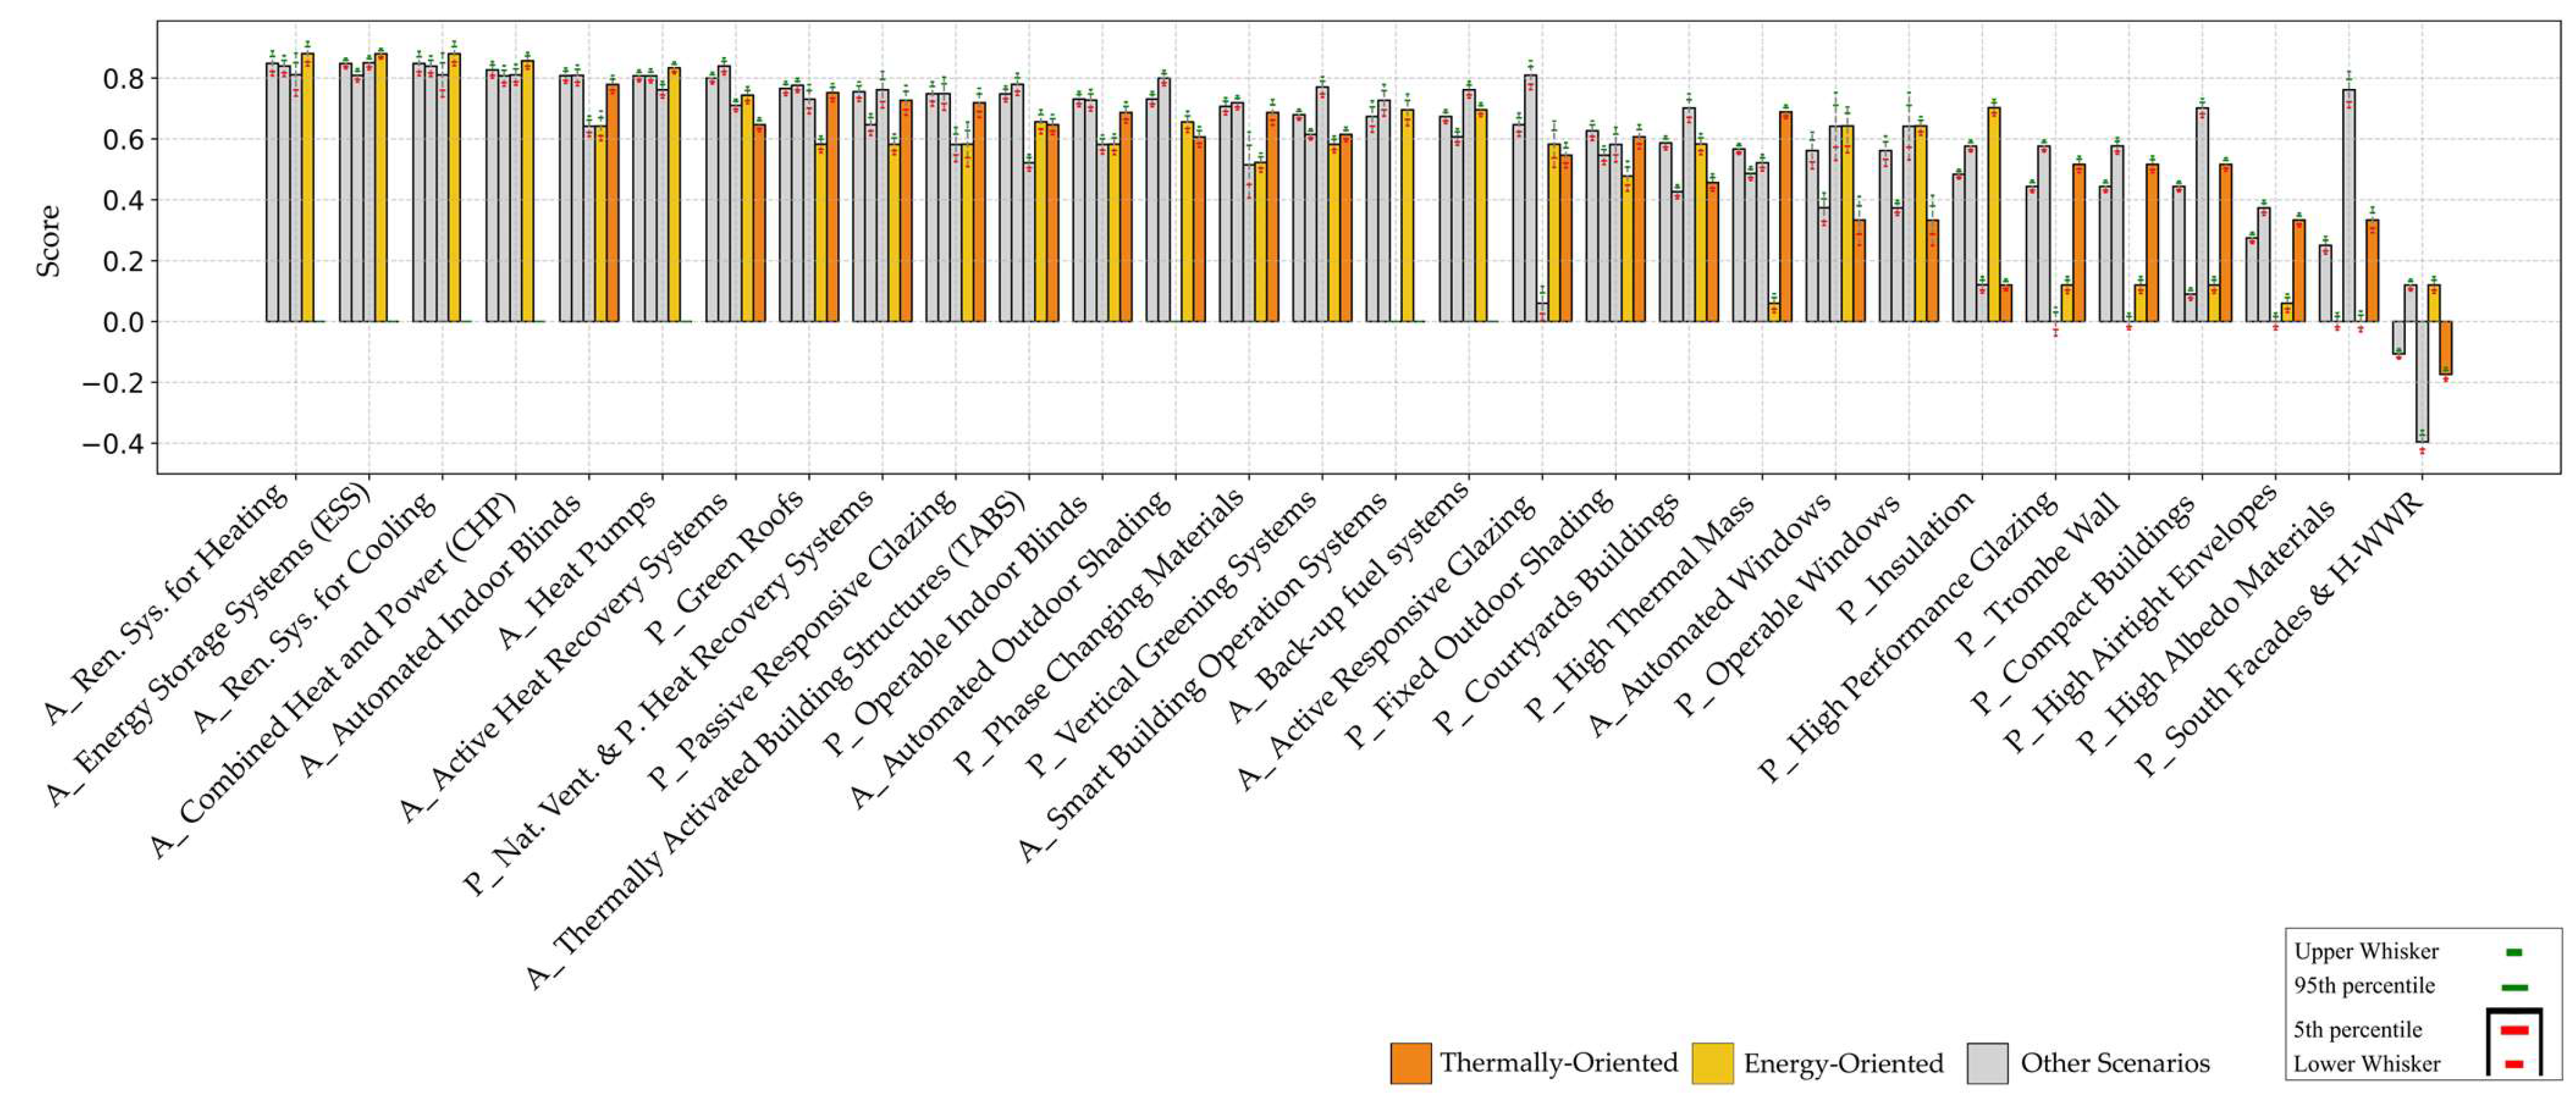
Comparing resilience strategies across energy-oriented (E) and thermally oriented (T) objectives revealed distinct differences in adoption (A) scores at both the building component and neighborhood levels. No strategy scored highly in both objectives (≥0.70), although several achieved moderate scores. At the building component level, these include passive responsive glazing (E: 0.58, T: 0.72), natural ventilation with passive heat recovery systems (E: 0.58, T: 0.73), active heat recovery systems (E: 0.74, T: 0.65), automated indoor blinds (E: 0.64, T: 0.78), and TABS (E: 0.66, T: 0.65). At the neighborhood level, compact urban form (E: 0.64, T: 0.69), resilience hubs (E: 0.68, T: 0.73), and green spaces (E: 0.64, T: 0.67) fall into this category. Green roofs (E: 0.58, T: 0.75) demonstrated moderate performance at both urban levels.
Certain strategies significantly enhanced building energy performance but contributed little to thermal resilience. These include RES for heating and cooling (E: 0.88, T: 0.00), CHP (E: 0.86, T: 0.00), ESS (E: 0.88, T: 0.00), and backup fuel systems (E: 0.70, T: 0.00) at both the building component and neighborhood levels.
Only one strategy excelled in thermally oriented objectives while scoring low in energy-oriented objectives: high thermal mass (E: 0.06, T: 0.69).
Finally, some strategies scored poorly in both scenarios. At the building component level, these include high-albedo materials (E: 0.00, T: 0.33), south-facing facades with a high window-to-wall ratio (E: 0.12, T: −0.17), and high airtight envelopes (E: 0.06, T: 0.33). High-albedo materials also showed low performance at the neighborhood level. Figure 12 and Figure 13 present energy- and thermally oriented strategies ranked by their mean scores at both levels. Figure 14 and Figure 15 show the energy- and thermally oriented strategies at the building component and neighborhood levels.

3.4. Coefficient of Variation for Total Impact Potential (TIP) Scores

The results of the Monte Carlo simulations for the Total Impact Potential (TIP) scores for the resilience strategies exhibit high statistical stability, aligning with the 0.30 Coefficient of Variation (CoV) threshold. This indicates a high level of consistency in the simulation outputs and suggests that the number of iterations used was sufficient to ensure convergence.
Only two strategies exceeded that threshold, namely south-facing facades with a high window-to-wall ratio (WWR) in thermally oriented scenarios (CoV: 0.407) and active responsive glazing (CoV: 0.346) in short-term and thermally oriented scenarios, respectively. Table 10 shows the coefficient of variation (CoV) ranges for different scenarios.

3.5. Worst, Mean, and Best Cases

The ranks of strategies across each studied scenario and urban level showed little variation between the worst (5th percentile), mean, and best (95th percentile) cases. Most strategies had consistent fluctuating ranks, generally dropping, climbing up one rank, or retaining their ranks. For example, in the holistic scenario fifteen strategies out of thirty at the building component level and fifteen out of eighteen at the neighborhood level retained the same rank. Figure 16 shows the ranks across the cases for the holistic scenario for building component-level strategies and neighborhood-level strategies. Other scenarios show similar results.

3.6. Hypothetical Case Study

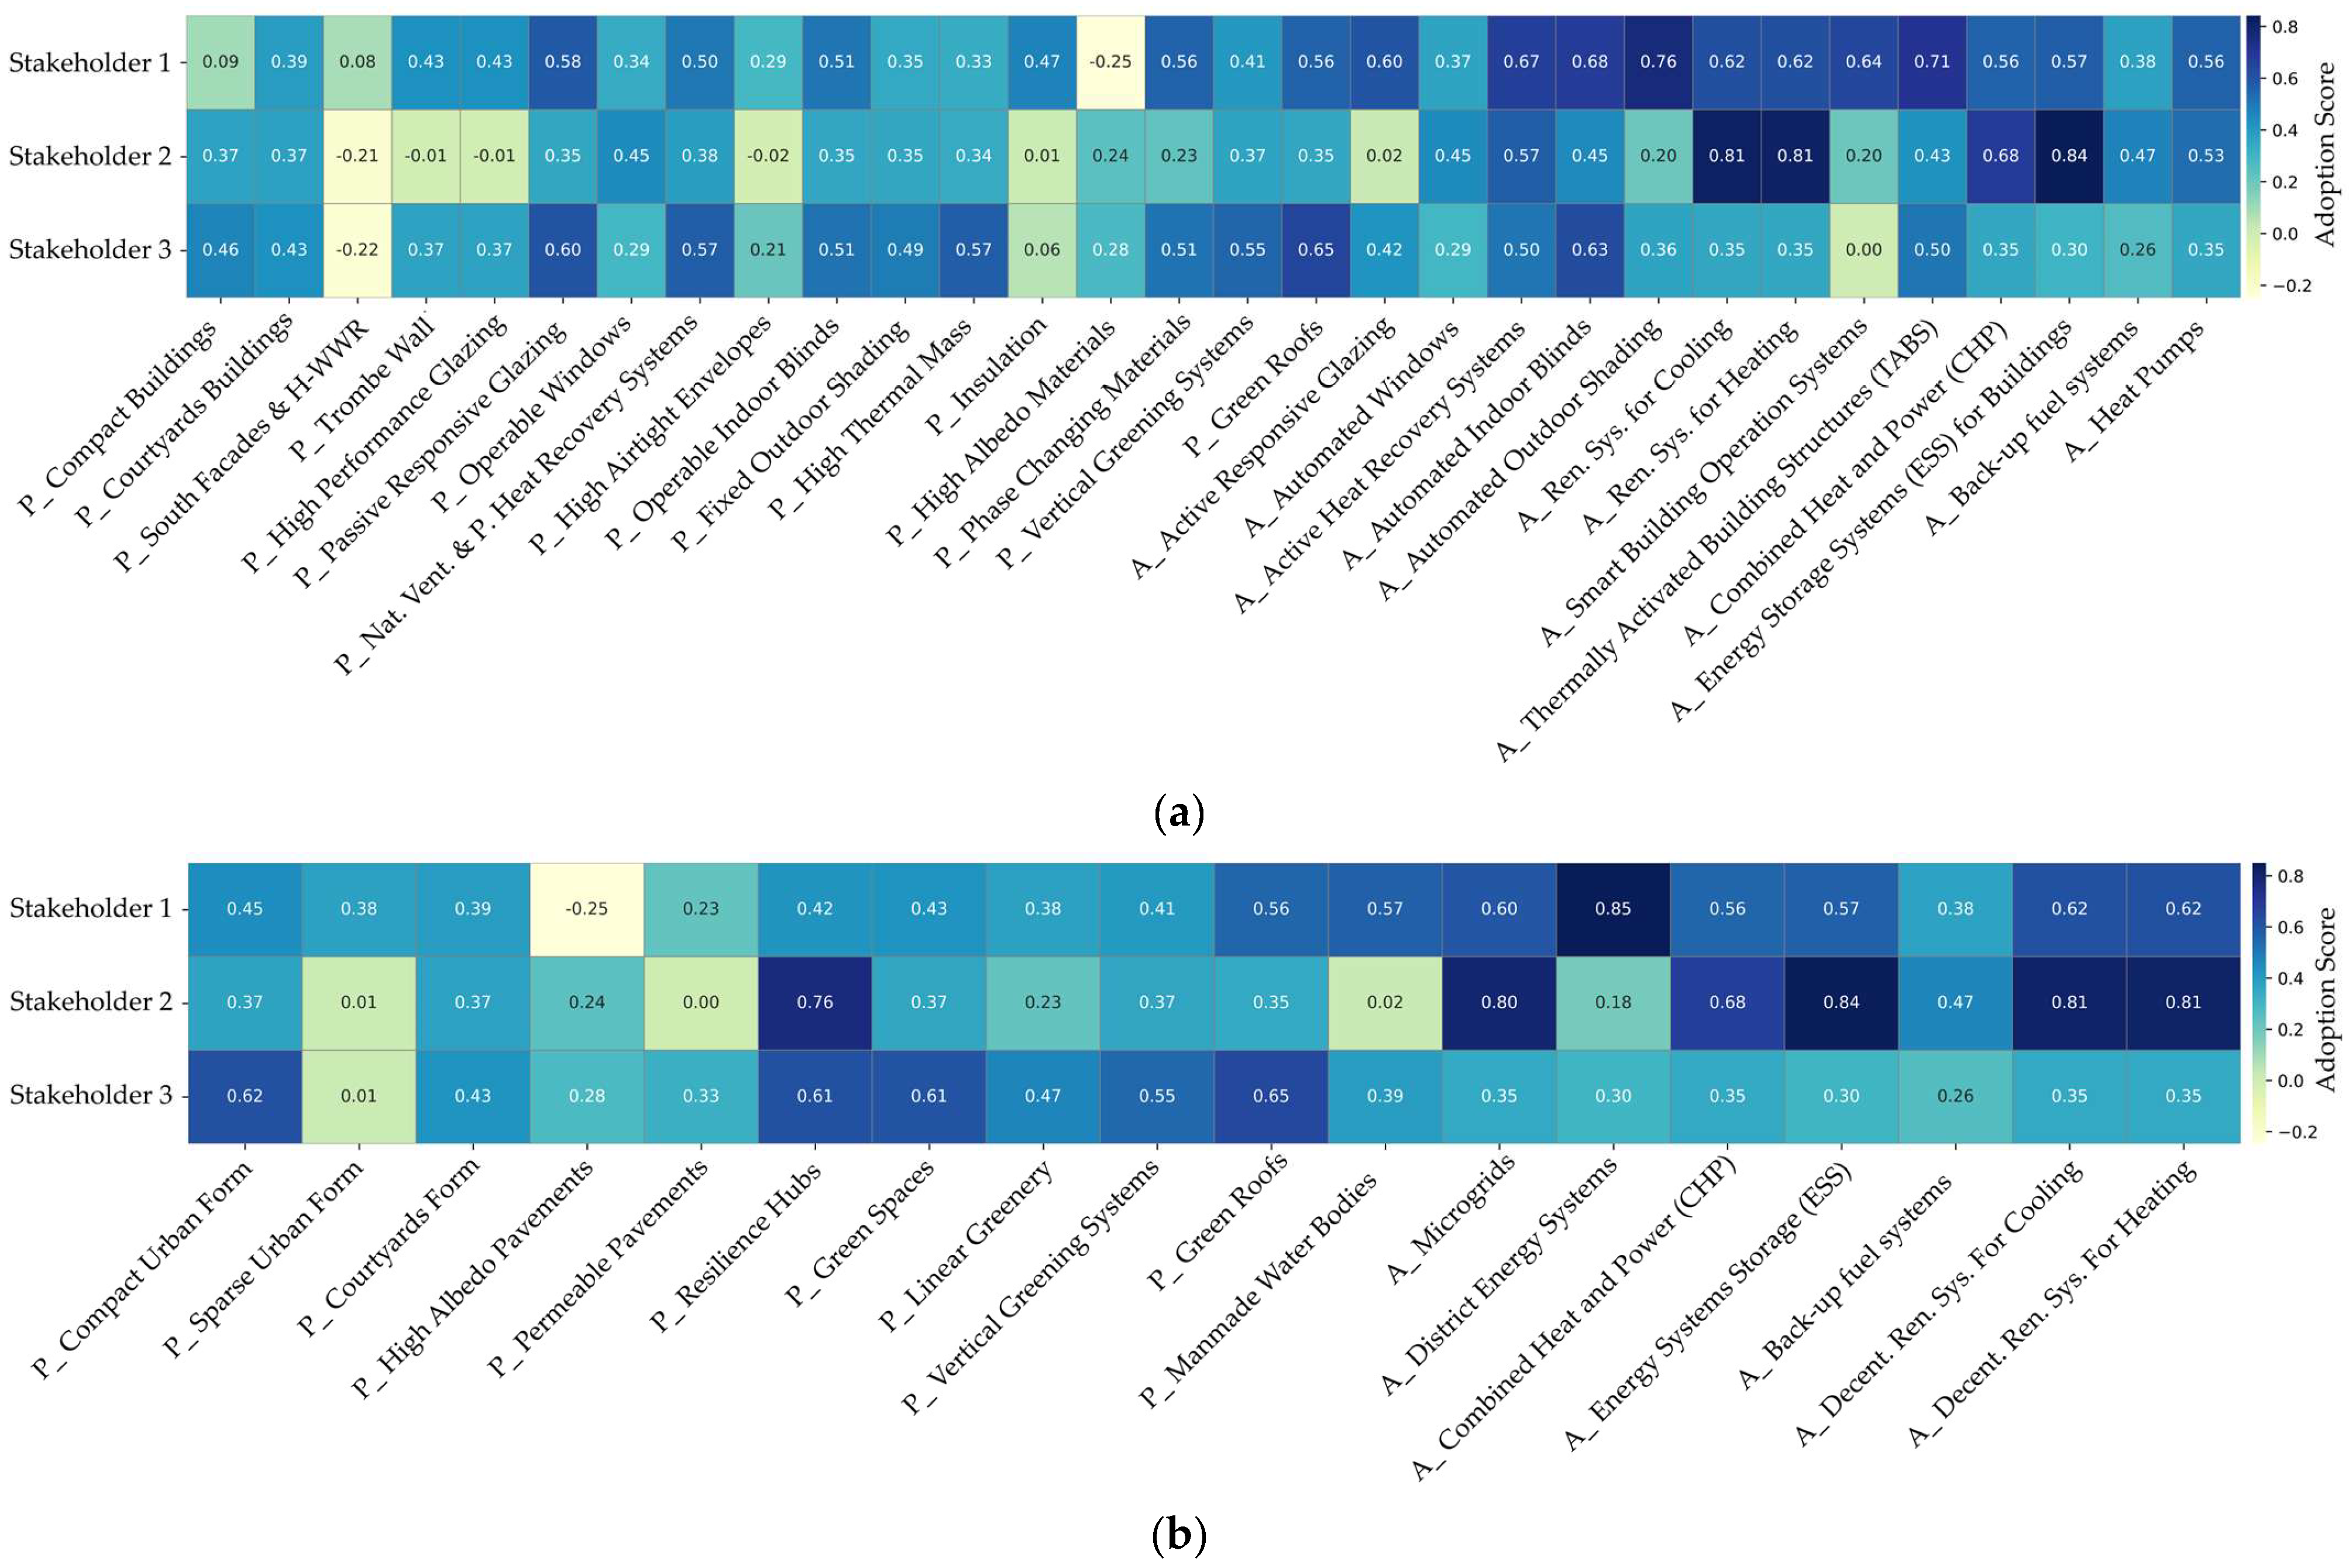
Applying the case study revealed interesting interactions among stakeholders’ preferences. At the building component level, for stakeholder 1, compact buildings (0.09), south-facing facades with a high window-to-wall ratio (0.08), and high-albedo materials (−0.25) scored the lowest adoption (A) scores. On the other hand, automated outdoor shading (0.76), TABS (0.71), automated indoor blinds (0.68), active heat recovery systems (0.67) were the highest-scoring strategies. For stakeholder 2, the lowest-scoring strategies were south-facing facades with a high window-to-wall ratio (0.08), Tombe wall (−0.01), high airtight envelope (−0.02), insulation (0.01), and active responsive glazing (0.02). The highest-scoring strategies were ESS for buildings (0.84), RES for heating/cooling (0.81/0.81). For stakeholder 3, south-facing facades with a high window-to-wall ratio (−0.22) was the lowest-scoring strategy. Green roofs (0.65), automated indoor blinds (0.63), and passive responsive glazing (0.60) were the highest-scoring ones.
At the neighborhood level, for stakeholder 1, high-albedo materials (−0.25) was noticeably the lowest-scoring strategy. DES (0.85), RES for heating/cooling (0.62/0.62), and microgrids (0.60) were the highest-scoring strategies. For stakeholder 2, sparse urban form (0.01), permeable pavements (0.00), and manmade water bodies (0.02) were the lowest-scoring strategies. ESS for neighborhoods (0.84), RES for heating/cooling (0.81/0.81), and microgrids (0.80) were the highest-scoring strategies. Finally, for stakeholder 3, sparse urban form was the lowest-scoring strategy (0.01). Green roofs (0.65), compact urban form (0.62), green spaces (0.61), and resilience hubs (0.61) were the highest-scoring strategies. Figure 17 shows the adoption (a) scores for the strategies against each stakeholder at the building component and neighborhood levels.

4. Discussion

4.1. Holistic Scenario

At the building component level, results suggest that high-scoring strategies are predominantly active ones, reflecting their significant contribution to multiple performance objectives. ESS for buildings contributes to long-term resilience capacity by reducing energy transmission losses, improving energy management, and shifting peak demands [129,130,134]. In short-term resilience capacity, they increase the reliability of energy systems during disruptions [134]. On the other hand, strategies with low adoption (A) scores, such as south-facing facades with a high window-to-wall ratio and high airtight envelopes, highlight the trade-offs inherent in building design. While such strategies can reduce heating demands [77,79,80,81], they may exacerbate cooling loads, increase heat loss during winter, or reduce passive survivability during heatwave outages [78,79,84]. This confirms the general concern that such strategies, while very useful during normal climate and power conditions, might have a varied impact resilience under disruptions [23,84,103,104]. Assessment of such strategies was built on the rationale that they might cause some negative effects. Taking this into consideration results in low scores and necessitates guidance on how practitioners should address them. To mitigate such risks, practitioners should design these strategies carefully, combining them with complementary measures. For example, pairing south-facing facades with a high window-to-wall ratio and high airtight envelopes with shading devices, natural ventilation systems, and other cooling strategies. This approach encourages more context-sensitive adoption and reduces unintended negative impacts.
Intermediate-scoring strategies reflect the nuanced performance of passive measures, which can continue to function during outages. While active versions of some of them may be more efficient in performance, their contribution during outages increases their overall adoption (A) scores. For example, passive responsive glazing depends on the material properties to naturally respond to external stimuli, while active responsive glazing requires external power to work [92,93,94,95]. While the latter is more efficient, the former can perform during outages [92,93,94,95]. Highly endorsed strategies such as insulation, high thermal mass, high-performance glazing, and Trombe wall have some limitation in releasing heat during heatwave outages, decreasing their short-term resilience capacity, affecting their overall score. However, their well-documented benefits in energy efficiency and thermal regulation must not be undervalued. Integrating these strategies with others, such as natural ventilation and operable windows, can mitigate these concerns.
At the neighborhood scale, active strategies again dominate (e.g., ESS for neighborhood, microgrids, decentralized RES for heating/cooling, and CHP), supporting both energy- and thermally oriented objectives. Such strategies contribute to both resilience capacities, long- and short-term. They are directly related to energy-oriented objectives, but they indirectly contribute to achieving thermally oriented ones. In addition to those, passive strategies such as resilience hubs, green roofs, compact urban form, and green spaces are also important. Those nine strategies contribute to many objectives in both resilience capacities and in both foci of objectives.
Low-adoption passive strategies such as high-albedo pavements emphasize the trade-offs between mitigating urban heat islands [67,68,101,110] and maintaining winter heat gains [31,67,110]. Similarly, sparse urban form provides passive cooling potential, integration with green infrastructure, and suitability for decentralized systems. However, they increase heat loss in winter and reduce passive survivability during storms [61,73,74]. District energy systems, though improving energy efficiency and long-term resilience, may be vulnerable to disruptions [141,142] without the incorporation of redundancy or local generation [143,144]. Green and blue infrastructure could achieve higher adoption (A) scores if broader environmental benefits, including flood mitigation and surface cooling, are considered.
Overall, these findings underscore the importance of context-sensitive adoption, combining active and passive strategies to maximize resilience while minimizing unintended negative impacts.

4.2. Long-Term vs. Short-Term Scenarios

The results highlight several key patterns in resilience strategy performance. Strategies that scored high in both long- and short-term capacities, such as RES for heating and cooling, ESS, CHP, and green roofs, demonstrate their dual potential for immediate operational benefits and sustained resilience over time. Heat pumps can enhance energy efficiency and increase the availability and accessibility of energy supply [30,62], contributing to the long-term resilience capacity. Also, their high-energy efficiency can increase the robustness against disruptions [30,62], contributing to the short-term resilience capacity.
Strategies with high long-term but low short-term performance show that active strategies such as active heat recovery systems and automated indoor blinds, despite their dependency on powered operation, can be either integrated with backup or demand-side management capacity [98,99,100] or be manually operated [122,123], respectively. At the neighborhood level, district energy systems have a low short-term score due to centralization. However, well-designed systems with backup and decentralization elements can improve robustness and redundancy [143,144]. Such enhancements were not fully considered in this tool. The long-term high score is reasonable due to the high energy efficiency that comes with these systems [141,142]. Similarly, large manmade water bodies help in regulating heating and cooling loads during normal conditions [15,18,139] but negatively impact thermally oriented objectives during storms [31,139,140].
Conversely, strategies with higher short-term than long-term scores also exist. At the building component level, compact buildings and operable windows have high scores in short-term resilience. However, they can still contribute to long-term energy efficiency when integrated with adaptive design features such as shading and natural ventilation [61,72,73,74,75]. High-albedo materials at both urban levels reduce urban heat island effects and cooling loads. However, their long-term score is affected by their negative impact in reducing heat gain in winter [31,67,110], thus increasing heating loads. At the neighborhood level, resilience hubs and courtyard forms have some moderate long-term benefits such as increasing the availability of energy sources and reducing cooling loads [61,76,137], respectively. However, their score is better during disruptions. Resilience hubs provide energy for inhabitants and critical services while courtyard forms mitigate heatwaves and help in regulating thermal performance [61,76,137].
Strategies scoring low in both capacities are the last category. At the building component level, high airtight envelopes and south-facing facades with high a window-to-wall ratio have scores that are low in the short term because of their negative impact under heatwave outages. Also, in the long term, they can exacerbate overheating risks, increase energy consumption for cooling, and reduce occupant comfort if not paired with adaptive shading or ventilation strategies. At the neighborhood level, the sparse urban form, despite having a low positive impact in the long-term as it allows for more solar passive heating [61,73,74], has a high negative impact on other long- and short-term objectives.
Overall, the analysis emphasizes the importance of integrating strategies with complementary strengths to enhance both short- and long-term resilience at the building and neighborhood scales.

4.3. Energy Oriented vs. Thermally Oriented Scenarios

The results highlight clear trade-offs between energy- and thermally oriented resilience objectives. Strategies with moderate performance across both objectives, passive responsive glazing, natural ventilation with passive heat recovery systems, active heat recovery systems, automated indoor blinds, and TABS, at the building component level, and compact urban form, resilience hubs, and green spaces at the neighborhood level, offer dual benefits. For instance, natural ventilation combined with passive heat recovery systems enhances energy efficiency by extracting heat from exhaust air and reusing it to improve indoor thermal condition [25,98,99,100,101,102].
Some strategies significantly enhance building energy performance but offer indirect contributions to thermal comfort and survivability. These include renewable energy systems, CHP, ESS, and backup fuel systems, representing advanced technological solutions designed to supply, store, or manage energy efficiently. However, they also provide some indirect benefits for thermal resilience by providing the energy needed during disruptions. Still, these indirect effects were not examined in this study.
High thermal mass exemplifies a strategy favoring thermal resilience over energy performance. This strategy mainly contributes to thermal regulation of the buildings despite having some positive impact on energy performance. The low score in energy is due to the fact that some evidence was found from the literature that high thermal mass can increase heating loads if the design does not receive sufficient solar gains [13,69,84,106,107,108,109], thus reducing the overall score.
Strategies scoring low in both objectives, such as high-albedo materials, high WWR south-facing facades, and high airtight envelopes, illustrate potential conflicting effects. High-albedo materials for buildings and neighborhoods have a zero score in energy due to equal chances of increasing heating loads in winter while reducing cooling load in summer. The results suggest a careful contextual-based approach to mitigate the conflicting effects. To elaborate, high airtight envelopes reduce heating loads and heat loss in winter [23,24]. However, they reduce passive survivability during heatwave outages [13,25,26]. To address these trade-offs, strategies can be combined with complementary solutions, such as automated shading or natural ventilation, and practitioners should adjust designs based on local climate and usage conditions.

4.4. Coefficient of Variation for Total Impact Potential (TIP) Scores

The high stability of the TIP scores reinforces confidence in the simulation model and suggests that the number of iterations was adequate for most strategies. The two strategies exceeding the CoV threshold, namely south-facing facades with high WWR and active responsive glazing, indicate greater variability in their performance assessments. Such findings indicate less confidence in these strategy assessments; more evidence is needed to assess them along with more iterations to reduce their variation. Also, this might indicate that such strategies are highly contextual and require detailed studies.

4.5. Worst, Mean and Best Cases

The limited variation between the worst, mean, and best cases across scenarios indicates that the ranking of strategies is robust and insensitive to probabilistic extremes. High-consistency strategies, such as ESS, CHP, automated blinds, microgrids, and resilience hubs, show strong reliability in performance evaluation. Low-ranked strategies, like high-albedo materials and sparse urban forms, demonstrate persistent underperformance regardless of case. This works as a sensitivity analysis. This stability enhances confidence in the assessment results and suggests that the Monte Carlo simulations provide a reliable representation of strategy effectiveness under different uncertainty conditions.

4.6. Hypothetical Case Study

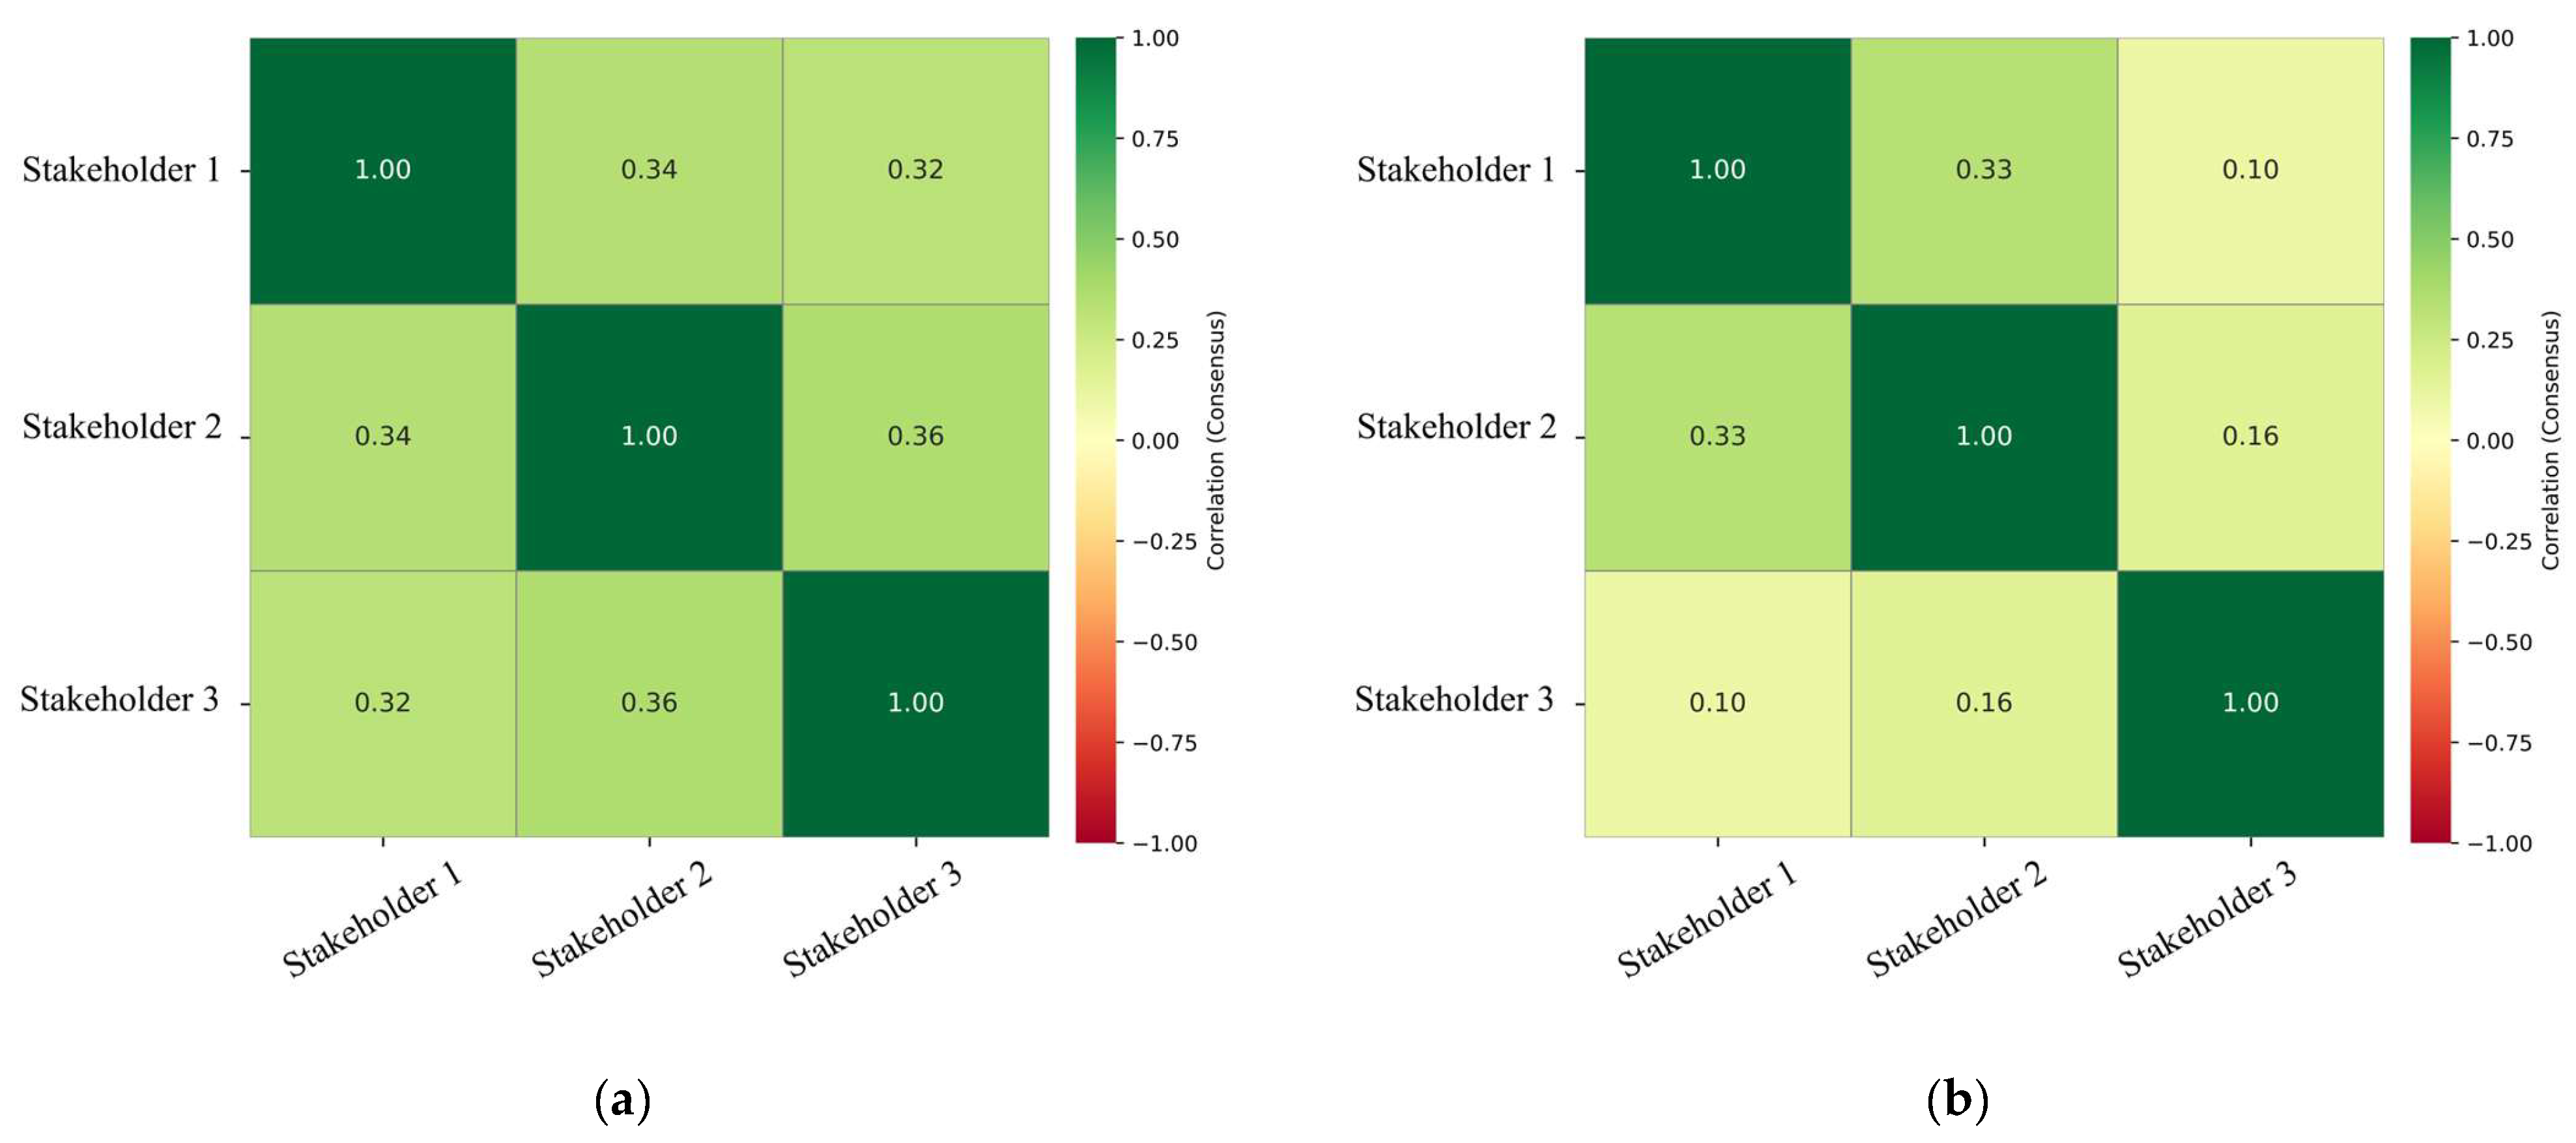
Some strategies exhibited convergence, where adoption (A) scores across all three stakeholders were relatively similar, while others displayed divergence, where scores differed substantially. These concepts are particularly valuable for decision-making: convergent strategies represent strong candidates for consensus, whereas divergent ones highlight potential trade-offs or negotiation points. To assess alignment, a correlation analysis was conducted. Figure 18 presents the results for both the building component and neighborhood levels. At the building component level, correlations among stakeholders were generally low, with Pearson coefficients of 0.32, 0.34, and 0.36. At the neighborhood level, the consensus was even weaker, as stakeholder 3 showed very low alignment with both stakeholder 1 (0.10) and stakeholder 2 (0.16). This reflects the common challenge that end users often have different priorities compared to technical stakeholders. Even between stakeholder 1 and stakeholder 2, the correlation remained modest at 0.33. These findings underscore the presence of stakeholder trade-offs and demonstrate how quantifying consensus can guide decision-making. Such quantification is essential, as it provides intermediate steps for reconsidering and re-weighting objectives to build greater alignment.
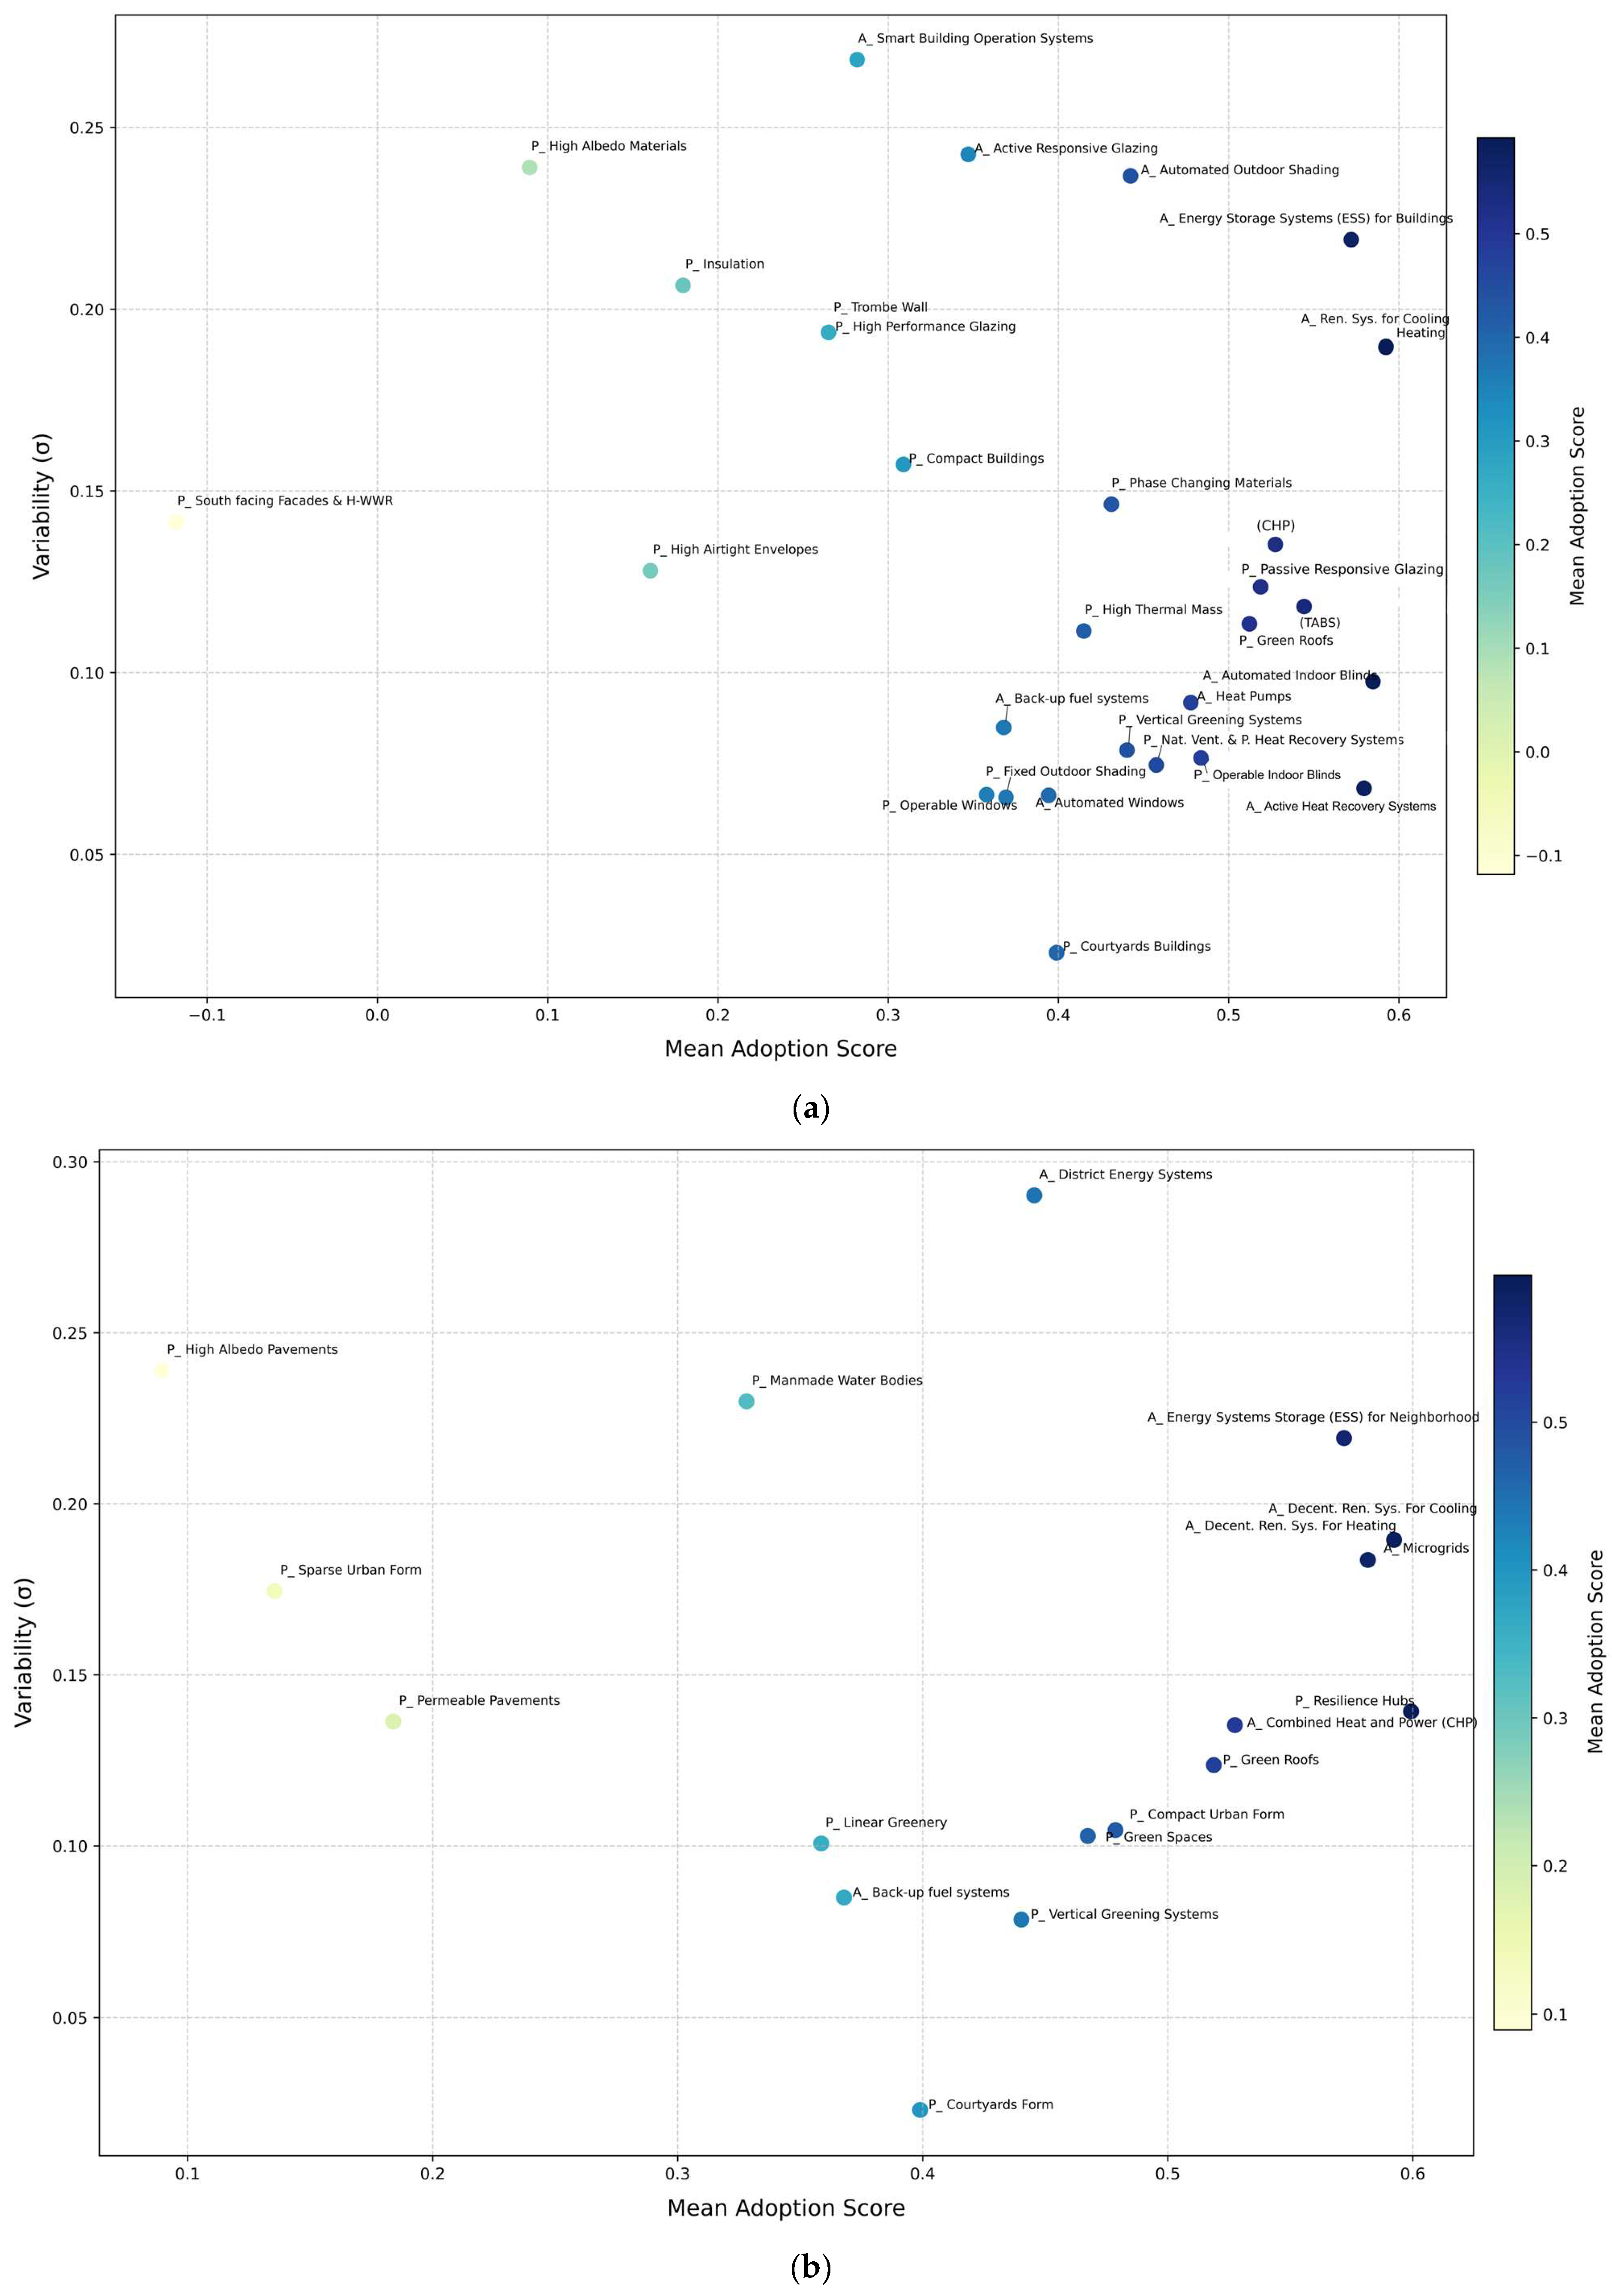
Beyond overall correlations, individual strategies can also be evaluated for their degree of convergence or divergence. As shown in Figure 19, strategies with high mean scores and low variation represent ideal entry points, since all stakeholders favor them and they can be adopted rapidly. At the building component level, these include operable indoor blinds for example. At the neighborhood level, examples include CHP and green roofs. Strategies with low means but low variation may still serve as compromise solutions, achieving a broad consensus but delivering only modest benefits. However, no clear examples exist for this case study.
In contrast, strategies with low means and high variation should generally be avoided due to weak support and conflicting views. Examples include high-albedo materials at the building component level, and sparse urban form at the neighborhood level. Finally, strategies with high means but high variation represent contentious yet impactful options, requiring negotiation and careful balancing of interests. At the building component level, these include smart building operation systems, while at the neighborhood level, they include district energy systems.

4.7. Insights, Limitations and Future Works

This study reveals that some strategies demonstrated both positive and negative impacts across different objectives, reducing the overall value and requiring specific trade-offs to be made. For example, compact buildings reduce heating loads while having difficulty in increasing solar heat gain [61,72,73,74,75]. Similarly, water bodies can serve as thermal mass in winter, absorbing heat during the day and releasing it at night, reducing temperature [15,18,139]. However, their effectiveness in winter depends on factors like size, depth, and integration with built environments. When they are frozen during storms, they may contribute to cold stress [31,139,140]. Moreover, while most strategies generally align with the qualitative knowledge found in the literature review, this study adds value by quantifying their performance using a comparable measure. The results offer a data-driven basis for decision-making rather than relying solely on narrative interpretations and general guidelines.
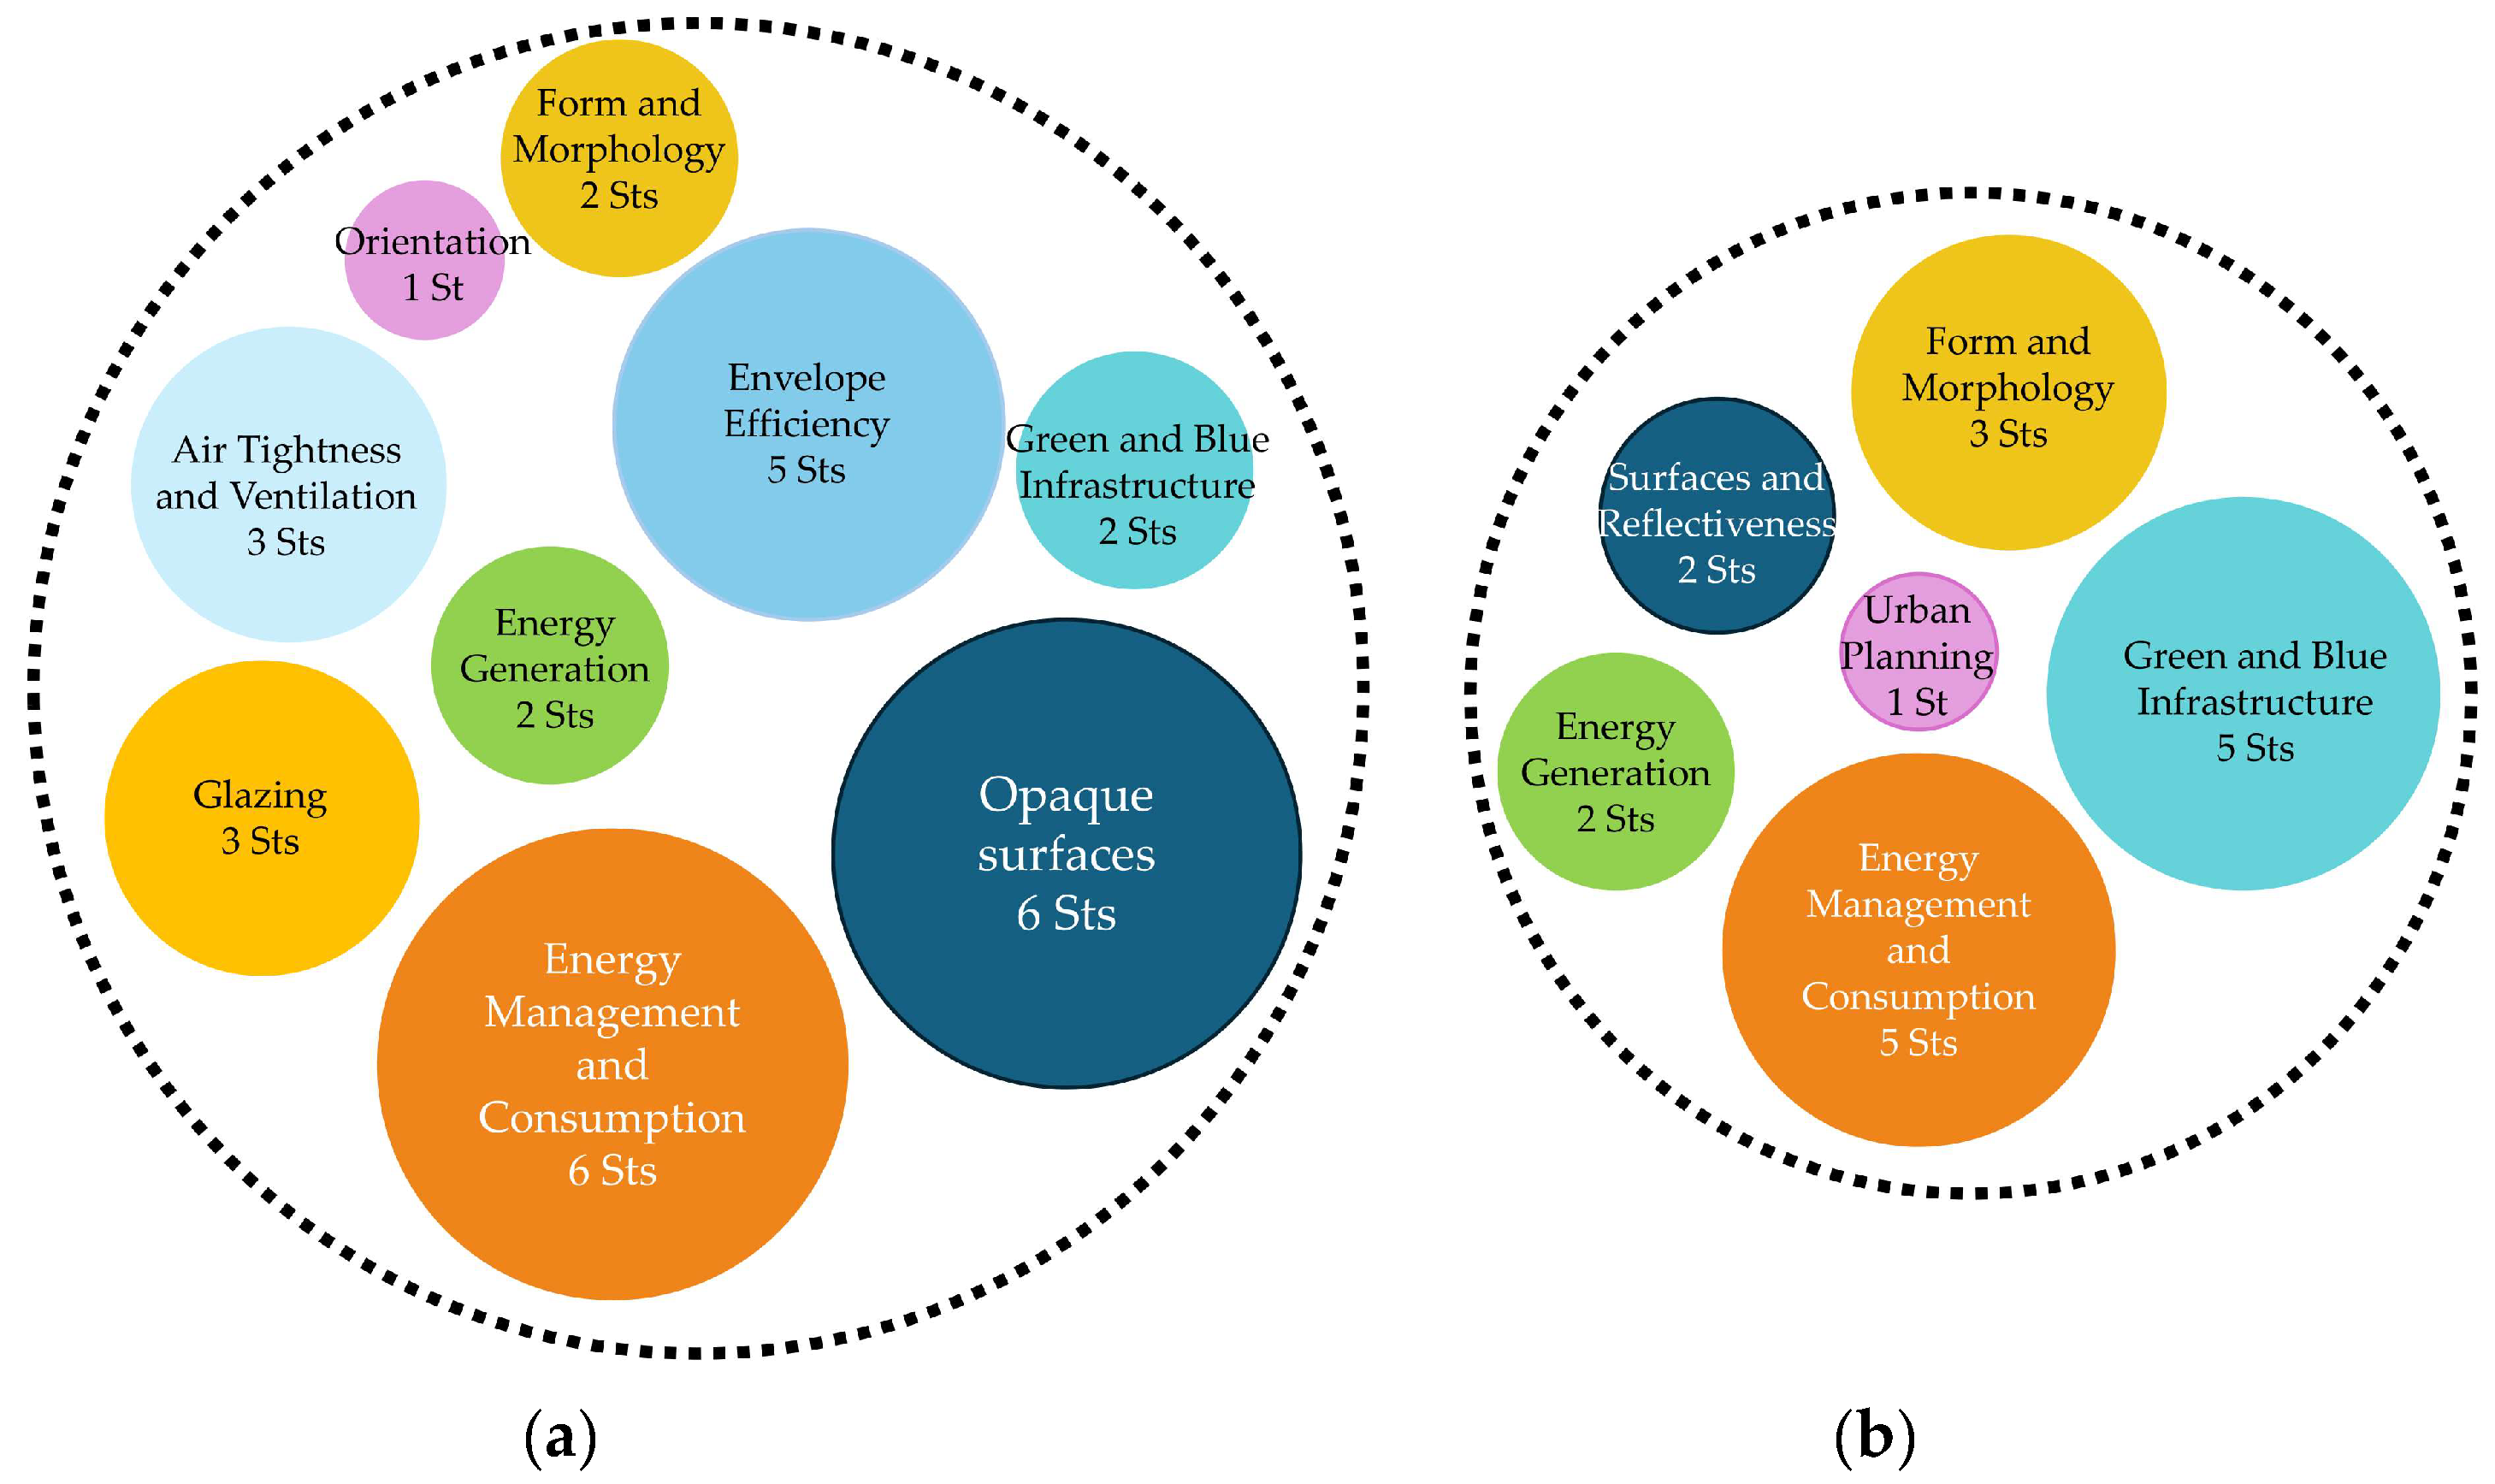
Additionally, the concept of forming packages or bundles of strategies that perform well in specific scenarios can be extended to grouping strategies according to the design variable. For example, at the building component level, strategies can be grouped into form and morphology, orientation, glazing, air tightness and ventilation, opaque surfaces, green and blue infrastructure, envelope efficiency, energy generation, and energy management and consumption. At the neighborhood level, these groups can be form and morphology, surfaces and reflectiveness, urban planning land use, green and blue infrastructure, energy generation, energy management, and consumption. This grouping can allow decision makers to select strategies from bundles to holistically address the design variables. Figure 20 shows such bundling.
From a policy perspective, the findings highlight the need for resilience strategies to be supported by context-sensitive guidelines that recognize trade-offs across scales, timescales, and objectives. Policymakers can use the quantified performance rankings to prioritize strategies that consistently deliver high resilience under uncertainty (e.g., ESS, CHP, green roofs), while developing regulatory frameworks and incentive schemes that encourage bundling of complementary active and passive measures. Additionally, the divergence in stakeholder preferences underscores the importance of participatory policy processes that balance technical assessments with end-user priorities. Integrating these insights into building codes, urban planning policies, and resilience funding programs can ensure that strategies are not only technically effective but also socially acceptable and widely adopted.
Addressing spatial constraints remains a pressing challenge in urban design. Limited space often restricts the implementation of multiple strategies simultaneously. This study contributes to solving this problem by providing a data-driven early-design tool for prioritizing resilience strategies for later design stages. Future versions of the tool will incorporate customizing the selection of objectives and weighing them according to decision makers’ preferences.
This study has several limitations. Although the literature review was comprehensive, it may not have captured all the relevant or emerging evidence. As new findings become available, the evaluation of certain strategies could change. Therefore, the results presented here should not be considered deterministic. The primary objective of this study is not to provide a definitive ranking of strategies, but rather to introduce a flexible and adaptable evaluation framework. Future studies should develop more robust methods for extracting relevant data not only from the literature but also from real-life projects.
Additionally, a single strategy can encompass multiple variants with significantly different performance outcomes. For example, active glazing technologies vary in their response during power outages: electrochromic glazing (EC) typically reverts to a clear state, while polymer-dispersed liquid crystal (PDLC) and suspended particle devices (SPDs) revert to a darkened state. These differences can influence performance across objectives. In this study, the focus was on PDLC and SPD systems, which are reported in the literature to perform favorably during heatwaves [92,93,94,95]. Future studies are encouraged to incorporate and also assess different types of the same strategy.
Another limitation is the inclusion of only direct contributions of strategies. Many strategies may produce indirect or systemic effects. For instance, natural ventilation can reduce energy consumption, indirectly supporting renewable energy systems by lowering overall demand. Similarly, backup power systems contribute to passive survivability during power outages—an indirect benefit not fully captured in the scoring framework. Future studies should incorporate these indirect systemic impacts while addressing correlation among objectives.
Interactions among resilience strategies including synergies or conflicts were not considered in this tool. Pairing strategies could positively or negatively impact the overall contributions. To address this limitation, ongoing work by the authors is developing a complementary methodology to capture and quantify these synergies and conflicts, which will be explored in future studies.
Moreover, this study addresses only energy- and thermal-oriented resilience objectives for simplification and to demonstrate the proposed method. However, resilience is inherently multi-dimensional, spanning social, economic, and environmental aspects and extending across various urban sectors such as water, food, mobility, and infrastructure systems. The methodology is scalable. In future versions, these additional dimensions and sectors should be integrated to strengthen their holistic relevance and provide a more comprehensive assessment of urban resilience.
Finally, the assessment process still involves subjectivity, despite the efforts to make it robust, since both the qualitative ratings and the ranges are based on the literature interpretation and authors’ judgment. A key future direction that we have already is to develop more standardized methods for extracting data and calibrating these probability models, thereby reducing subjectivity and enhancing reproducibility.

5. Conclusions

This study sets out to develop a data-driven early decision-making tool for evaluating resilience strategies in cold-climate urban areas at both the building component and neighborhood levels, with the goal of supporting stakeholders in prioritizing strategies for further design and exploration. A scalable, data-driven decision-making tool incorporating 48 passive and active resilience strategies mapped to 14 resilience objectives was developed. The tool integrates subjective qualitative assessments, derived from the literature, with range quantification using a Beta distribution. This approach enables a quantified, literature-informed evaluation of strategies against each objective. Monte Carlo probabilistic simulations were performed with 10,000 iterations, capturing the full spectrum of potential outcomes for each strategy–objective pair to account for uncertainty. From these simulations, several key metrics were calculated, including the probability of impact (PI) for each strategy per objective, Total and Average Impact Potentials (TIP and AIP), a Breadth Reward (BR), and a composite Adoption (A) Score.
The comparative analysis of resilience strategies across scenarios (long-term and short-term resilience capacities, energy and thermally oriented resilience objectives, and holistic scenarios) reveals significant variation in their adoption (A) scores at the building component and neighborhood levels. Results show that active energy strategies—such as ESS, RES, microgrids, and CHP—consistently achieve the highest scores across scenarios and levels, while some passive strategies, including green roofs, natural ventilation with passive heat recovery, and passive responsive glazing, demonstrate strong multi-objective performance and outage resilience. In contrast, some widely endorsed cold-climate measures, notably high airtight envelopes and large south-facing window-to-wall ratios, reveal potential short-term drawbacks during outages and extreme heat, underscoring critical temporal complexities. Simulation stability remains robust (CoV < 0.30), with a few context-sensitive exceptions that signal the need for further evidence.
The applicability of the tool was demonstrated through a hypothetical urban neighborhood case study. Three stakeholder-specific preferences of resilience objectives and their weights were integrated. The analysis revealed both convergent and divergent strategies across stakeholders. Convergent strategies, with high adoption scores and low variability, represent clear candidates for immediate implementation, while divergent strategies highlight potential trade-offs that require negotiation or prioritization. Stakeholder correlations quantified the alignment of preferences, illustrating that the consensus is generally low, particularly between stakeholder 3 and the other stakeholders, emphasizing the need for iterative evaluation and negotiation in decision-making.
This study has several limitations. The literature review, while comprehensive, may not capture all the emerging evidence, and the results should not be considered deterministic. The strategy performance can vary across different variants of the same strategy, and this study focused on specific cases reported in the literature. The analysis considered only direct contributions of strategies, excluding indirect or systemic effects and interactions. Additionally, the framework currently addresses only energy- and thermal-oriented resilience objectives, while resilience is inherently multi-dimensional, encompassing social, economic, and environmental aspects. Future work should incorporate additional resilience dimensions and broader urban sectors to enhance the framework’s comprehensiveness and applicability. Also, the subjectivity of the assessment process calls for more standardized methods for extracting data and enhancing assessment. This framework could be applied to real-world neighborhoods and expand the set of objectives to incorporate social, economic, and environmental dimensions more comprehensively.

Author Contributions

Conceptualization, A.N.M.H. and C.H.-V.; methodology, A.N.M.H.; software, A.N.M.H.; validation, C.H.-V.; formal analysis, A.N.M.H.; investigation, A.N.M.H.; resources, A.N.M.H.; data curation, A.N.M.H.; writing—original draft preparation, A.N.M.H.; writing—review and editing, A.N.M.H. and C.H.-V.; visualization, A.N.M.H.; supervision, C.H.-V.; project administration, C.H.-V. All authors have read and agreed to the published version of the manuscript.

Funding

This research is funded by the Canada First Research Excellence Fund: CFREF Volt-Age seed grant—Smart Solar Community Living Lab held by Caroline Hachem-Vermette.

Data Availability Statement

The raw data supporting the conclusions of this article will be made available by the authors on request.

Conflicts of Interest

The authors declare no conflicts of interest.

Abbreviations

The following abbreviations are used in this manuscript:
αAlpha
βBeta
AAdoption Score
AIPAverage Impact Potential
BRBreadth Reward score
CHPcombined heat and power
CoVcoefficient of variation
ESSenergy storage systems
κConcentration of a probability distribution function
μmean
MCSMonte Carlo simulations
PCMphase changing materials
PIᵢprobability of impact score for each objective i (PIᵢ)
RESrenewable energy systems
TABSthermally activated building structures
TIPTotal Impact Potential
WIPWeighted impact potential
WWRwindow-to-wall ratio

Appendix A

The appendix includes the definitions of the resilience strategies.
Compact Buildings: Buildings designed with compact shapes (low surface-to-volume ratios) to minimize heat loss in the winter and heat gain in the summer, increasing energy efficiency.
Courtyard Buildings: Structures organized around internal courtyards that enhance natural ventilation, daylight access, and microclimatic regulation while creating shaded outdoor spaces.
Longer South-facing Facades and High Window-to-Wall Ratio: Orienting buildings so that their longer facades face south and integrating larger glazing areas on this side to maximize passive solar heating in cold seasons.
Trombe Wall: A passive solar heating feature consisting of a glazed wall with high thermal mass that absorbs solar radiation during the day and gradually releases heat indoors at night.
High-Performance Glazing: Multi-layered or coated glazing systems (double, triple, or quadruple) with low U-values and optimized solar heat gain coefficients that improve insulation while allowing daylight.
Passive Responsive Glazing: Smart glazing materials, such as thermochromic or thermotropic glass, that automatically adjust transparency or reflectivity in response to environmental conditions like temperature.
Operable Windows: Windows that can be manually opened and closed, enabling natural ventilation, cooling, and improved indoor air quality when outdoor conditions are favorable.
Natural Ventilation with Passive Heat Recovery Systems: Ventilation systems that provide fresh air while reclaiming heat from exhaust air through passive exchangers (e.g., fixed plate or heat pipe), reducing energy demand.
High Airtight Envelopes: Building envelopes designed to minimize uncontrolled air leakage, improving thermal performance and reducing heating and cooling losses.
Operable Indoor Blinds: Adjustable interior shading devices that regulate incoming daylight, prevent glare, and control solar heat gains.
Fixed Outdoor Shading: Permanent external shading devices such as overhangs or louvers that block excess solar radiation and reduce cooling loads.
High Thermal Mass: Use of dense materials (e.g., concrete, stone) that absorb and store heat during the day and release it slowly, stabilizing indoor temperatures.
Envelope Insulation: Application of thermal insulation to walls, roofs, and floors to limit heat transfer and enhance building energy efficiency.
High-Albedo Materials: Surfaces with high reflectivity (light colors or reflective coatings) that reduce solar heat absorption, mitigating overheating.
Phase Change Materials (PCMs) on Surfaces: Integration of PCMs into walls, ceilings, or surfaces to store and release latent heat during phase transitions, helping regulate indoor temperature.
Vertical Greening Systems: As a Building Component: Green facades or living walls covered with vegetation that improve insulation, reduce heat gain, and enhance air quality. As a neighborhood-level strategy: Vegetated walls at the neighborhood scale, reducing heat, enhancing aesthetics, and improving microclimates.
Green Roofs: As a Building Component: Roofs covered with vegetation layers that provide insulation, reduce heat gain, retain rainwater, and contribute to urban biodiversity. This strategy can apply to both building components and in the neighborhood level through designated urban structures. As a neighborhood-level strategy: Widespread implementation of vegetated roof systems in neighborhoods to reduce urban heat, manage stormwater, and improve biodiversity.
Active Responsive Glazing: Electrically controlled glazing systems (e.g., electrochromic, polymer-dispersed liquid crystal, suspended particle device) that change transparency with external input.
Automated Windows: Windows integrated with sensors and automation technologies that open or close automatically to regulate ventilation and thermal comfort.
Active Heat Recovery Systems: Mechanical systems such as rotary wheels, run-around coils, or thermoelectric exchangers that actively transfer heat between supply and exhaust air streams.
Automated Indoor Blinds: Motorized blinds that adjust automatically based on sensors, reducing glare, regulating daylight, and managing heat gain.
Automated Outdoor Shading: Motorized external shading devices (e.g., adjustable louvers) that dynamically respond to sun position or weather to optimize comfort and energy savings.
Renewable Energy Systems for Cooling: As a Building Component: Technologies such as solar-assisted absorption chillers, air- and ground-source heat pumps, or solar-assisted cooling systems that provide low-carbon cooling. As a neighborhood-level strategy: Distributed renewable technologies (e.g., solar-assisted chillers, renewable-powered cooling) that serve buildings at the neighborhood scale.
Renewable Energy Systems for Heating: As a Building Component: Systems including solar thermal collectors, photovoltaic-thermal panels, or renewable-powered heat pumps that provide space heating and hot water sustainably. As a neighborhood-level strategy: Neighborhood-scale renewable heating solutions, including solar thermal, biomass, or renewable heat pumps, that reduce reliance on fossil fuels.
Smart Building Operation Systems: Automated systems that monitor, analyze, and optimize building operations (lighting, HVAC, energy use) to improve efficiency and comfort.
Thermally Activated Building Structures (TABS): Building elements such as concrete slabs embedded with pipes that circulate water to store and release heat, providing efficient thermal regulation.
Combined Heat and Power (CHP): As a Building Component: On-site systems that generate both electricity and usable thermal energy from a single fuel source, improving overall efficiency. As a neighborhood-level strategy: Neighborhood-scale cogeneration systems that provide electricity and thermal energy efficiently to multiple users.
Energy Storage Systems (ESS): As a Building Component: Battery systems or thermal storage units that store excess energy (electricity or heat) for later use, improving reliability and resilience. As a neighborhood-level strategy: Community-level storage solutions, such as large batteries, boreholes, or thermal tanks, that balance supply and demand and improve resilience.
Backup Fuel Systems: As a Building Component: Secondary energy supply systems, often fossil-fuel-based, that provide emergency heating or electricity during outages. As a neighborhood-level strategy: Neighborhood- or district-level backup systems, usually diesel or gas generators, that ensure power supply during grid failures.
Heat Pumps: Devices that transfer heat from air, ground, or water sources to provide efficient heating and cooling, often powered by electricity.
Compact Urban Form: Urban layouts with dense, compact structures that reduce infrastructure demand, energy use, and heat loss while enhancing walkability.
Sparse Urban Form: More spread-out, low-density urban layouts that can enhance ventilation and reduce localized overheating but increase land and energy use.
Courtyard Form: Neighborhoods or building clusters designed around shared courtyards that improve airflow, shading, and community interaction.
High-Albedo Pavements: Use of reflective paving materials that reduce solar heat absorption, mitigating the urban heat island effect.
Permeable Pavements: Paving systems that allow rainwater infiltration, reducing runoff, improving stormwater management, and mitigating surface overheating.
Resilience Hubs: Community facilities designed to provide essential services, energy, and shelter during disruptions such as heatwaves or power outages.
Green Spaces (Parks and Gardens): Urban vegetation areas that provide cooling, enhance air quality, and improve community well-being.
Linear Greenery (Trees, Bioswales, Rain Gardens): Vegetation arranged along streets or drainage systems to provide shading, stormwater management, and cooling.
Manmade Water Bodies: Artificial lakes, ponds, or canals that provide cooling through evaporation and improve recreational and aesthetic quality.
Microgrids: Localized energy networks that integrate renewable sources, storage, and demand management to provide reliable, decentralized power.
District Energy Systems: Centralized systems that supply heating, cooling, or electricity to multiple buildings through a shared network, often using waste heat or renewables.

References

  1. Zhang, X.; Flato, G.; Kirchmeier-Young, M.; Vincent, L.; Wan, H.; Wang, X.; Rong, R.; Fyfe, J.; Li, G.; Kharin, V.V. Chapter 4: Changes in Temperature and Precipitation Across Canada. In Canada’s Changing Climate Report; Government of Canada: Ottawa, ON, Canada, 2019; Volume 13. [Google Scholar]
  2. Surviving the Heat: The Impacts of the 2021 Western Heat Dome in Canada. Available online: https://science.gc.ca/site/science/en/blogs/science-health/surviving-heat-impacts-2021-western-heat-dome-canada (accessed on 11 August 2025).
  3. Chang, S.E.; McDaniels, T.L.; Mikawoz, J.; Peterson, K. Infrastructure Failure Interdependencies in Extreme Events: Power Outage Consequences in the 1998 Ice Storm. Nat. Hazards 2007, 41, 337–358. [Google Scholar] [CrossRef]
  4. Rajaram, N.; Hohenadel, K.; Gattoni, L.; Khan, Y.; Birk-Urovitz, E.; Li, L.; Schwartz, B. Assessing Health Impacts of the December 2013 Ice Storm in Ontario, Canada. BMC Public Health 2016, 16, 544. [Google Scholar] [CrossRef]
  5. Daley, W.R.; Smith, A.; Paz-Argandona, E.; Malilay, J.; McGeehin, M. An Outbreak of Carbon Monoxide Poisoning after a Major Ice Storm in Maine. J. Emerg. Med. 2000, 18, 87–93. [Google Scholar] [CrossRef] [PubMed]
  6. Zuo, J.; Pullen, S.; Palmer, J.; Bennetts, H.; Chileshe, N.; Ma, T. Impacts of Heat Waves and Corresponding Measures: A Review. J. Clean. Prod. 2015, 92, 1–12. [Google Scholar] [CrossRef]
  7. Thériault, J.M.; McFadden, V.; Thompson, H.D.; Cholette, M. Meteorological Factors Responsible for Major Power Outages during a Severe Freezing Rain Storm over Eastern Canada. J. Appl. Meteorol. Climatol. 2022, 61, 1239–1255. [Google Scholar] [CrossRef]
  8. Hachem-Vermette, C.; Yadav, S. Impact of Power Interruption on Buildings and Neighborhoods and Potential Technical and Design Adaptation Methods. Sustainability 2023, 15, 15299. [Google Scholar] [CrossRef]
  9. Casey, J.A.; Fukurai, M.; Hernández, D.; Balsari, S.; Kiang, M.V. Power Outages and Community Health: A Narrative Review. Curr. Environ. Health Rep. 2020, 7, 371–383. [Google Scholar] [CrossRef]
  10. Lebel, G.; Marjolaine, D.; Bustinza, R. Surveillance des Impacts des Vagues de Chaleur Extrême sur la Santé au Québec à l’Été 2018; Institut National de Santé Publique Du Québec: Québec, QC, Canada, 2018. [Google Scholar]
  11. Deb, A.; Sultana, H. Urban Resilience: Assessment of Performance and Science Mapping from a Climate Change Perspective. Sustain. Environ. 2024, 10, 2388936. [Google Scholar] [CrossRef]
  12. Wang, L. Exploring a Knowledge Map for Urban Resilience to Climate Change. Cities 2022, 131, 104048. [Google Scholar] [CrossRef]
  13. Baniassadi, A.; Sailor, D.J.; Scott Krayenhoff, E.; Broadbent, A.M.; Georgescu, M. Passive Survivability of Buildings under Changing Urban Climates across Eight US Cities. Environ. Res. Lett. 2019, 14, 074028. [Google Scholar] [CrossRef]
  14. Wilson, A. Passive Survivability: Understanding and Quantifying the Thermal Habitability of Buildings during Power Outages. In Climate Adaptation and Resilience Across Scales; Taylor Francis Group: Abingdon, UK, 2021; pp. 141–152. [Google Scholar]
  15. Ji, L.; Shu, C.; Gaur, A.; Wang, L.; Lacasse, M. A State-of-the-Art Review of Studies on Urban Green Infrastructure for Thermal Resilient Communities. Build. Environ. 2024, 257, 111524. [Google Scholar] [CrossRef]
  16. Hachem-Vermette, C.; Singh, K. Role of Neighbourhood Spatial and Energy Design in Reducing Energy Vulnerability during Power Disruption. Renew. Sustain. Energy Rev. 2023, 183, 113519. [Google Scholar] [CrossRef]
  17. Andersson, E.; Grimm, N.B.; Lewis, J.A.; Redman, C.L.; Barthel, S.; Colding, J.; Elmqvist, T. Urban Climate Resilience through Hybrid Infrastructure. Curr. Opin. Environ. Sustain. 2022, 55, 101158. [Google Scholar] [CrossRef]
  18. Ribeiro, D.; Mackres, E.; Baatz, B.; Cluett, R.; Jarrett, M.; Kelly, M.; Vaidyanathan, S. Enhancing Community Resilience through Energy Efficiency; American Council for an Energy-Efficient Economy (ACEEE): Washington, DC, USA, 2015. [Google Scholar]
  19. Zeng, X.; Yu, Y.; Yang, S.; Lv, Y.; Sarker, M.N.I. Urban Resilience for Urban Sustainability: Concepts, Dimensions, and Perspectives. Sustainability 2022, 14, 2481. [Google Scholar] [CrossRef]
  20. Castañeda, N.R.; Pineda-Pinto, M.; Gulsrud, N.M.; Cooper, C.; O’Donnell, M.; Collier, M. Exploring the Restorative Capacity of Urban Green Spaces and Their Biodiversity through an Adapted One Health Approach: A Scoping Review. Urban. For. Urban. Green. 2024, 100, 128489. [Google Scholar] [CrossRef]
  21. Wolfram, M.; Borgström, S.; Farrelly, M. Urban Transformative Capacity: From Concept to Practice. Ambio 2019, 48, 437–448. [Google Scholar] [CrossRef]
  22. Zhang, J.; Zhang, M.; Li, G. Multi-Stage Composition of Urban Resilience and the Influence of Pre-Disaster Urban Functionality on Urban Resilience. Nat. Hazards 2021, 107, 447–473. [Google Scholar] [CrossRef]
  23. Sheng, M.; Reiner, M.; Sun, K.; Hong, T. Assessing Thermal Resilience of an Assisted Living Facility during Heat Waves and Cold Snaps with Power Outages. Build. Environ. 2023, 230, 110001. [Google Scholar] [CrossRef]
  24. Gaarder, J.E.; Friis, N.K.; Larsen, I.S.; Time, B.; Møller, E.B.; Kvande, T. Optimization of Thermal Insulation Thickness Pertaining to Embodied and Operational GHG Emissions in Cold Climates—Future and Present Cases. Build. Environ. 2023, 234, 110187. [Google Scholar] [CrossRef]
  25. Oladipo, Y.G. Evaluating Overheating Preventative Measures in Residential Buildings and Passive Survivability. Master’s Thesis, Massachusetts Institute of Technology, Cambridge, MA, USA, 2021. Available online: https://hdl.handle.net/1721.1/139224 (accessed on 11 August 2025).
  26. Calama-González, C.M.; Escandón, R.; Alonso, A.; Suárez, R.; León-Rodríguez, Á.L.; Sánchez-Ostiz Gutiérrez, A.; Arriazu-Ramos, A.; Monge-Barrio, A. Thermal Insulation Impact on Overheating Vulnerability Reduction in Mediterranean Dwellings. Heliyon 2023, 9, e16102. [Google Scholar] [CrossRef]
  27. Schnidrig, J.; Chuat, A.; Terrier, C.; Maréchal, F.; Margni, M. Power to the People: On the Role of Districts in Decentralized Energy Systems. Energies 2024, 17, 1718. [Google Scholar] [CrossRef]
  28. Huang, W.; Zhang, X.; Li, K.; Zhang, N.; Strbac, G.; Kang, C. Resilience Oriented Planning of Urban Multi-Energy Systems with Generalized Energy Storage Sources. IEEE Trans. Power Syst. 2022, 37, 2906–2918. [Google Scholar] [CrossRef]
  29. Charani Shandiz, S.; Foliente, G.; Rismanchi, B.; Wachtel, A.; Jeffers, R.F. Resilience Framework and Metrics for Energy Master Planning of Communities. Energy 2020, 203, 117856. [Google Scholar] [CrossRef]
  30. Jeffers, R.; Wachtel, A.M.; Zhivov, A.M.; Thompson, C.B.; Srivastava, A.; Daniels, P.W. Integration of Resilience Goals into Energy Master Planning Framework for Communities. In Proceedings of the ASHRAE Transactions—2020 Winter Conference, Orlando, FL, USA, 1–5 February 2020. [Google Scholar]
  31. Irmak, M.A.; Yilmaz, S.; Mutlu, E.; Yilmaz, H. Analysis of Different Urban Spaces on Thermal Comfort in Cold Regions: A Case from Erzurum. Theor. Appl. Climatol. 2020, 141, 1593–1609. [Google Scholar] [CrossRef]
  32. Andenæs, E.; Kvande, T.; Muthanna, T.M.; Lohne, J. Performance of Blue-Green Roofs in Cold Climates: A Scoping Review. Buildings 2018, 8, 55. [Google Scholar] [CrossRef]
  33. Xing, Q.; Hao, X.; Lin, Y.; Tan, H.; Yang, K. Experimental Investigation on the Thermal Performance of a Vertical Greening System with Green Roof in Wet and Cold Climates during Winter. Energy Build. 2019, 183, 105–117. [Google Scholar] [CrossRef]
  34. Mehmood, A. Of Resilient Places: Planning for Urban Resilience. Eur. Plan. Stud. 2016, 24, 407–419. [Google Scholar] [CrossRef]
  35. Gaur, A.S.; Fitiwi, D.Z.; Curtis, J. Heat Pumps and Our Low-Carbon Future: A Comprehensive Review. Energy Res. Soc. Sci. 2021, 71, 101764. [Google Scholar] [CrossRef]
  36. Mahmoud, M.; Ramadan, M.; Naher, S.; Pullen, K.; Baroutaji, A.; Olabi, A.G. Recent Advances in District Energy Systems: A Review. Therm. Sci. Eng. Prog. 2020, 20, 100678. [Google Scholar] [CrossRef]
  37. Sharifi, A. Trade-Offs and Conflicts between Urban Climate Change Mitigation and Adaptation Measures: A Literature Review. J. Clean. Prod. 2020, 276, 122813. [Google Scholar] [CrossRef]
  38. Sharifi, A. Co-Benefits and Synergies between Urban Climate Change Mitigation and Adaptation Measures: A Literature Review. Sci. Total Environ. 2021, 750, 141642. [Google Scholar] [CrossRef]
  39. Meerow, S.; Newell, J.P.; Stults, M. Defining Urban Resilience: A Review. Landsc. Urban. Plan. 2016, 147, 38–49. [Google Scholar] [CrossRef]
  40. Sharifi, A.; Chelleri, L.; Fox-Lent, C.; Grafakos, S.; Pathak, M.; Olazabal, M.; Moloney, S.; Yumagulova, L.; Yamagata, Y. Conceptualizing Dimensions and Characteristics of Urban Resilience: Insights from a Co-Design Process. Sustainability 2017, 9, 1032. [Google Scholar] [CrossRef]
  41. Grewal, K.S.; Hachem-Vermette, C.; Yadav, S. Decision-Making Method to Prioritize and Implement Solar Strategies on Neighborhood Level. Energy Rep. 2024, 12, 2062–2076. [Google Scholar] [CrossRef]
  42. Brown, C.; Shaker, R.R.; Das, R. A Review of Approaches for Monitoring and Evaluation of Urban Climate Resilience Initiatives. Environ. Dev. Sustain. 2018, 20, 23–40. [Google Scholar] [CrossRef]
  43. Dianat, H.; Wilkinson, S.; Williams, P.; Khatibi, H. Choosing a Holistic Urban Resilience Assessment Tool. Int. J. Disaster Risk Reduct. 2022, 71, 102789. [Google Scholar] [CrossRef]
  44. Berbés-Blázquez, M.; Cook, E.M.; Grimm, N.B.; Iwaniec, D.M.; Mannetti, L.M.; Muñoz-Erickson, T.A.; Wahl, D. Assessing Resilience, Equity, and Sustainability of Future Visions across Two Urban Scales. Sustain. Sci. 2023, 18, 2549–2566. [Google Scholar] [CrossRef]
  45. Shamsipour, A.; Jahanshahi, S.; Mousavi, S.S.; Shoja, F.; Ansari Golenji, R.; Tayebi, S.; Alavi, S.A.; Sharifi, A. Assessing and Mapping Urban Ecological Resilience Using the Loss-Gain Approach: A Case Study of Tehran, Iran. Sustain. Cities Soc. 2024, 103, 105252. [Google Scholar] [CrossRef]
  46. Wang, L.; Xue, X.; Wang, Z.; Zhang, L. A Unified Assessment Approach for Urban Infrastructure Sustainability and Resilience. Adv. Civ. Eng. 2018, 2018, 2073968. [Google Scholar] [CrossRef]
  47. Reitberger, R.; Palm, N.; Palm, H.; Lang, W. Urban Systems Exploration: A Generic Process for Multi-Objective Urban Planning to Support Decision Making in Early Design Phases. Build. Environ. 2024, 254, 111360. [Google Scholar] [CrossRef]
  48. Hopfe, C.J.; McLeod, R.S. Enhancing Resilient Community Decision-Making Using Building Performance Simulation. Build. Environ. 2021, 188, 107398. [Google Scholar] [CrossRef]
  49. Bretagnolle, A.; Daudé, É.; Pumain, D. From Theory to Modelling: Urban Systems as Complex Systems. In Proceedings of the 13th European Colloquium on Theoretical and Quantitative Geography, Lucca, Italy, 5–9 September 2003. [Google Scholar] [CrossRef]
  50. Büyüközkan, G.; Ilıcak, Ö.; Feyzioğlu, O. A Review of Urban Resilience Literature. Sustain. Cities Soc. 2022, 77, 103579. [Google Scholar] [CrossRef]
  51. Carramiñana, D.; Bernardos, A.M.; Besada, J.A.; Casar, J.R. Towards Resilient Cities: A Hybrid Simulation Framework for Risk Mitigation through Data-Driven Decision Making. Simul. Model. Pract. Theory 2024, 133, 102924. [Google Scholar] [CrossRef]
  52. Bozza, A.; Asprone, D.; Manfredi, G. Developing an Integrated Framework to Quantify Resilience of Urban Systems against Disasters. Nat. Hazards 2015, 78, 1729–1748. [Google Scholar] [CrossRef]
  53. Salomon, J.; Broggi, M.; Kruse, S.; Weber, S.; Beer, M. Resilience Decision-Making for Complex Systems. ASME J. Risk Uncertainty Part B 2020, 6, 020901. [Google Scholar] [CrossRef]
  54. Nozhati, S. A Resilience-Based Framework for Decision Making Based on Simulation-Optimization Approach. Struct. Saf. 2021, 89, 102032. [Google Scholar] [CrossRef]
  55. Govindan, R.; Al-Ansari, T. Computational Decision Framework for Enhancing Resilience of the Energy, Water and Food Nexus in Risky Environments. Renew. Sustain. Energy Rev. 2019, 112, 653–668. [Google Scholar] [CrossRef]
  56. Datola, G. Implementing Urban Resilience in Urban Planning: A Comprehensive Framework for Urban Resilience Evaluation. Sustain. Cities Soc. 2023, 98, 104821. [Google Scholar] [CrossRef]
  57. Ribeiro, B.; Bailey, T. Indicators for Local Energy Resilience; ACEEE: Washington, DC, USA, 2017. [Google Scholar]
  58. Mutani, G.; Todeschi, V. Energy Resilience, Vulnerability and Risk in Urban Spaces. J. Sustain. Dev. Energy Water Environ. Syst. 2018, 6, 694–709. [Google Scholar] [CrossRef]
  59. Buckley, N.; Mills, G.; Letellier-Duchesne, S.; Benis, K. Designing an Energy-Resilient Neighbourhood Using an Urban Building Energy Model. Energies 2021, 14, 4445. [Google Scholar] [CrossRef]
  60. Sharifi, A.; Yamagata, Y. A Conceptual Framework for Assessment of Urban Energy Resilience. Energy Procedia 2015, 75, 2904–2909. [Google Scholar] [CrossRef]
  61. Dursun, D.; Yavas, M. Climate-Sensitive Urban Design in Cold Climate Zone: The City of Erzurum, Turkey. Int. Rev. Spat. Plan. Sustain. Dev. 2015, 3, 17–38. [Google Scholar] [CrossRef]
  62. ur Rehman, H.; Hamdy, M.; Hasan, A. Towards Extensive Definition and Planning of Energy Resilience in Buildings in Cold Climate. Buildings 2024, 14, 1453. [Google Scholar] [CrossRef]
  63. Singh, K.; Hachem-Vermette, C. Techniques of Improving Infrastructure and Energy Resilience in Urban Setting. Energies 2022, 15, 6253. [Google Scholar] [CrossRef]
  64. Shandiz, S.C.; Rismanchi, B.; Foliente, G.; Aye, L. A Model for Energy Master Planning and Resilience Assessment of Net-Zero Emissions Community. Sustain. Resilient Infrastruct. 2023, 8, 375–399. [Google Scholar] [CrossRef]
  65. Nik, V.M.; Perera, A.T.D.; Chen, D. Towards Climate Resilient Urban Energy Systems: A Review. Natl Sci Rev 2021, 8, nwaa134. [Google Scholar] [CrossRef] [PubMed]
  66. Erker, S.; Stangl, R.; Stoeglehner, G. Resilience in the Light of Energy Crises—Part I: A Framework to Conceptualise Regional Energy Resilience. J. Clean. Prod. 2017, 164, 420–433. [Google Scholar] [CrossRef]
  67. Keith, L.; Meerow, S. Planning for Urban Heat Resilience; Planning Advisory Services Report 600; American Planning Association: Chicago, IL, USA, 2022; ISBN 978-1-61190-208-2. [Google Scholar]
  68. Leal Filho, W.; Echevarria Icaza, L.; Neht, A.; Klavins, M.; Morgan, E.A. Coping with the Impacts of Urban Heat Islands. A Literature Based Study on Understanding Urban Heat Vulnerability and the Need for Resilience in Cities in a Global Climate Change Context. J. Clean. Prod. 2018, 171, 1140–1149. [Google Scholar] [CrossRef]
  69. Rempel, A.R.; Danis, J.; Rempel, A.W.; Fowler, M.; Mishra, S. Improving the Passive Survivability of Residential Buildings during Extreme Heat Events in the Pacific Northwest. Appl. Energy 2022, 321, 119323. [Google Scholar] [CrossRef]
  70. Wang, R.; Lu, S.; Zhai, X.; Feng, W. The Energy Performance and Passive Survivability of High Thermal Insulation Buildings in Future Climate Scenarios. Build. Simul. 2022, 15, 1209–1225. [Google Scholar] [CrossRef]
  71. Gatto, A.; Drago, C. A Taxonomy of Energy Resilience. Energy Policy 2020, 136, 111007. [Google Scholar] [CrossRef]
  72. Depecker, P.; Menezo, C.; Virgone, J.; Lepers, S. Design of Buildings Shape and Energetic Consumption. Build. Environ. 2001, 36, 627–635. [Google Scholar] [CrossRef]
  73. Hadavi, M.; Pasdarshahri, H. Investigating Effects of Urban Configuration and Density on Urban Climate and Building Systems Energy Consumption. J. Build. Eng. 2021, 44, 102710. [Google Scholar] [CrossRef]
  74. Strømann-Andersen, J.; Sattrup, P.A. The Urban Canyon and Building Energy Use: Urban Density versus Daylight and Passive Solar Gains. Energy Build. 2011, 43, 2011–2020. [Google Scholar] [CrossRef]
  75. Liu, X.; Liu, Z.; Wu, Y.; Hu, S.; Bu, F.; An, J.; Zhou, X.; Yan, D. A Novel Quantitative Method of Heatwave Classification for Building Resilience Analysis. Sustain. Cities Soc. 2024, 112, 105603. [Google Scholar] [CrossRef]
  76. Azimi, Z.; Shafaat, A. Proposing Design Strategies for Contemporary Courtyards Based on Thermal Comfort in Cold and Semi-Arid Climate Zones. Build. Environ. 2024, 266, 112150. [Google Scholar] [CrossRef]
  77. Sayadi, S.; Hayati, A.; Salmanzadeh, M. Optimization of Window-to-Wall Ratio for Buildings Located in Different Climates: An IDA-Indoor Climate and Energy Simulation Study. Energies 2021, 14, 1974. [Google Scholar] [CrossRef]
  78. Tian, Z.; Zhang, S.; Deng, J.; Hrynyszyn, B.D. Evaluation on Overheating Risk of a Typical Norwegian Residential Building under Future Extreme Weather Conditions. Energies 2020, 13, 658. [Google Scholar] [CrossRef]
  79. Alsehail, A.; Almhafdy, A. The Effect of Window-to-Wall Ratio (WWR) and Window Orientation (WO) on the Thermal Performance: A Preliminary Overview. Environ.-Behav. Proc. J. 2020, 5, 165–173. [Google Scholar] [CrossRef]
  80. Duraković, B. Passive Solar Heating/Cooling Strategies. In PCM-Based Building Envelope Systems: Innovative Energy Solutions for Passive Design; Springer: Cham, Switzerland, 2020; pp. 39–62. [Google Scholar] [CrossRef]
  81. Mussard, M. Solar Energy under Cold Climatic Conditions: A Review. Renew. Sustain. Energy Rev. 2017, 74, 733–745. [Google Scholar] [CrossRef]
  82. Pourghorban, A.; Asoodeh, H. The Impacts of Advanced Glazing Units on Annual Performance of the Trombe Wall Systems in Cold Climates. Sustain. Energy Technol. Assess. 2022, 51, 101983. [Google Scholar] [CrossRef]
  83. Ozel, M. Thermal, Economical and Environmental Analysis of Insulated Building Walls in a Cold Climate. Energy Convers. Manag. 2013, 76, 674–684. [Google Scholar] [CrossRef]
  84. White, L.M.; Wright, G.S. Assessing Resiliency and Passive Survivability in Multifamily Buildings. In Proceedings of the 2020 Building Performance Analysis Conference and SimBuild co-organized by ASHRAE and IBPSA-USA, Chicago, IL, USA, 29 September–1 October 2022; Volume 9, pp. 144–155. [Google Scholar]
  85. Prozuments, A.; Borodinecs, A.; Bebre, G.; Bajare, D. A Review on Trombe Wall Technology Feasibility and Applications. Sustainability 2023, 15, 3914. [Google Scholar] [CrossRef]
  86. Sergei, K.; Shen, C.; Jiang, Y. A Review of the Current Work Potential of a Trombe Wall. Renew. Sustain. Energy Rev. 2020, 130, 109947. [Google Scholar] [CrossRef]
  87. Stazi, F.; Mastrucci, A.; di Perna, C. Trombe Wall Management in Summer Conditions: An Experimental Study. Solar Energy 2012, 86, 2839–2851. [Google Scholar] [CrossRef]
  88. Arntsen, T.A.; Hrynyszyn, B.D. Optimization of Window Design for Daylight and Thermal Comfort in Cold Climate Conditions. Energies 2021, 14, 8013. [Google Scholar] [CrossRef]
  89. Foroughi, R.; Asadi, S.; Khazaeli, S. On the Optimization of Energy Efficient Fenestration for Small Commercial Buildings in the United States. J. Clean. Prod. 2021, 283, 124604. [Google Scholar] [CrossRef]
  90. Singhal, G.; Devi, S.; Balaji, K.; Rajasekar, E.; Natarajan, S. Optimization of Building Form and Fenestration for Current and Future Climate Scenarios. In Proceedings of the Building Simulation 2019: 16th Conference of IBPSA, Rome, Italy, 2–4 September 2019; Volume 16, pp. 3046–3054. [Google Scholar]
  91. Fang, Y.; Cho, S. Design Optimization of Building Geometry and Fenestration for Daylighting and Energy Performance. Solar Energy 2019, 191, 7–18. [Google Scholar] [CrossRef]
  92. Liu, X.; Wu, Y. A Review of Advanced Architectural Glazing Technologies for Solar Energy Conversion and Intelligent Daylighting Control. Archit. Intell. 2022, 1, 10. [Google Scholar] [CrossRef]
  93. Rezaei, S.D.; Shannigrahi, S.; Ramakrishna, S. A Review of Conventional, Advanced, and Smart Glazing Technologies and Materials for Improving Indoor Environment. Sol. Energy Mater. Sol. Cells 2017, 159, 26–51. [Google Scholar] [CrossRef]
  94. Liu, M.; Wittchen, K.B.; Heiselberg, P.K. Control Strategies for Intelligent Glazed Façade and Their Influence on Energy and Comfort Performance of Office Buildings in Denmark. Appl. Energy 2015, 145, 43–51. [Google Scholar] [CrossRef]
  95. Qahtan, A.M.; Shaik, S.; Alwadai, Y.A.; Alhamami, S.; Alawlaki, A.S.; Alyami, M.H.; Kodati, J.A. Smart Glazing Systems vs Conventional Glazing: A Comprehensive Study on Temperature Control, Daylighting, and Sustainability. Int. J. Sustain. Dev. Plan. 2024, 19, 939–947. [Google Scholar] [CrossRef]
  96. Zhou, P.; Wang, H.; Li, F.; Dai, Y.; Huang, C. Development of Window Opening Models for Residential Building in Hot Summer and Cold Winter Climate Zone of China. Energy Built Environ. 2022, 3, 363–372. [Google Scholar] [CrossRef]
  97. Wu, H.; Zhang, T. Multi-Objective Optimization of Energy, Visual, and Thermal Performance for Building Envelopes in China’s Hot Summer and Cold Winter Climate Zone. J. Build. Eng. 2022, 59, 105034. [Google Scholar] [CrossRef]
  98. O’connor, D.; Calautit, J.K.S.; Hughes, B.R. A Review of Heat Recovery Technology for Passive Ventilation Applications. Renew. Sustain. Energy Rev. 2016, 54, 1481–1493. [Google Scholar] [CrossRef]
  99. Xu, Q.; Riffat, S.; Zhang, S. Review of Heat Recovery Technologies for Building Applications. Energies 2019, Vol. 12, Page 1285 2019, 12, 1285. [Google Scholar] [CrossRef]
  100. Calautit, J.K.; O’Connor, D.; Tien, P.W.; Wei, S.; Pantua, C.A.J.; Hughes, B. Development of a Natural Ventilation Windcatcher with Passive Heat Recovery Wheel for Mild-Cold Climates: CFD and Experimental Analysis. Renew. Energy 2020, 160, 465–482. [Google Scholar] [CrossRef]
  101. Lee, S.H.; Hong, T.; Le, M.; Medina, L.; Xu, Y.; Robinson, A.; Piette, M.A. Assessment of Energy and Thermal Resilience Performance to Inform Climate Mitigation of Multifamily Buildings in Disadvantaged Communities. Sustain. Cities Soc. 2024, 104, 105319. [Google Scholar] [CrossRef]
  102. Ji, L.; Shu, C.; Laouadi, A.; Lacasse, M.; Wang, L. (Leon) Quantifying Improvement of Building and Zone Level Thermal Resilience by Cooling Retrofits against Summertime Heat Events. Build. Environ. 2023, 229, 109914. [Google Scholar] [CrossRef]
  103. Bomberg, M.; Kisilewicz, T.; Nowak, K. Is There an Optimum Range of Airtightness for a Building? J. Build. Phys. 2016, 39, 395–421. [Google Scholar] [CrossRef]
  104. Sdei, A.; Mcevoy, M. The Effects of Insulation and Air-Tightness in Reducing the Overheating Risk of Retrofitted Social Housing. Environments 2016, 11, 13. [Google Scholar]
  105. Khalid, H.L.; Donn, M.; Merwood-Salisbury, J. Systematic Literature Review on the Barriers to Using Operable Windows for Passive Cooling. Adv. Build. Energy Res. 2025, 19, 419–466. [Google Scholar] [CrossRef]
  106. Mutani, G.; Todeschi, V.; Beltramino, S. Energy Consumption Models at Urban Scale to Measure Energy Resilience. Sustainability 2020, 12, 5678. [Google Scholar] [CrossRef]
  107. Carlos, J.S. The Impact of Thermal Mass on Cold and Hot Climate Zones of Portugal. Indoor Built Environ. 2017, 26, 733–743. [Google Scholar] [CrossRef]
  108. Akander, J.; Bakhtiari, H.; Ghadirzadeh, A.; Mattsson, M.; Hayati, A. Development of an AI Model Utilizing Buildings’ Thermal Mass to Optimize Heating Energy and Indoor Temperature in a Historical Building Located in a Cold Climate. Buildings 2024, 14, 1985. [Google Scholar] [CrossRef]
  109. Reilly, A.; Kinnane, O. The Impact of Thermal Mass on Building Energy Consumption. Appl. Energy 2017, 198, 108–121. [Google Scholar] [CrossRef]
  110. Touchaei, A.G.; Akbari, H. Evaluation of the Seasonal Effect of Increasing Albedo on Urban Climate and Energy Consumption of Buildings in Montreal. Urban. Clim. 2015, 14, 278–289. [Google Scholar] [CrossRef]
  111. Madessa, H.B. A Review of the Performance of Buildings Integrated with Phase Change Material: Opportunities for Application in Cold Climate. Energy Procedia 2014, 62, 318–328. [Google Scholar] [CrossRef]
  112. Zhou, Z.; Zhang, Z.; Zuo, J.; Huang, K.; Zhang, L. Phase Change Materials for Solar Thermal Energy Storage in Residential Buildings in Cold Climate. Renew. Sustain. Energy Rev. 2015, 48, 692–703. [Google Scholar] [CrossRef]
  113. Li, Z.; Chow, D.H.C.; Yao, J.; Zheng, X.; Zhao, W. The Effectiveness of Adding Horizontal Greening and Vertical Greening to Courtyard Areas of Existing Buildings in the Hot Summer Cold Winter Region of China: A Case Study for Ningbo. Energy Build. 2019, 196, 227–239. [Google Scholar] [CrossRef]
  114. Medl, A.; Stangl, R.; Florineth, F. Vertical Greening Systems—A Review on Recent Technologies and Research Advancement. Build. Environ. 2017, 125, 227–239. [Google Scholar] [CrossRef]
  115. Wang, P.; Wong, Y.H.; Tan, C.Y.; Li, S.; Chong, W.T. Vertical Greening Systems: Technological Benefits, Progresses and Prospects. Sustainability 2022, 14, 12997. [Google Scholar] [CrossRef]
  116. Pérez, G.; Coma, J.; Cabeza, L.F. Vertical Greening Systems to Enhance the Thermal Performance of Buildings and Outdoor Comfort. In Nature Based Strategies for Urban and Building Sustainability; Butterworth-Heinemann: Oxford, UK, 2018; pp. 99–108. [Google Scholar] [CrossRef]
  117. Tang, X.; Qu, M. Phase Change and Thermal Performance Analysis for Green Roofs in Cold Climates. Energy Build. 2016, 121, 165–175. [Google Scholar] [CrossRef]
  118. Jamei, E.; Chau, H.W.; Seyedmahmoudian, M.; Stojcevski, A. Review on the Cooling Potential of Green Roofs in Different Climates. Sci. Total Environ. 2021, 791, 148407. [Google Scholar] [CrossRef] [PubMed]
  119. Lönnqvist, J.; Blecken, G.T.; Viklander, M. Vegetation Cover and Plant Diversity on Cold Climate Green Roofs. J. Urban Ecol. 2021, 7. [Google Scholar] [CrossRef]
  120. Psomas, T.; Fiorentini, M.; Kokogiannakis, G.; Heiselberg, P. Ventilative Cooling through Automated Window Opening Control Systems to Address Thermal Discomfort Risk during the Summer Period: Framework, Simulation and Parametric Analysis. Energy Build. 2017, 153, 18–30. [Google Scholar] [CrossRef]
  121. Psomas, T.; Heiselberg, P.; Lyme, T.; Duer, K. Automated Roof Window Control System to Address Overheating on Renovated Houses: Summertime Assessment and Intercomparison. Energy Build. 2017, 138, 35–46. [Google Scholar] [CrossRef]
  122. Shum, C.; Zhong, L. A Review of Smart Solar Shading Systems and Their Applications: Opportunities in Cold Climate Zones. J. Build. Eng. 2023, 64, 105583. [Google Scholar] [CrossRef]
  123. Shum, C.; Zhong, L. Optimizing Automated Shading Systems for Enhanced Energy Performance in Cold Climate Zones: Strategies, Savings, and Comfort. Energy Build. 2023, 300, 113638. [Google Scholar] [CrossRef]
  124. Shafaghat, A.; Keyvanfar, A. Dynamic Façades Design Typologies, Technologies, Measurement Techniques, and Physical Performances across Thermal, Optical, Ventilation, and Electricity Generation Outlooks. Renew. Sustain. Energy Rev. 2022, 167, 112647. [Google Scholar] [CrossRef]
  125. Jones, P.; Hou, S.S.; Li, X. Towards Zero Carbon Design in Offices: Integrating Smart Facades, Ventilation, and Surface Heating and Cooling. Renew. Energy 2015, 73, 69–76. [Google Scholar] [CrossRef]
  126. Chel, A.; Kaushik, G. Renewable Energy Technologies for Sustainable Development of Energy Efficient Building. Alexandria Eng. J. 2018, 57, 655–669. [Google Scholar] [CrossRef]
  127. Aljashaami, B.A.; Ali, B.M.; Salih, S.A.; Alwan, N.T.; Majeed, M.H.; Ali, O.M.; Alomar, O.R.; Velkin, V.I.; Shcheklein, S.E. Recent Improvements to Heating, Ventilation, and Cooling Technologies for Buildings Based on Renewable Energy to Achieve Zero-Energy Buildings: A Systematic Review. Results Eng. 2024, 23, 102769. [Google Scholar] [CrossRef]
  128. Noh, Y.; Jafarinejad, S.; Anand, P. A Review on Harnessing Renewable Energy Synergies for Achieving Urban Net-Zero Energy Buildings: Technologies, Performance Evaluation, Policies, Challenges, and Future Direction. Sustainability 2024, 16, 3444. [Google Scholar] [CrossRef]
  129. Niu, J.; Tian, Z.; Lu, Y.; Zhao, H. Flexible Dispatch of a Building Energy System Using Building Thermal Storage and Battery Energy Storage. Appl. Energy 2019, 243, 274–287. [Google Scholar] [CrossRef]
  130. Xu, Z.; Guan, X.; Jia, Q.S.; Wu, J.; Wang, D.; Chen, S. Performance Analysis and Comparison on Energy Storage Devices for Smart Building Energy Management. IEEE Trans. Smart Grid 2012, 3, 2136–2147. [Google Scholar] [CrossRef]
  131. Schindler, B.Y.; Blank, L.; Levy, S.; Kadas, G.; Pearlmutter, D.; Blaustein, L. Integration of Photovoltaic Panels and Green Roofs: Review and Predictions of Effects on Electricity Production and Plant Communities. Isr. J. Ecol. Evol. 2016, 62, 68–73. [Google Scholar] [CrossRef]
  132. Casini, M. Extended Reality for Smart Building Operation and Maintenance: A Review. Energies 2022, 15, 3785. [Google Scholar] [CrossRef]
  133. Villar-Ramos, M.M.; Hernández-Pérez, I.; Aguilar-Castro, K.M.; Zavala-Guillén, I.; Macias-Melo, E.V.; Hernández-López, I.; Serrano-Arellano, J. A Review of Thermally Activated Building Systems (TABS) as an Alternative for Improving the Indoor Environment of Buildings. Energies 2022, 15, 6179. [Google Scholar] [CrossRef]
  134. Gong, H.; Ione, D.M. Improving the Power Outage Resilience of Buildings with Solar PV through the Use of Battery Systems and EV Energy Storage. Energies 2021, 14, 5749. [Google Scholar] [CrossRef]
  135. Klymchuk, O.; Pozdniakova, G. Improving the reliability of heat supply systems in the conditions of power outage. Odes’kyi Politech. Univ. Pr. 2024, 70, 48. [Google Scholar] [CrossRef]
  136. Rędzińska, K.; Piotrkowska, M. Urban Planning and Design for Building Neighborhood Resilience to Climate Change. Land 2020, 9, 387. [Google Scholar] [CrossRef]
  137. Joseph, D.D.; Doon, R.A. The Impact of Climate Change on Vulnerable Populations: Social Responses to a Changing Environment; Multidisciplinary Digital Publishing Institute: Basel, Switzerland, 2023; ISBN 978-3-0365-5503-4. [Google Scholar]
  138. Aram, F.; Higueras García, E.; Solgi, E.; Mansournia, S. Urban Green Space Cooling Effect in Cities. Heliyon 2019, 5, e01339. [Google Scholar] [CrossRef] [PubMed]
  139. Jandaghian, Z.; Colombo, A. The Role of Water Bodies in Climate Regulation: Insights from Recent Studies on Urban Heat Island Mitigation. Buildings 2024, 14, 2945. [Google Scholar] [CrossRef]
  140. Manteghi, G.; Bin Limit, H.; Remaz, D. Water Bodies an Urban Microclimate: A Review. Mod. Appl. Sci. 2015, 9, 1–12. [Google Scholar] [CrossRef]
  141. Mazhar, A.R.; Liu, S.; Shukla, A. A State of Art Review on the District Heating Systems. Renew. Sustain. Energy Rev. 2018, 96, 420–439. [Google Scholar] [CrossRef]
  142. Gang, W.; Wang, S.; Xiao, F.; Gao, D.C. District Cooling Systems: Technology Integration, System Optimization, Challenges and Opportunities for Applications. Renew. Sustain. Energy Rev. 2016, 53, 253–264. [Google Scholar] [CrossRef]
  143. Harsini, A.E. Resilience-Oriented District Energy System Integrated with Renewable Energy and Multi-Level Seasonal Energy Storage. J. Energy Storage 2023, 72, 108645. [Google Scholar] [CrossRef]
  144. Yan, M.; He, Y.; Shahidehpour, M.; Ai, X.; Li, Z.; Wen, J. Coordinated Regional-District Operation of Integrated Energy Systems for Resilience Enhancement in Natural Disasters. IEEE Trans. Smart Grid 2018, 10, 4881–4892. [Google Scholar] [CrossRef]
  145. Rahgozar, S.; Zare Ghaleh Seyyedi, A.; Siano, P. A Resilience-Oriented Planning of Energy Hub by Considering Demand Response Program and Energy Storage Systems. J. Energy Storage 2022, 52, 104841. [Google Scholar] [CrossRef]
  146. Ang, A.H.-S.; Tang, W.H. Probability Concepts in Engineering Planning and Design. In Decision, Risk, and Reliability, 1st ed.; John Wiley & Sons, Inc.: New York, NY, USA, 1984; Volume 2. [Google Scholar]
  147. Guimarães, V.d.A.; Leal Junior, I.C.; da Silva, M.A.V. Evaluating the Sustainability of Urban Passenger Transportation by Monte Carlo Simulation. Renew. Sustain. Energy Rev. 2018, 93, 732–752. [Google Scholar] [CrossRef]
  148. Mitropoulos, L.K.; Prevedouros, P.D.; Yu, X.; Nathanail, E.G. A Fuzzy and a Monte Carlo Simulation Approach to Assess Sustainability and Rank Vehicles in Urban Environment. Transp. Res. Procedia 2017, 24, 296–303. [Google Scholar] [CrossRef]
  149. Mustafa, A.; Ebaid, A.; Omrani, H.; McPhearson, T. A Multi-Objective Markov Chain Monte Carlo Cellular Automata Model: Simulating Multi-Density Urban Expansion in NYC. Comput. Environ. Urban. Syst. 2021, 87, 101602. [Google Scholar] [CrossRef]
  150. Wang, Z.H.; Bou-Zeid, E.; Au, S.K.; Smith, J.A. Analyzing the Sensitivity of WRF’s Single-Layer Urban Canopy Model to Parameter Uncertainty Using Advanced Monte Carlo Simulation. J. Appl. Meteorol. Climatol. 2011, 50, 1795–1814. [Google Scholar] [CrossRef]
  151. Tian, K.; Jiang, S.; Gong, W.; Dai, L.; Liu, H. A Monte Carlo Simulation Study on Probability Distribution of Urban Tunnel Fire. Syst. Sci. Control. Eng. 2021, 9, 23–31. [Google Scholar] [CrossRef]
  152. Aronica, G.T.; Franza, F.; Bates, P.D.; Neal, J.C. Probabilistic Evaluation of Flood Hazard in Urban Areas Using Monte Carlo Simulation. Hydrol. Process 2012, 26, 3962–3972. [Google Scholar] [CrossRef]
  153. Wu, X.; Huang, X. Screening of Urban Environmental Vulnerability Indicators Based on Coefficient of Variation and Anti-Image Correlation Matrix Method. Ecol. Indic. 2023, 150, 110196. [Google Scholar] [CrossRef]
Figure 1. The temporal representation of resilience stages.
Energies 18 05421 g001
Figure 2. Conceptual classification of complexities relevant to urban resilience strategies.
Energies 18 05421 g002
Figure 3. Decision-making approaches for urban resilience.
Energies 18 05421 g003
Figure 4. Main research gaps in urban resilience decision-making.
Energies 18 05421 g004
Figure 5. Research methodology.
Energies 18 05421 g005
Figure 6. Resilience objectives extracted from literature [15,18,29,57,58,59,60,61,62,63,64,65,66,67,68,69,70,71].
Energies 18 05421 g006
Figure 7. The probability distribution functions for different cases of strategy effectiveness (strength of impact) along with their certainty (confidence in impact). (a) For positive impact; (b) for negative impact.
Energies 18 05421 g007
Figure 8. Signed logarithmic diminishing reward function.
Energies 18 05421 g008
Figure 9. Assumed stakeholders and their assumed ranked objectives.
Energies 18 05421 g009
Figure 10. Results of adoption (A) scores across the scenarios at (a) the building component level and (b) the neighborhood level, respectively.
Energies 18 05421 g010aEnergies 18 05421 g010b
Figure 11. Resilience strategies adoption (A) scores ranked in the holistic scenario by their means at (a) the building component level and (b) neighborhood level, respectively.
Energies 18 05421 g011
Figure 12. Resilience strategies adoption (A) scores in the long- and short-term scenarios at the building component level.
Energies 18 05421 g012
Figure 13. Resilience strategies adoption (A) scores in the long- and short-term scenarios at the neighborhood level.
Energies 18 05421 g013
Figure 14. Resilience strategies adoption (A) scores in the energy- and thermally oriented scenarios at the building component level.
Energies 18 05421 g014
Figure 15. Resilience strategies adoption (A) scores in the energy- and thermally oriented scenarios at the neighborhood level.
Energies 18 05421 g015
Figure 16. The ranks of resilience strategies across the cases for the holistic scenario for the following: (a) building component-level strategies; and (b) neighborhood-level strategies.
Energies 18 05421 g016
Figure 17. Results of adoption (a) scores for strategies against each stakeholder at (a) the building component level and (b) the neighborhood level.
Energies 18 05421 g017
Figure 18. Pearson correlation analysis for the stakeholders at (a) the building component level and (b) the neighborhood level.
Energies 18 05421 g018
Figure 19. Mapping consensus and conflict in resilience strategies at the (a) building component level and (b) the neighborhood level.
Energies 18 05421 g019
Figure 20. Bundles of strategies based on the design variable at (a) the building component level; and (b) the neighborhood level, respectively.
Energies 18 05421 g020
Table 1. Database of strategies at the building component level.
UL: Urban Level, ST: Strategy Type, DV: Design Variable
No.ULSTDVStrategyReference
1Building ComponentPassiveForm and MorphologyCompact Buildings[61,72,73,74,75]
2Courtyards Buildings[61,76]
3OrientationLonger South-facing Facades and High WWR[77,78,79,80,81,82,83,84]
4GlazingTrombe Wall[85,86,87]
5High-Performance Glazing[84,88,89,90,91]
6Passive Responsive Glazing[92,93,94,95]
7Air Tightness and
Ventilation
Operable Windows[13,23,69,84,96,97]
8Natural Ventilation with Passive Heat Recovery Systems[25,98,99,100,101,102]
9High Airtight Envelopes[23,84,103,104]
10Opaque
Surfaces
Operable Indoor Blinds[13,23,62,69,84,105]
11Fixed Outdoor Shading[13,23,62,69,84,105]
12High Thermal Mass[13,69,84,106,107,108,109]
13Envelope Insulation[13,18,24,57,62,69,83,84]
14High-Albedo Materials[13,31,67,68,69,101,102,110]
15Phase Changing Materials (PCMs) on Surfaces[111,112]
16Green & Blue
Infra.
Vertical Greening Systems[15,33,113,114,115,116]
17Green Roofs[15,18,32,57,62,117,118,119]
18ActiveEnvelope
Efficiency
Active Responsive Glazing[92,93,94,95]
19Automated Windows[120,121]
20Active Heat Recovery Systems[98,99,100]
21Automated Indoor Blinds[122,123]
22Automated Outdoor Shading[124,125]
23Energy
Generation
Renewable Energy Systems for Cooling[18,30,57,62,114,126,127,128,129,130,131]
24Renewable Energy Systems for Heating[18,30,57,62,114,126,127,128,129,130,131]
25Energy
Management and
Consumption
Smart Building Operation Systems[132]
26Thermally Activated Building Structures (TABS)[133]
27Combined Heat and Power (CHP)[18,57]
28Energy Storage Systems (ESS) for Buildings[129,130,134]
29Backup fuel systems[30,62,135]
30Heat Pumps[30,62]
Table 2. Database of strategies at the neighborhood level.
UL: Urban Level, ST: Strategy Type, DV: Design Variable
No.ULSTDVStrategyReference
1NeighborhoodPassiveForm and MorphologyCompact Urban Form[67,74,136]
2Sparse Urban Form[61,73,74]
3Courtyard Forms[61,76]
4Surfaces
and
Reflectiveness
High-Albedo Pavements[13,31,67,68,69,101,102,110]
5Permeable Pavements[15,68]
6Urban
Planning
Resilience Hubs[137]
7Green & Blue
Infra.
Green Spaces[15,31,138]
8Linear Greenery[15,31,67,68,138]
9Vertical Greening Systems[15,33,113,114,115,116]
10Green Roofs[15,18,32,62,117,118,119]
11Manmade Water Bodies[15,18,31,138,139,140]
12ActiveEnergy
Management and
Consumption
Microgrids[18,28,29,57,59,106]
13District Energy Systems[141,142,143,144]
14Combined Heat and Power (CHP)[18,57,59]
15Energy Systems Storage (ESS)[18,28,29,30,57,62,106,145]
16Fuel-based backup generators[62,135]
17Energy
Generation
Decentralized Renewable and Diversified Energy Sources for Cooling[18,28,59,62,66,71,106,135]
18Decentralized Renewable and Diversified Energy Sources for Heating[18,28,59,62,66,71,106]
Table 3. Qualitative assessment rates.
Positive/Negative Impact
EffectivenessCertainty
StrategyH: HighH: High
M: MediumM: Medium
L: LowL: Low
Table 4. The qualitative assessment of strategies at the building component level.
E: Energy, T: Thermal, L: Long-Term, S: Short-Term, Objectives Numbers Follow the Numbers in Figure 6
Objective FocusEEEEETTEETTTTE
Resilience Objective Number12345671234123
Resilience CapacityLLLLLLLSSSSBBB
P_ Compact BuildingsHHNLH HHNMH MHHH
P_ Courtyards BuildingsMHMH NMHLH HMMH
P_ South Facades and high window-to-wall ratioHHNLH NLHHH NLH
P_ Trombe WallHHNLH HMHH NLHLH
P_ High-Performance GlazingHHNLH HHHH NLHLM
P_ Passive Responsive GlazingMMMM MMMM MMLH
P_ Operable Windows HH MH NLH MHML
P_ Nat. Vent. and P. Heat Recovery SystemsMHMH LM HMHM
P_ High Airtight EnvelopesHHNMH HH NHHHH
P_ Operable Indoor BlindsMHMH HM MHLH
P_ Fixed Outdoor Shading MH LH LH
P_ High Thermal MassNLHMH MHMH LHLH
P_ InsulationHHHH HHNLH NLHHH
P_ High-Albedo MaterialsNMHMH NHH HM HM
P_ Phase Changing MaterialsLHMH MHMH MM
P_ Vertical Greening SystemsLHHH MHNLH HMLHHH
P_ Green RoofsLHHH LHLH MMLHHM
A_ Active Responsive GlazingMMMM HMHM MMNLH
A_ Automated Windows MH HL NLH MHML
A_ Active Heat Recovery SystemsHHHM HH LHLHLH MH
A_ Automated Indoor Blinds MH HM MHHM MHMH
A_ Automated Outdoor ShadingLHMH HM MHMH
A_ Ren. Sys. for Cooling MHHMHH HLMM HM
A_ Ren. Sys. for Heating MHHMHH HLMM HM
A_ Smart Building Operation SystemsMMMM HH
A_ Thermally Activated Building Structures (TABS)HHLH MM HM LHLH
A_ Combined Heat and Power (CHP)HM HH HMMH HH
A_ Energy Storage Systems (ESS) for Buildings HHMHMH HHHH HH
A_ Backup fuel systems LH HH HH
A_ Heat PumpsHH HH HH HH
Table 5. The qualitative assessment of strategies at the neighborhood level.
E: Energy, T: Thermal, L: Long-Term, S: Short-Term, Objectives Numbers Follow the Numbers in Figure 6
Objective FocusEEEEETTEETTTTE
Resilience Objective Number12345671234123
Resilience CapacityLLLLLLLSSSSBBB
P_ Compact Urban FormHHMH HHNHH MHHMMHHM
P_ Sparse Urban FormMMLM NHHHH MHNMHMHNMH
P_ Courtyard FormsMHMH NMHLH HMMH
P_ High-Albedo PavementsNMHMH NHH HM HM
P_ Permeable Pavements MH MMMH
P_ Resilience Hubs MHLH MHMHHHHH
P_ Green Spaces (Parks and Gardens)MMHH MMNMM HHLHHHMH
P_ Linear Greenery (Trees/Bioswales/Rain gardens)LHMH LHNMM MH MHLH
P_ Vertical Greening SystemsLHHH MHNLH HMLHHH
P_ Green RoofsLHHH LHLH MMLHHM
P_ Manmade Water BodiesMHMH LHLH MMNLHHMNLH
A_ Microgrids HHHHHH HMMH MH
A_ District Energy SystemsHHHM HHMH NLH MH
A_ Combined Heat and Power (CHP)HM HH HMMH HH
A_ Energy Systems Storage (ESS) for Neighborhood HHMHMH HHHH HH
A_ Backup fuel systems LH HH HH
A_ Decent. Ren. Sys. For Cooling MHHMHH HLMM HM
A_ Decent. Ren. Sys. For Heating MHHMHH HLMM HM
Table 6. Assumed means and concentrations for the positive impact.
Positive Impact
EffectivenessAssumed Mean
[0.0, 1.0]
Scaled Mean (μ)
[0.2, 1.0]
CertaintyConcentration (κ)
StrategyH0.80.84H125
M0.50.6M25
L0.20.36L5
Table 7. Assumed means and concentrations for the negative impact.
Negative Impact
EffectivenessAssumed Mean
[0.0, 1.0]
Scaled Mean (μ)
[0.2, 1.0]
CertaintyConcentration (κ)
StrategyH0.8−0.84H125
M0.5−0.6M25
L0.2−0.36L5
Table 8. Breadth Reward scores for different numbers of net objectives achieved.
Net Objectives AchievedBreadth Reward ScoreNet Objectives AchievedBreadth Reward Score
−3−0.630930.6309
−2−0.540.7325
−1−0.315550.8155
0060.8856
10.315570.9464
20.581
Table 9. Objectives ranks and equivalent weights.
Objectives RankObjective WeightObjectives RankObjective Weight
10.3750.07
20.2360.04
30.1670.02
40.11
Table 10. The ranges of coefficient of variation (CoV) for different scenarios.
ScenarioCoV RangeStrategies with High CoV
HolisticB: [0.017, 0.127]/N: [0.017, 0.134]-
Long-termB: [0.02, 0.126]/N: [0.019, 0.02]-
Short-termB: [−0.078, 0.346]/N: [0.02, 0.191]B: south-facing facades with a high window-to-wall ratio (WWR): 0.407
Energy OrientedB: [0.017, 0.191]/N: [0.017, 0.105]-
Thermally OrientedB: [0.032, 0.407]/N: [0.024, 0.112]B: active responsive glazing: 0.346
Disclaimer/Publisher’s Note: The statements, opinions and data contained in all publications are solely those of the individual author(s) and contributor(s) and not of MDPI and/or the editor(s). MDPI and/or the editor(s) disclaim responsibility for any injury to people or property resulting from any ideas, methods, instructions or products referred to in the content.