Article

Evaluation of Steam Channeling Severity Between Cyclic Steam Simulation Wells in Offshore Heavy Oil Reservoirs Based on Cloud Model and Improved AHP-CRITIC Method

1
CNOOC Key Laboratory of Offshore Heavy Oil Thermal Recovery, Tianjin 300459, China
2
Tianjin Branch of CNOOC Ltd., Tianjin 300452, China
3
School of Petroleum Engineering, China University of Petroleum (East China), Qingdao 266580, China
*
Author to whom correspondence should be addressed.
Energies 2025, 18(20), 5407; https://doi.org/10.3390/en18205407
Submission received: 3 August 2025 / Revised: 30 September 2025 / Accepted: 10 October 2025 / Published: 14 October 2025
(This article belongs to the Section H1: Petroleum Engineering)

Abstract

Steam channeling significantly affects the production performance of cyclic steam stimulation (CSS) wells in offshore heavy oil reservoirs. However, there remains a lack of effective methods for evaluating the steam channeling severity between CSS wells in offshore heavy oil reservoirs. This study develops a novel evaluation model to quantitatively evaluate the steam channeling severity between CSS wells in offshore heavy oil reservoirs via the improved AHP-CRITIC (IAHP-CRITIC) method and the cloud model. The results indicated that, compared with the reservoir survey results for the three typical reservoirs, the accuracies of the results obtained by the AHP, CRITIC, AHP-CRITIC, and IAHP-CRITIC methods were 88%, 52%, 92%, and 100%, respectively. Therefore, the IAHP-CRITIC method was more reliable than the other methods in terms of calculating the indicator weights and evaluating the steam channeling severity between the CSS wells. The Lw7 and Lw12 in the L reservoir and Rw2, Rw3, and Rw6 in the R reservoir exhibited strong steam channeling. It is necessary to control the steam channeling of these CSS wells. This is the first study to report the evaluation of steam channeling severity between CSS wells in offshore heavy oil reservoirs. This study provides an effective model to quantitatively evaluate the steam channeling severity between CSS wells and offers valuable insights for the selection of effective strategies to control the steam channeling between CSS wells and enhance offshore heavy oil recovery.

1. Introduction

The ongoing global pandemic, economic downturn, and sustained low oil prices have driven increased demand for hydrocarbon resources worldwide [1]. With the progressive depletion of conventional onshore oil reserves, significant attention has shifted toward exploiting heavy oil reserves in offshore reservoirs [2,3]. Notably, China’s Bohai Bay contains proven heavy oil reserves exceeding 4 billion metric tons [4]. Cyclic steam stimulation (CSS) has emerged as a predominant thermal method for heavy oil reserves and has been successfully implemented in multiple offshore heavy oilfields within Bohai Bay. Despite its popularity and success, CSS is not devoid of limitations or inherent inefficiencies. During the early cycles of the CSS process, thermal energy effectively mobilizes heavy oil near the CSS wells, yielding satisfactory performance (Figure 1a). However, as the number of CSS cycles increases, reservoir thermodynamic conditions change and increase the possibility of steam channeling between CSS wells [5,6]. This phenomenon occurs when steam preferentially flows through high-permeability zones or overrides the oil layers, which reduces the thermal efficiency and substantially impairs the production performance of the surrounding CSS wells (Figure 1b).
Many factors affect the steam channeling between CSS wells, including reservoir heterogeneity, fluid saturation distribution, well spacing, etc. [7]. Therefore, the steam channeling severity varies among different CSS wells, making it difficult to conduct a quantitative evaluation. This significantly hinders the selection of effective strategies to control steam channeling between CSS wells and enhance offshore heavy oil recovery.
The multi-well CSS process is a complex system, and steam channeling emerges from the coupled interaction of multiple factors rather than any single variable. In previous studies, either only the influence of a single indicator on steam channeling severity was considered or the relative importance relationships between evaluation indicators were neglected, resulting in poor evaluation accuracy. For instance, Li et al. [8] calculated the temperature variation in surrounding CSS wells via reservoir simulations to determine the steam channeling severity during the CSS process. Zheng et al. [9] identified steam channeling wells according to the water cut and temperature during steam flooding processes. Zheng et al. [10] assessed the steam channeling severity during steam flooding processes on the basis of the increased liquid production rate, water cut, and temperature. To our knowledge, there is a lack of effective methods for evaluating the steam channeling severity between CSS wells in offshore heavy oil reservoirs.
The cloud model, which is grounded in probability theory and fuzzy set theory [11], has proven to be an effective evaluation method in diverse engineering applications. Its successful implementations include the evaluation of pedestrian—vehicle conflicts, straddle-type monorail systems, and medical equipment. Chen et al. [12] integrated the entropy method, gray relational analysis, and analytic hierarchy process (AHP) to determine the weights of the indicators and used the cloud model to evaluate the pedestrian–vehicle conflict. Similarly, Wen et al. [13] developed a safety assessment model for monorail systems by combining a CRITIC (criteria importance through intercriteria correlation) method with the cloud model. In the medical domain, Zhang et al. [14] established a comprehensive evaluation system incorporating operational status, utilization efficiency, and service quality metrics, where the subjective and objective weights were derived through the AHP and entropy weight methods, respectively.
The aforementioned literature demonstrates that the cloud model has the potential to evaluate the steam channeling severity between CSS wells and involves a critical process of calculating the indicator weights.
Currently, the subjective calculation methods for indicator weights include the AHP [15], fuzzy comprehensive evaluation [16], gray correlational analysis, etc. Among these methods, the AHP is the predominant approach for calculating indicator weights [17]. It decomposes a complex problem into interconnected factors organized in a hierarchical structure and determines the indicator weights through expert scoring. However, the AHP also presents several limitations, such as high subjectivity that may compromise reliability, a requirement for consistency verification in each calculation that increases the computational burden, and particular challenges when handling systems with numerous indicators [18].
In addition, objective calculation methods, including the entropy method [19], factor analysis, and CRITIC, are widely used for indicator weight determination [20]. Among these, CRITIC demonstrates particular effectiveness in handling interdependent indicators [21]. However, conventional CRITIC approaches exhibit limitations when applied to multidimensional indicators with nonlinear distribution patterns [22]. Such indicators often present significant dispersion characteristics [23], which conventional CRITIC methods fail to account for during computation, potentially compromising weight calculation accuracy.
This study develops a novel evaluation model to quantitatively evaluate the steam channeling severity between CSS wells in offshore heavy oil reservoirs via the improved AHP-CRITIC (IAHP-CRITIC) method and the cloud model. First, an indicator system for the steam channeling severity on the basis of monitoring and production data was established. To integrate the advantages of both objective and subjective weights and overcome the limitations of the conventional AHP and CRITIC methods, the IAHP-CRITIC method was subsequently proposed to calculate the combined weights. To the best of our knowledge, there is no report in the literature about the use of the IAHP-CRITIC method in the cloud model. Finally, the proposed model was used to evaluate the steam channeling severity between cyclic steam stimulation (CSS) wells in three typical offshore heavy oil reservoirs. This is the first study to report the evaluation of steam channeling severity between CSS wells in offshore heavy oil reservoirs. This study provides an effective model to quantitatively evaluate the steam channeling severity between CSS wells and offers valuable insights for the selection of effective strategies to control the steam channeling between CSS wells and enhance offshore heavy oil recovery.

2. Methodology

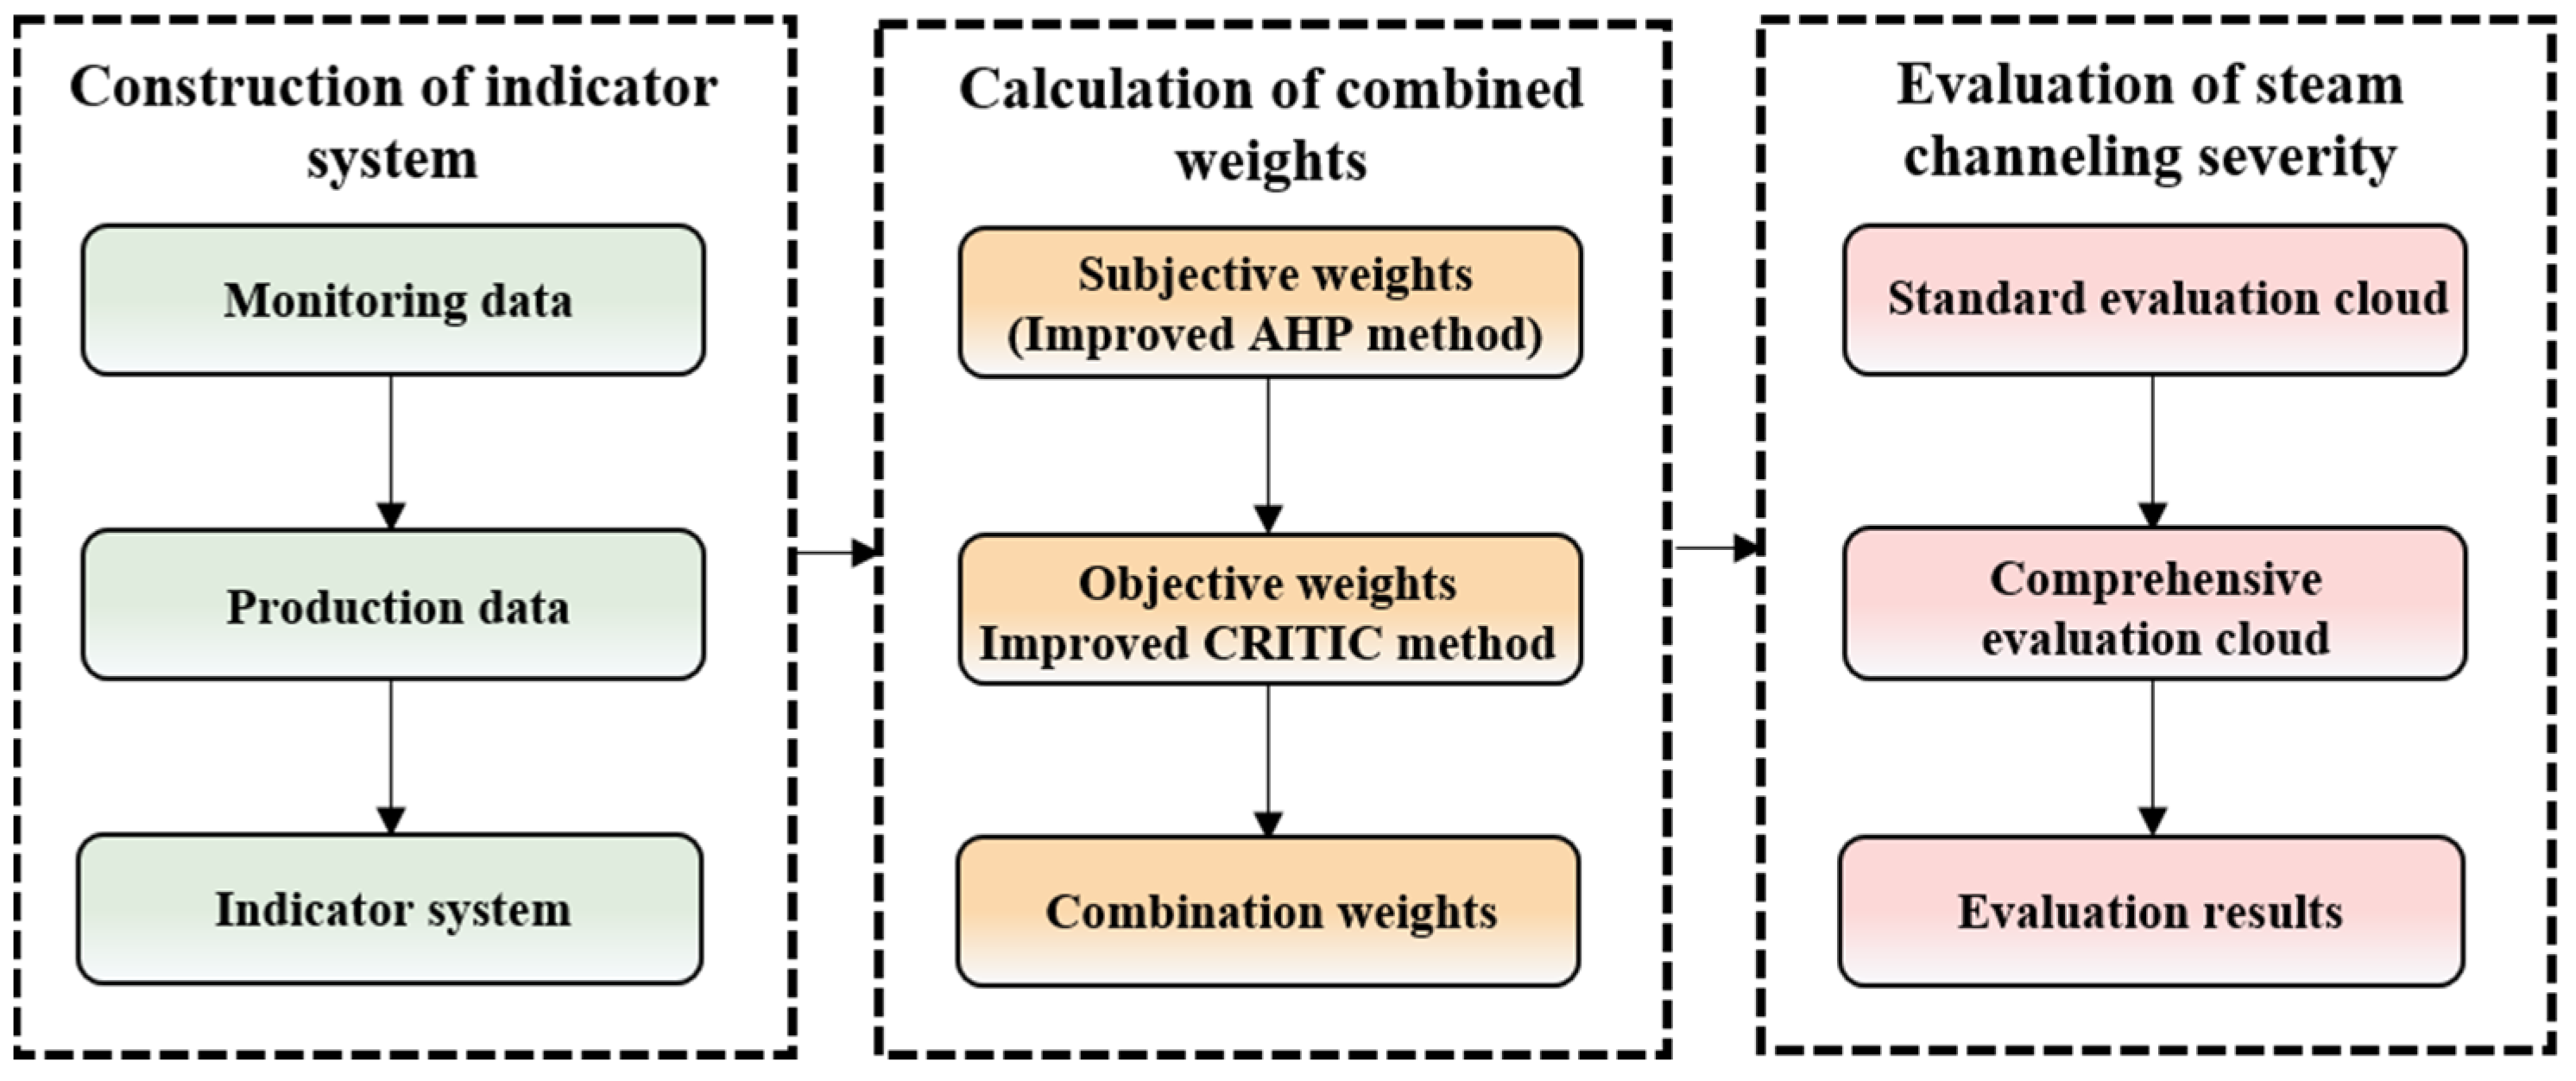
The workflow for evaluating the steam channeling severity between CSS wells is illustrated in Figure 2, which comprises three key steps: (1) construction of the indicator system, (2) calculation of combined weights, and (3) evaluation of steam channeling severity between CSS wells.

2.1. Construction of the Indicator System

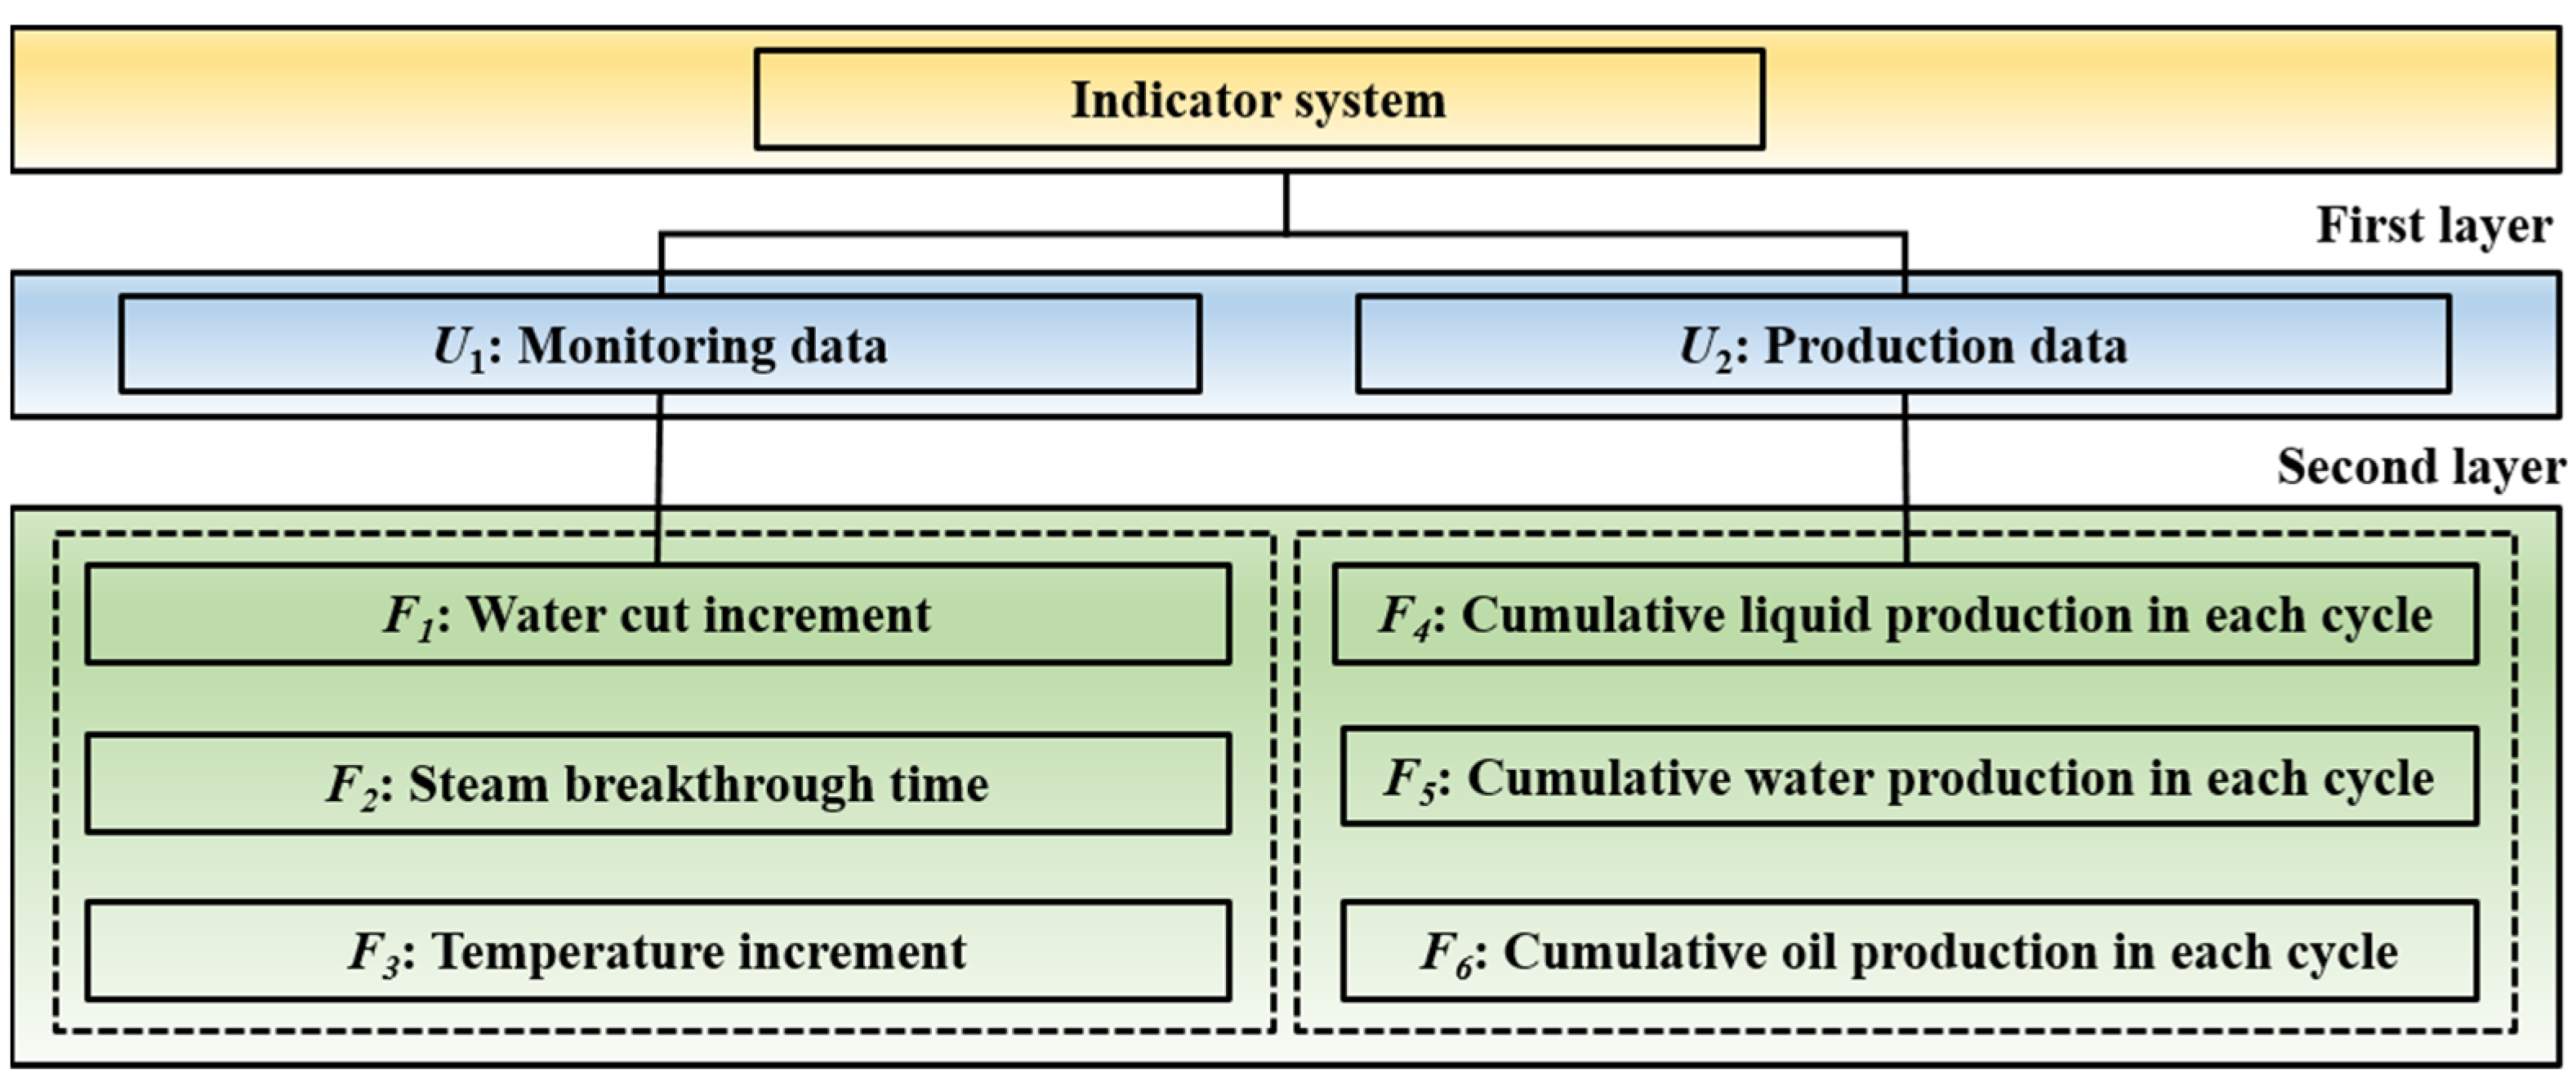
When steam channeling occurs between CSS wells, the monitoring data and production data of the surrounding CSS wells significantly change, such as an increase in water cut, temperature, and cumulative water production in each cycle, etc. On the basis of the aforementioned characteristics of steam channeling between CSS wells, a two-layer indicator system was established. The first layer includes two basic parameters: the monitoring data and production data. The second layer contains 6 indicators: the water cut increment, steam breakthrough time, temperature increment, cumulative liquid production in each cycle, cumulative water production in each cycle, and cumulative oil production in each cycle (Figure 3).

2.2. Calculation of Combined Weights

2.2.1. Improved AHP (IAHP) Method

The conventional AHP, originally developed by Saaty [24] in the 1970s, is a hierarchical decision-making framework based on network system theory [25]. Because of its strong subjectivity, it is widely used for subjective weight determination. However, the conventional AHP presents two notable limitations: significant subjectivity in expert judgments and computationally intensive consistency verification requirements for each calculation [26]. These limitations become particularly pronounced when systems with numerous indicators are used. In this study, we implemented an IAHP method to determine subjective weights, with the procedure detailed below [27].
(1)
Construction of a judgment matrix A:
A = ( a i j ) n × n ( i ,     j = 1 , 2 , 3 , , n )
where aij represents the relative importance of the i-th indicator compared to the j-th indicator. Its reciprocal aji represents the inverse relationship. n is the indicator number.
The following equations are satisfied [28]:
aij = 1/aji,  aij > 0,  aii = 0
The proportional relative formula (Wi/Wj) is used to determine the aij values. Wi and Wj represent the relative distributions of the i-th and j-th indicators, respectively, and Wi + Wj = 1 is satisfied.
(2)
Construction of an antisymmetric matrix
Let bij = lg aij; the antisymmetric matrix B is obtained, where B = ( b i j ) n × n and bij = −bji is satisfied.
(3)
Construction of the optimal transfer matrix
The cij is determined based on bij:
c i j = 1 n k = 1 n ( b i k b j k ) ( k = 1 , 2 , , n )
where bik is the value in the i-th row and k-th column of matrix B and bjk is the value in the j-th row and k-th column of matrix B. When i = 1 n j = 1 n ( c i j b i j ) 2 is minimized, the optimal transfer matrix C satisfies C = ( c i j ) n × n .
(4)
Construction of the optimization matrix:
A * = ( a i j * ) n × n
where a i j * = 10 C i j .
(5)
Determination of the subjective weight of the i-th indicator ωi:
ω i = j = 1 n a i j * i = 1 n a i j * i = 1 n j = 1 n a i j * i = 1 n a i j *

2.2.2. Improved CRITIC (ICRITIC) Method

The conventional CRITIC method demonstrates superior performance over the entropy method for determining objective weights, primarily through its consideration of both indicator conflict and contrast intensity [29]. However, this approach fails to account for data dispersion characteristics. To address this limitation, we incorporated information entropy into the CRITIC method [30]. This enhancement enables simultaneous evaluation of interindicator conflicts, contrast intensity, and data dispersion patterns. The procedure for this ICRITIC method is detailed below.
(1)
Normalization of the dimensional heterogeneity among indicators
The original indicator data were standardized to obtain G = ( g i j ) n × m , where m is the number of CSS wells in an offshore heavy oil reservoir.
(2) Calculation of the information entropy δi for the i-th indicator gi:
δ i = 1 ln m l = 1 m g i l l = 1 m g i l ln g i l l = 1 m g i l ( i = 1 , 2 , , n ; l = 1 , 2 , , m )
where gil represents the value of gi of the l-th CSS well in matrix G.
(3)
Calculation of the standard deviation σi of indicator gi and the correlation coefficient r i j between indicators gi and gj.
g ¯ i = 1 m l = 1 m g i l
σ i = l = 1 m g i l g ¯ i 2 m 1
r i j = l = 1 m g i l g ¯ i g j l g ¯ j l = 1 m g i l g ¯ i 2 l = 1 m g j l g ¯ j 2
where g ¯ i and g ¯ j are the average values of indicators gi and gj, respectively, and σi denotes the standard deviation of indicator gi.
(4)
Calculation of the information content Ci for indicator gi:
C i = ( σ i + δ i ) j = 1 n 1 r i j
(5)
Calculation of the objective weight of indicator gi ( ξ i ) as follows:
ξ i = C i i = 1 n C i = ( σ i + δ i ) j = 1 n 1 r i j i = 1 n ( σ i + δ i ) j = 1 n 1 r i j

2.2.3. Combined Weights

In this study, the IAHP method was used to determine the subjective weights on the basis of the subjective experience of the experts from offshore heavy oil oilfields, whereas the ICRITIC method was used to calculate the objective weights on the basis of the data from the CSS wells. The combined weights were subsequently calculated on the basis of the subjective and objective weights. This method makes use of both subjective experience and the dependability of objective data [31]. The calculation method for the combined weights wi is described as follows:
w i = φ ω i + ( 1 φ ) ξ i
where φ is a constant, which is 0.8 in this study.

2.3. Construction of the Cloud Model

2.3.1. Cloud Model

(1)
Concept of the cloud model
The cloud model is a sophisticated approach for uncertainty evaluation, grounded in the principles of probability theory and fuzzy set theory [32]. Consider a qualitative domain denoted as U, with C representing the corresponding qualitative concept defined over U. Assume that x is a random variable that adheres to a normal distribution, where xU, and the membership degree of x to C is a random variable characterized by a stable tendency that satisfies specific probabilistic conditions. In this framework, x and its distribution are defined as cloud droplets and clouds, respectively.
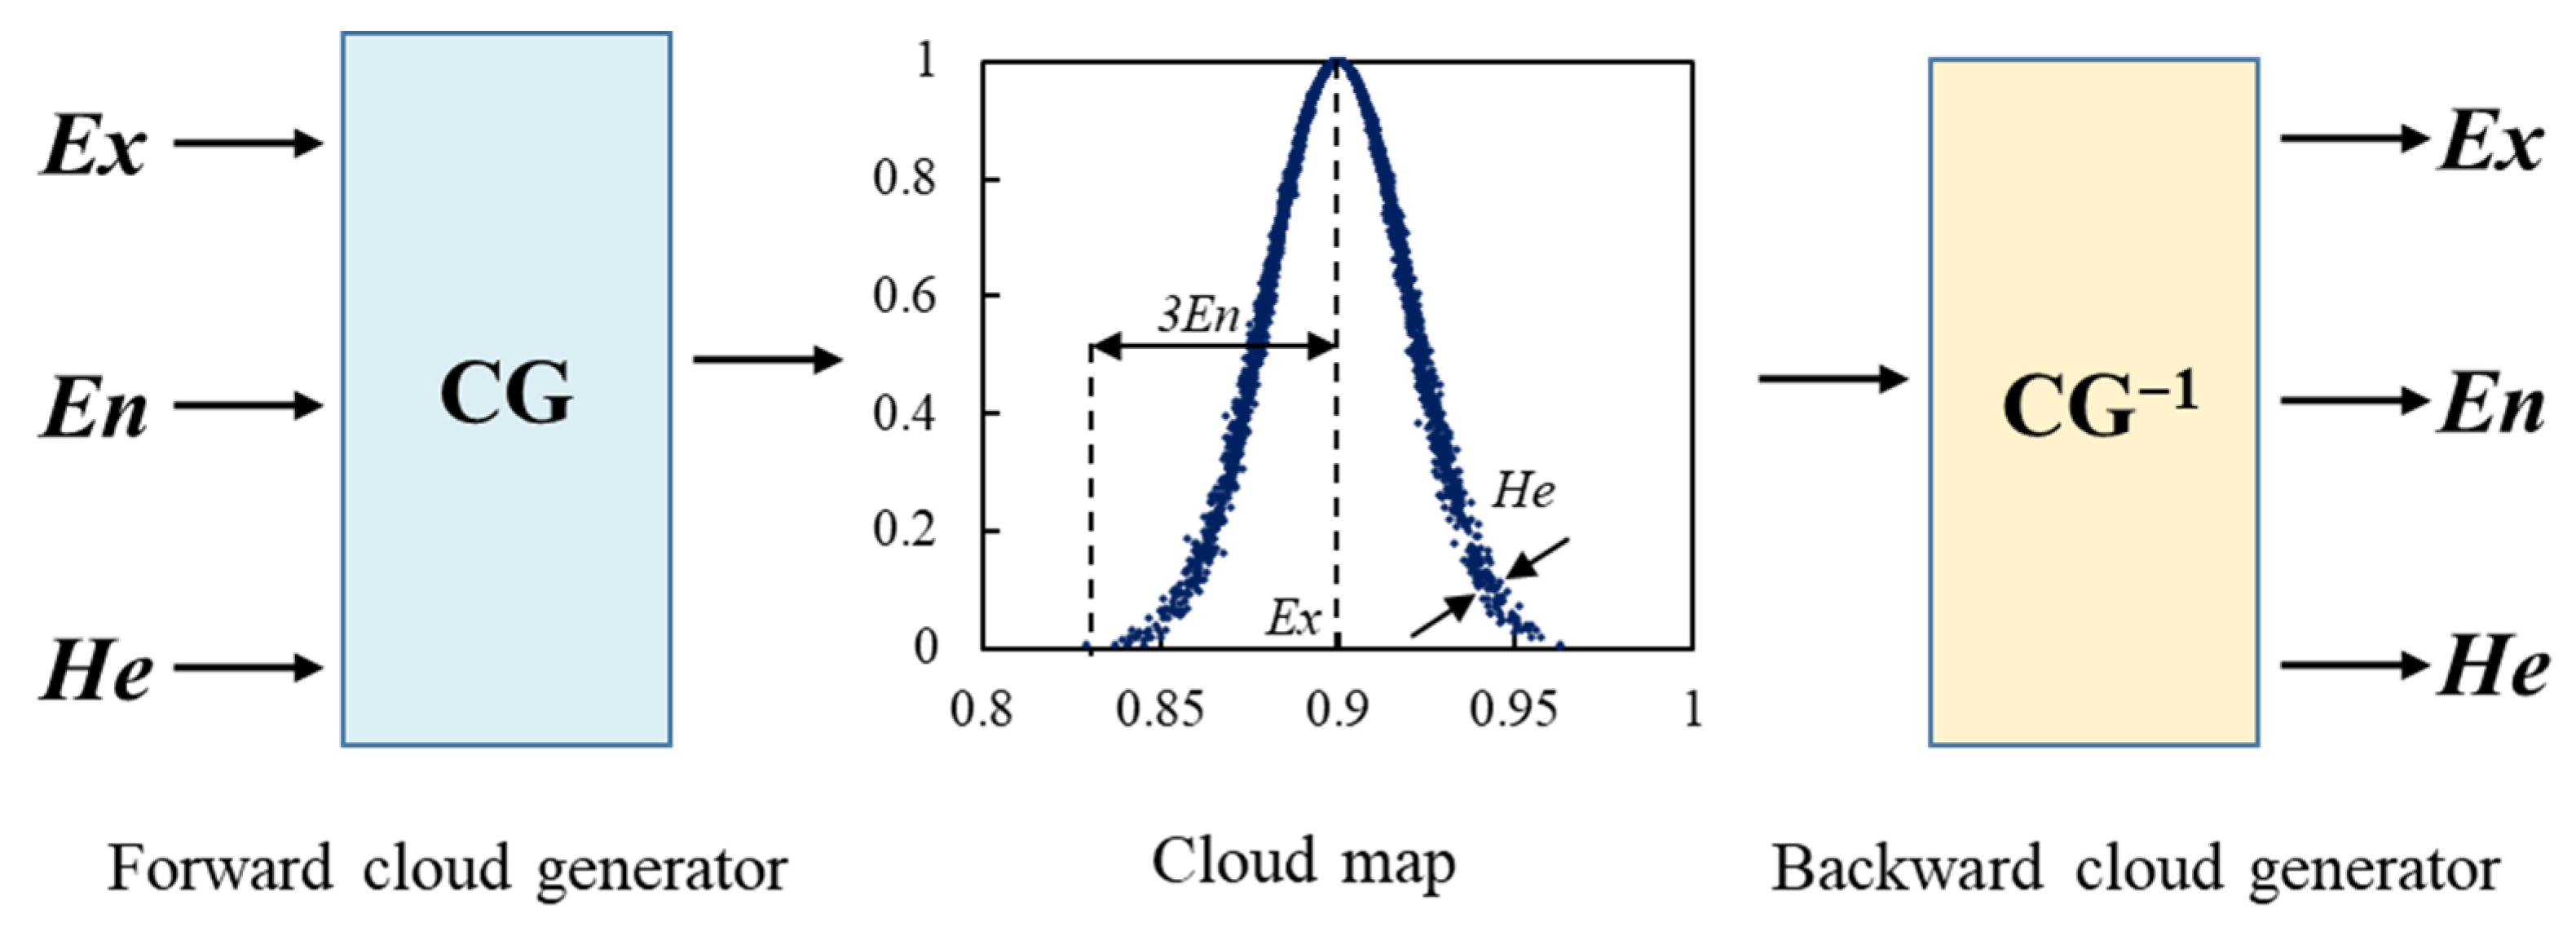
The uncertainty associated with x is articulated by cloud parameters: Ex signifies the mathematical expectation of cloud droplets in their spatial distribution, thereby reflecting the central position of the cloud. En, termed entropy, quantifies the dispersion of cloud droplets, dictating the permissible degree of certainty for cloud droplets within the spatial distribution, and is influenced by both qualitative concepts and inherent randomness. He, known as hyper entropy, acts as a metric of uncertainty to represent entropy, capturing the thickness or density of cloud droplets. The values of these cloud parameters can be computed as follows:
E x = 1 m i = 1 m x i E n = i = 1 m ( x i x i ¯ ) 2 m 1 H e = y
where xi represents the indicator data of the i-th CSS well; y is equal to 0.005 in this study.
(2)
Cloud generator
Cloud generators are utilized primarily to facilitate the interchange between qualitative concepts and quantitative data, encompassing both forward and backward cloud generators, as depicted in Figure 4. The forward cloud generator (CG) serves to transform cloud parameters into cloud maps, thereby enabling the intuitive visualization of numerical ranges and their associated distribution patterns. In contrast, the backward cloud generator (CG−1) operates as the inverse process of the forward cloud generator, converting cloud maps back into accurate cloud parameters.

2.3.2. Standard Evaluation Cloud (SEC)

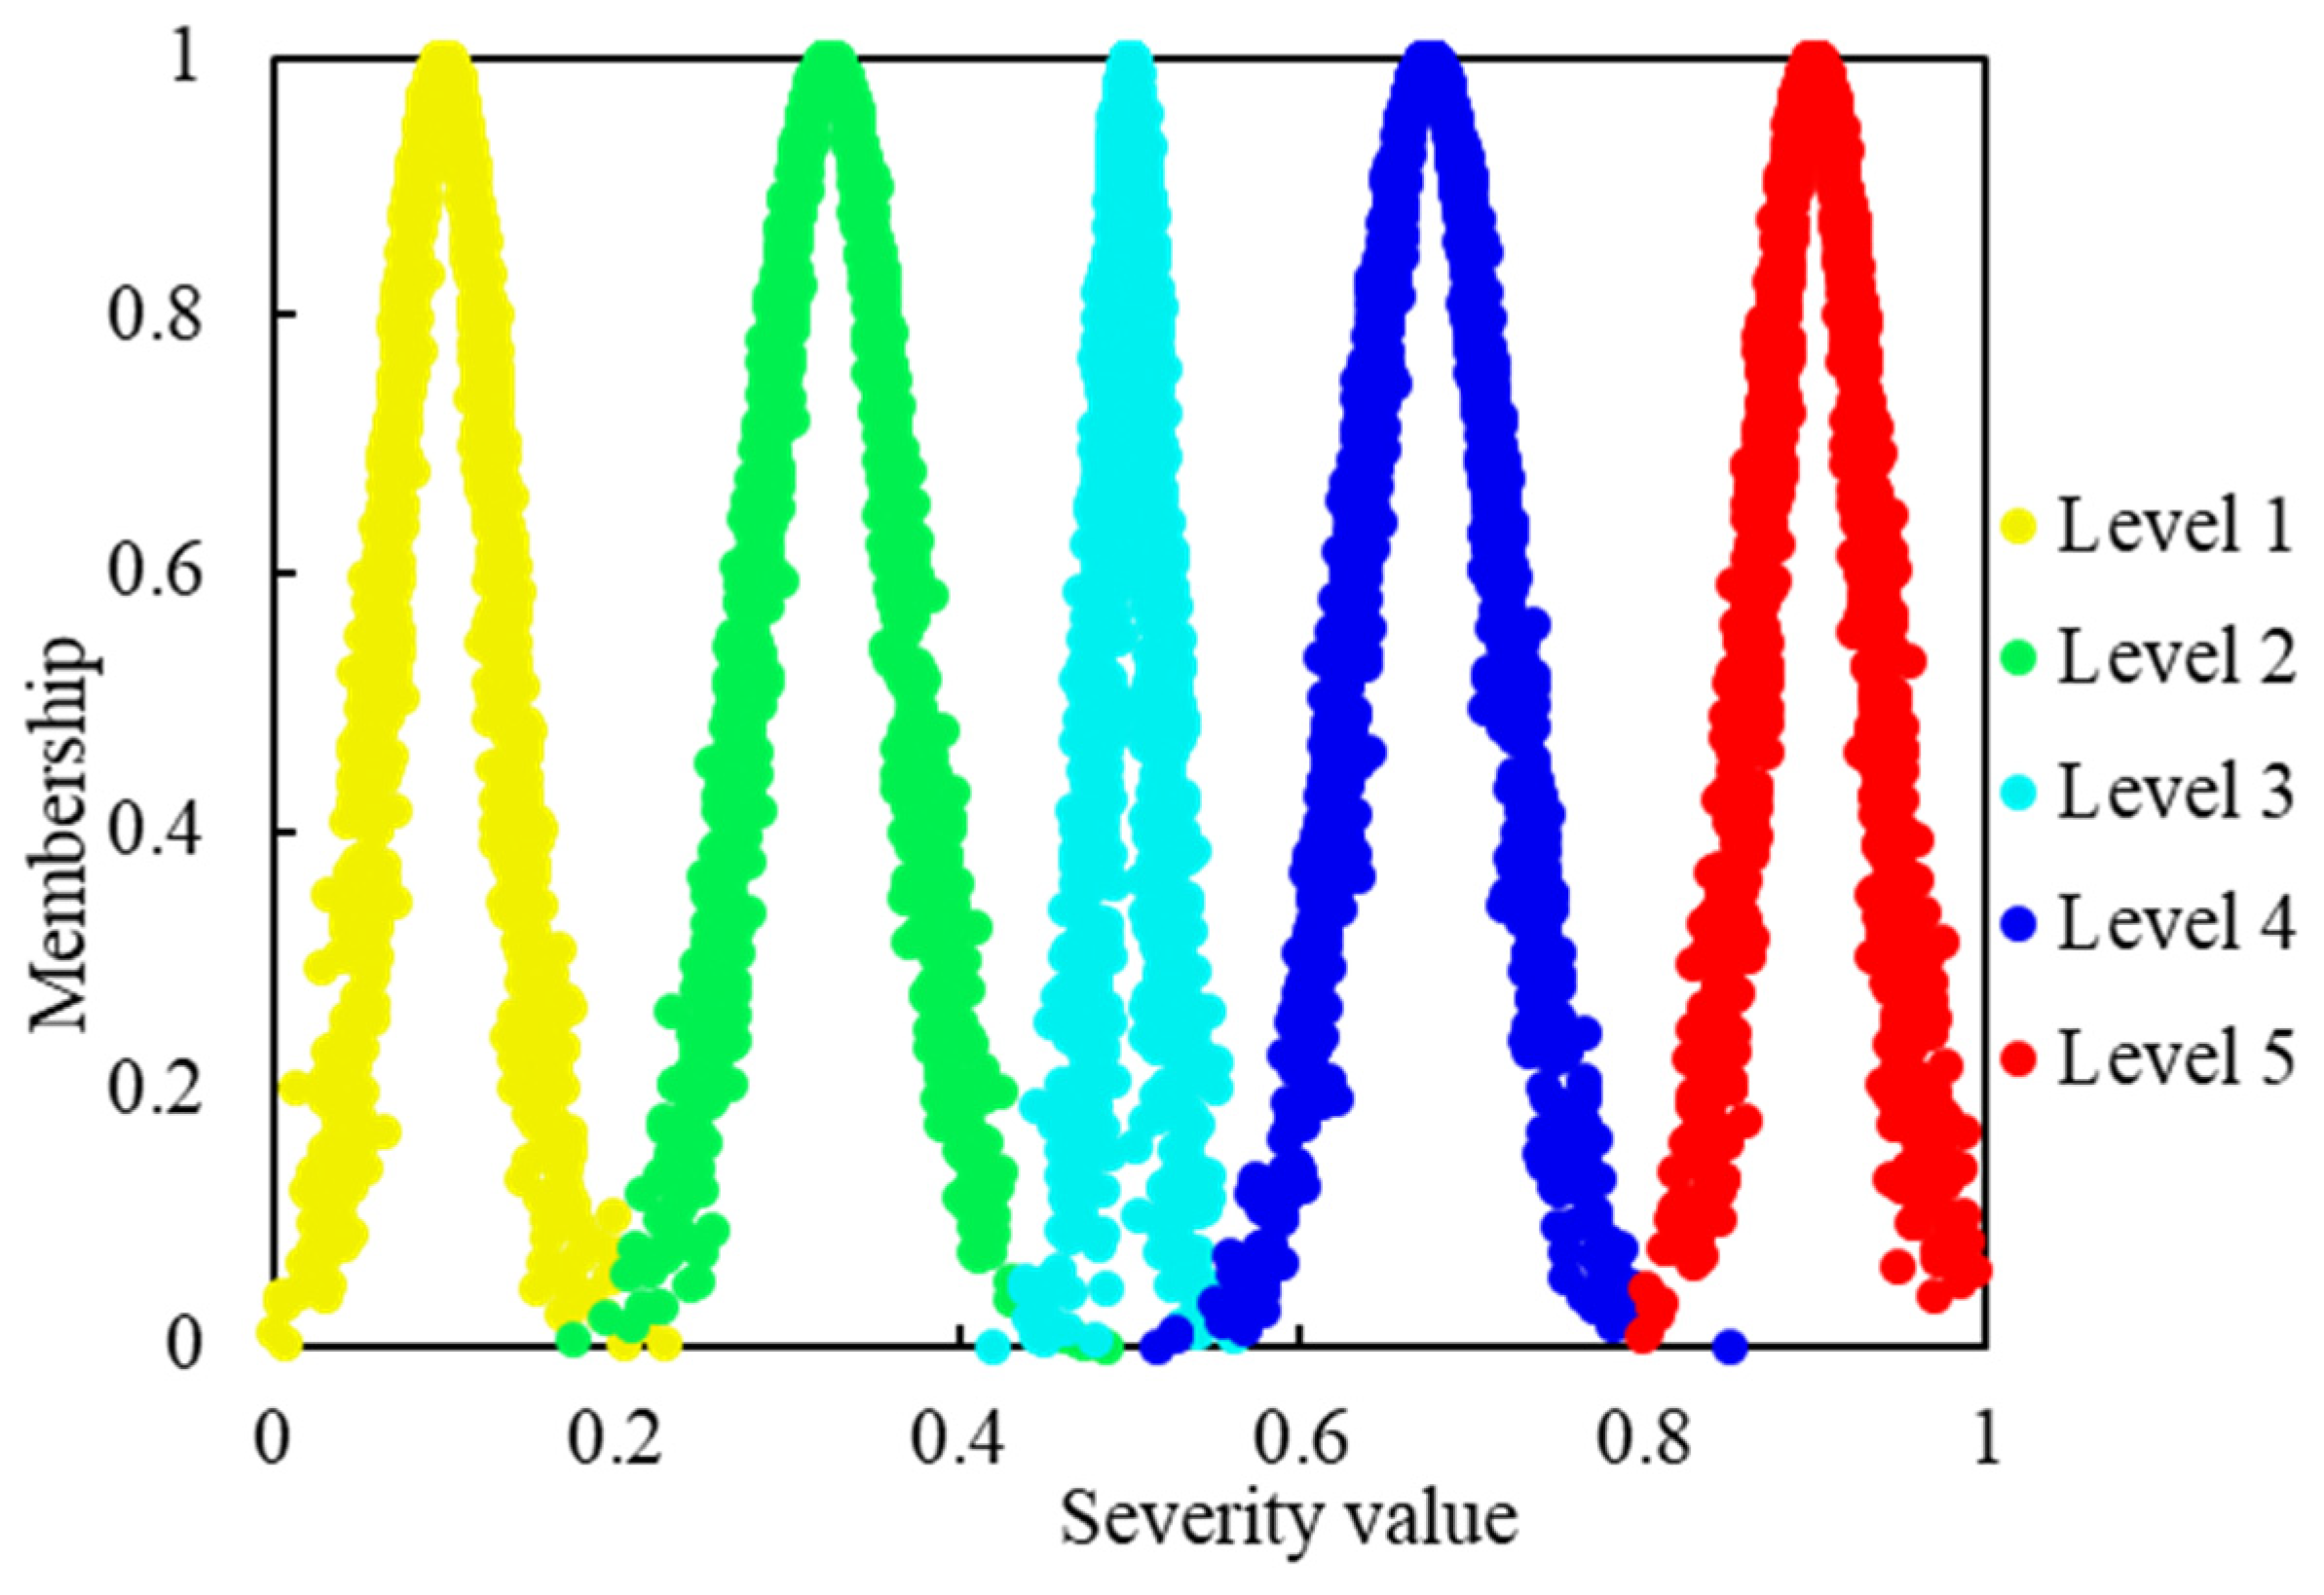
According to the production experiences of CSS wells, the steam channeling severity is divided into five levels, “No steam channeling”, “weak steam channeling”, “moderate steam channeling”, “strong steam channeling”, and “extremely strong steam channeling”, which are labeled as levels 1–5, respectively. These five levels were scored between 0 and 1, and the golden ratio was used to determine the value ranges of each level in the cloud model in Table 1. A higher value indicates that more severe steam channeling occurs between the CSS wells.
By referencing the value ranges specified for each level in Table 1, the values of the three cloud parameters for the SEC were calculated via the following equations:
E x s = ( c + d ) / 2 E n s = ( d c ) / 6 H e s = y
where c and d are the left and right boundaries of the value ranges for Level s, respectively, as shown in Table 1. Exs, Ens, and Hes represent the mathematical expectation, entropy, and hyper entropy of the SEC for Level s, respectively. The calculated values of Exs, Ens, and Hes are shown in Table 1.
The calculated values of Exs, Ens, and Hes were input into the forward cloud model, generating a SEC map to depict the severity of steam channeling between the CSS wells, as illustrated in Figure 5. The SEC map corresponds to five different levels of steam channeling severity between the CSS wells.

2.3.3. Comprehensive Evaluation Cloud (CEC)

On the basis of the evaluation criteria for the steam channeling severity between the CSS wells outlined in Table 2, the cloud parameters (Exi, Eni, and Hei) of the evaluation cloud for the i-th indicator are computed via Equations (15) and (16):
H i l = ( h i l a ) b a × ( d c ) + c
E x i = H i l E n i = l = 1 m ( H i l H i ¯ ) 2 m 1 H e i = y
where hil and Hil are the values of the i-th indicator for the l-th CSS well before and after cloud transformation, respectively; a and b represent the left and right boundaries of the value ranges of each indicator, respectively (Table 2); Exi, Eni, and Hei are the expectation, entropy, and hyper entropy of the evaluation cloud for the i-th indicator after cloud transformation, respectively; and H i ¯ is the average value of the i-th indicator for all the CSS wells after cloud transformation.
On the basis of Equation (17), the cloud parameters (Ex, En, and He) of the CEC are calculated to evaluate the steam channeling severity between the CSS wells as follows:
E x = i = 1 n E x i w i E n = i = 1 n E n i w i 2 w 1 2 + w 2 2 + + w n 2 H e = i = 1 n H e i w i 2 w 1 2 + w 2 2 + + w n 2
To quantify the similarity between the CEC and SEC, a determination method was proposed as follows:
E s = e ( ( x p E x s ) 2 / ( 2 E n s 2 ) )
T s = t = 1 T E s T
where Es and Ts are the preliminary similarity and final similarity between the CEC and SEC for level s, respectively; T is the repeated number of normal random numbers; and xp, Zx, and E n s are the normal random numbers determined by the cloud parameters of the CEC and SEC for level s, which satisfy the following equations:
x p ~ N ( E x , Z x ) Z x ~ N ( E n , H e ) E n s ~ N ( E n s , H e s 2 )
The level with the highest Ts is the corresponding level of steam channeling severity between the CSS wells.

3. Case Study

3.1. Data Collection

The reservoirs L, R, and T are typical offshore heavy oil reservoirs developed by large-scale CSS processes and are located in Bohai Bay, China. The reservoirs commenced production in April 2022. The cumulative oil production surpassed 500,000 tons by March 2024. However, as the CSS process continued, steam channeling occurred between the CSS wells, significantly affecting their production performance. Therefore, to propose corresponding schemes for controlling steam channeling between CSS wells and then enhancing offshore heavy oil recovery, evaluating the steam channeling severity between these CSS wells is imperative.
The monitoring and production data of the CSS wells in the three reservoirs are presented in Table 3. On the basis of the monitoring and production data shown in Table 3, an indicator system for evaluating the steam channeling severity between the CSS wells in the three reservoirs was constructed.

3.2. Calculation of Indicator Weights

The subjective weights of all the indicators were determined via the IAHP method and are shown in Figure 6. The calculated process parameters, including A, B, C, and A*, are as follows:
A = 0.5 0.65 / 0.35 0.55 / 0.45 0.8 / 0.2 0.7 / 0.3 0.85 / 0.15 0.35 / 0.65 0.5 0.4 / 0.6 0.65 / 0.35 0.55 / 0.45 0.7 / 0.3 0.45 / 0.55 0.6 / 0.4 0.5 0.75 / 0.25 0.65 / 0.35 0.8 / 0.2 0.2 / 0.8 0.35 / 0.65 0.25 / 0.75 0.5 0.45 / 0.55 0.55 / 0.45 0.3 / 0.7 0.45 / 0.55 0.35 / 0.65 0.55 / 0.45 0.5 0.65 / 0.35 0.15 / 0.85 0.3 / 0.7 0.2 / 0.8 0.45 / 0.55 0.35 / 0.65 0.5 B = 0.6931 0.6190 0.2007 1.3863 0.8473 1.7346 0.6190 0.6931 0.4055 0.6190 0.2007 0.8473 0.2007 0.4055 0.6931 1.0986 0.6190 1.3863 1.3863 0.6190 1.0986 0.6931 0.2007 0.2007 0.8473 0.2007 0.6190 0.2007 0.6931 0.6190 1.7346 0.8473 1.3863 0.2007 0.6190 0.6931 C = 0 0.6909 0.2465 1.3153 0.9392 1.5960 0.6909 0 0.4444 0.6244 0.2483 0.9051 0.2465 0.4444 0 1.0688 0.6927 1.3494 1.3153 0.6244 1.0688 0 0.3761 0.2807 0.9392 0.2483 0.6927 0.3761 0 0.6568 1.5960 0.9051 1.3494 0.2807 0.6568 0
A * = 1 4.9079 1.7641 20.6685 8.6936 39.4428 0.2038 1 0.3594 4.2112 1.7713 8.0365 0.5669 2.7821 1 11.7160 4.9280 22.3584 0.0484 0.2375 0.0054 1 0.4206 1.9084 0.1150 0.5645 0.0209 2.3774 1 4.5370 0.0254 0.1244 0.0447 0.5240 0.2204 1
The objective weights of all the indicators were calculated through the ICRITIC method, which is also shown in Figure 6. The process parameters, including, δ j , σ j , and C j , are shown in Table 4.
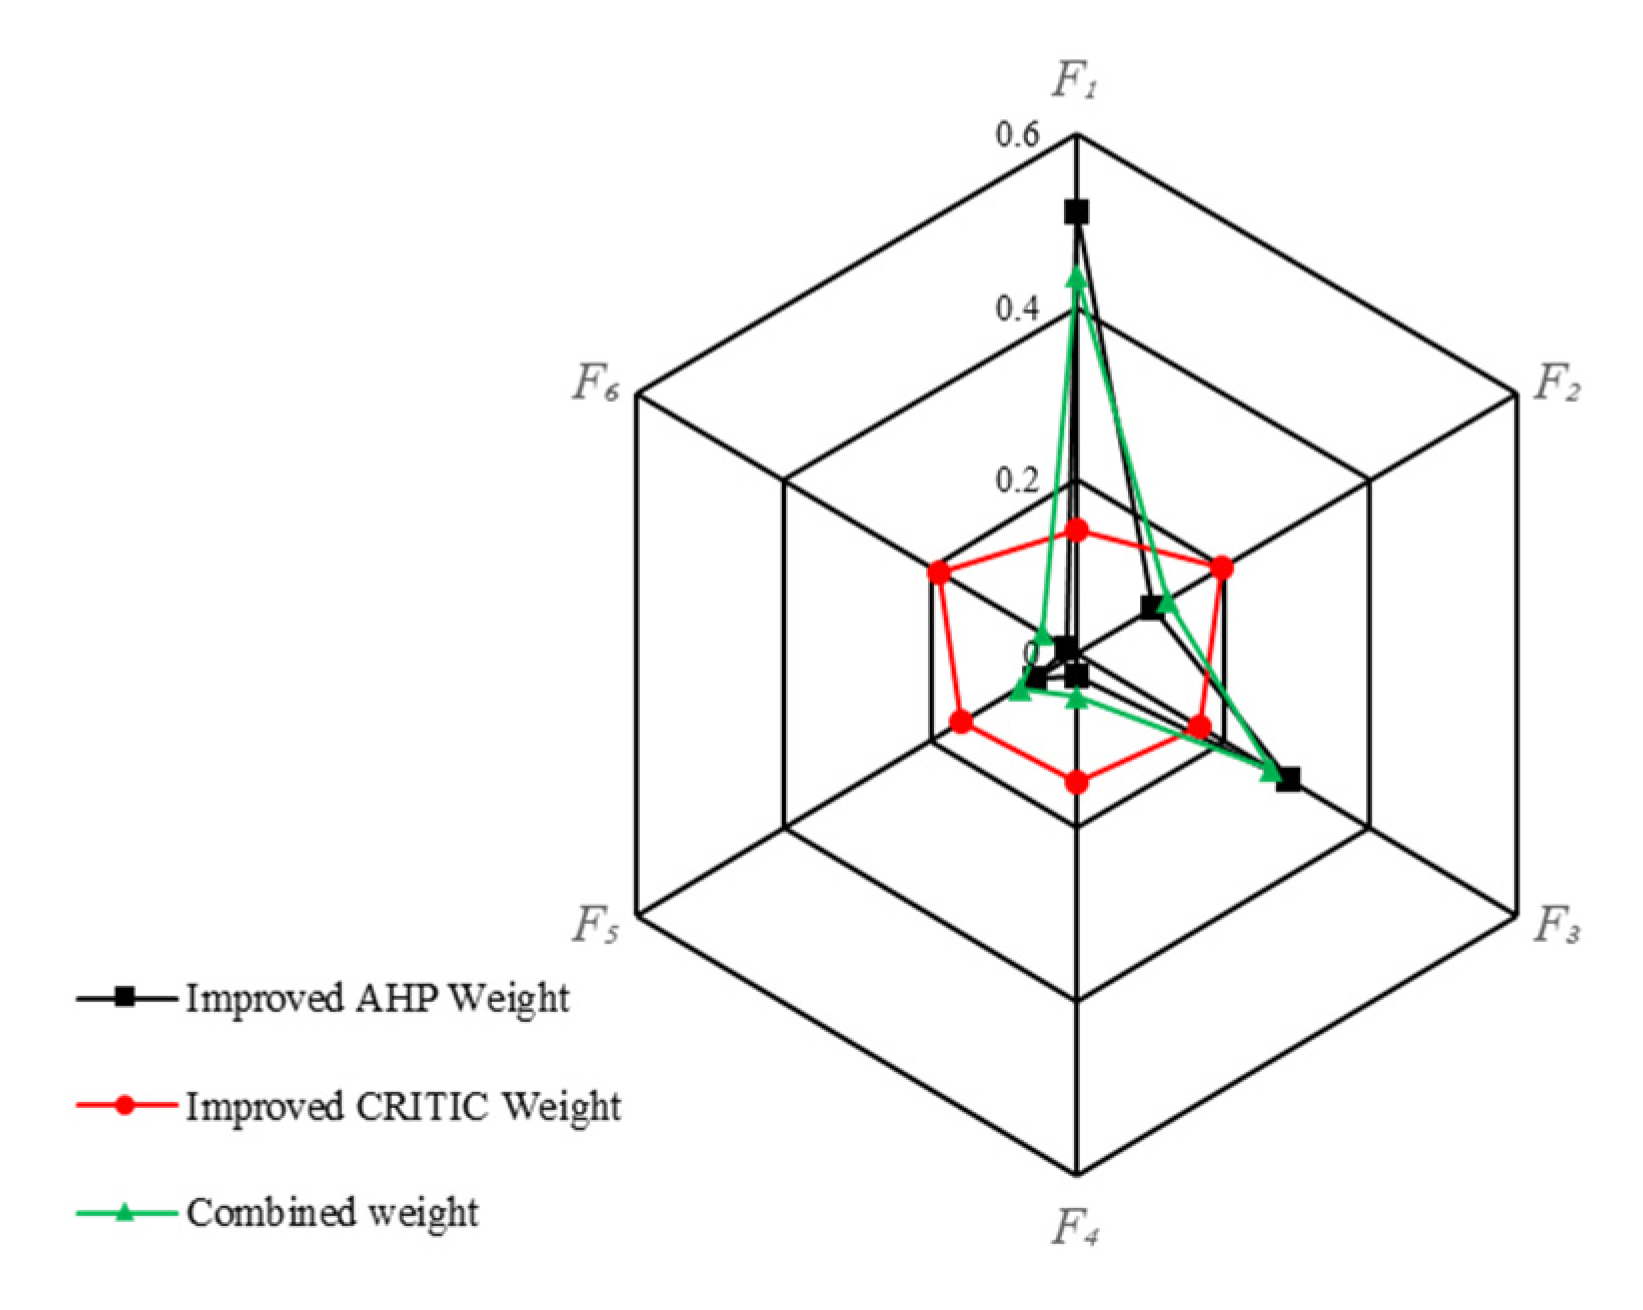
The combined weights of the indicators were calculated via Equation (12) and are shown in Figure 6. As shown in Figure 6, the ranking of the indicators used to determine steam channeling severity between CSS wells is as follows: the water cut increment > temperature increment > steam breakthrough time > cumulative liquid production in each cycle > cumulative water production in each cycle > cumulative oil production in each cycle.
To verify the viability of the IAHP-CRITIC method introduced in this study, a comparison was conducted among the IAHP, ICRITIC, and IAHP-CRITIC methods (Figure 7). Figure 7 shows that the weights determined by the IAHP method have obvious differences between the indicators, indicating that the IAHP method is subjective and overlooks the objective effects linked to the indicator data. The results are consistent with the results of Shi et al., who also found that the weights determined by the IAHP method have obvious differences between the indicators [33]. The weights calculated by the ICRITIC method have a relatively uniform distribution. The weights calculated by the IAHP-CRITIC method fall within the range of those determined by the IAHP method and the ICRITIC method individually. This observation suggests that the IAHP-CRITIC method can integrate the influences of both subjective and objective factors. Therefore, the proposed IAHP-CRITIC method results in a more reasonable weight distribution.

3.3. Evaluation of the Steam Channeling Severity Between CSS Wells

In this section, the 25 CSS wells in the three reservoirs are systematically evaluated via the developed IAHP-CRITIC method and cloud model. First, the cloud parameters for both the SEC and CEC of the 25 CSS wells were calculated. The aforementioned model was then programmed into a program via MATLAB R2021a program and used to calculate the SEC and CEC maps. Finally, the final similarities between the SEC and CEC maps were calculated to determine the levels of the steam channeling severity between the CSS wells.

3.3.1. Evaluation Cloud Maps of the Indicators

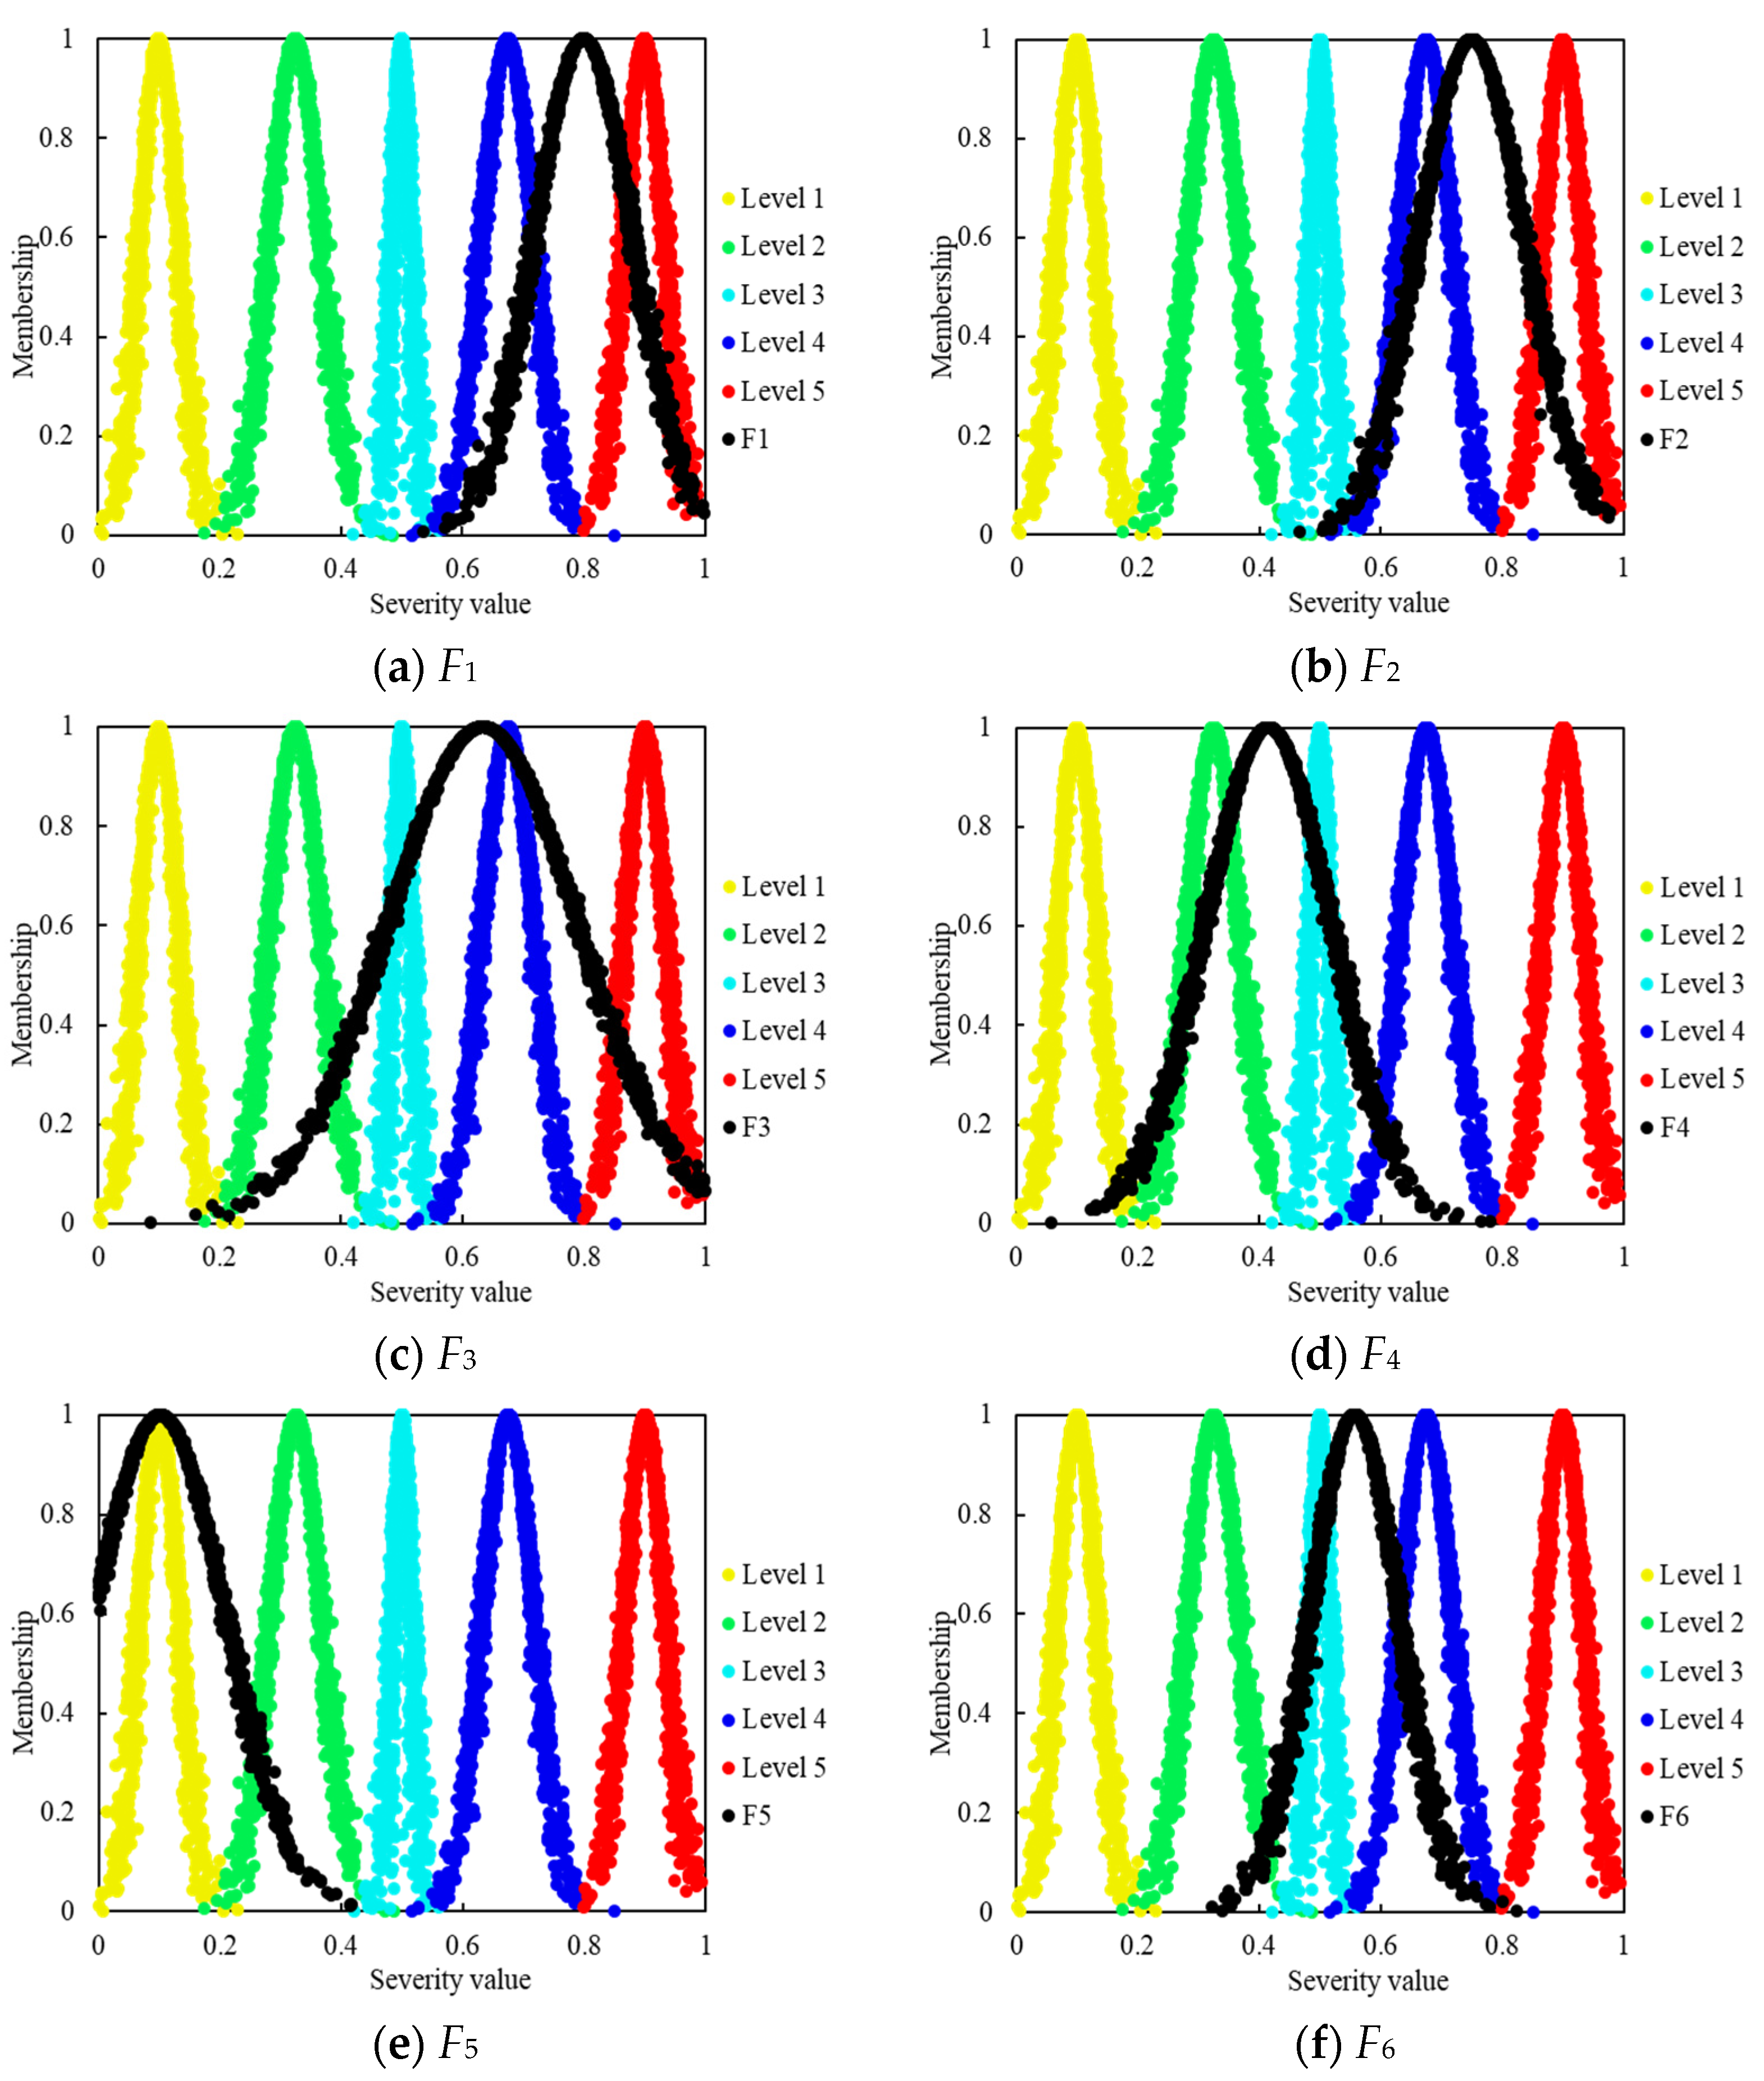
Taking Lw7 as an example, the cloud parameters for all the indicators were calculated via Equations (15) and (16) on the basis of the indicator data of Lw7 in Table 3, which are presented in Table 5. Through the forward cloud generator, the evaluation cloud maps for all the indicators are generated, as shown in Figure 8.

3.3.2. Comprehensive Evaluation Cloud Maps

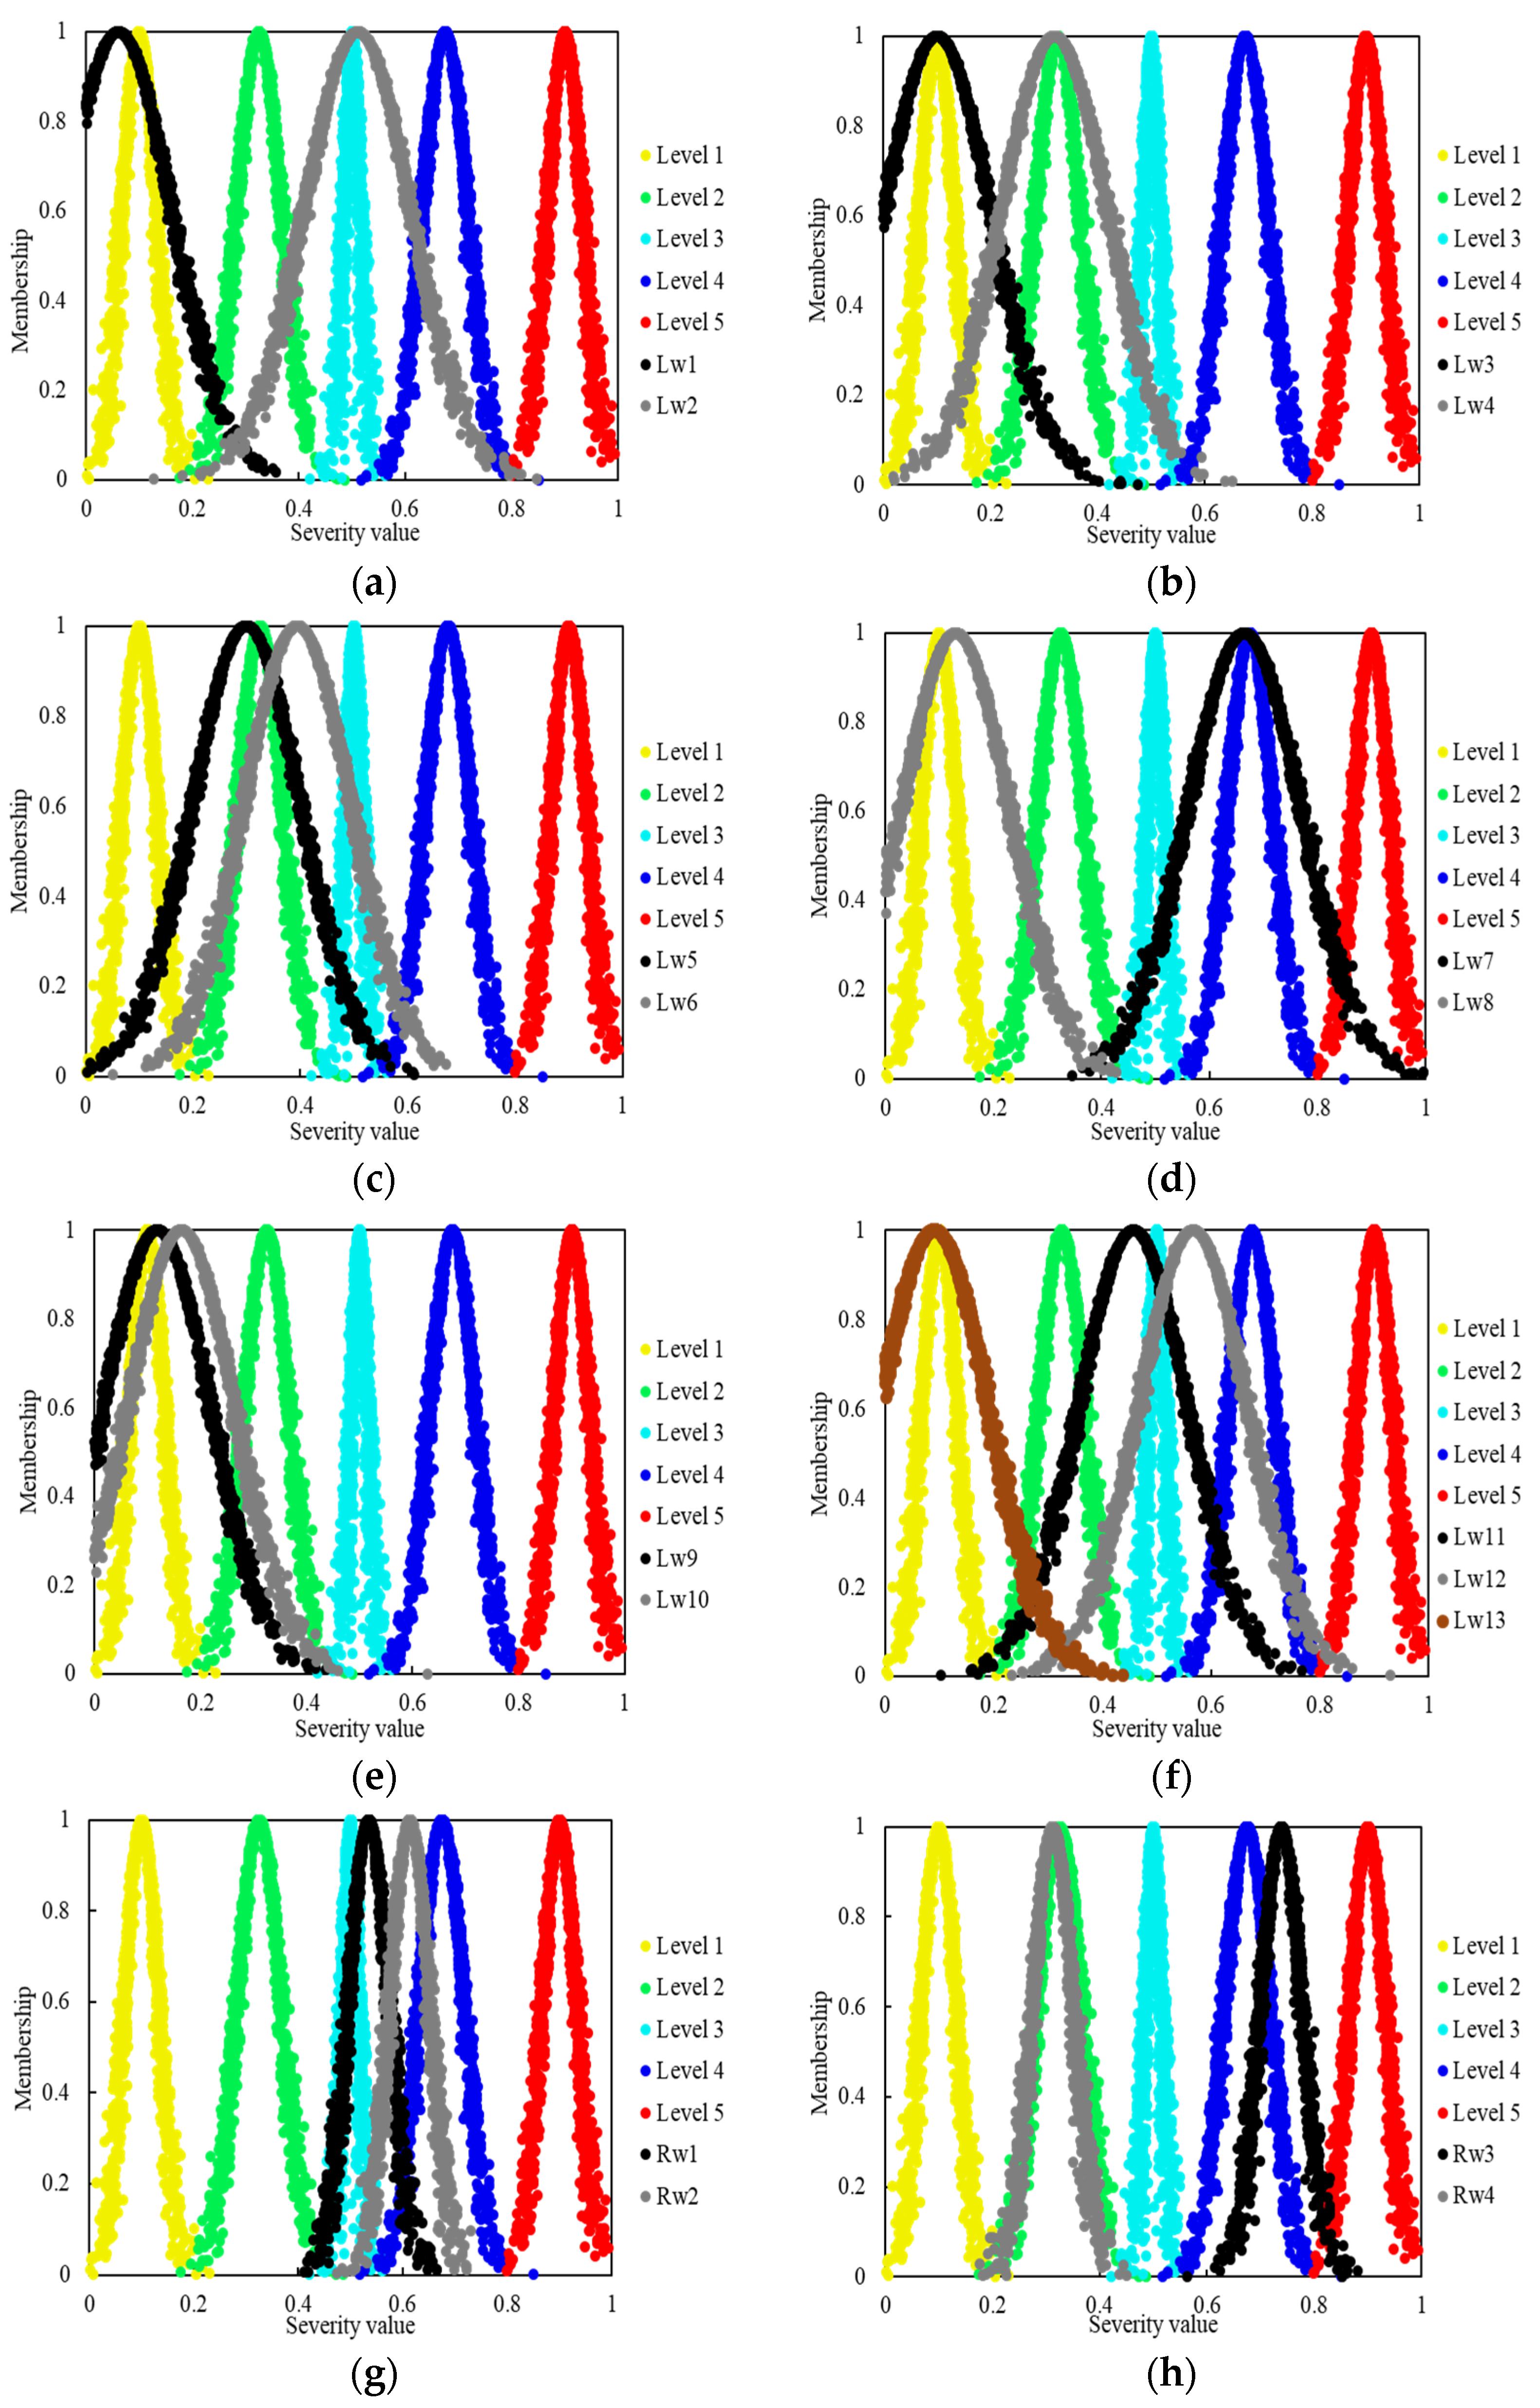
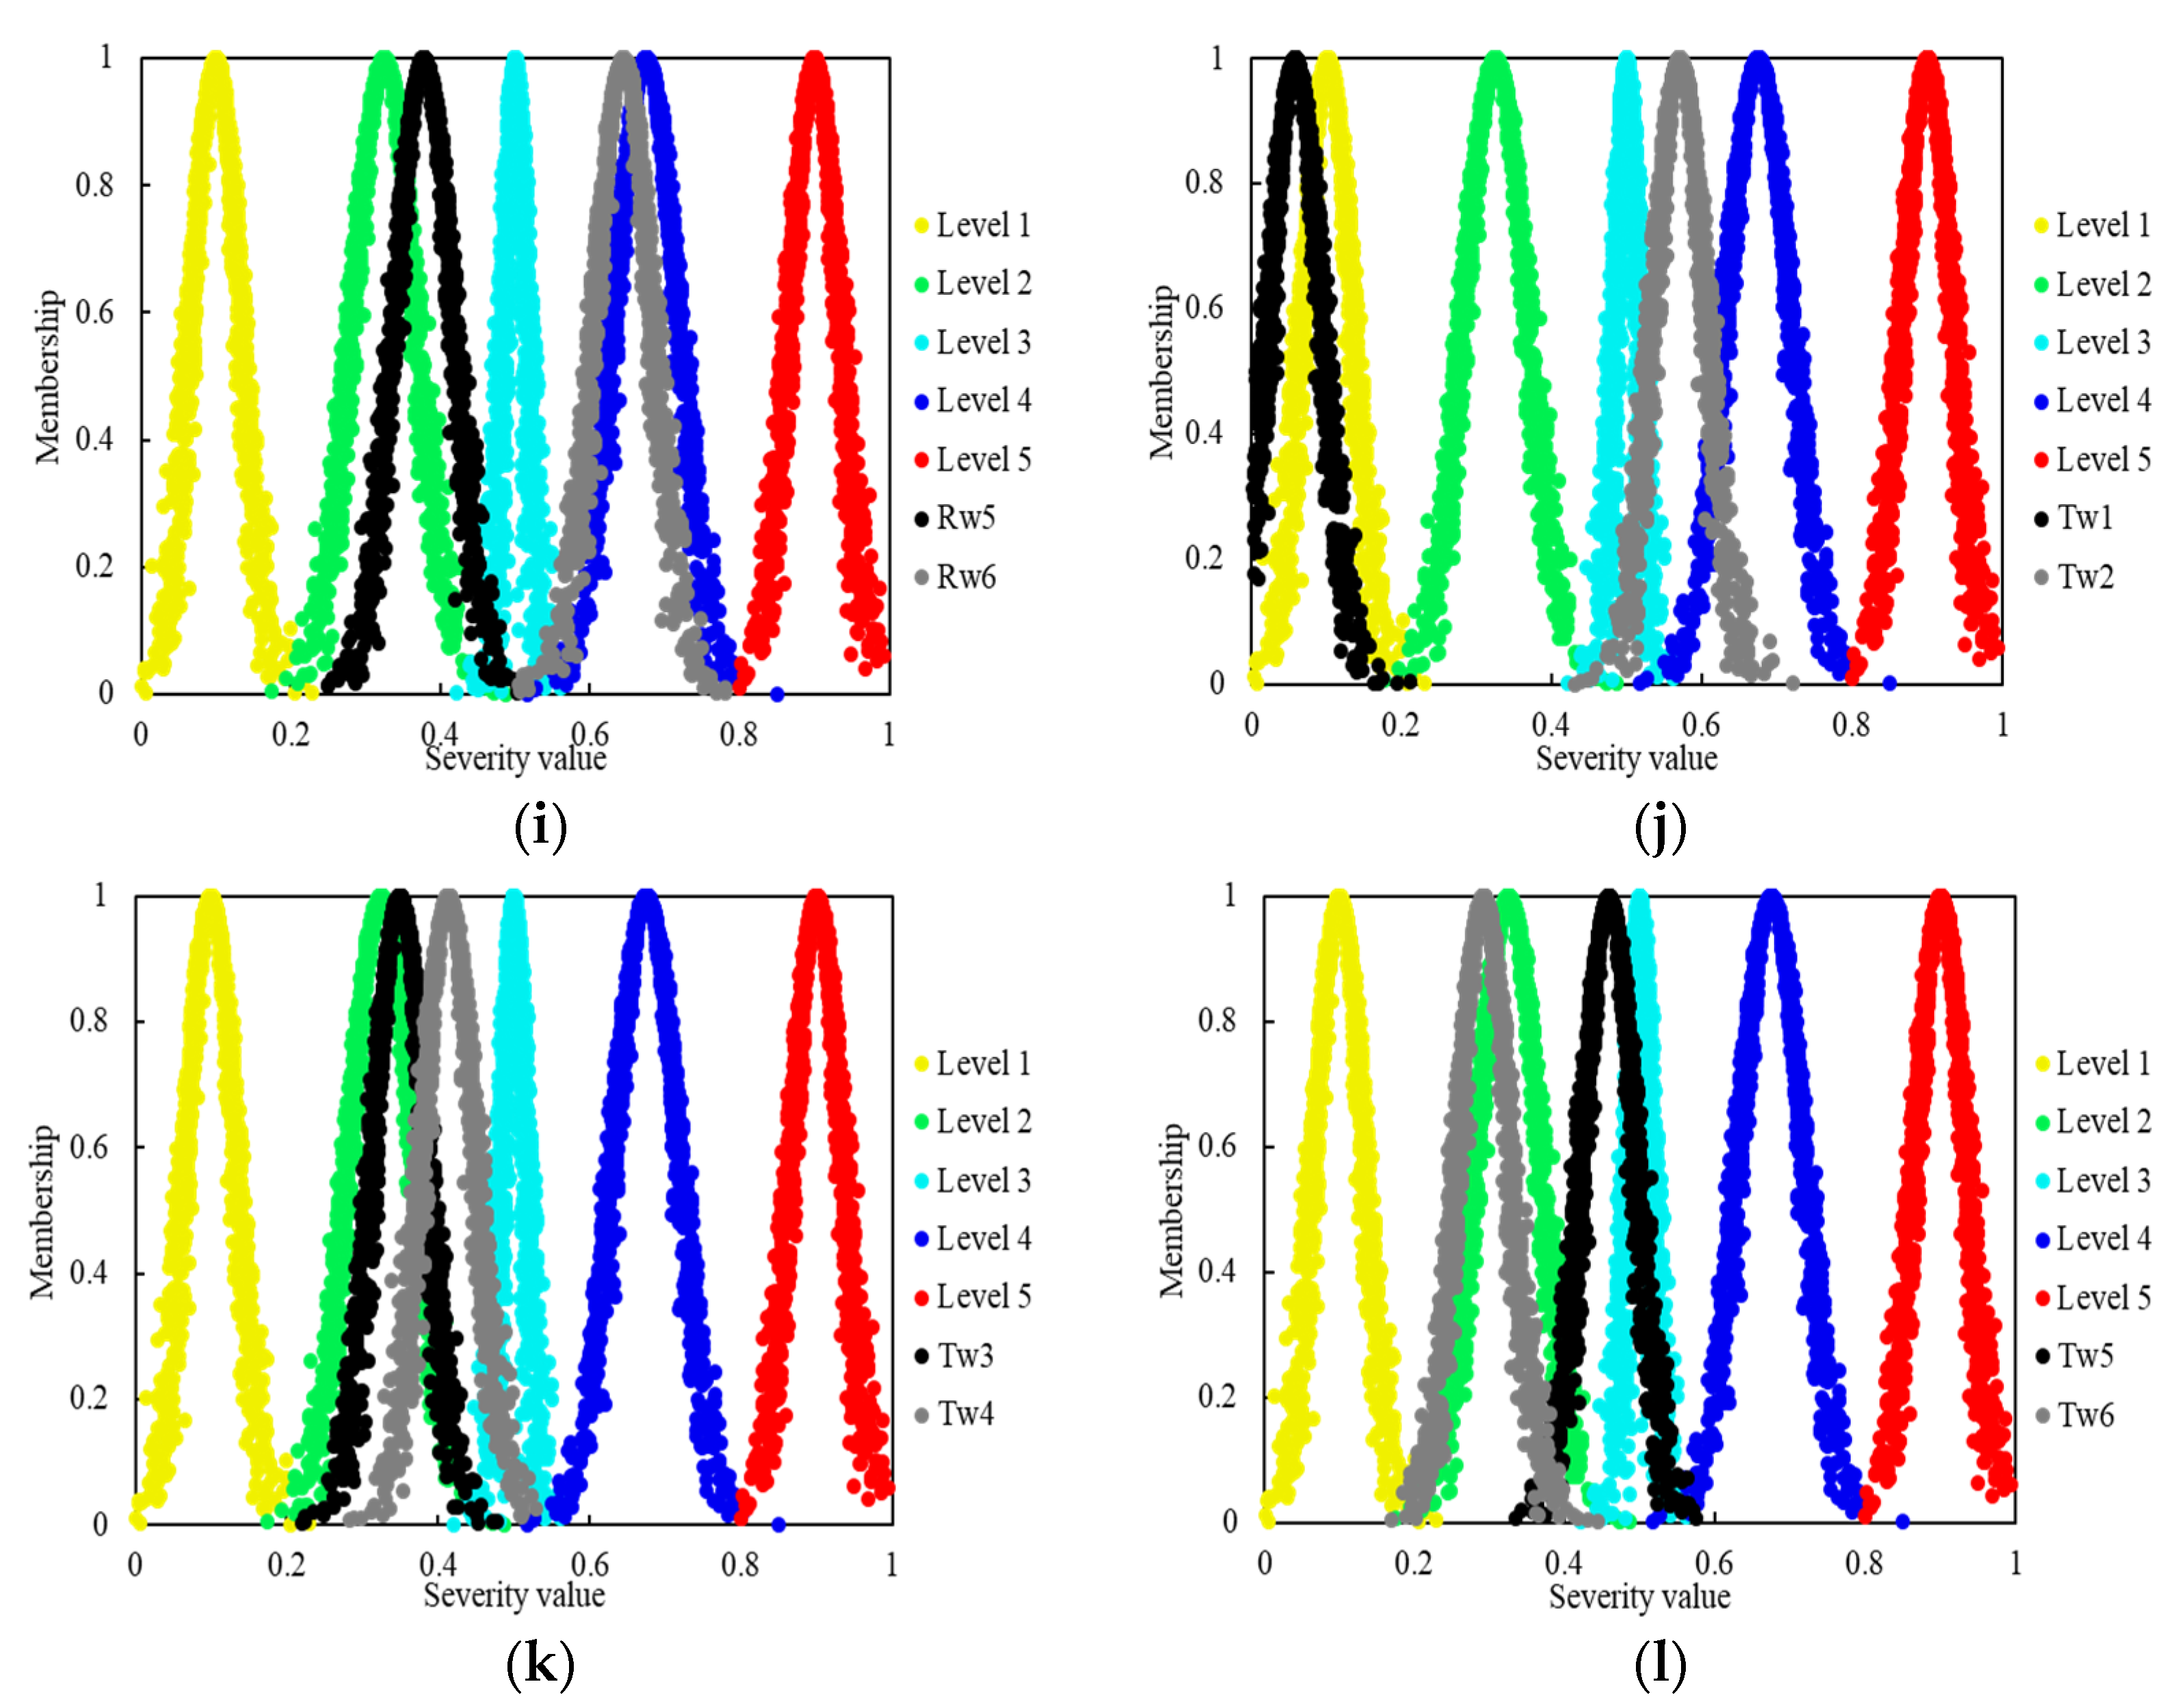
On the basis of the combined weights and cloud parameters of all the indicators (Table 5), the cloud parameters of the CEC map were determined via Equation (17) (Table 6). Through the forward cloud generator, the CEC maps for the 25 CSS wells are generated and overlaid with the SEC maps, providing a visual evaluation of the steam channeling severity between the CSS wells, as shown in Figure 9. According to Equations (18) and (19), the Ts values between the CEC maps and the SEC maps are calculated and shown in Table 6.
According to the comparisons in Figure 9 and the evaluation results shown in Table 6, the steam channeling severities of Lw7, Lw12, Rw2, Rw3, and Rw6 are level 4, indicating that these CSS wells exhibit strong steam channeling during the CSS process. The steam channeling severities of Lw2, Rw1, Tw2, and Tw5 are Level 3, indicating that these CSS wells exhibit moderate steam channeling during the CSS process. The steam channeling severities of Lw4, Lw5, Lw6, Lw11, Rw4, Rw5, Tw3, and Tw6 are Level 2, indicating that these CSS wells exhibit weak steam channeling during the CSS process. The steam channeling severities of Lw1, Lw3, Lw8, Lw9, Lw10, Lw13, and Tw1 are Level 1, indicating that these CSS wells have no steam channeling during the CSS process. In addition, the cloud maps’ half-widths reflect significant uncertainty in quantifying the steam channeling severity between CSS wells. High uncertainty is also a characteristic of the steam channeling phenomena [34]. To address this high uncertainty, it is necessary to determine the steam channeling severity between CSS wells by the calculated Ts shown in Table 6, which can quantify the similarity between the CEC and SEC instead of directly observing the similarity between the CEC and SEC shown in Figure 9. In conclusion, steam channeling is severe in the three reservoirs, and it is necessary to control steam channeling between CSS wells via relevant measures, such as the injection of chemical blocking agents, the optimization of injection parameters of CSS wells, and the implementation of combined CSS processes.

3.4. Validation of the Evaluation Results

The relative errors between the Exs of the SEC and the Ex of the CEC determined by the IAHP-CRITIC, AHP-CRITIC, AHP, and CRITIC methods are compared to verify the accuracy of the model and are shown in Table 7. In addition, the evaluation results were compared with the reservoir survey results of the three reservoirs and are shown in Table 8.
Table 7 shows that the relative errors between Exs and Ex determined by the IAHP-CRITIC, AHP-CRITIC, AHP, and CRITIC methods are 16.57%, 16.61%, 20.98%, and 53.30%, respectively. The results indicate that the IAHP-CRITIC method results in the most concentrated distributions and the smallest fluctuations in the number of cloud droplets in the CEC map of the steam channeling severity. In other words, for the CEC maps of the 25 CSS wells determined by the IAHP-CRITIC method, the majority of the cloud droplets can fall within the range of the correct level, and only a few cloud droplets are distributed in the ranges of the wrong levels.
In addition, compared with the reservoir survey results for the three reservoirs (Table 8), the accuracies of the results obtained via the AHP, CRITIC, AHP-CRITIC, and IAHP-CRITIC methods are 88%, 52%, 92%, and 100%, respectively. Therefore, compared with other methods, the IAHP-CRITIC method has greater reliability in terms of calculating indicator weights and evaluating the steam channeling severity between CSS wells. The results provide compelling evidence for the model’s accuracy in determining the indicator weights and evaluating the steam channeling severity between CSS wells. This study can be used as a reference for practical applications of this novel method in other offshore heavy oil reservoirs. The reason is that the IAHP-CRITIC method effectively considers the influences of both subjective and objective factors on individual indicator weights. It is noted that the results are consistent with the results of Ali et al., who also found that the AHP-CRITIC method has greater reliability in terms of calculating indicator weights than the AHP and CRITIC method [35].
However, the accuracy of the model was verified only in three offshore heavy oil reservoirs. The indicator system and SEC were developed on the basis of the data from offshore heavy oil, and the generalizability of the model is still limited. In addition, the model validation relied solely on the reservoir survey. More methods are needed to further verify the accuracy of the model. Therefore, more research, including verifying the accuracy of the model with more reservoir data and independent sources (distributed acoustic sensing and distributed temperature sensing measurements, tracer tests, or 4D seismic), will be required in the future.
To prove the accuracy of the combinations of indicators in this study, an alternative combination of indicators was used to determine the steam channeling severity between CSS wells. Due to the limited monitoring data and production data for offshore heavy oil reservoirs, the water cut (F11) and temperature (F33) were used to replace the water cut increment and temperature increment (the indicators shown in Figure 3) in the initial combinations of indicators.
Indicator data of the CSS wells in the three reservoirs are presented in Table 9. The evaluation criteria for determining the steam channeling severity between CSS wells are shown in Table 10. A comparison of the evaluation results determined by the different combinations of indicators is shown in Table 11. As shown in Table 8 and Table 11, compared with the reservoir survey results for the three reservoirs, the accuracies of the results obtained via the initial and alternative combinations of indicators are 100% and 32%, respectively, indicating the accuracy of the initial combinations of indicators in this study. The results are attributed to the fact that a higher water cut increment and temperature increment can indicate more severe steam channeling between CSS wells. A higher water cut and temperature are normal phenomena that occur in the later stage of development for CSS wells. They do not necessarily indicate the occurrence of severe steam channeling.
According to Equation (13), the cloud parameters Ex and En are fixed values once the indicator data are determined. Therefore, a sensitivity analysis was conducted by changing the value of He in this study to prove the accuracy of the results. A comparison of the evaluation results determined by the different He values is shown in Table 8 and Table 12. As shown in Table 8 and Table 12, when the He value is equal to 0.005, the evaluation results for the three wells are correct. He values that are too high or too low result in incorrect evaluation results for some CSS wells. Therefore, the He value of 0.005 used in this study is accurate. This is because He acts as a metric of uncertainty to represent entropy, capturing the thickness or density of cloud droplets. Either a too high or too low He value will lead to a decrease in Ts, thereby making it prone to result in incorrect evaluation results.

4. Conclusions and Discussion

This study developed a novel evaluation model to quantitatively evaluate the steam channeling severity between CSS wells in offshore heavy oil reservoirs via the improved AHP-CRITIC (IAHP-CRITIC) method and the cloud model. An indicator system for the steam channeling severity on the basis of monitoring and production data was established. The IAHP-CRITIC method was subsequently proposed to calculate the combined weights. The proposed model was used to evaluate the steam channeling severity between CSS wells in a typical offshore heavy oil reservoir. The results indicated that the constructed indicator system can be used to evaluate the steam channeling severity between CSS wells. The improved AHP-CRITIC method yielded a more reasonable weight distribution because it effectively considered the influences of both subjective and objective factors on individual indicator weights. Compared with the reservoir survey results for the L reservoir, the accuracies of the results obtained by the AHP, CRITIC, AHP-CRITIC, and IAHP-CRITIC methods were 88%, 52%, 92%, and 100%, respectively. Therefore, the IAHP-CRITIC method was more reliable than the other methods in terms of calculating the indicator weights and evaluating the steam channeling severity between the CSS wells. The Lw7 and Lw12 in the L reservoir, as well as Rw2, Rw3, and Rw6 in the R reservoir, exhibited strong steam channeling. It is necessary to control the steam channeling of these CSS wells. This is the first study to report the evaluation of steam channeling severity between CSS wells in offshore heavy oil reservoirs. This study provides an effective model to quantitatively evaluate the steam channeling severity between CSS wells and offers valuable insights for the selection of effective strategies to control the steam channeling between CSS wells and enhance offshore heavy oil recovery. However, it is noted that the model validation relied solely on the reservoir survey in three offshore heavy oil reservoirs. More research, including verifying the accuracy of the model by more reservoir data and independent sources (distributed acoustic sensing and distributed temperature sensing measurements, tracer tests, 4D seismic, etc.), will be required in the future.

Author Contributions

Conceptualization, Y.L. and J.B.; Methodology, Z.W. and Y.Z.; Validation, J.B., Z.W. and Q.W.; Investigation, J.W.; Resources, Q.W. and Z.W.; Writing—original draft preparation, X.S., J.W., Z.W. and Y.Z.; Writing—review and editing, X.S. and Y.L.; Supervision, X.S. All authors have read and agreed to the published version of the manuscript.

Funding

This research was funded by the open fund project of CNOOC Key Laboratory of Offshore Heavy Oil Thermal Recovery (No. KJQZ-2024-2105).

Data Availability Statement

The original contributions presented in the study are included in the article; further inquiries can be directed to the corresponding authors.

Conflicts of Interest

Authors Yigang Liu, Jianhua Bai, Qiuxia Wang, Zhiyuan Wang and Jia Wen were employed by the CNOOC Key Laboratory of Offshore Heavy Oil Thermal Recovery and Tianjin Branch of CNOOC Ltd. The remaining authors declare that the research was conducted in the absence of any commercial or financial relationships that could be construed as potential conflicts of interest. The authors declare that this study received funding from the CNOOC Key Laboratory of Offshore Heavy Oil Thermal Recovery. The funder had the following involvement with the study: Conceptualization, methodology, validation, investigation, resources, writing—original draft preparation, and writing—review and editing.

Abbreviations

CSSCyclic steam stimulation
AHPAnalytic hierarchy process
IAHPImproved analytic hierarchy process
CRITICCriteria importance through intercriteria correlation
ICRITICImproved criteria importance through intercriteria correlation
AHP-CRITICAnalytic hierarchy process–criteria importance through intercriteria correlation
IAHP-CRITICImproved analytic hierarchy process–criteria importance through intercriteria correlation
CGForward cloud generator
CG-1Backward cloud generator
SECStandard evaluation cloud
CECComprehensive evaluation cloud
U1,U2The indicators of the first layer
F1,F2,,F6The indicators of the second layer
nThe indicator number
AJudgment matrix
iVariable
jVariable
aijThe relative importance of the i-th indicator compared to the j-th indicator
Wi, WjThe relative distributions of the i-th and j-th indicators, respectively
BThe antisymmetric matrix B derived from matrix A
bijThe value of the common logarithm of aij
cijThe cij is determined on the basis of bij
CThe optimal transfer matrix
A * The optimization matrix
a i j * The a i j * is determined based on cij
ωiThe subjective weight of the i-th indicator
mThe number of CSS wells
g i j The standardized indicator data
G The matrix of the standardized indicator data
δiThe information entropy
lVariable
σiThe standard deviation of the i-th indicator
r i j The correlation coefficient between indicators gi and gj
g ¯ i The average values of the i-th indicator
CiThe information content for the i-th indicator
ξ i The objective weight of the i-th indicator
w i The combined weights of the i-th indicator
φConstant
Exs, Ens, HesThe cloud parameters of the standard evaluation cloud
sVariable
a, bThe left and right boundaries of the value ranges of each indicator
c, dThe left and right boundaries of the value ranges for the Level s
hilThe values of the i-th indicator for the l-th CSS well before cloud transformation
HilThe values of the i-th indicator for the l-th CSS well after cloud transformation
H i ¯ The average value of the i-th indicator for all the CSS wells
Ex, En, HeThe cloud parameters of the comprehensive evaluation cloud
Exi, Eni, HeiThe cloud parameters of the evaluation cloud for the i-th indicator
EsThe preliminary similarity
TsThe final similarity
xp, Zx, EnsThe normal random numbers determined by the cloud parameters of the CEC and SEC for level s

References

  1. Pang, Z.-X.; Wang, Q.H.; Meng, Q.; Wang, B.; Liu, D. The mechanisms of thermal solidification agent promoting steam diversion in heavy oil reservoirs. Pet. Sci. 2024, 21, 1902–1914. [Google Scholar] [CrossRef]
  2. He, H.F.; Li, Q.; Zheng, H.R.; Liu, P.C.; Tang, J.S.; Ma, Y.N. Simulation and evaluation on enhanced oil recovery for steam huff and puff during the later phase in heavy oil reservoir—A case study of block G in Liaohe oilfield, China. J. Pet. Sci. Eng. 2022, 219, 111092. [Google Scholar] [CrossRef]
  3. Dong, X.H.; Liu, H.Q.; Chen, Z.X.; Wu, K.L.; Lu, N.; Zhang, Q.C. Enhanced oil recovery techniques for heavy oil and oilsands reservoirs after steam injection. Appl. Energy 2019, 239, 1190–1211. [Google Scholar] [CrossRef]
  4. Wang, Z.J.; Du, H.W.; Li, S.R.; Li, S.P. Experimental study on gas-assisted cyclic steam stimulation under heavy-oil sandstone reservoir conditions: Effect of N2/CO2 ratio and foaming agent. Geoenergy Sci. Eng 2023, 228, 211976. [Google Scholar] [CrossRef]
  5. Wang, Y.Z.; Liu, H.Q.; Pang, Z.X.; Gao, M. Visualization study on plugging characteristics of temperature-resistant gel during steam flooding. Energy Fuels 2016, 30, 6968–6976. [Google Scholar] [CrossRef]
  6. Pratama, R.A.; Babadagli, T. Effect of temperature, phase change, and chemical additives on wettability alteration during steam applications in sands and carbonates. SPE Reserv. Eval. Eng. 2020, 23, 292–310. [Google Scholar] [CrossRef]
  7. Sun, L.X. Xinqian 45 block steam channeling characteristics and genetic analysis of heavy oil steam stimulation. Sichuan Univ. Arts Sci. J. 2012, 5, 54–58. [Google Scholar]
  8. Li, Y.; Liu, H.Q.; Jiao, P.; Wang, Q.; Liu, D.; Ma, L.Y.; Wang, Z.P.; Peng, H. Machine-learning-assisted identification of steam channeling after cyclic steam stimulation in heavy-oil reservoirs. Geofluids 2023, 1, 1–13. [Google Scholar] [CrossRef]
  9. Zheng, Q.; Liu, H.Q.; Li, F.; Wang, Q.; Wang, C.J.; Lu, C. Quantitative description of steam channels after steam flooding. Sci. China Technol. Sci 2013, 56, 1164–1168. [Google Scholar] [CrossRef]
  10. Zheng, J.P.; Dong, X.H.; Liu, H.G.; Sun, R.; Wei, X.G. Study on the characteristics of steam breakthrough during steam injection in heavy oil reservoirs. Spec. Oil Gas Reserv. 2012, 6, 72–75. [Google Scholar]
  11. Li, D.Y.; Liu, C.Y.; Liu, L.Y. Study on the universality of the normal cloud model. Eng. Sci. 2005, 2, 18–24. [Google Scholar]
  12. Chen, Z.Y.; Liang, G.H.; Chen, Y.X.; Yang, X.Y.; Liu, Y. Study on the risk assessment of pedestrian-vehicle conflicts in channelized right-turn lanes based on the hierarchical-grey entropy-cloud model. Accid. Anal. Prev. 2024, 205, 107664. [Google Scholar] [CrossRef]
  13. Wen, X.X.; Nie, Y.; Du, Z.X.; Huang, L.K. Operational safety assessment of straddle-type monorail vehicle system based on cloud model and improved CRITIC method. Eng. Fail. Anal. 2022, 139, 106463. [Google Scholar] [CrossRef]
  14. Zhang, X.T.; Fang, S.F.; Jin, Y.C.; Huang, Y.; Wang, S.C.; Wang, J.; Xu, Y.H. Comprehensive performance evaluation of valuable medical equipment based on cloud modelling and combined weighting methodologies. Eng. Appl. Artif. Intell. 2025, 154, 110969. [Google Scholar] [CrossRef]
  15. Pang, Z.X.; Wang, L.T.; Yin, F.H.; Lyu, X.C. Steam chamber expanding processes and bottom water invading characteristics during steam flooding in heavy oil reservoirs. Energy 2021, 234, 121214. [Google Scholar] [CrossRef]
  16. Cheng, C.; Chen, Y.; Li, T.Y. An AHP Method for Road Traffic Safety. In Proceedings of the 2011 Fourth International Joint Conference on Computational Sciences and Optimization, Kunming and Lijiang City, China, 15–19 April 2011. [Google Scholar]
  17. Tagavifar, M.; Fortenberry, R.; Rouffignac, E.; Sepehrnoori, K.; Pope, G.A. Heavy-oil recovery by combined hot water and alkali/cosolvent/polymer flooding. SPE J. 2016, 21, 74–86. [Google Scholar] [CrossRef]
  18. Ayağ, Z.; Özdemir, R.G. A fuzzy AHP approach to evaluating machine tool alternatives. J. Intell. Manuf. 2006, 17, 179–190. [Google Scholar] [CrossRef]
  19. Wang, W.Q.; Fang, S.E. A Multi-Level Gray and Fuzzy Comprehensive Evaluation of Road Traffic Safety Management Facilities. In Proceedings of the 2009 Second International Conference on Intelligent Computation Technology and Automation, Changsha, China, 10–11 October 2009. [Google Scholar]
  20. Lu, X.Q.; Zhou, X.; Luo, J.X.; Zeng, F.H.; Peng, X.L. Characterization of foamy oil and gas/oil two-phase flow in porous media for a heavy oil/methane system. J. Energy Resour. Technol. 2018, 141, 032801. [Google Scholar] [CrossRef]
  21. Wu, Z.B.; Liu, H.Q.; Wang, X. Adaptability research of thermal–chemical assisted steam injection in heavy oil reservoirs. J. Energy Resour. Technol. 2017, 140, 052901. [Google Scholar] [CrossRef]
  22. Fattore, M. Synthesis of indicators: The non-aggregative approach. Social Indic. Res. 2017, 70, 193–212. [Google Scholar]
  23. Xie, J.J.; Li, J.X.; Sun, Q. Multidimensional evaluation of the clinical efficacy and potential mechanisms of acupuncture combined with rehabilitation training in the treatment of stroke: A study based on multiple evaluation indicators. Front. Neurol. 2025, 16, 1573073. [Google Scholar] [CrossRef]
  24. Saaty, R.W. The analytic hierarchy process—What it is and how it is used. Math. Modell. 1987, 9, 161–176. [Google Scholar] [CrossRef]
  25. Yu, Y. Study on Evaluation of Nanchong Ecological Civilization Construction Based on AHP-Entropy Method. In Proceedings of the 2016 2nd International Conference on Education Technology, Management and Humanities Science, Beijing, China, 23–24 January 2016. [Google Scholar]
  26. Liu, G.C.; Li, G.J.; Yang, L.N. Risk assessments of debris flow based on improved analytic hierarchy process and efficacy coefficient method. Glob. Geol. 2012, 15, 231–236. [Google Scholar]
  27. Zheng, X.Y.; Liu, Q.; Li, Y.F.; Wang, B.; Qin, W.T. Safety risk assessment for connected and automated vehicles: Integrating FTA and CM-Improved AHP. Reliab. Eng. Syst. Safty 2025, 257, 110822. [Google Scholar] [CrossRef]
  28. Yang, J.J.; Wan, Q.L.; Han, J.H.; Xing, S.S. An evaluation model for automobile intelligent cockpit comfort based on improved combination weighting-cloud model. PLoS ONE 2023, 18, e0282602. [Google Scholar] [CrossRef]
  29. Lu, J.H.; Xu, J.X. Application of Fuzzy Comprehensive Evaluation Model Based on Analytic Hierarchy Process for Rural Drinking Water. In Proceedings of the 2011 5th International Conference on Bioinformatics and Biomedical Engineering, Wuhan, China, 10–12 May 2011. [Google Scholar]
  30. Huang, H.D.; Xue, Y.H.; Zhu, L.B.; Cui, C.C. Information entropy evaluation method for the disassemblability of smartphones. Procedia CIRP 2024, 127, 212–217. [Google Scholar] [CrossRef]
  31. Ishizaka, A.; Labib, A. Review of the main developments in the analytic hierarchy process. Expert Syst. Appl. 2011, 38, 14336–14345. [Google Scholar] [CrossRef]
  32. Cui, C.Q.; Wang, B.; Zhao, Y.X.; Zhang, Y.J.; Xue, L.M. Risk management for mine closure: A cloud model and hybrid semi-quantitative decision method. Int. J. Miner. Metall. Mater. 2020, 8, 1021–1035. [Google Scholar] [CrossRef]
  33. Shi, L.; Shuai, J.; Xu, K. Fuzzy fault tree assessment based on improved AHP for fire and explosion accidents for steel oil storage tanks. J. Hazard. Mater. 2014, 278, 529–538. [Google Scholar] [CrossRef] [PubMed]
  34. Cao, Y.B.; Liu, D.Q.; Zhang, Z.P.; Wang, S.T.; Wang, Q.; Xia, D.H. Steam channeling control in the steam flooding of super heavy oil reservoirs, Shengli oilfield. Pet. Explor. Dev. 2012, 39, 785–790. [Google Scholar] [CrossRef]
  35. Ali, M.H.; Zakaria, M.; El-Tawab, S. A comprehensive study of recent maximum power point tracking techniques for photovoltaic systems. Sci. Rep. 2025, 15, 14269. [Google Scholar] [CrossRef] [PubMed]
Figure 1. (a) The early cycles of the CSS process and (b) the steam channeling between the CSS wells in later cycles of the CSS process.
Energies 18 05407 g001
Figure 2. The workflow for evaluating the steam channeling severity between CSS wells.
Energies 18 05407 g002
Figure 3. The indicator system for evaluating the steam channeling severity between CSS wells.
Energies 18 05407 g003
Figure 4. Diagram of cloud generators.
Energies 18 05407 g004
Figure 5. SEC map of steam channeling severity between CSS wells.
Energies 18 05407 g005
Figure 6. The calculated subjective, objective, and combined weights.
Energies 18 05407 g006
Figure 7. Comparison of the weights calculated by different methods.
Energies 18 05407 g007
Figure 8. Evaluation cloud maps of all the indicators.
Energies 18 05407 g008
Figure 9. The CEC maps of the 25 CSS wells in the three reservoirs: (a) Lw1 and Lw2, (b) Lw3 and Lw4, (c) Lw5 and Lw6, (d) Lw7 and Lw8, (e) Lw9 and Lw10, (f) Lw11, Lw12, and Lw13, (g) Rw1 and Rw2, (h) Rw3 and Rw4, (i) Rw5 and Rw6, (j) Tw1 and Tw2, (k) Tw3 and Tw4, and (l) Tw5 and Tw6.
Energies 18 05407 g009aEnergies 18 05407 g009b
Table 1. The calculated cloud parameters of the standard evaluation cloud.
Severity LevelsValue RangesExsEnsHesInstructions
1[0, 0.2]0.10.0330.005No steam channeling
2(0.2, 0.45]0.3250.0420.005Weak steam channeling
3(0.45, 0.55]0.50.0160.005Moderate steam channeling
4(0.55, 0.8]0.6750.0420.005Strong steam channeling
5(0.8, 0.1]0.90.0330.005Extremely strong steam channeling
Table 2. Evaluation criteria for determining the steam channeling severity between CSS wells.
IndicatorsValue Ranges
No Steam
Channeling
Weak Steam
Channeling
Moderate Steam ChannelingStrong Steam
Channeling
Extremely Strong Steam Channeling
F1/%0F1 < 0.10.1 ≤ F1 < 0.20.2 ≤ F1 < 0.30.3 ≤ F1 < 0.6F1 ≥ 0.6
F2/day100 > F2 ≥ 6060 > F2 ≥ 3030 > F2 ≥ 1010 > F2 ≥ 55 > F2 ≥ 0
F3/°C0 ≤ F3 < 1010 ≤ F3 < 2020 ≤ F3 < 3030 ≤ F3 < 5555 ≤ F3 < 200
F4/×104 m30 < F4 < 2.52.5 ≤ F4 < 33 ≤ F4 < 3.53.5 ≤ F4 < 44 ≤ F4 < 8
F5/×104 m30 < F5 < 11 ≤ F5 < 1.51.5 ≤ F5 < 22 ≤ F5 < 33 ≤ F5 < 8
F6/×104 m32.5 > F6 ≥ 1.51.5 > F6 ≥ 1.41.4 > F6 ≥ 1.31.1 > F6 ≥ 11 > F6 ≥ 0
Table 3. Indicator data of the CSS wells in the three reservoirs.
Reservoir
Names
Well NamesF1/%F2/DayF3/°CF4/×104 m3F5/×104 m3F6/×104 m3
LLw1010002.631.461.17
Lw22010353.492.381.11
Lw3310006.245.450.78
Lw4221403.622.760.85
Lw5330208.195.862.32
Lw627504.92.642.26
Lw7606402.930.92.02
Lw8310008.524.294.23
Lw9310004.343.011.33
Lw101510001.980.941.04
Lw1120401.740.641.09
Lw1230602.951.131.81
Lw13310003.482.21.28
RRw12414285.654.41.25
Rw2348366.064.581.48
Rw3555497.825.871.95
Rw41125123.52.471.03
Rw51220164.052.651.4
Rw6376396.424.721.7
TTw1010002.541.511.03
Tw23114285.964.411.55
Tw31225133.92.551.35
Tw41519164.613.341.27
Tw51618234.743.491.25
Tw61026113.351.731.62
Table 4. Process parameters calculated via the ICRITIC method.
Indicators δ j σ j C j
F11.8840.28507.0207
F22.44580.29459.6559
F31.57140.39558.1033
F42.21150.32217.2606
F52.19090.32717.6908
F62.09660.27109.2392
Table 5. Cloud parameters for all the indicators of Lw7.
IndicatorsExiEniHei
F10.80.08120.005
F20.750.08670.005
F30.630.15640.005
F40.410.10380.005
F50.10.1070.005
F60.550.07350.005
Table 6. Cloud parameters of the CEC maps, Ts, and evaluation results.
Reservoir NamesWell NamesCloud Parameters TsThe Severity Levels
ExEnHeLevel 1Level 2Level 3Level 4Level 5
LLw10.060.10050.0052.2 × 10−11.6 × 10−24.6 × 10−1381.1 × 10−121.5 × 10−541
Lw20.510.10050.0054.3 × 10−59.0 × 10−21.9 × 10−11.5 × 10−14.9 × 10−43
Lw30.100.10050.0053.2 × 10−13.6 × 10−23.4 × 10−61.6 × 10−82.6 × 10−401
Lw40.320.10050.0054.6 × 10−23.6 × 10−13.6 × 10−21.6 × 10−36.3 × 10−152
Lw50.300.10050.0053.6 × 10−24.2 × 10−12.8 × 10−22.4 × 10−47.5 × 10−242
Lw60.390.10050.0057.1 × 10−33.8 × 10−18.3 × 10−22.3 × 10−21.6 × 10−102
Lw70.660.10050.0056.9 × 10−112.5 × 10−34.3 × 10−23.8 × 10−13.0 × 10−24
Lw80.130.10050.0051.8 × 10−18.4 × 10−21.2 × 10−56.4 × 10−103.0 × 10−421
Lw90.120.10050.0052.4 × 10−17.0 × 10−21.4 × 10−59.8 × 10−106.7 × 10−321
Lw100.160.10050.0053.1 × 10−11.4 × 10−11.1 × 10−35.3 × 10−72.7 × 10−311
Lw110.460.10050.0058.4 × 10−41.8 × 10−11.3 × 10−13.3 × 10−21.4 × 10−52
Lw120.570.10050.0054.1 × 10−113.0 × 10−24.4 × 10−21.8 × 10−14.3 × 10−34
Lw130.090.10050.0053.1 × 10−13.7 × 10−24.2 × 10−142.0 × 10−93.1 × 10−251
RRw10.530.03850.0051.2 × 10−242.9 × 10−43.1 × 10−16.2 × 10−23.7 × 10−113
Rw20.610.03850.0056.1 × 10−211.6 × 10−74.0 × 10−34.5 × 10−11.2 × 10−84
Rw30.740.03850.0051.8 × 10−741.0 × 10−183.9 × 10−233.5 × 10−15.9 × 10−34
Rw40.310.03850.0056.3 × 10−47.2 × 10−19.1 × 10−89.9 × 10−127.6 × 10−782
Rw50.380.03850.0057.4 × 10−94.9 × 10−18.9 × 10−32.4 × 10−81.1 × 10−462
Rw60.640.03850.0054.8 × 10−282.9 × 10−83.4 × 10−35.8 × 10−11.5 × 10−104
TTw10.060.03490.0053.6 × 10−17.7 × 10−104.0 × 10−2724.3 × 10−401.9 × 10−1651
Tw20.570.03490.0051.2 × 10−351.0 × 10−58.3 × 10−27.2 × 10−24.2 × 10−93
Tw30.350.03490.0053.8 × 10−86.1 × 10−14.0 × 10−44.7 × 10−96.0 × 10−762
Tw40.410.03490.0051.4 × 10−151.8 × 10−14.0 × 10−25.5 × 10−63.0 × 10−322
Tw50.460.03490.0057.1 × 10−153.4 × 10−21.5 × 10−11.1 × 10−31.7 × 10−253
Tw60.290.03490.0059.9 × 10−55.1 × 10−13.6 × 10−136.6 × 10−152.4 × 10−502
Table 7. Relative errors between Exs and Ex determined by different methods.
Reservoir NamesWell NamesExExsRelative Errors/%
AHPCRITICAHP-CRITICIAHP-CRITICAHPCRITICAHP-CRITICIAHP-CRITIC
LLw10.0790.1570.0590.0610.121.5057.4041.2039.30
Lw20.5200.5190.5200.5110.53.903.883.902.14
Lw30.1370.2600.1060.1000.136.50159.705.700.40
Lw40.3620.4390.3430.3190.32511.4835.145.541.75
Lw50.3450.4820.3110.2990.3256.1248.254.407.87
Lw60.4450.5660.4150.3940.32536.8974.2827.5421.38
Lw70.6360.5400.6600.6640.6755.8119.962.271.58
Lw80.1660.3390.1220.1300.165.50238.8022.1030.41
Lw90.1570.3150.1170.1190.156.80214.5017.4018.71
Lw100.1460.1140.1540.1640.145.7014.3053.6064.15
Lw110.4430.3510.4660.4570.32536.287.8543.3840.65
Lw120.5610.5220.5700.5670.67516.9622.7115.5316.05
Lw130.1190.2390.0890.0910.118.70139.2011.409.40
RRw10.540.580.550.530.58.2415.489.696.97
Rw20.620.640.600.610.6758.305.4811.119.12
Rw30.740.720.740.740.67510.145.989.309.46
Rw40.320.400.340.310.3251.5822.283.203.84
Rw50.380.500.410.380.32518.0252.8024.9716.18
Rw60.650.670.650.640.6753.551.333.114.47
TTw10.060.140.070.060.1043.8944.5326.2043.35
Tw20.570.600.580.570.514.5420.8415.8014.04
Tw30.350.460.380.350.3258.8142.3715.527.45
Tw40.420.510.440.410.32529.1258.2434.9527.27
Tw50.470.540.480.460.56.568.763.498.21
Tw60.290.390.310.290.3259.5818.473.9710.18
Average relative errors/%/20.9853.3016.6116.57
Table 8. The severity levels of CSS wells were determined by different methods.
Reservoir NamesWell NamesAHPCRITICAHP-CRITICIAHP-CRITICReservoir Survey Results
LLw111111
Lw243433
Lw312111
Lw422222
Lw523222
Lw624222
Lw744444
Lw812111
Lw912111
Lw1011111
Lw1132222
Lw1243444
Lw1312111
RRw133333
Rw244444
Rw344444
Rw423222
Rw523322
Rw634444
TTw111111
Tw233333
Tw323222
Tw423222
Tw533333
Tw623222
Accuracy/%/885292100/
Table 9. Indicator data of the CSS wells in the three reservoirs (the alternative combinations of indicators).
Reservoir
Names
Well NamesF11/%F2/DayF33/°CF4/×104 m3F5/×104 m3F6/×104 m3
LLw190100552.631.461.17
Lw26110903.492.381.11
Lw352100616.245.450.78
Lw445211003.622.760.85
Lw55330868.195.862.32
Lw65071124.902.642.26
Lw79561002.930.902.02
Lw846100608.524.294.23
Lw949100654.343.011.33
Lw1052100601.980.941.04
Lw11714601.740.641.09
Lw12786602.951.131.81
Lw1342100603.482.201.28
RRw16514805.654.41.25
Rw2778886.064.581.48
Rw37951307.825.871.95
Rw45025803.52.471.03
Rw55520844.052.651.4
Rw66761016.424.721.7
TTw155100602.541.511.03
Tw27114905.964.411.55
Tw36325823.92.551.35
Tw46619794.613.341.27
Tw56518944.743.491.25
Tw66826823.351.731.62
Table 10. Evaluation criteria for determining the steam channeling severity between CSS wells (the alternative combinations of indicators).
IndicatorsValue Ranges
No Steam
Channeling
Weak Steam
Channeling
Moderate Steam ChannelingStrong Steam
Channeling
Extremely Strong Steam Channeling
F11/%0F11 < 3030 ≤ F11 < 5050 ≤ F11 < 7070 ≤ F11 < 9090 ≤ F11 < 1
F2/day100 > F2 ≥ 6060 > F2 ≥ 3030 > F2 ≥ 1010 > F2 ≥ 55 > F2 ≥ 0
F33/°C0 ≤ F33 < 6060 ≤ F33 < 8080 ≤ F33 < 100100 ≤ F33 < 120120 ≤ F33 < 200
F4/×104m30 < F4 < 2.52.5 ≤ F4 < 33 ≤ F4 < 3.53.5 ≤ F4 < 44 ≤ F4 < 8
F5/×104m30 < F5 < 11 ≤ F5 < 1.51.5 ≤ F5 < 22 ≤ F5 < 33 ≤ F5 < 8
F6/×104m32.5 > F6 ≥ 1.51.5 > F6 ≥ 1.41.4 > F6 ≥ 1.31.1 > F6 ≥ 11 > F6 ≥ 0
Table 11. Cloud parameters of the CEC maps, Ts, and evaluation results calculated by the alternative combinations of indicators.
Reservoir
Names
Well NamesCloud Parameters TsThe Severity Levels
ExEnHeLevel 1Level 2Level 3Level 4Level 5
LLw10.490.0420.0053.3 × 10−251.2 × 10−21.1 × 10−11.1 × 10−33.8 × 10−233
Lw20.510.0420.0052.5 × 10−271.1 × 10−41.5 × 10−13.5 × 10−37.9 × 10−413
Lw30.360.0420.0052.0 × 10−86.7 × 10−14.9 × 10−69.9 × 10−123.7 × 10−522
Lw40.470.0420.0051.9 × 10−221.7 × 10−25.0 × 10−14.2 × 10−43.7 × 10−383
Lw50.510.0420.0051.6 × 10−281.8 × 10−37.0 × 10−11.0 × 10−22.5 × 10−193
Lw60.590.0420.0056.9 × 10−303.4 × 10−76.4 × 10−32.2 × 10−14.5 × 10−104
Lw70.710.0420.0051.1 × 10−511.7 × 10−123.0 × 10−65.6 × 10−13.2 × 10−44
Lw80.360.0420.0051.2 × 10−106.5 × 10−12.8 × 10−47.9 × 10−97.8 × 10−702
Lw90.380.0420.0058.8 × 10−84.8 × 10−14.3 × 10−54.8 × 10−71.6 × 10−402
Lw100.280.0420.0054.7 × 10−44.9 × 10−18.5 × 10−422.9 × 10−142.5 × 10−852
Lw110.410.0420.0051.7 × 10−142.1 × 10−16.5 × 10−31.3 × 10−54.5 × 10−252
Lw120.500.0420.0056.6 × 10−325.3 × 10−35.7 × 10−14.1 × 10−36.9 × 10−173
Lw130.300.0420.0052.0 × 10−57.8 × 10−16.8 × 10−157.4 × 10−142.4 × 10−492
RRw10.530.0110.0056.8 × 10−352.5 × 10−63.1 × 10−13.9 × 10−22.6 × 10−223
Rw20.610.0110.0055.3 × 10−633.3 × 10−106.9 × 10−82.5 × 10−16.5 × 10−154
Rw30.730.0110.0057.2 × 10−782.9 × 10−203.2 × 10−295.3 × 10−11.0 × 10−54
Rw40.460.0110.0055.4 × 10−142.1 × 10−21.8 × 10−12.4 × 10−53.0 × 10−363
Rw50.510.0110.0054.5 × 10−235.3 × 10−46.8 × 10−12.2 × 10−49.8 × 10−183
Rw60.600.0110.0051.9 × 10−366.9 × 10−81.7 × 10−93.2 × 10−11.1 × 10−204
TTw10.320.0070.0053.6 × 10−109.7 × 10−18.2 × 10−152.4 × 10−141.1 × 10−492
Tw20.560.0070.0053.1 × 10−261.8 × 10−61.2 × 10−82.7 × 10−21.5 × 10−294
Tw30.510.0070.0054.2 × 10−222.0 × 10−57.8 × 10−12.3 × 10−34.3 × 10−253
Tw40.530.0070.0051.1 × 10−332.2 × 10−45.3 × 10−11.0 × 10−32.9 × 10−363
Tw50.550.0070.0051.3 × 10−504.8 × 10−77.9 × 10−21.5 × 10−22.6 × 10−133
Tw60.500.0070.0051.3 × 10−216.3 × 10−58.9 × 10−16.4 × 10−41.6 × 10−183
accuracy/%/32
Table 12. Cloud parameters of the CEC maps, Ts, and evaluation results by using the different He values.
Well NamesCloud ParametersTsThe Severity Levels
ExEnHeLevel 1Level 2Level 3Level 4Level 5
Rw10.540.03850.0015.47 × 10−346.77 × 10−62.56 × 10−12.05 × 10−37.46 × 10−283
0.0031.74 × 10−381.22 × 10−61.47 × 10−21.28 × 10−21.23 × 10−233
0.0051.27 × 10−242.97 × 10−43.05 × 10−16.22 × 10−23.73 × 10−113
0.0071.05 × 10−422.50 × 10−71.08 × 10−22.01 × 10−21.76 × 10−244
0.018.93 × 10−398.62 × 10−71.54 × 10−21.72 × 10−22.03 × 10−244
Tw20.570.03490.0018.49 × 10−383.62 × 10−77.64 × 10−31.48 × 10−21.86 × 10−264
0.0031.34 × 10−442.76 × 10−61.18 × 10−21.49 × 10−22.47 × 10−214
0.0051.19 × 10−351.01 × 10−58.33 × 10−27.17 × 10−24.24 × 10−93
0.0071.87 × 10−668.84 × 10−76.61 × 10−23.19 × 10−24.50 × 10−253
0.018.45 × 10−541.43 × 10−52.50 × 10−21.75 × 10−21.03 × 10−163
Tw50.460.03490.0014.31 × 10−261.06 × 10−22.76 × 10−21.18 × 10−63.29 × 10−393
0.0035.68 × 10−258.73 × 10−34.24 × 10−21.46 × 10−81.75 × 10−273
0.0057.16 × 10−153.44 × 10−21.53 × 10−11.12 × 10−31.78 × 10−253
0.0071.59 × 10−24.55 × 10−12.14 × 10−13.39 × 10−21.53 × 10−52
0.015.84 × 10−398.93 × 10−23.57 × 10−34.74 × 10−72.84 × 10−282
Disclaimer/Publisher’s Note: The statements, opinions and data contained in all publications are solely those of the individual author(s) and contributor(s) and not of MDPI and/or the editor(s). MDPI and/or the editor(s) disclaim responsibility for any injury to people or property resulting from any ideas, methods, instructions or products referred to in the content.