Article

Quantifying the Need for Synthetic Inertia in the UK Grid: Empirical Evidence from Frequency Demand and Generation Data

School of Computing and Engineering, University of Huddersfield, Queensgate, Huddersfield HD1 3DH, UK
Energies 2025, 18(20), 5345; https://doi.org/10.3390/en18205345
Submission received: 1 September 2025 / Revised: 7 October 2025 / Accepted: 9 October 2025 / Published: 10 October 2025

Abstract

The increasing integration of inverter-based renewable energy sources is displacing conventional synchronous generation, resulting in a progressive reduction in system inertia and heightened challenges to frequency stability. This study presents a detailed empirical analysis of the UK electricity grid over a representative 24 h period, utilizing high-resolution datasets that capture grid frequency, energy demand, generation mix, and wholesale market prices. An inertia proxy is developed based on the share of synchronous generation, enabling quantitative assessment of its relationship with the Rate of Change of Frequency (RoCoF). Through the application of change point detection and unsupervised clustering algorithms, the analysis identifies critical renewable penetration thresholds beyond which frequency stability significantly deteriorates. These findings underscore the increasing importance of synthetic inertia in maintaining grid resilience under high renewable scenarios. The results offer actionable insights for system operators aiming to enhance frequency control strategies and contribute to the formulation of policy and technical standards regarding synthetic inertia provision in future low-inertia power systems.

1. Introduction

The urgent global push toward decarbonization has catalyzed an unprecedented expansion of inverter-based renewable energy sources, notably wind and solar photovoltaic (PV) [1]. In the UK, the capacity of wind power alone rose sharply from approximately 25 GW in 2021 to over 32 GW in 2024, supplying nearly 30% of total electricity generation [2]. While this growth supports ambitious carbon-reduction goals, it also erodes the contribution of synchronous generation and with it, the system’s inherent rotational inertia [3].
Rotational inertia, embedded within the large spinning masses of synchronous generators, delivers an automatic and instantaneous inertial response by resisting frequency deviations and providing a critical buffer following disturbances [4]. As conventional generators retire and inverter-based generation becomes dominant, this natural safety net weakens leading to more rapid and pronounced frequency deviations, reinforcing the system’s vulnerability to instability [5].
Indeed, empirical evidence highlights the severity of low-inertia systems. For instance, the GB grid experienced a significant blackout on 9 August 2019 following a lightning strike [6], wherein rapid frequency decline triggered widespread under-frequency load shedding; at the time, nearly 30–50% of generation came via electronically coupled renewables, indicating dangerously low system inertia [7]. Internationally, Australia exemplified similar risks frequency collapsed from 49.5 Hz to 47 Hz within 400 ms (RoCoF ≈ 6.25 Hz/s), well above protective thresholds [8]. Synthetic inertia delivered via fast-acting inverter control and energy storage systems has gained traction as a means to replicate the stabilizing effect traditionally provided by mechanical inertia [9]. Grid codes increasingly reflect this shift [10]: modern wind farms are now expected to provide inertia emulation or fast frequency response, a marked evolution from previous regulatory frameworks.
Theoretical and modeling studies further emphasize the urgency of integrating synthetic inertia effectively [11]. For example [12] demonstrate that failing to account for low inertia in frequency response procurement could raise ancillary service costs in Great Britain by as much as 165%. In complementary work [13] propose a coordinated scheduling model including synthetic inertia from wind turbines, showing that embedding inertia provision within stochastic unit commitment substantially improves frequency control and reduces system cost.
Despite these insights, a key gap remains: quantitative, empirically derived thresholds indicating when synthetic inertia becomes operationally critical under real-world conditions are largely undetermined. Without such data-driven criteria, grid operators and policymakers face challenges in designing effective frequency stability strategies, especially as renewable penetration deepens. This work addresses this gap by conducting a high-resolution, data-driven empirical analysis of the UK grid:
  • I introduce and validate a practical inertia proxy derived from real-time generation mix data.
  • I analyze its quantitative relationship with key frequency stability metrics, including Rate of Change of Frequency (RoCoF).
  • I apply change-point detection and clustering methods to uncover critical levels of renewable penetration thresholds at which frequency behavior degrades and synthetic inertia becomes necessary.
  • I interpret the findings in the context of grid operation and policy design, offering actionable insights for the deployment of synthetic inertia resources and the formulation of technical standards.
By anchoring our study in operational data, I aim to bridge the gap between theoretical models and real-world grid behavior, providing empirical guidance to enhance frequency control and system resilience in a rapidly evolving low-inertia future.
The paper is structured as follows: Section 2 outlines the design methodology, Section 3 presents the simulation results, Section 4 presents discussions, Section 5 provides a summary of the conclusions, while future directions are depicted in Section 6.

2. Methodology

This section presents the complete data analysis pipeline, encompassing the parsing and preprocessing of raw operational records, followed by statistical evaluation and visualization. The methodology integrates time-series interpolation, feature engineering, and unsupervised learning techniques to empirically investigate the interplay between renewable energy penetration, system inertia, and frequency stability.
The evaluation framework, summarized in Figure 1, proceeds in a structured sequence. First, frequency, demand, generation and prices datasets were collected for representative winter (January) and summer (August) weeks of system operation. After rigorous preprocessing, frequency stability was quantified using RoCoF-based metrics, clustering analysis, and change-point detection. A three-dimensional stability map was subsequently constructed to capture the joint dynamics of demand, wind share, and frequency deviations. Finally, nadir events were simulated under both baseline and synthetic inertia scenarios, enabling direct comparison of system resilience with and without additional inertial support. The outcomes were consolidated in comparative tables to emphasize seasonal contrasts and to quantify the potential benefits of synthetic inertia in enhancing grid frequency stability.
The primary outcome variable in this work is the system frequency deviation (Δf), characterized through RoCoF (Rate of Change of Frequency) and frequency nadir. These metrics directly reflect system stability under varying levels of inertia and renewable penetration. They were chosen because they are standard indicators used by transmission system operators (e.g., National Grid ESO) to assess dynamic stability.

2.1. Data Parsing and Synchronization

Four primary datasets were used in this study from the UK power grid [14]:
  • Demand.csv: National grid demand (MW)
  • Frequency.csv: Grid frequency (Hz)
  • Generation.csv: Generation by fuel type (MW)
  • Prices.csv: Wholesale electricity prices (£/MWh)
Each dataset was parsed using MATLAB R2024a, with timestamps converted to UTC using the ISO 8601 standard [15] (Equation (1)):
D a t e t i m e = d a t e t i m e ( t , I n p u t F o r m a t = y y y y M M d d T H H : m m : s s Z , T i m e Z o n e =   U T C )
The Generation.csv file was sorted in chronological order to align it with the temporal flow of other datasets. Each file was inspected to validate delimiter and structure before import. Timestamps were used as keys to synchronize the datasets. The datasets cover a two-week period (UTC dates: 1 January 2025 to 7 January 2025 and 1 August 2025 to 7 August 2025), with the following characteristics (Table 1):

2.2. Generation Aggregation and Feature Engineering

The generation dataset was initially structured in long format with rows indicating generation levels by fuel type at each timestamp. This was pivoted into wide format using (Equation (2)):
gen _ wide = unstack ( g e n e r a t i o n , G e n e r a t i o n , F u e l T y p e )
To address missing values—typically indicating zero output or reporting delays, all numeric generation entries were filled with zeros (Equation (3)):
gen _ wide ( : , fuel _ columns ) = fillmissing ( gen _ wide ( : , fuel _ columns ) , constant , 0 )
Fuel types were aggregated into two primary categories:
  • Synchronous generation: CCGT, OCGT, Nuclear, Biomass, Coal
  • Inverter-based renewables: Wind, Solar PV
The corresponding aggregates were calculated as (Equations (4)–(7)):
S y n c h r o n o u s G e n ( t ) = i S P i ( t )
R e n e w a b l e G e n ( t ) = j R P j ( t )
T o t a l G e n ( t ) = k P k ( t )
W i n d S h a r e ( t ) = R e n e w a b l e G e n ( t ) T o t a l G e n ( t )
where S, R, and K are sets of synchronous, renewable, and all generation types, respectively.

2.3. RoCoF Estimation

The Rate of Change of Frequency (RoCoF) is a key metric for assessing frequency stability [16]. It is defined as the first derivative of frequency with respect to time (Equation (8)):
R o C o F ( t ) = f ( t ) f ( t Δ t ) Δ t
In discrete terms, this was computed as (Equation (9)):
R o C o F [ n ] = f [ n ] f [ n 1 ] t [ n ] t [ n 1 ]
This operation produced a time series of RoCoF values corresponding to each frequency measurement. To ensure temporal alignment, Demand and Wind Share were interpolated onto the frequency timeline using linear interpolation (Equation (10)):
X i n t e r p ( t ) = i n t e r p ( t s o u r c e , X s o u r c e , t t a r g e t , l i n e a r , e x t r a p )

2.4. Clustering and Change Point Detection

2.4.1. K-Means Clustering

To identify operational regimes associated with different frequency stability behaviors, K-means clustering was applied [17] to a 2D feature space defined by absolute RoCoF and Wind Share (Equation (11)):
X = R o C o F 1 W i n d S h a r e 1 R o C o F 2 W i n d S h a r e 2 R o C o F N W i n d S h a r e N
The algorithm partitions data into k clusters C1, C2, ..., Ck by minimizing the within cluster sum of squares (WCSS) [18] (Equation (12)):
W C S S = i = 1 k x C i x μ i 2
where μi is the centroid of cluster Ci.
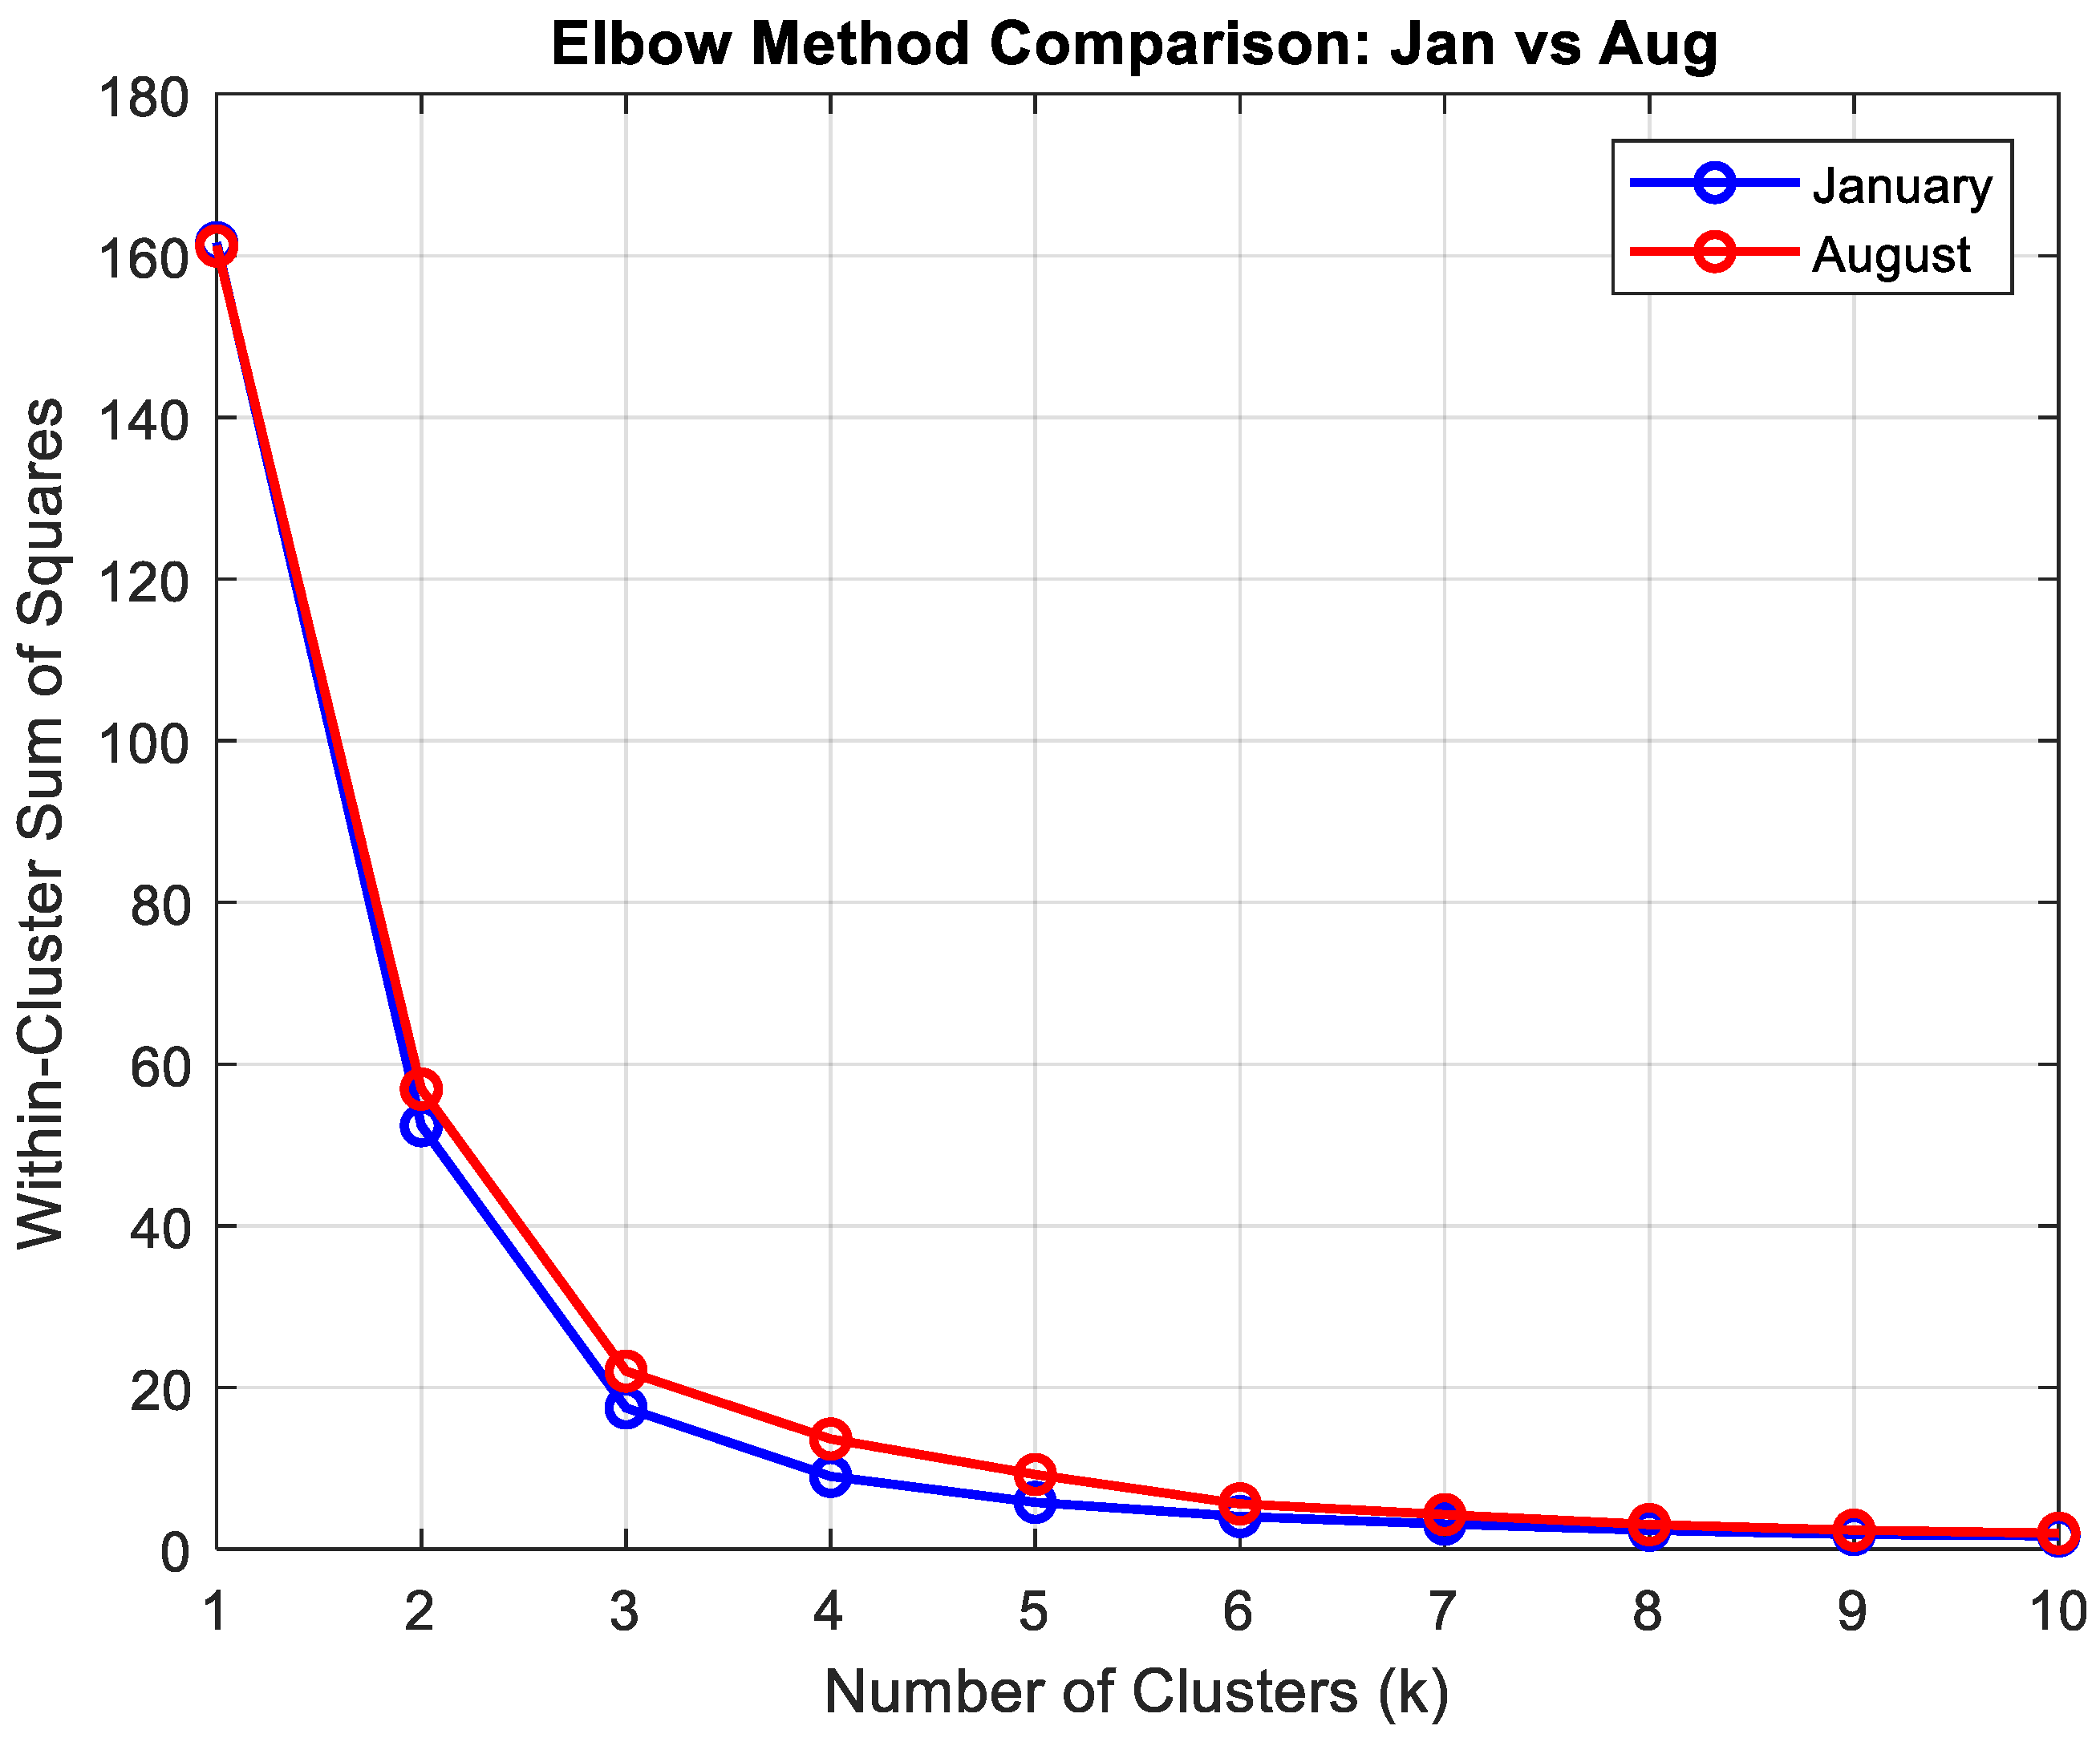
An elbow plot was generated by computing WCSS for k = 1 to 10 to visually select an optimal number of clusters.

2.4.2. Change Point Detection

To detect structural shifts in frequency stability over time, change point detection [19] was performed on Hourly Aggregated RoCoF values (Equation (13)):
R o C o F h o u r l y ( h ) = 1 N h i h R o C o F i
Change points were identified using MATLAB’s findchangepts function, which locates points where the mean of the signal significantly changes (Equation (14)):
C h a n g e   P o i n t   I n d e x = a r g   min k i = 1 k x i μ 1 2 + i = k + 1 n ( x i μ 2 ) 2
where μ1 and μ2 are the sample means of the segments before and after index k.

2.5. Synthetic Inertia-Based Improved Frequency Response

In a conventional synchronous power system, short-term frequency dynamics are governed by the swing Equation:
2 H d f d t = f 0 P b a s e ( P m P e )
  • H is inertia constant (s), measures stored kinetic energy in machines.
  • is the system frequency (Hz), with f 0
  • nominal grid frequency (50 Hz).
  • Pm is the mechanical input power.
  • Pe is the load demand.
  • Pbase is the system base power.
When a sudden imbalance ΔP = Pm − Pe < 0 occurs (e.g., generator trip, load increase), the frequency starts to decline. In systems dominated by inverter-based renewable generation (e.g., wind or solar PV), this dynamic is exacerbated. Such resources do not inherently provide rotational inertia, leading to a smaller H, which in turn produces steeper RoCoF, deeper frequency nadirs, and a greater risk of under-frequency load shedding or even large-scale system collapse.
Synthetic inertia is designed to mitigate this vulnerability. By leveraging fast power-electronic controls, synthetic inertia emulates the stabilizing effect of synchronous machine inertia. The controller continuously measures the RoCoF and injects an additional active power response that is proportional to the rate of frequency change:
P s y n t = K s y n d f d t
where
  • Ksyn is the synthetic inertia gain (MW/Hz/s).
Incorporating this control into the swing equation yields:
2 H d f d t = f 0 P b a s e ( Δ P P s y n ( t ) )
Substituting (16) gives:
( 2 H + f 0 K s y n P b a s e ) d f d t = f 0 P b a s e Δ P
This formulation reveals that the system behaves as if it possesses an effective inertia:
H e f f = H + f 0 K s y n 2 P b a s e
So the system behaves as if inertia were larger, and will impact positively on RoCof as (20):
d f d t = f 0 2 H e f f P b a s e Δ P
This enhancement effectively reduces the RoCoF and delays the occurrence of the frequency nadir, thereby providing critical additional time for primary frequency control mechanisms, such as governors and reserves, to stabilize the system. In essence, synthetic inertia bridges the gap left by declining synchronous generation and supports secure grid operation under high renewable penetration.

2.6. Visualization and Summary Metrics

A set of diagnostic plots was generated to visualize:
  • Frequency response during sample disturbances, with and without simulated synthetic inertia
  • A 3D scatter map of demand, wind share, and RoCoF magnitude
  • Elbow plot for K-means optimization
  • RoCoF time series with detected change points
A summary table of key indicators was compiled, including:
  • Maximum absolute RoCoF observed
  • Pearson correlation between Wind Share and |RoCoF|
  • Estimated frequency deviation avoided with synthetic inertia
  • Battery energy used and cost per hertz of avoided deviation
Cost estimation was calculated as (Equation (21)):
C o s t   p e r   Hz = B a t t e r y   C o s t   p e r   MWh × B a t t e r y   E n e r g y   U s e d   ( MWh ) Hz   D e v i a t i o n   A v o i d e d
This provides an economic lens on the value of synthetic inertia.

3. Results

This section presents the empirical findings from the UK grid dataset, using Matlab R2024a, highlighting how frequency stability degrades under high renewable penetration and low inertia conditions. Data were obtained from the Balancing Mechanism Reporting Service (BMRS) operated by Elexon [14]. Frequency metrics such as Rate of Change of Frequency (RoCoF) and frequency nadir follow ESO’s standard definitions for system stability assessment. Reliability of the primary outcome was assessed through consistency checks across independent datasets (January vs. August weeks).

3.1. RoCoF vs. Wind Share Clustering

To systematically explore the influence of renewable penetration on frequency stability, a clustering-based approach was employed. The clustering step, guided by the Elbow Method, reduces the high-dimensional and noisy time-series data into a set of representative operating states of the British power system. Each cluster characterizes distinct combinations of system demand, wind penetration, and the associated frequency stability metrics.
The rationale for clustering is twofold: first, it simplifies the continuous operational space into a manageable number of states, thereby facilitating interpretation; second, it preserves the essential variability required to compare frequency dynamics across different seasonal conditions. The Elbow Method was applied to ensure that the selected number of clusters balances parsimony with explanatory richness, avoiding both underfitting and overfitting.
In this study, the relationship between absolute RoCoF and wind share was clustered using the K-means algorithm. The Elbow Method was used to determine the optimal number of clusters by examining the within-cluster sum of squares (WCSS) as a function of k. As shown in Figure 2, the elbow point indicates the number of clusters beyond which additional complexity yields diminishing returns in explanatory power. This provides a data-driven basis for grouping operating states and identifying under which system conditions synthetic inertia is most effective in mitigating frequency instability.
This plot suggests a diminishing return in WCSS reduction beyond k = 3, implying three operational regimes may capture the dominant variation.

3.2. Change Point Detection in Hourly RoCoF

Hourly averages of |RoCoF| were calculated to assess intra-day variation in frequency volatility. Change point detection identified statistically significant shifts in the mean level of RoCoF. Figure 3 shows the two-week data |RoCoF| time series with detected change points overlaid as vertical lines.
The detection algorithm identified different breakpoints over a week, suggesting abrupt transitions in grid dynamics possibly associated with generation mix or load variability.

3.3. Frequency Response with and Without Synthetic Inertia

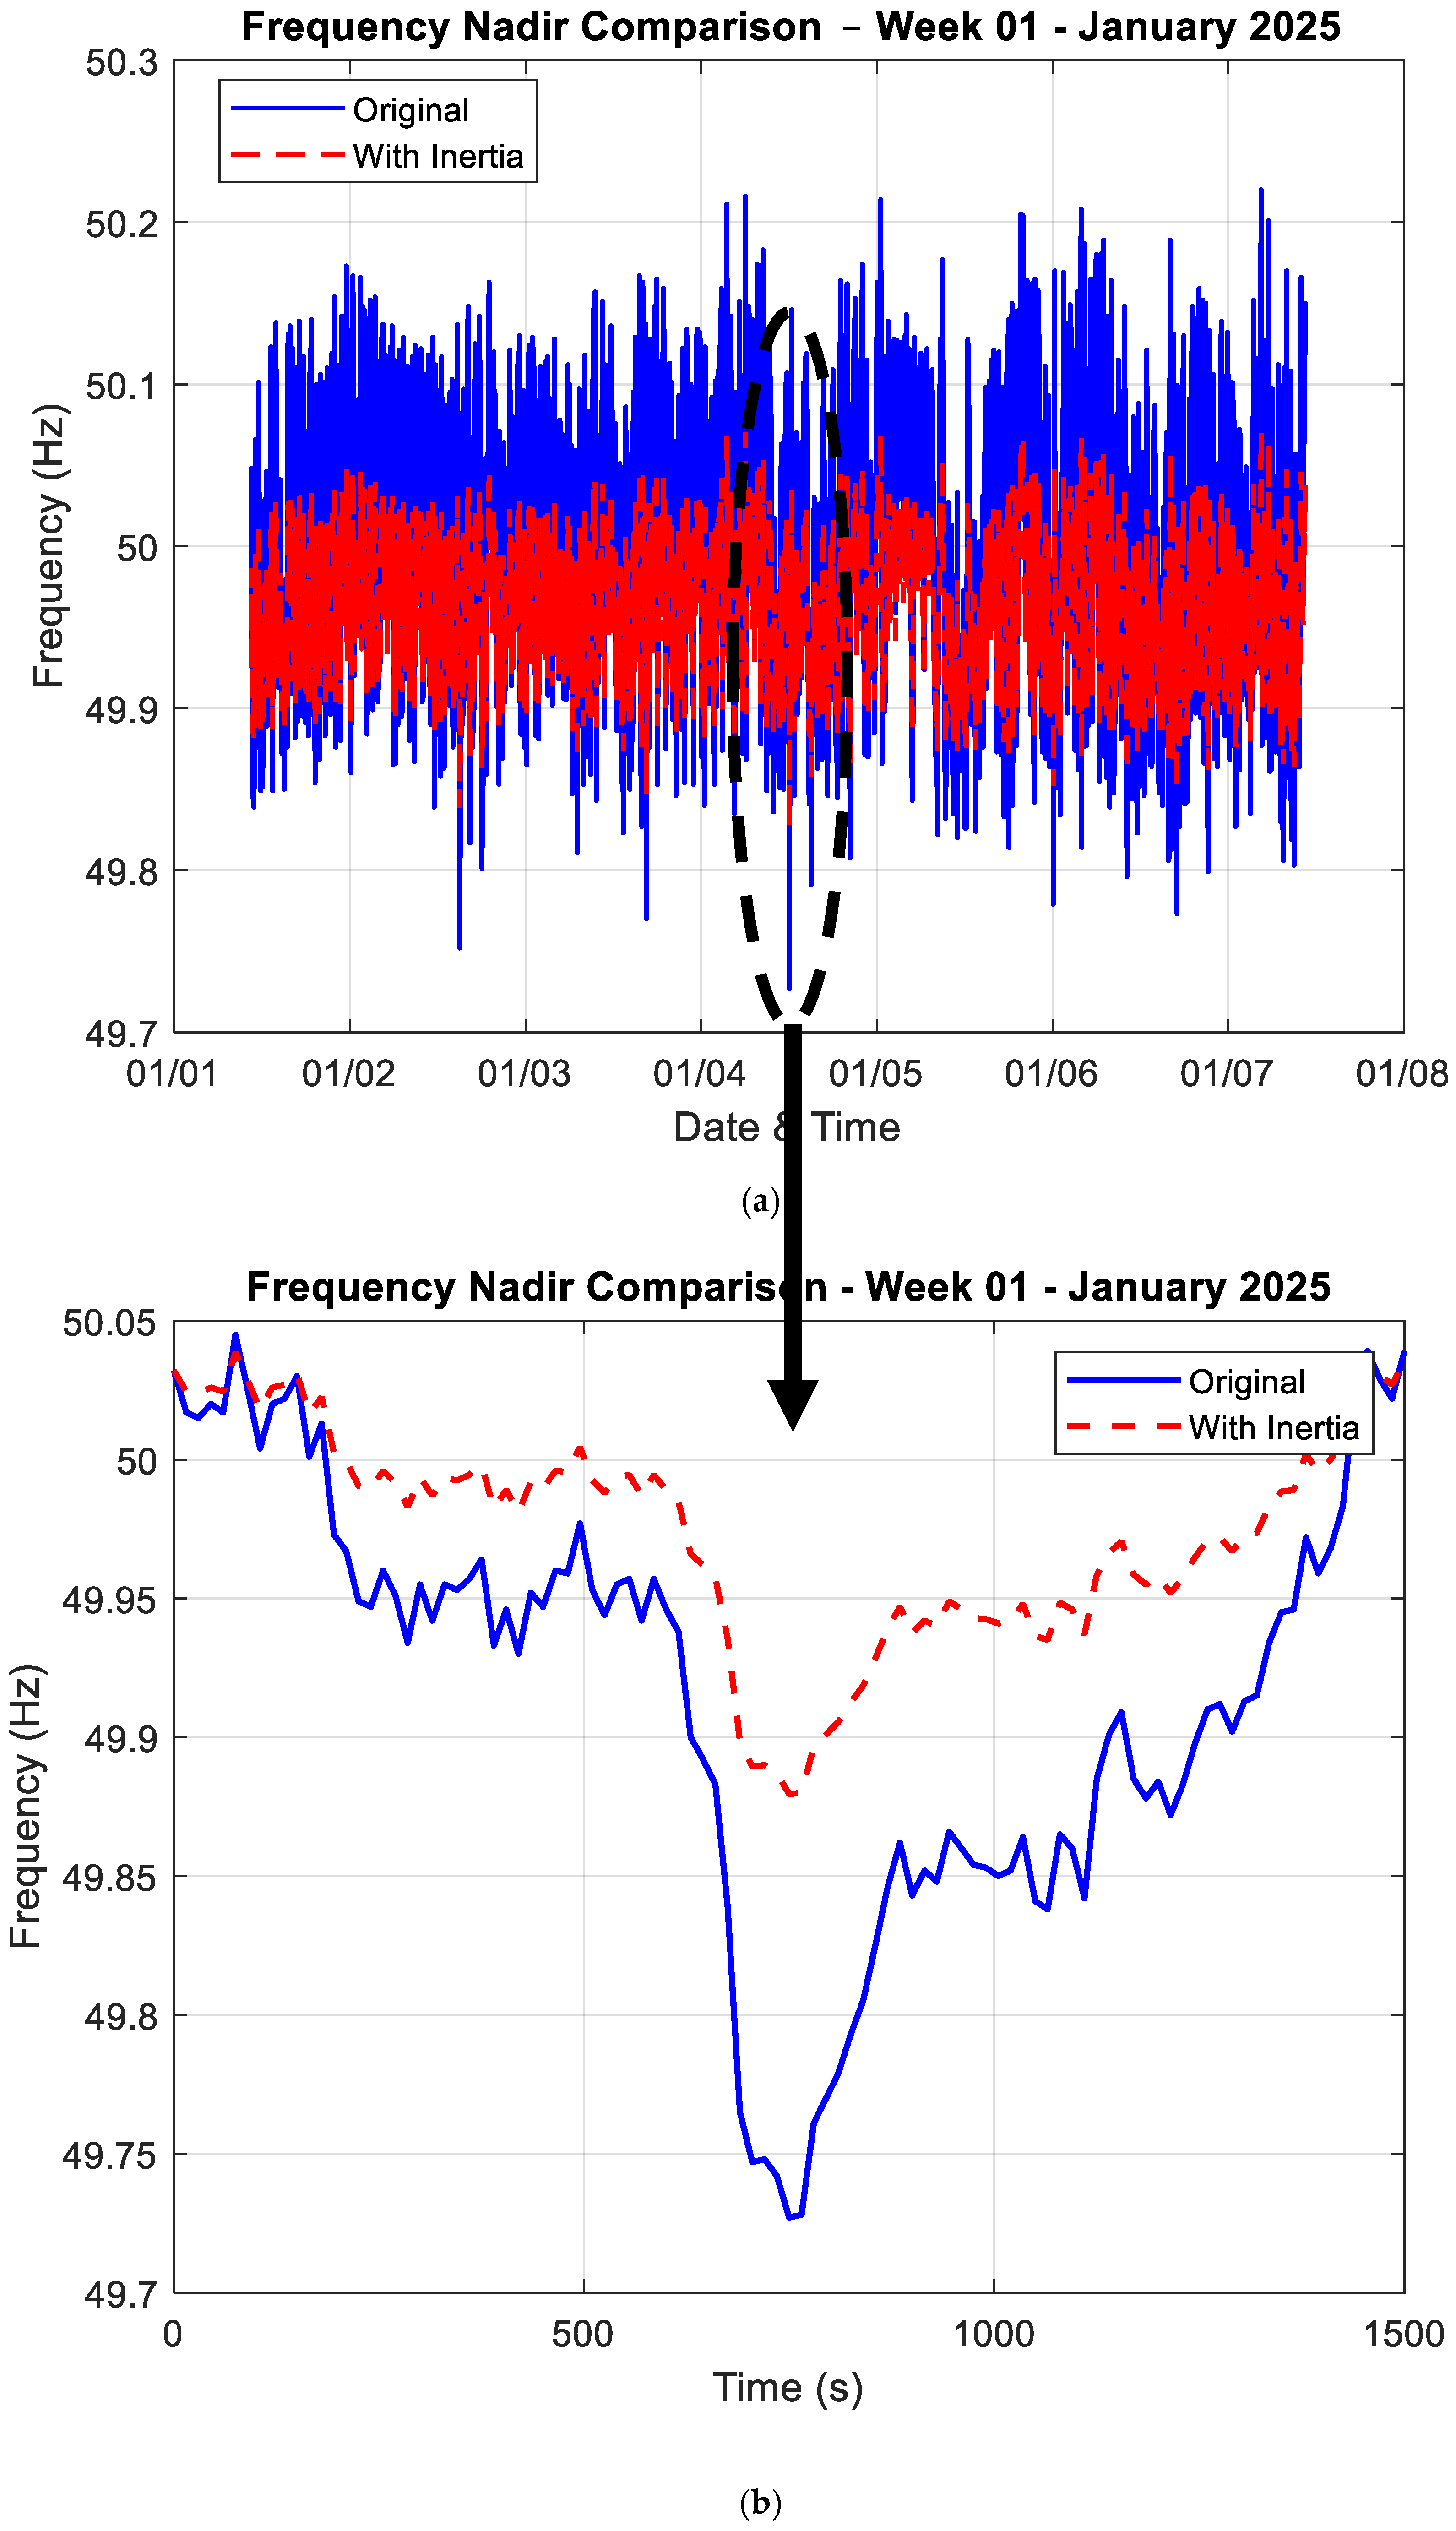
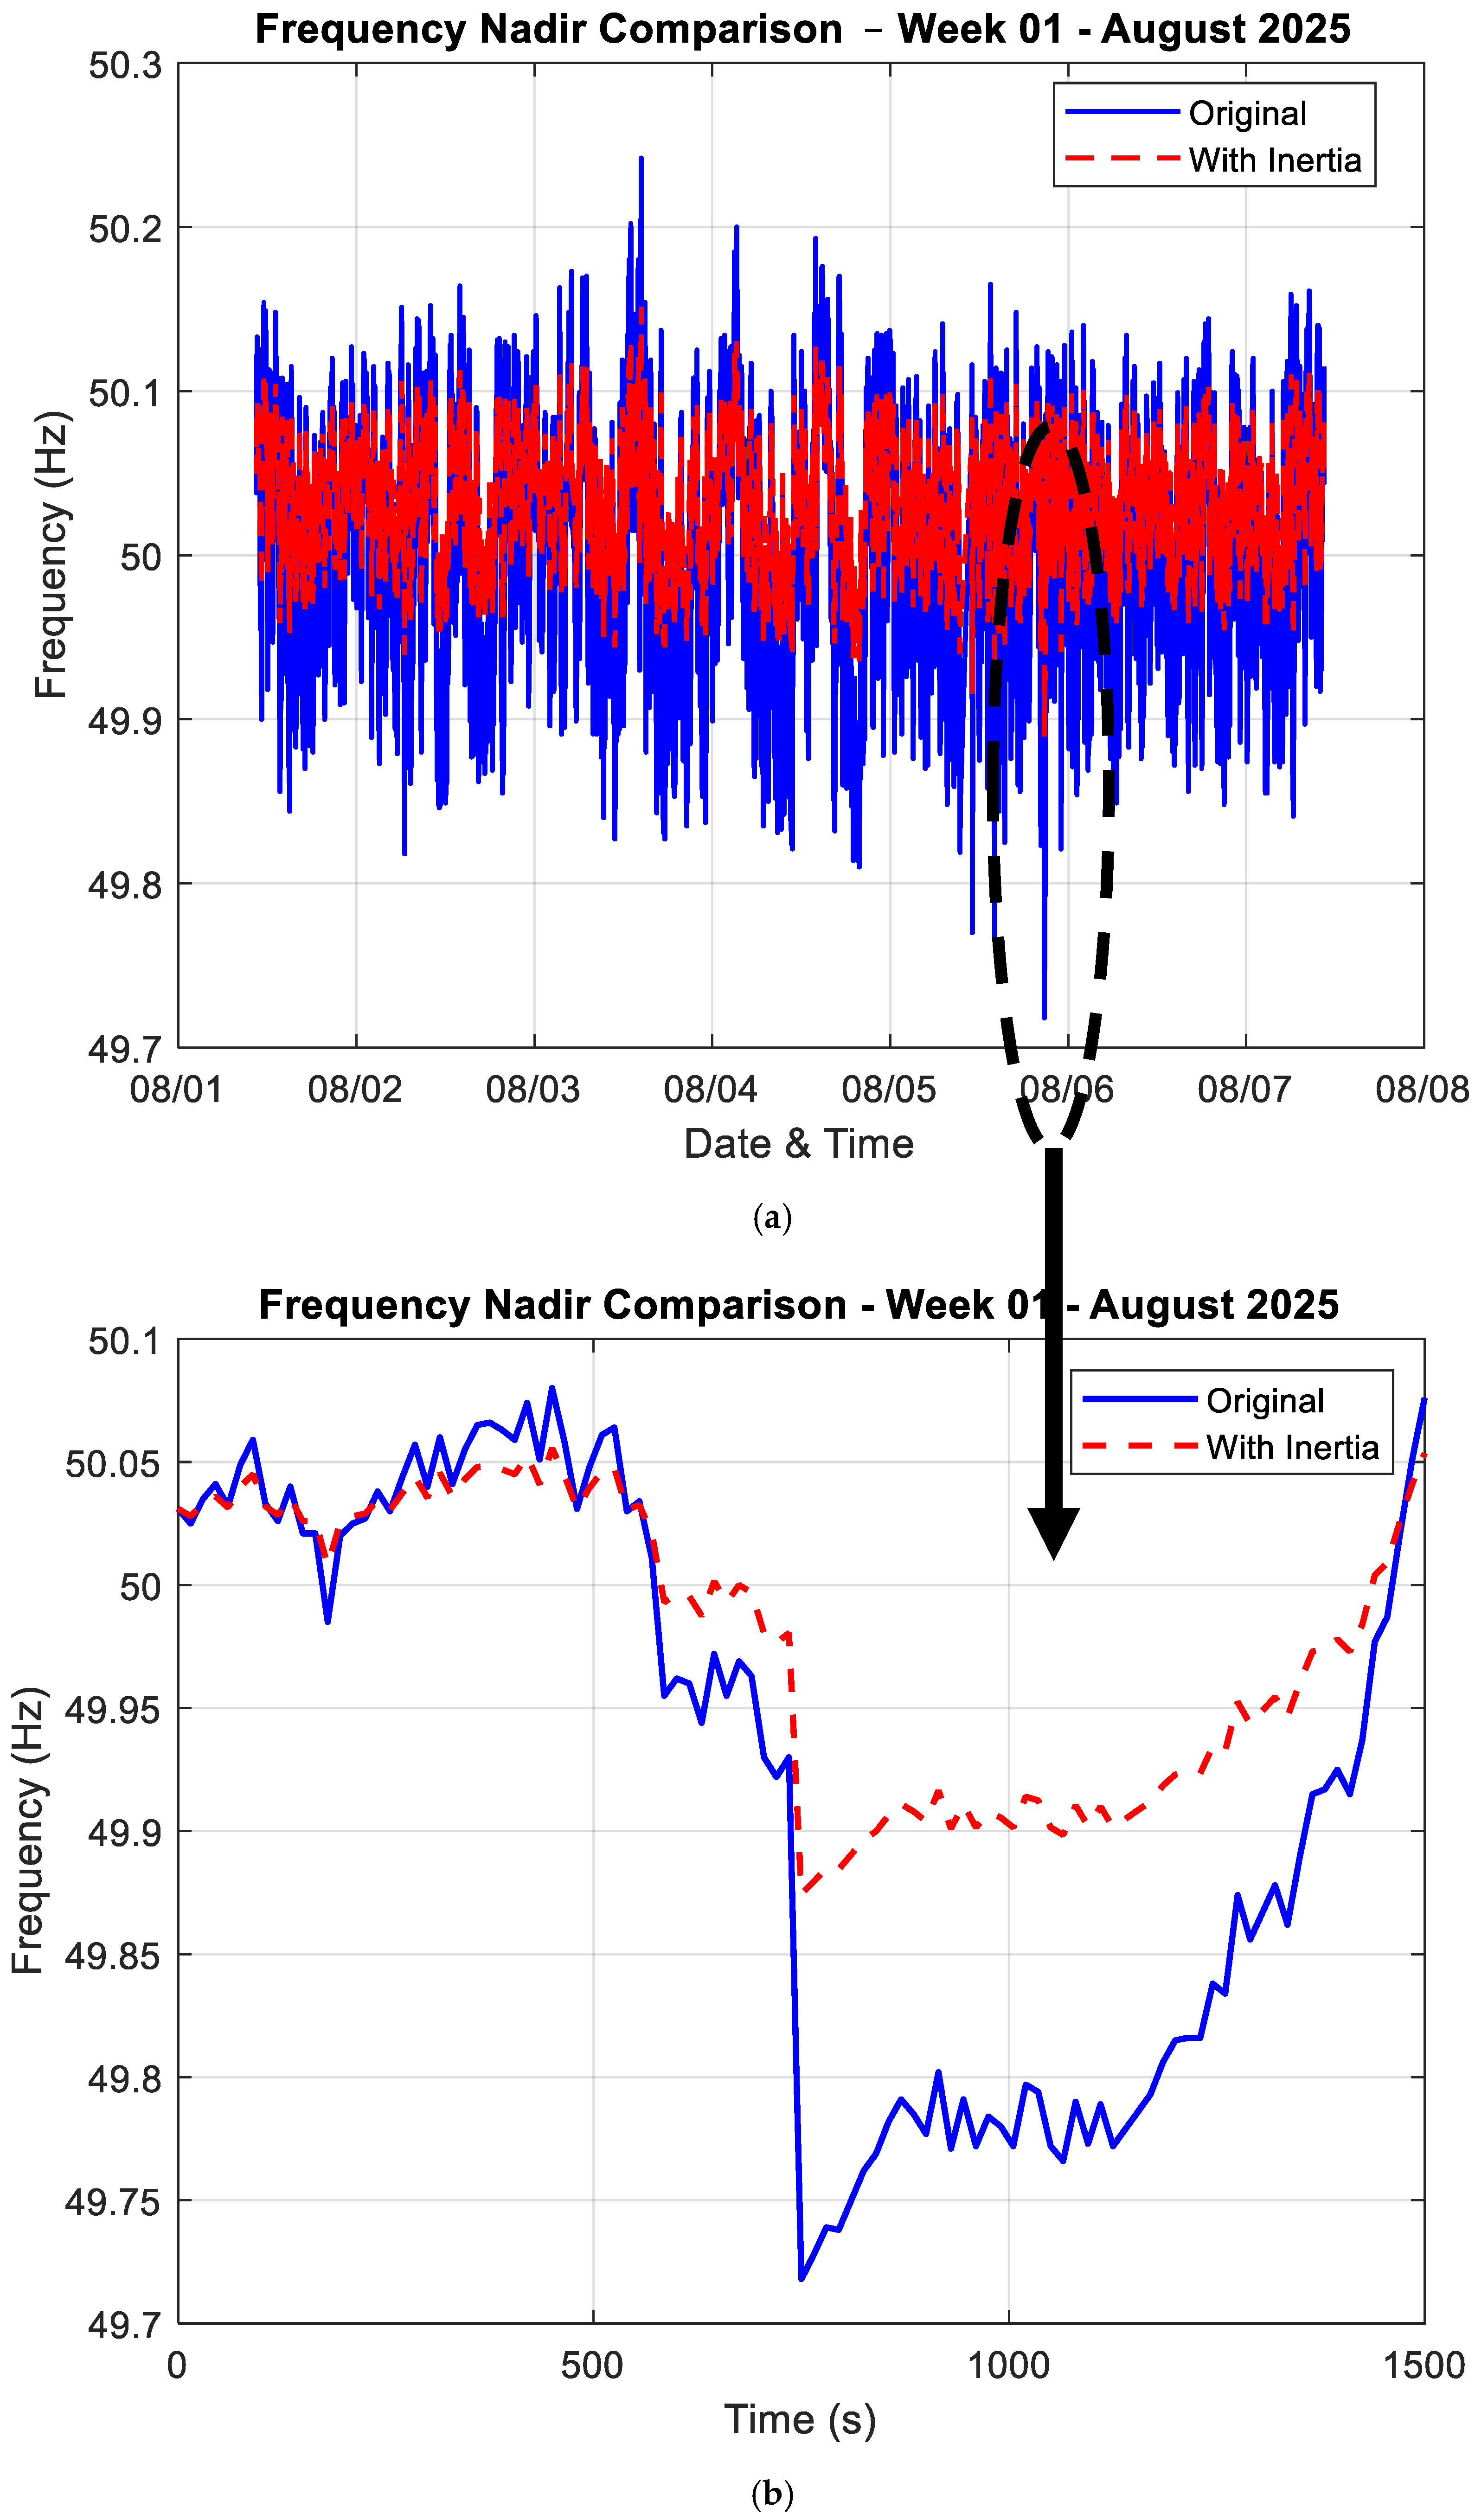
To illustrate the benefit of synthetic inertia, a representative frequency disturbance was simulated with and without inertia emulation. Figure 4 and Figure 5 plot the actual frequency response during an event window alongside a synthetic version with added damping, for both January and August respectively.
The synthetic frequency trace shows improved damping, indicating that modest synthetic inertia can reduce the depth and speed of frequency deviations. Standard deviation of RoCoF during each period was computed to indicate variability within each cluster. The synthetic inertia effect consistently reduced both the mean and the variance of RoCoF, demonstrating a robust improvement.

3.4. Three-Dimensional Stability Map: Demand, Wind Share, and RoCoF

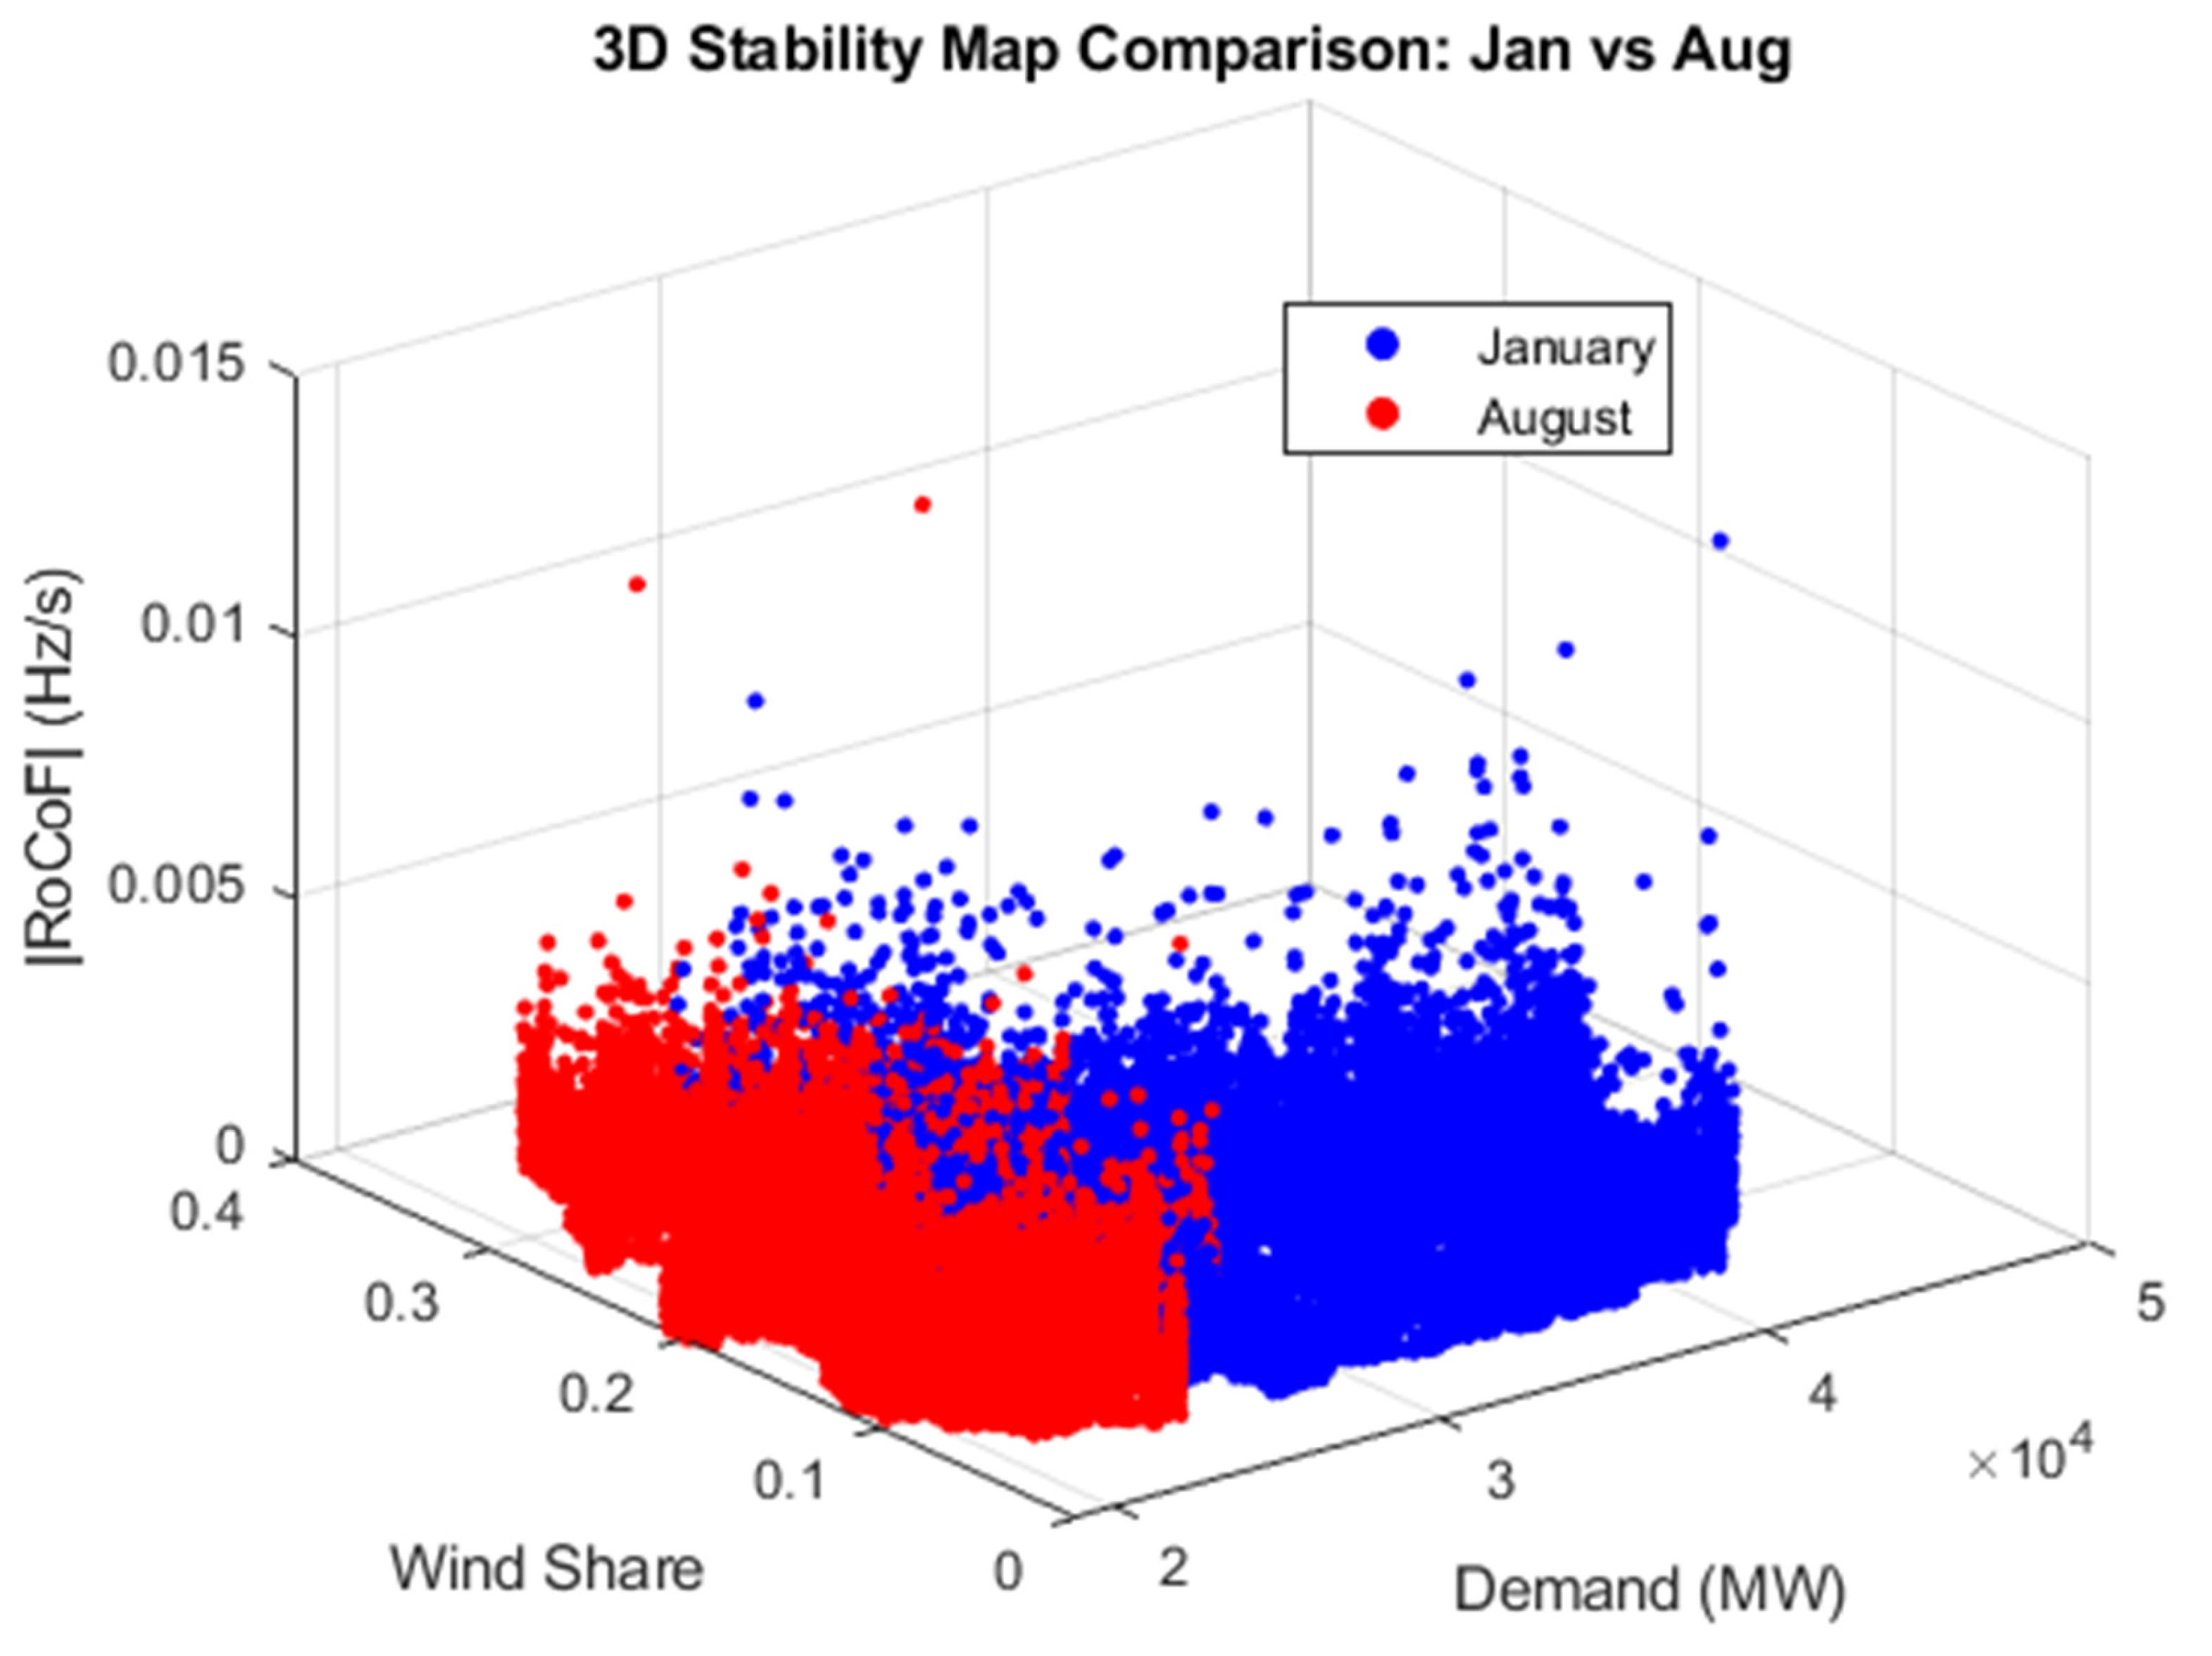
A three-dimensional scatter plot was constructed to visualize how RoCoF interacts with both grid demand and renewable share. Figure 6 shows a 3D map with color-coded |RoCoF| magnitudes.
This figure reveals that high RoCoF values tend to cluster at times of low demand and high wind share, conditions indicative of low inertia scenarios. The stability metrics showed similar qualitative patterns across both seasons, confirming that the observed improvements due to synthetic inertia are reproducible and not dependent on a single operational period.

3.5. Summary Metrics

A summary of key indicators was compiled to support interpretation and quantification of system dynamics under study (Table 2):

4. Discussion

The results provide compelling evidence that low-inertia conditions characterized by high wind share and reduced synchronous generation are strongly correlated with increased RoCoF and degraded frequency stability. The clustering analysis reveals distinct regimes in grid operation, likely corresponding to varying levels of risk and required response strategies. Change point detection further indicates that RoCoF does not vary smoothly but can shift abruptly, which may pose operational challenges in real-time system management. These discontinuities could align with dispatch events, forecast errors, or unexpected load/generation changes. Simulation of synthetic inertia suggests that relatively small interventions could meaningfully reduce the severity of frequency events. This supports growing advocacy for inertia emulation standards in grid-connected inverters and battery systems. The 3D stability visualization also reveals non-linear relationships among demand, wind share, and frequency dynamics, implying that inertia needs should be co-optimized with demand levels, not just renewable penetration alone. Together, these findings provide actionable insights for both system operators and policy architects seeking to define thresholds and strategies for synthetic inertia deployment in low-carbon grids. While the present analysis relies on high-resolution operational data, future work will include additional weeks or measurement campaigns to further strengthen the statistical reliability of the results.

5. Conclusions

This study provides an empirical, data-driven evaluation of frequency stability in the UK electricity grid in the context of declining system inertia due to increased penetration of inverter-based renewable energy sources. Using high-resolution operational data spanning demand, generation mix, and frequency measurements, I introduced a practical proxy for inertia and quantified its relationship with the rate of change of frequency (RoCoF).
Key findings include:
  • Higher renewable shares are consistently associated with higher RoCoF, confirming the vulnerability of low-inertia systems to frequency disturbances.
  • Change point detection revealed abrupt shifts in average RoCoF behavior, underscoring the need for real-time inertia awareness in system operation.
  • Clustering analysis of RoCoF and wind share highlighted distinct operational regimes, offering a basis for defining inertia-critical thresholds.
  • A simulated frequency response scenario demonstrated that synthetic inertia, even when modeled in a simple form, can meaningfully mitigate frequency excursions.
  • The 3D stability map illustrates the complex interaction between load, renewable share, and system volatility, pointing toward a multidimensional approach to grid stability assessment.
These insights reinforce the urgency for coordinated deployment of synthetic inertia, both as a technical requirement for grid-forming inverters and as a market mechanism for ancillary services. Without adequate inertia emulation, future high-renewable grids may face increasing frequency instability and operational risk.

6. Future Work

While this study offers valuable empirical insights, several extensions are recommended to enhance the generalizability and practical impact of the results:
  • Regional Disaggregation: Analyze inertia conditions at a zonal or nodal level to reflect regional imbalances, transmission constraints, and asynchronous behavior across the UK grid.
  • Synthetic Inertia Modeling: Develop more realistic models of inverter-based synthetic inertia, incorporating latency, control strategies, and saturation limits.
  • Economic Optimization: Integrate economic models to co-optimize inertia provision, battery sizing, and dispatch under realistic market constraints and pricing signals.
  • Policy Implications: Collaborate with regulators and TSOs (e.g., National Grid ESO) to define synthetic inertia standards and design market products that reward fast-frequency response.
  • Machine Learning Forecasting: Train predictive models using historical RoCoF and generation data to forecast stability risks in advance and support grid operation decision-making.
  • Extending the analysis with detailed network models would be a valuable direction for future work
  • Hardware-in-the-loop or field demonstrations would provide further verification, and this remains a valuable direction for future research.
As the energy system transitions toward a high-renewables future, the need for robust frequency stability mechanisms will only increase. This work offers a foundational empirical framework that can support both operational and policy advancements in the era of inverter-dominated grids.

Funding

This research received no external funding.

Data Availability Statement

The original contributions presented in this study are included in the article. Further inquiries can be directed to the corresponding author.

Conflicts of Interest

The authors declare no conflict of interest.

References

  1. Qaisar, M.W.; Fang, J. Grid-Forming Converters for Renewable Generation: A Comprehensive Review. Energies 2025, 18, 4565. [Google Scholar] [CrossRef]
  2. González, M.; Santiso, A.; Jones, D.; Akbari, N.; Vasconcelos, R.; Melo, D. Offshore Wind Power Growth and Industrial Development in Emerging Markets. Energies 2024, 17, 4712. [Google Scholar] [CrossRef]
  3. Njoka, G.M.; Mogaka, L.; Wangai, A. Impact of variable renewable energy sources on the power system frequency stability and system inertia. Energy Rep. 2024, 12, 4983–4997. [Google Scholar] [CrossRef]
  4. Hasan, A.K.; Haque, M.H.; Aziz, S.M. Enhancing Frequency Response Characteristics of Low Inertia Power Systems Using Battery Energy Storage. IEEE Access 2024, 12, 116861–116874. [Google Scholar] [CrossRef]
  5. He, C.; Geng, H.; Rajashekara, K.; Chandra, A. Analysis and Control of Frequency Stability in Low-Inertia Power Systems: A Review. IEEE/CAA J. Autom. Sin. 2024, 11, 2363–2383. [Google Scholar] [CrossRef]
  6. Zhao, J.; Li, F.; Zhang, Q. Impacts of renewable energy resources on the weather vulnerability of power systems. Nat. Energy 2024, 9, 1407–1414. [Google Scholar] [CrossRef]
  7. Souto, L.; Neal, R.; Pope, J.O.; Gonzalez, P.L.; Wilkinson, J.; Taylor, P.C. Identification of weather patterns and transitions likely to cause power outages in the United Kingdom. Commun. Earth Environ. 2024, 5, 49. [Google Scholar] [CrossRef]
  8. Venkatanagaraju, K.; Rakesh, M.; Yenugu, B.C.; Sharma, P.P.; Andanapalli, K.; Biswal, M. Major Power System Blackouts: A Survey. In Proceedings of the 2024 10th International Conference on Electrical Energy Systems (ICEES), Chennai, India, 22–24 August 2024; pp. 1–6. [Google Scholar] [CrossRef]
  9. Makolo, P.; Zamora, R.; Perera, U.; Lie, T.T. Flexible Synthetic Inertia Optimization in Modern Power Systems. Inventions 2024, 9, 18. [Google Scholar] [CrossRef]
  10. Aljarrah, R.; Fawaz, B.B.; Salem, Q.; Karimi, M.; Marzooghi, H.; Azizipanah-Abarghooee, R. Issues and Challenges of Grid-Following Converters Interfacing Renewable Energy Sources in Low Inertia Systems: A Review. IEEE Access 2024, 12, 5534–5561. [Google Scholar] [CrossRef]
  11. Boyle, J.; Littler, T.; Foley, A.M. Coordination of synthetic inertia from wind turbines and battery energy storage systems to mitigate the impact of the synthetic inertia speed-recovery period. Renew. Energy 2024, 223, 120037. [Google Scholar] [CrossRef]
  12. Baig, A.M.; Badesa, L.; Strbac, G. Importance of Linking Inertia and Frequency Response Procurement: The Great Britain Case. In Proceedings of the 2021 IEEE Madrid PowerTech, Madrid, Spain, 28 June–2 July 2021; pp. 1–6. [Google Scholar] [CrossRef]
  13. Chu, Z.; Markovic, U.; Hug, G.; Teng, F. Towards Optimal System Scheduling with Synthetic Inertia Provision from Wind Turbines. IEEE Trans. Power Syst. 2020, 35, 4056–4066. [Google Scholar] [CrossRef]
  14. Balancing Mechanism Reporting Service, Elexon, UK. Available online: https://bmrs.elexon.co.uk/ (accessed on 15 August 2025).
  15. ISO 8601; Date and Time Format. International Organization for Standardization (ISO): Geneva, Switzerland. Available online: https://www.iso.org/iso-8601-date-and-time-format.html (accessed on 15 August 2025).
  16. Deng, X.; Mo, R.; Wang, P.; Chen, J.; Nan, D.; Liu, M. Review of RoCoF Estimation Techniques for Low-Inertia Power Systems. Energies 2023, 16, 3708. [Google Scholar] [CrossRef]
  17. Li, F.; Su, J.; Sun, B. An Optimal Scheduling Method for an Integrated Energy System Based on an Improved k-Means Clustering Algorithm. Energies 2023, 16, 3713. [Google Scholar] [CrossRef]
  18. Wani, A.A. Comprehensive analysis of clustering algorithms: Exploring limitations and innovative solutions. PeerJ Comput. Sci. 2024, 10, e2286. [Google Scholar] [CrossRef] [PubMed]
  19. Lozada, C.; Vargas, W.; Granda, N.; Chamba, M. Optimal Load Shedding Scheme Considering the Dynamic Frequency Response. Eng. Proc. 2024, 77, 25. [Google Scholar] [CrossRef]
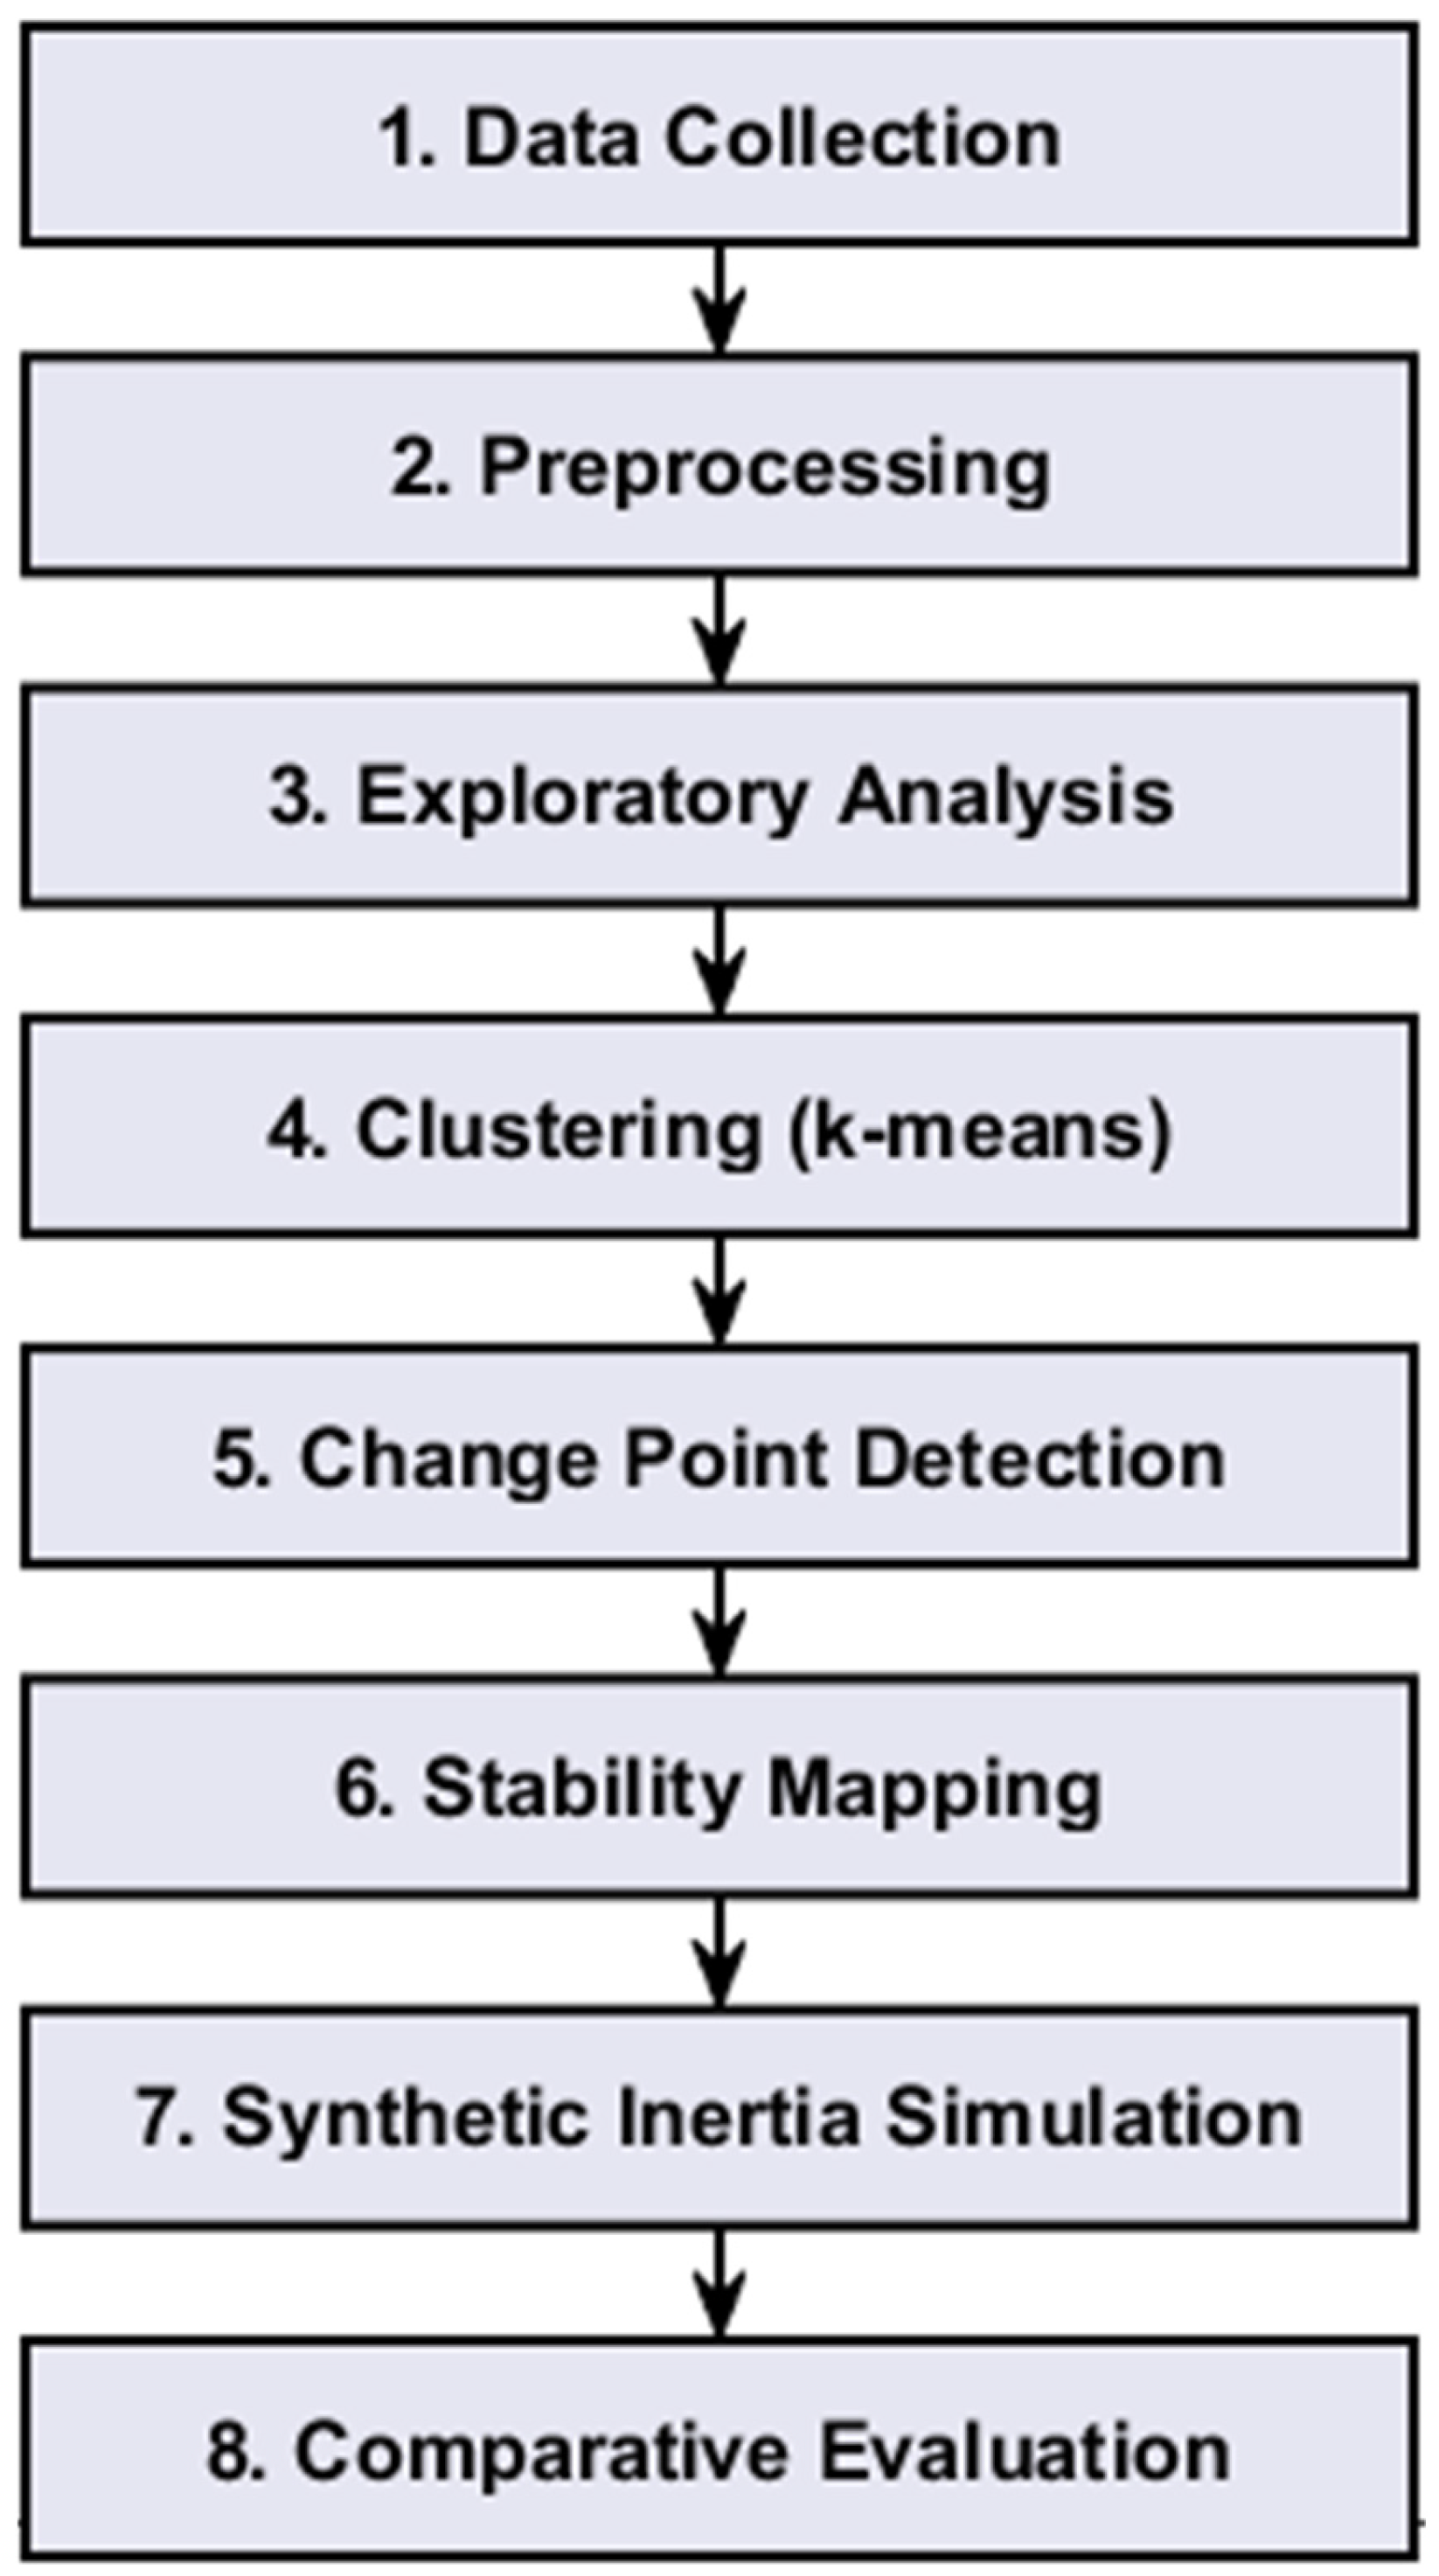
Figure 1. Evaluation methodology flowchart.
Energies 18 05345 g001
Figure 2. Elbow Plot for RoCoF vs. Wind Share Clustering.
Energies 18 05345 g002
Figure 3. Change Point Detection in Hourly RoCoF.
Energies 18 05345 g003
Figure 4. (a) Frequency Response with Synthetic Inertia—January data, (b) zoom.
Energies 18 05345 g004
Figure 5. (a) Frequency Response with Synthetic Inertia—August data, (b) zoom.
Energies 18 05345 g005
Figure 6. Three-Dimensional Stability Map.
Energies 18 05345 g006
Table 1. Data Description [14].
DatasetTime ResolutionColumnsNotes
Demand.csv5 minStartTime (ISO8601 UTC), Demand (MW)1730 rows
Frequency.csv15 sMeasurementTime (ISO8601 UTC), Frequency (Hz)34,562 rows
Generation.csv5 minStartTime (ISO8601 UTC), FuelType, Generation (MW)20 fuel types, data sorted reverse chronological (34,581 rows)
Prices.csv30 minStartTime (ISO8601 UTC), SystemSellPrice, SystemBuyPrice (GBP/MWh)290 rows
Table 2. Key indicators.
MetricValueUnits
JanuaryAugust
Max RoCoF Observed0.0128670.014133Hz/s
WindShare–RoCoF Correlation−0.0109−0.00303
Real Nadir49.72149.718Hz
                   With inertia49.8949.87
                   Improvement0.1520.156
Cost per Hz avoided3054.82960.3£
Disclaimer/Publisher’s Note: The statements, opinions and data contained in all publications are solely those of the individual author(s) and contributor(s) and not of MDPI and/or the editor(s). MDPI and/or the editor(s) disclaim responsibility for any injury to people or property resulting from any ideas, methods, instructions or products referred to in the content.