Abstract
At present, the development of power cables shows three notable trends: higher voltage, longer distance and more complex environments. Against this backdrop, the limitations of traditional detection techniques in locating local defects have become increasingly apparent. Frequency Domain Reflectometry (FDR) has garnered sustained research attention both domestically and internationally due to its high sensitivity and accuracy in detecting localized defects. This paper aims to compare the defect localization effectiveness of the Fast Fourier Transform (FFT) method and the Inverse Fast Fourier Transform (IFFT) method within FDR. First, the differences between the two methods are analyzed from a theoretical perspective. Then, field tests are conducted on cables of varying voltage levels and lengths, with comparisons made using parameters such as full width at half maximum (FWHM) and signal-to-noise ratio (SNR). The results indicate that the FFT method is more suitable for low-interference or short cables, while the IFFT method is more suitable for high-noise, high-resolution, or long cables.
1. Introduction
At present, the world is at a critical stage of energy transition, and the development of new power systems is also advancing continuously. Against this backdrop, power cables, as a core medium in the power transmission and distribution process, play an irreplaceable role. Driven by both energy transition and the development of new power systems, the market demand for power cables is constantly increasing, and the scale of the industry is also expanding continuously. However, throughout their entire lifecycle, power cables remain vulnerable to the adverse effects of various factors. Manufacturing deviations during production may introduce latent defects. During installation and operation, prolonged exposure to combined stresses—such as mechanical forces, elevated temperatures, and high humidity—can further precipitate localized insulation degradation and conductor contact failures [1,2]. If such localized defects are not detected early and addressed with targeted repairs, their deterioration will accelerate over time, eventually exceeding the insulation tolerance limit and evolving into permanent failures. These failures can lead to unplanned outages in the power system, resulting not only in regional power disruptions and direct economic losses but also potentially giving rise to secondary safety hazards. Such incidents pose significant threats to social well-being and public safety. Therefore, strengthening defect detection throughout the entire lifecycle of power cables holds significant engineering value and practical significance [3,4].
Common cable detection methods currently include insulation resistance testing (IR) [5], very-low-frequency dielectric loss testing (VLF-tan δ) [6], and withstand voltage testing [7]. Among these, IR and VLF-tan δ can only evaluate the overall condition of power cables and fail to locate localized minor defects. Withstand voltage testing serves as a direct means to assess cable insulation performance but is inherently destructive: if latent defects exist in the cable, the applied high voltage may directly promote defect propagation or even cause insulation breakdown. The widely used partial discharge (PD) detection enables non-destructive testing and exhibits high sensitivity to early-stage localized defects [8]; however, the amplitude of PD signals is extremely low, making them vulnerable to interference from complex electromagnetic environments during testing, which undermines the reliability of detection results [9]. Additionally, Time Domain Reflectometry (TDR) enables the rapid detection and localization of localized defects [10,11], but its narrow input signal bandwidth limits its sensitivity to minor impedance variations [12].
In recent years, as power cables have evolved toward higher voltages, longer transmission distances, and more complex installation environments, traditional detection technologies have increasingly revealed limitations—such as insufficient sensitivity and weak anti-interference capability—in detecting localized defects. Consequently, scholars worldwide have conducted in-depth and sustained research on the application of Frequency Domain Reflectometry (FDR) in assessing the insulation condition of power cables. Leveraging the high responsiveness of broadband signals to localized impedance changes, FDR has emerged as a key integrated technology for detecting, locating, and identifying micro-localized defects in power cables, providing more accurate localized defect assessment for cable condition-based maintenance.
Currently, the mainstream techniques in FDR are the Fast Fourier Transform (FFT) method and the Inverse Fast Fourier Transform (IFFT) method. Due to the non-integer periodicity of cable frequency-domain response data, FFT analysis is prone to spectral leakage and the fence effect. Meanwhile, during time-domain signal reconstruction via IFFT, the process faces dual challenges: the influence of the Gibbs phenomenon and electromagnetic noise interference. These inherent flaws significantly reduce the localization accuracy and identification sensitivity of localized cable defects.
Furthermore, signals inherently experience attenuation during transmission through cables. The amplitude of defect reflection signals progressively diminishes with increasing cable length, which makes the defect reflection peaks in the latter sections of long cables susceptible to being obscured by background noise, thereby complicating their effective identification. In contrast, for short cables where the distance between defects is minimal and characteristic signals are more subtle, algorithms must demonstrate higher frequency-domain resolution. This enhancement is essential to facilitate effective differentiation between adjacent defects and to ensure accurate extraction of fine features.
Differences in cable voltage ratings lead to fundamental variations in their structural design and operational electromagnetic environments. Compared to 35 kV medium-voltage cables, 110 kV high-voltage cables exhibit more intricate structures, such as cross-interconnected grounding configurations, and operate within significantly stronger environments of electromagnetic interference: On one hand, cross-interconnected structures alter signal transmission paths, introducing more complex reflection and refraction components into frequency-domain signals and substantially increasing the complexity of frequency-domain analysis; on the other hand, strong electromagnetic interference in high-voltage environments injects significant interference components into signals, further compromising the accuracy of defect identification.
Given the significant differences in signal transmission characteristics, structural complexity, and electromagnetic environments among cables of varying lengths and voltage ratings, systematically analyzing the technical properties of the FFT and IFFT methods and clarifying their applicable scenarios under different cable operating conditions is of great engineering significance for improving the practical application effectiveness of FDR. This study conducts a comparative analysis of the FFT and IFFT methods. This paper provides a comparative analysis of two technical approaches at a fundamental level, emphasizing their respective inherent advantages. Through the presentation of on-site measurement results, it further investigates the variations in various detection parameters under differing operational conditions. The analysis elucidates the applicable testing scenarios for each method.
2. Basic Principles of FDR
2.1. Input Characteristics of Cables
Based on transmission line theory, when the signal wavelength is much longer than the physical length of the cable, the cable can be analyzed using an equivalent distributed parameter model, as shown in Figure 1 [13,14]. Here, R is the resistance per unit length (Ω/m), L is the inductance per unit length (H/m), G is the conductance per unit length (S/m), C is the capacitance per unit length (F/m), and is the unit length (m), with all distributed parameters varying with frequency.
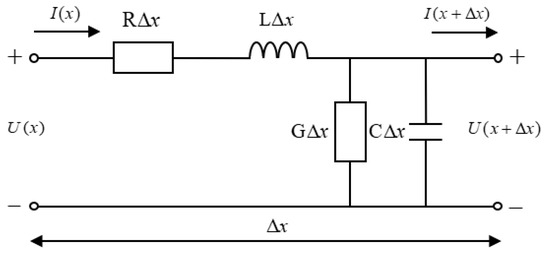
Figure 1.
Cable distributed parameter model.
It should be noted that the distributed parameter model shown in Figure 1 is a simplified power transmission line model adopted to clearly reveal the core principle of the frequency domain reflectometry. In actual engineering, single-core power cables often operate in a three-phase transmission system, and to suppress the circulating current loss in the shielding layer, designs such as cross-interconnection are often adopted. This makes the equivalent circuit of the cable need to consider complex factors such as multi-conductor electromagnetic coupling and stray parameters between the shielding layer and the main insulation, which are significantly different from the simplified model in Figure 1. Despite this, this simplified model remains an important foundation for analyzing the core issues of the frequency domain reflectometry—it strips away the complex coupling factors in engineering, focusing on the “essential laws of signal reflection and transmission in the frequency domain in the transmission line”, providing a clear physical and mathematical framework for subsequent understanding of the method’s principle and derivation of key formulas, and is a necessary prerequisite for theoretical research and engineering application expansion of such methods.
For the cable structure illustrated in Figure 1, the input impedance at a distance x from the cable’s sending end can be expressed as [15]:
where is the characteristic impedance of the cable, is the load reflection coefficient of the cable, is the propagation coefficient of the cable, and is the total length of the cable. , , and respectively denote [16]:
where is the load impedance at the cable end, is the angular frequency of the signal source, is the attenuation constant (), and is the phase shift constant ().
From Equations (1) and (3), the reflection coefficient at a distance of x from the cable’s front end can be derived as [17]:
When in Equations (1) and (5), the input impedance and reflection coefficient at the cable’s front end, respectively, can be obtained:
When a cable contains a localized defect, the signal undergoes refraction and reflection at the defect location, as shown in Figure 2 [18]. This causes a change in the . Assuming the distance from the front end to the localized defect is d, the additional component of the induced by the defect is:
where is the characteristic impedance of a local defect at a distance from the cable’s sending end.
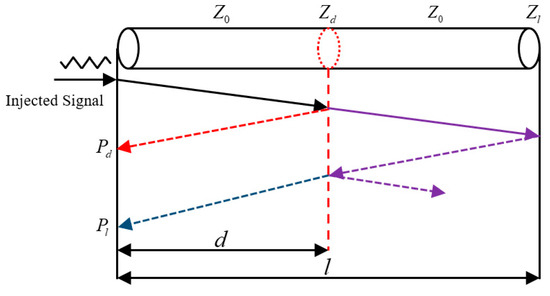
Figure 2.
Schematic diagram of incident signal propagation. The black line represents the incident signal without being reflected or refracted. The purple dotted line represents the signal reflected at the end of the cable and at the defect. The red dotted line represents the signal reflected only at the defect. The blue dotted line represents the signal reflected only at the end of the cable when there is no defect.
From Equations (7) and (8), it is evident that the is related to and . Simultaneously, according to transmission line theory, the and the can be converted into each other. Therefore, both the Broadband Impedance Spectrum (BIS) and Reflection Coefficient Spectrum (RCS) of the cable contain information about the location and type of localized defects, laying the theoretical foundation for the FDR method.
2.2. Basic Principles of IFFT
Since the RCS is comprised entirely of frequency-domain data, the IFFT—a widely utilized technique for time-domain signal recovery—can be applied in the process of signal processing [19,20,21]. The principle involves multiplying the by an analog time-domain excitation signal, enabling defect localization based on the time-domain impulse response at impedance mismatch points. To suppress the influence of the Gibbs phenomenon, a Gaussian pulse signal is typically selected as the time-domain excitation signal, whose time-domain function is expressed as [22]:
where is the maximum amplitude of the Gaussian signal, is the time shift of the signal, and relates to the pulse width. Since and have no effect on the amplitude-frequency characteristics of the pulse, this paper sets and . Different values of alter the frequency domain waveform characteristics of the Gaussian pulse signal. To ensure the spatial resolution of the localization map, must be selected based on the upper limit frequency of the test. The calculation formula is:
where is the upper limit frequency of the test, and is the ratio of the amplitude of the Gaussian pulse at the test point to its amplitude at 0 Hz. In this paper, is adopted. Since the characterizes the ratio of the reflected signal to the incident signal, the frequency-domain reflection signal can be obtained by multiplying the with the simulated time-domain signal. The time-domain signal is then retrieved via IFFT. The specific formula is as follows:
2.3. Basic Principles of FFT
As shown in Figure 2, when a cable contains a localized defect, an additional component appears in the reflection coefficient at the cable’s front end. This additional component contains information about the defect’s location and type. Therefore, effective defect information can be extracted through further analysis of Equation (7) [23,24]. Substituting Equation (4) into Equation (7) yields:
and are functions of frequency, which will be further expanded to yield:
where represents the propagation velocity of high-frequency electromagnetic waves in the cable. It should be noted that the of electromagnetic waves in cables is not a fixed value; it varies dynamically with factors such as the insulation characteristics of the cable and the test frequency. Based on the typical dielectric parameters of domestic mainstream XLPE insulated medium and high-voltage cables, the initial value of is set to 1.78 × 10⁸ in this paper. During the actual testing process, the value of is iteratively corrected by comparing the known total length recorded in the cable ledger with the test length calculated based on the initial . This process continues until the deviation between the two is controlled within the acceptable error range for the project, ensuring the accuracy of subsequent defect location.
By decomposing Equation (12) using Euler’s formula and substituting into Equation (13), it can be obtained:
From Equation (14), it can be observed that after injecting an incident signal into the cable, if is treated as the independent variable, both the real and imaginary parts of the will generate equivalent periodic components with a frequency of . This frequency corresponds precisely to the time required for the incident signal to travel from the front end to the cable’s load end and reflect back, matching the reflected wave in Figure 2.
Similarly, when a cable contains a localized defect, the incident signal is reflected at the defect location. This process introduces new periodic components into both the real and imaginary parts of , with a frequency of corresponding to the reflected wave at the defect location shown in Figure 2. By extension, after estimating the frequency of each equivalent periodic component in the real or imaginary part of the reflection coefficient, the propagation distance of each reflected wave in the FDR can be determined using the following equation:
where is the frequency of each equivalent periodic component.
To obtain the frequency of each periodic component, the real or imaginary part of the reflection coefficient can be treated as a “pseudo-time domain” signal. The new frequency component can then be estimated via Fourier transform [25]. Substituting into Equation (15) yields the localization spectrum. Since frequency-domain response data is not a full-cycle signal, spectral leakage and the fence effect occur during FFT processing—these phenomena directly impair the localization accuracy and detection sensitivity of localized cable defects. Therefore, applying a window function to preprocess the RCS during FFT can effectively mitigate spectral leakage and improve localization accuracy [26,27]. This paper uses the Kaiser autocorrelation window as an example, whose time-domain expression is:
where , is the first kind of zero-order Bessel function. is the shape parameter of the window function, is the window length, and in this paper, is adopted. When is fixed, a smaller value results in a narrower main lobe width of the window function and higher frequency resolution. However, this also increases the side lobe level, slows side lobe attenuation, and reduces suppression of spectral leakage. Therefore, must be flexibly adjusted based on actual field test conditions. In this paper, is adopted.
3. Experimental Verification
To specifically compare the fault location effectiveness of the FFT method and IFFT method in FDR, this paper evaluates the locating performance of both methods through field testing cases involving cables of different voltage levels and lengths, combined with comparisons of multiple sets of locating parameter indicators.
3.1. Parameter Indicators
To comprehensively characterize the localization performance of the two methods, the following key parameters were selected:
- Reflected peak (): Characterizes the degree of localized impedance mismatch;
- Position error (): Characterizes localization accuracy, where a smaller value indicates higher precision;
- Full Width at Half Maximum (): Characterizes the range of the detection blind zone caused by reflection peak;
- Signal-to-Noise Ratio (): Characterizes the degree of noise interference on the signal—a higher value indicates a more prominent useful signal, less noise interference, and greater facilitation of information extraction.
The calculation formulas for each parameter are as follows:
where is the measured defect location value, is the actual defect location value, and correspond to the two horizontal coordinates where the peak intensity of the reflection drops to half its value, is the average amplitude of the effective signal, and is the average amplitude of the noise. To ensure the reliability of the comparison, all experimental data were derived from RCS values obtained in the same measurement.
3.2. Field Test Results
3.2.1. 870 m Long 35 kV Cable
This section employs two methods for defect diagnosis and localization on an 870 m long 35 kV cable. The upper frequency limits of the incident signals are 20 MHz and 30 MHz, respectively. The cable connection is shown in Figure 3.
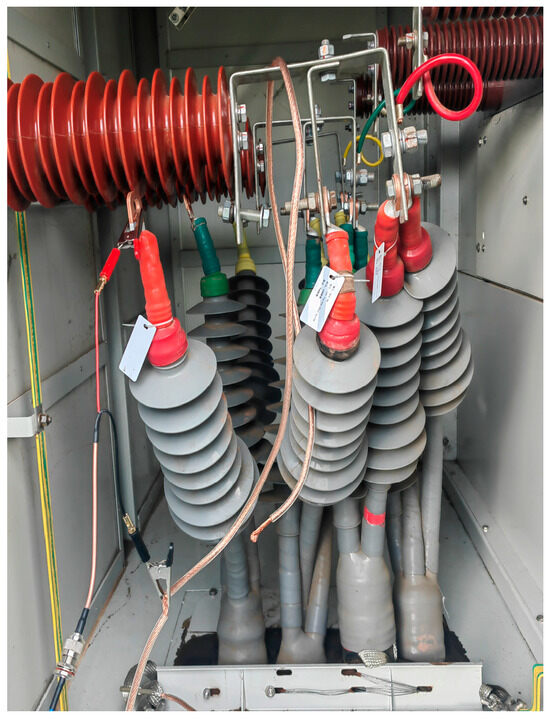
Figure 3.
Schematic diagram of 35 kV cable connection.
According to the cable ledger, the total length of the cable is approximately 870 m, with intermediate joints installed at 350 m and 680 m from the test end. The localization maps obtained from the tests are shown in Figure 4 and Figure 5, and the corresponding test parameters are detailed in Table 1 and Table 2.
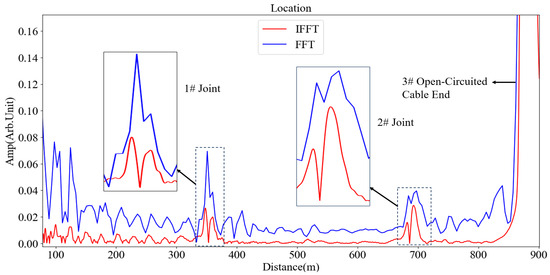
Figure 4.
Location map of 870 m long 35 kV cable (20 MHz).
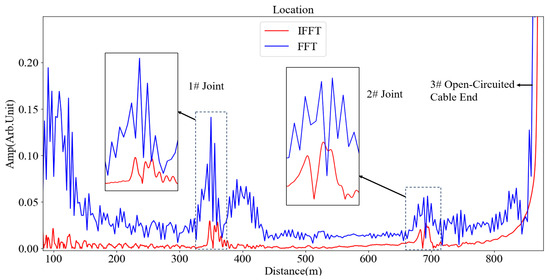
Figure 5.
Location map of 870 m long 35 kV cable (30 MHz).

Table 1.
Location parameter table for 870 m long 35 kV cable (20 MHz).

Table 2.
Location parameter table for 870 m long 35 kV cable (30 MHz).
A comparison of Table 1 and Table 2 reveals that at the same frequency: the FFT method exhibits a higher and generally smaller . The IFFT method generally demonstrates smaller FWHM and higher SNR. As the upper test frequency increases, all parameter indicators of the FFT method deteriorate, with the exception of an increase in . For the IFFT method, SNR and FWHM show a downward trend, while the remaining parameter indicators remain stable.
3.2.2. 3400 m Long 35 kV Cable
This section applies two methods to defect diagnosis and localization on a 3400 m long 35 kV cable. The upper frequency limit of the incident signal is set to 10 MHz. Due to the cable’s considerable length and numerous intermediate joints, testing at higher frequency limit yields unsatisfactory result. Thus, testing is performed at a single frequency.
According to the cable ledger, the total length of the cable is approximately 3400 m. 246 Starting from the test end, there are nine intermediate joints installed at the following lo- 247 cations: 1: 350 m, 2: 750 m, 3: 1100 m, 4: 1500 m, 5: 1900 m, 6: 2100 m, 7: 2300 m, 8: 2600 m, 9: 3000 m. The localization spectrum obtained from the test is shown in Figure 6, with test 249 parameters listed in Table 3.
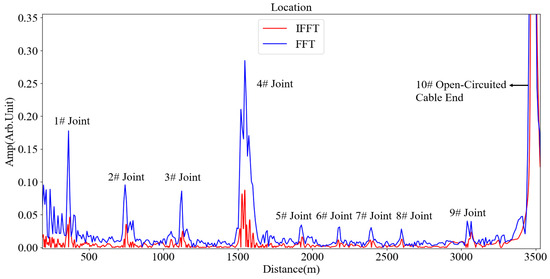
Figure 6.
Location map of 3400 m long 35 kV cable (10 MHz).

Table 3.
Location parameter table for 3400 m long 35 kV cable (10 MHz).
As shown in Table 3, at the same frequency, the FFT method yields a higher, while the IFFT method achieves a higher SNR. The and FWHM comparison results for both methods are similar, with no significant difference.
3.2.3. 970 m Long 110 kV Cable
This section uses the two methods for defect diagnosis and localization on a 970 m long 110 kV cable. The upper frequency limits of the incident signals are set to 20 MHz, 30 MHz, and 50 MHz, respectively.
According to the cable ledger, the total length of the cable is approximately 970 m. Intermediate joints are located at 300 m and 490 m, beginning from the test end. The localization spectra obtained from the tests are presented in Figure 7, Figure 8 and Figure 9. A prominent reflection peak was observed at the position of 150–155 m on the localization spectrum. Since no intermediate joint was documented at this location, it was inferred that damage to the cable insulation occurred at this point. Field verification conducted by maintenance personnel corroborated this inference, thereby validating the reliability of the test results. Detailed information regarding the test parameters can be found in Table 4, Table 5 and Table 6.
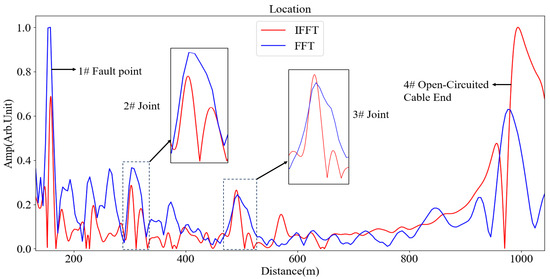
Figure 7.
Location map of 970 m long 110 kV cable (20 MHz).
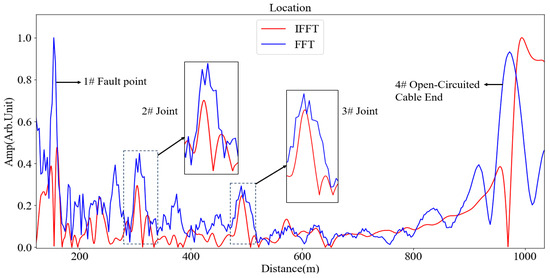
Figure 8.
Location map of 970 m long 110 kV cable (30 MHz).
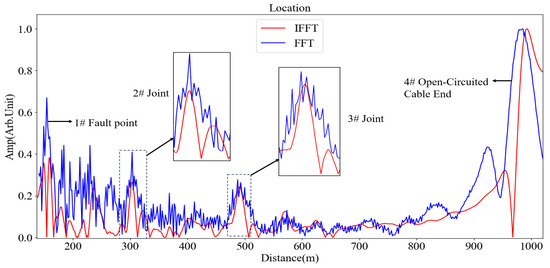
Figure 9.
Location map of 970 m long 110 kV cable (50 MHz).

Table 4.
Location parameter table for 970 m long 110 kV cable (20 MHz).

Table 5.
Location parameter table for 970 m long 110 kV cable (30 MHz).

Table 6.
Location parameter table for 970 m long 110 kV cable (50 MHz).
A comparison of Table 4, Table 5 and Table 6 shows that at the same frequency: the FFT method yields a higher and smaller ; the IFFT method exhibits a higher SNR; and the FWHM of both methods is comparable. As the upper test frequency increases: the overall performance indicators of the FFT method show a downward trend; for the IFFT method, while SNR also decreases, the other parameter indicators exhibit no significant degradation.
4. Discussion
4.1. Comparative Advantages Based on Core Detection Parameters
4.1.1. Reflected Peak
The reflected peak serves as a metric for assessing the severity of local impedance changes within the cable. Elevated values indicate enhanced sensitivity to impedance mismatches, thus facilitating the detection of minute anomalies. Based on measurement data, at an identical test frequency, it has been observed that the reflection peak values obtained using the FFT method are generally superior to those derived from the IFFT method. This demonstrates a notable advantage in identifying variations in impedance.
For instance, during a 20 MHz test conducted on an 870 m long 35 kV cable, as shown in Figure 4, the FFT peak value recorded at Joint 1# was significantly higher (0.070) compared to that of IFFT (0.026). Similarly, in another 20 MHz assessment involving a 970 m long 110 kV cable, as shown in Figure 7, the FFT peak measured at the defect point reached 1.000, surpassing IFFT’s corresponding value of 0.687.
Although IFFT yielded lower peak values than FFT generally did exhibit greater stability: within this same frequency range examined above concerning Joint 1# of the same length cable tested earlier, as shown in Figure 4 and Figure 5—a marginal increase occurred where IFFT’s peaks ascended only slightly from an initial reading of 0.026 up through 0.029—this showed no significant fluctuation ensuring reliable detection outcomes across varying frequencies.
The FFT effectively captures the equivalent periodic frequency components by interpreting the reflection coefficient spectrum as a “pseudo-time-domain signal” and directly transforming it into the frequency domain. This approach more comprehensively preserves the frequency characteristics associated with local impedance mismatches, resulting in generally elevated reflection peaks. The IFFT operates by first multiplying the reflection coefficient spectrum by a Gaussian pulse—serving as the time-domain excitation signal—prior to reconstructing the time-domain signal. The filtering effect of this Gaussian pulse in the frequency domain attenuates high-frequency reflection signals, which typically leads to lower peak values compared to those obtained through the FFT method.
4.1.2. Position Error
Position error indicates the deviation between the detected defect location and its actual position. A smaller value signifies higher positioning accuracy, serving as a critical metric for assessing a method’s capability to precisely locate defects. In low-frequency scenarios with an upper test frequency limit of ≤20 MHz, the FFT method exhibits reduced position errors and marked accuracy advantages: For instance, in a 20 MHz test on an 870 m long 35 kV cable, as shown in Figure 4, the FFT position error at the end of Cable 3# was significantly lower (0.06%) compared to that obtained using IFFT (0.90%); similarly, in another 20 MHz test involving a 970 m long 110 kV cable, as shown in Figure 7, the FFT error at Joint 3# was also lower (0.23%) than IFFT’s result (1.57%).
However, the FFT method exhibits a sensitivity to high-frequency noise, resulting in significantly increased errors under high-frequency scenarios. For instance, in a test conducted at 30 MHz, as shown in Figure 5, the position error measured using FFT at the Joint 2# of an 870 m cable was recorded at 1.51%, which is more than double that obtained with the IFFT, which was only 0.70%. Furthermore, at a frequency of 50 MHz, as shown in Figure 9, the accuracy advantage of FFT for identifying defects in 110 kV cables nearly diminished entirely.
The IFFT method exhibits remarkable stability across the entire frequency spectrum, showing minimal fluctuations in positional error at varying frequencies. Specifically, for the Joint 2# of a 35 kV cable tested at frequencies of 20 MHz and 30 MHz, as shown in Figure 4 and Figure 5, the IFFT errors recorded were 0.68% and 0.70%, respectively. In the case of the defect point on a 110 kV cable, as shown in Figure 7, Figure 8 and Figure 9, the IFFT error remained consistently stable within the range of 0.12% to 0.32% as the frequency increased from 20 MHz to 50 MHz.
From a theoretical perspective, the fundamental distinction between the two methods lies in their respective positioning logic and its adaptability to low-frequency signal characteristics, combined with IFFT’s inherent precision loss in this frequency range. FFT relies on direct “frequency-distance” mapping, which is particularly effective at low frequencies where signals exhibit longer periods, thus more readily satisfying its assumption of whole-cycle sampling. This characteristic significantly mitigates spectral leakage, enabling accurate extraction of defect-corresponding characteristic frequencies. IFFT employs a “time-delay-distance” localization logic. At lower frequencies, Gaussian pulses manifest greater pulse widths, leading to a reduction in the “time resolution” of time-domain reflection peaks. Moreover, the reconstruction process for IFFT consists of two sequential steps: “frequency-domain filtering followed by time-domain conversion.” This extended signal processing chain allows minor noise or computational errors to accumulate over time, resulting in slightly higher positional errors when compared to FFT.
4.1.3. Full Width at Half Maximum
Full width at half maximum serves as a metric for the “width” of a reflection peak. A smaller FWHM value signifies a narrower detection blind zone, which facilitates more accurate defect localization and reduces the likelihood of misjudgments arising from overlapping defect positions. At lower frequencies, the FFT method demonstrates reduced FWHM at specific detection points. For instance, in a 20 MHz test conducted on an 870 m long 35 kV cable, as shown in Figure 4, the FWHM observed using FFT at Joint 1# (13.5 m) is lower than that obtained with the IFFT, which measures 18.2 m.
At higher frequencies, there is a marked increase in the FWHM associated with the FFT method, resulting in an expanded range of detection blind zones: during a 30 MHz test on Joint 2# of the same 870 m cable, as shown in Figure 5, the FWHM reported for FFT (34.9 m) was approximately 1.8 times greater than that for IFFT (18.7 m). Similarly, as shown in Figure 9, at 50 MHz testing for Joint #3 of a separate 110 kV cable revealed that FFT’s FWHM (36.5 m) remained larger than that recorded via IFFT (17.8 m).
The IFFT method consistently maintains smaller and more stable FWHMs across diverse scenarios—demonstrating noteworthy advantages in managing detection blind zones: for example, regarding Joint 2# of the aforementioned 35 kV cable, as shown in Figure 4 and Figure 5, IFFT yielded an FWHM measurement of 18.1 m at 20 MHz and slightly increased to 18.7 m when tested at 30 MHz. Additionally, as shown in Figure 6, evaluation of Joint #8 on another extensive cable measuring 3400 m showed considerably lower performance for IFFT’s FWHM (15.3 m) compared to its counterpart derived from FFT analysis (21.1 m).
The FWHM of FFT is influenced by the resolution in the frequency domain, which is closely related to both the number of signal sampling points and the parameters of the window function. During processing, spectral leakage leads to an increase in peak width at specific frequencies; this leakage effect becomes more pronounced at higher frequencies, resulting in peak broadening and a corresponding rise in FWHM. The FWHM of the IFFT is influenced by the pulse width of the Gaussian pulse and can be controlled by testing the upper limit of the frequency band. The stability of pulse width directly contributes to ensuring the sharpness of reflections observed in the time-domain peaks.
4.1.4. Signal-to-Noise Ratio
The SNR quantifies the proportion of useful signal to noise, with higher values indicating greater resistance to interference. Additionally, the frequency dependence of the SNR highlights the method’s adaptability across various test frequencies—specifically, its capacity to maintain stable parameters across both high and low frequency bands. While elevated frequencies improve frequency resolution, they also introduce high-frequency noise, necessitating a careful balance between enhancing resolution and ensuring stability against noise.
The FFT method exhibits commendable parameter performance within the low-frequency spectrum. In tests conducted at 20 MHz, as shown in Figure 4, the SNR for an 870 m cable using FFT reached 21.56 dB, facilitating clear identification of reflection peaks. But FFT performance deteriorates markedly at elevated frequencies: as frequency increases from 20 MHz to 50 MHz, as shown in Figure 7, Figure 8 and Figure 9, the SNR for a 110 kV cable utilizing FFT declines from 30.64 dB to 19.53 dB. This drop leads to greater variability in positioning errors and a substantial increase in FWHM, which hampers effective exploitation of high frequencies for resolution enhancement.
The IFFT method demonstrates superior stability at high frequencies: within the same frequency range examined earlier, as shown in Figure 7, Figure 8 and Figure 9, the SNR for a 110 kV cable employing IFFT decreased from 34.05 dB to only 25.18 dB—representing merely half of what was observed with FFT degradation. Furthermore, critical parameters such as FWHM and position error revealed no significant deterioration under IFFT application. During testing at 50 MHz, as shown in Figure 9, IFFT exhibited minimal differences in FWHM (24.6 m) and position error (0.12%) compared to results obtained at lower frequencies, demonstrating an overall adaptability that significantly surpasses that of FFT.
FFT design without active anti-interference measures directly applies windowed transformations to the reflection coefficient spectrum. In the frequency domain, high-frequency electromagnetic noise overlaps with the useful signal’s frequency components. Additionally, spectral leakage exacerbates the confusion between noise and useful signals, resulting in a diminished SNR. This issue is particularly pronounced at higher frequencies. The IFFT incorporates an inherent anti-interference mechanism within its signal processing framework. The frequency-domain filtering characteristics of Gaussian pulses can effectively suppress some high-frequency noise. As a result, the overall SNR is enhanced, demonstrating greater adaptability to variations in frequency.
4.2. Analysis of Method Adaptability Based on Scenario Characteristics
4.2.1. Low-Noise or Short-Range Scenarios
Scenarios such as laboratory calibration, well-shielded cable trenches or distribution rooms, and short-length cable testing are characterized by low environmental interference—detection requirements primarily focus on high positioning accuracy and sensitivity to micro-defects. In low-noise environments, the FFT method can fully leverage its advantages in high sensitivity and precision. At short distances, the performance gap between the FFT and IFFT methods is particularly pronounced, allowing the FFT method to maximize its accuracy benefits. Although the IFFT method offers better anti-interference capability, this advantage becomes irrelevant in low-noise scenarios; moreover, its sensitivity and precision are slightly inferior to those of the FFT method, providing no additional value. Therefore, the FFT method is the preferred choice for such scenarios.
4.2.2. High-Noise Scenarios
Scenarios with strong electromagnetic interference—such as outdoor direct-buried cables or industrial environments containing motors or frequency converters—are characterized by noise that easily masks useful signals. Detection requirements in these scenarios prioritize anti-interference capability and stability. The IFFT method generally achieves a higher SNR, effectively suppressing noise interference and preventing reflection peak blurring. Even under severe interference, the IFFT method maintains stable FWHM and position accuracy, ensuring reliable localization results. In contrast, the FFT method exhibits a lower SNR: signals are susceptible to interference in high-noise conditions, and the localization spectrum is prone to distortion, leading to positioning errors. Therefore, the IFFT method is the preferred choice for high-interference scenarios.
4.2.3. High-Frequency Testing Scenarios
In scenarios requiring enhanced spatial resolution through increased testing frequency, such as detecting dense defects, the detection demand emphasizes balancing high-frequency resolution with noise immunity, as higher frequencies tend to introduce high-frequency noise. The IFFT method exhibits strong stability at high frequencies: the localization blind zone shows a decreasing trend, and position errors fluctuate minimally. Although SNR slightly decreases, core positioning parameters show no significant degradation. The IFFT method can effectively utilize high frequencies to enhance resolution while avoiding the spectral distortion issues inherent in the FFT method. Therefore, the IFFT method is the preferred choice for high-frequency testing scenarios.
4.2.4. Long-Range Scenarios
As cable length increases, the combined effects of signal attenuation and noise accumulation become increasingly pronounced. Detection requirements in these scenarios prioritize positioning stability and anti-attenuation capability to prevent positioning errors caused by signal degradation. The IFFT method maintains a high SNR over long distances, effectively countering signal attenuation and noise interference. Although its position errors and FWHM slightly increase, the performance gap with the FFT method narrows—and its anti-interference advantage persists, preventing localization failures in long-length cables. The FFT method can still be used for coarse localization under extremely low-noise conditions; however, its accuracy advantage diminishes significantly over long distances, resulting in overall adaptability lower than that of the IFFT method. Therefore, the IFFT method is the preferred choice for long-length cable scenarios.
4.2.5. Multi-Voltage Batch Testing Scenarios
When simultaneously testing cables of varying voltage levels or lengths, the primary objectives are versatility and efficiency. Specifically, there is a need to minimize the frequency of adjustments to test conditions in order to enhance the efficiency of batch testing. The IFFT method exhibits consistent parameter performance across different operating conditions, with low dependence on test parameters; during batch testing, it features low operational complexity and high efficiency. In contrast, the FFT method shows significant parameter fluctuations under varying conditions, requiring frequent adjustments to the window function’s shape parameter or frequency range. It lacks versatility and yields low batch testing efficiency. Therefore, the IFFT method is the preferred choice.
5. Conclusions
This paper conducts a comparative analysis of the localization performance between two commonly used methods in FDR, specifically the FFT method and the IFFT method, using both theoretical analysis and practical field application cases and drawing the following key conclusions:
- The FFT method demonstrates enhanced sensitivity and improved positional accuracy, rendering it particularly advantageous for precise detection in low-interference environments or short-distance cables;
- The IFFT method is characterized by a narrower location blind zone and enhanced stability, rendering it suitable for environments with strong interference, high-resolution requirements, or fault detection in long-distance cables;
- The selection of the upper test frequency plays a crucial role in the performance of FDR detection. As the upper test frequency increases, electromagnetic noise interference becomes significantly more pronounced, leading to a reduction in the SNR of the detection system. Simultaneously, signal attenuation within the cable accelerates, effectively shortening the detection range while concurrently improving frequency domain resolution.
Author Contributions
Conceptualization, W.Z. and B.H.; methodology, J.L.; software, T.H.; validation, J.L., T.H. and L.Z.; formal analysis, W.Z.; investigation, B.H.; resources, S.H.; data curation, W.Z.; writing—original draft preparation, J.L.; writing—review and editing, T.H.; visualization, B.H.; supervision, W.Z.; project administration, W.Z.; funding acquisition, B.H. All authors have read and agreed to the published version of the manuscript.
Funding
This research was funded by Digital Grid Research Foundation of China Southern Power Grid, grant number DPGCSG-2024-KF-41.
Data Availability Statement
Dataset available on request from the authors. Some of the test data are from joint experiments conducted by third-party testing institutions. According to the agreement of the cooperation, the data can only be used for the publication of this research result and shall not be publicly disseminated without authorization. The author needs to verify the research purpose of the user (such as non-commercial academic research) when receiving the request to ensure compliance with the data authorization terms and avoid infringement risks.
Conflicts of Interest
Authors Wenbo Zhu, Baojun Hui, Linjie Zhao and Shuai Hou were employed by the company CSG Electric Power Research Institute Co., Ltd. The remaining authors declare that the research was conducted in the absence of any commercial or financial relationships that could be construed as a potential conflict of interest.
Abbreviations
The following abbreviations are used in this manuscript:
| FDR | Frequency Domain Reflectometry |
| FFT | Fast Fourier Transform |
| IFFT | Inverse Fast Fourier Transform |
| FWHM | Full Width at Half Maximum |
| SNR | Signal-to-noise Ratio |
| IR | Insulation Resistance |
| VLF-tanδ | Very Low Frequency Dielectric Loss |
| PD | Partial Discharge |
References
- Furse, C.M.; Kafal, M.; Razzaghi, R.; Shin, Y.-J. Fault Diagnosis for Electrical Systems and Power Networks: A Review. IEEE Sens. J. 2020, 21, 888–906. [Google Scholar] [CrossRef]
- Panahi, H.; Zamani, R.; Sanaye-Pasand, M.; Mehrjerdi, H. Advances in Transmission Network Fault Location in Modern Power Systems: Review, Outlook and Future Works. IEEE Access 2021, 9, 158599–158615. [Google Scholar] [CrossRef]
- Li, J.; Li, Y.; Han, T.; Zheng, Z.; Zhu, W.; Du, B. Identification of Reflection Peaks in Multiparameter Constrained Based on Frequency Domain Reflection Method. In Proceedings of the 2025 IEEE 5th International Conference on Electrical Materials and Power Equipment (ICEMPE), Harbin, China, 3–6 August 2025. [Google Scholar]
- Zhang, Q.; Sorine, M.; Admane, M. Inverse Scattering for Soft Fault Diagnosis in Electric Transmission Lines. IEEE Trans. Antennas Propag. 2011, 59, 141–148. [Google Scholar] [CrossRef]
- McKinnon, D.L. Insulation Resistance Profile (IRP) and its use for assessing insulation systems. In Proceedings of the 2010 IEEE International Symposium on Electrical Insulation, San Diego, CA, USA, 6–9 June 2010. [Google Scholar]
- Kim, D.; Cho, Y.; Kim, S.-M. A study on three dimensional assessment of the aging condition of polymeric medium voltage cables applying very low frequency (VLF) tan δ diagnostic. IEEE Trans. Dielectr. Electr. Insul. 2014, 21, 940–947. [Google Scholar] [CrossRef]
- Cao, J.; Chen, J.; Gang, L.; Xiao, T.; Li, C.; Libin, H.; Zhifeng, X. Study on Optimization of Withstand Voltage Test for Long-Distance Power Cable Multi-Resonance System. In Proceedings of the 2018 International Conference on Power System Technology (POWERCON), Guangzhou, China, 6–8 November 2018. [Google Scholar]
- Eigner, A.; Rethmeier, K. An overview on the current status of partial discharge measurements on AC high voltage cable accessories. IEEE Electr. Insul. Mag. 2016, 32, 48–55. [Google Scholar] [CrossRef]
- Zhou, Z.; Zhang, D.; He, J.; Li, M. Local degradation diagnosis for cable insulation based on broadband impedance spectroscopy. IEEE Trans. Dielectr. Electr. Insul. 2015, 22, 2097–2107. [Google Scholar] [CrossRef]
- Zhang, J.; Zhang, Y.; Guan, Y. Analysis of Time-Domain Reflectometry Combined with Wavelet Transform for Fault Detection in Aircraft Shielded Cables. IEEE Sens. J. 2016, 16, 4579–4586. [Google Scholar] [CrossRef]
- Potivejkul, S.; Kerdonfag, P.; Jamnian, S.; Kinnares, V. Design of a low voltage cable fault detector. In Proceedings of the 2000 IEEE Power Engineering Society Winter Meeting, Singapore, 23–27 January 2000. [Google Scholar]
- Li, S.; Gu, B.; Zhu, X.; Li, H.; Deng, J.; Zhang, G. High impedance grounding fault location method for power cables based on reflection coefficient spectrum. Energy Rep. 2023, 9, 576–583. [Google Scholar] [CrossRef]
- Fritsch, M.; Wolter, M. Transmission Model of Partial Discharges on Medium Voltage Cables. IEEE Trans. Power Deliv. 2022, 37, 395–404. [Google Scholar] [CrossRef]
- Arabi, T.B.; Sarkar, T.K. Analysis of Multiconductor Transmission Lines. In Proceedings of the 31st ARFTG Conference Digest, New York, NY, USA, 24 May 1988. [Google Scholar]
- Mo, S.; Zhang, D.; Li, Z.; Wan, Z. The Possibility of Fault Location in Cross-Bonded Cables by Broadband Impedance Spectroscopy. IEEE Trans. Dielectr. Electr. Insul. 2021, 28, 1416–1423. [Google Scholar] [CrossRef]
- Li, Y.; Li, W.; Yao, Y.; Li, Q.; Han, T. Cable Defects Location Method Based on M-sequence with Broadband Impedance Spectroscopy. In Proceedings of the 2024 IEEE 5th International Conference on Dielectrics (ICD), Toulouse, France, 30 June–4 July 2024. [Google Scholar]
- Li, J.; Li, Y.; Han, T.; Zheng, Z.; Zhu, W.; Du, B. Cable Aging Type Identification Method Based on Frequency Domain Reflection and Multilayer Perceptron. In Proceedings of the 2025 IEEE 5th International Conference on Electrical Materials and Power Equipment (ICEMPE), Harbin, China, 3–6 August 2025. [Google Scholar]
- Zhou, K.; Tang, Z.; Meng, P.; Huang, J.; Xu, Y.; Rao, X. A Novel Method for Sign Judgment of Defects Based on Phase Correction in Power Cable. IEEE Trans. Instrum. Meas. 2024, 73, 3500509. [Google Scholar] [CrossRef]
- Zhou, G.; Liu, Z.; Zhou, K.; Wang, Z.; Lu, L.; Li, Y. A Novel Dampness Diagnosis Method for Distribution Power Cables Based on Time-Frequency Domain Conversion. IEEE Trans. Instrum. Meas. 2022, 71, 3510609. [Google Scholar] [CrossRef]
- Ohki, Y.; Hirai, N. Comparison of location abilities of degradation in a polymer-insulated cable between frequency domain reflectometry and line resonance analysis. In Proceedings of the 2016 IEEE International Conference on High Voltage Engineering and Application (ICHVE), Chengdu, China, 19–22 September 2016. [Google Scholar]
- Yamada, T.; Hirai, N.; Ohki, Y. Improvement in sensitivity of broadband impedance spectroscopy for locating degradation in cable insulation by ascending the measurement frequency. In Proceedings of the 2012 IEEE International Conference on Condition Monitoring and Diagnosis, Bali, Indonesia, 23–27 September 2012. [Google Scholar]
- Han, T.; Yao, Y.; Li, Q.; Huang, Y.; Zheng, Z.; Gao, Y. Locating Method for Electrical Tree Degradation in XLPE Cable Insulation Based on Broadband Impedance Spectrum. Polymers 2022, 14, 3785. [Google Scholar] [CrossRef] [PubMed]
- Tang, Z.; Zhou, K.; Xu, Y.; Meng, P.; Zhang, H.; Wu, Y. A Reflection Coefficient Estimation Method for Power Cable Defects Based on Three-Point Interpolated FFT. IEEE Trans. Instrum. Meas. 2024, 73, 3505508. [Google Scholar] [CrossRef]
- Huang, J.; Zhou, K.; Zhao, Q.; Xu, Y.; Meng, P.; Yuan, H. Diagnosis and Localization of Moisture Defects in HV Cable Water-Blocking Buffer Layer Based on Characteristic Impedance Variation. IEEE Trans. Dielectr. Electr. Insul. 2024, 31, 3322–3330. [Google Scholar] [CrossRef]
- Tang, Z.; Zhou, K.; Xu, Y.; Meng, P.; Li, Y.; Zhang, H. A Segment Insulation Diagnosis Method of Power Cable Based on Attenuation Coefficient in Frequency Domain. IEEE Trans. Dielectr. Electr. Insul. 2025, 32, 717–724. [Google Scholar] [CrossRef]
- Yao, W.; Teng, Z.; Tang, Q.; Gao, Y. Measurement of power system harmonic based on adaptive Kaiser self-convolution window. IET Gener. Transm. Distrib. 2016, 10, 390–398. [Google Scholar] [CrossRef]
- Fan, G.; Zhu, Y.; Yan, H.; Gao, Y. Fault Location Scheme for Transmission Lines Using Kaiser Self-Convolution Windowed FFT Phase Comparison. Appl. Mech. Mater. 2014, 596, 659–663. [Google Scholar] [CrossRef]
Disclaimer/Publisher’s Note: The statements, opinions and data contained in all publications are solely those of the individual author(s) and contributor(s) and not of MDPI and/or the editor(s). MDPI and/or the editor(s) disclaim responsibility for any injury to people or property resulting from any ideas, methods, instructions or products referred to in the content. |
© 2025 by the authors. Licensee MDPI, Basel, Switzerland. This article is an open access article distributed under the terms and conditions of the Creative Commons Attribution (CC BY) license (https://creativecommons.org/licenses/by/4.0/).