Abstract
Renewable energy has an important role in attaining environmental quality. Numerous studies have determined the factors driving the diminishment or promotion of renewable energy consumption (REC) globally. Despite the findings of prior studies, the specific effects of climate policy uncertainty (CPU) and global economic policy uncertainty (GEPU) on REC have not been probed in the case of BRICS economies. Furthermore, fewer considerations have been taken into account to explore whether green environmental policies (EPs) have a moderating role. Therefore, the present work contributes to filling the gap by providing an empirical model and assessing the panel quantile data and fixed-effect methods used between 2010 and 2020. The findings reveal that the expansion of the financial market, inflowing FDI, rising international remittances, developing environmental innovation, and increasing CPU are significant factors promoting REC while unfavorably increasing CO2, economic activity, and GEPU impact. Notably, the results underscore that EPs have a significant positive effect, and stricter ecological strategies lead to a rise in REC. In addition, the findings highlight that by implementing stricter EPs, the effect of CPU on REC becomes more positive, and the negative effect of GEPU on REC is more controlled. In particular, the significant interaction effects highlight that the beneficial role of EPs is more pronounced in nations with strong EPs relative to low EPs. Overall, EPs have a substantial beneficial role in promoting REC when CPU and GEPU arise. These findings are reliable after using numerous measurements and methods, and several policy recommendations are suggested to governments, policymakers, and regulatory bodies.
1. Introduction
Over the last decade, authorities and policymakers have put into place various plans and strategic activities to promote renewable energy (RE) globally. These actions include tax benefits, cheaper credits, and incentive plans aiming to encourage households to switch to RE, motivate firms to raise R&D in green energy and encourage investors to invest in RE plans to decrease climate change, reduce CO2 emissions, and also attain ecological sustainability [1,2,3,4,5]. Although these actions are useful for promoting RE [6], there is a significant USD 1.1 trillion in funds still required by 2030 to control greenhouse emissions and achieve sustainable development goals (SDGs) [7].
Because of rising worldwide climate change and diminishing air quality, the subject of green energy and RE has become a trending subject at the global level. Consequently, shifting economies from conventional fossil fuels to RE sources is the most important decision in their agendas to reduce climate change and accelerate achieving SDGs [8]. Unlike traditional energy, RE is replenishable and also has ecologically friendly advantages.
Therefore, a strand of the literature has been created essentially to investigate the factors that help promote or diminish renewable energy consumption (REC) in various countries using a demand modeling method. For instance, the findings of prior studies have revealed that capital development (e.g., [9,10,11]) promotes REC by providing easier external financing at lower costs for investors and households. Likewise, refs. [12,13] revealed that environmental innovations promote REC by increasing energy efficiency and accelerating the shift of the economy to a green country. Moreover, refs. [14,15] highlight that economic openness promotes REC by providing more availability to external financing.
Furthermore, prior works have revealed that economic activity (e.g., [16,17]) and international remittances (e.g., [18,19]) promote REC by increasing the income level of investors and households. Additionally, past works have documented that CO2 [15,17] diminishes REC. Moreover, earlier studies (e.g., [11,20,21]) have shown that green ecological strategies (EPs) promote REC by enhancing RE capacity growth. However, some works (e.g., [22,23]) have underscored how global economic policy uncertainty (GEPU) diminishes REC by decreasing investor and household income (demand side) [24] and raising investment costs in the private sector [25].
What about the determinants of REC in the BRICS countries, and which factors diminish or promote REC? Understanding this question is essential since it helps policymakers to increase the proportion of REC and help accelerate the energy transition from fossil fuels to green energy, which will eventually lead to attaining ecological sustainability. Brazil, Russia, India, China, and South Africa, which are considered BRICS, represent five massive and emerging economies in the world. Over the last decades, these economies have had outstanding economic development and endeavor to attain SDGs. For example, China applied numerous environmental strategies to encourage green energy in 2006 and 2009 and also used subsidy agendas in 2003 and 2010. This led to, for instance, China increasing its regional share of hydroelectricity production from 2.9% in 1973 to 30.1% in 2019. Also, it helped China to increase its regional share of wind electricity from 1.9% in 2005 to 28.4% in 2019 (https://www.iea.org/reports/key-world-energy-statistics-2021/supply, accessed on 1 June 2024).
Although some efforts have been made in some emerging economies to attain ecological sustainability, there are some significant challenges and problems that reduce the acceleration of the transition from traditional to green energy. For example, RE sources are not fully utilized in some nations, such as India and South Africa, and their share of fossil energy is relatively high [15]. Likewise, energy demands and carbon emissions are still soaring in developing nations, like BRICS, compared to advanced nations due to the rapid growth of energy-intensive businesses and a shortage of energy productivity (e.g., [26]). For example, China accounted for 4.7% of crude oil production regionally in 2020, which was 1.9% in 1973. In addition, the investment in RE schemes decreased to USD 15.4 B in India in 2018 and USD 91.5 B in China in 2019, leading to many RE schemes remaining uncompleted [27,28]. Therefore, BRICS is an interesting case study, and it is important to identify which determinants lead to the promotion or diminishment of REC in BRICS.
This work endeavors to answer the subsequent questions in BRICS settings: (i) What are the determinants of REC? (ii) How specifically do climate policy uncertainty (CPU) and GEPU influence REC? (iii) Do EPs have a moderating effect on CPU, GEPU, and REC?
To attain these objectives, the current research uses novel data for BRICS nations between 2010 and 2020. Likewise, this research also contributes by performing both fixed effects (FEs) and quantile panel data (PQ) techniques to find reliable results. Furthermore, unlike past work (e.g., [11,17]), the current research contributes by probing the elements of the REC in BRICS environments and by focusing mainly on the roles of CPU, GEPU, and EPS, which have not been studied deeply. We employ a novel BRICS EPS index, which uses data collected from the OECD Stat website and which is broadly used for strategy examination aimed at climate change and air pollution-lessening policies. This unique research on BRICS economies can provide findings that are valuable to the work of authorities, policymakers, and executives to upsurge the share of REC and ultimately attain SDGs.
The current research yields some important highlights. The research uncovered that the expansion of the capital market, inflowing FDI, rising international remittances, boosting environmental innovation, and rising CPU are significant drivers promoting REC. This indicates that policymakers and regulatory bodies should make external financing more accessible for investors and households. This would allow them to borrow funds at lower costs, thereby expediting the completion of renewable energy schemes. Likewise, the results denote that representatives should pay more attention to R&D development and enhance country-level competitiveness factors (e.g., private and public institution qualities, economic stability, political stability, infrastructure, and education) to expedite shifting from traditional energies to green energies and attract cross-border capital inflows. Furthermore, the findings highlight that rising CO2, economic activity, and GEPU have detrimental impacts on the REC of BRICS environments. Moreover, the findings underline that stricter EPS leads to a rise in the REC, and by implementing a stricter EPS, the impact of CPU on REC becomes more positive, and the negative impact of GEPU on REC is more controlled. The findings recommend policymakers design and implement stricter environmental policies to moderate the impact of GEPU on the REC. Policymakers, by developing effective EPS, could accelerate climate change alleviation strategies by promoting REC, particularly when CPU and GEPU arise.
2. Literature Review
A portion of energy research in the literature has focused on identifying the key factors that influence renewable energy consumption (REC) across various economies using demand modeling methods. Previous research has primarily indicated that several significant drivers impacting REC globally include capital market development, financial openness, international remittances, ecological innovation, carbon dioxide (CO2) emissions, and overall economic activity. Additionally, earlier studies have shown that global Carbon Pricing Units (CPUs) and Global Environmental Policy Units (GEPU) also play an important role in affecting REC. In the following paragraphs, we will discuss in detail how these factors are connected to REC.
2.1. Country-Level Factors
According to previous studies [11,29], the development of financial markets can facilitate the availability of external funds at lower financing costs for both investors and households, thereby promoting renewable energy commercialization (REC). A country with a well-developed capital market can expedite the implementation of renewable energy (RE) projects and enhance access to a variety of financial products and services. This, in turn, can inspire firms to increase research and development (R&D) activities in clean energy, improve ecological knowledge, and expand RE initiatives.
Additionally, earlier research [30,31] demonstrated that financial openness, characterized by the inflow of foreign capital such as foreign direct investment (FDI), provides cheaper external funds for investors and households, which can also promote REC. A nation with policies supporting financial openness can facilitate the dissemination of better management practices and greener technologies, ultimately leading to an increase in both the supply and demand for renewable energy [32].
Numerous studies (e.g., [11,19]) have shown that international remittances can increase household income levels, which, in turn, may promote renewable energy consumption (REC). As remittances flow into households, they encourage families to invest in renewable energy plans. This financial support allows them to enhance their knowledge and skills related to renewable energy and implement green systems in their homes [33].
Similarly, research by [12,13] indicates that ecological innovations, which improve energy productivity, can also promote REC. Countries with high levels of technological innovation are likely to reduce the investment costs associated with new renewable energy initiatives. This shift can help transition a nation from a traditional economy to a greener one [34,35]. As a result, such changes lead to decreased CO2 emissions and assist in achieving the Sustainable Development Goals (SDGs) [13].
Numerous studies have shown that CO2 emissions and economic activity negatively impact renewable energy consumption (REC). This can be attributed to some governments promoting fossil fuel energy through financial incentives, which lowers the price of carbon emissions and ultimately reduces REC. However, other research indicates that economic growth can promote REC, with more developed nations requiring increased energy production from both non-renewable and renewable energy (RE) sources.
Additionally, certain studies [36,37] suggest that environmental policies, such as taxes, can encourage investors and households to support REC. Research [11] has found that implementing green ecological methods can lead to an increase in REC. Countries with stricter environmental policies are likely to see enhanced growth and consumption of renewable energy capacity [21,36]. Importantly, the works by [38,39,40] indicate that the effectiveness of ecological strategies is influenced by the type of renewable energy sources utilized.
2.2. Global-Level Factors
Several studies have examined the impact of global-level factors on renewable energy consumption (REC). For example, the earlier research by [11,23] indicated that global economic policy uncertainty (GEPU) negatively affects renewable energy from both the supply and demand perspectives. An increase in GEPU tends to lower the income levels of investors and households, which, in turn, slows down the transition to a green economy in the long run [24]. Additionally, GEPU raises investment costs for the private sector, leading to a decrease in the supply of renewable energy [25].
Conversely, other studies have emphasized the significant role of global climate policy uncertainty (CPU) in stimulating both renewable energy demand and supply. For instance, research by [41,42] found that an increase in CPU encourages firms to invest more in green energy initiatives (supply side) and boosts the green energy sector supported by rising CPU. Moreover, reference [8] documented that CPU promotes REC (the demand side) in the long term. Reference [43] revealed that during extreme climate events, the causal connection between CPU and renewable energy consumption strengthens considerably. Additionally, reference [44] showed that CPU has a favorable impact on REC in the United States. A summary of the literature is presented in Table 1. Several studies have examined the impact of global-level factors on renewable energy consumption (REC). For example, the earlier research by [11,23] indicated that global economic policy uncertainty (GEPU) negatively affects renewable energy from both the supply and demand perspectives. An increase in GEPU tends to lower the income levels of investors and households, which, in turn, slows down the transition to a green economy in the long run [24]. Additionally, GEPU raises investment costs for the private sector, leading to a decrease in the supply of renewable energy [25].

Table 1.
Summary of the literature.
Several studies have identified various country-specific and global factors that influence the rise or decline of renewable energy consumption (REC) worldwide. However, the specific impacts of Consumer Price Uncertainty (CPU) and global economic policy uncertainty (GEPU) on REC, particularly within the context of BRICS nations, have not been thoroughly examined. Furthermore, there has been limited exploration into whether economic policy stability (EPS) serves as a moderator between CPU, GEPU, and REC. This study aims to address these gaps by utilizing novel panel data from emerging BRICS countries and applying the Pooled Ordinary Least Squares (POLS) and fixed effects (FE) methods for the period from 2010 to 2020.
3. Methodology
3.1. Data Description
This research examines the factors influencing renewable energy consumption (REC) in BRICS nations over the period from 2010 to 2022. However, due to data accessibility issues and inconsistencies among various databases, the final analysis is limited to the years 2010 to 2020.
Table A1 in Appendix A lists the BRICS nations and presents the average values of the key determinants for each country. According to the data, Brazil has the highest average for LnREC (3.831) and LnFDI (1.270). South Africa, on the other hand, leads in LnSMC (5.490), indicating that it has the most developed capital market. Additionally, China has the highest averages for LnTINV (12.265) and LnCO2 (16.110). It is noteworthy that Brazil has the lowest average for LnREM (−1.951), while Russia shows the highest average for LnGDPC (8.941). This research examines the factors influencing renewable energy consumption (REC) in BRICS nations over the period from 2010 to 2022. However, due to data accessibility issues and inconsistencies among various databases, the final analysis was limited to the years 2010 to 2020.
Following earlier studies, we identified the main factors that influence renewable energy consumption (REC). This study collected data on various factors, including renewable energy consumption (REC), capital market development (SMC), trade openness (FDI), remittances (REMs), technological innovation (TINV), carbon dioxide emissions (CO2), and economic output (GDP) from the World Bank. Specifically, we obtained Consumer Policy Uncertainty (CPU) and Global Economic Policy Uncertainty (GEPU) data from the policy uncertainty website.
The CPU index is constructed based on reporting terms such as “uncertainty”, “carbon dioxide”, “global warming”, and “regulation”, as mentioned in articles from eight leading U.S. newspapers. The GEPU index, on the other hand, is the GDP-weighted average of national Economic Policy Uncertainty (EPU) indices for 21 nations. Each national EPU index reflects the relative frequency of articles in local newspapers that discuss three terms: economy, policy, and uncertainty.
Furthermore, for further analysis, we selected the environmental policy stringency (EPS) index from the OECD Stat website. Additionally, we gathered data for the World Uncertainty Index (WUI) and Geopolitical Risk Index (GPR) from the policy uncertainty website. The WUI is calculated based on indices of economic uncertainty for 143 nations, employing frequency counts of the term “uncertainty” in the quarterly Economist Intelligence Unit (EIU) country reports. Similarly, the GPR is derived by counting the number of articles related to adverse geopolitical events in newspapers each month.
The explanations and sources for these elements are detailed in Table 2.
Table 2.
Factors explanations.
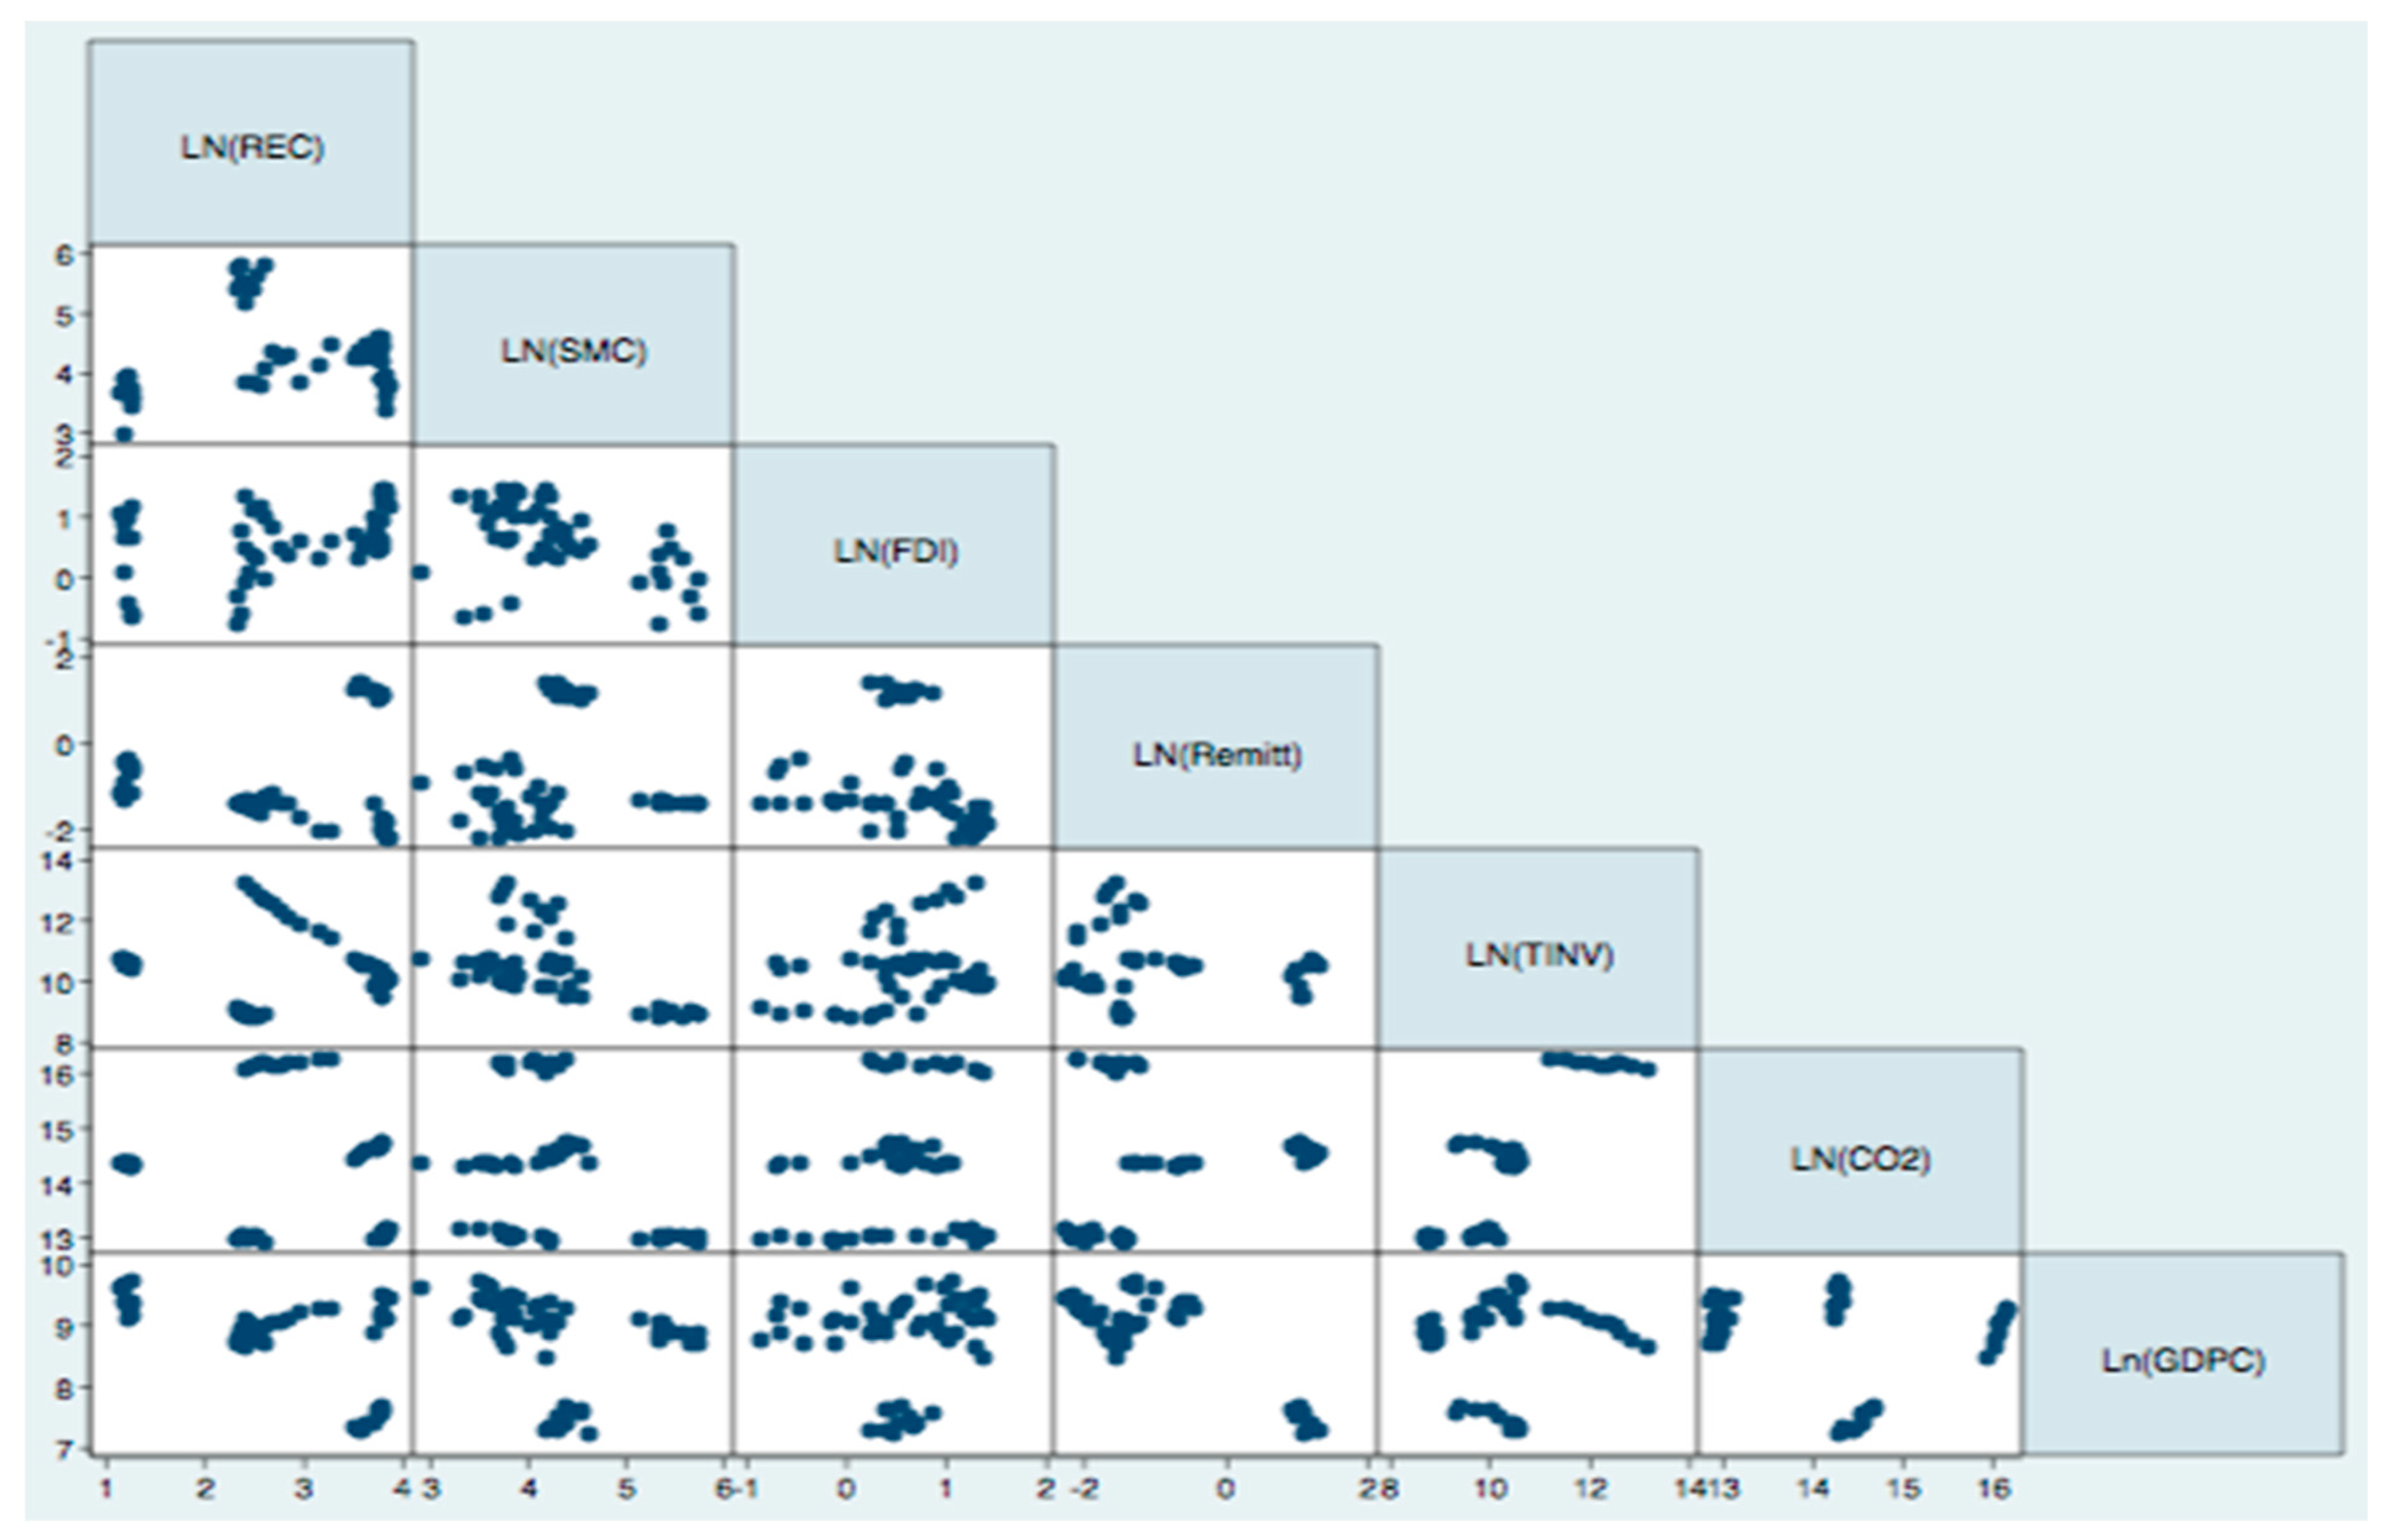
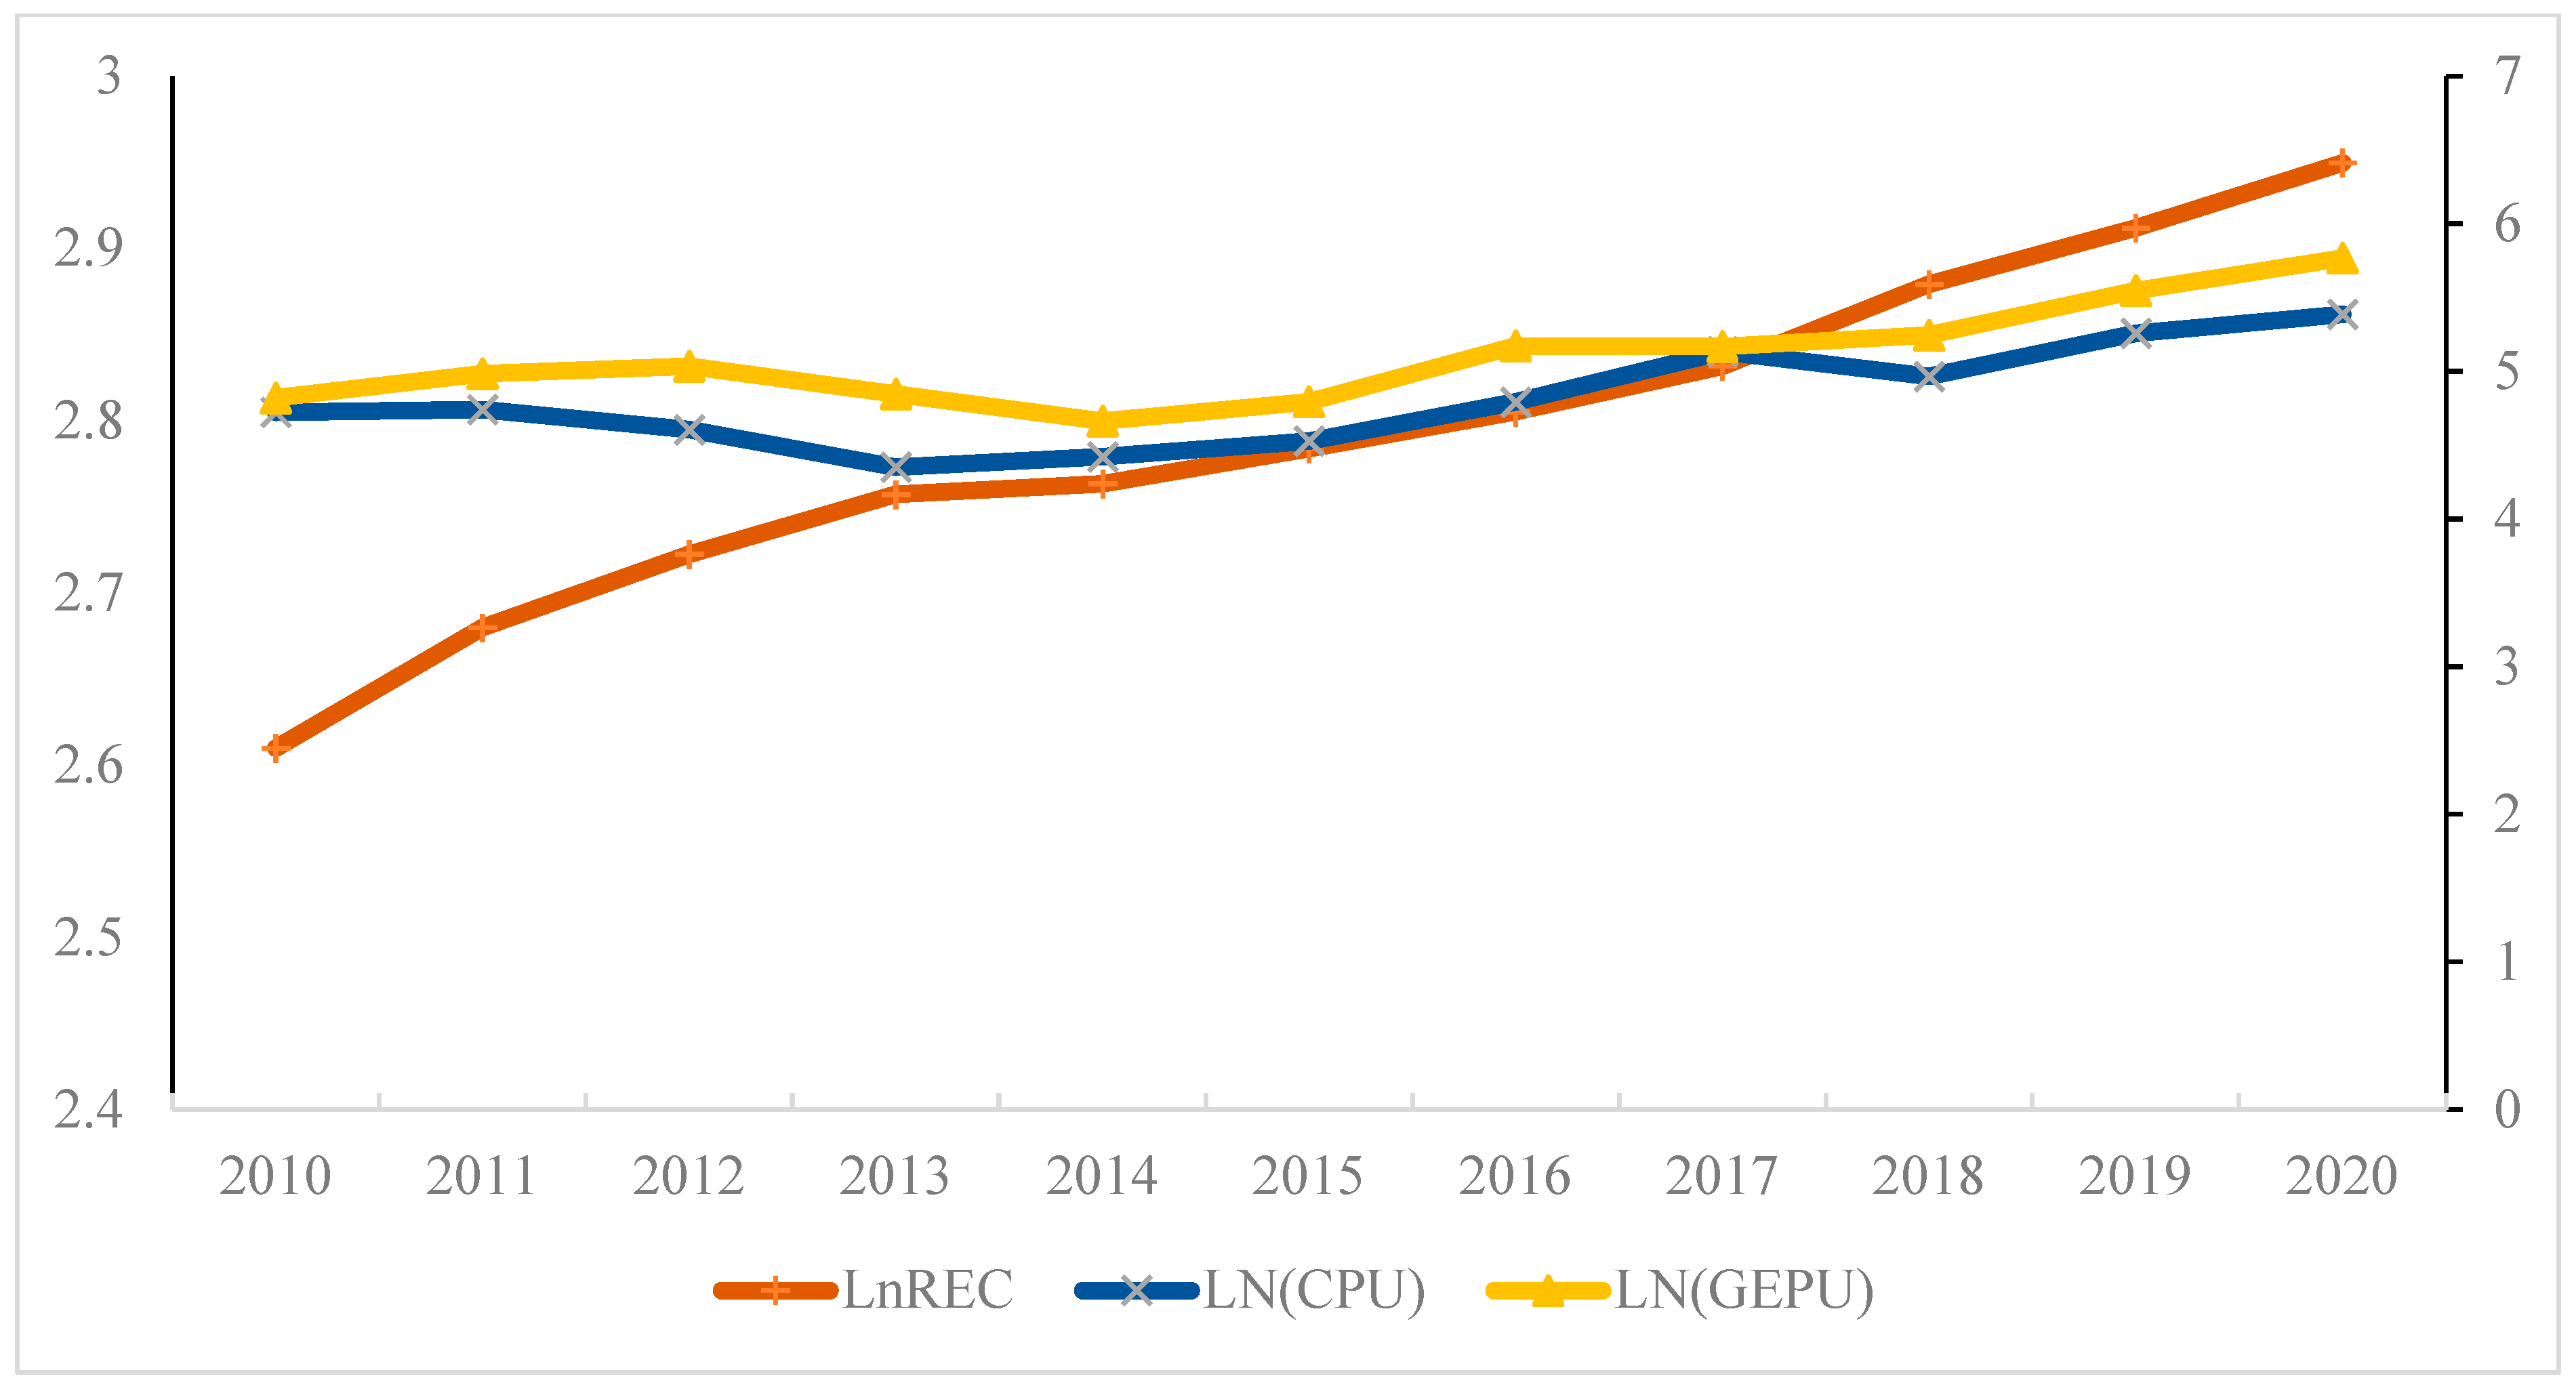
Figure 1 presents a scatterplot matrix illustrating the relationships among the determinants studied. Additionally, Figure 2 displays the time series data for REC, CPU, and GEPU within the BRICS countries from 2010 to 2020. As shown in Figure 2, there is a positive correlation between REC, CPU, and GEPU, suggesting that increases in CPU and GEPU lead to a rise in REC. Furthermore, Figure 2 indicates that REC showed a continuous increase throughout the study period, while CPU experienced a decline during the periods of 2010–2013 and 2017–2018.

Figure 1.
Scatterplot matrix.
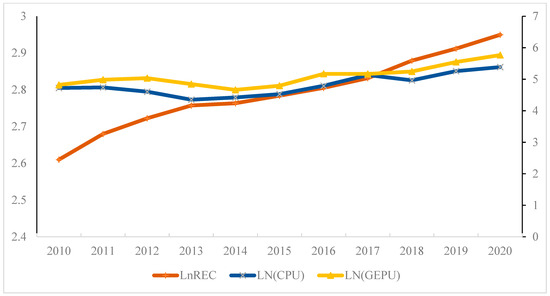
Figure 2.
Time series plot of REC, CPU, and GEPU.
Figure 3 highlights the potential impact of various factors on renewable energy consumption (REC) in BRICS countries. As illustrated, certain factors such as Structural Market Conditions (SMCs), foreign direct investment (FDI), Consumer Price Utility (CPU), remittances (REMs), and total investment (TINV) are anticipated to have a positive effect on REC. Conversely, other factors like Global Energy Policy Uncertainty (GEPU), gross domestic product growth (GDPC), and carbon dioxide emissions (CO2) may impact REC both positively and negatively. The analysis presented in Figure 3 was achieved through a series of pre-estimation tests, estimation analyses, and post-estimation tests to validate the results.
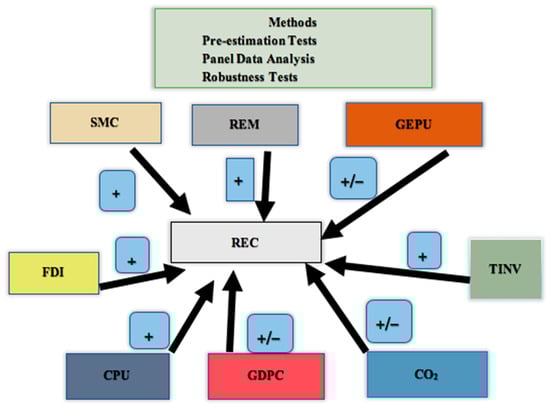
Figure 3.
Workflow of the study.
Table 3 presents the results of the correlation analysis. It indicates that there is no evidence of multicollinearity among the factors, allowing for the inclusion of all potential determinants in the model estimates. Additionally, Table 3 shows that some correlations are statistically significant at the 1% level, with both positive and negative signs. Furthermore, the Variance Inflation Factor (VIF) suggests that the estimation models do not suffer from multicollinearity, even when incorporating all possible factors.
Table 3.
Correlation analysis.
3.2. Model and Methodology
Equation (1) is employed to perform empirical analyses.
where country and time are represented correspondingly.
To mitigate the effect of outliers, the data elements are winsorized at the 1% level. Furthermore, each factor is normalized by applying the natural logarithm. In the estimation of Equation (1), we utilized the PQ method (see, e.g., [11,15,45]). This approach helps identify connections across multiple points in the distribution of the dependent variable (LnREC) for the estimation of Equation (1). Quantiles act as thresholds that divide a probability distribution into smaller, continuous intervals that each contain equal probabilities. The PQ technique allows us to understand the relationships among variables at different quantiles.
Additionally, we employed the fixed effects (FEs) approach while clustering standard errors at the country level to ensure reliable results. Studies conducted by [46,47] indicated that using the panel data methodology enhances estimation efficiency and addresses issues related to multicollinearity and heterogeneity. To mitigate the effect of outliers, the data elements are winsorized at the 1% level. Furthermore, each factor is normalized by applying the natural logarithm. For the estimation of Equation (1), we utilized the PQ method (see, e.g., [11,15,45]). This approach helped identify connections across multiple points in the distribution of the dependent variable (LnREC) for the estimation of Equation (1). Quantiles act as thresholds that divide a probability distribution into smaller, continuous intervals that each contain equal probabilities. The PQ technique allows us to understand the relationships among variables at different quantiles.
4. Univariate and Multivariate Analyses
Table 4 presents the descriptive statistics of determinants from 2010 to 2020. The average of LnCO2 is 14.190, which is the highest, with values ranging from 12.882 to 16.208. Conversely, the average of LnREM is −0.931, and the lowest average ranges from −2.227 to 1.327. Following that, LnFDI has an average of 0.597, with a range between −0.824 and 1.420.
Table 4.
Descriptive statistics (2010–2020).
Additionally, Table 4 indicates that LnREM has the lowest minimum value at −2.227, while LnCO2 has the highest maximum value at 16.208. Moreover, LnCO2 exhibits the highest variation with a standard deviation of 1.172, followed closely by LnTINV at 1.170. In contrast, LnGEPU and LnCPU display the lowest variations, with standard deviations of 0.322 and 0.327, respectively.
4.1. Multivariate Results
Before estimating the models, this study conducted cross-sectional dependence (CD) and panel unit root tests. Table 5 shows that the test values for all factors are statistically significant, indicating that any variation in one country will definitely impact the others in the sample. In the robustness section, we employed the CD post-estimation test to examine whether the estimated model encounters any dependency issues.
Table 5.
Cross-sectional dependence.
We also conducted the panel unit root test as recommended by sources [48,49] to examine the stationarity of the factors. Specifically, the suggested methods allowed us to assess the stationarity of the factors while considering both trend and cross-dependence alternatives. As shown in Panels (A) and (B) of Table 6, the variables under investigation were stationary (I(1)), indicating that the panels did not contain unit roots.
Table 6.
Panel unit root tests.
We conducted a Granger causality test to examine the possibility of reverse causality among the factors. As shown in Table 7, the F-statistics were significant at the 1%, 5%, and 10% significance levels, indicating that causality flows from LnSMC, LnFDI, LnREM, LnTINV, LnCO2, LnGDPC, LnCPU, and LnGEPU to LnREC for the BRICS economies. This suggests that reverse causality is likely to occur, and the tested model is not affected by potential endogeneity.
Table 7.
Granger causality test.
4.1.1. Estimation Results
Table 8 presents the determinants of renewable energy consumption (REC). The results indicate that the natural logarithm of Social Market Capitalization (LnSMC) has a positive effect on LnREC. However, the coefficient is statistically significant only in the 75th percentile (Q.75) at a significance level of 5% (α = 0.056) and in the 95th percentile (Q.95) at a level of 10% (α = 0.053). These findings are consistent with previous studies (e.g., [9,10,11,15]), suggesting that the development of financial markets plays a crucial role in promoting REC in BRICS economies. A well-developed financial market leads to greater availability of external financing and lower borrowing costs. As a result, investors are more likely to engage in renewable energy projects, which ultimately boosts REC and enhances ecological quality (e.g., [26,29]). Furthermore, a developed financial market encourages firms to invest more in research and development (R&D) for renewable energy initiatives, clean energy, and increasing environmental awareness, thereby contributing to higher REC in the long term.
Table 8.
The determinants of REC: the role of CPU and GEPU.
The results further highlight that foreign direct investment (LnFDI), remittances (LnREM), and total investment (LnTINV) have a positive impact on renewable energy consumption (LnREC), with statistically significant coefficients across various quantiles. Based on the estimates from the fixed effects (FEs) method, a 1% increase in FDI and TINV results in an increase of 0.06% and 0.02% in renewable energy consumption, respectively. In agreement with previous studies, these findings indicate that cross-border capital inflows play a crucial role in enhancing renewable energy consumption in BRICS economies. The openness of these economies allows for foreign capital inflows, enabling investors to access additional external funds for renewable energy projects. Furthermore, this also facilitates the transfer of improved management practices and greener skills, which contribute to the growth of renewable energy both in the host country and globally [50]. The results indicate that international remittances play a significant role in promoting renewable energy consumption (REC) in BRICS economies, which is consistent with previous studies (e.g., [11,15,19,51,52]). Increased remittances raise household income levels, enabling families to invest in renewable energy technologies and fund renewable energy initiatives more easily. This shift gradually reduces the reliance on fossil fuels while increasing the use of renewable energy sources.
Additionally, the findings suggest that technological innovation is a crucial driver of REC in BRICS economies, aligning with earlier research ([12,53]). Enhanced technological innovation improves energy efficiency and accelerates the transition from conventional energy sources to clean and green alternatives. Consequently, this transition contributes to a decline in CO2 emissions and supports the achievement of Sustainable Development Goals (SDGs) [13,54].
In contrast, Table 8 indicates that LnCO2 has a negative impact on LnREC. According to the estimations from the fixed effects (FEs) method, a 1% increase in CO2 results in a 0.2% decrease in renewable energy consumption (REC). These findings align with previous studies (e.g., [17]) suggesting that CO2 is a significant factor adversely affecting REC in BRICS economies. This situation can be attributed to many governments promoting fossil fuel energy. For instance, OECD countries allocated nearly USD 108 billion to fossil fuel extraction in 2019, providing financial incentives for investments in this sector. This investment leads to a reduction in carbon emissions prices, undermining the effectiveness of ecological initiatives and obstructing the transition to a clean economy [55].
Additionally, consistent with the findings of Ref [14], gross domestic product per capita (GDPC) is also a significant factor negatively impacting REC in BRICS economies. However, some studies (e.g., [16,34,56]) have documented that REC can increase with a rise in real per capita income. Similarly, the research in Ref. [17] emphasizes that GDP per capita has a positive effect on REC in OECD nations.
Table 8 shows that LnCPU has a positive effect on LnREC at various quantiles in the BRICS nations: Q.25 (α = 0.122), Q.50 (α = 0.252), Q.75 (α = 0.318), and Q.95 (α = 0.311). According to the estimates from the fixed effects method, a 1% increase in CPU leads to a 0.4% increase in REC. This aligns with previous studies (e.g., [8,41]), indicating that CPU is a significant driver of REC in BRICS economies. An increase in CPU encourages firms to boost their investments in clean energy initiatives, which contributes to a higher REC in the long term. Furthermore, the research by [42] suggested that the green energy sector was enhanced by increasing CPU and the Paris Agreement (2015).
The results indicate that LnGEPU has a negative impact on LnREC at various quantiles: Q.25 (α = −0.232), Q.50 (α = −0.348), Q.75 (α = −0.316), and Q.95 (α = −0.269). Specifically, a 1% increase in GEPU is associated with a 0.28% reduction in REC within the BRICS nations. This aligns with previous findings from sources [11,22,23], suggesting that GEPU adversely affects REC. The rise in economic policy uncertainty (EPU) on an international scale negatively influences the income levels of investors and households, making them less motivated to replace fossil fuels with renewable energy sources (REs). Notably, the higher levels of GEPU result in a slower transition from traditional energy sources to REs. It is important to mention that all estimated models incorporate time and country dummies, although their coefficients are not reported to save space. Additionally, the cross-sectional dependence (CD) post-estimation test produced a p-value of 0.393, which is not statistically significant, indicating that the estimation results are robust.
4.1.2. Additional Analysis: The EPS Interaction Effects with CPU and GEPU
This sub-section seeks to determine whether the environmental policy stringency (EPS) acts as a moderator between the relationships of Clean Production Utilization (CPU) and Green Energy Production Utilization (GEPU) in the context of Resource Efficiency and Conservation (REC). Understanding this issue carries significant policy implications for governments, as it can help improve REC by implementing effective green policies when both CPU and GEPU are present. To achieve this objective, we gathered EPS data from the OECD.Stat website. According to a report from the OECD Nations Department, the EPS index is calculated based on three sub-indices: market-based policies, non-market-based policies, and policies that support technology.
Table 9 examines the interaction effects of environmental policy strategies (EPS) with Carbon Pricing Units (CPUs) and Green Energy Policy Units (GEPUs) on renewable energy consumption (REC) in BRICS nations, taking into account various control variables. The findings indicate that EPS has a positive and statistically significant effect on REC. According to the existing literature, implementing green environmental strategies contributes to an increase in REC (e.g., [11,20,21]). Studies by [36,38] demonstrate that EPS effectively enhances REC, while the success of ecological strategies is influenced by the type of renewable energy sources utilized. Furthermore, reference [57] revealed that countries with lower levels of REC experience positive impacts from EPS.
Table 9.
The nexus between EPS, CPU, GEPU, and REC.
Furthermore, Table 9 indicates that the coefficients for the interaction effects of (LnEPS*LnCPU) (α = 0.017) and (LnEPS*LnGEPU) (α = 0.022) are both positive and statistically significant in BRICS nations. This suggests that implementing stricter Environmental Policy Standards (EPSs) enhances the positive effect of CPU on renewable energy consumption (REC) and mitigates the negative impact of GEPU on REC. Therefore, EPS plays a crucial role in promoting REC when CPU and GEPU are present.
The analysis reveals that when data are divided based on the average Earnings Per Share (EPS), the interaction effects are significantly different between economies with low and high EPS. Specifically, the magnitude of the interaction effects for LnEPS*LnCPU (α = 0.028) and LnEPS*LnGEPU (α = 0.016) is relatively smaller in low EPS economies. By contrast, for high EPS economies, the coefficients are larger: LnEPS*LnCPU (α = 0.033) and LnEPS*LnGEPU (α = 0.044).
These findings suggest that the efficiency of EPS is crucial. The results indicate that CPU has a more positive effect on renewable energy consumption (REC), while GEPU has a less negative impact on environments with stricter green policies. Overall, the evidence demonstrates that strengthening EPS can promote REC by enhancing the positive effects of CPU and mitigating the negative effects of GEPU. Therefore, we recommend that policymakers design and implement stricter EPS to achieve higher levels of REC.
5. Robustness Check
First, we utilized alternative measurements, specifically the “stock market turnover ratio” (LnSMT) and the “world uncertainty index” (LnWUI), to assess financial market development and geopolitical economic policy uncertainty (GEPU), respectively. The data for these measurements were gathered from the World Bank and the policy uncertainty website.
Second, following the findings from the work referenced in [17], we estimated Equation (1) by introducing a new variable: the “geopolitical risk index” (LnGPR), with data collected from the same policy uncertainty website.
Third, we estimated Equation (1) using both pooled quantile (PQ) and fixed effects (FEs) regression methods to check for consistency in our results.
Finally, we conducted the CD post-estimation test [58] to determine whether the estimated model exhibited any dependency issues.
The findings presented in Table 10 align with previous studies, indicating that LnSMT, LnFDI, LnREM, LnTINV, and LnCPU have positive and statistically significant effects on renewable energy consumption (REC). Our results provide substantial evidence that improving access to external funds by developing financial markets and attracting foreign direct investment (FDI), increasing household income through international remittances, enhancing environmental innovation, and raising consumer purchasing power (CPU) contribute to promoting REC in BRICS countries.
Table 10.
Robustness test.
Conversely, the data reveal that LnCO2, LnGDPC, LnWUI, and LnGPR negatively impact REC. Specifically, our findings demonstrate that increases in CO2 levels, economic output, global uncertainty, and geopolitical risk contribute to a decline in REC within BRICS nations.
6. Conclusions
Several researchers (e.g., [11,15]) have examined the elements of renewable energy consumption (REC) in various countries. However, there has been less focus on this topic in the context of BRICS nations. To the best of the authors’ knowledge, this study may be the first to investigate the moderating role of environmental policies (EPs) between Clean Production Units (CPUs), Green Energy Policy Uncertainty (GEPU), and REC in BRICS economies. This research aims to address these gaps by offering an empirical model that explores the determinants of REC in BRICS countries, utilizing traditional control factors. To achieve these objectives, this study employed the pooled quantile (PQ) and fixed effects (FEs) methods to analyze annual data from 2010 to 2020.
The findings indicate that the expansion of the capital market, an influx in foreign direct investment (FDI), increasing international remittances, advancements in environmental innovation, and rising capacity utilization (CPU) are significant factors that promote renewable energy consumption (REC). However, rising carbon dioxide (CO2) levels, economic growth, and an increase in global economic policy uncertainty (GEPU) negatively affect REC in BRICS countries.
Additionally, the results emphasize that environmental policy stringency (EPS) has a positive and significant impact on REC, suggesting that stricter ecological policies enhance REC. Notably, EPS plays a significant moderating role between CPU, GEPU, and REC. This means that by implementing stricter EPS, the positive effect of CPU on REC can be amplified, while the negative impact of GEPU on REC can be mitigated.
Consequently, EPS has a crucial role in promoting REC when CPU and GEPU are present. Specifically, the interaction effects highlight that the positive influence of EPS is more pronounced in countries with high EPS compared to those with low EPS. The findings are robust, having been validated through multiple measures and various methodologies.
6.1. Policy Recommendations
Here, we provide several policy recommendations. First, the statistically significant findings regarding SMC, FDI, and REM suggest that policymakers should improve access to external funds for investors and households to promote renewable energy consumption (REC). This can be achieved by developing financial markets, fostering open economies, and enhancing the inflow of international remittances. By doing so, investors and households can access and borrow funds at lower costs, which encourages greater investment in renewable energy schemes.
Furthermore, the findings indicate that policymakers aiming to facilitate capital inflows into a host country should focus on enhancing competitiveness at the country level. This includes improving the quality of private and public institutions, ensuring financial and economic stability, maintaining political stability, and developing infrastructure (e.g., [59]).
Secondly, the significant positive impact of technological innovation (TINV) indicates to policymakers the importance of focusing on research and development (R&D) and financing renewable energy (RE) technologies. This focus can help expedite the transition from conventional energy sources to clean energy and contribute to achieving the Sustainable Development Goals (SDGs).
Moreover, the statistically significant findings regarding Environmental Policy Structures (EPSs) suggest that policymakers should design and implement stricter environmental policies. These policies can be market-based, non-market-based, or involve technological support, all aimed at promoting renewable energy consumption (REC). In countries with stricter environmental regulations, growth in RE capacity and consumption could be enhanced. This environment would also encourage both investors and households to actively promote REC.
Additionally, consistent with the study in ref [11], stricter environmental policies can help moderate the influence of Global Energy Price Uncertainty (GEPU) on the demand for RE. Therefore, by developing effective Environmental Policy Structures, policymakers can accelerate climate change mitigation strategies, particularly when confronted with Consumer Price Uncertainty (CPU) and GEPU.
6.2. Limitations of Study
Further studies could explore the findings of this research across both developing and developed economies. Additionally, it would be valuable to test the proposed model with various renewable energy (RE) sources. Incorporating the impact of economic globalization and sovereign Environmental, Social, and Governance (ESG) factors [60,61] on renewable energy consumption (REC) and different RE sources would also be beneficial. Moreover, future research should examine the short- and long-term relationships between these variables and REC.
Author Contributions
Conceptualization, D.A., T.A. and M.A.; methodology, D.A. and M.A.; software, D.A.; validation, D.A. and M.A.; formal analysis D.A.; investigation, D.A. and M.A.; resources, D.A. data curation, D.A.; writing—original draft preparation, D.A., T.A. and M.A.; writing—review and editing, D.A.; visualization, D.A. and M.A.; supervision, D.A.; project administration, D.A. and M.A. All authors have read and agreed to the published version of the manuscript.
Funding
This research received no external funding.
Data Availability Statement
The original contributions presented in this study are included in the article. Further inquiries can be directed to the corresponding author.
Conflicts of Interest
The authors declare no conflicts of interest.
Appendix A
Table A1.
BRICS nations and the average of factors (2010–2020).
Table A1.
BRICS nations and the average of factors (2010–2020).
| BRICS Countries | LnREC | LnSMC | LnFDI | LnREM | LnTINV | LnCO2 | LnGDPC |
|---|---|---|---|---|---|---|---|
| Brazil | 3.831 | 3.853 | 1.270 | −1.951 | 9.931 | 13.012 | 9.222 |
| Russia | 1.238 | 3.637 | 0.402 | −0.841 | 10.518 | 14.306 | 9.375 |
| India | 3.717 | 4.416 | 0.556 | 1.156 | 10.160 | 14.554 | 7.413 |
| China | 2.801 | 4.055 | 0.787 | −1.591 | 12.265 | 16.110 | 8.941 |
| South Africa | 2.455 | 5.490 | −0.029 | −1.427 | 8.862 | 12.967 | 8.852 |
References
- Gozgor, G.; Lau, C.K.M.; Lu, Z. Energy consumption and economic growth: New evidence from the OECD countries. Energy 2018, 153, 27–34. [Google Scholar] [CrossRef]
- Adams, S.; Nsiah, C. Reducing carbon dioxide emissions; Does renewable energy matter? Sci. Total Environ. 2019, 693, 133288. [Google Scholar] [CrossRef] [PubMed]
- Zhou, A.; Li, J. Heterogeneous role of renewable energy consumption in economic growth and emissions reduction: Evidence from a panel quantile regression. Environ. Sci. Pollut. Res. 2019, 26, 22575–22595. [Google Scholar] [CrossRef]
- Godil, D.I.; Yu, Z.; Sharif, A.; Usman, R.; Khan, S.A.R. Investigate the role of technology innovation and renewable energy in reducing transport sector CO2 emission in China: A path toward sustainable development. Sustain. Dev. 2021, 29, 694–707. [Google Scholar] [CrossRef]
- Addai, K.; Al Geitany, S.H.; Athari, S.A.; Farmanesh, P.; Kirikkaleli, D.; Saliba, C. Do Environmental Tax and Energy Matter for Environmental Degradation in the UK? Evidence from Novel Fourier-Based Estimators. Energies 2024, 17, 5732. [Google Scholar] [CrossRef]
- Bloomberg New Energy Finance. Global Trends in Clean Energy Investment; Bloomberg Finance L.P.: New York, NY, USA, 2019. [Google Scholar]
- IRENA. World Energy Transitions Outlook: 1.5 °C Pathway; International Renewable Energy Agency: Abu Dhabi, United Arab Emirates, 2021; pp. 1–352. Available online: www.irena.org/publications (accessed on 11 April 2024).
- Shang, Y.; Han, D.; Gozgor, G.; Mahalik, M.K.; Sahoo, B.K. The impact of climate policy uncertainty on renewable and non-renewable energy demand in the United States. Renew. Energy 2022, 197, 654–667. [Google Scholar] [CrossRef]
- Sweerts, B.; Longa, F.D.; van der Zwaan, B. Financial de-risking to unlock Africa’s renewable energy potential. Renew. Sustain. Energy Rev. 2019, 102, 75–82. [Google Scholar] [CrossRef]
- Anton, S.G.; Nucu, A.E.A. The effect of financial development on renewable energy consumption. A panel data approach. Renew. Energy 2020, 147, 330–338. [Google Scholar] [CrossRef]
- Athari, S.A. Global economic policy uncertainty and renewable energy demand: Does environmental policy stringency matter? Evidence from OECD economies. J. Clean. Prod. 2024, 450, 141865. [Google Scholar] [CrossRef]
- Alam, M.M.; Murad, M.W. The impacts of economic growth, trade openness and technological progress on renewable energy use in organization for economic co-operation and development countries. Renew. Energy 2020, 145, 382–390. [Google Scholar] [CrossRef]
- Saliba, C.B.; Hassanein, F.R.; Athari, S.A.; Dördüncü, H.; Agyekum, E.B.; Adadi, P. The Dynamic Impact of Renewable Energy and Economic Growth on CO2 Emissions in China: Do Remittances and Technological Innovations Matter? Sustainability 2022, 14, 14629. [Google Scholar] [CrossRef]
- Tiwari, A.K.; Nasreen, S.; Anwar, M.A. Impact of equity market development on renewable energy consumption: Do the role of FDI, trade openness and economic growth matter in Asian economies? J. Clean. Prod. 2022, 334, 130244. [Google Scholar] [CrossRef]
- Athari, S.A. The impact of financial development and technological innovations on renewable energy consumption: Do the roles of economic openness and financial stability matter in BRICS economies? Geol. J. 2024, 59, 288–300. [Google Scholar] [CrossRef]
- Padhan, H.; Padhang, P.C.; Tiwari, A.K.; Ahmed, R.; Hammoudeh, S. Renewable energy consumption and robust globalization(s) in OECD countries: Do oil, carbon emissions and economic activity matter? Energy Strategy Rev. 2020, 32, 100535. [Google Scholar] [CrossRef]
- Zhao, Z.; Gozgor, G.; Lau, M.C.K.; Mahalik, M.K.; Patel, G.; Khalfaoui, R. The impact of geopolitical risks on renewable energy demand in OECD countries. Energy Econ. 2023, 122, 106700. [Google Scholar] [CrossRef]
- Sadeque, Z.; Rysankova, D.; Elahi, R.; Soni, R. Scaling Up Access to Electricity: The Case of Bangladesh; Live Wire, 2014/21; World Bank: Washington, DC, USA, 2014; Available online: https://openknowledge.worldbank.org/handle/10986/18679 (accessed on 11 April 2024).
- Subramaniam, Y.; Masron, T.A.; Loganathan, N. Remittances and renewable energy: An empirical analysis. Int. J. Energy Sect. Manag. 2022, 17, 1034–1049. [Google Scholar] [CrossRef]
- Acemoglu, D.; Akcigit, U.; Hanley, D.; Kerr, W. Transition to clean technology. J. Political Econ. 2016, 124, 52–104. [Google Scholar] [CrossRef]
- Lei, W.; Xie, Y.; Hafeez, M.; Ullah, S. Assessing the dynamic linkage between energy efficiency, renewable energy consumption, and CO2 emissions in China. Environ. Sci. Pollut. Res. 2022, 29, 19540–19552. [Google Scholar] [CrossRef] [PubMed]
- Shafiullah, M.; Miah, M.D.; Alam, M.S.; Atif, M. Does economic policy uncertainty affect renewable energy consumption? Renew. Energy 2021, 179, 1500–1521. [Google Scholar] [CrossRef]
- Lei, W.; Liu, L.; Hafeez, M.; Sohail, S. Do economic policy uncertainty and financial development influence the renewable energy consumption levels in China? Environ. Sci. Pollut. Res. 2022, 29, 7907–7916. [Google Scholar] [CrossRef] [PubMed]
- Alsagr, N.; van Hemmen, S. The impact of financial development and geopolitical risk on renewable energy consumption: Evidence from emerging markets. Environ. Sci. Pollut. Res. 2021, 28, 25906–25919. [Google Scholar] [CrossRef]
- Gozgor, G.; Lau, M.C.K.; Zeng, Y.; Yan, C.; Lin, Z. The impact of geopolitical risks on tourism supply in developing economies: The moderating role of social globalization. J. Travel Res. 2022, 61, 872–886. [Google Scholar] [CrossRef]
- Ma, Y.; Zhao, Y.; Jia, R.; Wang, W.; Zhang, B. Impact of financial development on the energy intensity of developing countries. Heliyon 2022, 8, e09904. [Google Scholar] [CrossRef]
- IEA. World Energy Statistics 2019, France. 2020. Available online: https://www.iea.org (accessed on 11 April 2024).
- Global Energy Review. In Assessing the Effects of Economic Recoveries on Global Energy Demand and CO2 Emission in 2021; International Energy Agency: Paris, France, 2021.
- Kirikkaleli, D.; Adebayo, T.S. Do renewable energy consumption and financial development matter for environmental sustainability? New global evidence. Sustain. Dev. 2021, 29, 583–594. [Google Scholar] [CrossRef]
- Paramati, S.R.; Ummalla, M.; Apergis, N. The effect of foreign direct investment and stock market growth on clean energy use across a panel of emerging market economies. Energy Econ. 2016, 56, 29–41. [Google Scholar] [CrossRef]
- Amuakwa-Mensah, F.; Näsström, E. Role of banking sector performance in renewable energy consumption. Appl. Energy 2022, 306, 118023. [Google Scholar] [CrossRef]
- Ferrier, G.D.; Reyes, J.; Zhu, Z. Technology diffusion on the international trade network. J. Public Econ. Theory 2016, 18, 291–312. [Google Scholar] [CrossRef]
- Swiss Agency for Development and Cooperation. Energy, Migration and the 2030 Agenda for Sustainable Development, Briefing Note. 2018. Available online: https://www.odi.org/sites/odi.org.uk/files/resource-documents/12301.pdf (accessed on 16 May 2024).
- Sadorsky, P. Renewable energy consumption and income in emerging economies. Energy Policy 2009, 37, 4021–4028. [Google Scholar] [CrossRef]
- Saeed, T.; Bouri, E.; Alsulami, H. Extreme return connectedness and its determinants between clean/green and dirty energy investments. Energy Econ. 2021, 96, 105017. [Google Scholar] [CrossRef]
- Jenner, S.; Groba, F.; Indvik, J. Assessing the strength and effectiveness of renewable electricity feed-in tariffs in European Union countries. Energy Policy 2013, 52, 385–401. [Google Scholar] [CrossRef]
- Bersalli, G.; Menanteau, P.; El-Methni, J. Renewable energy policy effectiveness: A panel data analysis across Europe and Latin America. Renew. Sustain. Energy Rev. 2020, 133, 110351. [Google Scholar] [CrossRef]
- Johnstone, N.; Haščič, I.; Poirier, J.; Hemar, M.; Michel, C. Environmental policy stringency and technological innovation: Evidence from survey data and patent counts. Appl. Econ. 2012, 44, 2157–2170. [Google Scholar] [CrossRef]
- Bourcet, C. Empirical determinants of renewable energy deployment: A systematic literature review. Energy Econ. 2020, 85, 104563. [Google Scholar] [CrossRef]
- Sohail, M.T.; Xiuyuan, Y.; Usman, A.; Majeed, M.T.; Ullah, S. Renewable energy and non-renewable energy consumption: Assessing the asymmetric role of monetary policy uncertainty in energy consumption. Environ. Sci. Pollut. Res. 2021, 28, 31575–31584. [Google Scholar] [CrossRef]
- Pommeret, A.; Schubert, K. Intertemporal emission permits trading under uncertainty and irreversibility. Environ. Resour. Econ. 2018, 71, 73–97. [Google Scholar] [CrossRef]
- Antoniuk, Y.; Leirvik, T. Climate change events and stock market returns. J. Sustain. Financ. Investig. 2021, 14, 42–67. [Google Scholar] [CrossRef]
- Ren, X.; Li, J.; He, F.; Lucey, B. Impact of climate policy uncertainty on traditional energy and green markets: Evidence from time-varying granger tests. Renew. Sustain. Energy Rev. 2023, 173, 113058. [Google Scholar] [CrossRef]
- Zhou, D.; Siddik, A.B.; Guo, L.; Li, H. Dynamic relationship among climate policy uncertainty, oil price and renewable energy consumption—Findings from TVP-SV-VAR approach. Renew. Energy 2023, 204, 722–732. [Google Scholar] [CrossRef]
- Saliba, C.; Farmanesh, P.; Athari, S.A. Does country risk impact the banking sectors’ non-performing loans? Evidence from BRICS emerging economies. Financ. Innov. 2023, 9, 86. [Google Scholar] [CrossRef] [PubMed]
- Baltagi, B.H. Econometric Analysis of Panel Data; John Wiley & Sons: West Sussex, UK, 2005. [Google Scholar]
- Hsiao, C. Analysis of Panel Data (No. 54); Cambridge University Press: Cambridge, UK, 2014. [Google Scholar]
- Levin, A.; Lin, C.-F.; Chu, C.-S.J. Unit root tests in panel data: Asymptotic and finite-sample properties. J. Econ. 2002, 108, 1–24. [Google Scholar] [CrossRef]
- Im, K.S.; Pesaran, M.; Shin, Y. Testing for unit roots in heterogeneous panels. J. Econom. 2003, 115, 53–74. [Google Scholar] [CrossRef]
- Inglesi-Lotz, R. The impact of renewable energy consumption to economic growth: A panel data application. Energy Econ. 2016, 53, 58–63. [Google Scholar] [CrossRef]
- Yang, B.; Jahanger, A.; Khan, M.A. Does the inflow of remittances and energy consumption increase CO2 emissions in the era of globalization? A global perspective. Air Qual. Atmos. Health 2020, 13, 1313–1328. [Google Scholar] [CrossRef]
- Das, A.; McFarlane, A.; Carels, L. Empirical exploration of remittances and renewable energy consumption in Bangladesh. Asia-Pac. J. Reg. Sci. 2021, 5, 65–89. [Google Scholar] [CrossRef]
- Bellakhal, R.; Ben Kheder, S.; Haffoudhi, H. Governance and renewable energy investment in MENA countries: How does trade matter? Energy Econ. 2019, 84, 104541. [Google Scholar] [CrossRef]
- Chen, J.; Rojniruttikul, N.; Kun, L.Y.; Ullah, S. Management of green economic infrastructure and environmental sustainability in one belt and road enitiative economies. Environ. Sci. Pollut. Res. 2022, 29, 36326–36336. [Google Scholar] [CrossRef] [PubMed]
- Hou, H.; Lu, W.; Liu, B.; Hassanein, Z.; Mahmood, H.; Khalid, S. Exploring the Role of Fossil Fuels and Renewable Energy in Determining Environmental Sustainability: Evidence from OECD Countries. Sustainability 2023, 15, 2048. [Google Scholar] [CrossRef]
- Sadorsky, P. Renewable energy consumption, CO2 emissions and oil prices in the G7 countries. Energy Econ. 2009, 31, 456–462. [Google Scholar] [CrossRef]
- Li, X.; Ozturk, I.; Syed, Q.R.; Hafeez, M.; Sohail, S. Does green environmental policy promote renewable energy consumption in BRICST? Fresh insights from panel quantile regression. Econ. Res.-Ekon. Istraživanja 2022, 35, 5807–5823. [Google Scholar] [CrossRef]
- Pesaran, M.H. General Diagnostic Tests for Cross Section Dependence in Panels; Cambridge Working Papers in Economics, 0435; University of Cambridge: Cambridge, UK, 2004. [Google Scholar]
- Athari, S.A.; Adaoglu, C. Nexus between institutional quality and capital inflows at different stages of economic development. Int. Rev. Financ. 2019, 19, 435–445. [Google Scholar] [CrossRef]
- Athari, S.A. Does the sovereign environmental, social, and governance sustainability activities jeopardize the banking sector’s stability: Evidence from the Arab economies. Sustain. Futures 2024, 7, 100204. [Google Scholar] [CrossRef]
- Athari, S.A.; Saliba, C.; Abboud, E.; El-Bayaa, N. Examining the Quadratic Impact of Sovereign Environmental, Social, and Governance Practices on Firms’ Profitability: New Insights from the Financial Industry in Gulf Cooperation Council Countries. Sustainability 2024, 16, 2783. [Google Scholar] [CrossRef]

Disclaimer/Publisher’s Note: The statements, opinions and data contained in all publications are solely those of the individual author(s) and contributor(s) and not of MDPI and/or the editor(s). MDPI and/or the editor(s) disclaim responsibility for any injury to people or property resulting from any ideas, methods, instructions or products referred to in the content. |
© 2025 by the authors. Licensee MDPI, Basel, Switzerland. This article is an open access article distributed under the terms and conditions of the Creative Commons Attribution (CC BY) license (https://creativecommons.org/licenses/by/4.0/).