Article

Harnessing ESG Sustainability, Climate Policy Uncertainty and Information and Communication Technology for Energy Transition

Department of Business Administration, Institute of Graduate Research and Studies, University of Mediterranean Karpasia, Mersin 33010, Turkey
*
Author to whom correspondence should be addressed.
Energies 2025, 18(19), 5301; https://doi.org/10.3390/en18195301
Submission received: 22 August 2025 / Revised: 26 September 2025 / Accepted: 28 September 2025 / Published: 8 October 2025
(This article belongs to the Special Issue Financial Development and Energy Consumption Nexus—Third Edition)

Abstract

This study addresses a significant gap in the existing literature by introducing novel perspectives. First, it provides a comprehensive assessment of the impact of ESG sustainability and information and communication technology (ICT) on energy transition using updated quarterly data from 2002 Q3 to 2024 Q4. Second, it uniquely integrates climate policy uncertainty (CPU) and financial development (FD) as core explanatory variables, which have been largely neglected in prior research. Third, this study applies advanced quantile-based methodologies, including the Quantile Autoregressive Distributed Lag (QARDL) model and Quantile Cointegration (QC) techniques, to enhance empirical rigor and ensure policy relevance across the entire conditional distribution. The results showed that at lower quantiles (τ = 0.05–0.30), FD positively influences ET, supporting early-stage clean energy adoption. ICT shows a short-term negative effect (τ = 0.05–0.40). Based on these findings, policymakers should strengthen financial development to accelerate clean energy adoption at early stages, while addressing the short-term negative impacts of ICT by promoting supportive digital and energy policies that align technology use with sustainability goals.

1. Introduction

The United States is undergoing a significant energy transition—a shift from fossil fuels toward a cleaner, more diversified energy mix. As of 2023, renewables accounted for approximately 21% of U.S. utility-scale electricity generation—up from just 10% in 2010—reflecting rapid growth in wind and solar power [1]. For instance, wind-derived generation climbed to over 10% of total electricity (~434 TWh) in 2022, while solar capacity surged to nearly 240 GW by end-2024, with solar projects comprising 66% of new generation capacity in that year alone [2]. Despite these advances, fossil fuels still provided nearly 60% of overall U.S. electricity in 2023, underscoring the slow decline of coal and natural gas as dominant sources [3]. This transition plays a pivotal role in advancing the nation’s carbon neutrality goals. Under the Inflation Reduction Act and other federal initiatives, the U.S. aims to reduce greenhouse gas emissions by 40–60% by 2030 (compared to 2005 levels), with net-zero emissions targeted by 2050. To support this, the Department of Energy’s roadmap projects that renewables may supply up to 44% of U.S. electricity by 2050, with interim targets like 100% clean electricity by 2035, potentially cutting economy-wide emissions by 62% relative to 2005 [4]. Yet, achieving such ambitious objectives remains challenging: issues such as aging grid infrastructure, permitting delays, policy reversals, and lingering reliance on fossil fuels threaten further progress.
Environmental, Social, and Governance (ESG) sustainability has emerged as a crucial driver of the global energy transition, particularly by shaping corporate behavior, influencing investor decisions, and aligning economic activities with long-term environmental objectives. ESG frameworks provide a structured approach for organizations to internalize climate-related risks and embed sustainability across their operations and supply chains, thereby fostering investment in clean technologies and renewable energy infrastructure [5]. Empirical evidence shows that firms with strong ESG performance are more likely to pursue low-carbon strategies and attract green financing, which in turn accelerates the shift from fossil fuels to renewable sources [6,7]. Moreover, ESG commitments enhance transparency, regulatory compliance, and stakeholder trust—factors that are essential in scaling up clean energy adoption at both firm and national levels [8]. The inclusion of ESG metrics in financial analysis has also motivated institutional investors to divest from carbon-intensive assets and reallocate capital toward energy-efficient innovations and renewable energy projects. In the context of high-income economies like the United States, where sustainability reporting standards and investor activism are well developed, ESG practices not only reinforce corporate accountability but also align with broader national goals for carbon neutrality and climate resilience. As a result, ESG sustainability functions not just as a reporting tool, but as a strategic lever that catalyzes systemic transformation in energy production and consumption patterns.
Financial development plays a pivotal role in advancing the energy transition (ET) by mobilizing capital, lowering financing costs, and enhancing the efficiency of resource allocation toward clean energy investments. A well-developed financial system—comprising deep capital markets, diversified financial instruments, and inclusive credit access—facilitates the funding of renewable energy infrastructure, energy-efficient technologies, and sustainable innovation. According to [9], financial development significantly promotes ET by reducing transaction costs and improving the availability of long-term financing required for capital-intensive renewable projects. In developing and emerging economies, where financial constraints are more pronounced, robust financial systems can bridge the investment gap in renewable energy by attracting both domestic and foreign capital [10,11]. However, the effectiveness of financial development in driving ET depends heavily on the alignment of financial flows with green objectives, which requires supportive regulatory frameworks, environmental risk assessments, and the integration of sustainability criteria into lending and investment decisions [12]. Without such alignment, financial systems may inadvertently continue to support carbon-intensive industries, thereby slowing the transition. Therefore, for financial development to meaningfully contribute to energy transition, it must be accompanied by targeted policies, green finance instruments, and institutional reforms that channel capital explicitly toward low-carbon and sustainable energy pathways.
Information and Communication Technology (ICT) serves as a critical enabler of the energy transition (ET) by enhancing energy system efficiency, enabling digital innovation, and supporting the deployment of renewable energy solutions. ICT facilitates the transformation of traditional energy infrastructure into smart energy systems through technologies such as smart grids, digital meters, automated demand response, and real-time energy management platforms [13,14]. These innovations improve energy efficiency, reduce transmission losses, and allow for better integration of variable renewable sources like wind and solar into the energy mix [15]. In advanced economies such as the United States, ICT has supported decentralized energy solutions, electric vehicle infrastructure, and energy storage optimization—contributing significantly to decarbonization efforts. [16] highlight that increased ICT adoption positively influences ET by enabling predictive analytics, load forecasting, and efficient energy consumption behavior. ICT plays a pivotal role in enhancing data-driven policymaking and increasing transparency in energy governance. Importantly, ICT not only drives operational improvements but also promotes inclusivity by extending energy access to remote or underserved regions through digital platforms. However, to fully harness the potential of ICT for ET, supportive policies, cybersecurity infrastructure, and investment in digital capacity-building are essential. Thus, ICT stands as a strategic pillar in accelerating the global transition toward a clean, resilient, and intelligent energy future.
Aligned with the discussion above, the current study takes a deeper and more contextualized look at the case of the United States, a global leader in financial markets, technological innovation, and climate diplomacy. Utilizing quarterly data spanning from 2002 Q4 to 2024 Q4, this study aims to uncover thorough and distribution-sensitive insights into the drivers of energy transition (ET) within a high-income, policy-active economy. Recognizing that the shift from fossil fuel-based systems to renewable energy infrastructure is complex and multifaceted, this research is guided by the following critical research questions:
  • What is the effect of ESG sustainability on energy transition?
  • How does ICT impact energy transition?
  • Does financial development influence energy transition?
  • What role does climate policy uncertainty play in fostering energy transition?
Through these questions, this study aims to provide a comprehensive, empirical assessment of the multifactorial drivers of energy transition in the U.S., contributing to both academic literature and practical policymaking.

Novelty of this Study

First this study presents an in-depth analysis of the role of ESG sustainability in driving the energy transition within the context of the United States, a global leader in energy policy, financial markets, and climate governance. While prior studies have largely concentrated on ESG impacts in emerging markets or through cross-country comparisons, this research fills a critical gap by focusing on the U.S. as a benchmark case. The U.S. has made notable achievements in advancing renewable energy adoption, expanding clean investment, and promoting ESG disclosures, yet it continues to face persistent challenges such as reliance on fossil fuels, policy uncertainty, and uneven regional transitions across states. By examining how ESG principles influence the structural shift from carbon-intensive to cleaner energy systems, this study opens a novel line of inquiry at the intersection of energy, finance, and governance literature. Its significance lies in demonstrating how ESG frameworks cannot only accelerate decarbonization but also strengthen investor alignment with green mandates, reduce financial risks from stranded assets, and enhance corporate accountability. Moreover, by addressing both the progress made and the hurdles that remain, this study reshapes the policy discourse around energy transition, offering timely and actionable insights for policymakers, investors, and regulators seeking to design robust ESG-aligned strategies that advance long-term sustainability goals in advanced economies.
Secondly, unlike prior studies that focus solely on average (mean) effects, this study considers the entire distribution of the data, allowing for a deeper understanding of how CPU, ESG sustainability, FD, and ICT affect ET across different conditions and levels of response. By capturing variations at the lower, median, and upper quantiles, the analysis reveals asymmetric and context-specific effects that are often masked by mean-based approaches. This comprehensive perspective significantly enhances the quality of policy recommendations by enabling more targeted and inclusive strategies, particularly for addressing vulnerabilities at the lower tail (e.g., underperforming regions or sectors) and leveraging strengths at the upper end (e.g., innovation-driven regions). As a result, this study provides a more accurate and equitable policy framework that accounts for distributional realities rather than one-size-fits-all solutions.
Third, this study augments the conventional Granger causality framework suggested by [17] by integrating it with the quantile-based approach proposed by [18], resulting in a Quantile Granger Causality method that captures nonlinear and asymmetric causal relationships across the entire conditional distribution rather than assuming a constant effect at the mean. This enhanced approach allows for a more refined analysis of how CPU, ESG sustainability, FD, and ICT affect ET under varying economic and policy conditions. By identifying causal effects at different quantiles—such as during low or high levels of ET performance—this method provides differentiated and context-specific policy insights, enabling policymakers to design tailored interventions that are responsive to both vulnerable and high-performing segments of the energy transition landscape.
The subsequent sections are organized as follows: Section 2 and Section 3 present the literature review and the data and methodology, respectively; Section 4 presents the empirical results; and Section 5 provides the conclusion and policy implications.

2. Theoretical Underpinning and Empirical Review

2.1. Theoretical Underpinning

From an institutional perspective, persistent climate policy uncertainty—manifested in volatile regulations, inconsistent subsidy frameworks, and frequent geopolitical disruptions—can significantly undermine investor confidence. Such instability not only raises the cost of capital but also creates hesitation among stakeholders, discouraging long-term commitments to renewable energy projects. In many cases, this uncertainty translates into delays in infrastructure development, reduced flows of green finance, and an increased reliance on short-term fossil fuel investments as a fallback option [19]. However, in some contexts, CPU may paradoxically trigger strategic hedging and risk mitigation behavior, prompting governments and firms to diversify their energy portfolios toward renewables [20,21]. Meanwhile, ESG sustainability, rooted in stakeholder theory and legitimacy theory, provides a vital framework for aligning both firm behavior and national energy strategies with broader environmental responsibilities.
By embedding ESG principles into business practices and policy frameworks, organizations and governments can demonstrate accountability to stakeholders while fostering long-term resilience. In the context of emerging markets, where institutional structures and financial systems are still evolving, effective ESG integration has the potential to attract green finance, improve risk and credit profiles, and enhance overall transparency [22]. These outcomes not only build investor confidence but also create an enabling environment that reinforces and accelerates energy transition efforts toward cleaner and more sustainable pathways [15,23]. Financial development plays a foundational role through the lens of endogenous growth theory, as access to diversified financial instruments, well-regulated capital markets, and inclusive credit systems enables efficient allocation of resources toward clean energy infrastructure [9,11]. In the Global South, where financing constraints are often pronounced, a robust financial system can reduce risk premiums and stimulate private-sector investment in renewable technologies [23,24]. Finally, ICT acts as a technological enabler of ET, in line with Schumpeterian innovation theory, by facilitating the digitalization of energy systems, improving grid efficiency, and enabling data-driven policymaking [14,16]. In many developing countries, where energy access remains limited and system reliability is often compromised, the adoption of ICT provides a critical pathway for modernizing the energy sector. Through advanced energy monitoring, smart metering, and real-time system optimization, ICT can improve efficiency, reduce losses, and foster transparency in energy management, thereby creating conditions that support a gradual yet steady shift away from fossil fuel dependence. Beyond the technological dimension, an integrated framework highlights the importance of aligning policy stability, strong ESG commitments, financial sector maturity, and digital innovation.

2.2. Empirical Review

A critical review of the studies on the determinants of energy transition (ET) reveals the substantial and multifaceted role played by financial development (FD). Empirical results from [9,11,25] consistently indicate a positive association between FD and ET across various national and regional contexts using robust econometric techniques such as panel cointegration and FMOLS. These findings affirm the argument that a well-functioning financial system reduces transaction costs, facilitates access to green finance, and enhances capital allocation toward low-carbon technologies. However, results from [26,27] illustrate a duality, showing that the influence of financial development on ET is not universally linear. In less diversified economies like Ghana or politically heterogeneous regions such as ASEAN+3, financial development may support fossil fuel investments alongside renewables. This underscores the need for green financial regulations and targeted policy interventions that direct capital toward sustainable energy infrastructures.
The contribution of information and communication technology (ICT) to energy transition also emerges as a compelling and consistent theme across the reviewed studies. Research conducted by [16,28,29] offers substantial evidence that ICT enhances ET by enabling smart energy systems, improving energy efficiency, and fostering digital innovation for renewable deployment. Ref. [30] complements these findings with a comprehensive review confirming the enabling role of ICT across multinational settings. The convergence in findings highlights ICT as a universal driver of energy transition, irrespective of geographic or economic differences. However, while most studies focus on technological readiness, fewer delve into the governance, cybersecurity, and affordability issues that may moderate the ICT-ET relationship. Therefore, while ICT is a vital enabler, maximizing its impact on ET requires parallel investments in regulatory frameworks and digital inclusiveness.
In contrast to ICT and FD, studies exploring climate policy uncertainty (CPU) reveal a more complex and sometimes contradictory relationship with energy transition. While [20,21,31,32,33] argue that CPU positively influences ET—possibly due to increased hedging behavior or green investment as a risk mitigation strategy—ref. [19] present evidence that CPU can deter ET by generating market instability and discouraging long-term green commitments. These conflicting outcomes suggest that the effect of CPU is context-sensitive and potentially nonlinear. For instance, advanced economies with resilient financial systems and clear long-term environmental targets may react to uncertainty by accelerating clean investments, whereas others may delay green transitions due to risk aversion. As such, policymakers must strive to reduce policy ambiguity while simultaneously enhancing institutional capacity to absorb external shocks.
Lastly, the role of ESG (Environmental, Social, and Governance) sustainability practices in promoting ET is gaining scholarly prominence, with most studies showing a positive correlation. Refs. [15,23,33] provide evidence that ESG-aligned firms and nations are more inclined to adopt renewable energy strategies, leveraging ESG principles to drive investor confidence, reputational gains, and regulatory compliance. Nevertheless, refs. [24,34] offer more a thorough findings—reporting nonlinear or neutral relationships—highlighting that ESG effectiveness may vary depending on enforcement mechanisms, firm characteristics, or sectoral composition. The integration of machine learning by [15] also signifies a shift toward more sophisticated predictive tools in ESG-energy research. Collectively, these studies emphasize that while ESG is generally conducive to ET, its true impact depends on the depth of ESG integration, regulatory incentives, and alignment with national energy priorities. Table 1 presents summary of reviewed studies.

2.3. Gap in the Literature

A review of prior studies on the determinants of energy transition highlights important gaps that this study addresses. FD is often linked to supporting green finance and capital allocation for renewables, yet findings are inconsistent across contexts, with some evidence showing FD also fuels fossil investments. ICT is widely recognized as a driver of smart energy systems and efficiency, but most research neglects governance, affordability, and inclusiveness issues. CPU remains contested, with some studies suggesting it spurs hedging and green investment, while others show it discourages long-term commitments—implying a nonlinear, context-specific effect. ESG practices are generally seen as fostering renewable adoption [35], but existing work has focused on emerging markets or cross-country settings, overlooking advanced economies like the United States, where ESG is more institutionalized yet fossil fuel dependence and policy fragmentation persist. Moreover, much of the literature relies on mean-based methods, masking heterogeneity and nonlinear effects. This study fills these gaps by focusing on the U.S., employing a quantile-based approach that not only uncovers asymmetric effects of CPU, ESG, FD, and ICT across the distribution but also integrates quantile causality to reveal nonlinear dynamics. The choice of quantile-based techniques is particularly justified over other nonlinear or robust alternatives because it captures heterogeneous relationships across different points of the conditional distribution that mean-based or variance-focused models often overlook. Furthermore, the adequacy of the sample ensures the robustness of the estimations, although potential data limitations—such as the reliance on secondary sources and uneven regional representation—are acknowledged.

3. Data and Methods

3.1. Data

Table 2 outlines the data sources and measurement approaches for the key variables used in the analysis. Climate Policy Uncertainty (CPU) is captured using an index developed by Policy Uncertainty [36], which quantifies the level of uncertainty surrounding climate-related policy decisions. Environmental, Social, and Governance (ESG) Sustainability is also measured through an index provided by [36], reflecting the degree of corporate and national commitment to sustainable practices. The dependent variable, Energy Transition (ET), is measured in trillion British thermal units (Btu) and sourced from [1]), indicating the volume of energy shifting from conventional to cleaner sources. Financial Development (FD) is proxied by domestic credit to the private sector by banks as a percentage of GDP, based on data from [37], highlighting the depth and accessibility of financial resources within the economy. Lastly, Information and Communication Technology (ICT) is measured by the percentage of individuals using the internet, also obtained from [37], serving as a proxy for digital connectivity and technological advancement. This study covers the period from 2002 Q3 to 2024 Q4, and all data are transformed using natural logarithms. The starting point of 2002 Q3 is chosen due to the unavailability of ESG data prior to this period, while data for 2024 Q4 are currently unavailable.

3.2. Method

To explore the dynamic relationship between energy transition and its potential determinants—namely Financial Development (FD), Information and Communication Technology (ICT), Climate Policy Uncertainty (CPU), and Environmental, Social, and Governance Sustainability (ESG)—this study employs the Quantile Autoregressive Distributed Lag (QARDL). Compared to the conventional ARDL model, the QARDL framework offers a significant advantage by capturing asymmetric and heterogeneous effects across different conditional distributions of the dependent variable. This allows for a more nuanced understanding of how the influence of independent variables varies at different levels of the energy transition.
The traditional ARDL model is formulated as follows:
Δ Y t = α + λ Y t 1 + δ X t 1 + i = 1 p ϕ i Δ Y t i + j = 0 q θ j Δ X t j + ε t
where Y t is the dependent variable (energy transition), X t is a vector of independent variables (FD, ICT, CPU, ESG), Δ denotes the first-difference operator, α   is   the   intercept ,   λ   and   δ are the adjustment and long-run parameters, respectively, ϕ i   and   θ j are short-run coefficients, and εt is the error term. The lag orders are denoted by p and q.
To capture distributional asymmetries and quantile-specific behavior, the model is extended into the QARDL form
Q τ Δ Y t F t 1 = α ( τ ) + λ ( τ ) Y t 1 + δ ( τ ) X t 1 + i = 1 p ϕ i ( τ ) Δ Y t i + j = 0 q θ j ( τ ) Δ X t j + ε t ( τ )
In this specification, Q τ ( ) denotes the conditional quantile function at quantile τ  τ ( 0,1 ) , allowing model parameters to vary across different points in the conditional distribution of Y t . The quantiles considered in this study are τ = { 0.05 , 0.10 , 0.20 , , 0.90 , 0.95 } , which permits the analysis of heterogeneous effects of FD, ICT, CPU, and ESG across the entire distribution of energy transition.
To examine whether the effects of independent variables vary significantly across quantiles, Wald-type tests for slope equality are conducted. The null hypotheses are stated as follows:
H 0 : δ k τ 1 = δ k τ 2 = = δ k τ n
H 0 : θ k j τ 1 = θ k j τ 2 = = θ k j τ n
Rejection of these null hypotheses suggests the presence of long- and short-run asymmetries across quantiles, confirming the quantile-dependence of the relationship between the independent variables and energy transition. This approach not only enhances the understanding of conditional heterogeneity but also improves the reliability of inferences drawn from quantile-varying data structures.

4. Results of Analysis

4.1. Descriptive Statistics

Table 3 presents the descriptive statistics for five key variables: CPU, ESG, ET, FD, and ICT. These statistics provide insight into the central tendency, dispersion, and distributional characteristics of each variable. The mean values indicate that ET has the highest average (6.245), followed by ICT (4.351) and CPU (4.782), suggesting that, on average, ET data points are consistently higher than those of the other variables. The dispersion is reflected by the standard deviation, where ESG (0.375) and CPU (0.501) exhibit more variability compared to FD (0.061), indicating that FD is the most stable among the variables. The median values closely align with the means, suggesting a generally symmetric distribution for most variables, particularly ESG and FD. Skewness values reveal the direction of asymmetry in the distribution. Positive skewness is observed in CPU (0.485), ESG (0.260), and FD (0.567), indicating a longer right tail, whereas ET is negatively skewed (−0.539), implying a left-tailed distribution. ICT shows near-zero skewness (0.017), suggesting a nearly symmetrical distribution. Kurtosis values, which measure the “tailedness” of the distribution, range from 1.713 (ICT) to 3.443 (FD), with FD exhibiting a slightly leptokurtic distribution, indicating heavier tails. Conversely, ICT and ET have platykurtic distributions (kurtosis < 3), suggesting lighter tails than the normal distribution. The Jarque-Bera test statistics assess the normality of the data. Significant values (denoted with asterisks) are observed for CPU (4.339, p < 0.1), ET (8.187, p < 0.01), FD (5.555, p < 0.01), and ICT (6.213, p < 0.01), indicating that the null hypothesis of normality is rejected for these variables. Only ESG fails to reject the null hypothesis (1.334), suggesting it is approximately normally distributed. These results suggest that most of the variables exhibit non-normality, emphasizing the need for robust statistical techniques, such as quantile-based or non-parametric methods, in subsequent analyses.
The Q-Q plots (see Figure 1) displayed the normality of the variables ET, ICT, CPU, ESG, and FD by comparing their quantiles against a theoretical normal distribution. A perfectly normal distribution would result in points aligning along the diagonal line. While variables such as ESG and ICT closely follow the theoretical line, indicating approximate normality, others such as ET, CPU, and particularly FD show noticeable deviations in the tails, suggesting skewness or heavier/lighter tails relative to the normal distribution. The curved patterns and tail departures seen in ET and FD align with their descriptive statistics, such as negative skewness in ET and significant Jarque-Bera values for FD, confirming non-normality in the data distribution. These deviations validate the use of non-parametric or quantile-based methods in subsequent analysis.
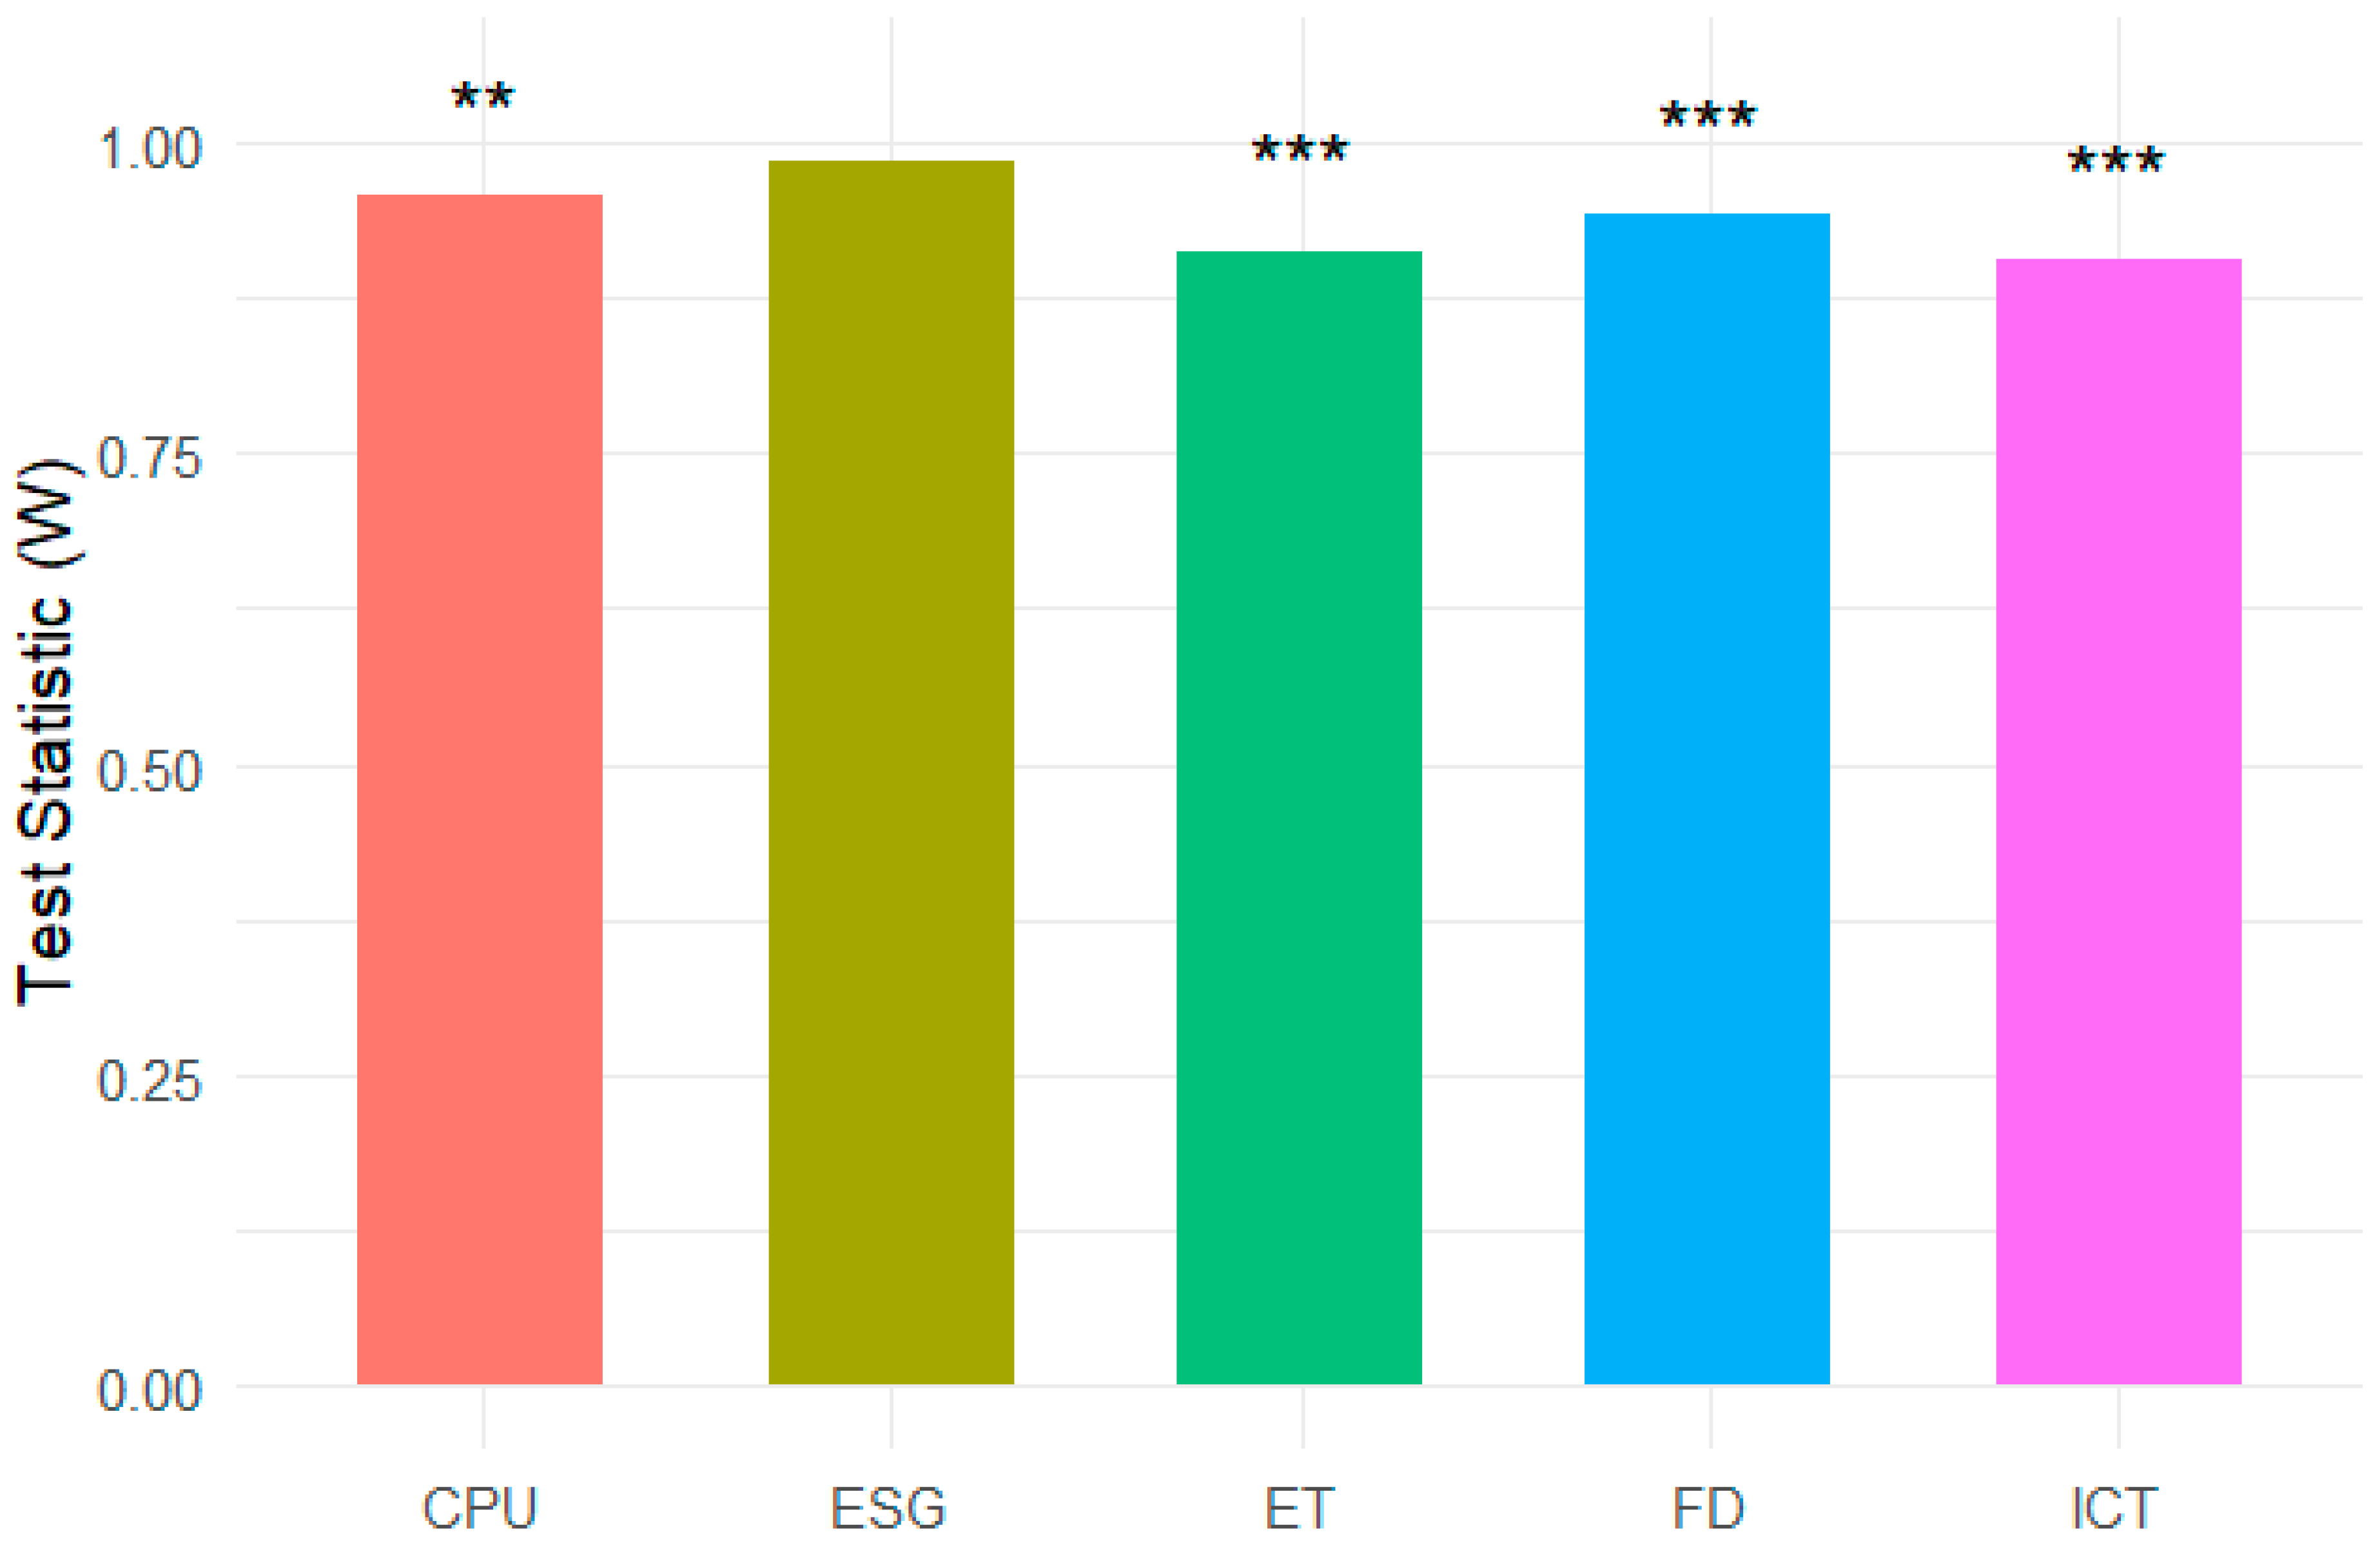
Figure 2 illustrates the Shapiro–Wilk normality test statistics (W-values) for the variables CPU, ESG, ET, FD, and ICT. The test assesses whether each variable’s distribution deviates significantly from normality, with W-values closer to 1 indicating a better fit to the normal distribution. Although ESG displays a W-value near 1, suggesting approximate normality, the presence of significance stars above all bars indicates that, for most variables, the null hypothesis of normality is rejected at conventional significance levels (p < 0.01, p < 0.05). Specifically, ET, FD, and ICT exhibit highly significant deviations, confirming strong evidence against normality. These findings are consistent with the earlier Q-Q plots and Jarque-Bera statistics, reinforcing the presence of non-normal distributions in the dataset and supporting the adoption of non-parametric or quantile-based methods in subsequent analyses.
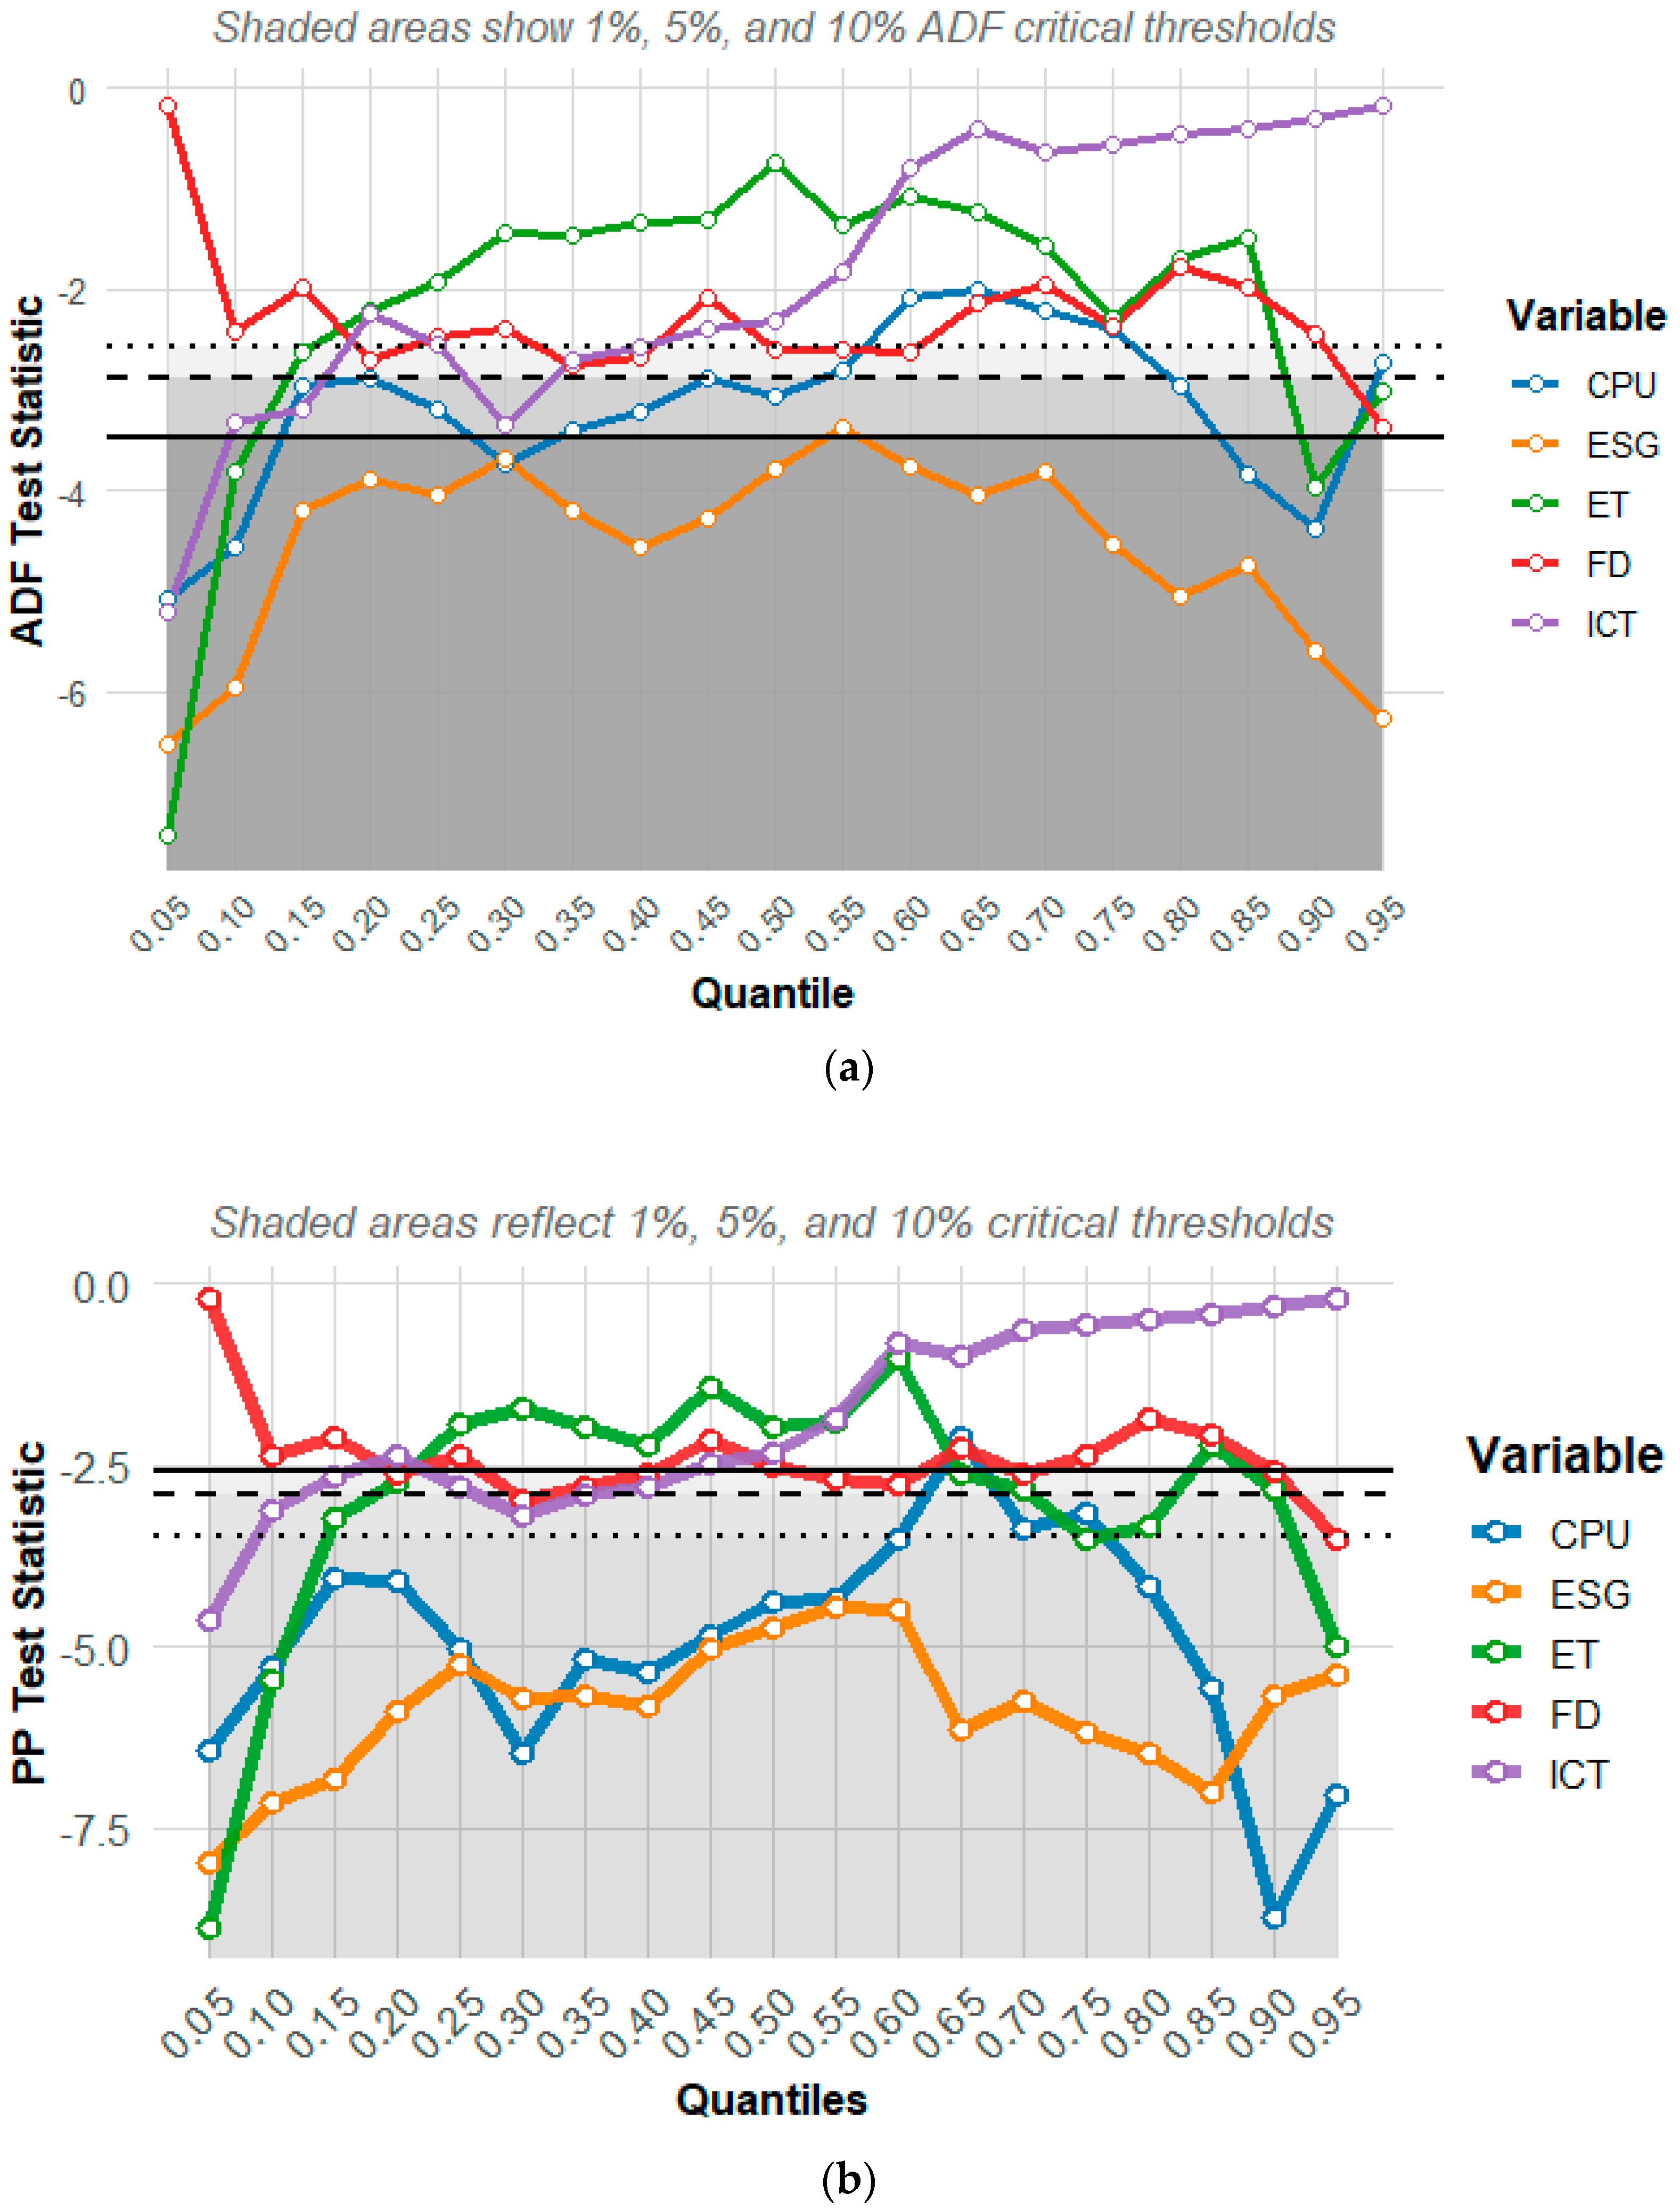
The Quantile Augmented Dickey–Fuller (QADF) and Quantile Phillips-Perron (QPP) tests presented in Figure 3a,b assess the stationarity of the variables CPU, ESG, ET, FD, and ICT across different quantiles (τ = 0.05 to 0.95), providing a more nuanced understanding than traditional unit root tests. In the QADF plot, most series—including CPU, ESG, and ET—have test statistics that fall below the 1%, 5%, and 10% critical thresholds (shaded regions), particularly at lower and upper quantiles, indicating rejection of the null hypothesis of a unit root and evidence of stationarity in the tails. Similarly, the QPP estimates reaffirm these findings, with strong rejections of the unit root null at several quantiles, especially for CPU and ESG, whose test statistics are consistently below the critical bounds. Notably, ICT and FD display values closer to or above the thresholds in mid-quantiles, suggesting partial non-stationarity in the central distribution but stationarity in the extremes. These quantile-based unit root tests reveal heterogeneous stationarity dynamics that standard full-sample tests may overlook, highlighting the importance of accounting for distributional asymmetries in time-series behavior.

4.2. Quantile Cointegration

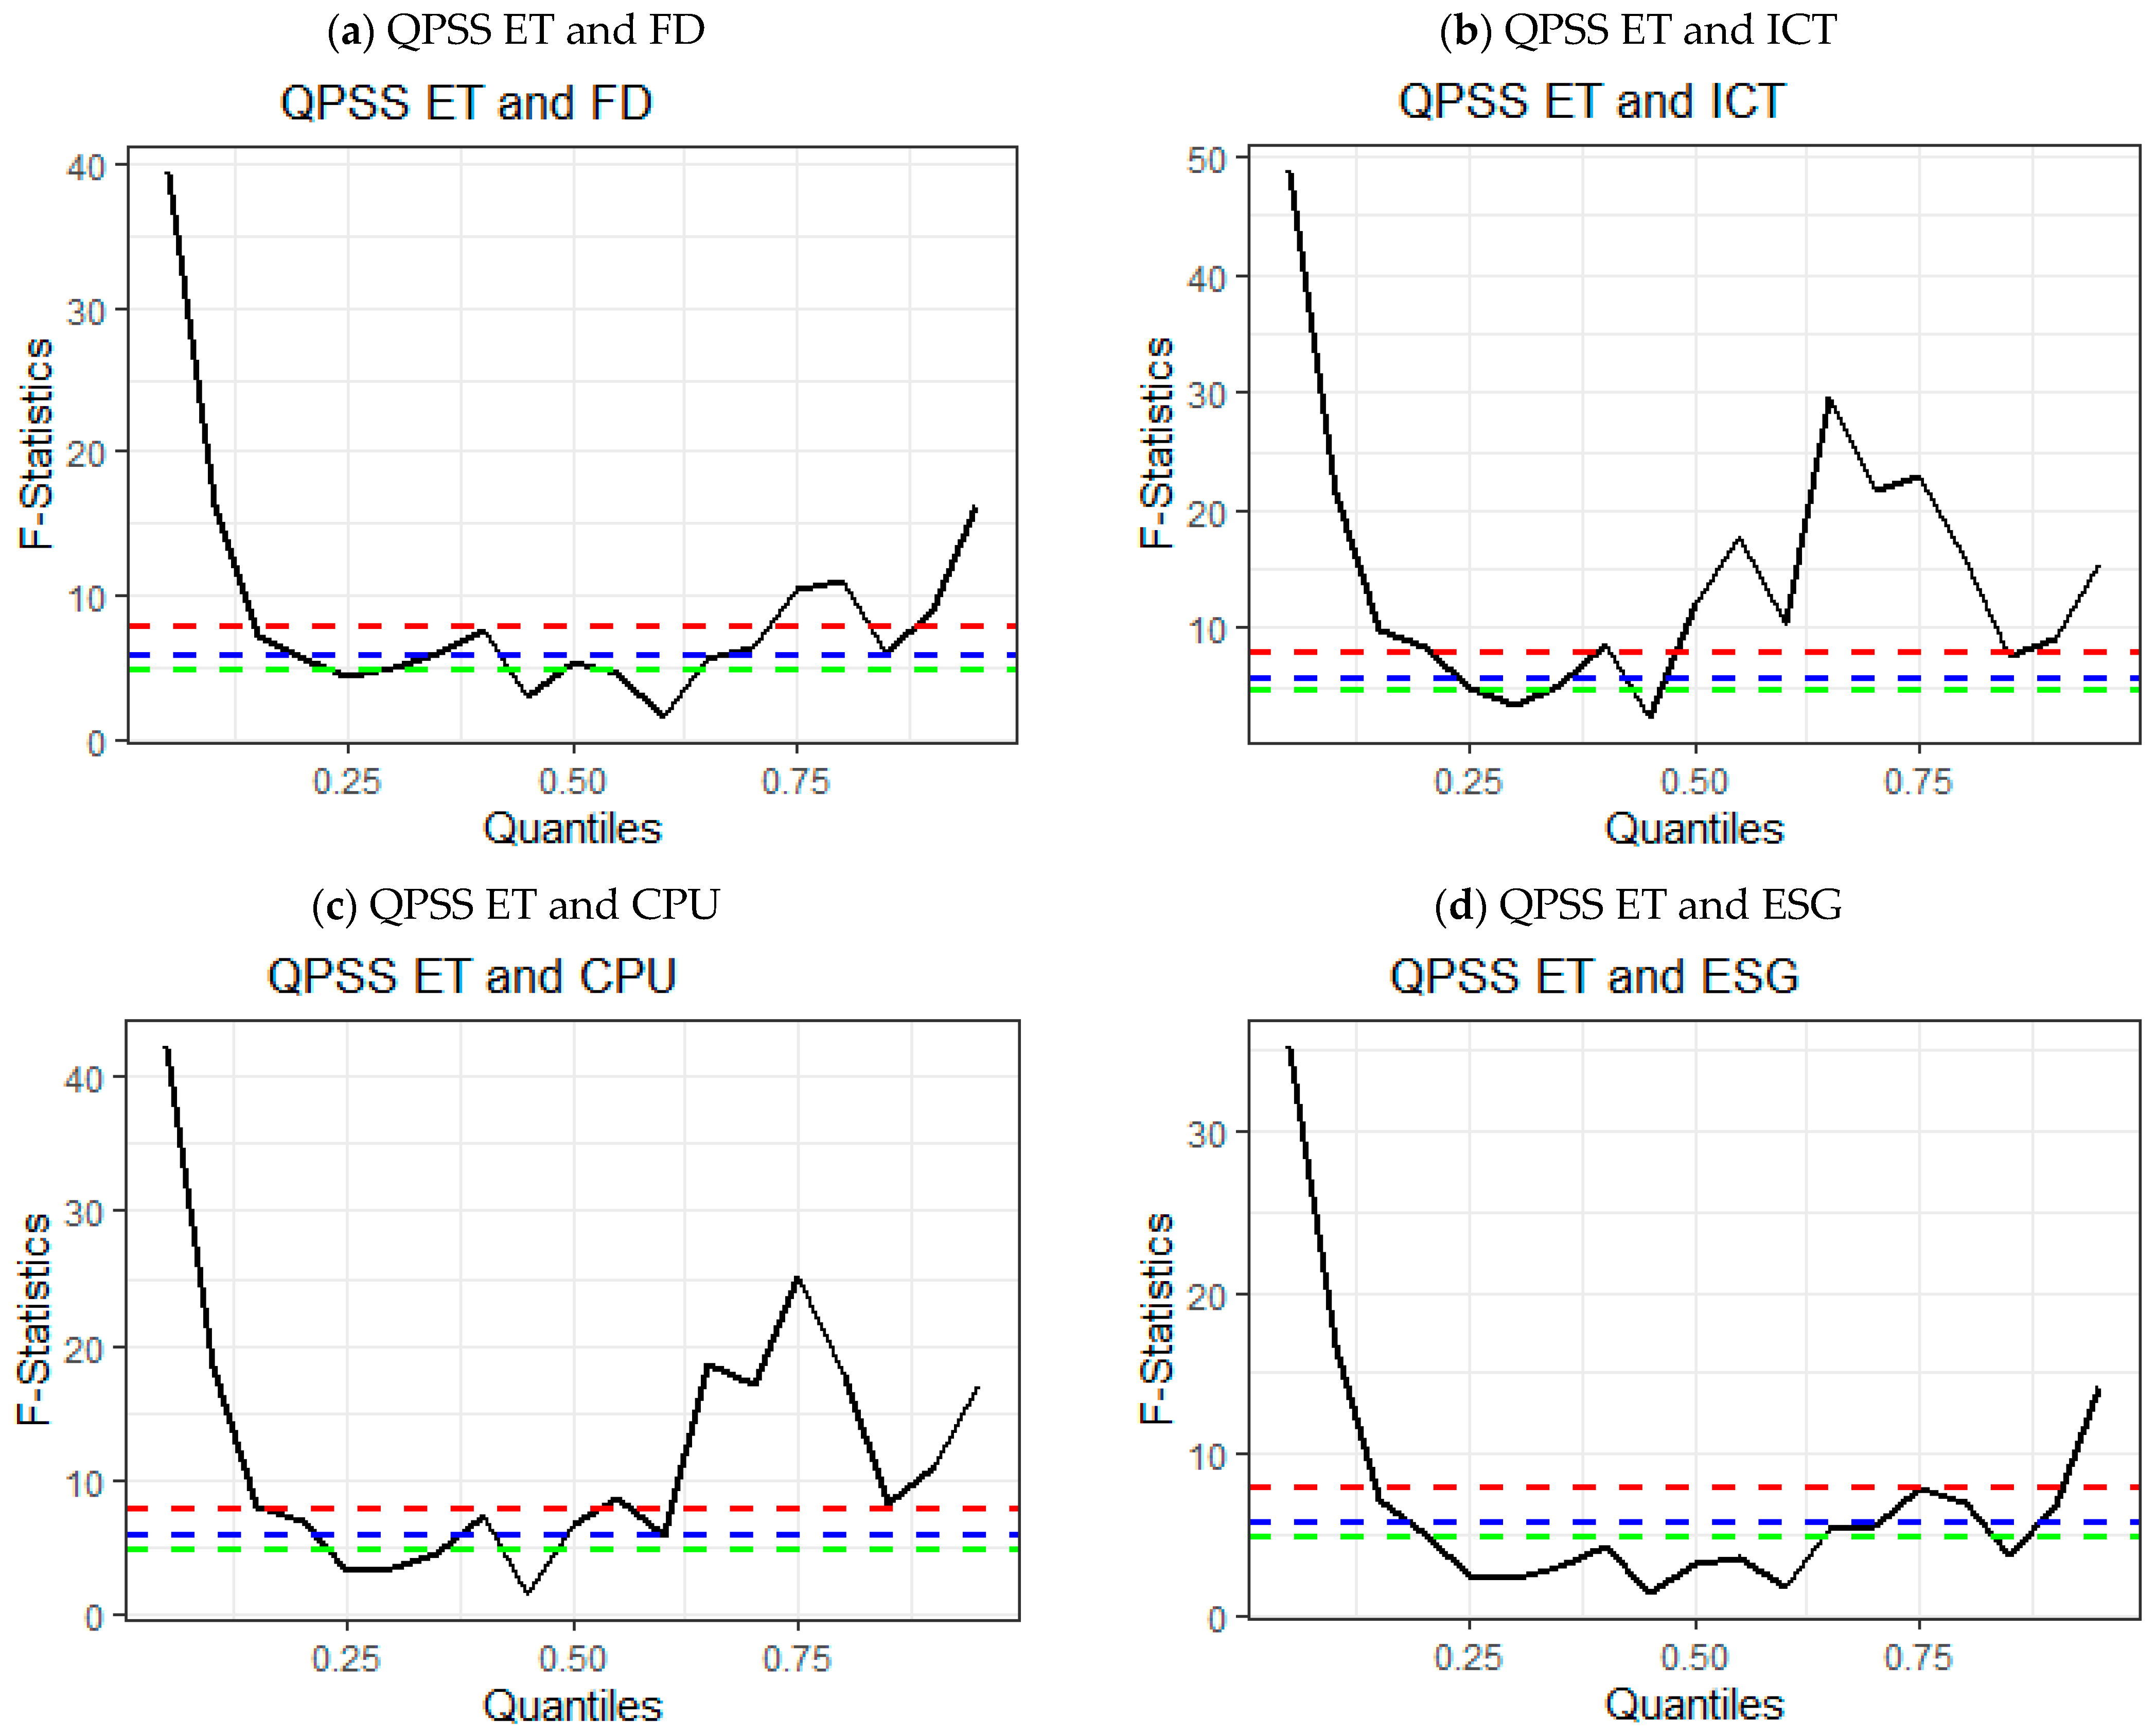
Next, we check the cointegration between the variables using the Quantile Cointegration suggested by Adebayo et al. (2025) [13]. Figure 4 results of the Quantile Autoregressive Distributed Lag-based Partial Sum of Squares (QPSS) approach. Each subfigure (a–d) displays the F-statistics across quantiles ranging from the 5th to the 95th percentile, compared against critical value thresholds at the 10%, 5%, and 1% significance levels. The dashed green, blue, and red lines represent the lower bounds (I(0)) and upper bounds (I(1)) of the critical values used to determine whether cointegration exists. Specifically, for the 10% significance level, the lower and upper bounds are 4.04 and 4.78, respectively. At the 5% level, they are 4.94 (I(0)) and 5.73 (I(1)), and at the 1% level, 6.84 (I(0)) and 7.84 (I(1)). Cointegration is confirmed at any quantile where the estimated F-statistic exceeds the I(1) bound, indicating a statistically significant long-run relationship at that conditional quantile.
From the figures, we observe substantial variation in the cointegration relationship across quantiles. For ET and FD (panel a), cointegration is evident at lower and upper quantiles, suggesting that financial development influences energy transition more strongly during extreme conditions—both sluggish and highly dynamic periods of transition. A similar pattern is observed in the ET–ICT relationship (panel b), where F-statistics exceed the 1% upper bound at extreme quantiles, indicating robust long-run linkage during low and high levels of ET. The ET–CPU (panel c) cointegration test highlights that climate policy uncertainty becomes significantly cointegrated with ET primarily in the upper-middle quantiles, reflecting its influence during moderately strong phases of energy transition. For ESG (panel d), the cointegration relationship is particularly strong in the lower and upper quantiles, suggesting that ESG sustainability practices impact energy transition during both early and advanced stages. Collectively, these results underscore the heterogeneous and quantile-dependent nature of long-run relationships, reinforcing the importance of the QARDL-QPSS framework in uncovering asymmetric cointegration dynamics that would be masked by mean-based approaches.

4.3. Quantile ARDL Results

4.3.1. Short-Term Effects (δ Coefficients)

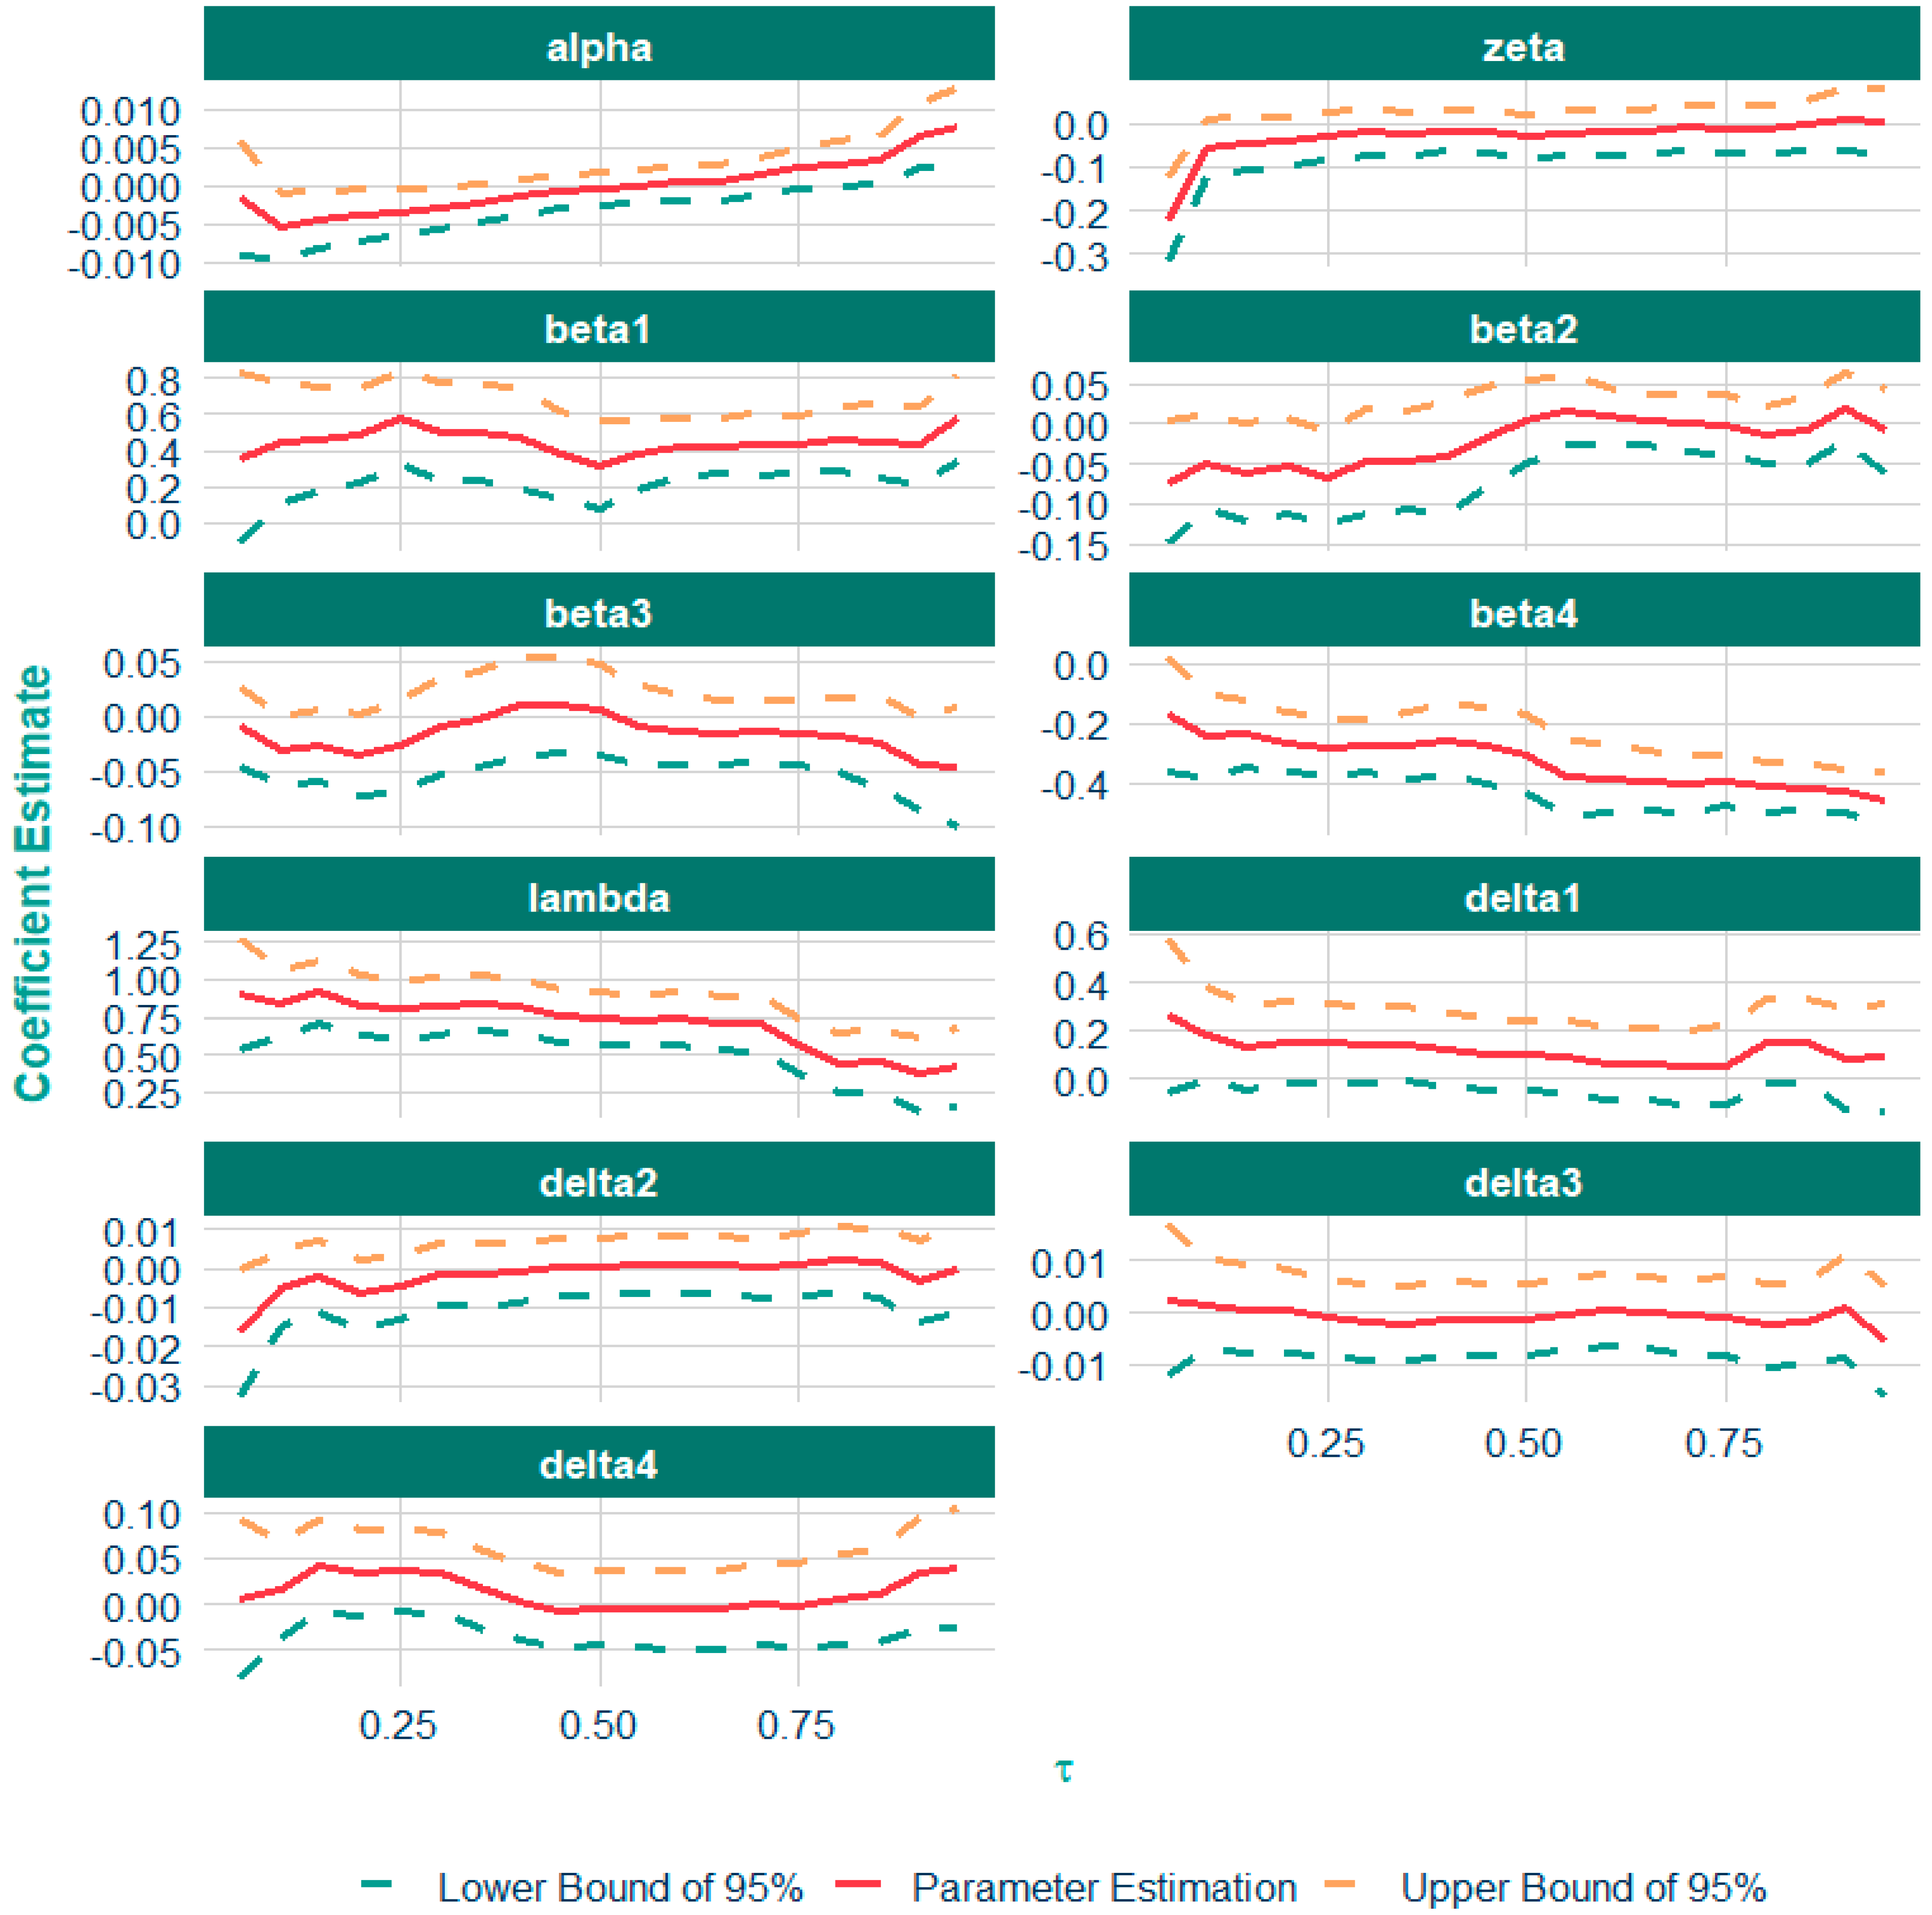
Table 4 and Figure 5 present the results of the QARDL results. In the short run, the Quantile ARDL results reveal significant heterogeneity in how financial development (FD), ICT, ESG, and commodity price uncertainty (CPU) affect the energy transition (ET) across quantiles in the United States.
At the lower quantiles (τ = 0.05 to 0.30), FD exerts a positive and statistically significant influence on ET, suggesting that financial institutions play a critical enabling role during the early or sluggish stages of the clean energy transition. In the U.S. context, this is consistent with the evolution of sustainable finance initiatives such as the Inflation Reduction Act, which has stimulated green investments through credit guarantees, tax incentives, and favorable lending conditions. Ref. [11] similarly argue that the maturation of financial markets enables the mobilization of long-term capital essential for infrastructure-heavy renewable projects.
Conversely, ICT shows a negative and statistically significant short-term effect from τ = 0.05 to 0.40, indicating that digitalization in its early phases may inhibit clean energy progress. This reflects a transitional paradox in the U.S. economy: while ICT infrastructure (cloud computing, AI systems, IoT devices) boosts operational efficiency, it simultaneously elevates short-term electricity consumption, often from non-renewable sources. This is particularly true in regions like Texas and California, where data centers place heavy strain on the grid. Ref. [38] caution that without an energy mix dominated by renewables, digital expansion may increase the fossil fuel load, thereby temporarily hindering ET.
Climate policy uncertainty significantly disrupts short-term progress in energy transition (ET) across various quantiles, particularly in the lower and upper bounds. In the United States, where energy policies are highly responsive to global oil and gas price fluctuations, sudden changes in commodity markets often lead to prolonged decision-making processes, discourage investments in renewable energy, and foster policy hesitation [39]. This challenge highlights the critical need for robust and predictable policy frameworks capable of mitigating the adverse effects of climate policy uncertainty on sustainable energy investments. Ref. [32] emphasize that in high-income economies, such uncertainty frequently redirects capital away from long-term renewable projects towards safer, quicker-return investments in fossil fuels, especially during periods of volatile or declining oil prices.
Interestingly, ESG exerts a negative and statistically significant short-term effect across most quantiles, especially from τ = 0.10 to 0.80. While ESG integration is a growing mandate in the U.S. financial and corporate sector, the short-term costs associated with ESG compliance—such as environmental audits, governance restructuring, and disclosure alignment—can suppress immediate investments in energy transition. This echoes the empirical observations of [40], who note that the initial costs of ESG compliance in U.S. firms are high and do not immediately translate into cleaner operations. Therefore, in the short run, ESG may act more as a regulatory burden than a catalyst for green acceleration.

4.3.2. Long-Term Effects (φ Coefficients)

Over the long term, FD continues to have a robustly positive effect on ET, particularly at quantiles τ = 0.05 to 0.30 and τ = 0.80 to 0.90, underscoring its role as a foundational driver of structural transformation in the U.S. energy sector. Long-term green finance instruments such as green bonds and climate-aligned investment portfolios are flourishing in the U.S., enabling deeper penetration of renewable energy. Ref. [41] emphasizes that advanced economies like the United States exhibit strong financial capacity to internalize long-horizon sustainability goals through capital market mechanisms. Thus, FD provides both the liquidity and risk mitigation tools required for sustaining long-term transition goals.
The long-run effects of ICT are mixed but tend to improve in the upper quantiles. Initially negative in lower quantiles, ICT becomes statistically insignificant or slightly positive at higher quantiles, suggesting that once energy transition has progressed beyond a threshold, ICT starts to amplify green energy performance. This transition occurs as the U.S. grid modernizes through smart meters, AI-powered forecasting, and blockchain-based energy tracking. As stated by [42], the synergy between digitalization and clean energy becomes more visible only when the technological ecosystem matures and policy alignment supports integration [38]. Therefore, while ICT may not kickstart ET, it enhances its efficiency and scalability in the long term.
Climate policy uncertainty (CPU) exerts a persistent and structurally negative influence on the clean energy transition across all quantiles, highlighting its critical role as a long-term barrier to sustainable energy development. In the United States, where the energy sector is characterized by a competitive and deregulated market structure, CPU generates a volatile investment climate that discourages both public and private stakeholders from committing to capital-intensive, long-gestation renewable energy projects [43]. Periods of elevated uncertainty—such as during the COVID-19 pandemic or geopolitical tensions like the Russia-Ukraine conflict—intensify oil and gas market volatility, distorting expectations and increasing perceived investment risks.
According to [31], this uncertainty raises the hurdle rate for renewable energy investments, inflates financing costs, and dampens investor appetite for clean innovations, particularly in markets sensitive to policy shifts. The resulting hesitation leads to delays, cancellations, or downsizing of renewable energy initiatives, weakening not only project-level deployment but also broader innovation and R&D in green technologies. Moreover, when policy instruments such as tax credits, carbon pricing mechanisms, or renewable portfolio standards are seen as unstable or politically reversible, they fail to provide the long-term signals needed to guide private sector behavior [44]. This fosters a vicious cycle where uncertainty impedes investment, delayed investment slows the transition, and a sluggish transition reinforces fossil fuel dependency—ultimately making future policy reform more difficult. Addressing CPU through stable, transparent, and credible climate governance is therefore essential to lowering risk premiums, mobilizing capital, and achieving a sustained and equitable clean energy transition in the United States.
On the ESG front, the long-term impact becomes marginally positive and significant around the median quantiles, suggesting that ESG-oriented firms in the U.S. begin to realize energy transition gains only after passing a tipping point. As ESG disclosure becomes normalized through legislation, U.S. firms align with longer-term sustainable strategies, leading to operational improvements, emissions reduction, and reputational gains. Ref. [35] note that once ESG frameworks are integrated and institutionalized, they become strategic assets for long-term performance [5]. This supports the idea that ESG is a long-term enabler of the green transition, albeit with upfront costs.

4.3.3. Adjustment Coefficient (ρ)

The adjustment coefficient ρ is significantly negative at lower quantiles (τ = 0.05 to 0.30), indicating that when deviations from the long-run equilibrium occur in states of low energy transition, the U.S. system exhibits a strong tendency to revert to equilibrium. This validates the presence of a stable cointegrating relationship between ET and its drivers. In practical terms, this means that energy policy shocks, such as sudden changes in subsidies or market incentives, are absorbed and corrected over time, ensuring system stability.

4.3.4. Speed of Adjustment (ζ)

The speed of adjustment term ζ is consistently positive and statistically significant from τ = 0.10 to 0.60, reinforcing the notion that deviations from equilibrium are not only corrected but corrected rapidly. This reflects the institutional agility of the U.S. energy system, supported by regulatory responsiveness, federal stimulus, and advanced infrastructure. As renewable energy becomes more cost-competitive, and as policy instruments (e.g., carbon credits, R&D subsidies) become more targeted, the system’s response time improves.

4.4. Quantile Granger Causality

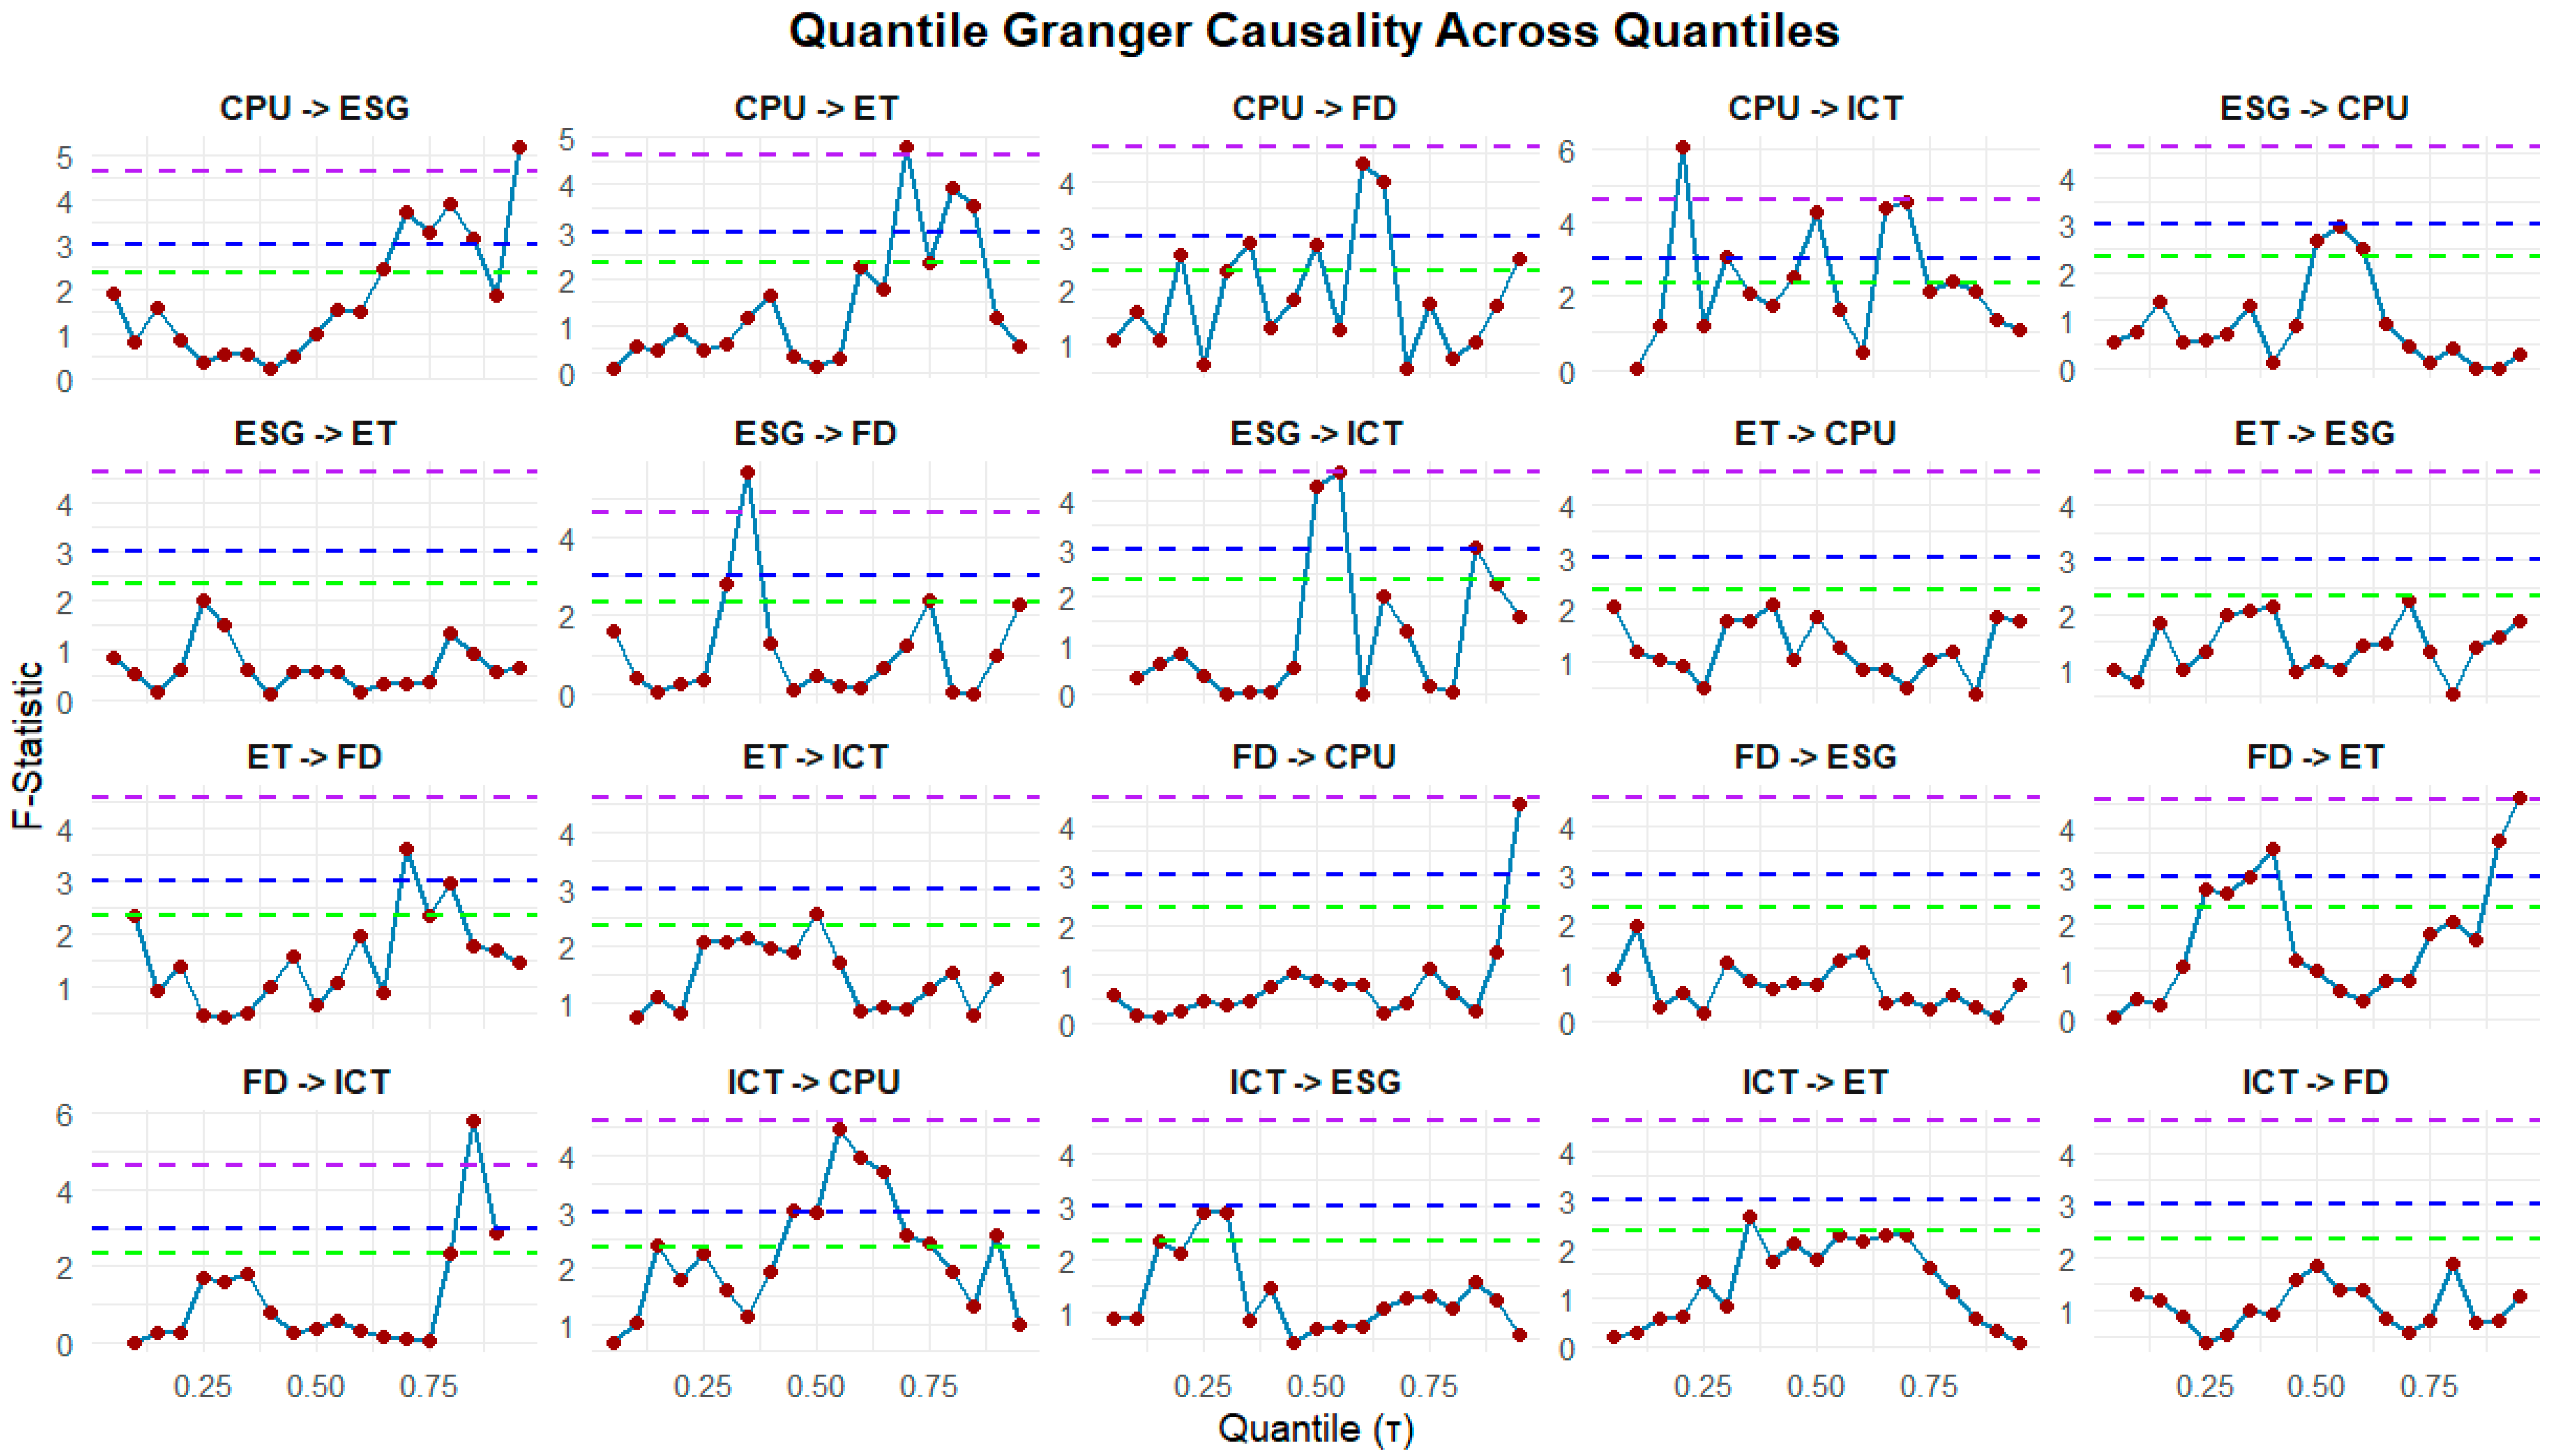
Next, we employed the Quantile Granger Causality test. The results of the QGC are presented in Figure 6. Specifically, CPU significantly Granger-causes ESG, ET, FD, and ICT at upper quantiles (especially τ > 0.75), indicating that during periods of high uncertainty, climate policy unpredictability becomes a dominant driver of changes in financial systems, sustainable investments, and digital innovation. This finding supports [33], who argue that elevated uncertainty prompts stakeholders to adopt risk-mitigating mechanisms through sustainability and technological investments. Moreover, the significant causality from CPU to ET and ESG underscores that policymakers and investors tend to integrate more resilient, forward-looking strategies in energy and ESG domains when faced with rising climate and regulatory uncertainty.
The second row of results highlights directional causality running from ESG to FD and ICT, primarily at mid-quantiles (τ = 0.3–0.7), suggesting that ESG engagement influences financial and technological structures under stable economic conditions. Likewise, ICT significantly causes ESG at similar quantiles, showing the feedback loop where digitization enhances ESG transparency and monitoring mechanisms. These findings are supported by [14], who show that ICT development improves ESG data processing, promotes responsible investing, and facilitates stakeholder engagement. ESG → FD causality also confirms that sound ESG policies can lead to greater financial innovation and inclusion,
As for the energy transition, the quantile Granger causality tests show that ET → FD is significant at higher quantiles, especially during periods of economic expansion or aggressive climate actions, such as the implementation of the Inflation Reduction Act in 2022. This indicates that ongoing energy transition efforts influence financial development by redirecting capital towards renewable energy sectors. Simultaneously, FD → ET shows a bidirectional relationship, especially at both lower and upper quantiles, which implies that financial development acts as both an initiator and responder to energy transition processes—amplifying clean energy investments in times of economic volatility and stability alike.
Finally, the dynamic between ICT and FD is also substantial. The causality from FD → ICT is evident at higher quantiles, indicating that during robust financial conditions, investments in digital technologies such as smart grids, AI, and green fintech rise substantially [45]. Similarly, ICT → FD causality at moderate quantiles suggests that technological advancements bolster financial infrastructure by reducing transaction costs and improving access to green finance instruments. Furthermore, the feedback between CPU and ICT is stronger from CPU → ICT, showing that during turbulent regulatory periods, there is increased adoption of digital technologies to manage risks and uncertainties. The weaker ICT → CPU link suggests that while ICT supports the policy environment, it does not directly drive changes in climate policy uncertainty.

4.5. Discussion of Findings

The results offer rich insights into both the short- and long-term dynamics of financial development (FD), ICT, ESG, and climate policy uncertainty (CPU) on the U.S. energy transition (ET), underscoring their asymmetric and context-specific impacts. In the short run, FD proves to be a crucial enabler of ET at lower quantiles, confirming the role of financial systems in mobilizing capital for early-stage renewable investments. This aligns with findings by [42,46], who emphasize that well-functioning financial markets reduce transaction costs, stimulate green finance, and accelerate renewable energy deployment. This is also consistent with U.S. policy measures such as the Inflation Reduction Act, which has facilitated clean energy financing through tax incentives and credit guarantees. However, ICT exhibits a negative influence at lower quantiles, highlighting a transitional paradox: the expansion of digital infrastructure, while beneficial for efficiency and innovation, temporarily raises energy demand, particularly in fossil-fuel-heavy regions. Similar evidence is reported by [47], who shows that ICT adoption initially increases energy consumption before efficiency gains materialize.
ESG also shows short-term drawbacks, as compliance-related costs hinder immediate green investments, echoing the observations of [40] that ESG integration involves high upfront costs that delay measurable improvements. CPU emerges as a disruptive factor, creating policy hesitation and redirecting capital toward fossil fuel assets. This outcome is supported by [48], who argue that policy uncertainty inflates risk premiums and discourages long-term clean energy investments. Collectively, these findings highlight how short-term volatility, costs, and uncertainty can stall clean energy momentum despite broader commitments to sustainability.
Over the long run, the estimates reveal more encouraging patterns, particularly for FD and ICT. FD remains a robust driver of ET, especially at both lower and higher quantiles, reinforcing its structural role in enabling sustained decarbonization through deepening financial markets, green bonds, and climate-aligned portfolios. These results are in line with the conclusions of [11,45], who show that green finance and capital market maturity provide liquidity and risk mitigation tools needed for renewable energy transition. ICT, initially a drag, evolves into a supportive force at higher quantiles, where advanced digitalization enhances efficiency and monitoring in smart energy systems. This transformation is consistent with findings from [45], who emphasize that digital technologies boost renewable energy performance once integrated into modernized grids. In contrast, CPU sustains its long-term negative effect across quantiles, exacerbating investor risk perceptions and deterring renewable energy deployment. This reflects the challenges highlighted by [21], who argue that volatile and unpredictable climate policies distort expectations and weaken investor appetite for renewables.
ESG, while costly in the short run, transitions into a positive and statistically significant driver at median quantiles, suggesting that once ESG frameworks are institutionalized, they become strategic assets that generate reputational benefits and sustained green investment. This outcome corroborates the arguments of [24], who found that ESG disclosure enhances long-term firm value and sustainability performance. Thus, while FD and ICT provide enabling capacity, and ESG emerges as a long-term catalyst, CPU remains a formidable barrier requiring governance reforms to stabilize expectations and unlock consistent progress.
The quantile Granger causality results add a dynamic layer, showing that CPU is not only disruptive in isolation but also causally shapes ESG, FD, ICT, and ET, particularly at upper quantiles. This implies that during high-uncertainty periods, climate policy unpredictability becomes a central force driving shifts in financial allocation, sustainability practices, and digital adoption. At the same time, causality runs in multiple directions: ESG influences FD and ICT at mid-quantiles, while ICT strengthens ESG transparency, reinforcing feedback loops that build resilience in the transition process. Bidirectional causality between FD and ET at lower and upper quantiles. Importantly, ICT and FD also reinforce one another: FD → ICT at higher quantiles shows that financial strength drives investments in smart grids and green fintech, while ICT → FD at mid-quantiles indicates that digitalization reduces transaction costs and expands green finance opportunities.

5. Conclusions and Policy Recommendations

5.1. Conclusions

Unlocking the potential of Information and Communication Technology, ESG sustainability, and financial development is key to propelling forward in energy transition efforts. By synergizing these elements, we pave the way for innovative solutions and sustainable growth in the clean energy sector. This study employed the novel ARDL on data spanning from 2002 Q3 to 2024 Q4 for the case of the United States. The Quantile ARDL results show that at lower quantiles (τ = 0.05 to 0.30), FD has a positive and statistically significant impact on ET, underscoring its role in facilitating early-stage clean energy initiatives. This finding aligns with [27,45], who reported that financial deepening enhances renewable energy adoption by lowering investment risks and mobilizing capital flows. Conversely, ICT exhibits a negative short-term effect (τ = 0.05 to 0.40), reflecting initial challenges in balancing rapid digital expansion with environmental objectives, consistent with [49,50], who noted that digitalization can exacerbate energy demand before efficiency gains materialize. CPU disrupts short-term ET progress across most quantiles due to its influence on energy investment decisions amid global market fluctuations, which resonates with the results of [51,52], highlighting that heightened policy uncertainty deters green technology financing. ESG integration, while mandated, initially imposes compliance costs without immediate efficiency gains, thereby constraining short-term ET strategies across quantiles. This outcome mirrors the observations of [35,40], who emphasized that ESG adoption, despite long-term benefits, may temporarily burden firms with high transition costs.

5.2. Policy Recommendations

In this study, policies are formulated into two distinct parts: short-term and long-term, offering detailed strategies tailored to various quantile distributions:
Short-Term Policy Recommendations:
(a)
Financial Development (FD): To capitalize on FD’s positive impact on ET at lower quantiles, policymakers should prioritize enhancing financial incentives and regulatory frameworks that promote green investments. This includes expanding tax credits for renewable energy projects, incentivizing green bonds, and fostering partnerships between financial institutions and clean energy developers. By facilitating easier access to capital for sustainable infrastructure, such policies can accelerate the deployment of renewable technologies, particularly in underserved communities and rural areas.
(b)
ICT (Information and Communication Technology): Recognizing ICT’s initial negative impact on ET in lower quantiles, policies should focus on balancing digital innovation with environmental sustainability. This can be achieved by promoting energy-efficient ICT solutions, such as smart grid technologies, AI-driven energy management systems, and incentivizing data centers to adopt renewable energy sources. Additionally, regulatory measures can be implemented to ensure that ICT infrastructure investments align with long-term sustainability goals, minimizing the short-term energy consumption drawbacks associated with digital expansion.
(c)
Climate Policy Uncertainty (CPU): Given CPU’s disruptive impact across quantiles, policy responses should focus on enhancing the stability and credibility of the U.S. climate policy framework. This involves establishing consistent and long-term regulatory signals, institutionalizing climate targets through legislation, and designing adaptive policy instruments that can withstand political and economic cycles. By reducing ambiguity around future climate regulations, tax incentives, and renewable energy mandates, such measures can strengthen investor confidence and reduce the risk premium associated with clean energy investments. Furthermore, fostering domestic energy security through expanded deployment of renewable resources, supporting innovation in green technologies, and enhancing international cooperation on climate governance can insulate the U.S. energy sector from policy-induced volatility. A stable and predictable climate policy environment is essential for mobilizing sustained investments and accelerating the clean energy transition.
(d)
ESG Integration: To address the short-term costs of ESG compliance and maximize its long-term benefits, policymakers should promote regulatory clarity and support mechanisms for firms transitioning towards sustainable practices. This includes incentivizing ESG reporting through tax incentives, promoting transparency in environmental audits, and fostering public-private partnerships to facilitate ESG integration across industries. By aligning financial incentives with environmental and governance standards, policies can foster a business environment where ESG considerations drive innovation and long-term value creation.
Long-Term Policy Recommendations:
(a)
Financial Development (FD): Building on its foundational role, long-term policies should focus on expanding green finance initiatives and strengthening institutional support for sustainable investments. This includes developing standardized green finance guidelines, supporting the growth of green bonds and investment funds, and integrating climate risk assessments into financial decision-making processes. By fostering a robust green finance ecosystem, policymakers can ensure continued capital flows into renewable energy projects, supporting ET goals across all quantiles.
(b)
ICT (Information and Communication Technology): To harness ICT’s potential as a long-term enabler of ET, policies should promote the deployment of advanced digital infrastructure that enhances energy efficiency and integrates renewable energy sources. This involves investing in smart grid technologies, accelerating the adoption of AI-driven energy management systems, and incentivizing ICT innovations that support environmental sustainability. Regulatory frameworks should incentivize the use of ICT for optimizing energy consumption patterns and promoting grid modernization, ensuring that digital advancements contribute positively to long-term ET objectives.
(c)
Climate Policy Uncertainty (CPU): Long-term strategies should prioritize reducing climate policy uncertainty by establishing consistent, transparent, and forward-looking regulatory frameworks that support clean energy development. This includes enacting stable climate legislation, setting clear decarbonization targets, and institutionalizing long-term incentives for renewable energy investments. Such measures can reduce ambiguity for investors and firms, lower risk premiums, and encourage sustained capital flows into green infrastructure. Additionally, promoting energy independence through diversified local renewable resources, enhancing grid resilience via advanced energy storage systems, and strengthening international cooperation on climate and energy governance can help insulate the U.S. energy system from external shocks. By minimizing the destabilizing effects of climate policy uncertainty, these efforts will foster a more predictable policy environment that facilitates long-term planning, drives innovation, and accelerates the transition to a low-carbon economy.
(d)
ESG Integration: As ESG frameworks evolve, long-term policies should continue to support firms in adopting sustainable business practices and aligning with global sustainability standards. This involves implementing stringent climate risk disclosure requirements, fostering industry collaboration on ESG best practices, and incentivizing green innovation through research grants and tax incentives. By embedding ESG considerations into corporate governance and investment decisions, policymakers can enhance the long-term competitiveness of U.S. firms, drive innovation in clean technologies, and accelerate progress towards achieving ET goals across quantiles.

5.3. Limitation and Future Directions

While significant progress can be made through current policies, several limitations must be addressed to ensure an effective energy transition (ET) in the United States. These include persistent challenges in data reliability and availability, regulatory complexities that hinder policy implementation, and the substantial short-term costs associated with integrating Environmental, Social, and Governance (ESG) standards. Technological dependencies, particularly Information and Communication Technology (ICT), also introduce risks such as cybersecurity threats and environmental impacts, which require careful management. In addition, global economic uncertainties and commodity price fluctuations complicate long-term planning and investment in ET. To overcome these challenges, future efforts should focus on enhancing data collection and analysis capabilities, standardizing ESG reporting metrics, and developing integrated policy frameworks across federal, state, and local levels. It is also important for future research to consider the external validity of these findings to other high-income economies, where similar structural challenges may exist but institutional and policy contexts differ. Furthermore, fostering innovation in green technologies, strengthening resilience against economic shocks, building stakeholder capacity, and implementing robust monitoring mechanisms will be essential. By addressing these aspects, the U.S. can navigate complexities and uncertainties while advancing toward a sustainable and resilient energy future.

Author Contributions

Conceptualization and writing—original draft preparation, A.R.A.; Supervision, K.I.; Project administration, A.A. All authors have read and agreed to the published version of the manuscript.

Funding

This research received no external funding.

Data Availability Statement

The original contributions presented in the study are included in the article, further inquiries can be directed to the corresponding author.

Conflicts of Interest

The authors declare no conflict of interest.

References

  1. EIA. Energy Information Association. United States. 2024. Available online: https://www.eia.gov/todayinenergy/detail.php?id=48396 (accessed on 4 March 2024).
  2. EIA. Electricity Consumption in United States. 2025. Available online: https://www.eia.gov/environment/emissions/carbon/ (accessed on 21 July 2025).
  3. EIA. The United States uses a mix of energy sources. 2024. Available online: https://www.eia.gov/energyexplained/us-energy-facts/ (accessed on 10 August 2025).
  4. IEA. International Energy Agency. World Energy Investment 2024: United States. 2024. Available online: https://www.iea.org/reports/world-energy-investment-2024/united-states (accessed on 4 June 2024).
  5. Işık, C.; Ongan, S.; Islam, H.; Balsalobre-Lorente, D.; Sharif, A. ECON-ESG factors on energy efficiency: Fostering sustainable development in ECON-growth-paradox countries. Gondwana Res. 2024, 135, 103–115. [Google Scholar] [CrossRef]
  6. Abakah, E.J.A.; Tiwari, A.K.; Abdullah, M.; Ji, Q.; Sulong, Z. Monetary policy uncertainty and ESG performance across energy firms. Energy Econ. 2024, 136, 107699. [Google Scholar] [CrossRef]
  7. Işık, C.; Ongan, S.; Islam, H.; Pinzon, S.; Jabeen, G. Navigating sustainability: Unveiling the interconnected dynamics of ESG factors and SDGs in BRICS-11. Sustain. Dev. 2024, 32, 5437–5451. [Google Scholar] [CrossRef]
  8. Mohammed, K.S.; Pata, U.K.; Serret, V.; Kartal, M.T. The role of renewable energy and carbon dioxide emissions on the ESG market in European Union. Manag. Decis. Econ. 2024, 45, 5146–5158. [Google Scholar] [CrossRef]
  9. Shahbaz, M.; Topcu, B.A.; Sarıgül, S.S.; Vo, X.V. The effect of financial development on renewable energy demand: The case of developing countries. Renew. Energy 2021, 178, 1370–1380. [Google Scholar] [CrossRef]
  10. Adams, S.; Fotio, H.K. Economic integration and environmental quality: Accounting for the roles of financial development, industrialization, urbanization and renewable energy. J. Environ. Plan. Manag. 2024, 67, 688–713. [Google Scholar] [CrossRef]
  11. Eren, B.M.; Taspinar, N.; Gokmenoglu, K.K. The impact of financial development and economic growth on renewable energy consumption: Empirical analysis of India. Sci. Total Environ. 2019, 663, 189–197. [Google Scholar] [CrossRef]
  12. Kirikkaleli, D.; Adebayo, T.S. Do renewable energy consumption and financial development matter for environmental sustainability? New global evidence. Sustain. Dev. 2021, 29, 583–594. [Google Scholar] [CrossRef]
  13. Adebayo, T.S.; Ozsahin, D.U.; Olanrewaju, V.O.; Uzun, B. Decoding the environmental role of nuclear and renewable energy consumption: A time-frequency perspective. Ann. Nucl. Energy 2025, 223, 111660. [Google Scholar] [CrossRef]
  14. Higón, D.A.; Gholami, R.; Shirazi, F. ICT and environmental sustainability: A global perspective. Telemat. Inform. 2017, 34, 85–95. [Google Scholar] [CrossRef]
  15. Ghallabi, F.; Souissi, B.; Du, A.M.; Ali, S. ESG stock markets and clean energy prices prediction: Insights from advanced machine learning. Int. Rev. Financ. Anal. 2025, 97, 103889. [Google Scholar] [CrossRef]
  16. Aydin, M.; Demirtas, N.; Sogut, Y.; Degirmenci, T. On the road to environmental sustainability: The role of ICT penetration, renewable energy, and investment freedom on load capacity factor. Environ. Dev. Sustain. 2025. [Google Scholar] [CrossRef]
  17. Granger, C.W.J. Investigating Causal Relations by Econometric Models and Cross-spectral Methods. Econometrica 1969, 37, 424–438. [Google Scholar] [CrossRef]
  18. Li, T.-H. Quantile Fourier Transform, Quantile Series, and Nonparametric Estimation of Quantile Spectra. arXiv 2024, arXiv:2211.05844. [Google Scholar] [CrossRef]
  19. Rajendra, M.A.; Setiastuti, S.U. Climate Policy Uncertainty and the Demand for Renewable Energy in the United States of America: Evidence from a Non-Linear Threshold Autoregressive Model. Gadjah Mada Economics Working Paper Series 202312012. 2023. Available online: https://ideas.repec.org//p/gme/wpaper/202312012.html (accessed on 30 July 2025).
  20. Pata, S.K.; Balcilar, M. Identifying the influence of climate policy uncertainty and oil prices on modern renewable energies: Novel evidence from the United States. Clean Technol. Environ. Policy 2024, 27, 2969–2980. [Google Scholar] [CrossRef]
  21. Meo, M.S.; Adebayo, T.S. Role of financial regulations and climate policy uncertainty in reducing CO2 emissions—An application of bootstrap subsample rolling-window Granger causality. Clean Technol. Environ. Policy 2024, 27, 2377–2393. [Google Scholar] [CrossRef]
  22. Chomać-Pierzecka, E.; Błaszczak, B.; Godawa, S.; Kęsy, I. Human Safety in Light of the Economic, Social and Environmental Aspects of Sustainable Development—Determination of the Awareness of the Young Generation in Poland. Sustainability 2025, 17, 6190. [Google Scholar] [CrossRef]
  23. Jin, C. Investigating the intersection of ESG investing, green recovery, and SME development in the OECD. Humanit. Soc. Sci. Commun. 2025, 12, 572. [Google Scholar] [CrossRef]
  24. Kong, X.; Li, Z.; Lei, X. Research on the impact of ESG performance on carbon emissions from the perspective of green credit. Sci. Rep. 2024, 14, 10478. [Google Scholar] [CrossRef]
  25. Paramati, S.R.; Mo, D.; Gupta, R. The effects of stock market growth and renewable energy use on CO2 emissions: Evidence from G20 countries. Energy Econ. 2017, 66, 360–371. [Google Scholar] [CrossRef]
  26. Prempeh, K.B. The role of economic growth, financial development, globalization, renewable energy and industrialization in reducing environmental degradation in the economic community of West African States. Cogent Econ. Financ. 2024, 12, 2308675. [Google Scholar] [CrossRef]
  27. Sun, Z.; Zhang, X.; Gao, Y. The Impact of Financial Development on Renewable Energy Consumption: A Multidimensional Analysis Based on Global Panel Data. Int. J. Environ. Res. Public Health 2023, 20, 3124. [Google Scholar] [CrossRef]
  28. Saba, C.S. Nexus between CO2 emissions, renewable energy consumption, militarisation, and economic growth in South Africa: Evidence from using novel dynamic ARDL simulations. Renew. Energy 2023, 205, 349–365. [Google Scholar] [CrossRef]
  29. Lee, C.-C.; Chen, M.-P.; Yuan, Z. Is information and communication technology a driver for renewable energy? Energy Econ. 2023, 124, 106786. [Google Scholar] [CrossRef]
  30. Hu, J.-L.; Chen, Y.-C.; Yang, Y.-P. The Development and Issues of Energy-ICT: A Review of Literature with Economic and Managerial Viewpoints. Energies 2022, 15, 594. [Google Scholar] [CrossRef]
  31. Shang, Y.; Han, D.; Gozgor, G.; Mahalik, M.K.; Sahoo, B.K. The impact of climate policy uncertainty on renewable and non-renewable energy demand in the United States. Renew. Energy 2022, 197, 654–667. [Google Scholar] [CrossRef]
  32. Athari, S.A.; Kirikkaleli, D. How do climate policy uncertainty and renewable energy and clean technology stock prices co-move? evidence from Canada. Empir. Econ. 2025, 68, 353–371. [Google Scholar] [CrossRef]
  33. Zaier, L.H.; Mokni, K.; Ajmi, A.N. Causality relationships between climate policy uncertainty, renewable energy stocks, and oil prices: A mixed-frequency causality analysis. Future Bus. J. 2024, 10, 112. [Google Scholar] [CrossRef]
  34. Taghizadeh-Hesary, F.; Rasoulinezhad, E. Accelerating the renewable energy transition in the EU: The role of smart technologies and ESG investments. Discov. Sustain. 2025, 6, 692. [Google Scholar] [CrossRef]
  35. Ren, M.; Zhou, J.; Si, J.; Wang, G.; Guo, C. The Impact of ESG Performance on Green Innovation among Traditional Energy Enterprises—Evidence from Listed Companies in China. Sustainability 2024, 16, 3542. [Google Scholar] [CrossRef]
  36. Policy Uncertainty. 2023. Available online: https://www.policyuncertainty.com/us_monthly.html (accessed on 2 March 2023).
  37. WDI. World Development Indicator. 2024. Available online: https://data.worldbank.org (accessed on 1 April 2024).
  38. Ahmed, Z.; Nathaniel, S.P.; Shahbaz, M. The criticality of information and communication technology and human capital in environmental sustainability: Evidence from Latin American and Caribbean countries. J. Clean. Prod. 2021, 286, 125529. [Google Scholar] [CrossRef]
  39. Cheng, J.; Mohammed, K.S.; Misra, P.; Tedeschi, M.; Ma, X. Role of green technologies, climate uncertainties and energy prices on the supply chain: Policy-based analysis through the lens of sustainable development. Technol. Forecast. Soc. Change 2023, 194, 122705. [Google Scholar] [CrossRef]
  40. Zhao, Y.; Ramzan, M.; Brika, S.K.; Eweade, B.S. Uncertainty in climate and ESG policies: Implications for renewable energy investments. Appl. Econ. 2025, 1–15. [Google Scholar] [CrossRef]
  41. Athari, S.A. The impact of financial development and technological innovations on renewable energy consumption: Do the roles of economic openness and financial stability matter in BRICS economies? Geol. J. 2024, 59, 288–300. [Google Scholar] [CrossRef]
  42. Ahmed, Z.; Le, H.P. Linking Information Communication Technology, trade globalization index, and CO2 emissions: Evidence from advanced panel techniques. Environ. Sci. Pollut. Res. 2021, 28, 8770–8781. [Google Scholar] [CrossRef] [PubMed]
  43. Bouri, E.; Iqbal, N.; Klein, T. Climate policy uncertainty and the price dynamics of green and brown energy stocks. Finance Res. Lett. 2022, 47, 102740. [Google Scholar] [CrossRef]
  44. Hu, Z.; Borjigin, S. The amplifying role of geopolitical Risks, economic policy Uncertainty, and climate risks on Energy-Stock market volatility spillover across economic cycles. N. Am. J. Econ. Finance 2024, 71, 102114. [Google Scholar] [CrossRef]
  45. Yadav, A.; Bekun, F.V.; Ozturk, I.; Ferreira, P.J.S.; Karalinc, T. Unravelling the role of financial development in shaping renewable energy consumption patterns: Insights from BRICS countries. Energy Strategy Rev. 2024, 54, 101434. [Google Scholar] [CrossRef]
  46. Appiah-Otoo, I.; Acheampong, A.O.; Song, N.; Chen, X. The impact of information and communication technology (ICT) on carbon dioxide emissions: Evidence from heterogeneous ICT countries. Energy Environ. 2023, 34, 3080–3102. [Google Scholar] [CrossRef]
  47. Sadorsky, P. The impact of financial development on energy consumption in emerging economies. Energy Policy 2010, 38, 2528–2535. [Google Scholar] [CrossRef]
  48. Adebayo, T.S. How do energy and precious metals markets respond to climate policy uncertainty? A multi-frequency quantile framework. Appl. Econ. Lett. 2025, 3, 1–7. [Google Scholar] [CrossRef]
  49. Charfeddine, L.; Hussain, B.; Kahia, M. Analysis of the Impact of Information and Communication Technology, Digitalization, Renewable Energy and Financial Development on Environmental Sustainability. Renew. Sustain. Energy Rev. 2024, 201, 114609. [Google Scholar] [CrossRef]
  50. Haldar, A.; Sethi, N. Environmental effects of Information and Communication Technology—Exploring the roles of renewable energy, innovation, trade and financial development. Renew. Sustain. Energy Rev. 2022, 153, 111754. [Google Scholar] [CrossRef]
  51. Xu, Y.; Li, M.; Yan, W.; Bai, J. Predictability of the renewable energy market returns: The informational gains from the climate policy uncertainty. Resour. Policy 2022, 79, 103141. [Google Scholar] [CrossRef]
  52. Siddique, M.A.; Nobanee, H.; Hasan, M.B.; Uddin, G.S.; Hossain, M.N.; Park, D. How do energy markets react to climate policy uncertainty? Fossil vs. renewable and low-carbon energy assets. Energy Econ. 2023, 128, 107195. [Google Scholar] [CrossRef]
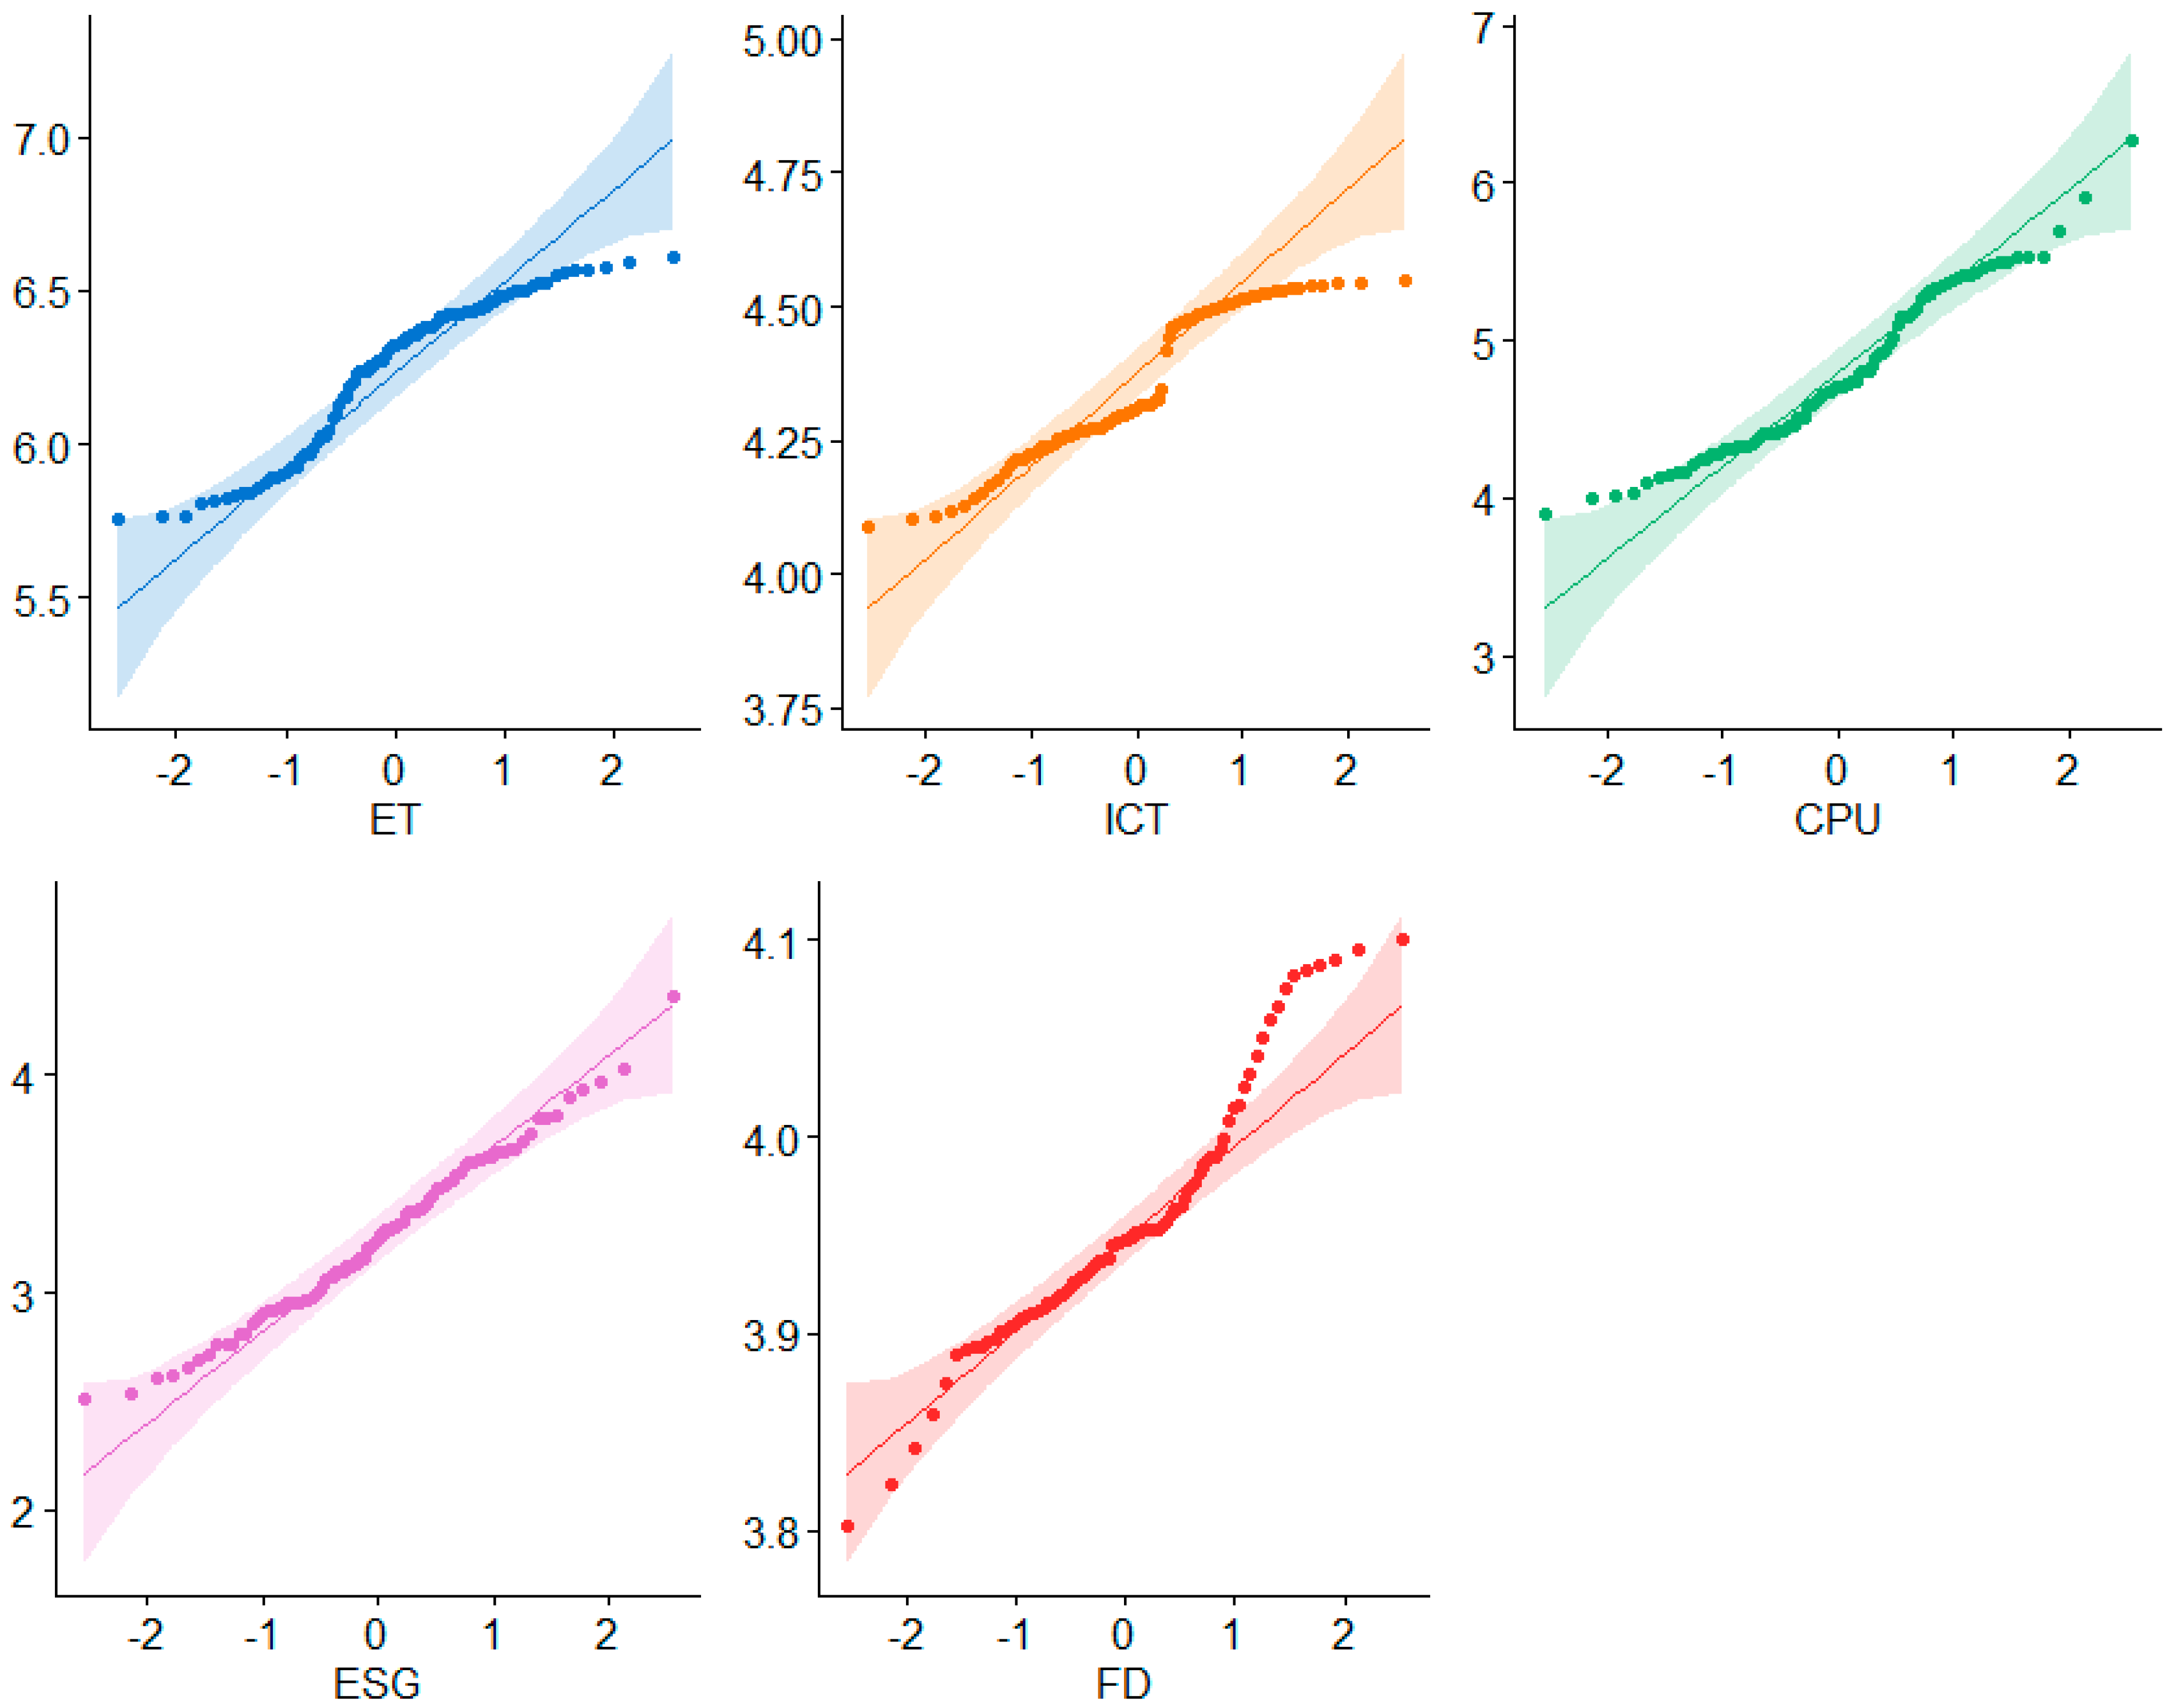
Figure 1. QQ Plot Estimates.
Energies 18 05301 g001
Figure 2. Shapiro–Wilk Test Estimate (*** p < 1% and ** p < 5%).
Energies 18 05301 g002
Figure 3. (a) QADF Test Estimate. Note: The horizontal and vertical axes depict quantiles and test statistics, respectively. The black solid, dashed, and dotted lines represent the 10%, 5%, and 1% levels of significance. CPU is represented in blue, ESG in orange, ET in green, FD in red, and ICT in purple. (b) QPP Estimates. Note: The horizontal and vertical axes depict quantiles and test statistics, respectively. The black solid, dashed, and dotted lines represent the 10%, 5%, and 1% levels of significance. CPU is represented in blue, ESG in orange, ET in green, FD in red, and ICT in purple.
Energies 18 05301 g003
Figure 4. QPSS Estimates. Note: The F-test results are evaluated against the critical values provided by the bounds testing approach. At the 10% significance level, the lower bound (I(0)) critical value is 4.04, while the upper bound (I(1)) is 4.78. At the 5% level, the critical values are 4.94 for I(0) and 5.73 for I(1). For the 1% significance level, the corresponding critical values are 6.84 for I(0) and 7.84 for I(1). These thresholds serve as benchmarks for determining the presence of cointegration in the ARDL or QARDL framework. Subfigures (ad) shows QPSS ET and FD, QPSS ET and ICT, QPSS ET and CPU and QPSS ET and ESG.
Energies 18 05301 g004
Figure 5. Plot of the QARDL Estimate. Note: beta1, beta2, beta3, beta4 denotes FD, ICT, CPU and ESG in the short-term while delta1, delta2, delta3, and delta4 denotes FD, ICT, CPU and ESG in the long-term.
Energies 18 05301 g005
Figure 6. Quantile Granger Causality. Note: The vertical axis represents the F-statistics, while the horizontal axis denotes the quantiles. The green, blue, and purple dashed lines correspond to the 10%, 5%, and 1% significance levels, respectively. The null hypothesis is rejected when the F-statistic exceeds the critical value at the corresponding significance level.
Energies 18 05301 g006
Table 1. List of Studies.
Author(s)Period(s)Nation(s)Method(s)Finding(s)
Impact of Financial Development on Energy Transition
[9]1994–201534 upper-middle-income developing countriesPanel cointegration, FMOLSFD ↑ ET
[11]1971–2015IndiaMaki cointegration, DOLS, VECMFD ↑ ET
[26]1990–2018GhanaARDL, FMOLS, VECMFD ↑↓ ET
[27]1990–2019ASEAN + 3 countriesPanel ARDLFD ↑↓ ET
[25]1991–2012G20, OECD, EU countriesFMOLS, STIRPAT modelFD ↑ ET
Impact of ICT on Energy Transition
[28]2001–2020Africa (panel, ~29 countries)PARDLICT ↑ ET
[16]1996–2021DenmarkregressionICT → ET
[29]2000–2019126 countries (global)Panel regressionICT ↑ ET
[30]Not DefinedMultinational studiesReviewICT ↑ ET
Impact of Climate Policy Uncertainty on Energy Transition
[31]2000–2022United StatesARDL/FMOLS/DOLSCPU ↑ ET
[19]Not DefinedUnited StatesNon-linear threshold AR modelCPU ↓ ET
[32]2013–2022CanadaWavelet Power Spectrum & CoherenceCPU ↑ ET
[20]1987–2024United StatesGranger causalityCPU ↑ ET
[21]1989–2023USARolling WindowCPU ↑ ET
[33]variesdeveloped countriesPanel regressionCPU ↑ ET
Impact of ESG Sustainability on Energy Transition
[35]2011–2024China (traditional energy firms)Zero-inflated negative binomial modelESG ↑ ET
[24]2013–2022China (provinces)Threshold regression/fixed effectsESG ↑↓ ET
[23]2005–2020OECD (10 countries)Panel regressionESG ↑ ET
[34]2000–2021EU-10 nationsVECM & FMOLSESG ↔ ET
[15]10 countriesMachine learning forecastingESG ↑ ET
↑ denote increase and ↓ denote decrease.
Table 2. Data Sources and Measurement.
SignVariablesMeasurementSources
CPUClimate Policy UncertaintyIndex[36]
ESGEnvironmental Social Governance Sustainability Index[36]
ETEnergy Transition(Trillion Btu)[1]
FDFinancial DevelopmentDomestic credit to private sector by banks (% of GDP)[37]
ICTInformation and Communication TechnologyIndividuals using the Internet (% of population)[37]
Table 3. Descriptive Statistics.
StatisticCPUESGETFDICT
Minimum3.8962.5125.7593.8024.091
Maximum6.2754.3576.614.1014.547
Mean4.7823.2536.2453.9554.351
Median4.7013.2526.3223.9474.311
Stdev0.5010.3750.2470.0610.135
Skewness0.4850.26−0.5390.5670.017
Kurtosis2.5342.7081.9893.4431.713
Jarque-Bera4.339 *1.3348.187 ***5.555 ***6.213 ***
Note: *** p < 0.01 and * p < 0.1.
Table 4. Estimation results of full sample QARDL model.
Quantiles ( τ ) α ( τ ) ρ ( τ ) δ F D ( τ ) δ I C T ( τ ) δ C P U ( τ ) δ E S G ( τ ) ζ ( τ ) φ F D ( τ ) φ I C T ( τ ) φ C P U ( τ ) φ E S G ( τ )
0.05Coefficient−0.002−0.218 ***0.357−0.072−0.01 *−0.1690.896 *0.260 ***−0.017 **0.0020.005
SE0.0040.0470.2380.0390.0180.0970.1850.1580.0080.0070.043
0.10Coefficient−0.005 **−0.056 *0.443 **−0.049 *−0.031 ***−0.240 ***0.835 ***0.185 **−0.005 *0.0010.016
SE0.0020.0320.1720.0290.0150.0720.1130.0960.0050.0040.027
0.20Coefficient−0.004 **−0.0430.487 ***−0.053 *−0.036 **−0.264 ***0.828 ***0.152 *−0.007 **0.0000.035 *
SE0.0020.0280.1350.030.0180.0500.1000.0850.0040.0040.024
0.30Coefficient−0.003−0.020 **0.499−0.047 ***−0.009−0.2700.824 ***0.141 ***−0.002 *−0.0020.034 *
SE0.0010.0260.140.0320.0220.0440.0930.0790.0040.0040.022
0.40Coefficient−0.001−0.0160.470−0.041 ***0.010−0.2540.818 ***0.119 ***−0.001 **−0.0010.004
SE0.0010.0240.1450.0350.0220.0580.090.0760.0040.0040.021
0.50Coefficient0.000−0.0320.3200.003 **0.005−0.302 ***0.745 ***0.098 ***0.000 *−0.001−0.004 ***
SE0.0010.0250.1260.0260.0210.0670.0870.0750.0040.0030.021
0.60Coefficient0.000−0.020.4190.010 ***−0.013−0.381 **0.739 ***0.062 ***0.0010.001−0.006
SE0.0010.0260.0810.0170.0160.0570.0890.0760.0040.0040.022
0.70Coefficient0.001−0.010.4350.002 ***−0.014−0.401 *0.709 ***0.049 ***0.000−0.0010.001
SE0.0010.0260.0850.0180.0150.0480.0910.0780.0040.0040.022
0.80Coefficient0.003−0.013 **0.462−0.013 ***−0.018−0.411 **0.447 ***0.155 *0.002−0.0020.005
SE0.0010.0280.0910.0180.0170.0430.1010.0860.0040.0040.025
0.90Coefficient0.007 ***0.0070.429 ***0.020−0.043 ***−0.4240.368 **0.082 ***−0.003 ***0.0010.034
SE0.0020.0350.1090.0220.0220.0350.1240.1060.0050.0050.03
0.95Coefficient0.008 *0.0020.583 ***−0.009−0.046 *−0.453 ***0.423 ***0.090.000−0.0050.04
SE0.0020.0380.1210.0260.0270.0460.1330.1140.0060.0050.033
Note: *** p < 0.01; ** p < 0.05 and * p < 0.1. We use the Bayesian Information Criterion to determine the optimal lag orders. We use the Bayesian Information Criterion to determine the optimal lag orders p and q as 2 and 1.
Disclaimer/Publisher’s Note: The statements, opinions and data contained in all publications are solely those of the individual author(s) and contributor(s) and not of MDPI and/or the editor(s). MDPI and/or the editor(s) disclaim responsibility for any injury to people or property resulting from any ideas, methods, instructions or products referred to in the content.