Article

Design and Experimental Validation of a Cluster-Based Virtual Power Plant with Centralized Management System in Compliance with IEC Standard

by
Putu Agus Aditya Pramana
1,
Akhbar Candra Mulyana
1,
Khotimatul Fauziah
2,*,
Hafsah Halidah
2,
Sriyono Sriyono
1,
Buyung Sofiarto Munir
1,
Yusuf Margowadi
2,
Dionysius Aldion Renata
2,
Adinda Prawitasari
2,
Annisaa Taradini
2,
Arief Kurniawan
2 and
Kholid Akhmad
2
1
Transmission and Distribution Department, PLN Research Institute, PT PLN (Persero), Jakarta 12760, Indonesia
2
Research Center for Energy Conversion and Conservation, National Research and Innovation Agency, Banten 15314, Indonesia
*
Author to whom correspondence should be addressed.
Energies 2025, 18(19), 5300; https://doi.org/10.3390/en18195300
Submission received: 19 August 2025 / Revised: 11 September 2025 / Accepted: 20 September 2025 / Published: 7 October 2025
(This article belongs to the Section F2: Distributed Energy System)

Abstract

As power systems decentralize, Virtual Power Plants (VPPs) offer a promising approach to coordinate distributed energy resources (DERs) and enhance grid flexibility. However, real-world validation of VPP performance in Indonesia remains limited, especially regarding internationally aligned test standards. This study presents the design and experimental validation of a cluster-based VPP framework integrated with a centralized VPP Management System (VMS). Each cluster integrates solar photovoltaic (PV) system, battery energy storage system (BESS), and controllable load. A Local Control Unit (LCU) manages cluster operations, while the VMS coordinates power export–import dispatch, cluster-level aggregation, and grid compliance. The framework proposes a scalable VPP architecture and presents the first comprehensive experimental verification of key VPP performance indicators, including response time, adjustment rate, and accuracy, in the Indonesian context. Testing was conducted in alignment with the IEC TS 63189-1:2023 international standard. Results suggest real time responsiveness and indicate that, even at smaller scales, VPPs may contribute effectively to voltage control while exhibiting minimal influence on system frequency in interconnected grids. These findings confirm the capability of the proposed VPP framework to provide reliable real time control, ancillary services, and aggregated energy management. Its cluster-based architecture supports scalability for broader deployment in complex grid environments.

1. Introduction

The increasing integration of distributed energy resources (DERs), including solar photovoltaic (PV) systems, energy storage systems (ESS), and flexible loads, has fundamentally transformed modern power system operations [1,2,3]. While DERs contribute to decarbonization and energy access, they also present challenges for grid stability, power quality, and coordinated control, particularly in islanded and weak-grid environments [4,5]. In the context of Indonesia, an archipelagic nation with growing renewable energy ambitions, effective DER integration requires innovative strategies that go beyond conventional grid expansion [4,5]. VPPs have emerged as a promising solution for aggregating and coordinating DERs into a unified, dispatchable entity [6,7,8]. A VPP is a virtual aggregation of DERs, designed to enhance grid stability and address challenges of grid transformation driven by high DER penetration [9,10,11]. VPPs utilize centralized control systems with bi-directional communication for the remote and automated coordination of DERs [12,13]. Implementation combines software, hardware, ICT, a management center, and all DER units as controllable entities [14]. Blockchain technology may further enhance VPPs by enabling decentralized energy trading and increasing user participation in energy markets [15]. Among the various configurations, clustered VPPs—where DERs are grouped into localized clusters under centralized management—demonstrate high flexibility and scalability, especially in archipelagic countries like Indonesia [16]. This cluster-based VPPs framework offers a scalable approach that aligns with Indonesia’s geographical and grid infrastructure constraints.
Despite the growing role of VPPs in grid flexibility and integrating renewable energy, research on real-time control for dynamic operations remains limited. When a VPP is assigned to supply power to the grid, its control system must dispatch commands to DERs to deliver the required output. Thus, evaluating VPP responsiveness to disturbances such as setpoint changes, PV fluctuations, load variations, or system faults is essential [17,18]. As VPPs gain importance, validating their performance under real-world conditions has also become crucial [19].
Most scholarly work on VPP control has focused on three primary domains: power setpoint tracking, frequency regulation, and voltage management [20]. For example, a real-time framework has been designed and tested to improve VPP control and provide ancillary services [21]. Furthermore, compliance with technical standards and system performance is essential for VPP development. Real-time VPPs must follow international standards on frequency and voltage regulation to ensure enhanced grid services from DER aggregators [22].
To contextualize these control and operational considerations, it is necessary to review the broader advances in VPP development. Various studies have proposed different architectures, control methods, and market participation strategies for VPPs. This section summarizes existing work relevant to VPP architecture, DER coordination, grid interaction, and experimental validation. Despite recent advances in technology, important research gaps remain unaddressed. Notably, there is a lack of scalable clustered VPP architectures capable of efficiently managing large-scale and decentralized energy resources [23,24,25,26]. Current real-time control methodologies are insufficient, necessitating control algorithms that can effectively manage operational disturbances [27,28]. Furthermore, grid import/export dynamics are often oversimplified, failing to capture the complex behavior of energy transfers and grid interactions [29]. In addition, the limited use of actual data and Hardware-in-the-Loop (HIL) configurations continues to hinder a robust assessment of the practical feasibility and reliability of VPP systems [30]. The gaps in previous research highlight the need for complete frameworks, as illustrated in Table 1, which compares past studies with the contributions of this study.
Although VPPs have been widely studied, few works address their implementation in countries with distinct regulations and infrastructure, limiting their practical adoption. In Indonesia, VPPs offer strong potential given the nation’s archipelagic structure and limited centralized grid. Moreover, the Indonesian government currently employs a quota system to limit rooftop PV installations according to the power system’s capability in response to intermittency. VPP development could ease these quota restrictions and support the government’s plan to deploy solar PV in every village, enabling aggregation of excess power. However, current regulations and technical standards remain insufficient, particularly regarding decentralized control, interoperability, and real-time coordination. In addition, Indonesia’s power system is still vertically integrated under a single state-owned utility and lacks an open electricity market. Therefore, this work emphasizes the technical implementation of VPP, aiming to demonstrate its operational feasibility as a reference for future regulatory and market development.
To address these challenges, this study proposes a cluster-based VPP framework that integrates scalable architecture, real-time monitoring and control, and experimental validation. The system integrates PV, BESS, and controllable loads into clusters managed by LCUs and coordinated by a centralized VMS. LCUs manage local operations, while the VMS controls power exchange and cluster–grid interactions. Real-time data and decentralized control are enabled through IoT, ensuring higher efficiency and stability compared to traditional SCADA [35]. LCUs and the VMS communicate using the MQTT protocol for efficient and lightweight data exchange.
The main contributions of this work are:
  • Proposing a scalable cluster-based VPP architecture with a centralized energy management system;
  • Developing a control strategy for managing power export and import using LCU and VMS;
  • First applied in Indonesia, conducting comprehensive experimental verification of key performance indicators, including response time, adjustment rate, and accuracy, in accordance with IEC TS 63189-1:2023;
  • Validating the impact of power exchange in small-scale VPP on the frequency and voltage of the large-scale interconnected grid system.
This paper is organized as follows: Section 1 introduces the topic and reviews related work; Section 2 explains the proposed methodology, including components, architecture, cluster configuration, and control strategies; Section 3 details the experimental setup and test scenarios; Section 4 discusses the results of the system performance; and Section 5 concludes with directions for future work.

2. Materials and Methods

2.1. System Components

2.1.1. PV Systems

The PV system consists of two separate arrays, each with a capacity of 4 kWp, installed on the rooftop. Each array is connected to a single-phase on-grid inverter with a rated capacity of 3 kWp. The PV arrays generate a DC voltage of 400 V, which serves as the input to the on-grid inverters. The output of each inverter is 220 V AC, which is then connected to the input terminals of the battery inverter. This configuration enables the integration of the generated PV solar power into the energy storage system, while also allowing for synchronization with other system components.

2.1.2. BESS

The Battery Energy Storage System consists of two main components: the battery and the battery inverter (BI). The battery used in this system is a Lithium Iron Phosphate (LiFePO4) type, selected for its safety, thermal stability, and long operational life. It has a nominal voltage of 51.2 V and operates within a voltage range of 40 V to 58.4 V. With a nominal capacity of 100 Ah and an energy rating of 5 kWh, the battery can deliver 5 kW of power continuously for one hour, supported by a C-rating of 1.0. The discharge cutoff voltage is 44.8 V, and the equalized charge voltage is 58.4 V, ensuring efficient and reliable performance while maintaining battery health. This battery is well-suited for integration with inverters and battery management systems in the ESS. The battery inverter (BI) serves as a crucial interface that converts direct current (DC) from the battery into alternating current (AC), making it compatible with household appliances and electronic equipment. In off-grid solar power systems, the BI plays an essential role by providing backup power during outages or when the main power source is unavailable. The installed BI has a rated power output of 6000 W, supports AC voltage in the range of 202–253 V, and can deliver a maximum current of 20 A (equivalent to 4.6 kVA). It operates at a frequency of 50 Hz with a DC input voltage range of 41–63 V, and achieves a conversion efficiency of 95.8%. Additionally, it supports multiple battery types, including Lead-acid (FLA/VRLA), Lithium-ion, and LiFePO4. The BI is further equipped to supply both active and reactive power on demand, enabling dynamic support for grid stability and power quality.

2.1.3. Controllable Load

The controllable load operates when a power adjustment is required on the load side during the control process within a virtual power plant, such as when excess power is undesirably flowing into the grid or when reverse power is not allowed. In addition, during active power import, the controllable load absorbs the incoming power demand. It is composed of a 5 kW dummy load, equipped with a Solid State Relay (SSR) module and an ESP32 microcontroller, which functions as an automatic electronic switch, enabling control via the Local Control Unit (LCU).

2.1.4. LCU

The Local Control Unit is a device that serves as an interface between field equipment and the control system, transmitting measurement data upstream and executing control commands downstream. The LCU must be equipped with the capability to acquire data and manage Distributed Energy Resources (DER), which include generation units, energy storage systems (e.g., BESS), and controllable loads connected to the system. The collected data must meet the required type and level of accuracy to support both operational needs and long-term energy system planning. The LCU is implemented using a Raspberry Pi to perform main control functions and a Programmable Logic Controller (PLC) to interface with sensors and actuators.
For energy trading purposes, the LCU should monitor parameters such as active and reactive power, device operational status (on/off), and operational costs. The data acquisition frequency (sampling period) is determined by the requirements of the specific electricity market platform, commonly ranging from 5 to 15 min [22]. For services related to frequency regulation or power reserve provisioning, similar data are required. However, higher temporal resolution—such as one-minute intervals—is typically necessary to enable fast system response and ensure real-time adaptability to dynamic grid conditions [22]. However, the selection of the sampling period in this study was not based on the requirements of electricity market, due to Indonesia’s vertically integrated market. It was based on the state-owned electricity provider standard regarding Remote Terminal Unit (RTU) and SCADA gateway specification [36]. A sampling period of 1 s was selected to meet the telemetering requirement, which states that the master station must receive device updates at least every 2 s.

2.1.5. VMS

VMS is a system that enables dispatch management and coordinated control of various VPP components, including generators, loads, and energy storage units, while facilitating orderly participation in electricity market trading. The designed VMS architecture comprises several components, including the VMS Communication Service, Database, VMS Application Service, and MQTT Broker. The VMS Comm Service is responsible for handling secure and reliable data exchange between the VMS core and distributed field devices, ensuring the timely delivery of monitoring data and control commands.
The database serves as the central repository for both historical and real-time operational data, such as device status, performance logs, and control setpoints. A two-tiered data management architecture is implemented, combining local and centralized storage. LCUs record data in CSV files. Aggregated data is transmitted to a centralized database using PostgreSQL with the TimescaleDB extension. PostgreSQL manages relational data (such as managing multiple VPP units and their parameter settings), while TimescaleDB handles time-series data, ensuring scalable storage and analytical capability.
The VMS App Service hosts the core logic and functionalities of the system, including energy management algorithms, scheduling optimization, grid-event response coordination, and user interfaces for system operators. Meanwhile, the MQTT Broker enables lightweight and real-time communication between the VMS and distributed LCUs via the MQTT protocol, allowing bidirectional data flow and low-latency control execution. This modular and scalable architecture ensures that the VMS can operate reliably across a wide range of grid conditions and application scenarios.

2.2. System Architecture

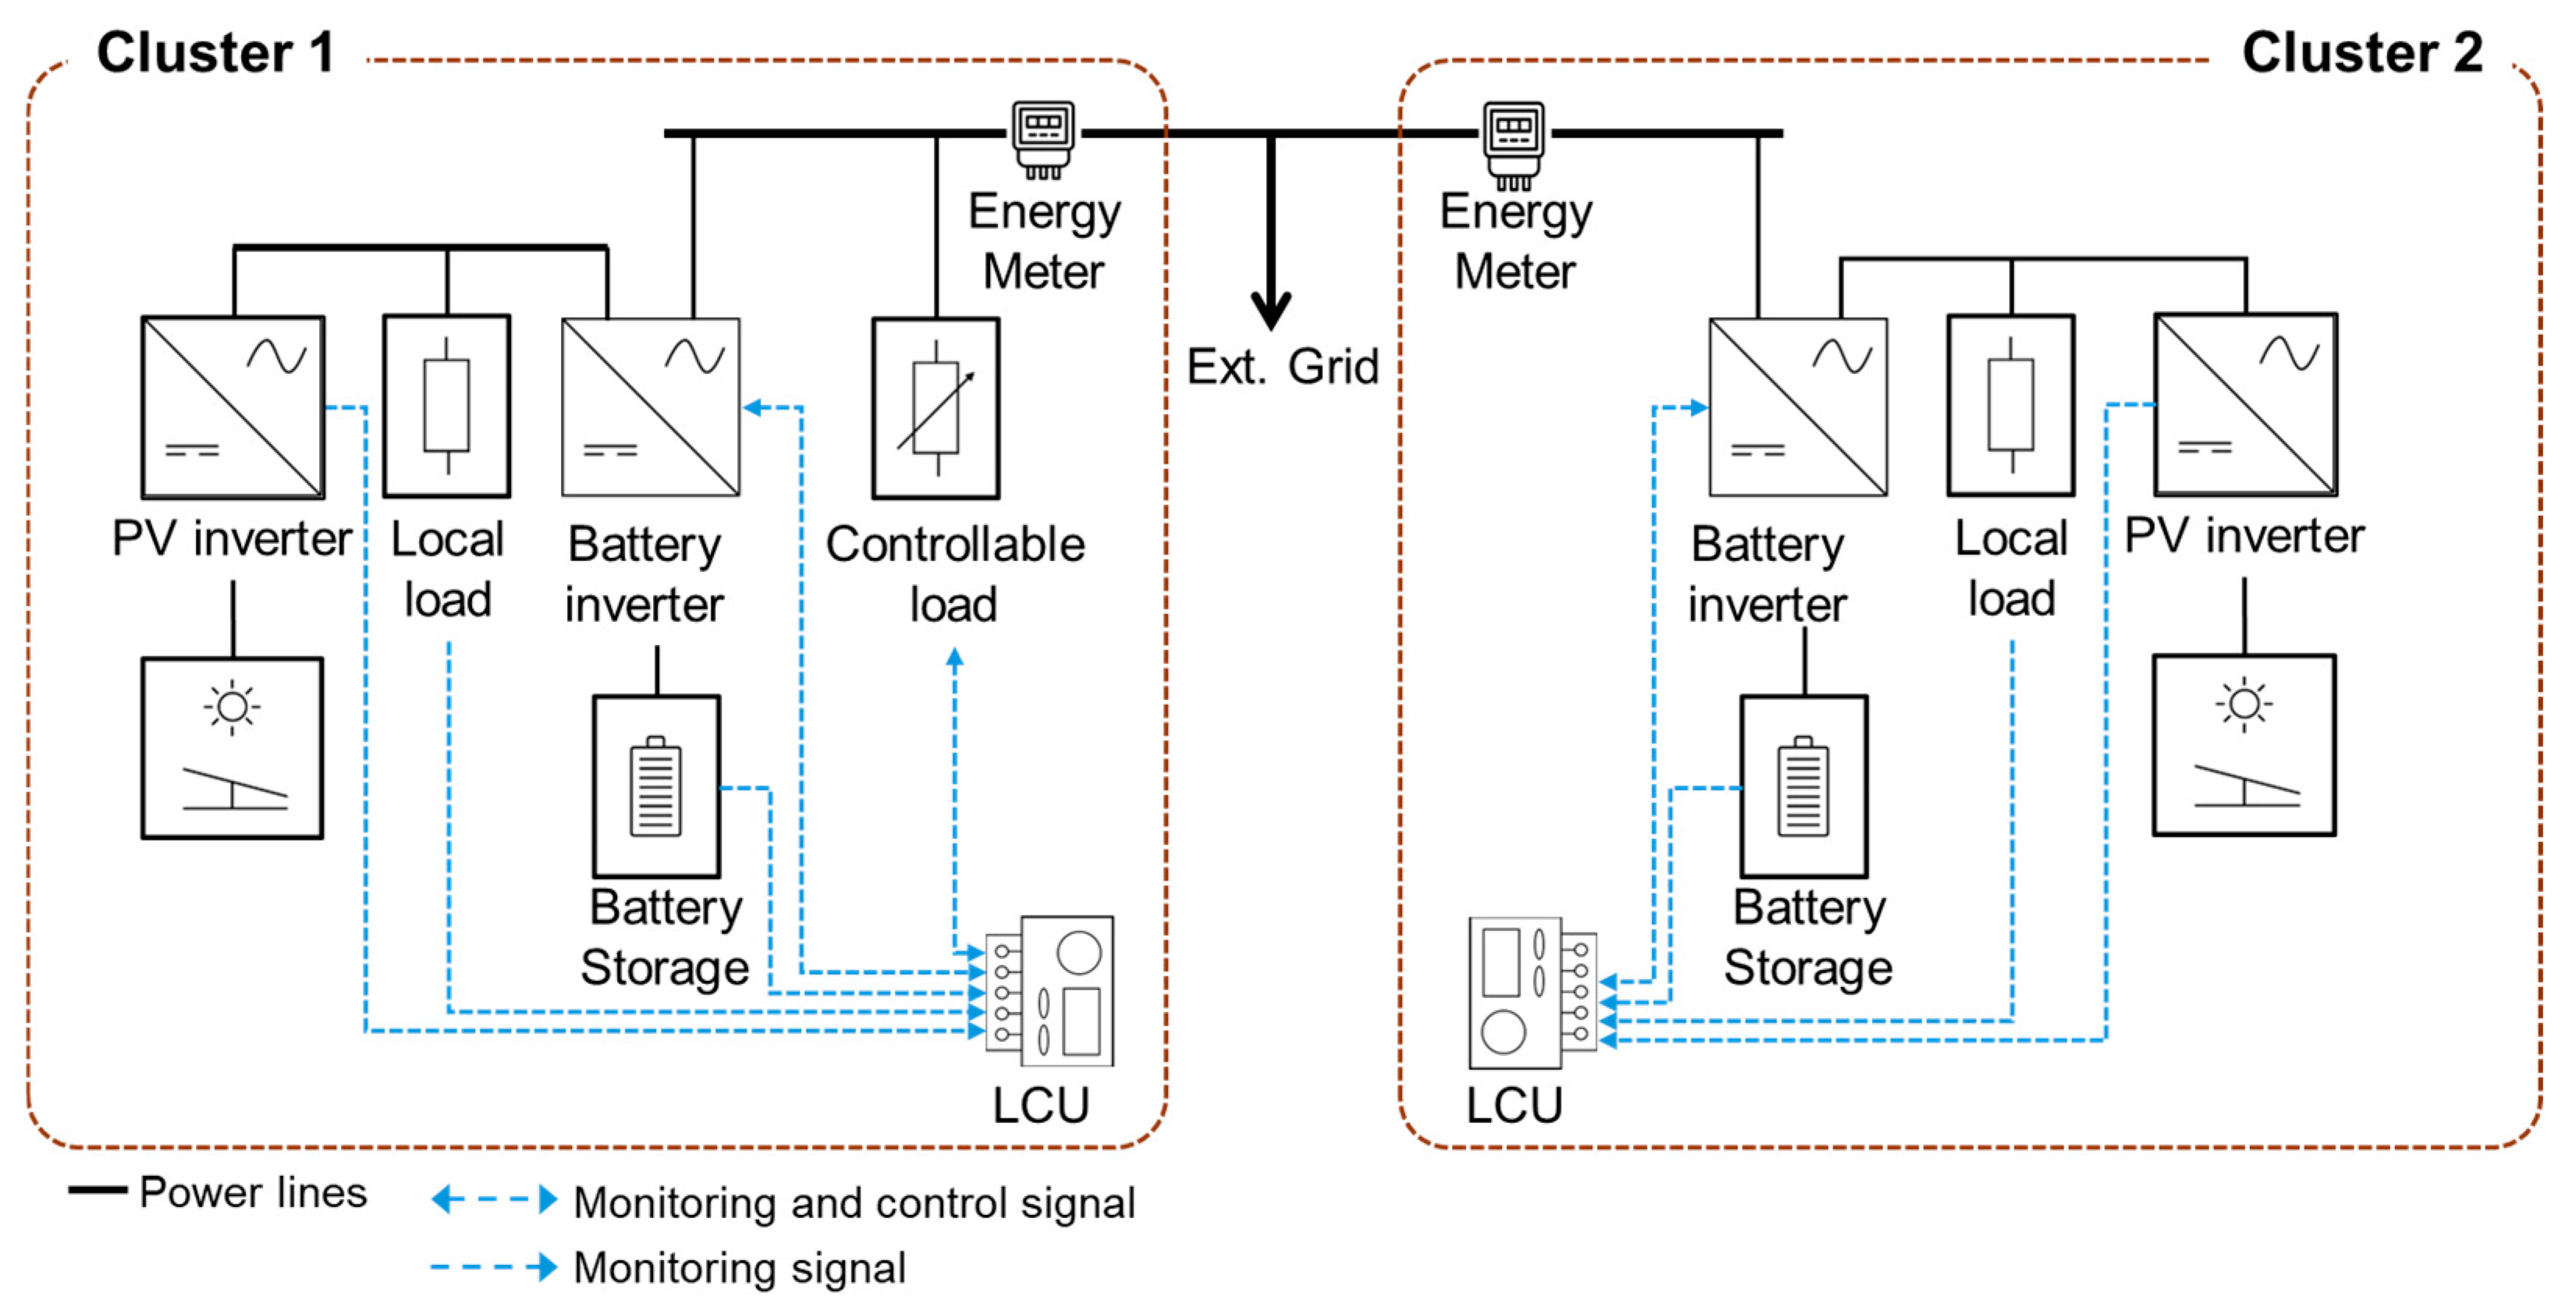
A VPP cluster could consist of multiple distributed solar PVs, battery energy storage systems, and uncontrollable local loads with a centralized controllable load. Each cluster has an LCU that manages day-to-day energy usage while limiting power export to the grid. The LCU will give permission to export only when a request has been received to export to the grid. In this study, a single VPP cluster is configured with one solar PV system, one BESS unit, a local AC load, and a controllable load, as depicted in Figure 1. The LCU monitors data from PV inverter, local load, BESS, and grid export (measured via an energy meter). It also controls and monitors the battery inverter and the controllable load.
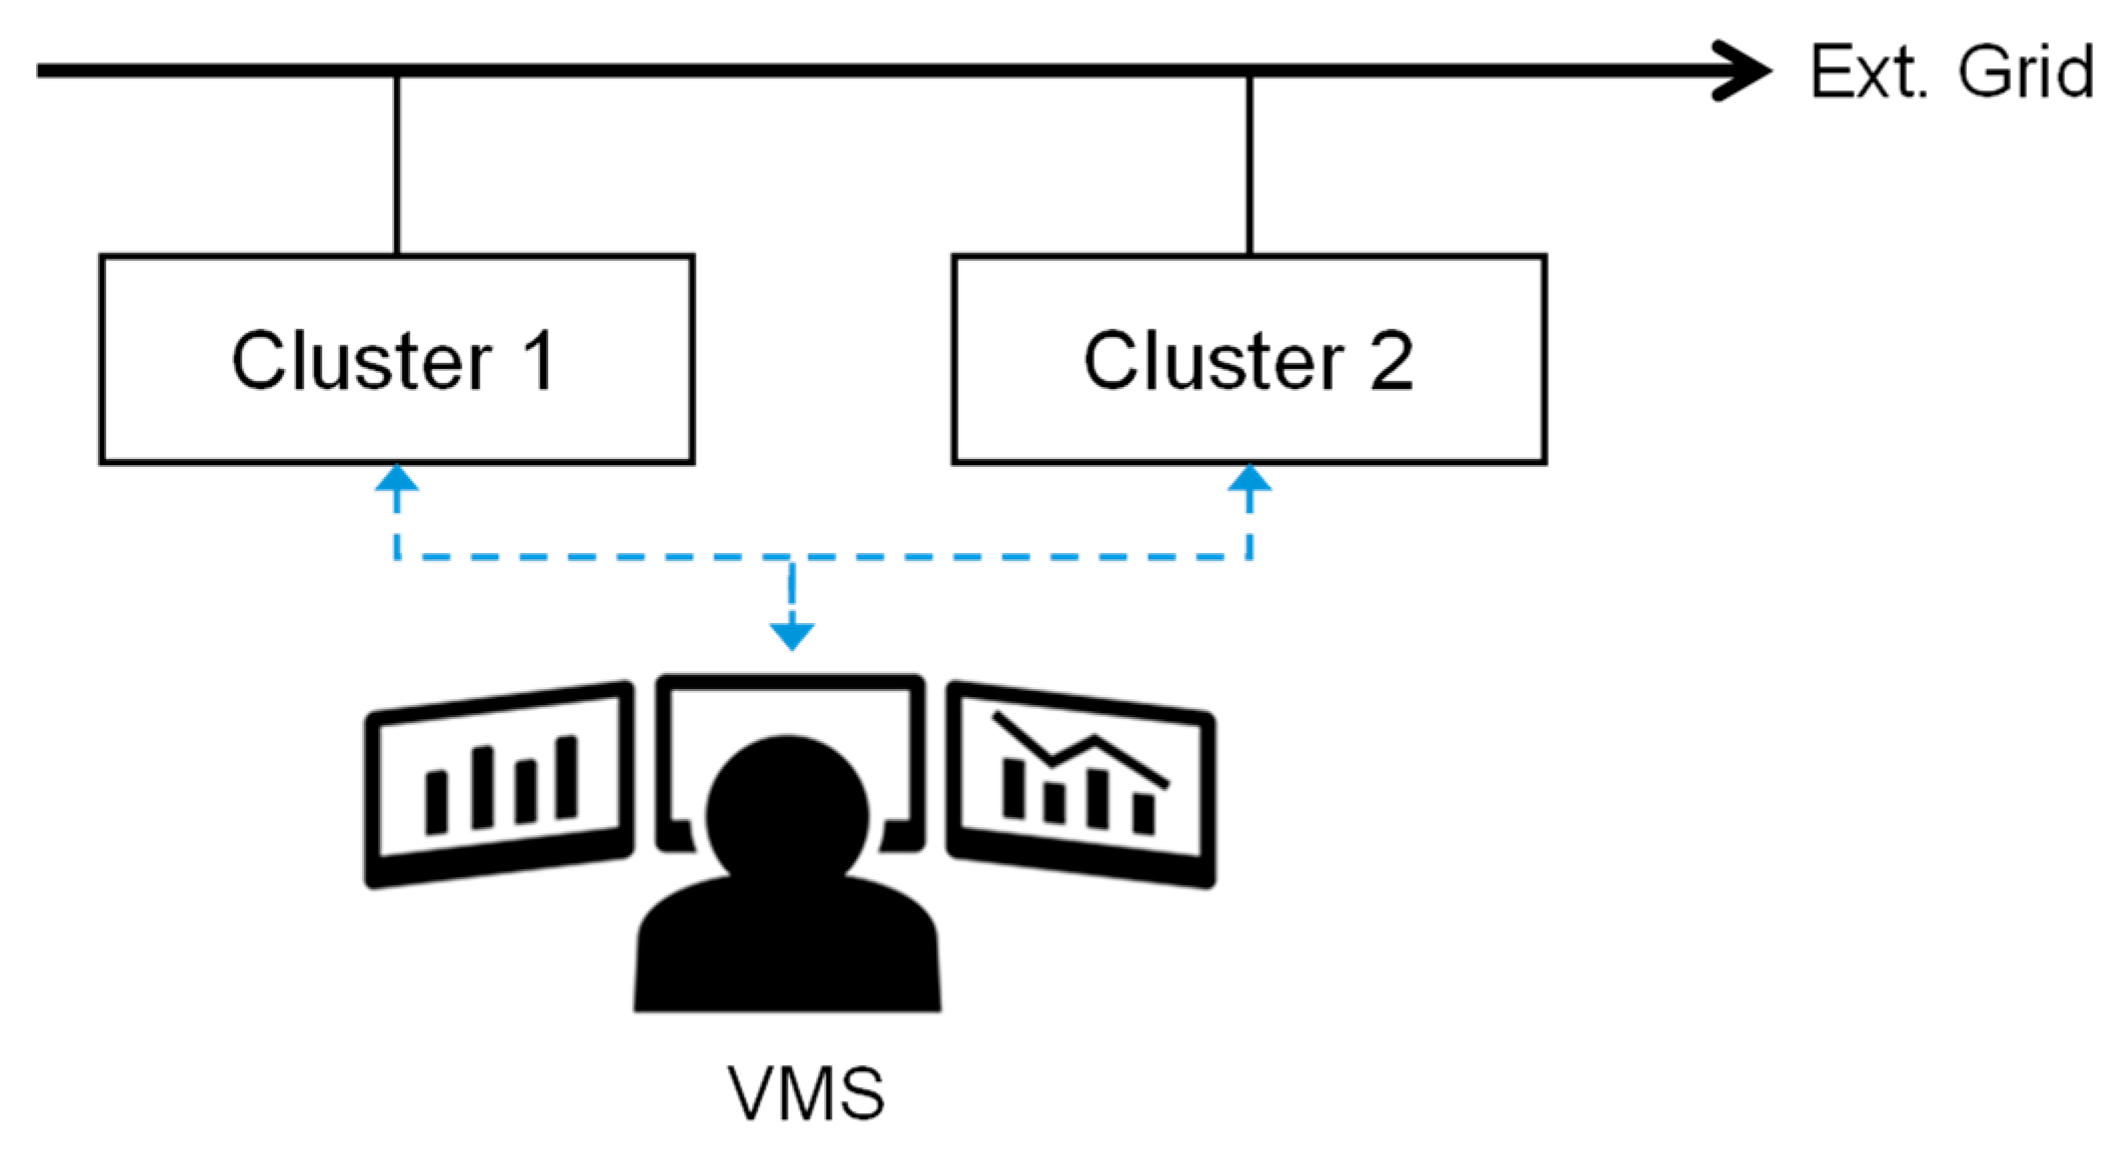
The LCU from a VPP cluster is then connected to the VMS. In this study, 2 VPP clusters are used to simulate multiple clusters interacting with VMS, as illustrated in Figure 2. Both clusters power the low-voltage lines in the same building.

2.3. Control and Management Strategy

2.3.1. Control Strategy

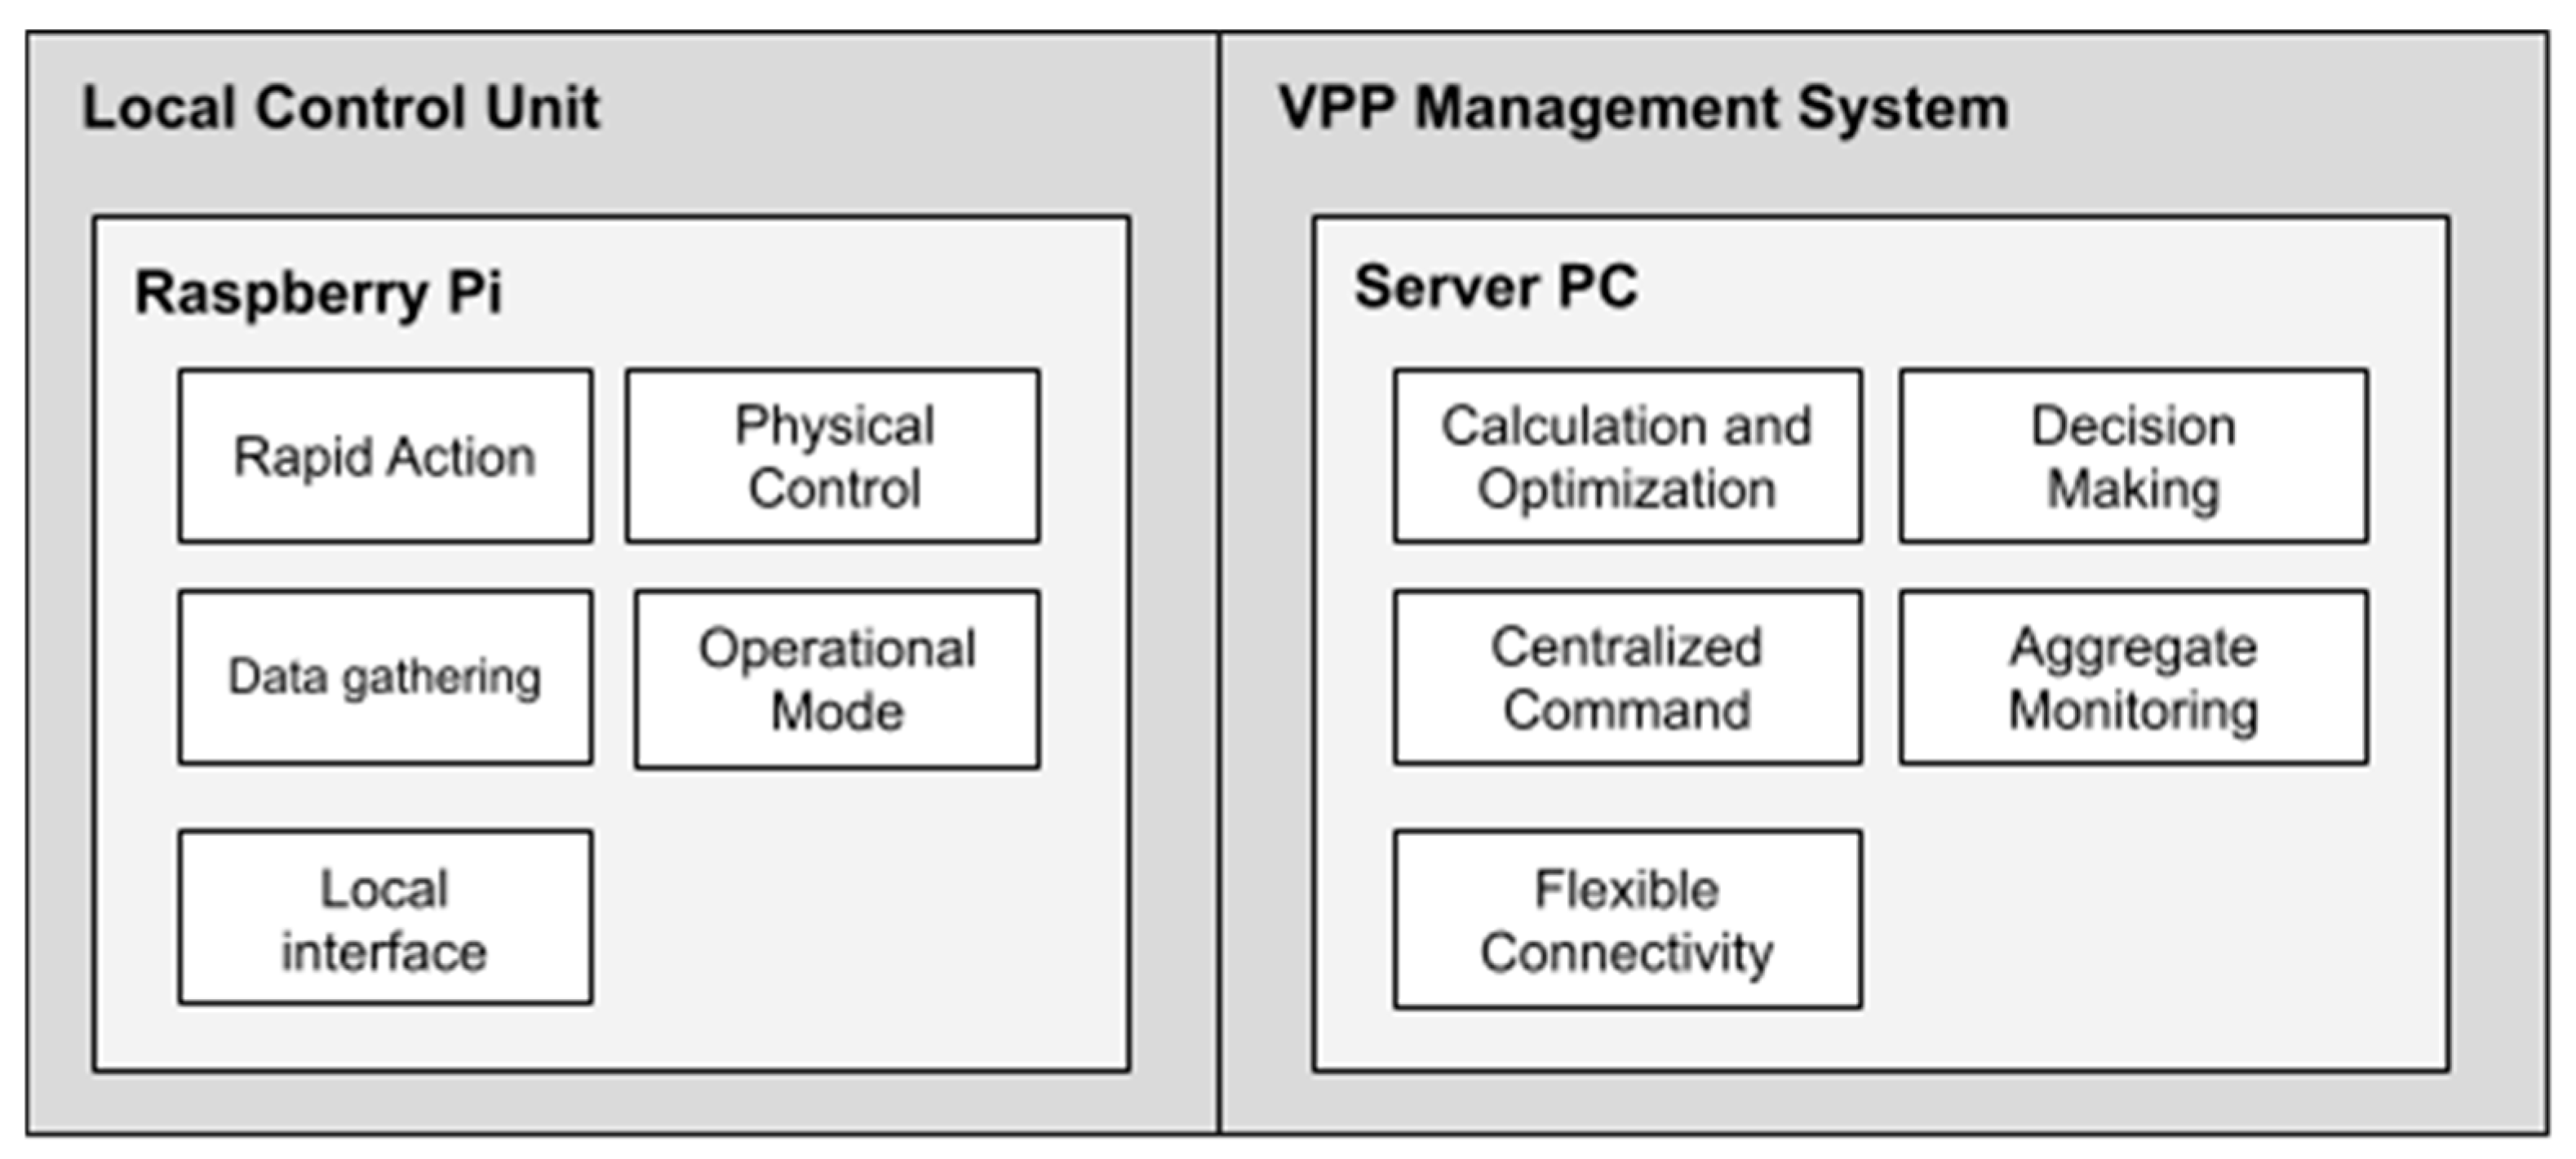
The control strategy for the proposed cluster-based Virtual Power Plant (VPP) is designed to ensure optimal coordination among DERs at the cluster level while enabling effective interaction with the VPP central system. The control adopts a hierarchical approach, consisting of two main layers: LCU at the cluster level and centralized control at VMS. The functions of each unit are illustrated in the block diagram shown in Figure 3.
The LCU is designed to act as the local executor and data collector, while the VMS functions as the central command center and strategic brain. One of its primary functions is rapid action in response to VMS commands. Utilizing the lightweight MQTT communication protocol, the LCU receives instructions and instantly controls the inverter for power export or import. To execute this physical control, the LCU uses the industrial standard MODBUS TCP protocol to communicate directly with hardware such as inverters and energy meters. The LCU is also responsible for real-time data collection, reading critical parameters like power, voltage, and current from various points on the local network, grid, battery, and inverter. All this data is then sent back to the VMS for analysis.
The control strategy implemented at the LCU level utilizes a state-machine-based control strategy to manage both the inverter and the programmable load. Upon receiving a command from the VMS via MQTT, the LCU’s internal logic transitions to one of five distinct states: 2 operational modes (continuous and limited) or 3 functions (export, import, and stop). The flowchart of this operation is shown in Figure 4. The stop function provides the LCU with full autonomy, overriding VMS commands, a crucial feature for system safety and reliability. For on-site monitoring, each LCU is equipped with a web-based HMI that displays graphical data and allows for basic adjustments without a VMS connection.
On the other hand, the VMS serves as the central intelligence hub that manages the entire VPP network. By gathering data from all LCUs, the VMS runs complex calculation and optimization algorithms to holistically manage VPP operations. Based on the incoming data, the VMS makes strategic decisions, such as determining when to charge batteries or dispatch power to the grid. These strategic decisions are translated into structured MQTT messages containing specific set points for Active Power (P), Reactive Power (Q), and a duration for which the LCU must maintain these settings. The commands resulting from these decisions are then dispatched to the relevant LCUs via MQTT. To provide full visibility, the VMS features a website interface that displays all aggregated data from across the VPP, allowing operators to comprehensively monitor performance. Flexibility is another key advantage of the VMS, as it can connect with LCUs through either a local network or the internet, enabling efficient and reliable remote management.
Another key feature of the VPP architecture is the inclusion of a controllable load, which can be dynamically controlled by the LCU. This controllable load is essential for fine-tuning power flow and maintaining grid stability, especially during specific control functions. In import function, the LCU activates the controllable load to absorb power precisely equal to the difference between the import set point and the total power currently being produced by the VPP. This ensures that the LCU imports the exact amount of power required. Similarly, in limited mode, the LCU can prevent unintended power export to the grid by activating the controllable load to consume any surplus power. This action effectively brings the net export to zero, adhering to the specified grid limitations.

2.3.2. Communication Interfaces

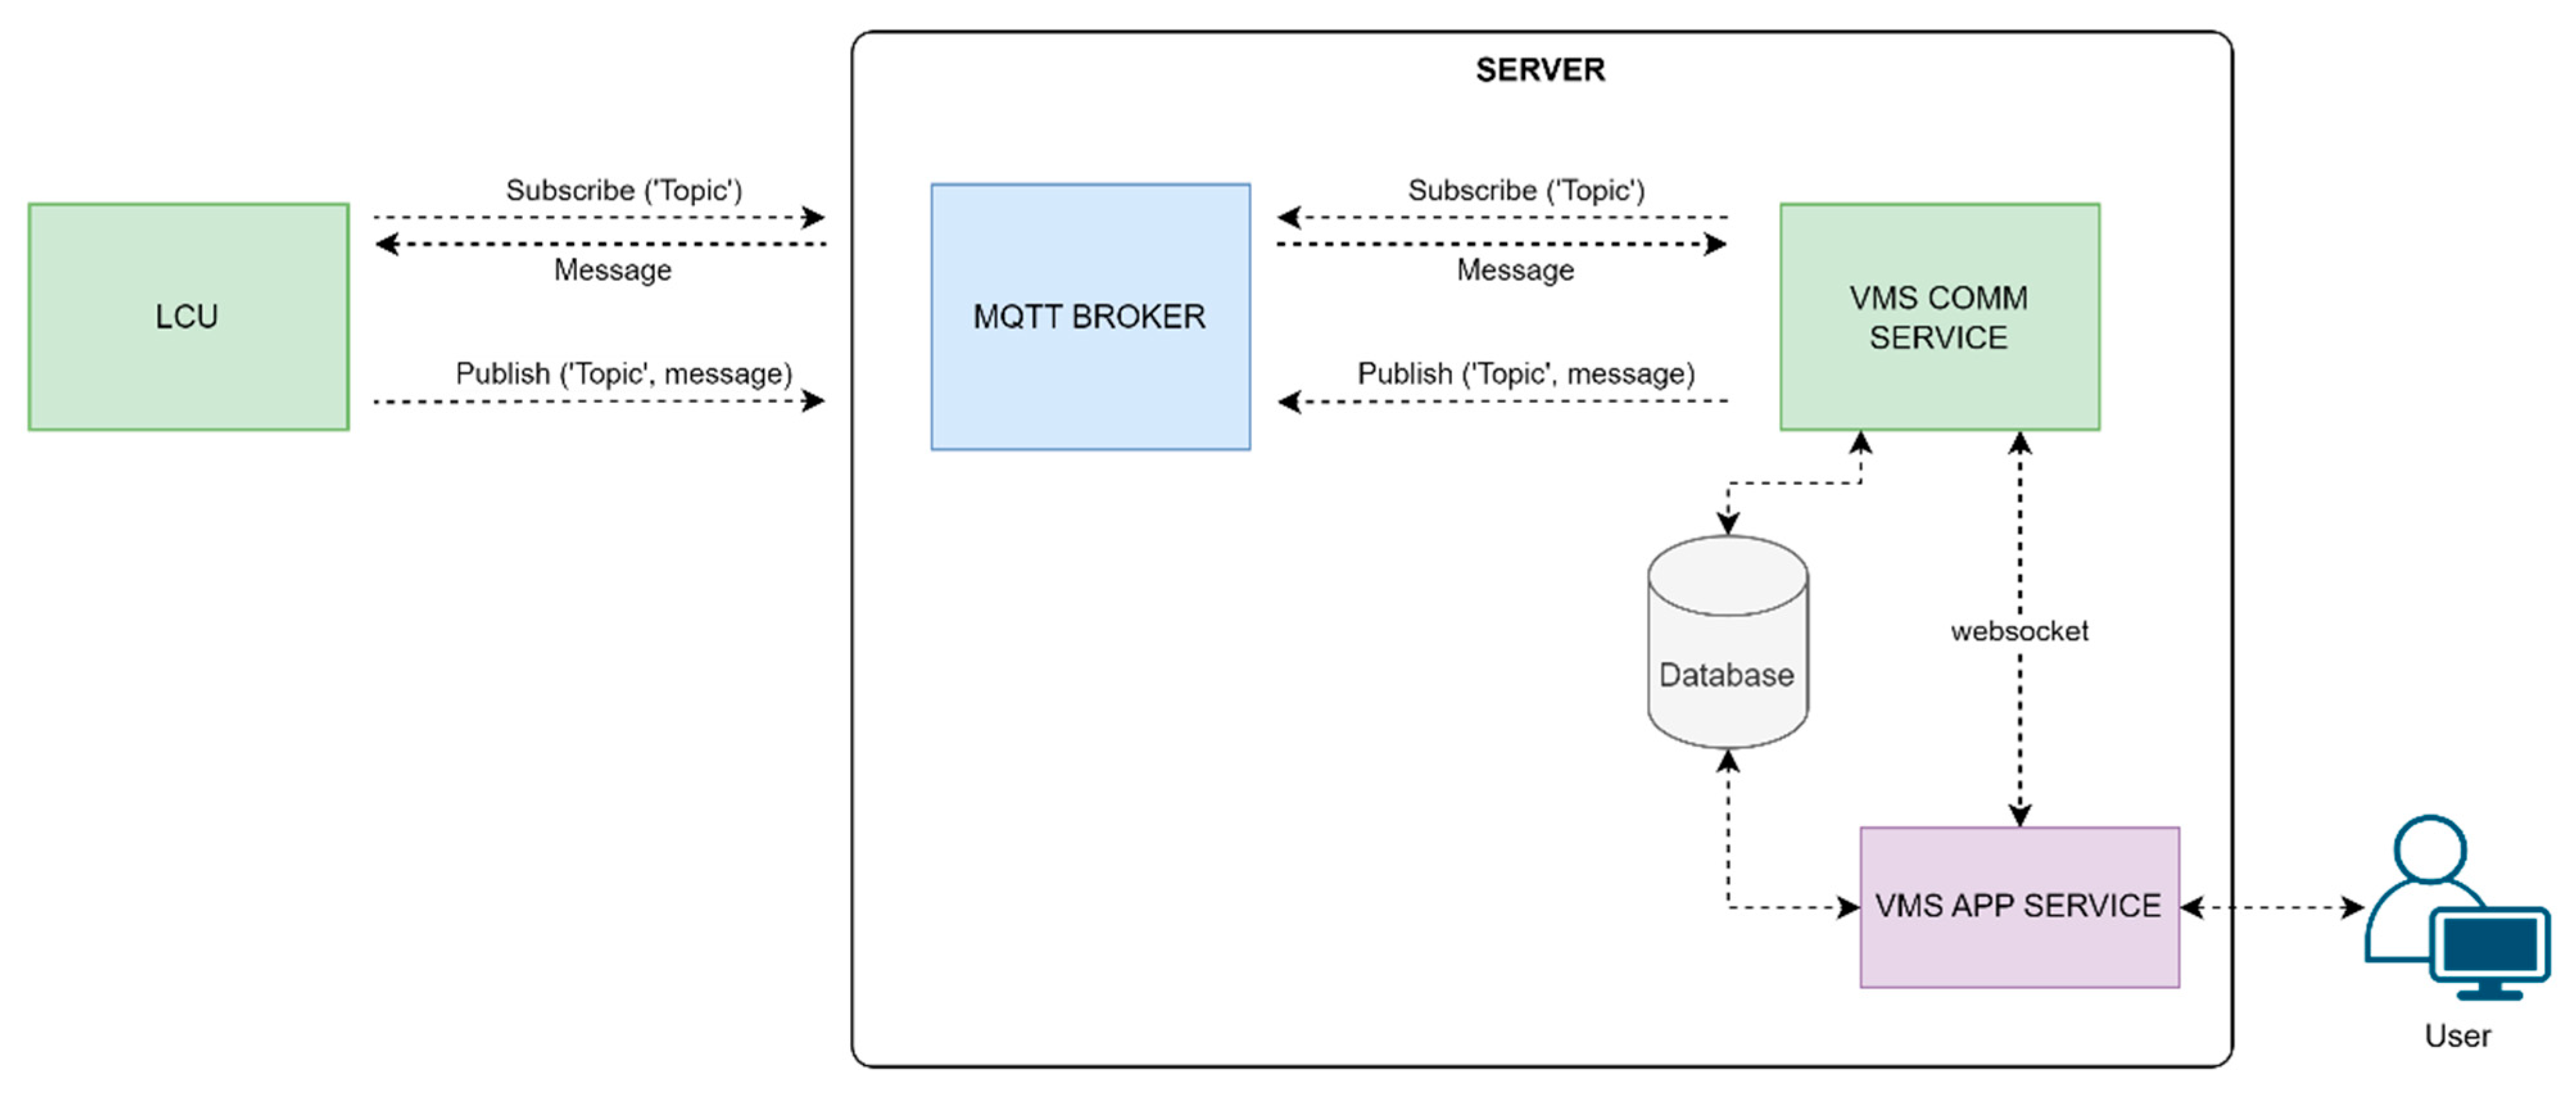
Communication between LCU and the VMS is implemented using the Message Queuing Telemetry Transport (MQTT) protocol, using a publish–subscribe model as depicted in Figure 5. MQTT enables lightweight data handling and bidirectional communication, making it suitable for real-time monitoring and control in distributed energy systems [37,38]. In this architecture, the LCU subscribes to a control topic to receive commands from the VMS and publishes corresponding response messages. It also transmits real-time monitoring data by publishing to a designated monitoring topic. Meanwhile, the VMS subscribes to the monitoring topic to collect operational data and to the control topic to send control signals and receive responses from the LCU. To ensure secure communication, the MQTT protocol is configured with authentication mechanisms using a combination of username, password, and access tokens. This publish–subscribe mechanism ensures reliable, scalable, and secure communication between distributed control layers and the central management system.

2.3.3. Aggregation Management

Aggregation management is performed by the VMS to consolidate real-time operational data from multiple clusters and determine a coordinated control strategy for the entire system. The VMS calculates each cluster’s available capacity based on current PV generation, battery capacity, and state of charge (SoC) to determine its energy export or import. The aggregate setpoint is calculated using proportional power-sharing based on each cluster’s SoC. Meanwhile, the maximum duration of the aggregate setpoint is limited to 80% of the battery capacity to preserve its lifetime. Based on this calculation, export or import setpoints are then assigned to each cluster accordingly. The process for determining the aggregate power setpoint and its duration is illustrated in the flowchart shown in Figure 6.

3. Experimental Setup

3.1. Hardware Specification

The hardware used on the test platform is shown in Table 2. The two clusters share similar specifications, differing only in their PV inverters, controllable loads, and local loads. The local loads are expected to differ between clusters due to their unique load characteristics. The PV inverters and controllable loads, however, are set up differently to simulate various conditions for future VPP implementation. It should be noted that the operational differences resulting from these configurations are not discussed here but are the subject of our ongoing research. The block diagram of this experimental setup is presented in Figure 7.
Cluster 1, which has no control capabilities from the VMS to the PV inverter, is equipped with a centralized controllable load to balance excess energy to the external grid when the grid is at capacity. Cluster 2 is used to simulate PV installations that allow a certain degree of control from the VMS and, therefore, does not require a controllable load. Figure 8 shows the experimental setup, with numerical labels showing which cluster each equipment belongs to.
The LCU monitors and controls the PV inverter, battery inverter, controllable load, and local load via MODBUS protocol, while the battery is monitored using RS232 serial communication. The LCU then communicates with the VMS through MQTT protocol. The control algorithm is implemented using Python 3.11.3 and JSON.

3.2. Testing Scenario

The testing of the VPP system was conducted in accordance with the test parameters outlined in the IEC TS 63189-1:2023 [22]. The primary functionalities evaluated were frequency regulation and voltage control, selected as the core testing parameters because they represent the most fundamental and critical functions for a VPP to provide ancillary services. These functions are directly related to maintaining grid stability and reliability, which are the primary objectives of VPP operation.
Prior to formal testing, a functional verification of the LCU was carried out to ensure its ability to manage power dispatch to and from the system effectively. The key performance indicators observed during the tests included response time, adjustment rate, adjustment accuracy, and the voltage and frequency responses of the grid during the execution of each test scenario.
The frequency regulation function was tested by injecting active power (P, in watts) into the system, while voltage control was tested by injecting reactive power (Q, in vars). Two operational modes of each VPP cluster were developed:
  • Continuous mode: Power exchange between the cluster and the external grid is permissible even without a request by the VMS. Also called normal mode.
  • Limited mode: Power exchange between the cluster and the external grid is prohibited unless explicitly requested by the VMS.
In each mode, both export and import of active and reactive power were simulated for cluster 1 and cluster 2. The magnitude of power injection was varied within a range of 1 to 4 kW for active power and 1 to 4 kVar for reactive power. These test conditions were designed to evaluate the dynamic performance of the LCU under different operating constraints. The detailed test scenarios are summarized in Table 3, which outlines the power injection sequences and corresponding system responses used to assess the VPPs’ control capabilities.

3.3. IEC TS 63189-1:2023 Testing Parameter

Based on IEC TS 63189-1:2023, there are three test parameters to assess the capability and performance of a given VPP system service. Details of these test parameters are shown in Table 4.

3.3.1. Response Time Parameter

Response time is defined as the time delay between the moment a control setpoint is issued and the point at which the system successfully executes the corresponding action. In the context of distributed energy systems or automated control environments, response time serves as a critical performance indicator for assessing the agility and precision of control mechanisms such as the Local Control Unit (LCU). The IEC standard classifies response time into three levels based on its urgency and sensitivity: Level 1 (real-time), Level 2 (fast), and Level 3 (slow). The response time of the LCU can be quantitatively assessed using Equation (1).
tresponse time = t1 − t0 (second)
where
  • tresponse time represents the time interval between the receipt of a setpoint signal and the moment the actual system output reaches the commanded setpoint value.
  • t0 is the timestamp marking the issuance of the setpoint signal.
  • t1 is the timestamp indicating the first occurrence where the actual system response equals the setpoint.
This measurement approach provides a standardized basis for evaluating the control dynamics of the LCU, especially under various operational scenarios such as real-time load balancing, grid support, or frequency regulation. An accurate understanding of response time is essential for optimizing the performance and reliability of control systems in smart grid and energy storage applications.

3.3.2. Adjusment Rate Parameter

In addition to response time, another critical performance indicator in the operation of a Virtual Power Plant (VPP) is the adjustment rate, which reflects how quickly the power output of the VPP can be modified within a given time frame. This metric is typically expressed in percentage per minute (%/min) and is particularly important in scenarios requiring dynamic load following, frequency regulation, or ramping support. The adjustment rate is categorized into three levels to reflect the flexibility and responsiveness of the system: Level 1 (fast), Level 2 (medium), and Level 3 (low). These classifications provide a standardized framework for evaluating the VPP’s ability to adapt to rapid changes in demand or supply conditions, and they serve as an essential basis for control strategy design, particularly in distributed energy resource coordination and grid integration.

3.3.3. Adjusment Accuracy Parameter

Another important performance indicator for evaluating the effectiveness of a Virtual Power Plant (VPP) is adjustment accuracy, which measures the extent to which the actual power output aligns with the desired setpoint. High adjustment accuracy indicates the system’s ability to precisely track power commands, which is critical for maintaining grid stability, ensuring compliance with dispatch instructions, and optimizing overall control performance. This metric is classified into three levels: Level 1 (high accuracy), Level 2 (medium accuracy), and Level 3 (low accuracy), providing a standardized framework for assessing control precision. The adjustment accuracy of the LCU can be quantitatively calculated using Equation (2).
Adjustment Accuracy = (1 − n1/n0) × 100%   (%)
where
  • n1 = The number of instances in which the actual value matches the setpoint value
  • n0 = The total number of setpoint commands issued
This ratio reflects the proportion of successful setpoint tracking events relative to the total number of control instructions, thus serving as a reliable metric for evaluating the fidelity and responsiveness of the LCU in real-time operations. High adjustment accuracy is essential for ensuring the reliability of VPPs, particularly in applications involving frequent setpoint changes and tight grid interaction requirements.

4. Results and Discussion

4.1. Continuous Mode (Normal)

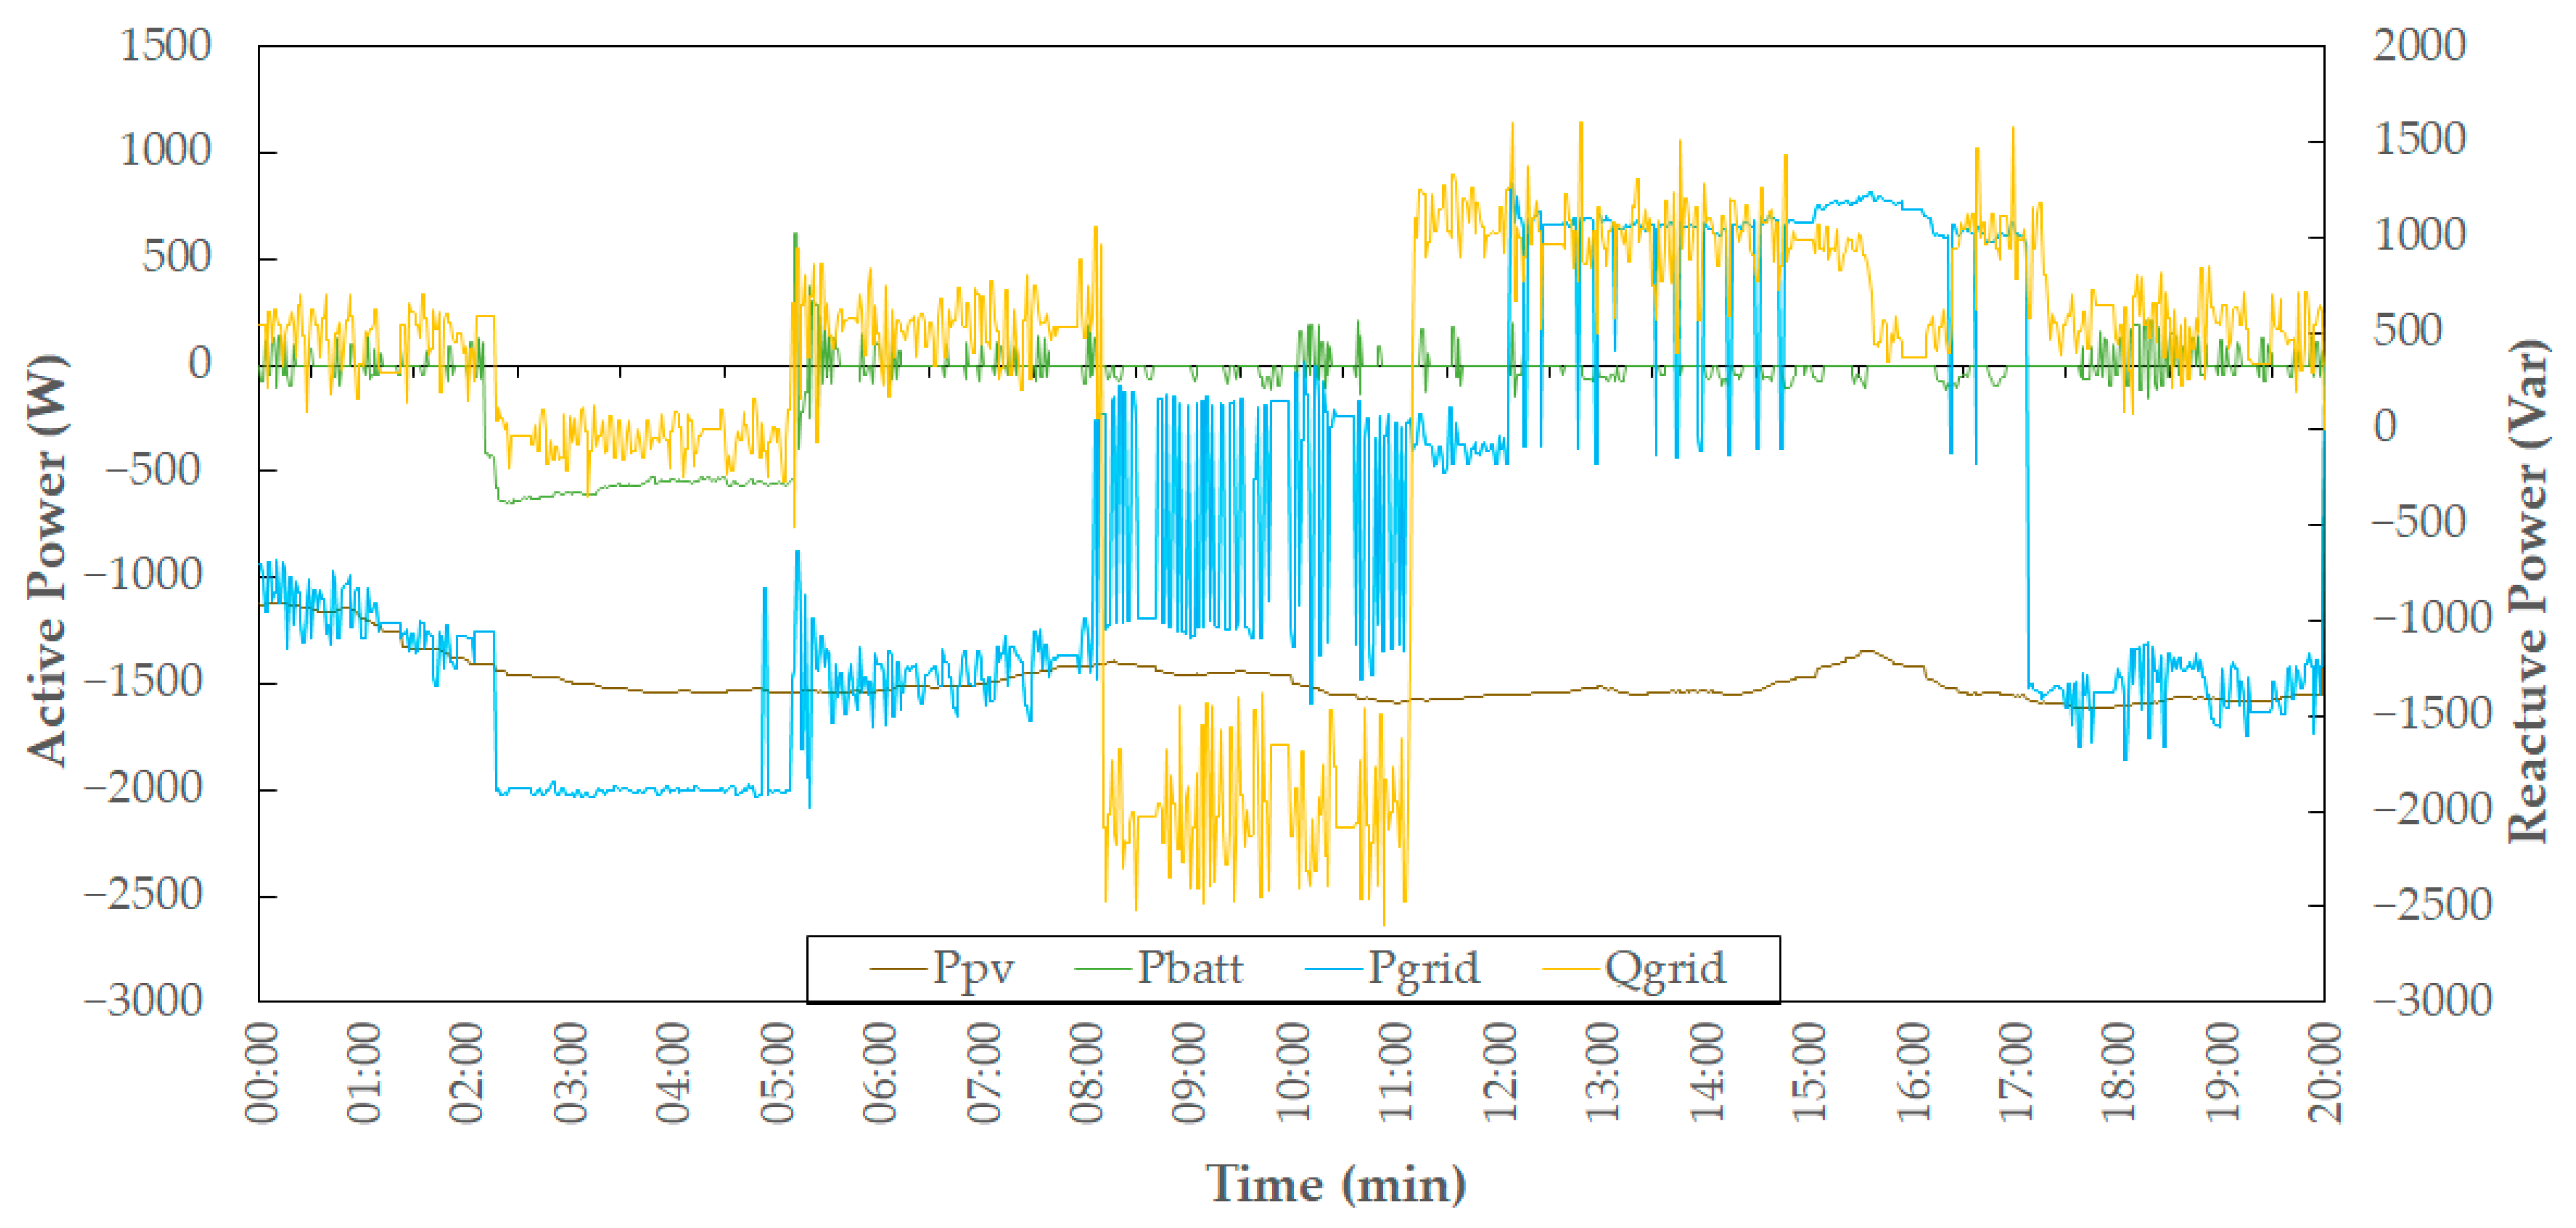
The first test was conducted to evaluate the functionality of the LCU in managing power export and import under different operational modes. Under continuous mode, the test involved the export of 2000 W of active power, 2000 Var of reactive power, and the import of 2000 W of active power. The objective was to assess the LCU’s ability to accurately control power flows in real time. Figure 9 presents the functional test results. The export of active power shows relatively stable performance, whereas the export of reactive power and the import of active power exhibit more fluctuations. This indicates that the LCU demonstrates higher control precision for active power export under normal conditions, while reactive power export and active power import may be more sensitive to system dynamics or transient responses during operation.
The observed performance aligns with findings from recent studies, which indicate that active power export is typically more stable than reactive power export and active power import in inverter-based systems [25,26,31]. Unlike most simulation-based studies [8,25], these results are experimentally validated, similar to the experimental validation of a dynamic equivalent model for microgrids, which confirms the LCU’s capability for reliable active power export in continuous mode. Meanwhile, the observed fluctuations highlight the need for more advanced control strategies, consistent with recommendations in [35,37].

4.2. Limited Mode

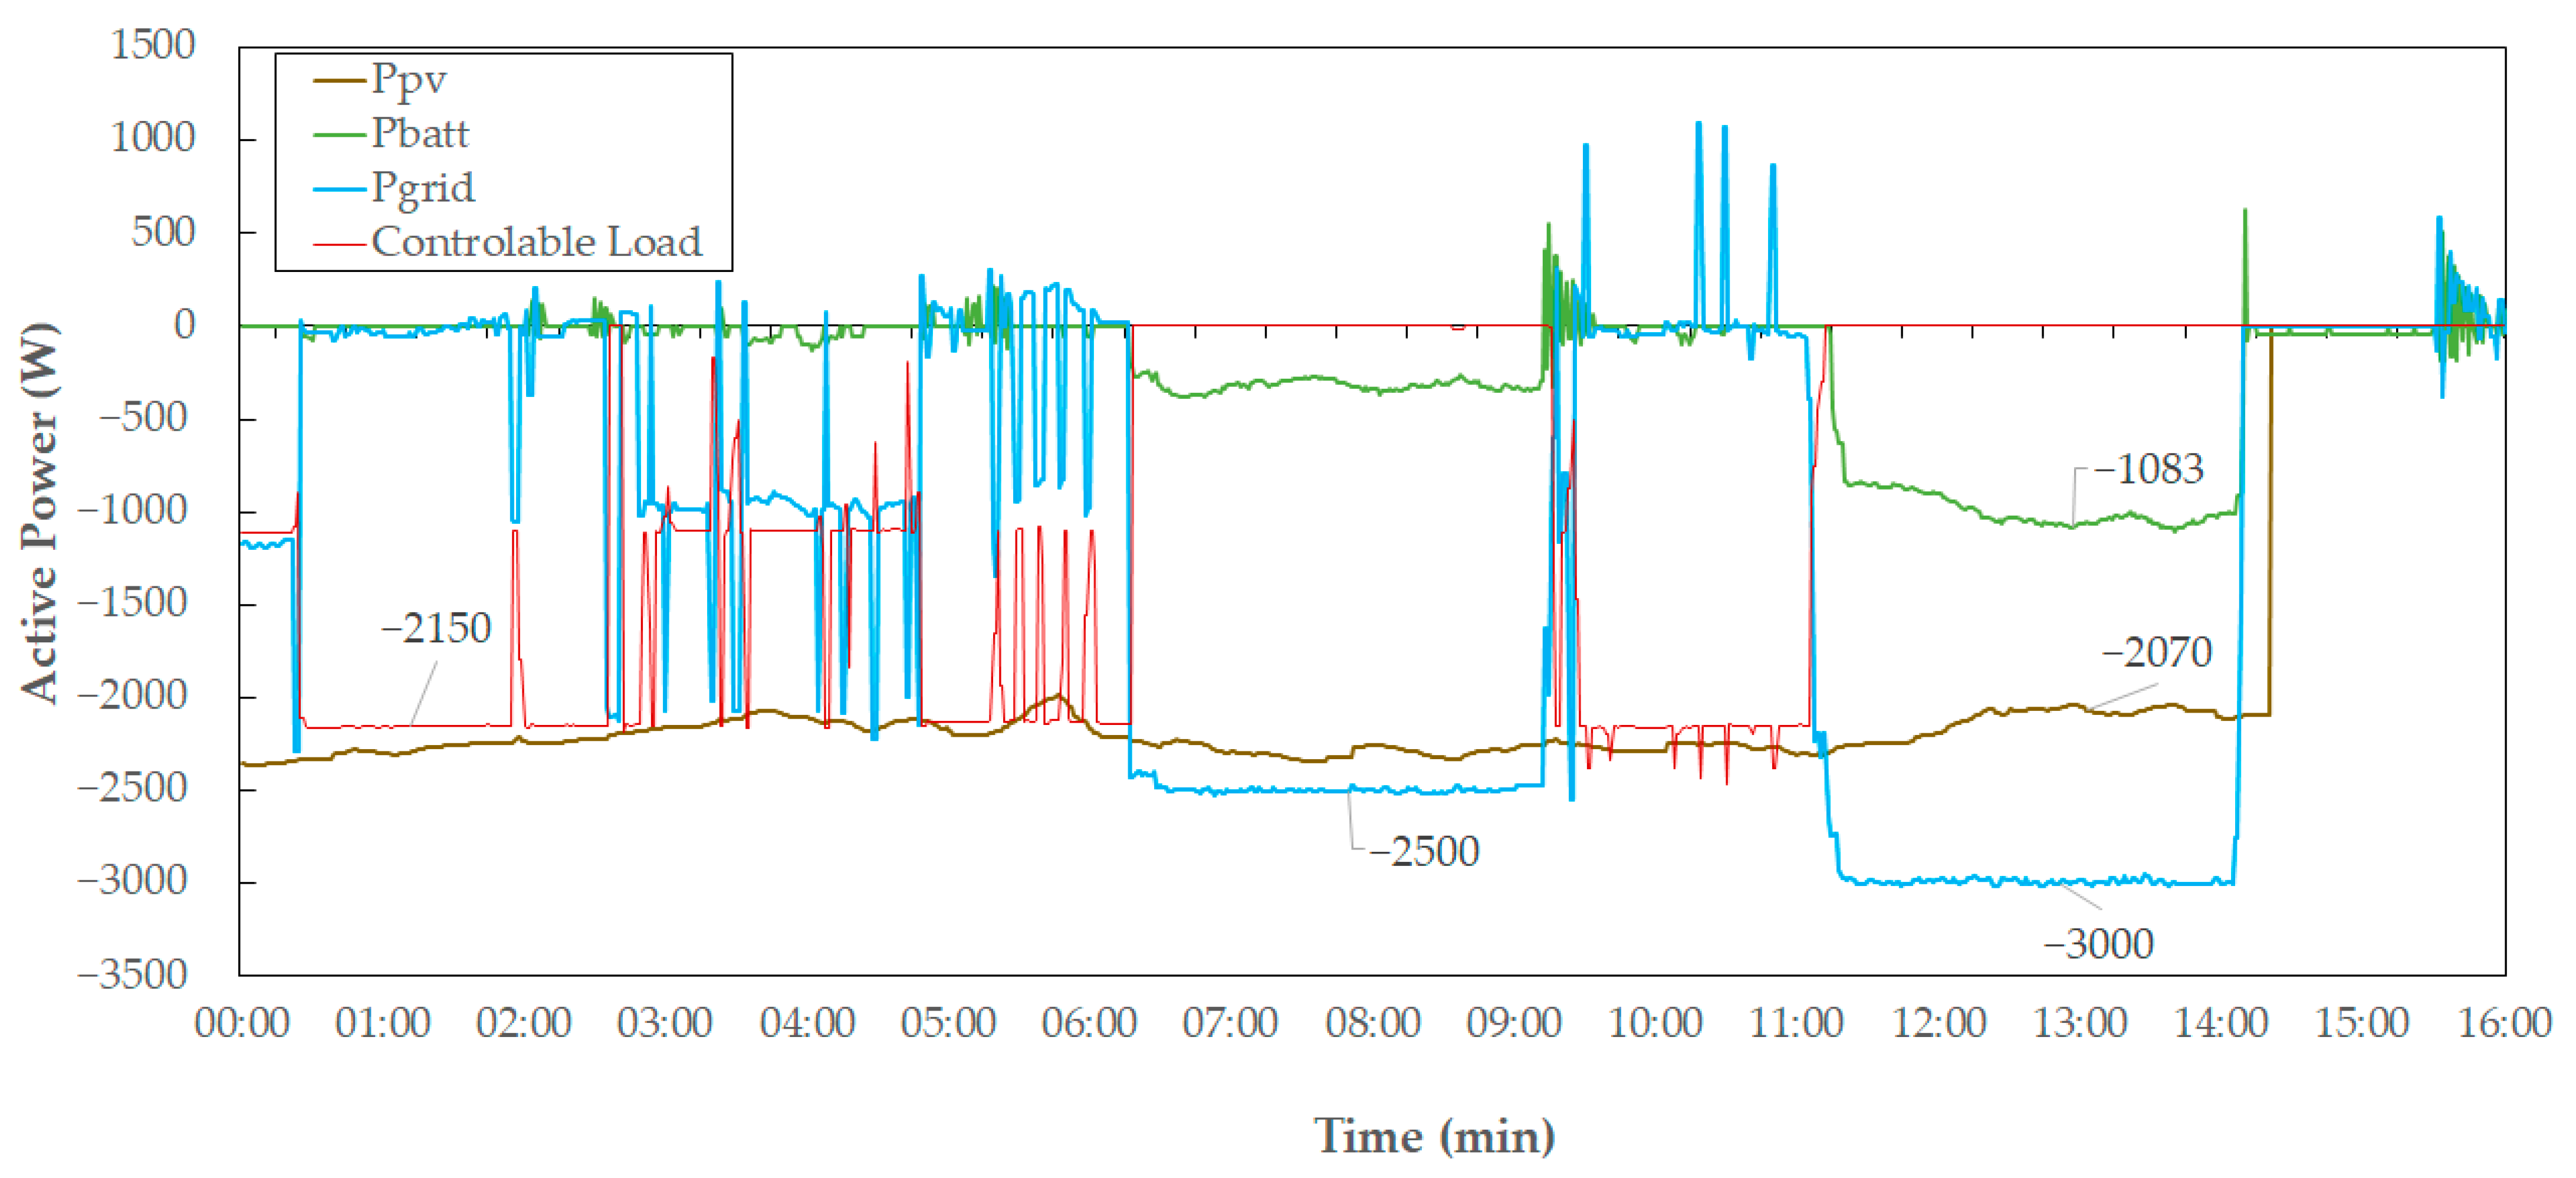
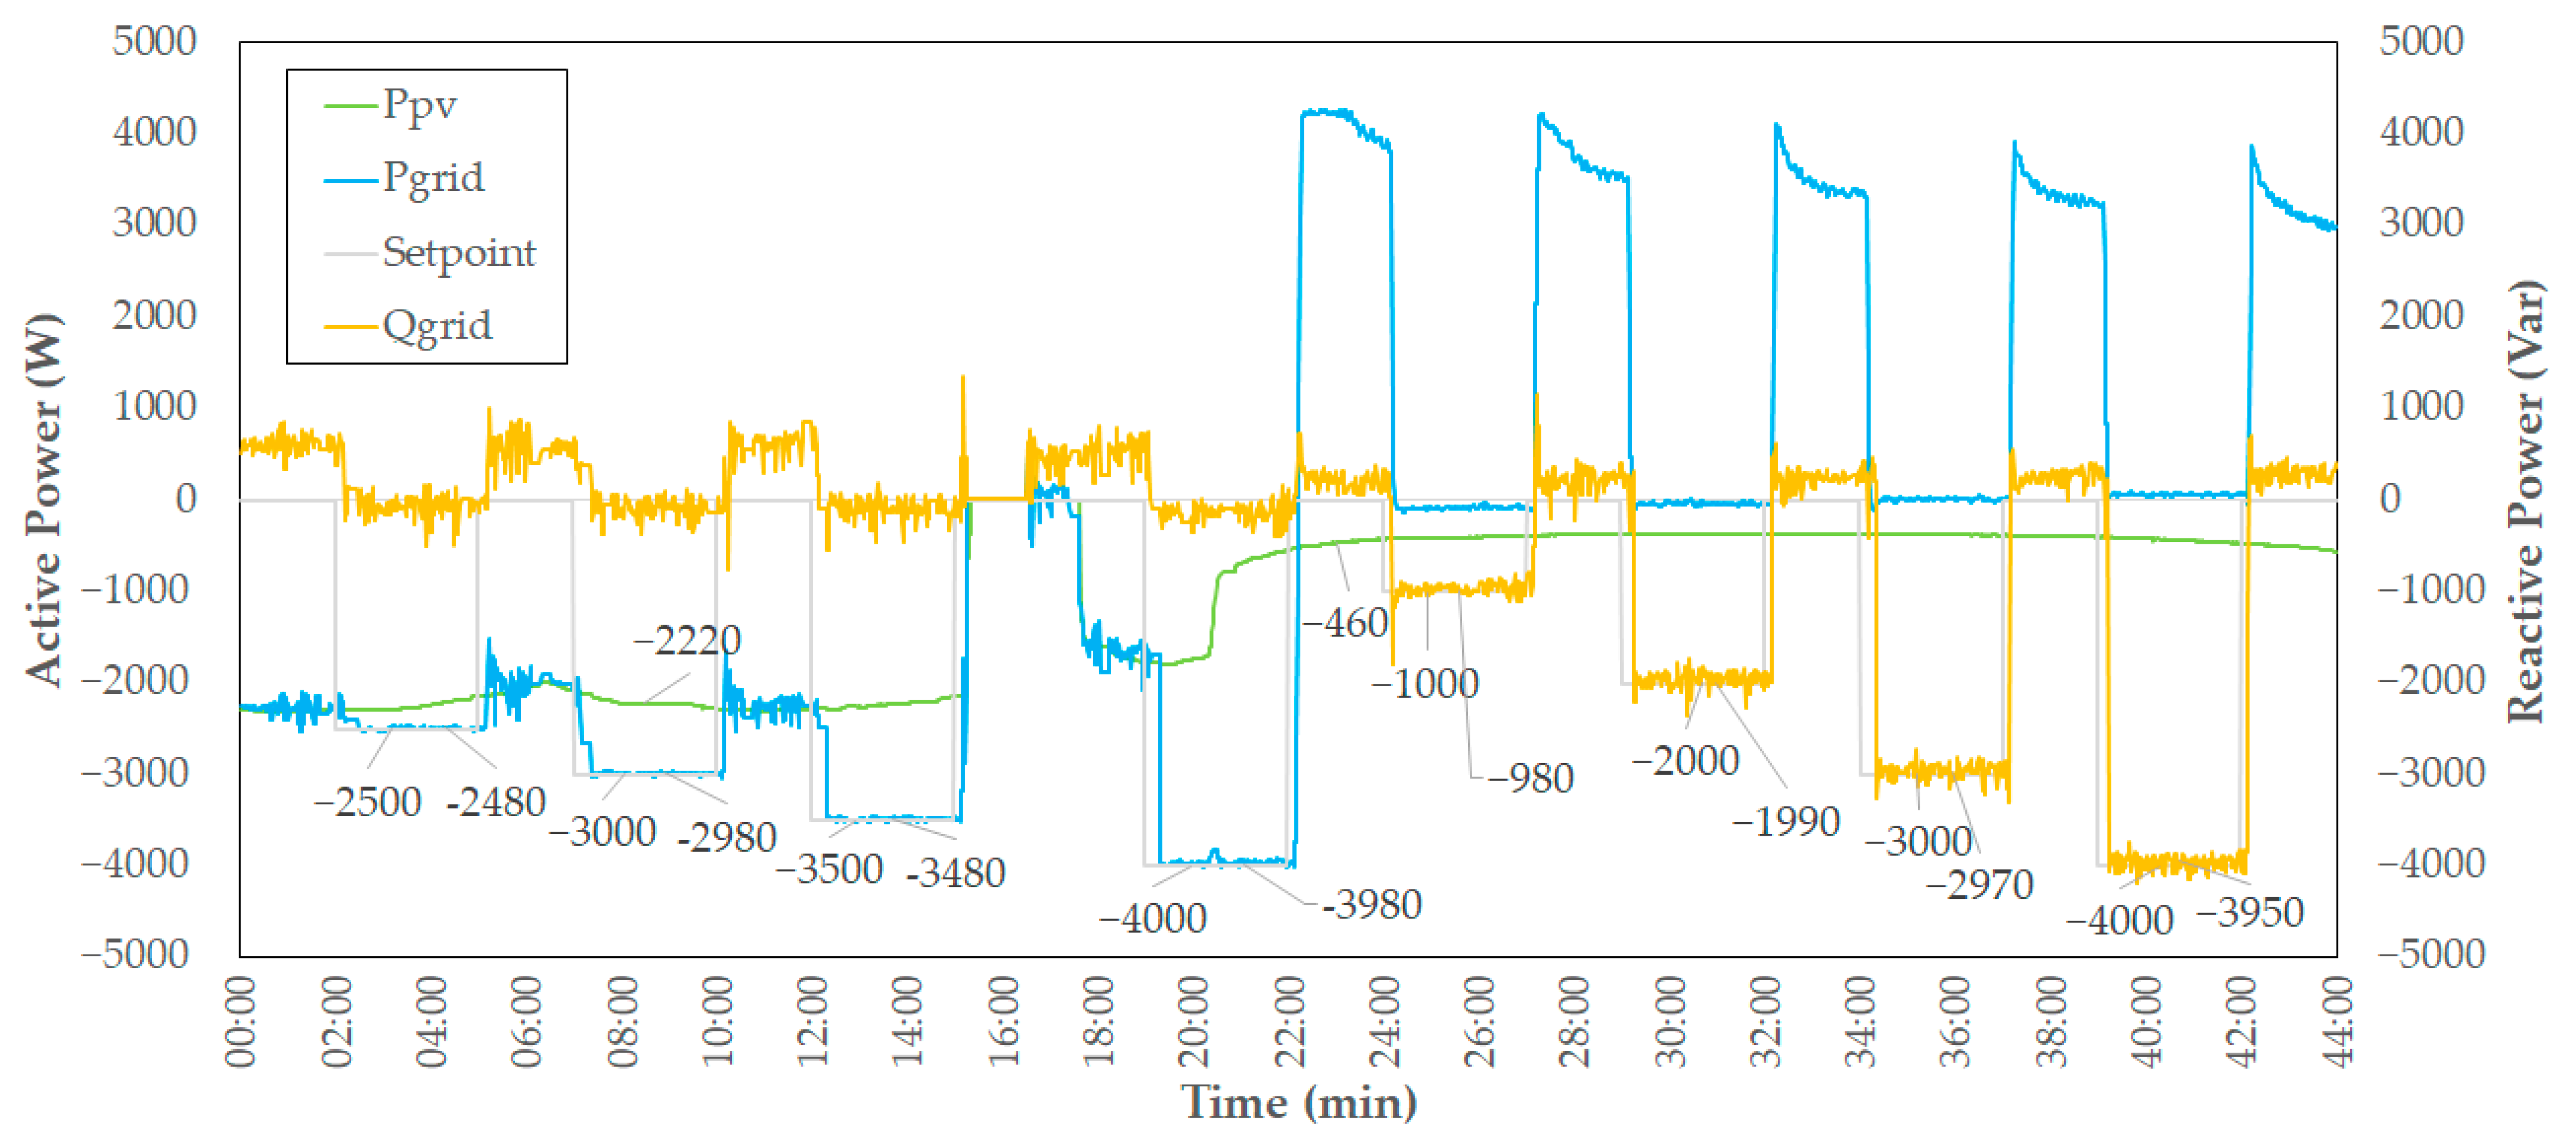
During the limited mode test, the system was subjected to export commands of 2500 W and 3000 W of active power. As shown in Figure 10, grid power (Pgrid) remained approximately zero when no export setpoint was given, indicating that the control program successfully prevented any unintended power flow from the system to the grid. This demonstrates the effectiveness of the no reverse power control logic implemented in the LCU.
The legend for Figure 9 and Figure 10 is as follows: PV power (Ppv) is represented by the brown line, battery power (Pbatt) by the green line, active grid power (Pgrid) by the light blue line, and reactive grid power (Qgrid) by the orange line, and controllable load power by the red line. A negative value for PV or battery indicates power generation or discharge. A negative grid power value indicates that the VPP is exporting power to the grid, while a positive value indicates that power is being imported from the grid into the VPP system.

4.3. Aggregation

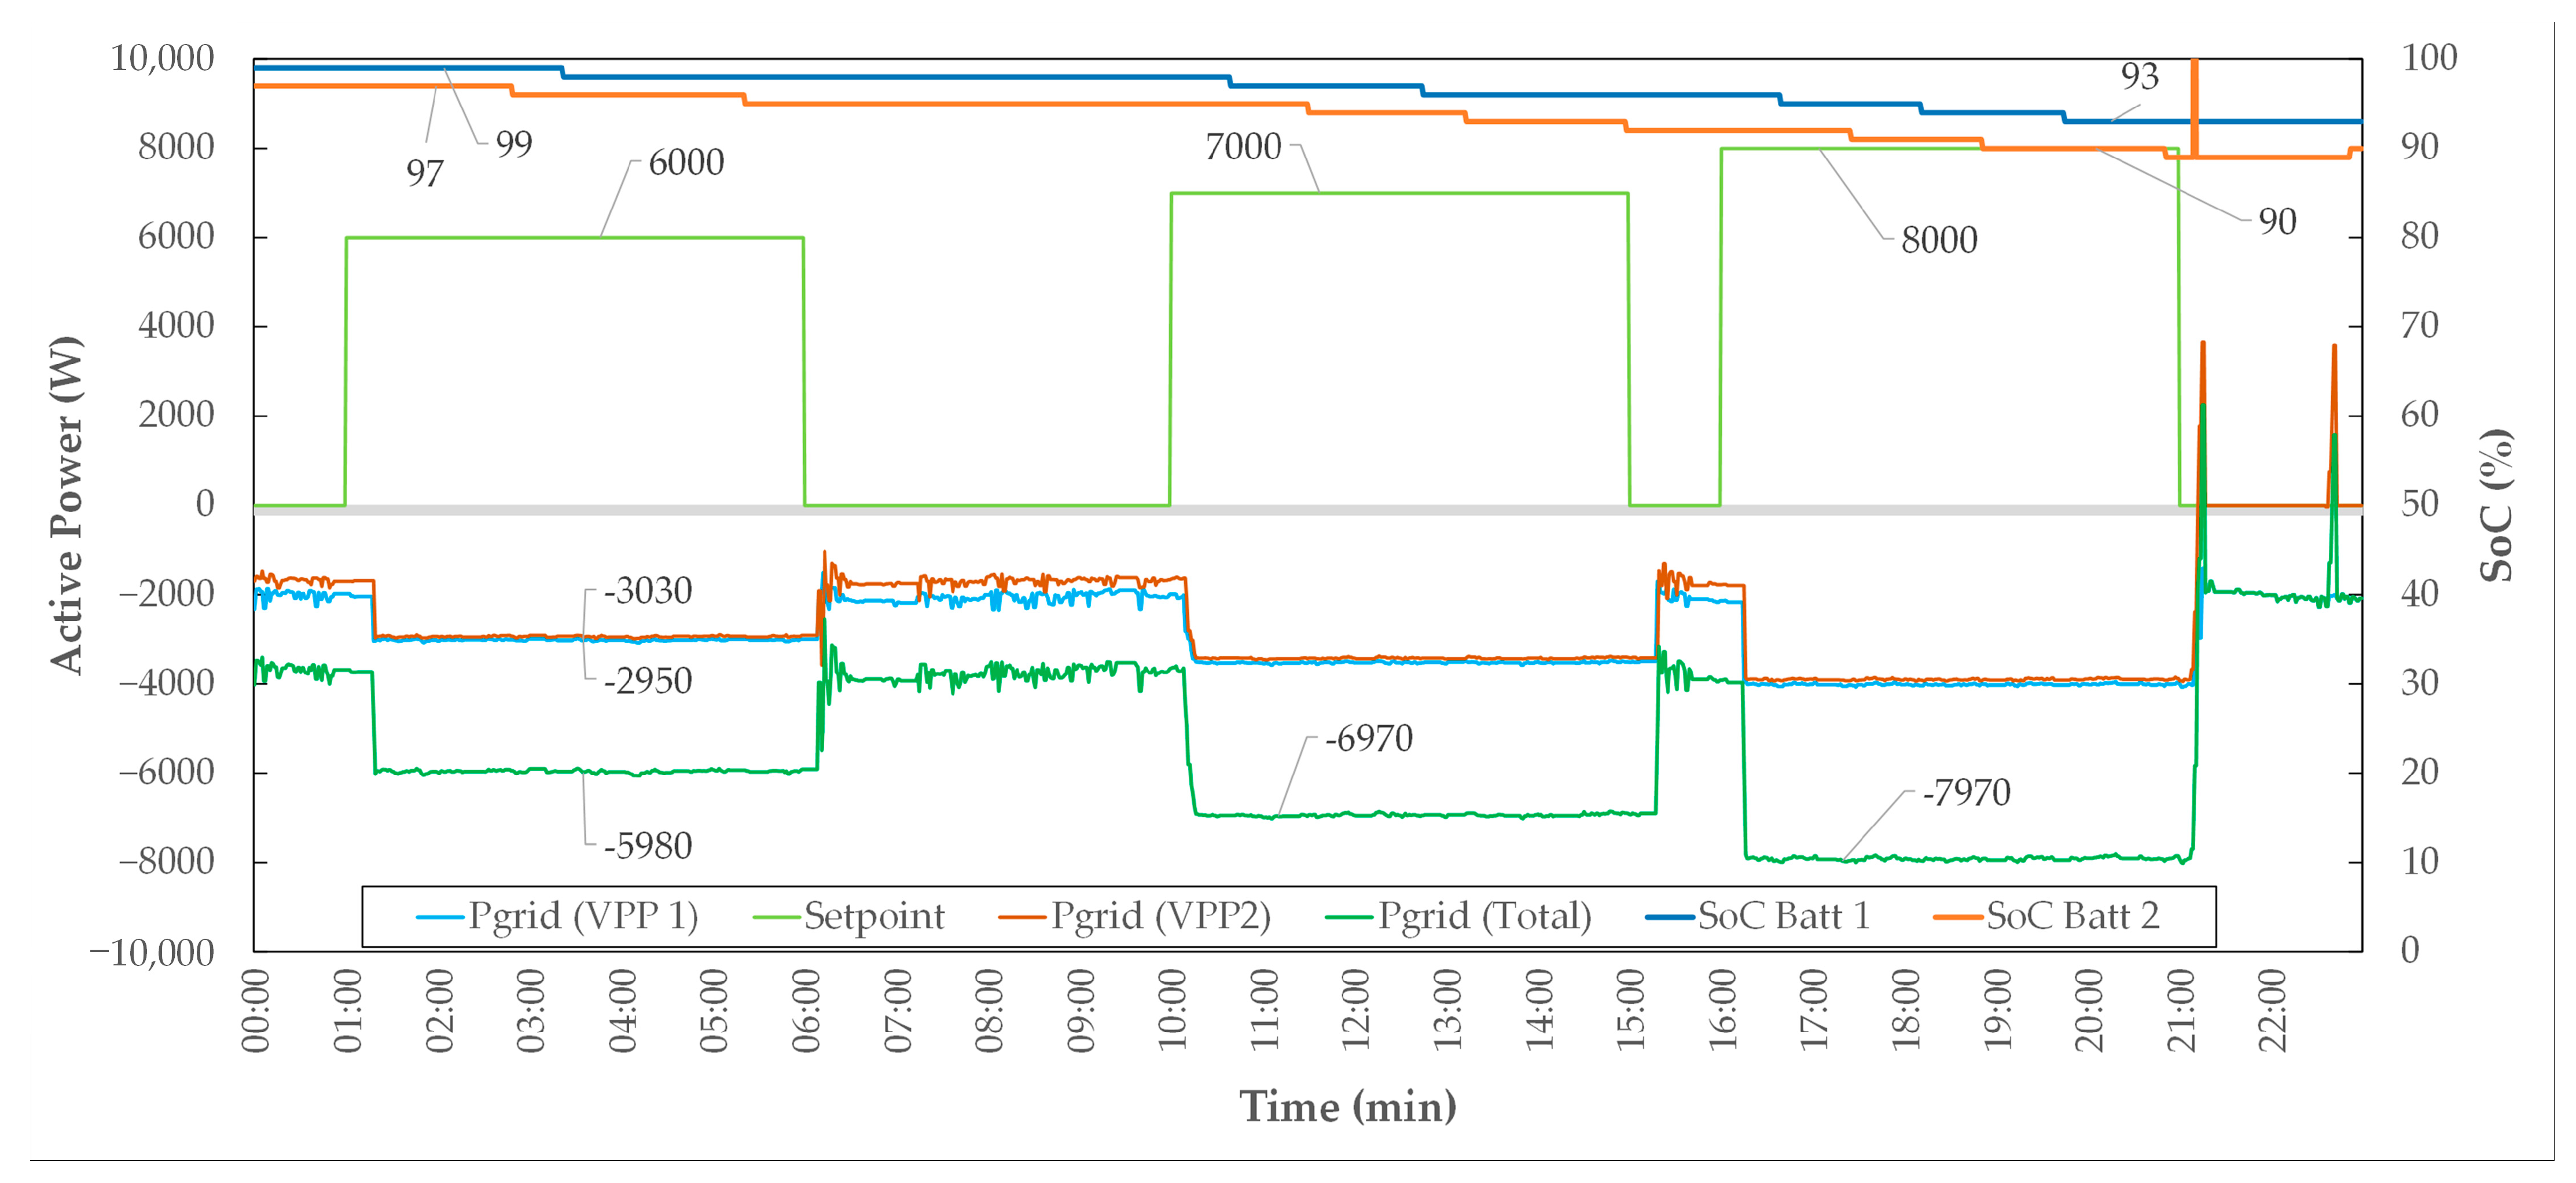
A series of tests was conducted to evaluate the performance of the Virtual Power Plant operating in aggregated mode during power export to the electrical grid. Throughout the experiment, export power was incrementally controlled based on the state of charge (SoC) of individual storage units within the aggregated system.
At 01:00, the system initiated a 6 kW power export. At this time, the SoC was observed to be 99% for line 1 and 97% for line 2, indicating a fully charged system capable of delivering stable output. The export operation continued for 300 s without significant fluctuations in output power or system parameters, with line 1 (Pgrid VPP1) delivering approximately 3030 W and line 2 (Pgrid VPP2) delivering 2950 W.
At 10:15, the export power was increased to 7 kW. A slight reduction in SoC was recorded, with values reaching 98% for line 1 and 95% for line 2. Despite this reduction, the SoC remained within the optimal range for reliable operation. The system sustained the 7 kW output for another 300 s, demonstrating the effectiveness of the aggregation strategy in maintaining output stability.
The final stage of the test occurred at 16:16, with the export power elevated to 8 kW. Correspondingly, the SoC decreased to 95% (line 1) and 92% (line 2). Although the SoC values showed a progressive decline, the VPP maintained a continuous and stable export for 300 s, without triggering any overvoltage or instability within the system.
The test results are shown in Figure 11, which presents the export power profiles, associated SoC trajectories, and system stability during each interval. These findings confirm that the VPP, when operated in an aggregated configuration, is capable of delivering controlled and reliable power export to the grid, adapting effectively to system constraints and dynamic grid demands.

4.4. Response Time

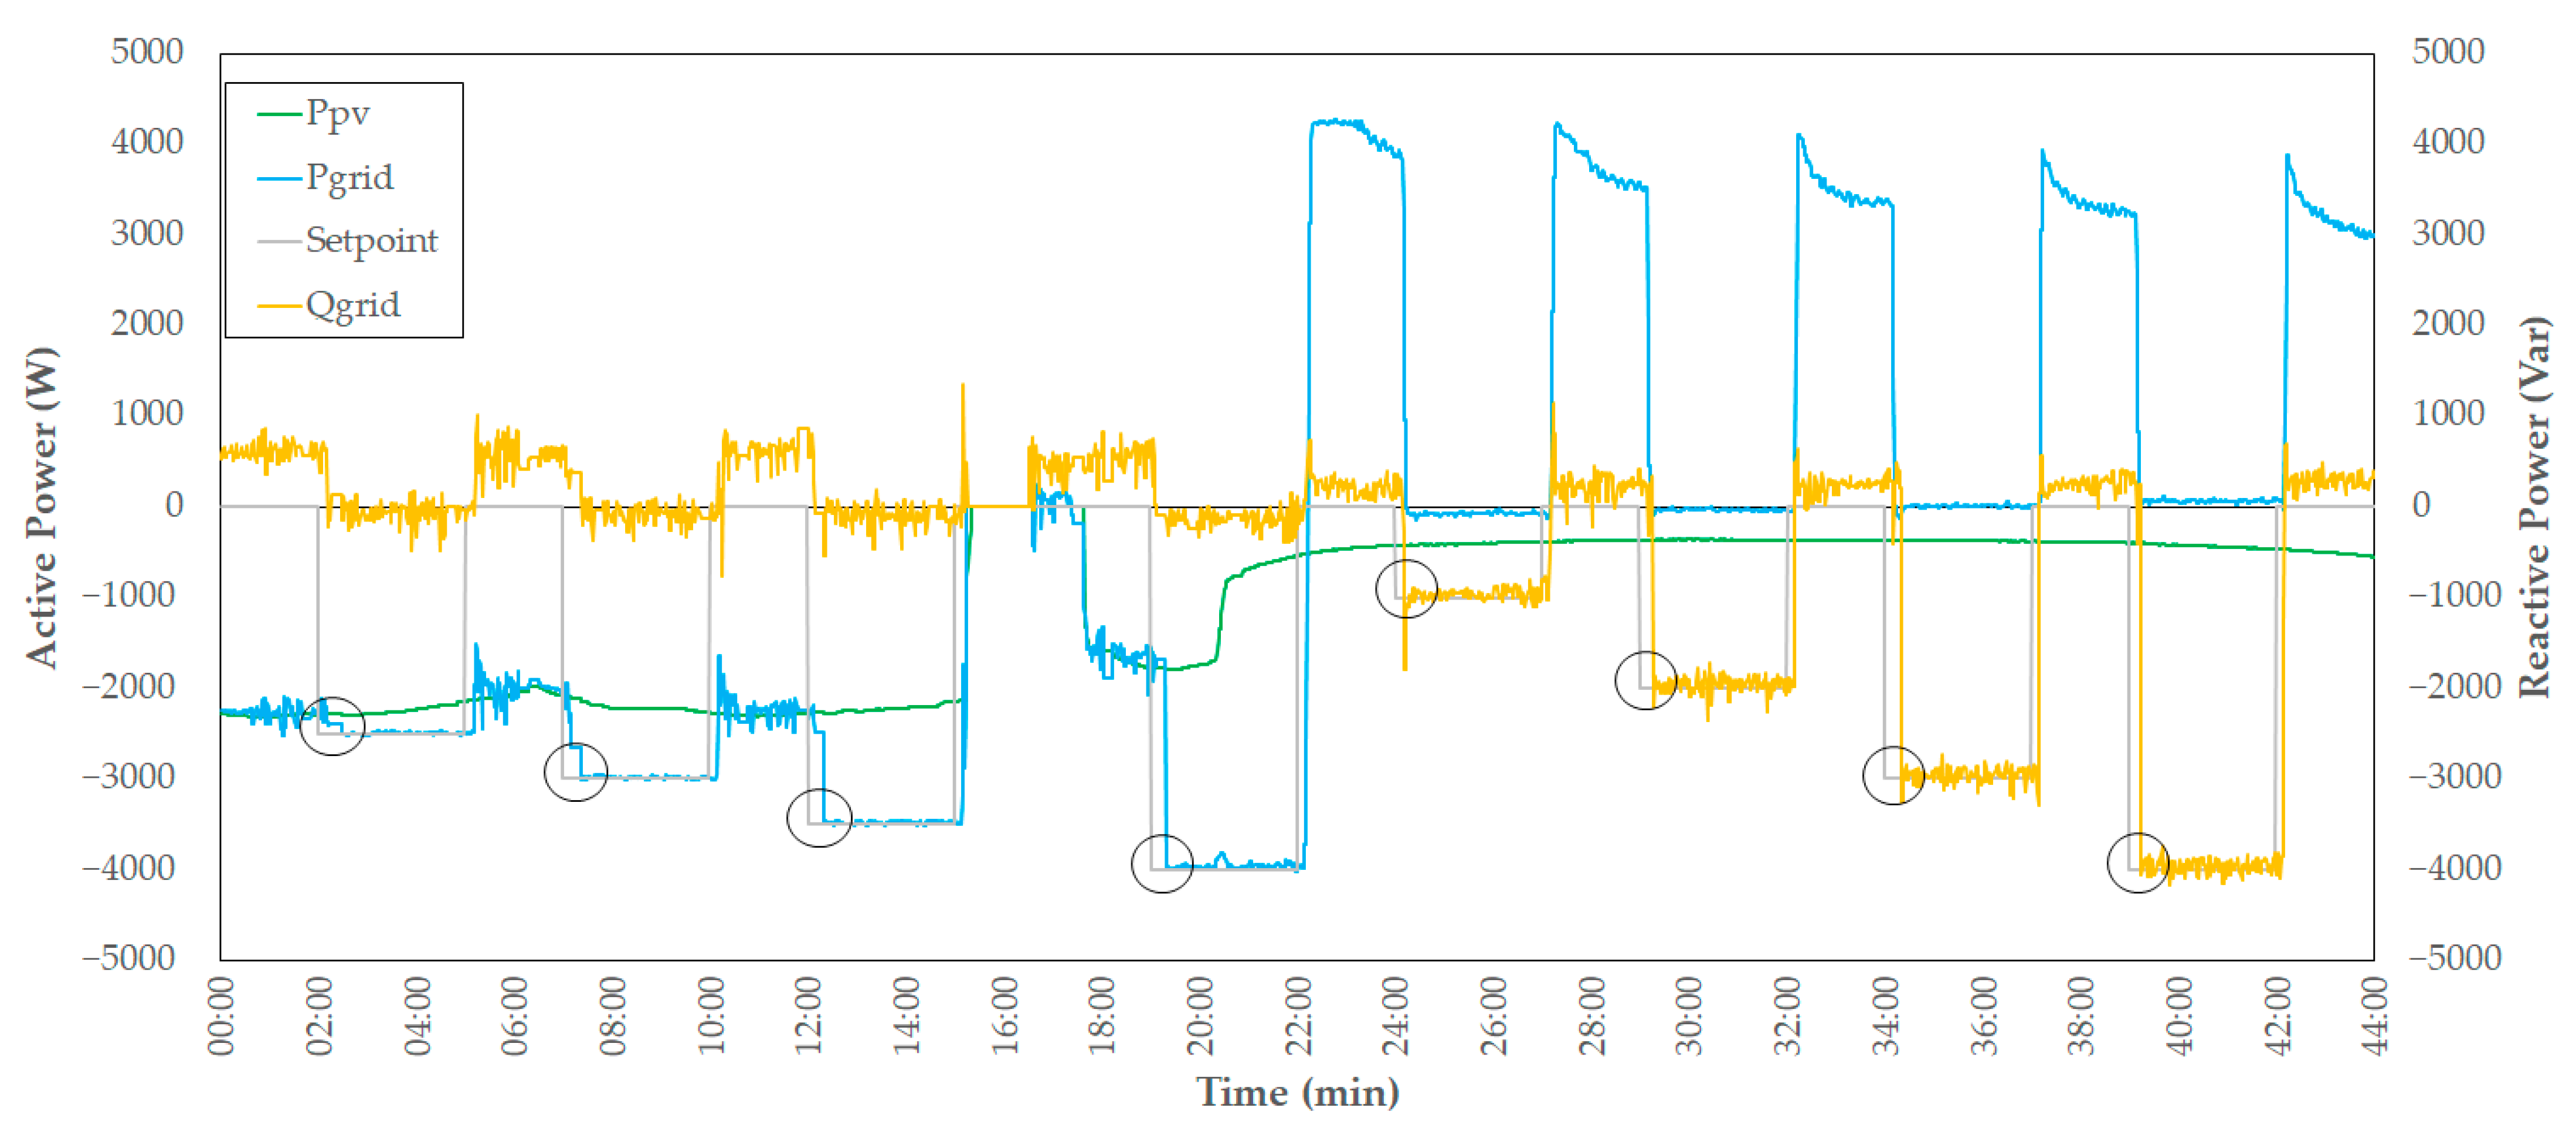
The response time calculation was carried out using Equation (1) based on the predefined testing scenario. The results show that the average response time for frequency regulation, defined by active power injection, was 7 s. This duration qualifies as a Level 1 real-time response. Similarly, the response time for voltage control, involving the injection of reactive power, was recorded at 11 s, which also falls under Level 1 (real-time response). These findings indicate that the Local Control Unit (LCU) is capable of responding rapidly to control commands under both frequency and voltage regulation scenarios. The response time test results are illustrated in Figure 12.

4.5. Adjustment Accuracy

The average adjustment accuracy was evaluated using Equation (2) with the predefined test scenarios. For frequency regulation, which involves the injection of active power, the adjustment accuracy was found to be 3%, which does not meet the minimum threshold defined by the test level classifications. In contrast, the adjustment accuracy for voltage control, involving the injection of reactive power, was recorded at 6%, which corresponds to Level 2 (medium accuracy). These results highlight the need for further refinement in active power control to meet higher accuracy standards, while reactive power control performance falls within an acceptable range. The adjustment accuracy test results are presented in Figure 13.

4.6. Adjustment Rate

The results indicate that the average adjustment rate for frequency regulation, corresponding to active power injection, was 103%/min. This implies that the system is capable of ramping active power from 0 to 4 kW within one minute. Based on the defined classification, this places the adjustment rate within Level 1, indicating a fast response capability. In contrast, the adjustment rate for voltage control, which involves reactive power injection, was measured at 80%/min, reflecting a ramping capability from 0 to 3.2 kVAR per minute. This performance falls under Level 2, categorized as medium. These findings suggest that while the system exhibits high responsiveness in adjusting active power, its performance in reactive power control is moderately responsive and may benefit from further optimization depending on grid requirements.

4.7. Frequency Regulation

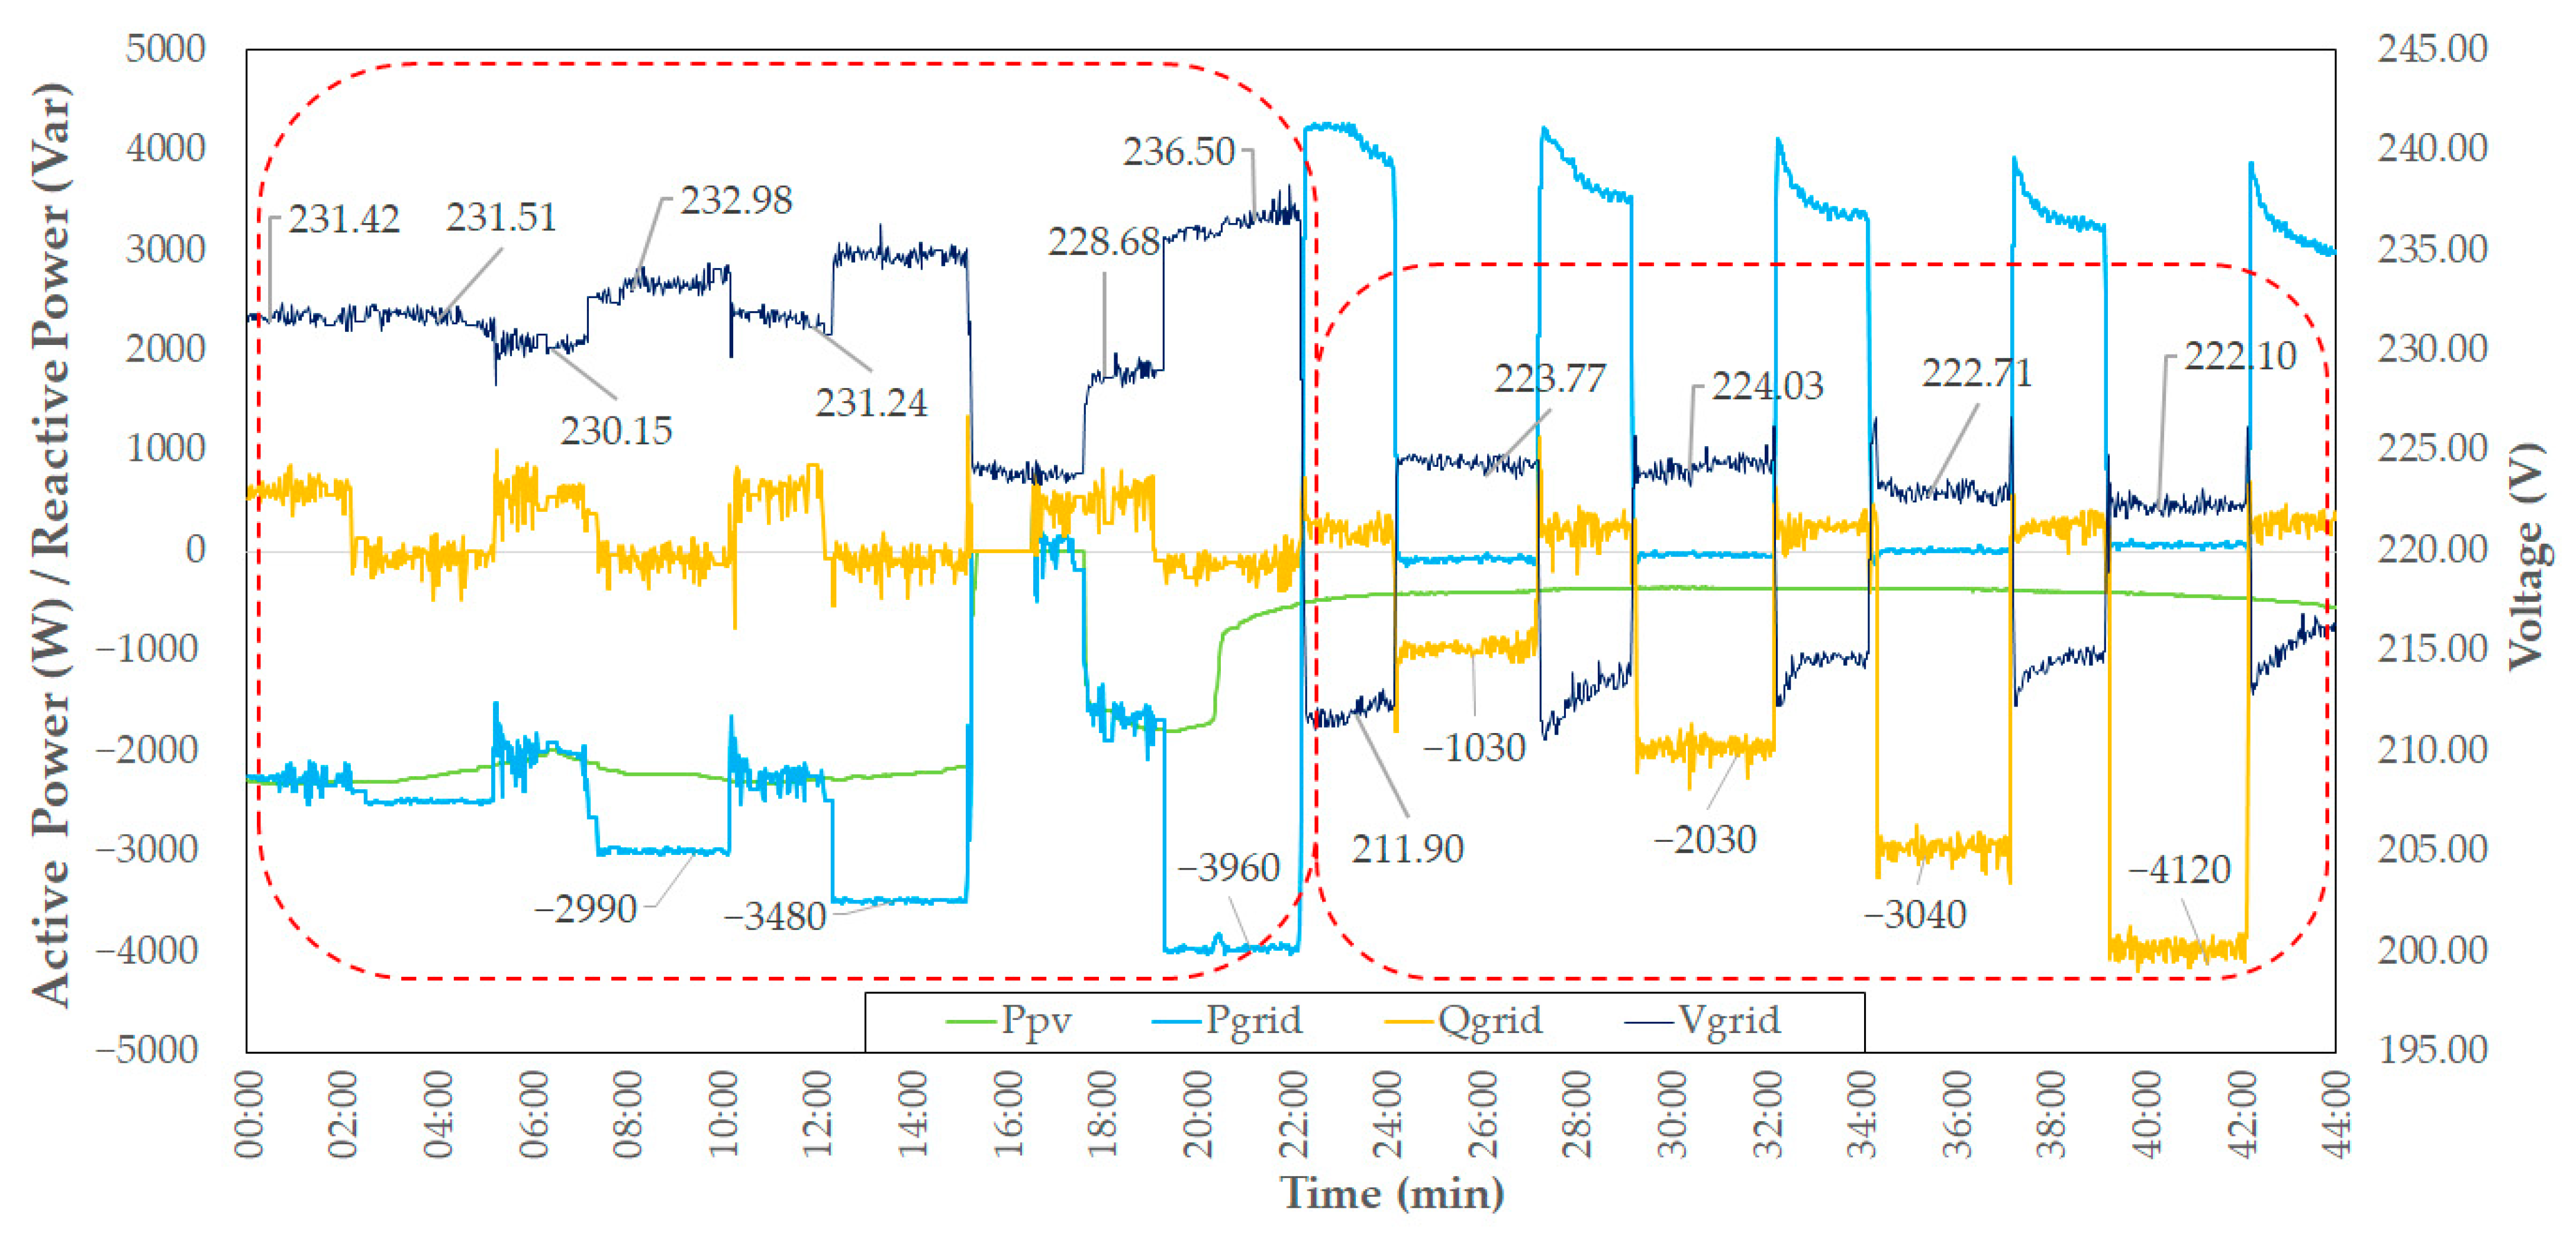
In addition, the test results revealed the relationship between active power injection and system frequency. The analysis showed that variations in exported or imported active power, regardless of magnitude, did not have a measurable impact on grid frequency. This outcome is attributed to the relatively small capacity of the implemented VPP system compared to the much larger interconnected grid, such as the Java-Madura-Bali (Jamali) system. As a result, the power exchanges at the VPP level are negligible in scale and do not exert sufficient influence to affect the overall grid frequency. The relationship between power and frequency is illustrated in Figure 14.

4.8. Voltage Control

The testing also revealed the relationship between active and reactive power injection and the corresponding voltage response. During reactive power injection, the voltage increased significantly by approximately ±10 V and remained stable, despite the injected reactive power varying from 1000 to 4000 var. This behavior indicates that reactive power injection has a strong and stabilizing effect on voltage, primarily because it compensates for the inductive nature of loads and mitigates voltage drops across the reactive impedance of the network. The voltage rise followed by stabilization suggests that the system was approaching a reactive power balance, where additional Var injections no longer caused significant changes in voltage levels.
In contrast, during active power injections ranging from 1000 to 4000 W, the voltage also increased but in a more variable manner, ranging from 2 V to 8 V. This voltage variation is attributed to the increased current flow associated with active power injection, which affects voltage distribution across the system’s impedance. These results demonstrate the distinct impacts of active and reactive power injections on voltage dynamics. The relationship between power injection and voltage response is shown in Figure 15.
The conclusion of testing the test parameters with frequency regulation and voltage control is summarized in Table 5.

5. Conclusions

This study presents the design, implementation, and experimental validation of a cluster-based VPP framework integrated with a centralized VMS. The developed system comprises two clusters, each equipped with solar PV, BESS, controllable loads, and LCU. It was tested under continuous (normal) and limited mode, which was verified in accordance with IEC TS 63189-1:2023, the standard that defines the architecture and functional requirements of VPPs. Results demonstrate that the VPP effectively manages power export–import flows and enables real-time frequency and voltage regulation via controlled export of active and reactive power. The system achieved fast response times of 7 s for frequency regulation and 11 s for voltage control, both classified as Level 1 for real-time response. Adjustment rates were 103%/min for active power and 80%/min for reactive power, indicating fast and medium ramping capabilities, respectively. Adjustment accuracy reached 3% for active power and 6% for reactive power, indicating the need for further refinement in active power control. Both clusters were also tested to see the performance of VPP’s aggregation management. The test demonstrated the VPP’s ability to maintain stable power export at increasing load levels (6 kW to 8 kW) while effectively managing state-of-charge (SoC) dynamics. Despite gradual SoC reductions (99% to 95% on cluster 1; 97% to 92% on cluster 2), the system delivered uninterrupted export for 300 s intervals without instability or overvoltage events. Moreover, voltage control tests showed that reactive power injection of 1–4 kVar resulted in stable voltage increases of approximately ±10 V, demonstrating its stabilizing effect. Meanwhile, the frequency regulation test indicates minimal impact on system frequency in interconnected grids.
These results confirm that the proposed cluster-based VPP framework is scalable, responsive, and technically feasible for real-world implementation. The responsive characteristics of the VPP system can serve as a bridge to facilitate regulatory changes aimed at increasing rooftop solar PV quotas, thereby enabling greater penetration of renewable energy in Indonesia. Future work should focus on improving active power control accuracy, integrating predictive and optimization algorithms for DER generation and load dispatch, and conducting field-scale deployment and cyber-physical resilience assessments.

Author Contributions

Conceptualization, P.A.A.P. and K.F.; methodology, A.C.M. and H.H.; software, Y.M. and D.A.R.; validation, S.S., B.S.M. and K.A.; formal analysis, P.A.A.P. and K.F.; investigation, A.C.M. and H.H.; resources, A.P., A.T. and A.K.; data curation, A.C.M. and K.F.; writing—original draft preparation, P.A.A.P., A.C.M., H.H., A.P. and A.T.; writing—review and editing P.A.A.P. and K.F.; visualization, Y.M., D.A.R. and A.K.; supervision, S.S., B.S.M. and K.A.; project administration, K.F. All authors have read and agreed to the published version of the manuscript.

Funding

This research received no external funding.

Data Availability Statement

The data will be made available on request. The data are not publicly available due to an ongoing patent application process.

Acknowledgments

The authors thank the PLN PUSLITBANG and BRIN for providing the technical support.

Conflicts of Interest

Authors Putu Agus Aditya Pramana, Akhbar Candra Mulyana, Sriyono Sriyono and Buyung Sofiarto Munir were employed by the company PT PLN (Persero). The remaining authors declare that the research was conducted in the absence of any commercial or financial relationships that could be construed as a potential conflict of interest.

References

  1. Gong, X.; Wang, X.; Cao, B. On Data-Driven Modeling and Control in Modern Power Grids Stability: Survey and Perspective. Appl. Energy 2023, 350, 121740. [Google Scholar] [CrossRef]
  2. Qudaisat, M.; Alipour, A. Future-Proofing Energy Infrastructure Resilience with Distributed Energy Resources. Dev. Built Environ. 2025, 23, 100696. [Google Scholar] [CrossRef]
  3. Adham, M.; Keene, S.; Bass, R.B. Distributed Energy Resources: A Systematic Literature Review. Energy Rep. 2025, 13, 1980–1999. [Google Scholar] [CrossRef]
  4. Amiruddin, A.; Dargaville, R.; Gawler, R. Optimal Integration of Renewable Energy, Energy Storage, and Indonesia’s Super Grid. Energies 2024, 17, 5061. [Google Scholar] [CrossRef]
  5. Sulaeman, I.; Simatupang, D.P.; Noya, B.K.; Suryani, A.; Moonen, N.; Popovic, J.; Leferink, F. Remote Microgrids for Energy Access in Indonesia—Part i: Scaling and Sustainability Challenges and a Technology Outlook. Energies 2021, 14, 6643. [Google Scholar] [CrossRef]
  6. Morstyn, T.; Farrell, N.; Darby, S.J.; McCulloch, M.D. Using Peer-to-Peer Energy-Trading Platforms to Incentivize Prosumers to Form Federated Power Plants. Nat. Energy 2018, 3, 94–101. [Google Scholar] [CrossRef]
  7. Kaiss, M.; Wan, Y.; Gebbran, D.; Vila, C.U.; Dragičević, T. Review on Virtual Power Plants/Virtual Aggregators: Concepts, Applications, Prospects and Operation Strategies. Renew. Sustain. Energy Rev. 2025, 211, 115242. [Google Scholar] [CrossRef]
  8. Marinescu, B.; Gomis-Bellmunt, O.; Dörfler, F.; Schulte, H.; Sigrist, L. Dynamic Virtual Power Plant: A New Concept for Grid Integration of Renewable Energy Sources. IEEE Access 2022, 10, 104980–104995. [Google Scholar] [CrossRef]
  9. Liu, J.; Hu, H.; Yu, S.S.; Trinh, H. Virtual Power Plant with Renewable Energy Sources and Energy Storage Systems for Sustainable Power Grid-Formation, Control Techniques and Demand Response. Energies 2023, 16, 3705. [Google Scholar] [CrossRef]
  10. Abdelkader, S.; Amissah, J.; Abdel-Rahim, O. Virtual Power Plants: An In-Depth Analysis of Their Advancements and Importance as Crucial Players in Modern Power Systems. Energy Sustain. Soc. 2024, 14, 52. [Google Scholar] [CrossRef]
  11. Moghadam, M.; Ghaffarzadeh, N.; Tahmasebi, M.; Pasupuleti, J. Virtual Power Plant Management with Hybrid Energy Storage System. Unconv. Resour. 2025, 5, 100107. [Google Scholar] [CrossRef]
  12. Zhong, W.; Chen, J.; Liu, M.; Murad, M.A.A.; Milano, F. Coordinated Control of Virtual Power Plants to Improve Power System Short-Term Dynamics. Energies 2021, 14, 1182. [Google Scholar] [CrossRef]
  13. Sarmiento-Vintimilla, J.C.; Torres, E.; Larruskain, D.M.; Pérez-Molina, M.J. Applications, Operational Architectures and Development of Virtual Power Plants as a Strategy to Facilitate the Integration of Distributed Energy Resources. Energies 2022, 15, 775. [Google Scholar] [CrossRef]
  14. Morteza Rahimiyan, L.B. Real-Time Energy Management of a Smart Virtual Power Plant. IET Gener. Transm. Distrib. 2018, 13, 2015–2023. [Google Scholar] [CrossRef]
  15. Yang, Q.; Wang, H.; Wang, T.; Zhang, S.; Wu, X.; Wang, H. Blockchain-Based Decentralized Energy Management Platform for Residential Distributed Energy Resources in a Virtual Power Plant. Appl. Energy 2021, 294, 117026. [Google Scholar] [CrossRef]
  16. Setiawan, A.; Jufri, F.H.; Dzulfiqar, F.; Samual, M.G.; Arifin, Z.; Angkasa, F.F.; Aryani, D.R.; Garniwa, I.; Sudiarto, B. Opportunity Assessment of Virtual Power Plant Implementation for Sustainable Renewable Energy Development in Indonesia Power System Network. Sustainability 2024, 16, 1721. [Google Scholar] [CrossRef]
  17. Soto, E.A.; Bosman, L.B.; Wollega, E.; Leon-Salas, W.D. Analysis of Grid Disturbances Caused by Massive Integration of Utility Level Solar Power Systems. Eng 2022, 3, 236–253. [Google Scholar] [CrossRef]
  18. Callegaro, L.; Konstantinou, G.; Rojas, C.A.; Avila, N.F.; Fletcher, J.E. Testing Evidence and Analysis of Rooftop PV Inverters Response to Grid Disturbances. IEEE J. Photovolt. 2020, 10, 1882–1891. [Google Scholar] [CrossRef]
  19. Esfahani, M.; Alizadeh, A.; Cao, B.; Kamwa, I.; Xu, M. Bridging Theory and Practice: A Comprehensive Review of Virtual Power Plant Technologies and Their Real-World Applications. Renew. Sustain. Energy Rev. 2025, 222, 115929. [Google Scholar] [CrossRef]
  20. Xie, Y.; Zhang, Y.; Lee, W.J.; Lin, Z.; Shamash, Y.A. Virtual Power Plants for Grid Resilience: A Concise Overview of Research and Applications. IEEE/CAA J. Autom. Sin. 2024, 11, 329–343. [Google Scholar] [CrossRef]
  21. Elkhatib, M.; Johnson, J.; Schoenwald, D. Virtual Power Plant Feedback Control Design for Fast and Reliable Energy Market and Contingency Reserve Dispatch. In Proceedings of the 2017 IEEE 44th Photovoltaic Specialist Conference (PVSC), Washington, DC, USA, 25–30 June 2017; pp. 2969–2974. [Google Scholar] [CrossRef]
  22. IEC TS 63189-1; Virtual Power Plants—Part 1: Architecture and Functional Requirements. IEC: Geneva, Switzerland, 2023.
  23. Alves, F.; Ribeiro, R.; Petiz, M.; Abbasi, A.; Carvalho, P.; Faia, R.; Faria, P.; Vaie, Z.; Rodrigues, R. Virtual Power Plant Optimization Service-Benchmark of Solvers. In Proceedings of the 2024 19th Conference on Computer Science and Intelligence Systems (FedCSIS), Belgrade, Serbia, 8–11 September 2024; pp. 279–287. [Google Scholar] [CrossRef]
  24. Häberle, V.; Tayyebi, A.; He, X.; Prieto-Araujo, E.; Dörfler, F. Grid-Forming and Spatially Distributed Control Design of Dynamic Virtual Power Plants. IEEE Trans. Smart Grid 2024, 15, 1761–1777. [Google Scholar] [CrossRef]
  25. Abbasi, A.; Alves, F.; Ribeiro, R.A.; Sobral, J.L.; Rodrigues, R. Optimizing Virtual Power Plants with Parallel Simulated Annealing on High-Performance Computing. Smart Cities 2025, 8, 47. [Google Scholar] [CrossRef]
  26. Ju, L.; Lv, S.S.; Li, Y.; Li, Y.; Qi, X.; Li, G.; Zhang, F. Two-Stage Scheduling Optimization Model and Benefit Allocation Strategy for Virtual Power Plant Clusters Aggregated by Multidimensional Information Indicators. Renew. Energy 2025, 240, 122245. [Google Scholar] [CrossRef]
  27. Wu, C.; Fang, L.; Yang, T.; Zhang, F.; Qiu, Y. Virtual Power Plant Response Strategy Considering Dynamic Aggregation of Different Flexible Resources. J. Phys. Conf. Ser. 2024, 2774, 012044. [Google Scholar] [CrossRef]
  28. Oladimeji, O.; Ortega, A.; Sigrist, L.; Marinescu, B.; Thomas, V. Adaptive High-Performance Optimization Tool for Real-Time Operation of Renewable-Based Virtual Power Plants. IEEE Access 2025, 13, 11479–11493. [Google Scholar] [CrossRef]
  29. Chatzistylianos, E.S.; Psarros, G.N.; Papathanassiou, S.A. Export Constraints Applicable to Renewable Generation to Enhance Grid Hosting Capacity. Energies 2024, 17, 2588. [Google Scholar] [CrossRef]
  30. Mihalič, F.; Truntič, M.; Hren, A. Hardware-in-the-Loop Simulations: A Historical Overview of Engineering Challenges. Electronics 2022, 11, 2462. [Google Scholar] [CrossRef]
  31. Qais, M.; Kirli, D.; Moroshko, E.; Kiprakis, A.; Tsaftaris, S. A Virtual Power Plant for Coordinating Batteries and EVs of Distributed Zero-Energy Houses Considering the Distribution System Constraints. J. Energy Storage 2025, 106, 114905. [Google Scholar] [CrossRef]
  32. Sun, Z.; Lu, T. Collaborative Operation Optimization of Distribution System and Virtual Power Plants Using Multi-Agent Deep Reinforcement Learning with Parameter-Sharing Mechanism. IET Gener. Transm. Distrib. 2024, 18, 39–49. [Google Scholar] [CrossRef]
  33. Lin, X.; Lin, X.; Zhong, W.; Zhou, Y. Predictive Operation Optimization of Multi-Energy Virtual Power Plant Considering Behavior Uncertainty of Diverse Stakeholders. Energy 2023, 280, 128130. [Google Scholar] [CrossRef]
  34. Zhu, X.; Ruan, G.; Geng, H. Optimal Frequency Support from Virtual Power Plants: Minimal Reserve and Allocation. Appl. Energy 2025, 392, 125913. [Google Scholar] [CrossRef]
  35. Sawilam, M.; Kizilkaya, B.; Taha, A.; Flynn, D.; Imran, M.A.; Ansari, S. Impact of Virtual Power Plants on Grid Stability and Renewable Energy Integration in Smart Cities Using IoT. Energy Rep. 2025, 13, 3312–3323. [Google Scholar] [CrossRef]
  36. SPLN S3.006-1:2024; Remote Terminal Unit (RTU) and SCADA Gateway Specification Part 1: Transmission. PT PLN (Persero): Jakarta, Indonesia, 2024.
  37. Manowska, A.; Wycisk, A.; Nowrot, A.; Pielot, J. The Use of the MQTT Protocol in Measurement, Monitoring and Control Systems as Part of the Implementation of Energy Management Systems. Electronics 2023, 12, 17. [Google Scholar] [CrossRef]
  38. Burgio, A.; Cimmino, D.; Nappo, A.; Smarrazzo, L.; Donatiello, G. An IoT-Based Solution for Monitoring and Controlling Battery Energy Storage Systems at Residential and Commercial Levels. Energies 2023, 16, 3140. [Google Scholar] [CrossRef]
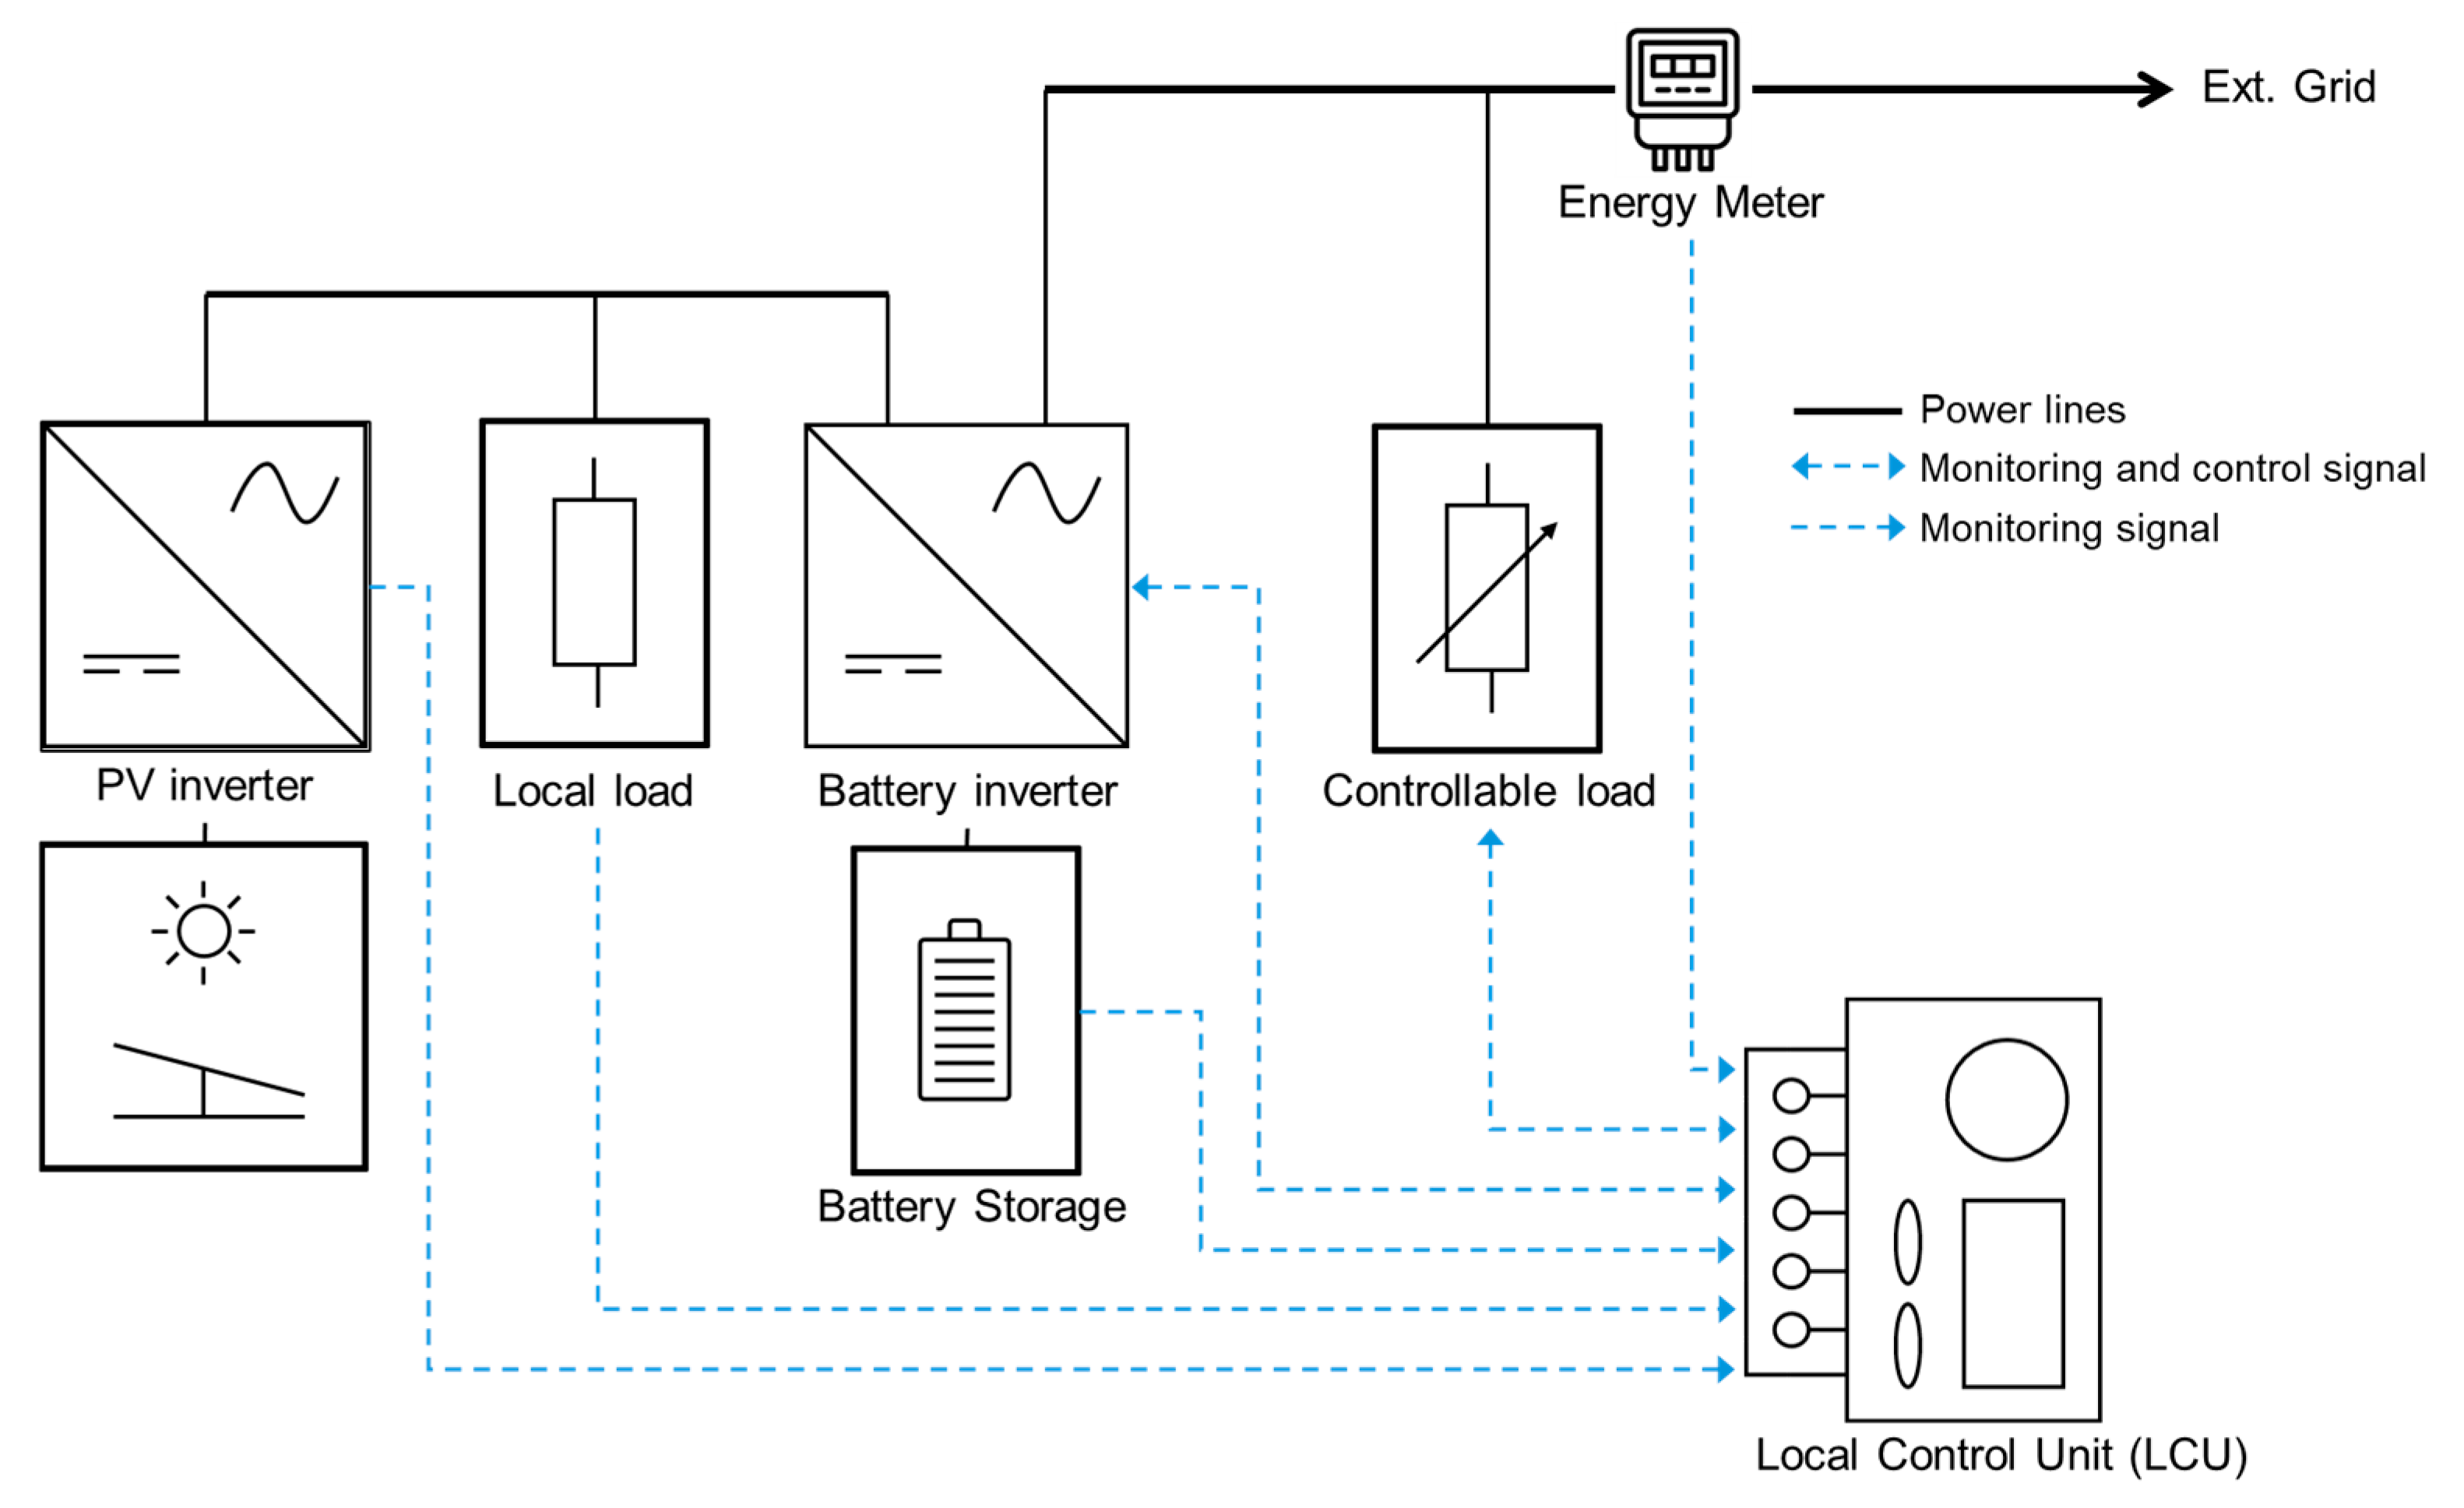
Figure 1. VPP Cluster configuration.
Energies 18 05300 g001
Figure 2. Two VPP Clusters interacting with VMS.
Energies 18 05300 g002
Figure 3. LCU and VMS function block diagrams.
Energies 18 05300 g003
Figure 4. Flowchart of LCU operation.
Energies 18 05300 g004
Figure 5. Communication interfaces between LCU and VMS.
Energies 18 05300 g005
Figure 6. Aggregate setpoint calculation.
Energies 18 05300 g006
Figure 7. Block diagram of experimental setup.
Energies 18 05300 g007
Figure 8. The experimental setup.
Energies 18 05300 g008
Figure 9. Functional test results in continuous mode.
Energies 18 05300 g009
Figure 10. Functional test results in limited mode.
Energies 18 05300 g010
Figure 11. Functional test results on aggregation management.
Energies 18 05300 g011
Figure 12. Functional test results on response time; the black circle highlights the delay between the setpoint and the export power.
Energies 18 05300 g012
Figure 13. Functional test results on adjustment accuracy.
Energies 18 05300 g013
Figure 14. Functional test results on frequency regulation.
Energies 18 05300 g014
Figure 15. Functional test results on voltage control. The right-hand graph shows the impact of reactive power injection, while the left-hand graph depicts the impact of active power injection.
Energies 18 05300 g015
Table 1. Summary of Key Studies and Contributions to Scalable VPP Development and Experimental Validation.
StudyFocus AreaLimitationsContribution
[20,21,22,23]Scalable Clustered VPP ArchitectureLimited scalability for large multi-cluster systemsProposes a hierarchical, scalable, clustered VPP architecture integrating multi-layer optimization
[11,25,26]Real-Time Control StrategiesInadequate adaptive algorithms to handle operational disturbancesDevelops adaptive real-time model predictive control to handle disturbances
[27,31,32]Grid Import/Export Behavior ModellingOversimplified models ignore complex grid interactionsImplements accurate grid interaction modelling integrated into VPP optimization
[33,34]Experimental ValidationValidation of results obtained from simulations and modelsPractical tests are used to check if the simulated VPP models and control methods work in real conditions.
This Work (Proposed)Integrated scalable VPP architecture with responsive control and experimental validation-Provides a holistic framework combining scalable clustered architecture, responsive real-time control, and experimental validation for reliable and practical VPP deployment
Table 2. Assets used in the setup.
Cluster 1Cluster 2
PV Module3.9 kW3.9 kW
PV Inverter3.6 kW3 kW
Battery Energy StorageLFP 51.2 V 100 AhLFP 51.2 V 100 Ah
Battery Inverter6 kW 6 kW
LCUPLC and Raspberry PiPLC and Raspberry Pi
Controllable loadMax 5 kW-
Local loadAir Conditioner, desktop PC, LAN ServerLCD Screen, 2 laptops, 4 LED Lights
Table 3. Testing Scenarios.
Operation ModeClusterExport Injection (P)Export Injection (Q)Import Injection (P)
Continuous12.5–4 kW1–4 kVar1–4 kW
2
Limited11–4 kW
2
Table 4. VPP Testing Parameter.
Technical IndexFrequency RegulationVoltage ControlReserve CapacityCongestion Management
Response TimeLevel 1≤20 s≤20 s≤1 min≤1 min
Level 220 s–1 min20 s–1 min1 min–1 h1 min–1 h
Level 31 min–5 min1 min–5 min>1 h>1 h
Adjustment RateLevel 1>20%/min>100%/min>10%/min>10%/min
Level 23–20%/min25–100%/min1–10%/min1–10%/min
Level 31–3%/min10–25%/min≤1%/min≤1%/min
Adjustment AccuracyLevel 1≤0.5%≤3%≤1.5%≤1.5%
Level 20.5–1%3–7%1.5–10%1.5–10%
Level 31–1.5%7–10%>10%>10%
Table 5. Summary of test results for frequency regulation and voltage control.
Technical IndexFrequency RegulationVoltage Control
StandardTest ResultsStandardTest Results
Response TimeLevel 1≤20 s7 s≤20 s11 s
Level 220 s–1 min20 s–1 min
Level 31 min–5 min1 min–5 min
Adjustment AccuracyLevel 1≤0.5%3%≤3%6%
Level 20.5–1%3–7%
Level 31–1.5%7–10%
Adjustment RateLevel 1>20%/min103%/min>100%/min80%/min
Level 23–20%/min25–100%/min
Level 31–3%/min10–25%/min
Disclaimer/Publisher’s Note: The statements, opinions and data contained in all publications are solely those of the individual author(s) and contributor(s) and not of MDPI and/or the editor(s). MDPI and/or the editor(s) disclaim responsibility for any injury to people or property resulting from any ideas, methods, instructions or products referred to in the content.