Article

Evaluation of Peak Shaving and Valley Filling Efficiency of Electric Vehicle Charging Piles in Power Grids

1
School of Economics and Management, Zhejiang Ocean University, Zhoushan 316000, China
2
School of Public Administration, Hohai University, Nanjing 210098, China
*
Author to whom correspondence should be addressed.
Energies 2025, 18(19), 5284; https://doi.org/10.3390/en18195284 (registering DOI)
Submission received: 11 September 2025 / Revised: 25 September 2025 / Accepted: 2 October 2025 / Published: 5 October 2025
(This article belongs to the Section E: Electric Vehicles)

Abstract

As electric vehicles (EVs) continue to advance, the impact of their charging on the power grid is receiving increasing attention. This study evaluates the efficiency of EV charging piles in performing peak shaving and valley filling for power grids, a critical function for integrating Renewable Energy Sources (RESs). Utilising a high-resolution dataset of over 240,000 charging transactions in China, the research classifies charging volumes into “inputs” (charging during peak grid load periods) and “outputs” (charging during off-peak, low-price periods). The Vector Autoregression (VAR) model is used to analyse interrelationships between charging periods. The methodology employs a Slack-Based Measure (SBM) Data Envelopment Analysis (DEA) model to calculate overall efficiency, incorporating charging variance as an undesirable output. A Malmquist index is also used to analyse temporal changes between charging periods. Key findings indicate that efficiency varies significantly by charging pile type. Bus Stations (BS) and Expressway Service Districts (ESD) demonstrated the highest efficiency, often achieving optimal performance. In contrast, piles at Government Agencies (GA), Parks (P), and Shopping Malls (SM) showed lower efficiency and were identified as key targets for optimisation due to input redundancy and output shortfall. Scenario analysis revealed that increasing off-peak charging volume could significantly improve efficiency, particularly for Industrial Parks (IP) and Tourist Attractions (TA). The study concludes that a categorised approach to the deployment and management of charging infrastructure is essential to fully leverage electric vehicles for grid balancing and renewable energy integration.

1. Introduction

With the meteoric growth of RESs in China, the problem of intermittency is increasingly prominent, and the consumption of RESs is becoming a growing burden on the grid. Therefore, the state is accelerating the construction of “RESs + energy storage” projects. Peak shaving and valley filling have become increasingly critical for power grid operations. On the other hand, by the end of 2024, the number of EVs in use in China had reached 31.4 million, accounting for 8.90% of the total automobile fleet, according to statistical data from the Ministry of Public Security. During the 14th Five-Year Plan period, China established the world’s largest EV charging infrastructure network, with an average of two charging piles for every five electric vehicles. EVs are envisioned as massive energy storage facilities due to the integrated batteries they carry. Moreover, EVs contribute to reducing carbon emissions in the transport sector. The layout of EV charging piles should consider not only user convenience but also their impact on the power grid. For instance, charging piles in certain locations may handle large charging volumes, significantly affecting grid operations, while others may have minimal influence. Therefore, planning charging infrastructure must account for its role in peak shaving and valley filling. This integrated approach represents a key distinction between our study and prior research. A practical example is the use of vehicle-to-grid (V2G) technology in Guangdong Province, China, where electric vehicles have contributed to reducing grid load [1]. The case of EV charging planning in Islamabad also demonstrates its effectiveness in maintaining grid stability [2]. Building on a classification of EV charging pile types, this study utilises charging volumes from distinct daily time intervals as designated “inputs” and “outputs” within the analytical framework. Unlike traditional DEA the overall efficiency and scale efficiency of charging piles were calculated using SBM and Malmquist-DEA, respectively. Furthermore, this paper conducted a scenario analysis using the Directional Distance Function (DDF) model to simulate varying multiples of charging volume at EV charging piles during off-peak load periods. The marginal contribution of this study lies in its evaluation of the efficiency of various EV charging pile types to flatten the peak-to-valley load difference in the power grid. It not only establishes a quantifiable criterion for the rational deployment of charging infrastructure but also integrates EV charging with peak shaving and valley filling for power grids.
This study is developed based on the following assumptions: the optimal layout of EVs can respond to peak shaving and valley filling for power grids. The flexibility in charging scheduling, combined with the energy storage capacity of EV batteries, represents a significant opportunity. Previous studies insisted that the adoption of EVs should not challenge grid operators but bring opportunities and enhance consumer welfare [3,4,5]. The optimistic perspective holds that EVs possess the potential to consume a high percentage of abandoned RESs [6]. As charging EVs is regarded as a flexible load, they will mitigate peak-valley load when the RESs generation is not aligned with the demand. However, some previous studies insisted on considering wind power as the only resource to interact with EVs [7,8]. They may be correct, but their analysis overlooks the economic behaviour underlying EV charging. In reality, EVs are charged via charging piles at peak and valley tariffs, with charging pile tariffs typically reaching their lowest values during midday and nighttime. Scholars found that charging for EVs usually reaches its peak at night [1,9]. For EV users, scheduling charging times is a higher priority than selecting specific locations [10]. Peak and valley tariff policies can promote EVs to be dispatched for midday or nighttime charging. This will positively impact the peak shaving and valley filling for power grids. Research indicates that daytime EV charging activity is generally low, with a distinct peak around midday [1,11]. Midday is when photovoltaic power generation is at its peak. The electricity price for charging is also at its lowest during this period. It is precisely because electric vehicles are charged during off-peak hours—when both electricity demand and prices are at their lowest—that EVs are equally considered effective in consuming PV power [4]. Based on the foregoing analysis, we propose a hypothesis: that regulating the charging efficiency and spatial distribution of EV charging piles can facilitate peak shaving and valley filling for the power grid, thereby enhancing the integration of RESs and reducing wind and PV curtailment.
In addition to flexible charging scheduling, the inherent energy storage capability of EV batteries plays a pivotal role in peak shaving and valley filling for the power grid. Vehicle-to-grid (V2G) diffusion offers an additional avenue for EVs to integrate with the grid. Previous research has examined various scenarios, including charging time, charging infrastructure (e.g., charging piles), and distance traveled by EVs, ultimately concluding that V2G technology can significantly contribute to peak valley regulation of the power grid [1]. Batteries in electric vehicles can smooth the load fluctuations in the power grid, and their collective electricity storage potential can achieve a scale effect [12]. V2G technology leverages the battery energy storage of EVs to mitigate power supply fluctuations, and by interfacing with the grid, it forms a microgrid that helps to balance the load.
The predominant research approaches for investigating EV charging behaviour contribute to higher loads on grid equipment, but also offer flexibility based on model simulation [2,11]. That is the main idea of this study. Moreover, the PVAR model is employed to examine the interactive relationship between energy and development [3]. In addition, probability distributions of EVs charging was assumed [13], or the EVs’ daytime hourly charging behavior was simulated [4,14]. However, these studies remain at the stage of simulation or modeling and have not been validated using large-scale empirical data from actual EV charging activities. A focus on the structure of the electricity market and its incentive mechanisms is conducive to achieving vehicle-grid integration [5,15]. In practice, current EV charging infrastructure deployment primarily aims to alleviate range anxiety and promote EV adoption through expanded accessibility. Perhaps due to limitations in data availability, the effectiveness of EVs in supporting peak shaving and valley filling for the power grid has not yet been empirically validated. While peak shaving and valley filling are often regarded as distinctive functions of V2G technology, the evaluation of charging pile efficiency in providing these grid services and its implications for rational charging infrastructure planning have become increasingly relevant in the context of China’s rapidly expanding EV sector. Unfortunately, this research area has thus far attracted limited scholarly interest, likely due in part to constraints related to data availability.
This study utilises a high-resolution dataset of electric vehicle charging transactions in China, published by [16] in Scientific Data, comprising over 240,000 records collected from charging piles in 2021. The use of this empirically grounded dataset ensures the reliability and validity of the efficiency measurements conducted. It is expected that the findings will provide actionable insights for optimising the deployment and operation of charging infrastructure in the context of rapidly expanding EV charging piles. The rest of the paper proceeds as follows. Section 2 introduces the methodology used in this study. Section 3 analyses the empirical results. Section 4 presents the discussion. Section 5 presents the conclusion and discusses the implications of the findings. Finally, Section 6 presents the limitations and future work.

2. Theoretical Framework and Methodology

2.1. Theoretical Framework

Given that EV owners are willing to adjust their charging timing [10], it is reasonable to conclude that EV charging behaviour is largely influenced by charging location and cost. In practice, EV users’ primary concerns, aside from range anxiety, revolve around operational expenses. Meanwhile, to support peak shaving and valley filling in the power grid, tiered electricity pricing policies have been implemented. The specific tiered pricing structure applied to EV charging piles is summarised in Table 1 (During the study period, time intervals with an electricity price of 0.3784 Yuan/kWh are classified as off-peak hours, which correspond to the “output” dimension in the subsequent analysis.). The tiered electricity pricing data are divided into two components: one subset is used to characterize the “output” to the power system, while the other subset represents the “input” to the system. Charging during low electricity price periods can be regarded as an “output”, whereas charging during non-low-price periods is treated as an “input”.
Definition of “inputs” and “outputs”. In this context, “inputs” and “outputs” are not defined in a traditional production sense, but rather relative to the goal of maintaining grid balance through EV charging management. Inputs represent efforts or resources expended to reduce negative impacts on the grid—specifically, charging activities during peak periods that exacerbate grid stress. Outputs represent desired outcomes that support grid stability—specifically, charging activities during off-peak periods that contribute to valley filling and peak shaving. This conceptual framing allows us to evaluate how effectively EV charging behavior. The impact of EV charging on grid stability is twofold. On one hand, charging during peak load periods increases grid stress, thereby challenging system stability. Conversely, off-peak charging reduces excess supply in the electricity market and allows for more complete use of energy from renewable sources. The core objective of this study—peak shaving and valley filling—aims to shift charging activity from high-demand to low-demand periods. Within this framework, EV charging during on-peak hours is treated as an “input,” while charging during valley periods is regarded as an “output.” Table 1 presents the classification of charging volumes as inputs or outputs for their respective time intervals.
Feasibility analysis of peak shaving and valley filling efficiency for electric vehicle charging piles. We begin by categorizing distinct time intervals based on variations in grid load, and then aggregate electric vehicle charging volumes within each interval. Building on this segmentation, we hypothesize that EV charging contributes to peak shaving and valley filling, and we proceed to evaluate and analyze the efficiency of charging during grid off-peak periods compared to other time windows. Figure 1 displays the distribution of ten types of electric vehicle charging piles—such as Bus Station (BS), Expressway Service District (ESD), Financial Industrial Park (FIP), Government Agency (GA), Industrial Park (IP), Park (P), Shopping Mall (SM), Technology Park (TP), Tourist Attraction (TA), Wholesale Market (WM)—across different time intervals.
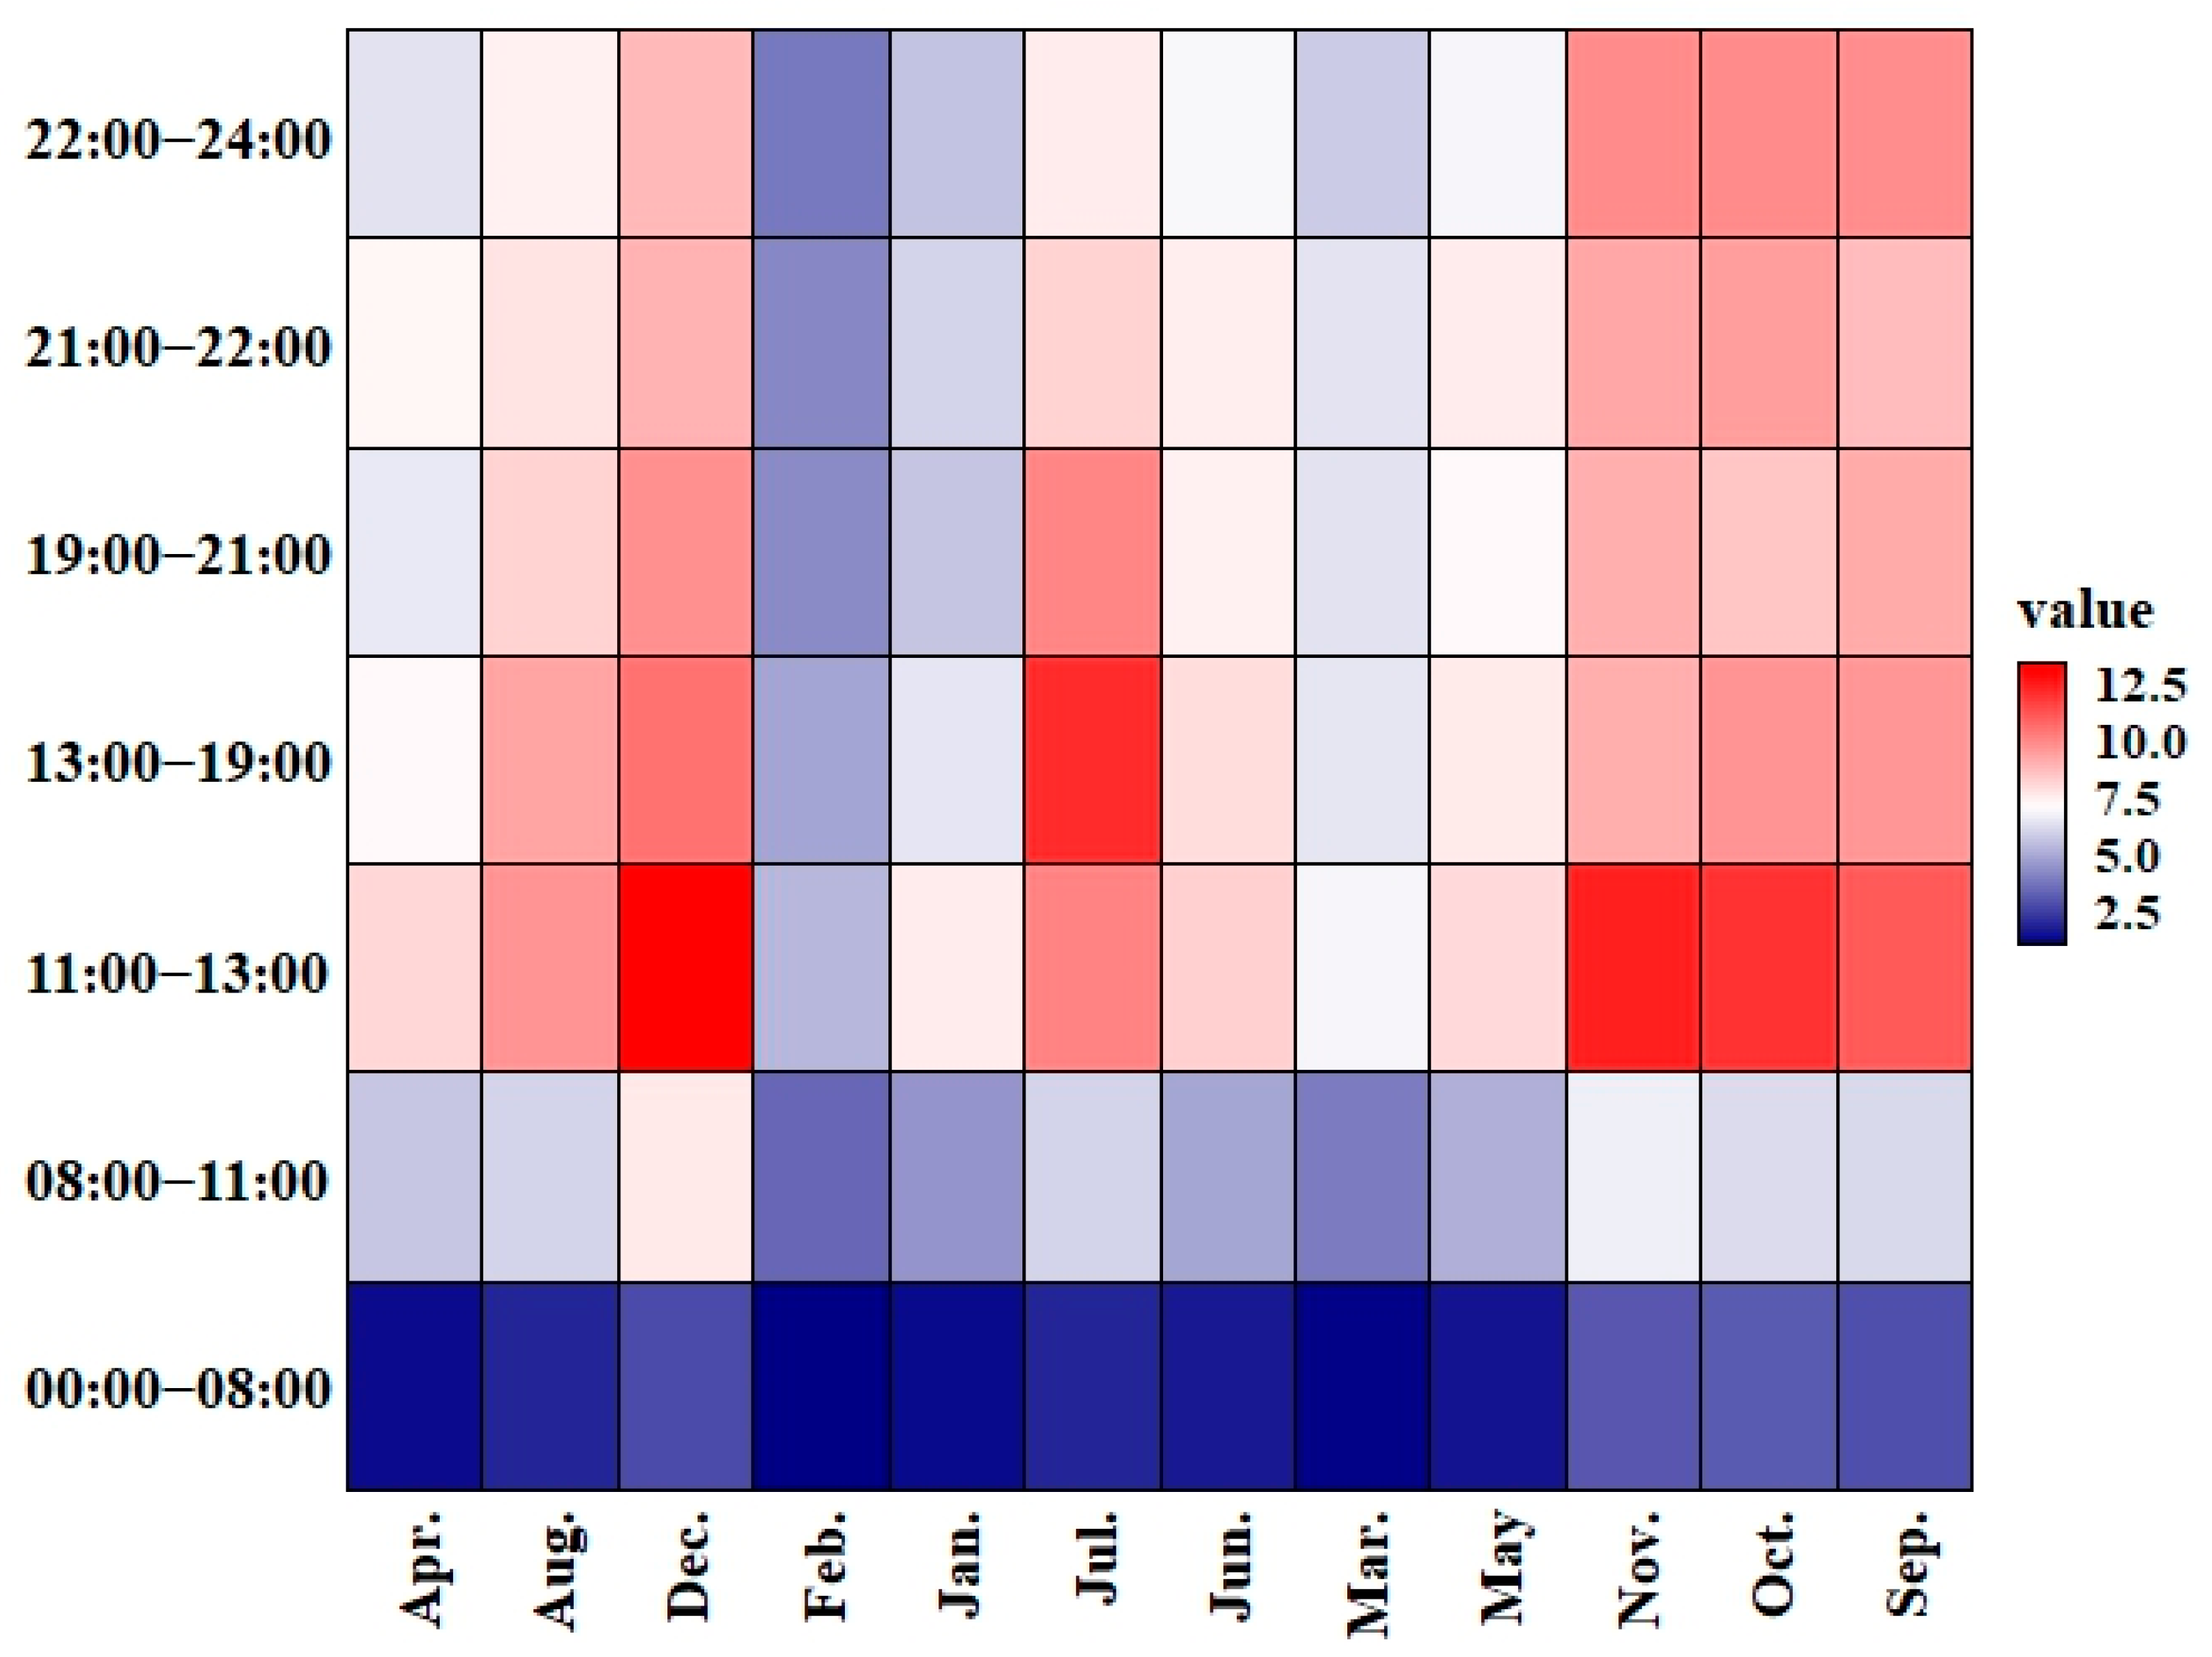
Figure 2 illustrates the heatmap distribution of average charging volume across different time intervals throughout January to December.
Both Figure 1 and Figure 2 indicate that the period from 0:00 to 8:00 corresponds to a valley in electric vehicle charging activity, while the interval from 11:00 to 13:00 exhibits a distinct peak. Notably, even during typical off-peak hours—such as 22:00–24:00 and 11:00–13:00—charging volumes show considerable variation across different types of charging piles. This is precisely why panel data is employed in the subsequent analysis. Due to the absence of charging records for FIP and TP-type charging piles in certain months or time intervals, a balanced panel dataset was constructed using the remaining eight types of charging piles.
To define the variables, we designate the charging volumes during three grid off-peak periods—0:00–8:00, 11:00–13:00 and 22:00–24:00 —as outputs, designated as Out1, Out2, and Out3, respectively. These time intervals also coincide with periods of high renewable energy generation output. The charging volumes during all other time intervals are defined as inputs, labelled as Inp1, Inp2, Inp3, and Inp4, respectively. Moreover, we consider that electric vehicle charging may increase the volatility of grid load—an outcome contrary to the objectives of peak shaving and valley filling. To account for this undesirable effect, we compute the variance of EV charging volumes and incorporate it as an “undesirable output” (Var).
Justification for Model Selection. Figure 2 reveals variations in the average charging volume across different time intervals and months. To quantify the resulting changes in efficiency, the Malmquist index was computed. Furthermore, to determine whether charging volumes in various time intervals are excessive or insufficient, we introduced a Slack-Based Measure (SBM) model capable of conducting redundancy analysis. The SBM model is widely used to evaluate the efficiency of input-output systems. In recent years, it has been applied to assess the production efficiency of renewable energy [17] and water utilization efficiency [18]. In this study, we conceptualize EV charging behavior as a system, where charging volumes during peak hours are treated as “inputs” to the system, while charging volumes during off-peak hours are regarded as “outputs”. This approach is motivated by the objective of maximizing off-peak charging and minimizing peak-hour charging, thereby enabling EVs to fulfill their role in peak shaving and valley filling for the power grid. Indeed, the terms “input” and “output” in this context refer to challenges to and enhancements of grid stability, respectively, rather than denoting inputs and outputs in the conventional production sense.
We focus on the following variables:
Overall Efficiency: This metric reflects the aggregate efficiency of electric vehicle charging piles in delivering peak shaving and valley filling services.
Given that EV charging operations may exhibit economies of scale, overall efficiency can be decomposed into:
Scale Efficiency (SEC): Measures whether EV charging activities achieve scale effects to enhance grid load management.
Pure Efficiency (PEC): Evaluates the intrinsic capability of EV charging infrastructure to balance peak and off-peak demand, independent of scale-related advantages.
(1)
To validate whether the proposed EV charging strategy contributes to peak shaving and valley filling, we first employ a Vector Autoregression (VAR) model. The charging volume data are divided into three temporal groups: the combined charging volume from 22:00 to 24:00 and 0:00–8:00 (NCV); the charging volume during 11:00–13:00 (MCV); and the charging volume during all other time periods (PEAK). (To simplify the model, we consolidate the charging volumes from non-renewable energy dominant periods—which also correspond to time intervals without the lowest electricity prices—into a single variable labeled PEAK). These groupings serve as key variables in the VAR analysis to assess dynamic interactions and grid load-shifting effects. If mutual influences exist among these variables, it would justify the comparative analysis of EV peak shaving and valley filling efficiency.
(2)
Similarly, using time series data, we proceed to a monthly efficiency comparison. At this stage, we introduce the Malmquist-Luenberger measure to evaluate whether efficiency in peak shaving and valley filling at EV charging piles has improved. A value greater than 1 indicates an improvement in efficiency, while a value less than 1 denotes a decline in efficiency.
(3)
Subsequently, we computed the overall efficiency, pure efficiency, and scale efficiency for each of the eight types of charging piles using panel data. Based on these results, we further quantified their redundancy during peak grid load periods and shortfalls during off-peak hours.
(4)
Finally, we conducted a scenario analysis of the peak shaving and valley filling efficiency of EV charging piles using the DDF model by scaling the charging volume during off-peak periods to 1.2, 1.5, 2, and 2.5 times the baseline level.

2.2. Methodology

2.2.1. Analysing Interrelationships in Charging Volume Using a VAR Model

A VAR model is characterised by a system of equations in which each equation shares the same set of right-hand side variables, specifically including lagged values of all endogenous variables within the system. The general expression for a VAR (p) model is:
N C V t = c + ϕ 1 N C V t 1 + ϕ 2 N C V t 2 + + ϕ p N C V t p + ε 1 , t M C V t = c + φ 1 M C V t 1 + φ 2 M C V t 2 + + φ p M C V t p + ε 2 , t P E A K t = c + θ 1 P E A K t - 1 + θ 2 P E A K t - 2 + L + θ p P E A K t - p + ε 3 , t
c is a vector of constants; ϕ , φ , θ are matrices of coefficients; p denotes the lag order of the endogenous variables; ε is a vector of error terms.

2.2.2. Calculation of EV Peak Shaving and Valley Filling Efficiency

We adopted the SBM model over traditional DEA or Stochastic Frontier Analysis (SFA) models for the following reasons:
(1)
Explicit slack variables.
The SBM model incorporates slacks in charging volumes across time intervals, allowing direct quantification of undercharging during off-peak hours and overcharging during peak periods.
(2)
Incorporation of grid stability impacts.
The SBM model accommodates the variance in charging volumes—treated as an undesirable output—to reflect grid stability risks, thereby preventing underestimation of efficiency losses in decision-making units (DMUs). Conventional DEA models lack this capability.
(3)
Avoidance of prescriptive functional forms of the production function.
Unlike the SFA model, which requires specifying a production function in advance, SBM does not impose the production function assumptions—a significant advantage given the complex nature of EV charging behaviour.
(4)
Robustness to data properties.
The SFA model requires input and output data to conform to the basic assumptions. Violations of these assumptions may lead to the problem of skewness, whereas SBM operates free of such constraints.
(5)
Handling multi-output settings.
SFA necessitates either aggregating multiple outputs into one single index or using distance functions, both of which are unsuitable for relatively independent EV charging volumes across time intervals. SBM natively supports multi-output evaluation.
Our objective is to maximise the charging volume during off-peak grid load periods; therefore, we selected an output-oriented SBM model that incorporates undesirable outputs:
θ * = min λ , S , S + 1 1 + 1 q + h ( i = 1 q S i + O u t i o + k = 1 h S k V a r k o )
s . t . O u t i o = j = 1 n λ j O u t i j S i + , i = 1 , 2 , 3 V a r k o = j = 1 n λ j V a r k j + S k , k = 1
λ j 0 ( j ) , S i + 0 ( i ) , S k 0 ( k )
where
O u t i o denotes the vector of charging volumes during off-peak periods for the o-th charging pile (serving as the desirable output of the o-th DMU);
V a r k o represents the fluctuation in charging volume of the o-th charging pile (treated as the undesirable output of the o-th DMU);
S i + indicates the shortfall in charging volume during off-peak hours for the o-th charging pile;
S k captures the redundancy in grid stability disturbance caused by the o-th charging pile;
j refers to the index of individual charging piles (j = 1, 2, …, n);
i represents the time intervals within off-peak charging periods.
q and h denote the number of inputs and outputs, respectively.
λ represents the linear combination coefficients.
With reference to the study by [19], the Malmquist index (M) can be formally expressed as follows:
M ( O u t t + 1 , I n p t + 1 , O u t t , I n p t , ) = D t ( I n p t + 1 , O u t t + 1 ) D t ( I n p t , O u t t ) × D t + 1 ( I n p t + 1 , O u t t + 1 ) D t + 1 ( I n p t , O u t t ) 1 2
The peak shaving and valley filling efficiency value, calculated based on the “inputs” and “outputs” defined in Equation (2), is denoted as D t ( Inp t , Out t ) . It represents the peak shaving and valley filling efficiency of EV charging piles in month t. D t + 1 ( Inp t , Out t ) denotes the efficiency in period t + 1 of month t. If M > 1, the efficiency has improved compared to the previous month. If M = 1, the efficiency remains unchanged from the last month; If M < 1, the efficiency has declined relative to the previous month.
The SBM-DDF model was employed to conduct sensitivity analysis. The inefficiency level measured by the model is expressed as follows:
θ * = max S r , S i , S k 1 n r = 1 n S r I n p g n I n p + 1 q + h ( i = 1 Q S i O u t g i O u t + k = 1 h S k V a r g k V a r ) 2
where ( g n I n p , g i O u t , g k V a r ) denote the directional vectors representing, holding inputs constant, increasing desirable outputs by a factor of p, and keeping undesirable outputs unchanged; while ( S r I n p , S i O u t , S k V a r ) are slack vectors indicating: input excess, shortfall in desirable outputs, and excess in undesirable outputs. A value greater than 0 suggests that both inputs and undesirable outputs exceed the levels on the production frontier, while desirable outputs fall short of the corresponding frontier point.

3. Results

3.1. Characterisation of Peak Shaving and Valley Filling Efficiency in EV Charging Piles

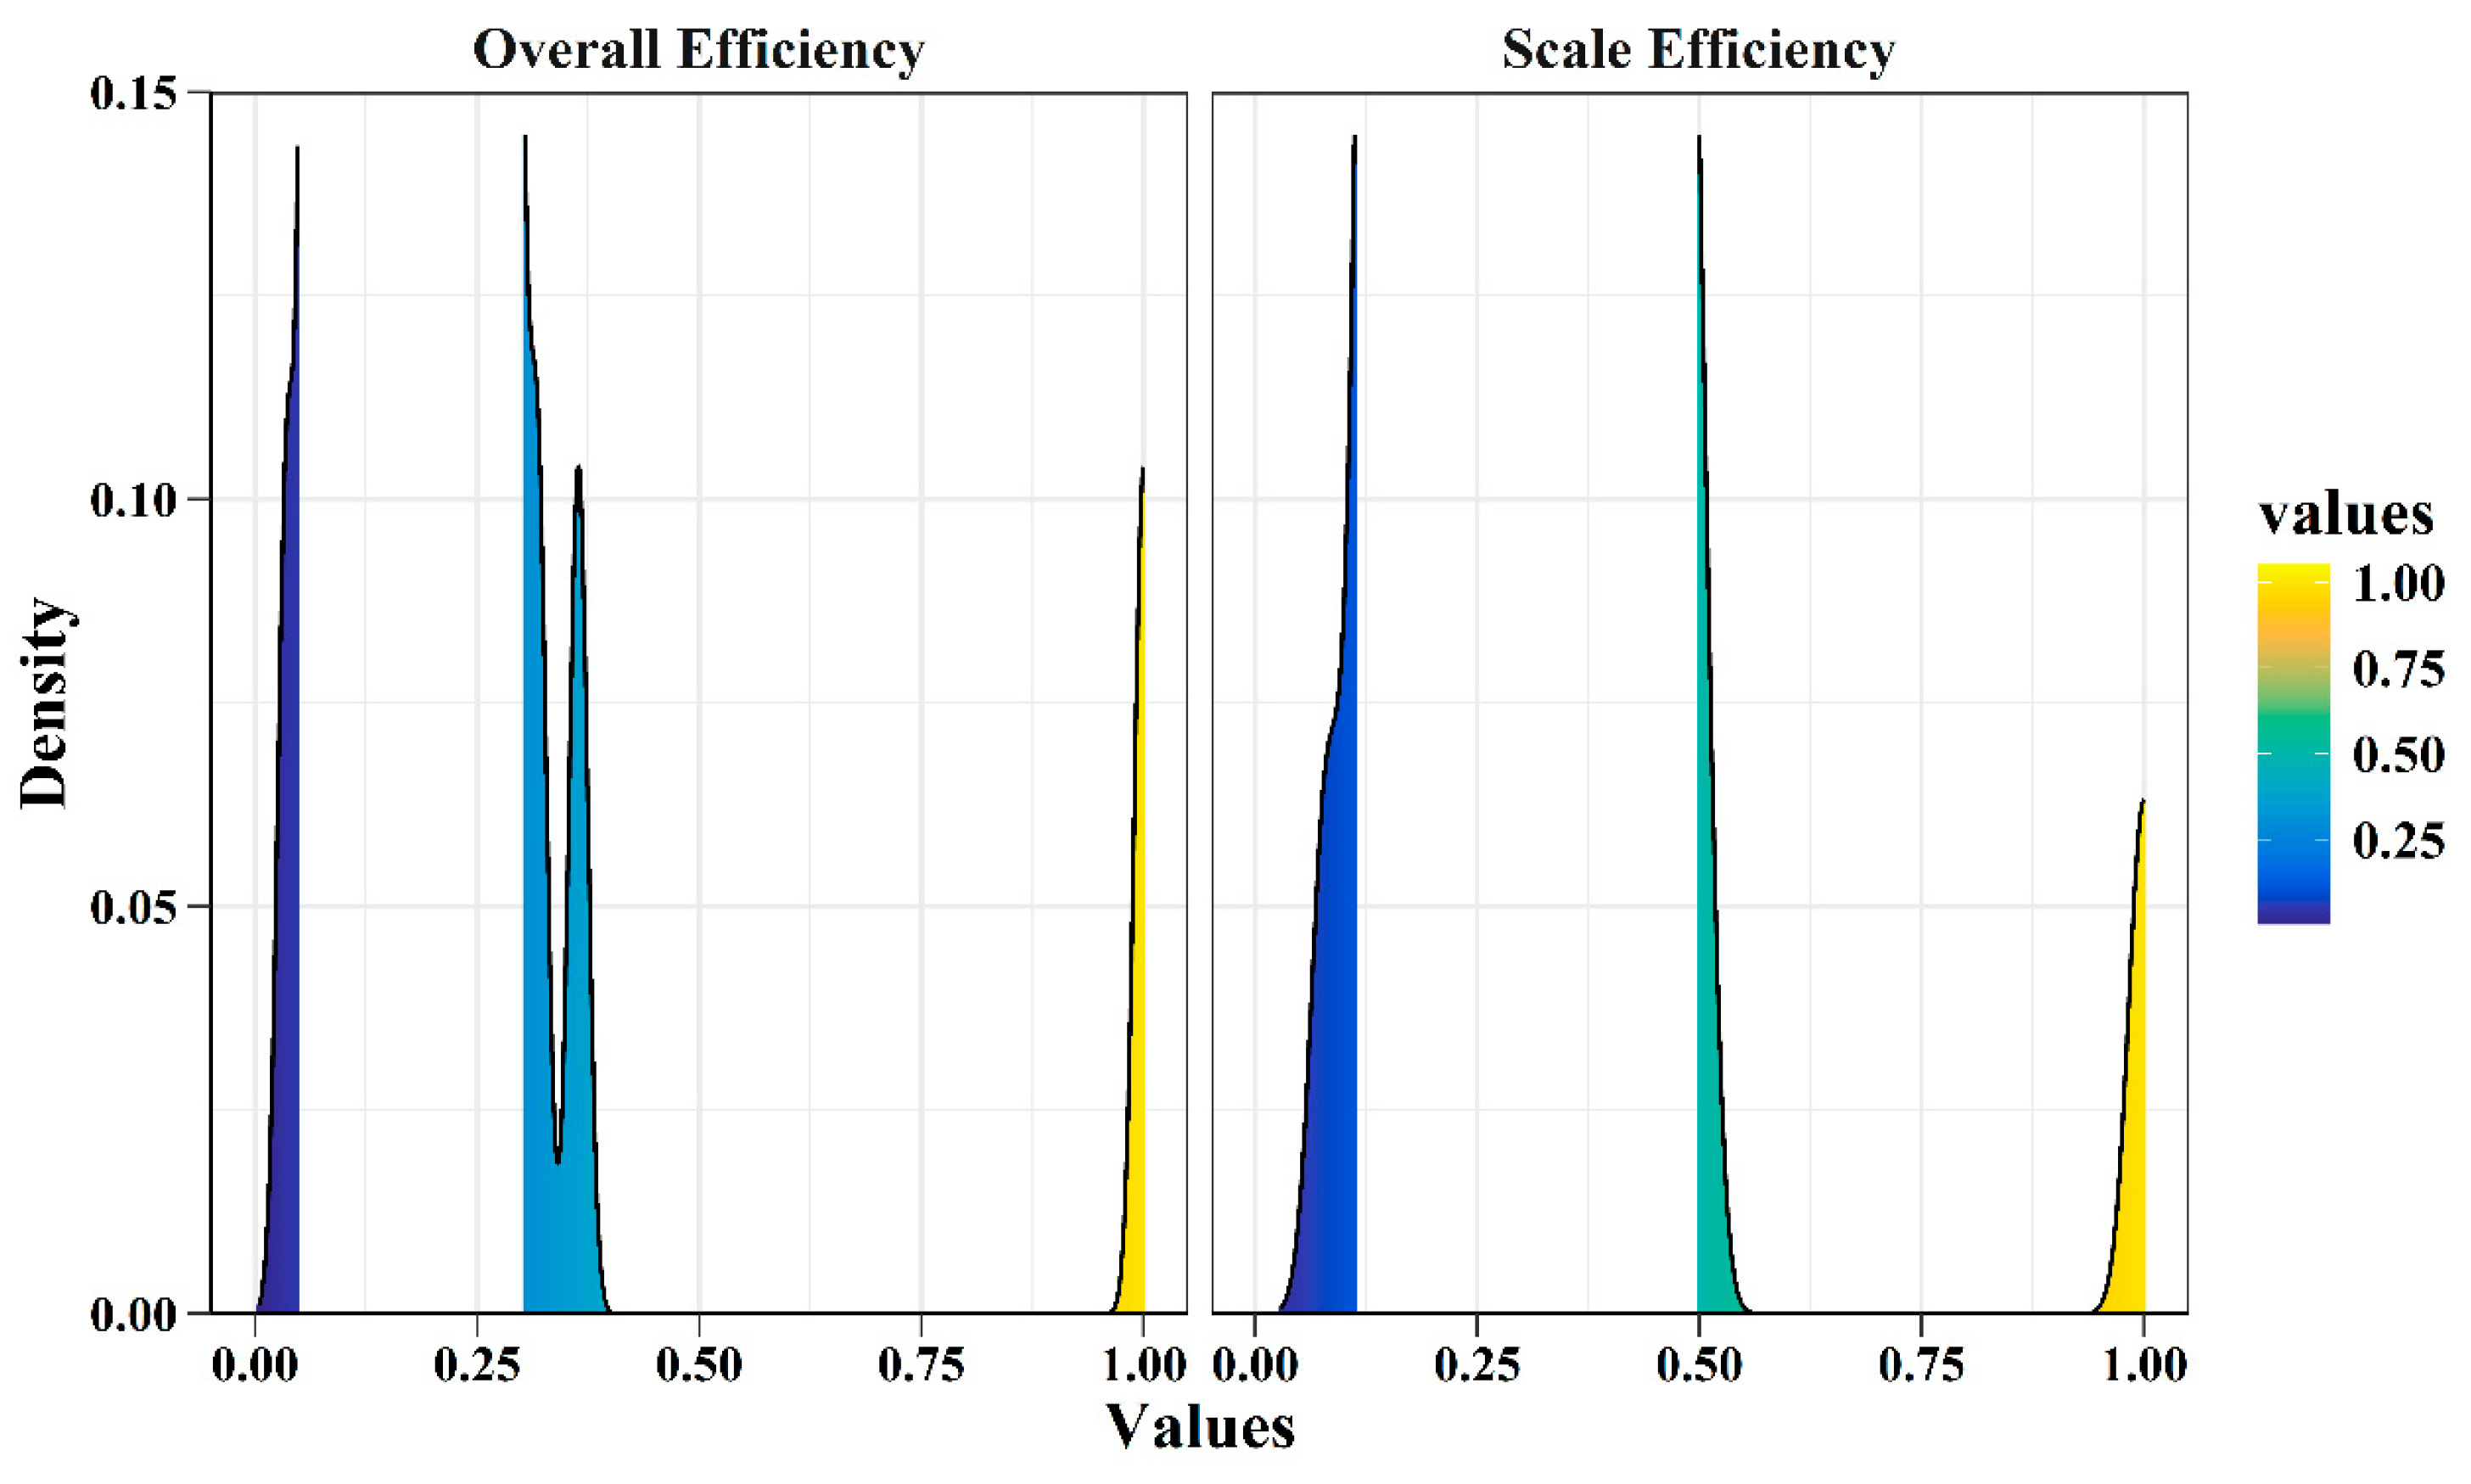
We initially performed an output-oriented efficiency analysis that incorporates undesirable outputs, utilising cross-sectional data on electric vehicle charging pile operations. The results are shown in Figure 3. The following are observed from the figure. (1) The overall efficiency of electric vehicle charging piles in peak shaving and valley filling shows a high concentration within the range of 0.3–0.4. (2) Compared to overall efficiency, the scale efficiency values are relatively higher. (3) Compared to overall efficiency, fewer observations achieve a scale efficiency value of 1, with the majority distributed at relatively lower levels.

3.2. The VAR Model Demonstrates the Feasibility of Utilising EV for Peak Shaving and Valley Filling Efficiency

We first performed unit root tests on the three variables—NCV, MCV, and PEAK. As shown in Table 2, the results from all three testing methods indicate that these variables are stationary (I (0)), supporting the use of a VAR model for further analysis.
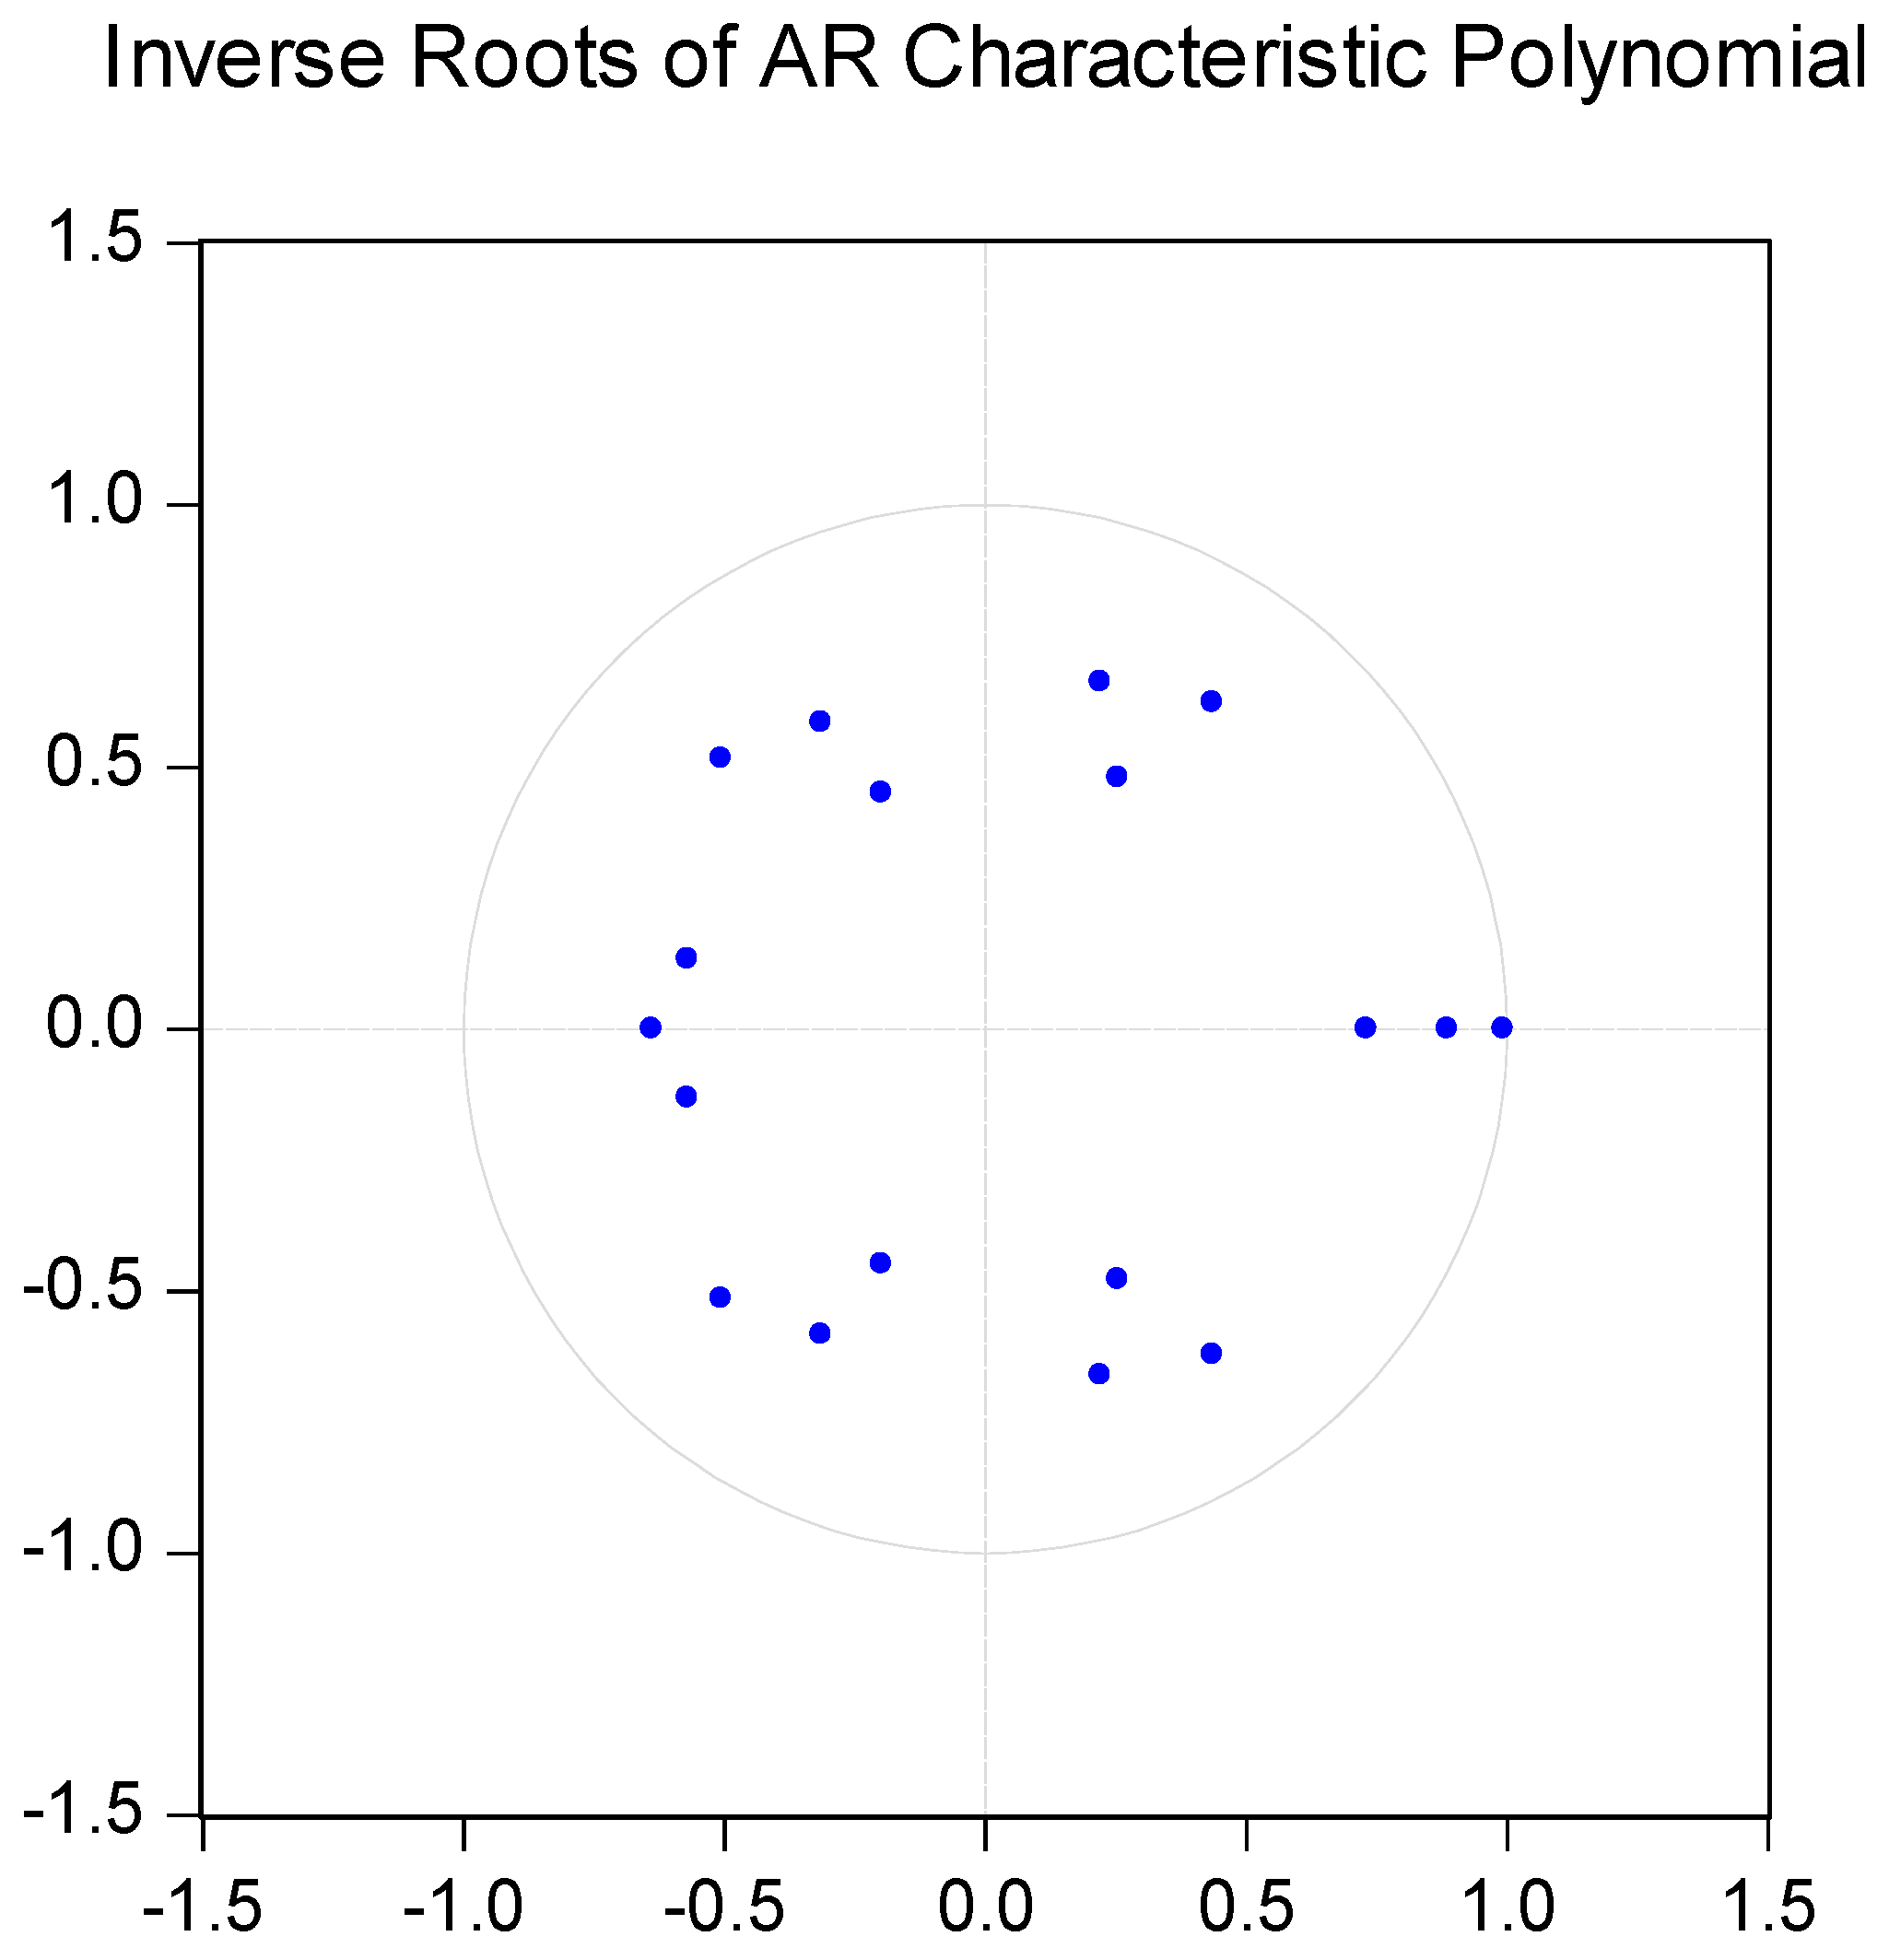
The results of the VAR model indicate the presence of mutual influences among the variables. To examine the stability of the VAR model, a common method for discrimination involves assessing whether the modulus of each eigenvalue of the model is less than 1. We plot the locations of the eigenvalues in Figure 4, and the eigenvalues are within the unit circle. Therefore, we have sufficient reason to conclude that the VAR model meets the stability conditions. Furthermore, we attempted to reorder the variables, obtaining the same results.
Based on information criteria, we selected a lag order of 5 for the model. The established model yields the results shown in Table 3.
We summarise the following findings: (1) The lagged terms of each variable exhibit a significant influence on their own current values. (2) The lagged terms of NCV have a significant positive effect on MCV, indicating synchronised charging behaviour of EVs during low electricity price periods. (3) The lagged terms of PEAK significantly affect both NCV and MCV, but with divergent directional impacts: the effect on NCV is oscillatory (alternating in sign), while the effect on MCV remains consistently positive.
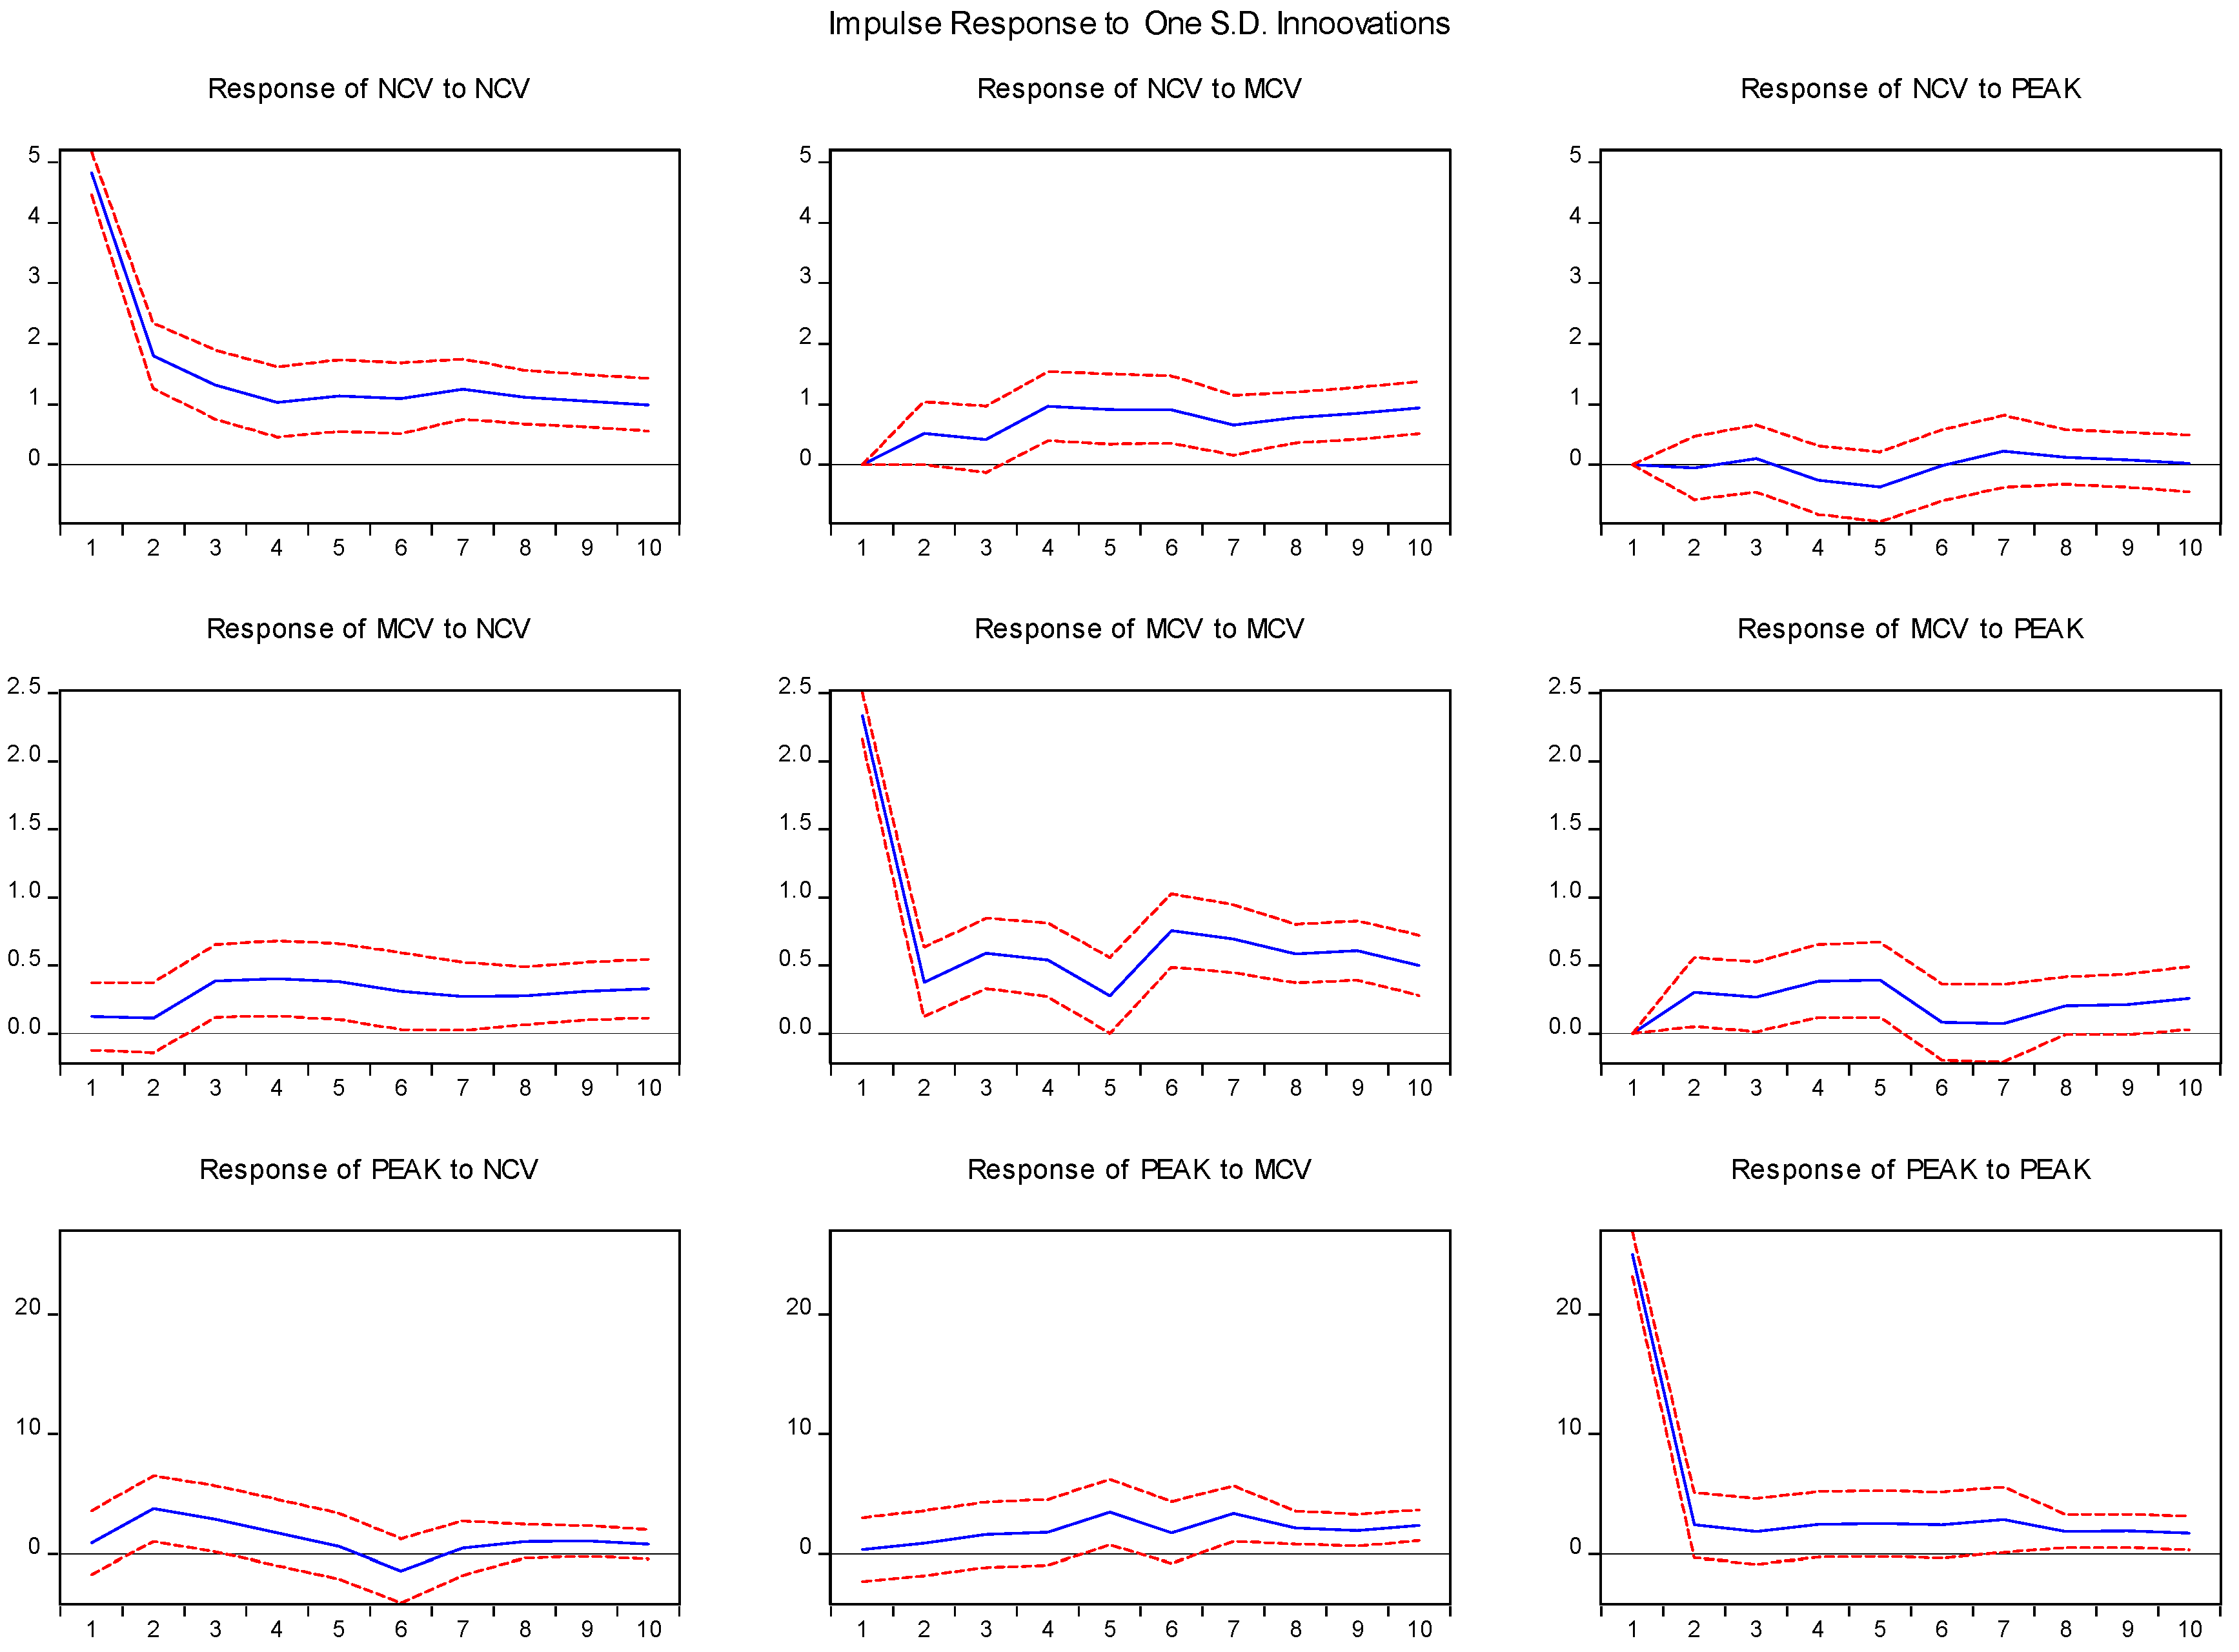
Figure 5, the Impulse Response Function (IRF) plot, reveals the following dynamics: (1) Response to NCV shock: Its self-impact is initially strong but declines rapidly; It exerts a positive shock on MCV; The effect on PEAK is positive initially but turns negative later. (2) Response to MCV shock: Beyond its self-impact, MCV shows minimal influence on other variables. (3) Response to PEAK shock: The effect on NCV oscillates around zero; It has a persistently positive impact on MCV.
These findings strongly indicate that EV charging volumes across different time intervals are not isolated but exhibit mutual interactions. Specifically, charging during peak hours exerts a measurable influence on off-peak charging behaviour. It is therefore necessary to incorporate charging data from all time intervals into a cohesive analytical system. This integrated approach validates that comparing the peak shaving and valley filling efficiency of EV charging piles is both reasonable and feasible.

3.3. Temporal Variation in Peak Shaving and Valley Filling Efficiency of EV Charging Piles

This section primarily describes the trajectory of EV charging efficiency in peak shaving and valley filling over time. The central question addressed is whether this trajectory exhibits a consistent trend or demonstrates strong seasonal patterns. The temporal variation in the peak shaving and valley filling efficiency of EV charging piles is presented in Table 4. The Malmquist index shows an increase compared to the previous month in all cases except April and October. Further decomposition of the efficiency results reveals four distinct patterns: (1) One marked by an improvement in technical efficiency alongside a decline in scale efficiency, as observed in March, July, September, and December. This pattern suggests that while operational efficiency improved, the scale of EV charging operations remained insufficient to leverage economies of scale fully. (2) Efficiency decline with scale efficiency improvement: occurring in June, August, and November, this result indicates that despite achieving better scaling, the actual efficiency in load shifting deteriorated, reflecting potential coordination challenges during these months. The charging efficiency reached its lowest levels during these months. (3) A synergistic improvement was observed in May: both peak shaving–valley filling efficiency and scale efficiency increased simultaneously, illustrating an ideal scenario in which the expansion of charging scale was complemented by enhanced operational performance. (4) In February, April, and October, both scale efficiency and peak shaving valley filling efficiency declined.
Therefore, we conclude that the efficiency of EV charging in peak shaving and valley filling does not follow a consistent unidirectional trend but exhibits distinct seasonal fluctuations and specific patterns. Influenced significantly by seasonal factors and operational coordination capabilities, improving this efficiency requires not only expanding infrastructure scale but also optimising operational management to match these dynamics.

3.4. Decomposition of Peak Shaving and Valley Filling Efficiency by Charging Piles

The efficiency analysis results for the eight types of charging piles (Table 5) indicate that:
(1)
BS and ESD charging piles exhibit the highest peak shaving and valley filling efficiency, achieving the top performance in both pure efficiency and scale efficiency. Their efficiency values are equal to or approach 1. Furthermore, these charging piles maintained TE = 1 for ten or more months, with some operating at full efficiency year-round.
(2)
Although WM’s average overall efficiency and pure efficiency in peak shaving and valley filling both reached a value of 1, its average scale efficiency remained at only 0.8631. The number of months in which TE = 1 is only 6.
(3)
The overall average efficiency values for IP and TA are 0.949 and 0.941, respectively, indicating similar performance levels. However, IP demonstrates lower scale efficiency compared to TA, along with fewer months achieving both TE = 1 and PTE = 1.
(4)
The overall average peak shaving and valley filling efficiency values for GA, P, and SM are 0.856, 0.761, and 0.772, respectively. Although GA exhibits higher overall efficiency, its scale efficiency values are relatively similar—0.944, 0.914, and 0.936.
It follows that charging piles deployed at BS and ESD locations demonstrate the highest efficiency in peak shaving and valley filling. BS-based piles effectively implement tiered electricity pricing policies, while the efficiency of ESD piles appears to stem from high utilisation rates of the charging infrastructure. Charging piles installed at WM exhibit high overall and pure efficiency, yet fail to achieve scale efficiency. This suggests that such piles may possess strong exclusivity in usage. From the perspective of peak shaving and valley filling efficiency, greater sharing of charging infrastructure appears desirable. Charging piles deployed at IP and TA exhibit similar characteristics, and while their peak shaving and valley filling efficiency is relatively high, there remains room for improvement. Charging piles located at GA, P, and SM demonstrate relatively low efficiency in peak shaving and valley filling. Charging piles at P and SM are characterised by their location-specific exclusivity. A common characteristic among these three types is that none are situated in residential or workplace areas. The slightly higher efficiency observed at GA piles may be attributed to the charging behaviour by civil servants during work attendance.
The time intervals from 0:00–8:00, 11:00–13:00, and 22:00–24:00 are conventionally classified as off-peak grid load periods. Charging during these hours is designated as the output in our model. Conversely, charging occurring during all other time intervals—classified as non-off-peak periods—is treated as the input.
Table 6 displays the slack states in EV charging across time intervals, reflecting their redundancy or shortfall in supporting peak shaving and valley filling for the grid. Specifically, slack during non-off-peak hours is termed “input redundancy”, while slack during off-peak hours is referred to as “output shortfall”. Table 6 shows that charging piles with a redundancy rate above the average during off-valley hours are located in GA, P, and SM, while those with an insufficiency rate above the average during valley hours are also situated in GA, P, and SM. Furthermore, charging piles in IP also exhibit charging insufficiency during both the 11:00–13:00 and 22:00–24:00 periods. This demonstrates that GA, P, and SM should be the key regions targeted for optimising the peak shaving and valley filling efficiency of EV charging piles. Additionally, charging infrastructure in the IP region requires enhanced scheduling capability, specifically during the 11:00–13:00 and 22:00–24:00 time intervals.
Table 7 summarises the peak shaving and valley filling efficiency, along with the distinctive characteristics and underlying causes, for the eight types of charging piles discussed above. Furthermore, we summarise the following conclusions: (1) Significant efficiency disparities exist: Charging piles at different locations exhibit substantial variations in performance, highlighting the critical importance of site selection and operational models for effective peak shaving and valley filling. (2) No consistent temporal trend but clear seasonal patterns: While no unidirectional trend in efficiency is observed, decomposition reveals patterns such as trade-offs between technical and scale efficiency or synergistic improvements in specific months, indicating challenges related to seasonal operational coordination. (3) Core issue lies in scheduling capability for load shifting: The primary cause of low efficiency is the failure to shift charging behaviour from peak to off-peak grid periods, underscoring the need for enhanced scheduling strategies.

3.5. Sensitivity Analysis of Peak Shaving and Valley Filling Efficiency in EV Charging Piles

By modifying the directional vector to scale the off-peak EV charging volume by factors of 1.2, 1.5, 2.0, and 2.5—while holding charging volumes in other periods constant—the resulting peak shaving and valley filling average efficiency values and their corresponding average GML indices are presented in Table 8.
We observed that charging piles at IP and TA exhibited the most significant increase in peak shaving and valley filling efficiency when off-peak charging volume was scaled from 1.2 to 2.5 times, with growth rates exceeding 10%. In contrast, piles at WM showed the smallest improvement, with an increase of approximately 0.8%. As the frontier has already been reached, charging piles at BS and ESD exhibit no change in peak shaving and valley filling efficiency. Additionally, charging piles located at IP demonstrate the lowest efficiency.
Based on the analysis above, charging piles at TA exceed the average efficiency in peak shaving and valley filling, yet retain significant potential for further improvement. In contrast, piles at IP should be prioritised in layout optimisation efforts, as their current efficiency not only requires enhancement but also holds considerable potential. This phenomenon is primarily attributable to their insufficient charging volume during off-peak hours. Charging piles located at BS and ESD are not priority targets for efficiency adjustments in peak shaving and valley filling operations.
Based on the data above, the overall peak shaving and valley filling efficiency of charging piles in the WM region is relatively adequate. However, their potential for further improvement remains limited. As a result, optimising the layout of charging infrastructure in this area should not be considered a high priority.

4. Discussion

Whether the research focus lies on optimizing charging pile layout [3] or designing low electricity price strategies [14], the consistent goal is to treat EVs and the power grid as an integrated system. Aligned with this perspective, our study conceptualizes EV charging volumes across different time intervals as a unified system and aims to achieve an equilibrium within this system, thereby enabling a robust estimation of the efficiency of EV charging in supporting peak shaving and valley filling.
The implications of the study. The world’s attention to the field of vehicle-grid interaction is increasing daily. EVs, functioning as distributed storage units, exhibit microgrid-like characteristics that enable active interaction with the power grid and ultimately contribute to the integration of renewable energy sources [20]. The California government of the United States has enacted a series of mandatory policies and regulations on vehicle-grid interaction since 2019, which has promoted the rapid development of vehicle-grid interaction in the region. Current research focuses on several dimensions, such as technology development [21], infrastructure layout [22,23], the economic feasibility of battery use [24], impact of taxation [25], and many other dimensions. An aggregation model combined with sorting-based methods is proposed to address the challenge of aligning large-scale electric vehicle charging with photovoltaic power generation during peak load conditions [22]. Yet the effects of vehicle-grid integration in practice have been less noticed. In addition, existing studies on charging pile layout predominantly focus on promoting EV adoption, with limited attention to vehicle-grid integration, and even less consideration for supporting peak shaving and valley filling in the power grid. However, the regulation of RESs and power grids by EVs has also long attracted the attention of scholars [26]. If the battery of EVs is considered a kind of energy storage, the process of building the integration of “Source, Grid, Load and Storage” should not focus only on the technical aspects, and should not study the charging distribution and charging behaviour of a single EV [4,13,14].
Therefore, EVs should be investigated in reality. Only in a real-world social context can the energy storage potential of electric vehicles be fully activated through the regulation of charging schedules [10]. By leveraging the law of large numbers, such coordinated management creates essential conditions for effective peak shaving and valley filling. Therefore, our study is necessary, it is a test and exploration of this effect.
EVs bring opportunities to the power grid [3,4]. The integration of EVs with the grid has been a topic of discussion, including the analysis of influencing factors [27] and the selection of charging pile locations [28]. However, existing studies have predominantly focused solely on technical aspects, leaving broader operational and practical dimensions underexplored. After considering smart charging capabilities, ref. [29] found that EVs indeed reduced the curtailment rate of RESs generation. The core concept involves optimising the timing of EV charging. However, the requirements for the location of EV charging are more stringent than those for charging time [10]. On the other hand, the layout of EV charging piles also directly impacts the convenience of EV usage and alleviates range anxiety among users. Without achieving large-scale diffusion, the objective of supporting peak shaving and valley filling in the power grid cannot be fully realised [30]. If user convenience is prioritised, supermarkets, shopping areas, and workplaces are ideal locations for deploying charging piles. However, residential communities offer stability and long-term charging demand, making them equally suitable. Yet, given the limited prevalence of single-family homes in China, this study focuses primarily on public charging piles—specifically examining the peak shaving and valley filling efficiency of piles deployed at supermarkets, shopping areas, and workplaces. Layout charging piles in underground parking lots of apartment buildings and in parking lots near residential area would likely significantly increase the efficiency of filling the 23:00–05:00 load base.
Key factors to optimise EV charging infrastructure and adaptive strategies. We propose that public optimisation of charging pile layout should adopt a categorised approach. This study is limited to eight types of charging piles and excludes those situated in transportation hubs, educational institutions, and dining areas. Nevertheless, in the context of supporting peak shaving and valley filling in the power grid, the types of charging piles examined in this study broadly represent the major categories of relevance. (1) Charging piles that serve stable and predictable charging behaviours (such as BS locations) achieve the highest efficiency in supporting peak shaving and valley filling for the power grid. Methods for integrating surplus photovoltaic power into bus charging systems have also been proposed [31]. Although challenges such as queuing management for bus charging remain to be addressed, we insist that this approach represents the most promising pathway for utilising EV charging piles to achieve peak shaving and valley filling. (2) Charging piles capable of alleviating range anxiety are also key targets for development. Charging piles located at ESD also demonstrate high efficiency in supporting peak shaving and valley filling for the power grid. (3) Charging piles in categories such as GA, P, and SM are facilities primarily aimed at improving user convenience. To enhance their contribution to grid peak shaving and valley filling efficiency, access to these charging piles should be expanded. Establishing a sharing mechanism for EV charging piles could increase utilisation rates by more than 10% [32]. (4) Charging piles requiring enhanced charging time management (IP). For charging piles with suboptimal performance in peak shaving and valley filling during certain periods, a more differentiated tiered electricity pricing policy should be implemented to guide their charging behaviour toward off-peak hours.

5. Conclusions

By constructing a parsimonious VAR model, we have demonstrated that charging behaviours across different time periods are not isolated but exhibit significant mutual influences and dynamic interdependencies. This validates the rationality and necessity of integrating charging data into a comprehensive analytical framework, thereby confirming the feasibility of the research methodology for evaluating the efficiency of peak shaving and valley filling. The following conclusions are drawn:
(1)
Efficiency is highly sensitive to seasonal and operational factors: Improving the efficiency of EV charging to support peak shaving and valley filling requires not only expanding infrastructure but also optimising operational management to align with seasonal variations and address coordination challenges.
(2)
Promote efficient models and prioritise remediation of low-performance sites: Emulate successful cases such as BS (effective policy guidance) and ESD (high utilisation efficiency) to extend best practices. Focus on optimising charging behaviour at low-efficiency piles such as GA, P, and SM, encouraging users to shift charging activities to off-peak periods.
(3)
Enhance precision in scheduling strategies: For piles such as IP that exhibit insufficient charging during specific off-peak periods, implement tailored scheduling policies to improve valley filling performance.
(4)
Sensitivity analysis identifies IP and TA as priority optimisation targets. These piles combine two key characteristics: room for improvement and significant potential, meaning that optimising their layout and guiding strategies can yield the highest return on investment. Piles such as GA, P, and SM remain key targets for remediation, as they are currently the primary sources of inefficiency. Due to its inherent exclusivity in usage, WM offers limited potential for improvement under this strategy and thus has a lower optimization priority.
Certainly, due to constraints in data availability, the study has the following limitations and potential avenues for improvement:
(1)
Limited factor analysis: The current efficiency analysis considers only time and charging station characteristics. Future research could incorporate data on EV user behavior and charging habits to enhance the accuracy of peak shaving and valley filling efficiency evaluations.
(2)
Efficiency application: While this study focuses on efficiency measurement, future work could treat efficiency as an explanatory variable to explore its impact on EV adoption or RESs development, thereby expanding the conceptual and practical implications.
(3)
Neglect of convenience factors: The study does not account for the convenience of charging pile locations. Subsequent research could integrate geographical factors (e.g., proximity to workplaces or residential areas) into the analysis, contingent on data accessibility.

6. Implications

Based on the findings of this study, the following implications and recommendations are proposed to enhance the efficiency of EV charging in supporting grid peak shaving and valley filling:
(1)
An integrated program of EV charging infrastructure is essential.
EV charging behaviour is interconnected across time periods, necessitating a holistic approach to charging infrastructure planning and operation. We recommend the planning and layout of charging infrastructure comprehensively integrate three key factors: renewable energy accommodation, user convenience, and charging efficiency.
(2)
Formulate dynamic and incentive-based policies.
Time-based charging patterns are highly responsive to electricity pricing and incentives. Implement dynamic pricing strategies and financial incentives to encourage off-peak charging, particularly at low-efficiency stations (e.g., GA, P, SM).
(3)
Optimize targeted infrastructure.
Piles vary significantly in efficiency potential due to location-specific factors. Priorities investments and improvements at high-potential sites (e.g., IP, TA) while adopting tailored strategies for low-efficiency or limited-potential sites (e.g., WM).
(4)
Promoting high-efficiency charging piles
Best practices from top-performing stations (e.g., BS, ESD) can be replicated to drive broad improvements. A more extensive network of highway charging facilities can be established to support long-distance travel and enhance interregional connectivity for electric vehicle users. It would not only address the charging needs of EV users on long-distance trips but also enhance the grid’s ability to balance peak and off-peak loads.

Author Contributions

Conceptualization, S.W. and F.C.; Methodology, S.W.; Software, S.W.; Formal analysis, S.W.; Data curation, S.W. and C.L.; Writing—original draft, S.W.; Supervision, F.C. All authors have read and agreed to the published version of the manuscript.

Funding

This research was funded by Zhejiang Soft Science Research Program grant number [2024C35017].

Data Availability Statement

The data presented in this study are available on request from the corresponding author due to privacy.

Conflicts of Interest

The authors declare no conflict of interest.

References

  1. Li, Y.; Huang, Y.; Liang, Y.; Song, C.; Liao, S. Economic and carbon reduction potential assessment of vehicle-to-grid development in Guangdong province. Energy 2024, 302, 131742. [Google Scholar] [CrossRef]
  2. Ullah, Z.; Wang, S.; Wu, G.; Hasanien, H.M.; Rehman, A.U.; Turky, R.A.; Elkadeem, M.R. Optimal scheduling and techno-economic analysis of electric vehicles by implementing solar-based grid-tied charging station. Energy 2023, 267, 126560. [Google Scholar] [CrossRef]
  3. Li, X.; Wang, Z.; Zhang, L.; Sun, F.; Cui, D.; Hecht, C.; Figgener, J.; Sauer, D.U. Electric vehicle behavior modeling and applications in vehicle-grid integration: An overview. Energy 2023, 268, 126647. [Google Scholar] [CrossRef]
  4. Yao, Z.; Ran, L.; Wang, Z.; Guo, X. Integrated management of electric vehicle sharing system operations and Internet of Vehicles energy scheduling. Energy 2024, 309, 132498. [Google Scholar] [CrossRef]
  5. Wesseh, P.; Benjamin, N.; Lin, B. The coordination of pumped hydro storage, electric vehicles, and climate policy in imperfect electricity markets: Insights from China. Renew. Sustain. Energy Rev. 2022, 160, 112275. [Google Scholar] [CrossRef]
  6. Dixon, J.; Bukhsh, W.; Edmunds, C.; Bell, K. Scheduling electric vehicle charging to minimise carbon emissions and wind curtailment. Renew. Energy 2020, 161, 1072–1091. [Google Scholar] [CrossRef]
  7. Borba, B.; Szklo, A.; Schaeffer, R. Plug-in hybrid electric vehicles as a way to maximize the integration of variable renewable energy in power systems: The case of wind generation in northeastern Brazil. Energy 2012, 37, 469–481. [Google Scholar] [CrossRef]
  8. Liu, L.; Kong, F.; Liu, X.; Peng, Y.; Wang, Q. A review on electric vehicles interacting with renewable energy in smart grid. Renew. Sustain. Energy Rev. 2015, 51, 648–661. [Google Scholar] [CrossRef]
  9. Zhao, Z.; Zhang, L.; Yang, M.; Chai, J.; Li, S. Pricing for private charging pile sharing considering EV consumers based on non-cooperative game model. J. Clean. Prod. 2020, 254, 120039. [Google Scholar] [CrossRef]
  10. Wang, N.; Tian, H.; Zhu, S.; Li, Y. Analysis of public acceptance of electric vehicle charging scheduling based on the technology acceptance model. Energy 2022, 258, 124804. [Google Scholar] [CrossRef]
  11. Reibsch, R.; Gemassmer, J.; Katerbau, T. Low voltage grid resilience: Evaluating electric vehicle charging strategies in the context of the grid development plan Germany. eTransportation 2024, 20, 100323. [Google Scholar] [CrossRef]
  12. Sagaria, S.; Kam, M.; Bostrom, T. The influence of socio-technical variables on vehicle-to-grid technology. Energy 2024, 305, 132299. [Google Scholar] [CrossRef]
  13. Zambrano-Monserrate, M.; Soto, G.; Ahakwa, I.; Manigandan, P. Dynamic effects on modern renewable energy generation: The role of patents in clean energy technology. Energy 2024, 311, 1133340. [Google Scholar] [CrossRef]
  14. Sandstrom, M.; Huang, P.; Bales, C.; Dotzauer, E. Evaluation of hosting capacity of the power grid for electric vehicles—A case study in a Swedish residential area. Energy 2023, 284, 129293. [Google Scholar] [CrossRef]
  15. Kester, J.; Noel, L.; de Rubens, G.Z.; Sovacool, B. Promoting Vehicle to Grid (V2G) in the Nordic region: Expert advice on policy mechanisms for accelerated diffusion. Energy Policy 2018, 116, 422–432. [Google Scholar] [CrossRef]
  16. Zhang, Y.; Xu, T.; Chen, T.; Hu, Q.; Chen, H.; Hu, X.; Jiang, Z. A high-resolution electric vehicle charging transaction dataset with multidimensional features in China. Sci. Data 2025, 12, 643. [Google Scholar] [CrossRef]
  17. Liu, P.; Li, M.; Han, C.; Meng, L.; Shao, Z. From input to output: Unraveling the Spatio-temporal pattern and driving factors of the coupling coordination between wind power efficiency and installed capacity in China. Appl. Energy 2025, 396, 126320. [Google Scholar] [CrossRef]
  18. Santos-Arteaga, F.J.; Buendía, A.; André, F.J. A dynamic approach to analyze the evolution of water use efficiency across Spanish regions. J. Environ. Manag. 2025, 389, 126174. [Google Scholar] [CrossRef] [PubMed]
  19. Fare, R.; Desli, E. Productivity growth, technical progress, and efficiency change in industrialised countries: Comment. Am. Econ. Rev. 1997, 87, 1033–1039. [Google Scholar]
  20. Lei, X.; Zhong, J.; Chen, Y.; Shao, Z.; Jian, L. Grid integration of electric vehicles within electricity and carbon markets: A comprehensive overview. eTransportation 2025, 25, 100435. [Google Scholar] [CrossRef]
  21. Madhan-akkumar, N.; Vijayaragavan, M.; Anbarasan, P.; Reshmila, S. Smart energy management for plug-in hybrid electric vehicles: Integration of waterwheel plant algorithm and dual stream spectrum deconvolution neural network. J. Energy Storage. 2024, 102, 113867. [Google Scholar] [CrossRef]
  22. Qian, L.; Zhang, C.; Chen, Y.; Xiao, Z. Spatial cross-side network effect of charging stations on electric vehicle adoption. Transp. Res. Part. D Transp. Environ. 2024, 136, 104400. [Google Scholar] [CrossRef]
  23. Liu, X.; Guo, X.; Sun, X.; Song-Turner, H. Network effects from the provision of charging stations in the market diffusion of electric vehicles. Transp. Lett. 2025, 17, 881–894. [Google Scholar] [CrossRef]
  24. Uddin, K.; Dubarry, M.; Glick, M.B. The viability of vehicle-to-grid operations from a battery technology and policy perspective. Energy Policy. 2018, 113, 342–347. [Google Scholar] [CrossRef]
  25. Sabadini, F.; Madlener, R. Does taxation hamper the vehicle-to-grid business case? Empirical evidence from Germany. Appl. Energy 2025, 381, 125041. [Google Scholar] [CrossRef]
  26. Guo, S.; He, J.; Ma, K.; Yang, J.; Wang, Y.; Li, P. Robust economic dispatch for industrial microgrids with electric vehicle. Renew. Energy 2025, 240, 122210. [Google Scholar] [CrossRef]
  27. Gonul, O.; Duman, A.C.; Guler, O. Multi-objective optimal sizing and techno-economic analysis of on- and off-grid hybrid renewable energy systems for EV charging stations. Sustain. Cities Soc. 2024, 115, 105846. [Google Scholar] [CrossRef]
  28. Guindi, M.; Kamel, R.M. Optimal location and sizing of renewable distributed generations and electric vehicle charging stations. Renew. Energy 2024, 235, 121272. [Google Scholar] [CrossRef]
  29. Will, C.; Zimmermann, F.; Ensslen, A.; Fraunholz, C.; Jochem, P.; Keles, D. Can electric vehicle charging be carbon neutral? Uniting smart charging and renewables. Appl. Energy 2024, 371, 123549. [Google Scholar] [CrossRef]
  30. Katontoka, M.; Orsi, F.; Bakker, M.; Hocks, B. Toward sustainable transportation: A systematic review of EV charging station locations. Int. J. Sustain. Transp. 2025, 19, 881–893. [Google Scholar] [CrossRef]
  31. Osaki, F.; Fujimoto, Y.; Iino, Y.; Ihara, Y.; Mitsuoka, M.; Hayashi, Y. Dynamic bus charge scheduling by model predictive control to maximize local PV surplus power utilization. eTransportation 2025, 25, 100441. [Google Scholar] [CrossRef]
  32. Chen, Z.; Ji, Y.; Guo, Z.; Pei, H.; Zhou, Z. A method for allocation of supply-demand equilibrium in urban electric vehicles shared charging facilities. Sustain. Cities Soc. 2025, 131, 106682. [Google Scholar] [CrossRef]
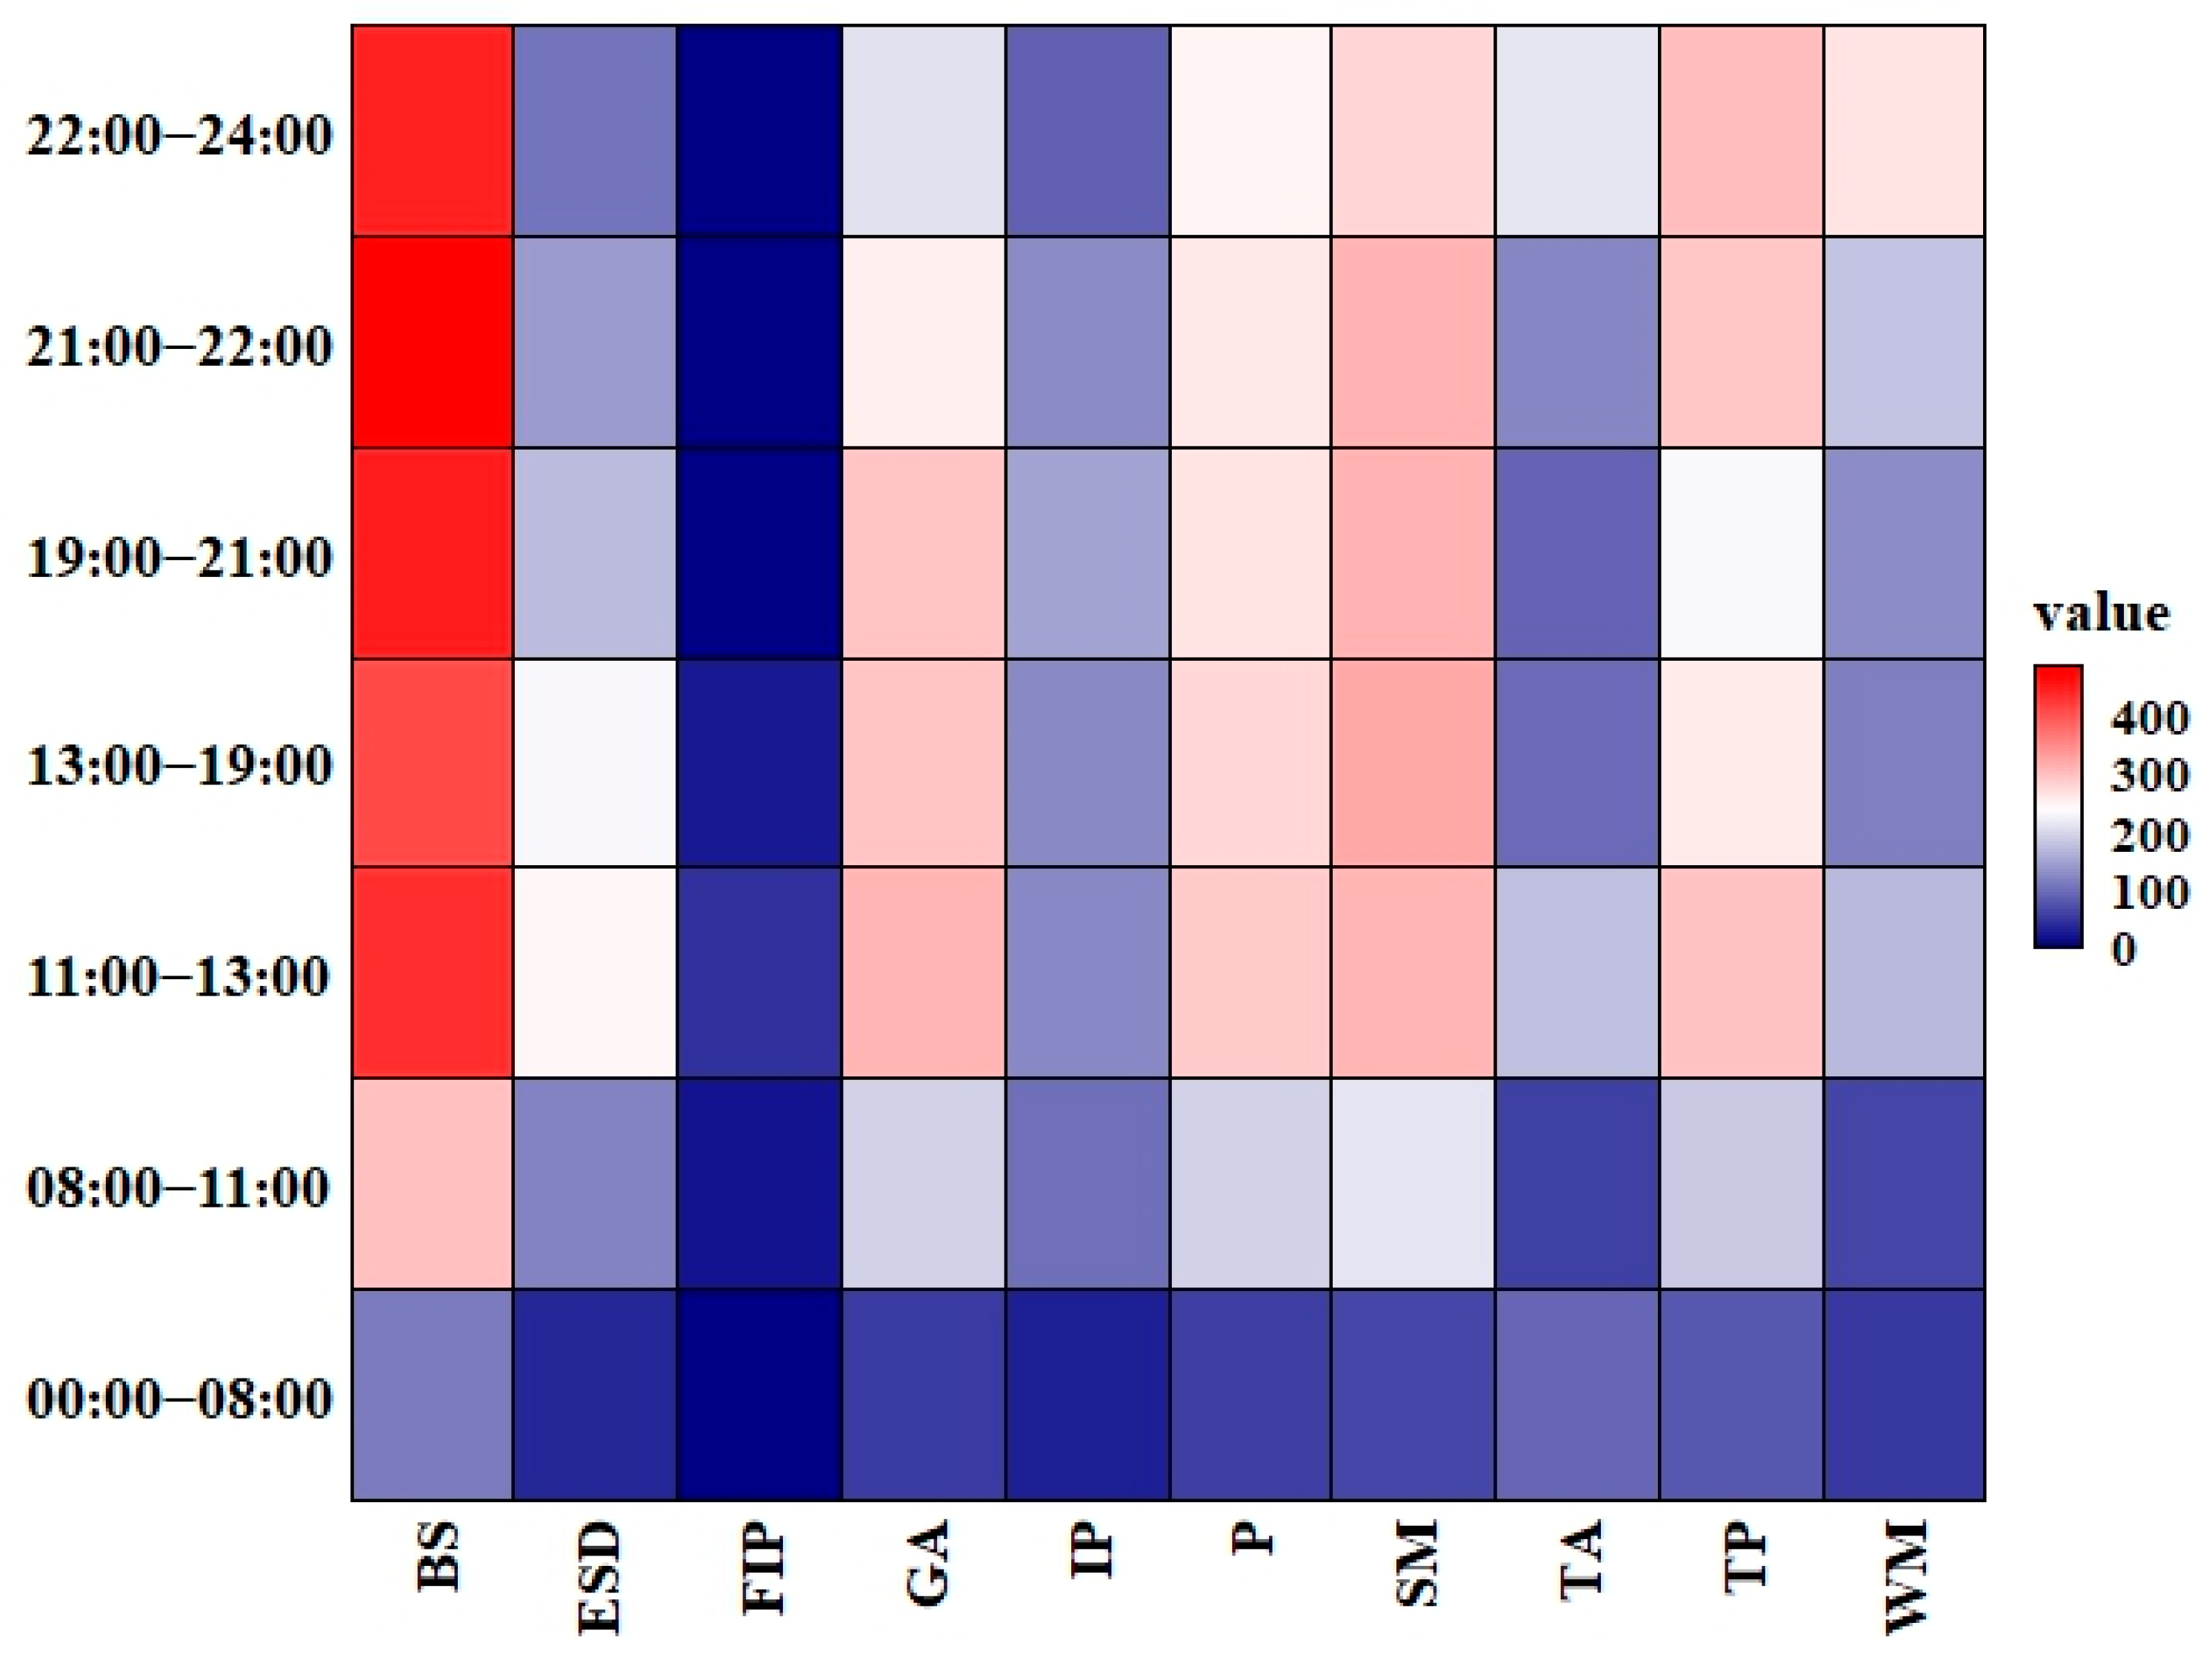
Figure 1. Thermal distribution of charging volume across different time intervals by charging pile type.
Energies 18 05284 g001
Figure 2. Thermal distribution of average charging volume throughout January to December (2021).
Energies 18 05284 g002
Figure 3. The efficiency of EV charging piles.
Energies 18 05284 g003
Figure 4. Robustness check.
Energies 18 05284 g004
Figure 5. Impulse Response Function (IRF) plot. Note: The two red dashed lines form the 95% confidence interval.
Energies 18 05284 g005
Table 1. Tiered electricity pricing for EV charging piles and variables.
Time IntervalsElectricity Price (Yuan/kWh)Off-Peak Charging PeriodDefinition of Charging VolumeVariable
00:00–08:000.3784YesoutputsOut1
08:00–11:000.9014NoinputsInp1
11:00–13:000.3784YesoutputsOut2
13:00–19:000.9014NoinputsInp2
19:00–21:001.2064NoinputsInp3
21:00–22:000.9014NoinputsInp4
22:00–24:000.3784YesoutputsOut3
Data sources: The data are sourced from the Supplementary Materials of [16].
Table 2. Unit root test for variables.
Augmented Dickey–Fuller TestPhillips–Perron TestKwiatkowski–Phillips–Schmidt–Shin Test
t-Statisticp-Valuet-Statisticp-ValueLM-StatisticCritical Value at the 5% Level
MCV−8.3940.000−15.5270.0000.1620.146
NCV−7.1060.000−12.1700.0000.1300.146
PEAK−16.1490.000−17.0850.0000.1920.146
Constant YesYesYes
TrendYesYesYes
Table 3. The results of VAR model.
NCV(−1)NCV(−2)NCV(−3)NCV(−4)NCV(−5)
NCV0.367 *0.131 *0.042 *0.088 *0.043 *
MCV0.018 **0.053 **0.023 **0.002 **−0.017 **
PEAK0.7520.215−0.087−0.296−0.638
MCV(−1)MCV(−2)MCV(−3)MCV(−4)MCV(−5)
NCV0.2240.0620.2550.1090.058
MCV0.160 *0.216 *0.128 *−0.034 *0.162 *
PEAK0.3610.4100.3220.755−0.166
PEAK(−1)PEAK(−2)PEAK(−3)PEAK(−4)PEAK(−5)
NCV−0.002 **0.002 **−0.015 **−0.017 **0.001 **
MCV0.012 ***0.008 ***0.009 ***0.007 ***−0.006 ***
PEAK0.095 *0.062 *0.074 **0.072 **0.056 **
Note: *, **, *** denote the 10%, 5%, and 1% significance levels.
Table 4. The Malmquist index and its decomposition for efficiency change in EV Charging.
MonthEfficiency Change (EC)Scale Efficiency Change (SEC)Malmquist
1–20.9460.5201.101
2–31.0260.8431.083
3–40.9930.9480.995
4–51.0151.0031.044
5–60.9511.0271.038
6–71.0350.9051.004
7–80.9881.0541.072
8–91.0100.9651.234
9–100.9580.9520.960
10–110.9881.0591.126
11–121.0820.9331.064
Table 5. Comparative analysis of peak shaving and valley filling efficiency in EV charging piles.
Effect TypeMean Value and Number of MonthsBSESDGAIPPSMTAWM
Overall EfficiencyMean Value110.8560.9490.7610.7720.9411
Number of Months with TE = 11210553376
Pure EfficiencyMean Value110.8560.9490.7610.7720.9411
Number of Months with PTE = 1101179541110
Scale EfficiencyMean Value10.9420.9440.6610.9140.9360.8650.863
Number of Months with SE = 11211554387
Table 6. Slacks in EV charging across time intervals: redundancy and shortfall.
Time IntervalsRedundant RatioRedundant RatioShortage RatioShortage Ratio
Below AverageAbove AverageBelow AverageAbove Average
8–11 BS, ESD, IP, TA, WMGA, P, SM--
13–19BS, ESD, IP, TA, WMGA, P, SM--
19–21BS, ESD, IP, TA, WMGA, P, SM--
21–22BS, ESD, GA, IP, TA, WMP, SM--
0–8--BS, ESD, IP, TA, WMGA, P, SM
22–24--BS, ESD, TA, WMGA, IP, P, SM
11–13--BS, ESD, GA, TA, WM IP, P, SM
Table 7. Performance ranking of charging pile types (from best to worst).
Types of Charging PilesOverall
Efficiency
Pure Technical EfficiencyScale EfficiencyKey Characteristics and Causes
BS, ESDHighestHighestHighestBenchmark
Effectively implements time-of-use electricity pricing policies (BS)
High infrastructure utilisation rates (ESD)
WMHighHighRelatively lowHigh operational efficiency coupled with insufficient scale efficiency (exclusivity or dedicated usage)
IP, TARelatively highRelatively highMediumRoom for improvement, relatively low scale efficiency (IP)
GA, P, SMLowestLowRelatively lowKey optimisation targets (not located in residential or workplace areas)
Table 8. Scenario analysis of peak shaving and valley filling efficiency of charging piles.
Charging Pile1.2 × VF1.5 × VF2 × VF2.5 × VF
Average EfficiencyAverage
GML
Average
Efficiency
Average
GML
Average
Efficiency
Average
GML
Average
Efficiency
Average
GML
BS1.0001.0291.0001.0261.0001.0211.0001.018
ESD0.9991.0330.9991.0260.9991.0190.9991.012
GA0.9611.0380.9691.0360.9771.0340.9811.030
IP0.8021.0080.8311.0080.8651.0070.8881.007
P0.8890.9990.9080.9990.9300.9990.9450.998
SM0.9171.0060.9321.0050.9461.0040.9551.004
TA0.8381.0660.8561.0660.9081.0690.9251.061
WM0.9791.0080.9821.0060.9851.0010.9870.999
Disclaimer/Publisher’s Note: The statements, opinions and data contained in all publications are solely those of the individual author(s) and contributor(s) and not of MDPI and/or the editor(s). MDPI and/or the editor(s) disclaim responsibility for any injury to people or property resulting from any ideas, methods, instructions or products referred to in the content.