Article

Characteristic Analysis of Boiling Heat Transfer of R32 Refrigerant and Modeling Study of Heat Exchanger

1
Green Refrigeration Equipment Engineering Research Center of ZHUHAI GREE Co., Ltd., Zhuhai 519041, China
2
Key Laboratory of Thermo-Fluid Science and Engineering (Ministry of Education), Xi’an Jiaotong University, Xi’an 710049, China
3
Gree Electric Appliances Inc. of Zhuhai, Zhuhai 519041, China
*
Author to whom correspondence should be addressed.
Energies 2025, 18(19), 5258; https://doi.org/10.3390/en18195258
Submission received: 3 August 2025 / Revised: 19 September 2025 / Accepted: 28 September 2025 / Published: 3 October 2025
(This article belongs to the Section J1: Heat and Mass Transfer)

Abstract

This study experimentally investigates the boiling heat transfer characteristics of R32 and R410A refrigerants in heat exchangers, systematically analyzing the effects of tube thickness, saturation temperature, latent heat, liquid-phase density, and viscosity. The average boiling heat transfer coefficients (HTCs) of R32 and R410A were compared across varying mass flow rates and saturation temperatures. The results reveal that, independent of tube thickness, the boiling HTC of R32 exhibits a non-monotonic increase followed by a decrease with rising mass flow rate. Additionally, elevated saturation temperatures reduced vaporization latent heat, liquid-phase density, and gas-phase viscosity, while the flow pattern may also change. Meanwhile, R32 demonstrated superior boiling heat transfer performance compared to R410A under equivalent conditions. Furthermore, the correlation is proposed to predict the HTCs, indicating ±10% prediction error. This study provides critical insights for optimizing refrigeration systems and advancing heat exchanger modeling frameworks.

1. Introduction

The ongoing depletion of the ozone layer and intensification of the greenhouse effect have been exacerbated by the widespread use and emission of synthetic refrigerants [1,2]. This has necessitated an urgent search for eco-friendly alternatives. Janta et al. [3] reviewed hydrocarbon refrigerants across various systems, concluding that they offer an energy-efficient and environmentally sustainable alternative for refrigeration equipment and heat pumps. Kryukov et al. [4] experimentally assessed two commercial compressors (scroll and reciprocating) using R22 and R290 with the same mineral oil lubricants. The results showed a 13–20% reduction in cooling capacity for the propane unit but an accompanying 1–3% increase in energy efficiency. Yan et al. [5] evaluated two hydrocarbon refrigerants and seven mixtures of R1270, R290, RE170, and R152A as R22 replacements in residential air conditioners. These alternatives exhibited a Global Warming Potential (GWP) of just 3–58% that of R22. Except for R1270, all tested refrigerants demonstrated a higher energy efficiency ratio (EER), lower discharge temperatures, and comparable cooling capacities. Chaudhary et al. [6] compared R410A and R22 in split air-conditioning systems under outdoor temperatures of 27–68 °C. Both systems showed a linear decrease in cooling capacity and efficiency, with their cooling capacities nearly equivalent at 35 °C. However, at 55 °C, R410A’s cooling capacity was 9% lower than R22’s, and at 68 °C, R410A’s performance dropped more sharply due to its lower critical temperature.
The refrigerant serves as the working fluid that facilitates energy conversion in various heat engines through reversible phase transitions, such as gas/liquid transitions [7]. Examples include steam in steam engines and refrigerants in vapor-compression systems [8]. In steam engines, thermal energy from steam is converted into mechanical work, whereas in refrigeration systems, the refrigerant transfers heat from a low-temperature region to a high-temperature environment. Historically, chlorofluorocarbons (CFCs) were widely used due to their thermodynamic properties but are now being phased out due to their ozone-depleting potential. Alternatives such as ammonia, sulfur dioxide, and non-halogenated hydrocarbons (e.g., methane) have gained prominence.
In vapor-compression refrigeration cycles, refrigerants that can be liquefied at or below ambient temperatures are employed, including chlorofluorohydrocarbons (e.g., Freon), azeotropic mixtures, hydrocarbons (e.g., propane, ethylene), and ammonia [9]. Gas-compression refrigeration systems utilize gaseous working fluids like air, hydrogen, and helium, which remain in the gas phase throughout the cycle [10]. Absorption refrigeration systems typically use binary fluid pairs such as ammonia/water or lithium bromide/water, while steam-jet refrigeration systems employ water as the refrigerant [11]. Key thermophysical properties of refrigerants include saturated vapor pressure, specific heat, viscosity, thermal conductivity, and surface tension, which collectively influence system performance and efficiency.
Table 1 provides a comparative overview of the physical properties of R22, R32, and R410A. Notably, R32 has garnered significant attention as a potential alternative to R22 due to its favorable thermodynamic and environmental properties. As a pure working fluid, R32 exhibits distinct physical and chemical characteristics compared to the mixed refrigerant R410A. The data in Table 1 illustrate the differences in physical properties among these refrigerants, offering critical insights into their performance and application potential in refrigeration systems. This comparative analysis not only highlights the advantages of R32 but also provides a reference for evaluating the feasibility of its substitution for R22.
This study compares R32 refrigerant with R410A, a well-established R22 alternative, from multiple physical property perspectives. The results indicate that R32 and R410A exhibit comparable physical properties, suggesting their potential compatibility for use in compressors and refrigeration systems [12]. Regarding flammability, R32’s low flammability may restrict its practical application [13]. However, experts argue that R32’s required charging amount in air-conditioning systems is much lower than the maximum allowable limit, enabling its widespread use in such systems [14]. In terms of environmental impact, while R410A has zero Ozone Depletion Potential (ODP), its high Global Warming Potential (GWP) subjects it to increasing regulatory restrictions [15]. R32, on the other hand, has not only zero ODP but also a significantly lower GWP than R410A, giving it a distinct environmental edge [16]. Furthermore, R32 systems require a relatively smaller refrigerant charge, at merely 60% of R22 and approximately 70% of R410A. Given R32’s considerably lower price compared to R410A, its adoption in air-conditioning systems could substantially reduce refrigerant charging costs, thereby offering a cost advantage over R410A and R22 [17].
Furthermore, the theoretical thermal properties of R32 and R410A were compared, with the results presented in Table 2. The comparison reveals that the suction pressure and discharge pressure of R32 are 1.018 MPa and 3.472 MPa, respectively, while those of R410A are 0.998 MPa and 3.385 MPa, respectively [18]. This indicates that, under the same displacement conditions, R32 refrigerant imposes a higher compressor load and consequently results in greater power consumption. Additionally, the cooling capacity per unit mass of R32 is 241.04 W/kg, significantly higher than that of R410A at 157.41 W/kg [19]. This implies that, for an equivalent air-conditioning system, the theoretical refrigerant charge required for R32 is considerably smaller than that for R410A. In terms of input power per unit volume, R32 exhibits a value of 1.969 W/L, compared to R410A’s 1.822 W/L. The elevated input power per unit volume of R32 may lead to increased vapor enthalpy in the compressor and point-of-use machinery, potentially affecting the refrigerant’s overheating as it flows through the motor cavity. Specifically, the discharge temperature of the R32 compressor reaches 118.4 °C, markedly higher than the 96.4 °C observed for the R410A compressor. Such high discharge temperatures can cause compressor deformation and alter the viscosity of lubricating oil, thereby compromising the compressor’s normal operation [20,21]. These findings suggest that in practical applications involving R32 refrigerant, it is advisable to appropriately reduce the refrigerant charge within the system and closely monitor the impact of high discharge temperatures on compressor performance [22].
The correlations are important in practical application as they can provide quick prediction and performance evaluation. Chen [23] provided a substantial body of experimental evidence, identifying that the two-phase flow boiling heat transfer within horizontal tubes is governed by two distinct mechanisms: nucleate boiling and forced convective heat transfer. Then, numerous researchers refined Chen’s correlation, yielding boiling heat transfer correlations of enhanced accuracy and broader applicability. Notable among these are the formulations proposed by Choi [24] and Gungor and Winterton [25] and by Liu and Winterton [26] and Pamitran et al. [27]. In this context, the boiling heat transfer characteristics of R32 refrigerant through comparative analysis are explored. This study examines various parameters, including experimental tube thickness, saturation temperatures, latent heat, liquid-phase density, gas-phase density, and viscosity. Additionally, the modeling of single-channel and multi-channel heat exchangers is discussed. This comprehensive analysis of R32’s boiling heat transfer and heat exchanger modeling provides valuable methodological guidance for future advancements in the refrigerant field.

2. Experimental System

Main experimental equipment: liquid storage tank, filter, magnetic gear pump, Coriolis quality flow meter (CMF), etc. The volume of the liquid storage tank is 2 L, and the pressure gauge, filling port, and valve with a range of 0~7.0 MPa are arranged on the tank body [28]. The tank filling port and valve are used for filling nitrogen leak detection, vacuuming and replenishing refrigerant later before the start of the experiment. The filter adopts an EK-083S drying filter, which can dry the refrigerant and filter out the solid particles and impurities in the system to avoid wear or blockage of the magnetic drive gear pump. The magnetic gear pump is an integrated hydraulic transmission device composed of a precise gear pump and motor [29,30]. The motor drives the gear pump through the magnetic coupling transmission, which can completely eliminate the leakage problem of the shaft section after the long-term use of the gear pump. The CMF enables direct and precise measurement of fluid mass flow [31,32]. It has a very wide range of applications and is suitable for the measurement of small mass flow of gas, liquid, liquid/solid, gas/solid mixture, etc. The specific experimental schematic diagram is shown in Figure 1. When starting the system, the chiller should be first activated under the target temperature. Then, the refrigerant will be cooled in the condenser section; continuously monitor the pressure gauge indication. Simultaneously, the gear pump starts to bring the primary refrigeration loop into the test section; observe the mass flowmeter reading until it decays to the desired value. The power of the preheater is then adjusted to an appropriate level. While tracking both thermocouple temperatures and pressure gauge readings, regulate the preheater until the refrigerant temperature and pressure at the exchanger outlet conform to the specified operating conditions.
The inner diameter and thickness of the inner tube are 5 mm and 7 mm, which are commonly used in air-conditioning devices. Additionally, the micro-ribbed tube is also tested while the fin height, fin weight, and fin distance are 0.38 mm, 0.2 mm, and 0.52 mm. On the other hand, the inner diameter of the annular diameter is 10 mm. Material with a thickness of 3 mm is selected to safely maintain the pressure of refrigerants. Meanwhile, the tube length is 1000 mm, which ensures the full development of the working medium. The roughness of the inner tube was also measured and found to be under 5.0 μm, which can be regarded as a smooth tube.
Table 3 shows the instrumental measurement precision. The relative uncertainty of the indirectly measured physical quantities in this experiment can be further calculated. All measuring devices used in the present study were calibrated by standard test platforms, including flowmeter, pressure gauge, and thermocouples. The relative uncertainties of the key performance parameters of the experimental system are all below 3%, indicating that the measurement accuracy of the apparatus is high and meets the experimental requirements.
In the present paper, cases with saturation temperatures at 5 °C to 11 °C are tested. The range of the flow rate is 100 to 260 kg/m3. Meanwhile, the flow and thermal performances of refrigerants in two different tube diameters of 5 mm and 7 mm are compared. The heat loss in the process of implementation has an important influence on the authenticity of the data. When the inlet and outlet temperatures inside and outside the experimental tube are unchanged, the heat balance is reached. At this time, the temperature difference between the inlet and outlet and the flow rate are recorded. Based on the energy conservation, the heat transfer rate in watt units can be calculated by Equation (1).
Q w = q v ρ c p t i n t o u t = q r x l
In Equation (1), q v represents the volume flow of the liquid, ρ and c p indicate the density and specific heat capacity at the average temperature of the liquid inlet and outlet, Δ t denotes the temperature difference between the liquid inlet and outlet, q r refers to the volume flow of refrigerant, x expresses the vapor quality of R32, and l indicates the latent heat of R32 at constant pressure. As a result, with the increase in flow rate, the heat transfer rate rises accordingly. However, due to the shorter heating time of R32, the vapor quality should gradually decline with increasing R32 flow rates.
The calculation method of the relative error of the heat transfer can be calculated by the values inside and outside the experimental tube and is shown in Equation (2).
E r = Q w , o Q w , i Q w , o + Q w , i × 0.5 × 100 %
In Equation (2), Q w , o expresses the liquid flow rate after the condenser in the system, and Q w , i means the liquid flow rate before the preheater.
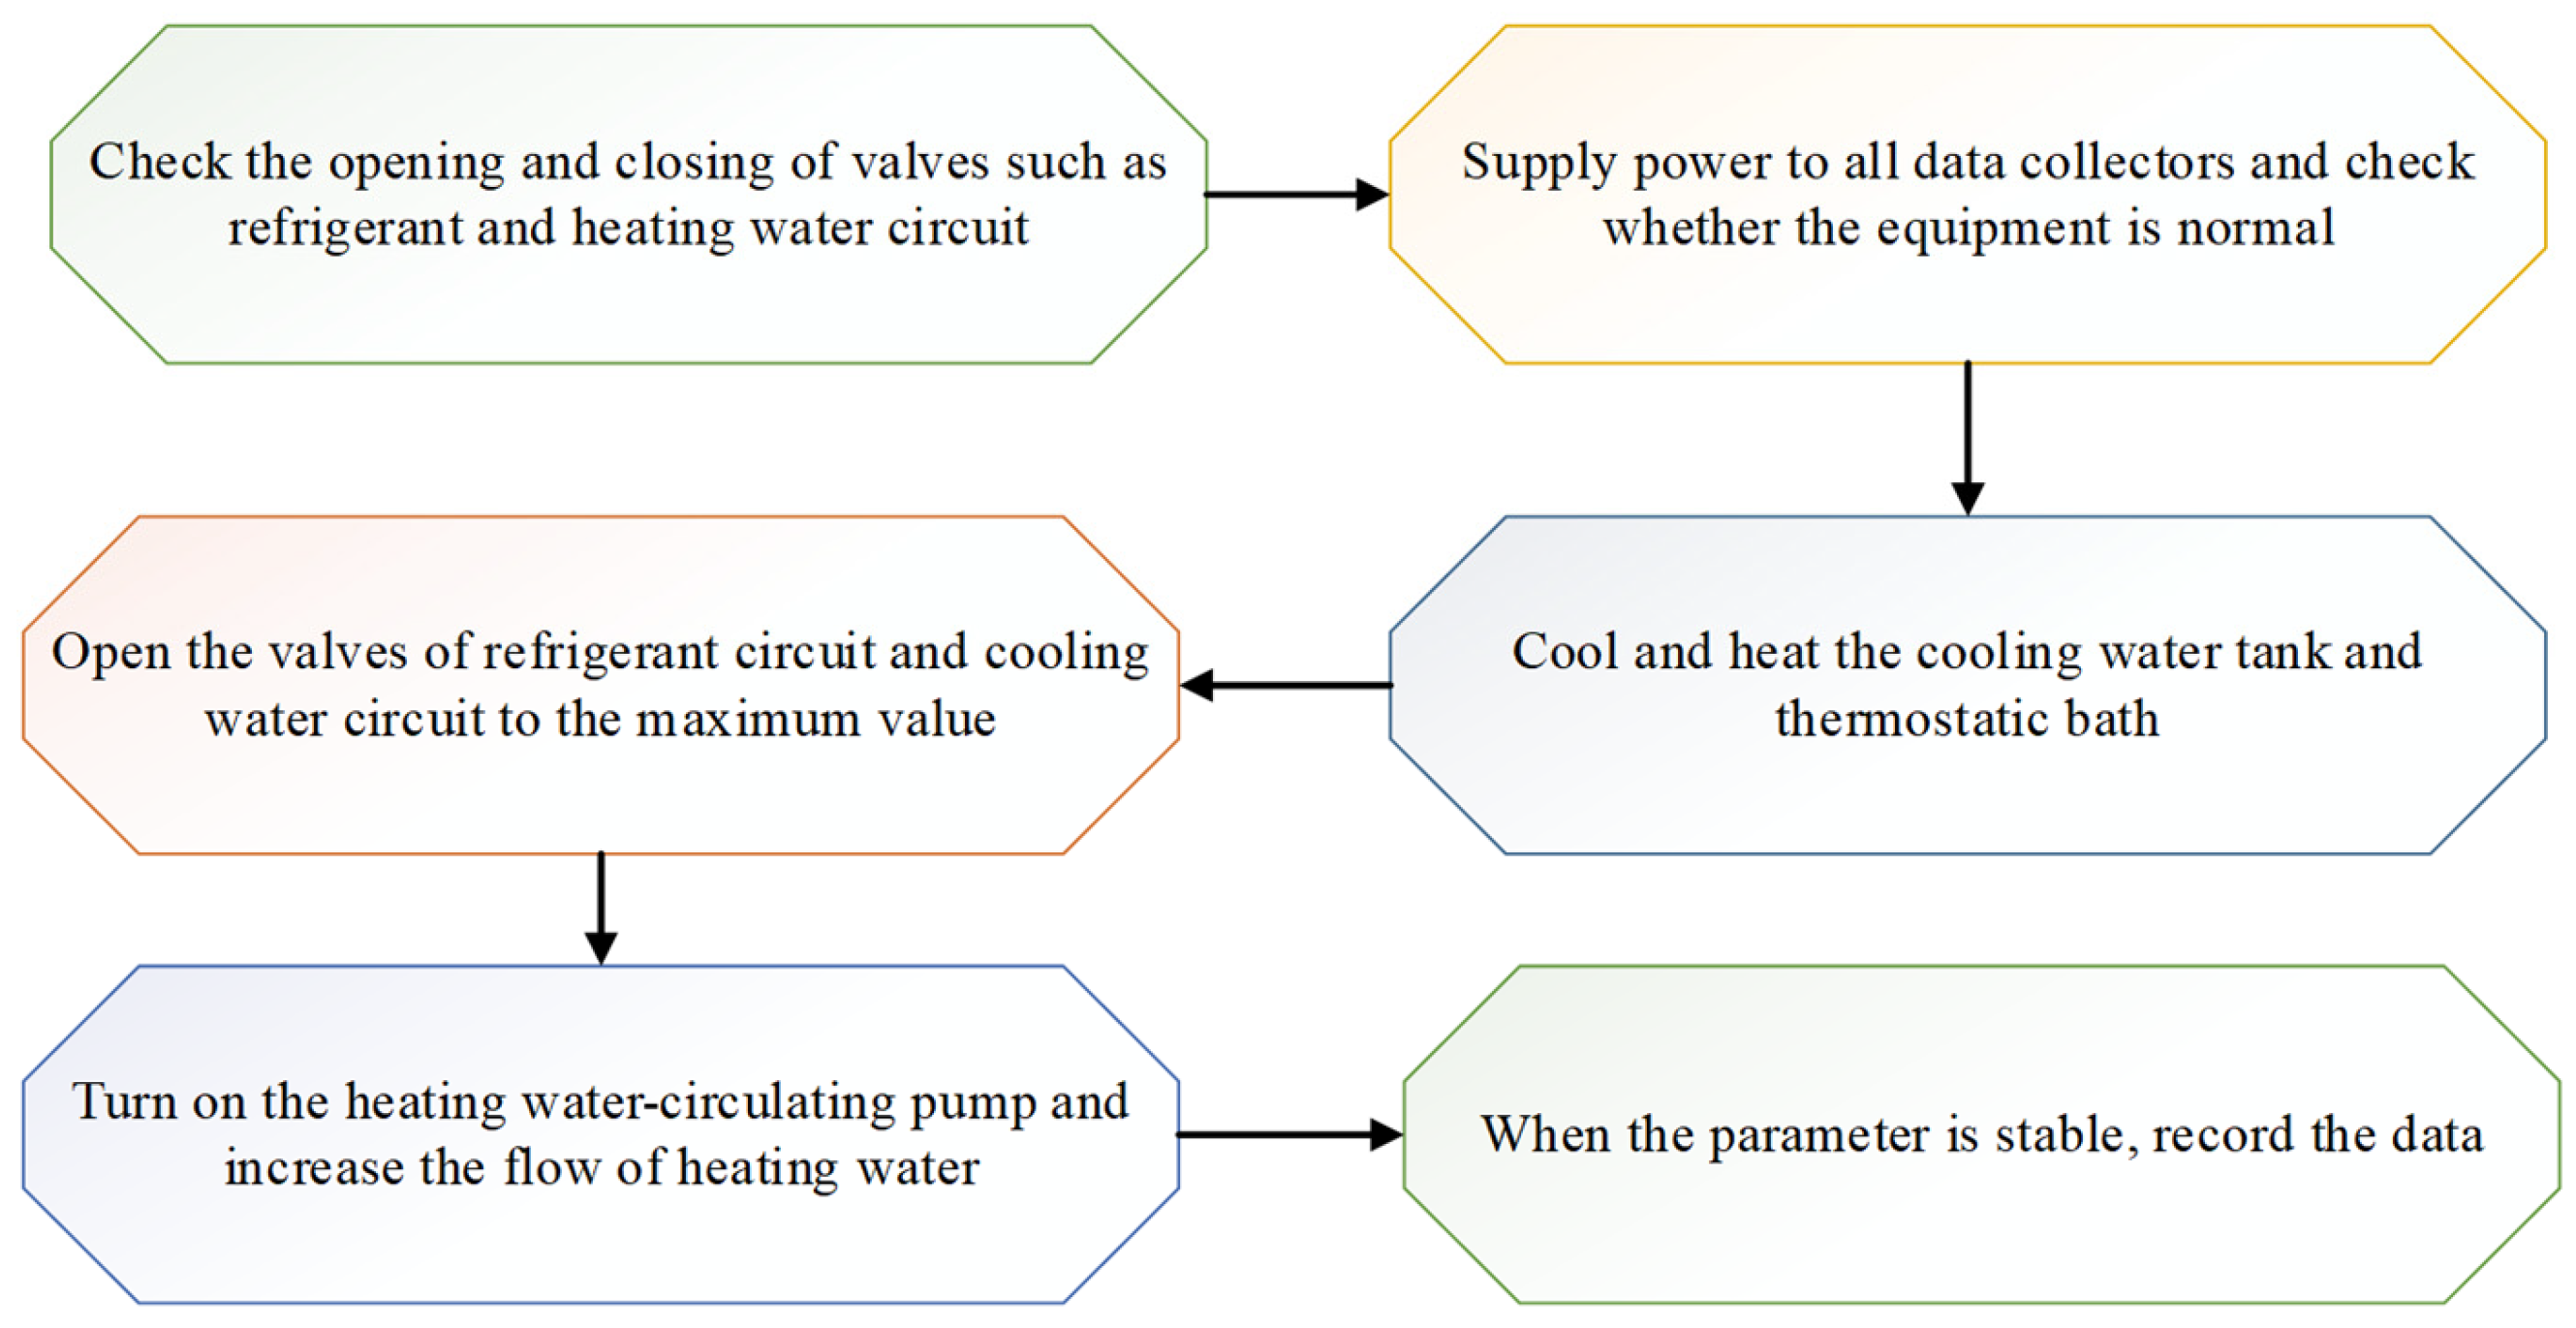
The specific experimental steps are shown in Figure 2. Initially, valve operations for the refrigerant and heating water circuit are inspected, followed by powering up all data collectors and verifying equipment functionality. Subsequently, the cooling water tank and thermostatic bath are cooled and heated. Valves in the refrigerant and cooling water circuits are then fully opened. Next, the heating water-circulating pump is activated and the heating water flow is increased. Finally, once the parameters stabilize, data are recorded. The flowchart outlines the sequence of operations to ensure proper experimental setup and data acquisition.
After cleaning the experimental tube and ignoring the effect of fouling thermal resistance, the basic equation for heat transfer can be calculated based on the thermal resistance distribution in heat exchangers [27], which is shown as follows:
Q = Δ t m 1 π d o L h o + 1 2 π λ L l n d o d i + 1 π d i L h i
In Equation (3), Q represents the heat exchange of the experimental tube, and Δ t m means the logarithmic heat transfer temperature difference between the refrigerant and the heating water in the experimental section. h i represents the boiling heat transfer coefficient of the refrigerant in the experimental tube, and h o indicates the heat transfer coefficient of water flow outside the experimental tube. d i refers to the inner diameter of the experimental tube, d o stands for the outer diameter of the experimental tube. L refers to the effective heat exchange length of the experimental tube, and λ represents the thermal conductivity of the copper tube.
The logarithmic mean temperature difference (LMTD) method is applied [33], using the refrigerant saturation temperature and the heating water temperature in the experimental section.
Δ t m = Δ t m a x Δ t m i n ln Δ t m a x Δ t m i n
In Equation (4), Δ t m is the LMTD, Δ t m a x represents the larger of the heated water at both ends of the experimental section, and Δ t m i n represents the smaller of the heated water at both ends of the experimental section.
Combining Equations (1), (3), and (4), the boiling heat transfer coefficient (h) can be calculated, which is shown in Equation (5).
h t p = Q 1 / 4 π · d o 2 · Δ t m

3. Results and Discussion

3.1. Effect of Tube Diameter and Mass Flow Rate on Boiling Heat Transfer

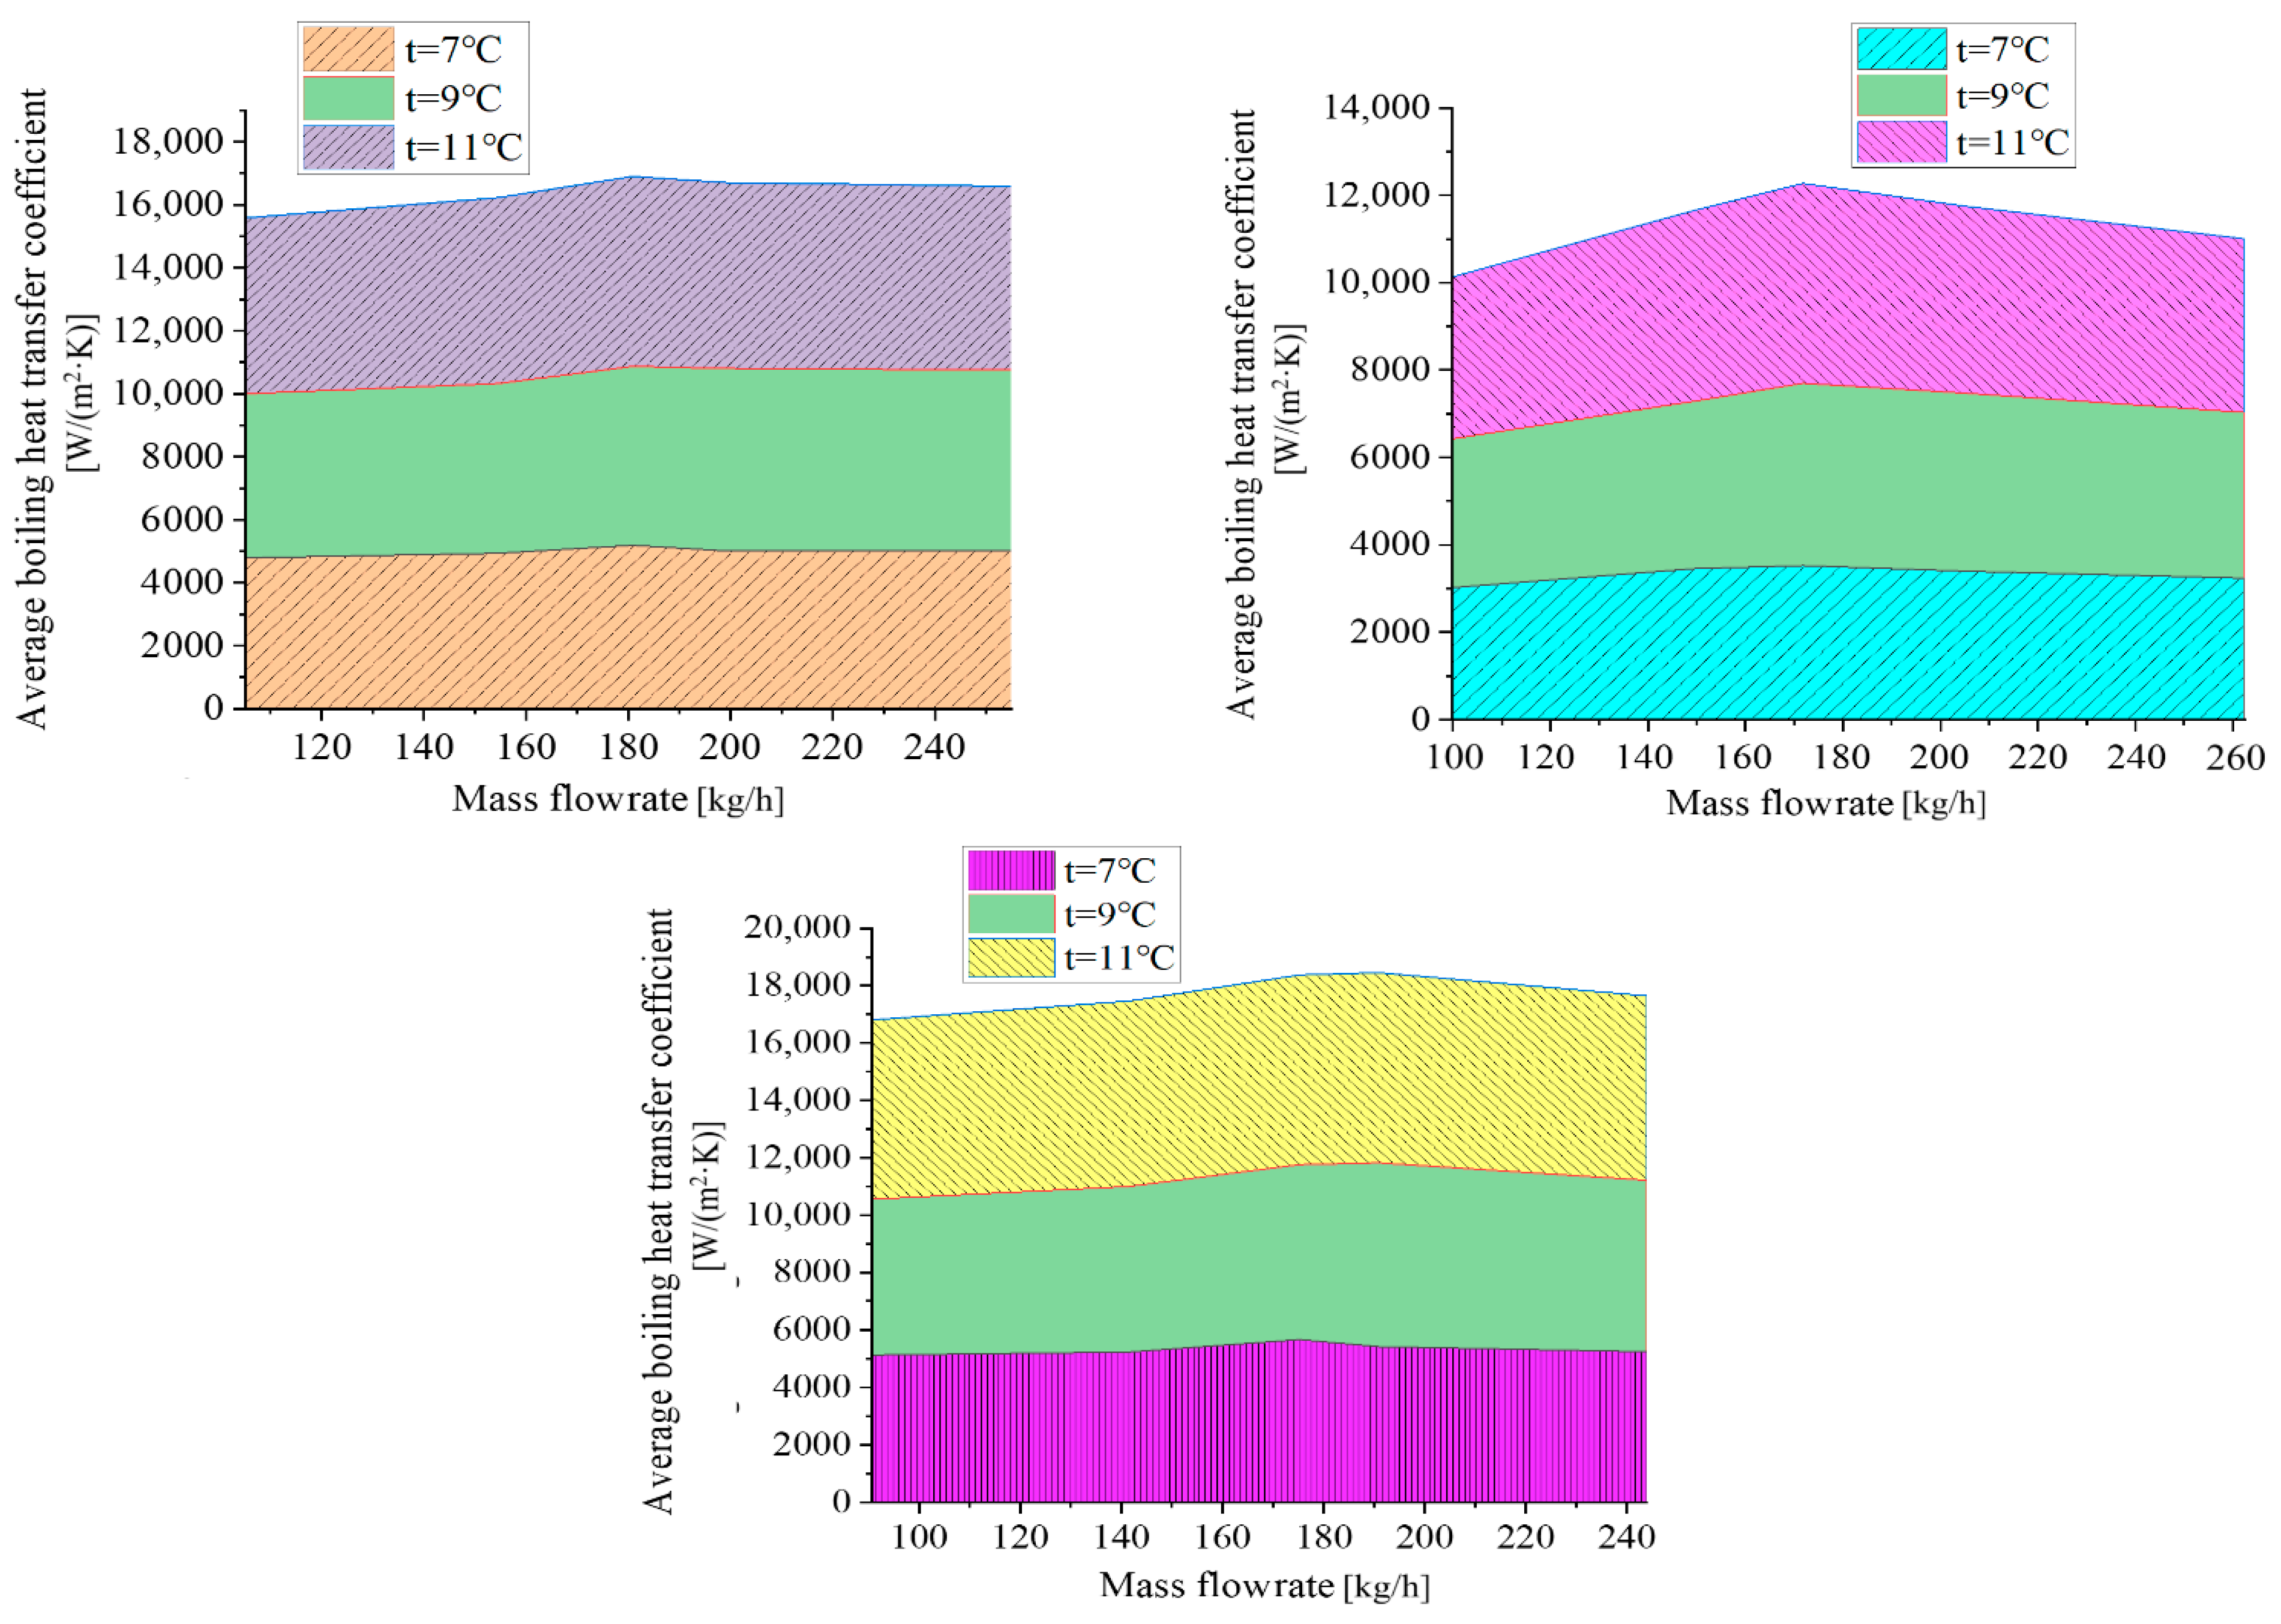
To investigate the boiling heat transfer characteristics of R32 refrigerant, the relationship between the boiling heat transfer coefficient and mass flow rate was analyzed across experimental tubes of varying thicknesses and under different saturation temperatures, as depicted in Figure 3. The preheater and pump adjust simultaneously to achieve flow rates at fixed saturation temperatures. It can be found that, at fixed saturation temperature, the average boiling heat transfer coefficient grows first when raising the flow rate. Then, it drops at a higher flow rate. This is because the flow pattern might change and the friction of liquid phase dominates. When mass flow rate reaches about 180 kg/h, the flow pattern develops as slug flow. Based on the calculation of the heat transfer rate in Equation (1), with the increase in flow rate, the vapor quality drops. As a result, the flow pattern might change to bubble flow, and the liquid phase friction leads to a decrease in heat transfer, though the total heat transfer rate still rises due to the enhancement of turbulence intensity. This phenomenon becomes more significant at a higher saturation temperature of 11 °C in comparison to the case at 7 °C. The maximum average boiling heat transfer coefficient reaches 17,000 W/(m2·K). When testing in a micro-finned tube, the peak value of the heat transfer coefficient grows to over 18,000 W/(m2·K). This is because the increased airflow-induced shear forces within the liquid phase promote heat transfer. However, the tube’s internal cross-sectional area is finite, limiting the maximum heat transfer capacity. It can also be assumed that, once the flow turbulence reaches a certain value, it may not dominate the heat transfer at all. Further increases in mass flow rate become meaningless, and might result in a reduced proportion of vapor phase components. On the other hand, the construction of micro-ribs could re-initialize the thin liquid film, multiply nucleation sites, and enhance turbulence intensity. Considering its effect on the thin-film evaporation enhancement and thermal resistance decline due to bubble agitation, higher boiling coefficient can be reached compare to the cases with smooth tubes.
This study elucidates the interplay between mass flow rate, flow regime transitions, and heat transfer performance in refrigerant boiling processes.
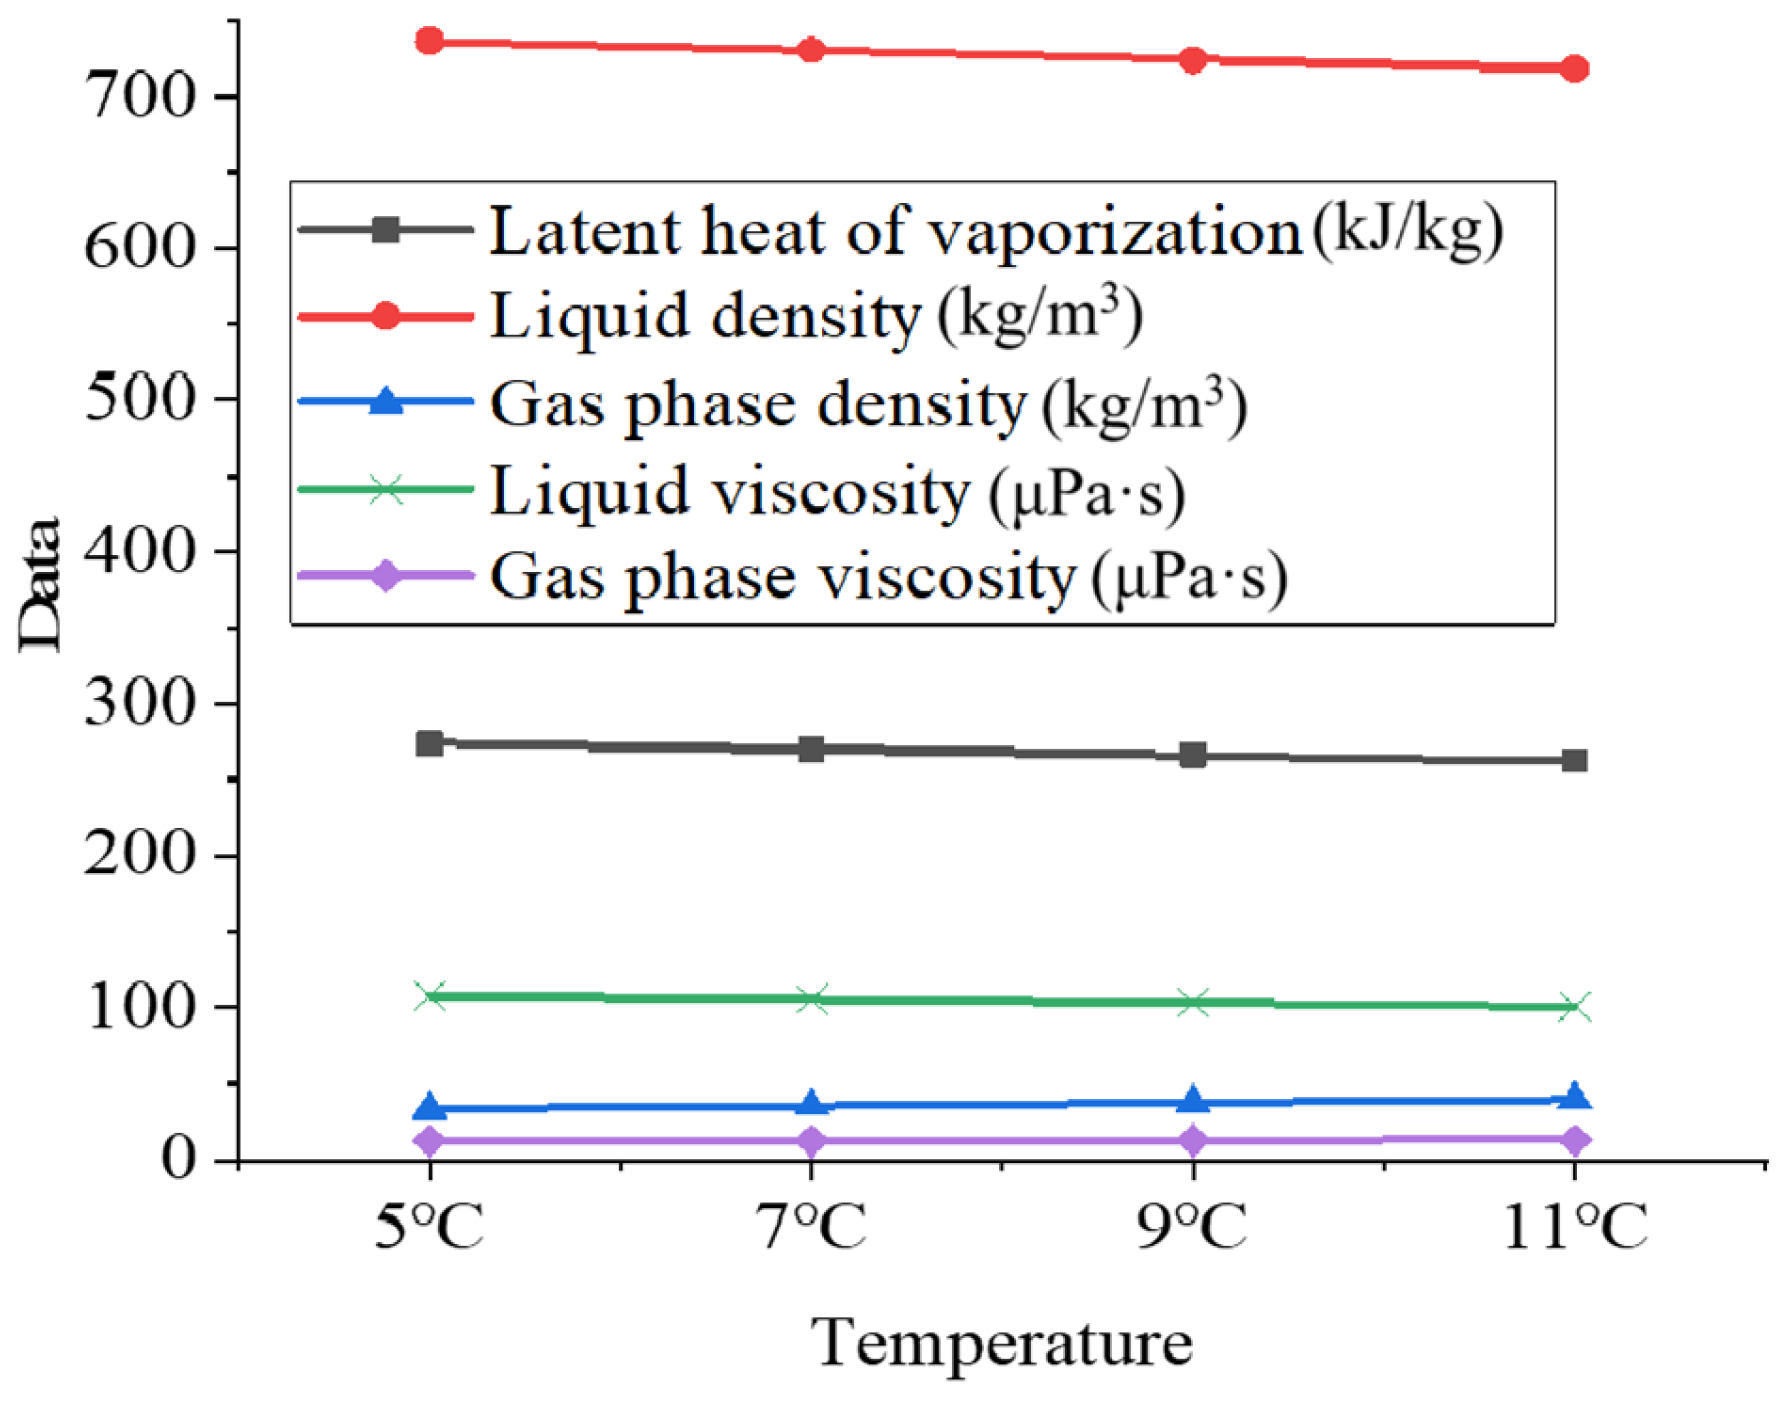
The thermophysical properties of R32 refrigerant at different saturation temperatures were analyzed, and the data are presented in Figure 4. At a saturation temperature of 5 °C, the latent heat of vaporization was 273.95 kJ/kg, the liquid-phase density was 736.42 kg/m3, the gas-phase density was 33.290 kg/m3, the liquid-phase viscosity was 108.03 μPa·s, and the gas-phase viscosity was 12.483 μPa·s. When the saturation temperature increased to 7 °C, these values changed to 270.15 kJ/kg, 730.45 kg/m3, 35.327 kg/m3, 105.57 μPa·s, and 12.602 μPa·s, respectively. At 9 °C, the latent heat of vaporization decreased further to 266.25 kJ/kg, the liquid-phase density to 724.37 kg/m3, and the gas-phase density increased to 37.477 kg/m3, while the liquid-phase viscosity was 103.15 μPa·s and the gas-phase viscosity was 12.725 μPa·s. At 11 °C, the latent heat of vaporization was 262.26 kJ/kg, the liquid-phase density was 718.17 kg/m3, the gas-phase density was 39.745 kg/m3, the liquid-phase viscosity was 100.77 μPa·s, and the gas-phase viscosity was 12.851 μPa·s. These results indicate that as the saturation temperature increases, the latent heat of vaporization, liquid-phase density, and gas-phase viscosity decrease monotonically. In contrast, the gas-phase density and liquid-phase viscosity increase gradually.
The current study investigates the influence of R32 refrigerant on heat exchange performance from the perspectives of pipe diameter and type, with specific findings illustrated in Figure 5. Notably, the use of heat exchange tubes with smaller diameters can enhance heat exchange efficiency. The experimental results indicate that the boiling heat transfer coefficient of a 5 mm diameter tube is approximately 32.8–69.2% higher than that of a 7 mm diameter tube. This enhancement is attributed to the increased specific surface area of the refrigerant in contact with the tube wall as the pipe diameter decreases. For a given refrigerant mass flow rate, smaller-diameter tubes facilitate the formation of a greater number of vaporization nucleation sites, thereby promoting heat absorption by the refrigerant and strengthening boiling heat transfer.

3.2. Effect of Ribbed Tube and Refrigerant Type on Boiling Heat Transfer

Figure 5 shows the bubble generation and development for annular flow during the boiling heat transfer process (at the flow rate of 160 kg/m3). Notably, the liquid film shears over vapor core. Wall nucleation generates micro-bubbles at cavity sites; rapid radial conduction and local supersaturation feed influx, driving bubble growth. Inertia, surface tension, and interfacial shear compete: when drag plus buoyancy exceed capillary anchoring force, bubbles lift off, collapsing into the high-velocity vapor core, while adjacent liquid rewets the surface, sustaining cyclic heat transfer.
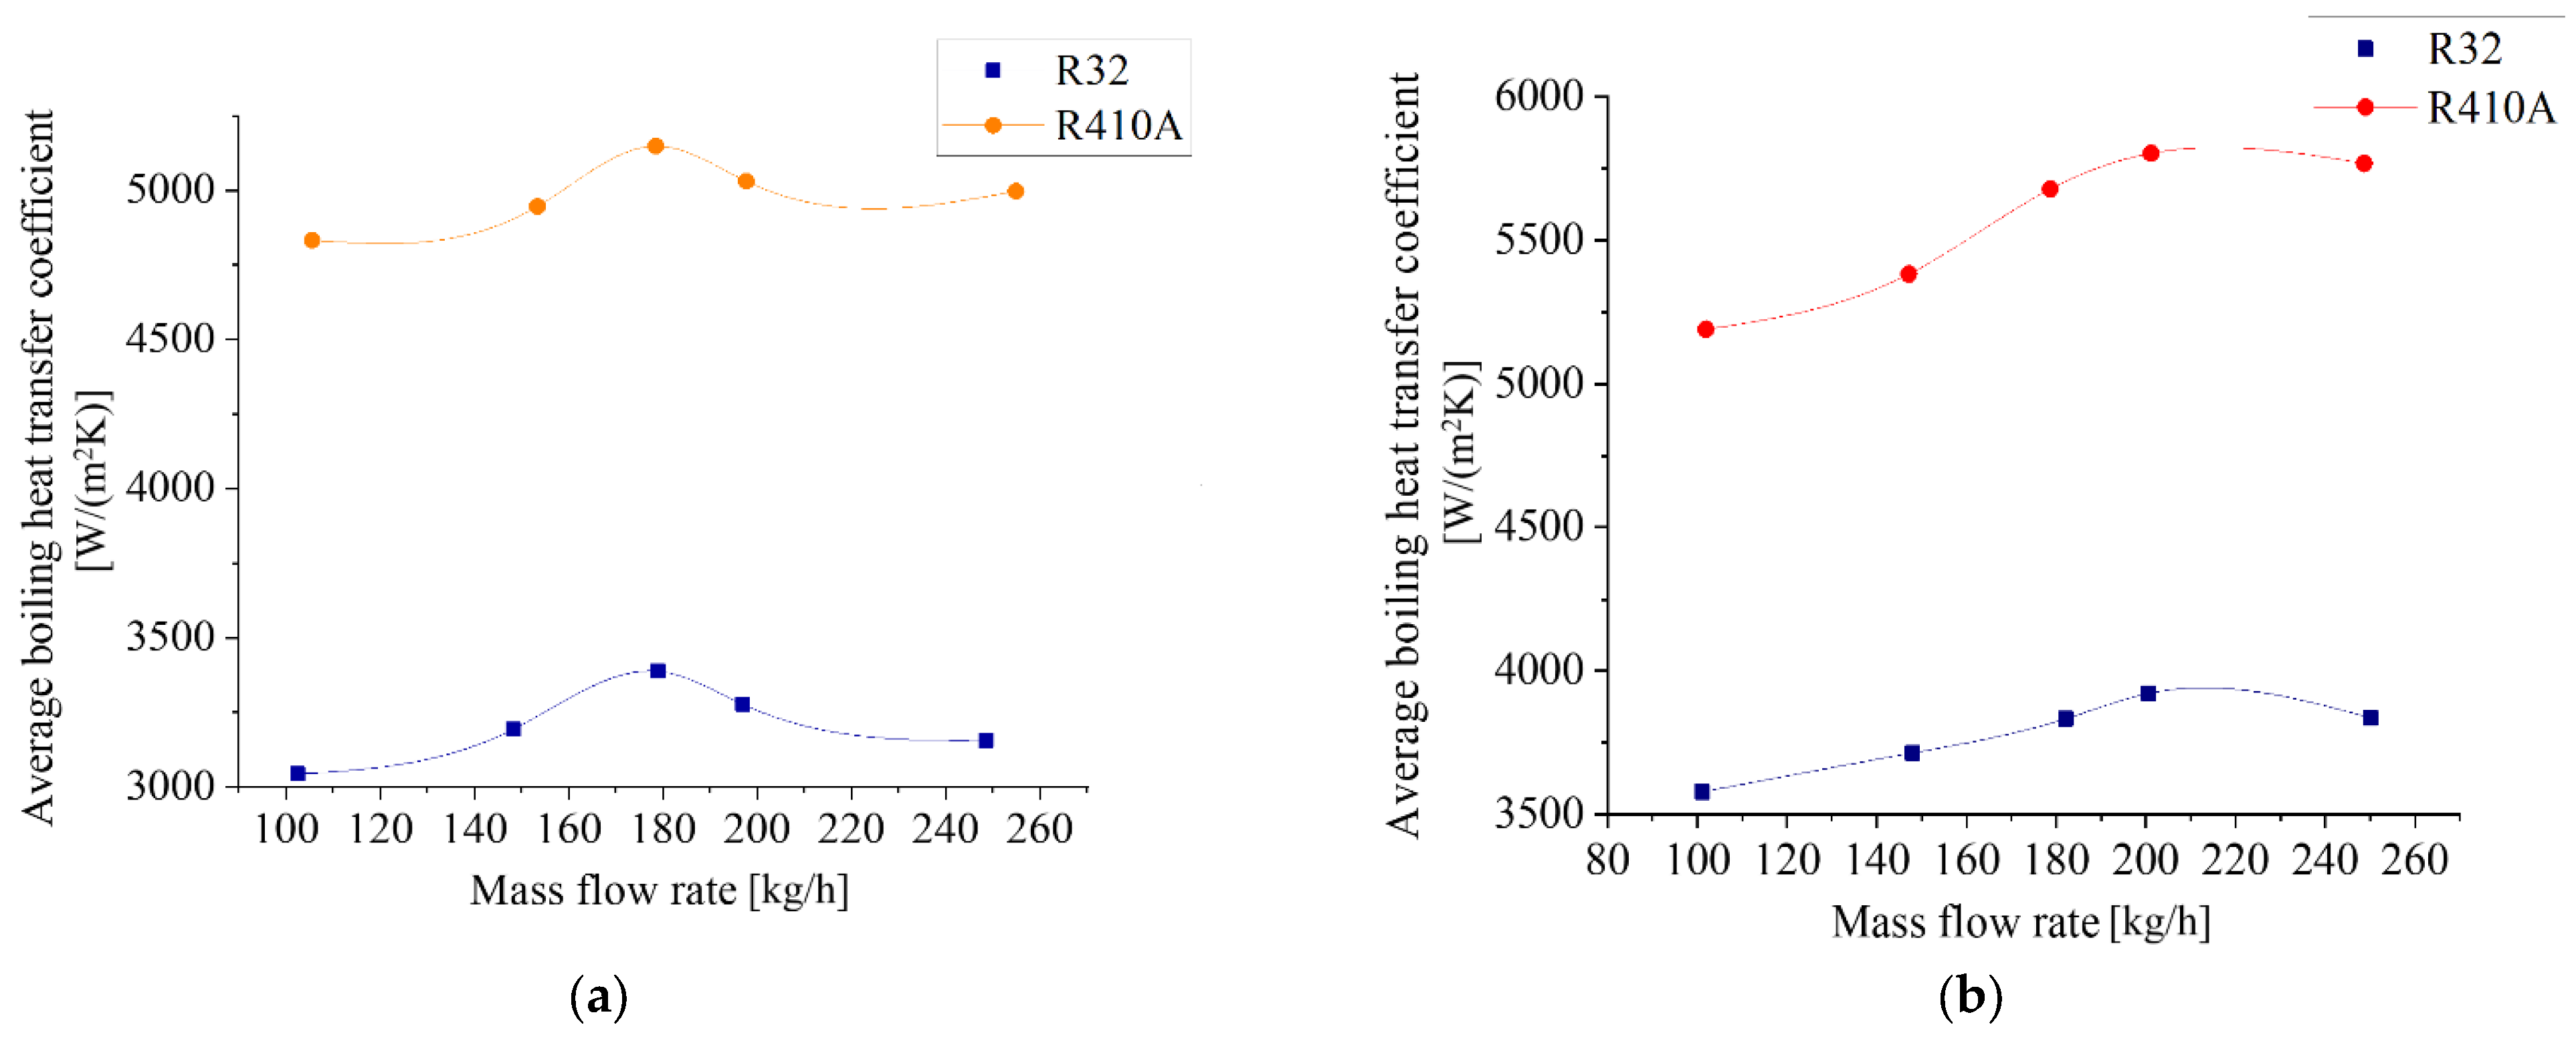
The boiling heat transfer characteristics of R32 refrigerant are analyzed by comparing the average boiling heat transfer coefficients of R32 and R410A refrigerants at various mass flow rates and saturation temperatures, with the results presented in Figure 6 and Figure 7. R32 exhibits a higher boiling heat transfer coefficient than R410A under identical conditions and within the same experimental tube. Specifically, R32’s heat transfer coefficient is 14.3% to 68.4% higher than that of R410A. It should be declared that this comparison is based on the statistics under current operating conditions, within the range of tube diameter, mass flow rates, and saturation temperatures. This advantage is particularly pronounced at lower saturation temperatures. These differences are primarily attributed to the distinct thermophysical properties of the working fluids.
On the other hand, the lubricating oil introduced by the compressor always shows an important effect on the boiling heat transfer coefficient in horizontal tubes [34]. The influence regime of channel size, saturation temperature, and flow rate might change due to the existence of oil, since it becomes a vital factor when reaching over 1% of mass. It was reported that the tube wall may be more susceptible to dry-out at lower qualities and mass fluxes with refrigerant/oil mixture, while the oil concentration shows a critical impact on heat transfer enhancement or deterioration. The influence of lubricating oil in R32 boiling heat transfer will be further analyzed.

3.3. Research on Modeling of Correlations

Studies on the boiling heat transfer of R32 are not as general as R134a and 410°, especially the correlations. Based on the analogy of flow regime and boiling phenomenon, investigations on other refrigerants can be regarded as references. Pamitran et al. [27] developed the empirical correlation of R290 based on the classical Cooper equation [33]. Then, Choi et al. [24] further corrected the boiling heat transfer coefficient based on their experimental data. Zhang et al. [35] followed the studies of Pamitran, and further regarded the friction factor as an independent variable, which can further decrease the prediction error. Fang et al. [36] proposed their correlation based on their measurement for R32. However, the correlation is complicated and showed poor practical application.
In developing the new correlation for the nucleate-boiling suppression factor S and turbulence factor F, the conventional functional form was retained [34]:
h = S h n b + F h t u r
S = 135.69 ( f 2 ) 0.031 B o 0.748
F = 0.023 f 2 + 0.977
where S stands for the nuclear boiling restrain factor, F is the forced convection enhancement factor, f is the friction factor, Bo is the boiling factor, and hnb and htur are the heat transfer coefficients of nucleate boiling and turbulent flow, respectively. As shown in Equation (9), the two-phase friction factor (f) is calculated according to the pressure loss ( Δ p ):
f = 2 Δ p ρ u 2 L d i
where d i indicates the outer diameter of the inner tube. A regression analysis was applied to the experimental data to derive the updated correlation. The refitted correlations are presented as follows:
h n b = 55 p p r 0.12 0.4343 ln p p r 0.55
where p and pr are the pressure and the saturation pressure of the fluid, respectively. The turbulent heat transfer coefficient can be calculated accordingly. When 200 < Re < 2000, the calculation method for the laminar flow area is as shown in Equation (11).
h t u r d i λ = 1.02 R e 0.45 P r 0.5 μ l μ w a l l 0.14 d i L 0.4 d o d i 0.8 G r 0.05
When Re > 10,000, the calculation method for the turbulent flow area is as shown in Equation (12).
h t u r d i λ l = 0.023 R e 0.8 P r 0.4 d o d i 0.45
where d o means the inner diameter of the outer tube of the casing, λ l is the thermal conductivity of the fluid, μ l stands for the fluid viscosity, μ w shows the fluid viscosity at the pipe wall temperature, R e is the Reynolds number, P r is the Prandtl number, and G r is the Grashof number. Subsequent validation demonstrated that the proposed boiling heat transfer correlation possesses a high predictive accuracy.
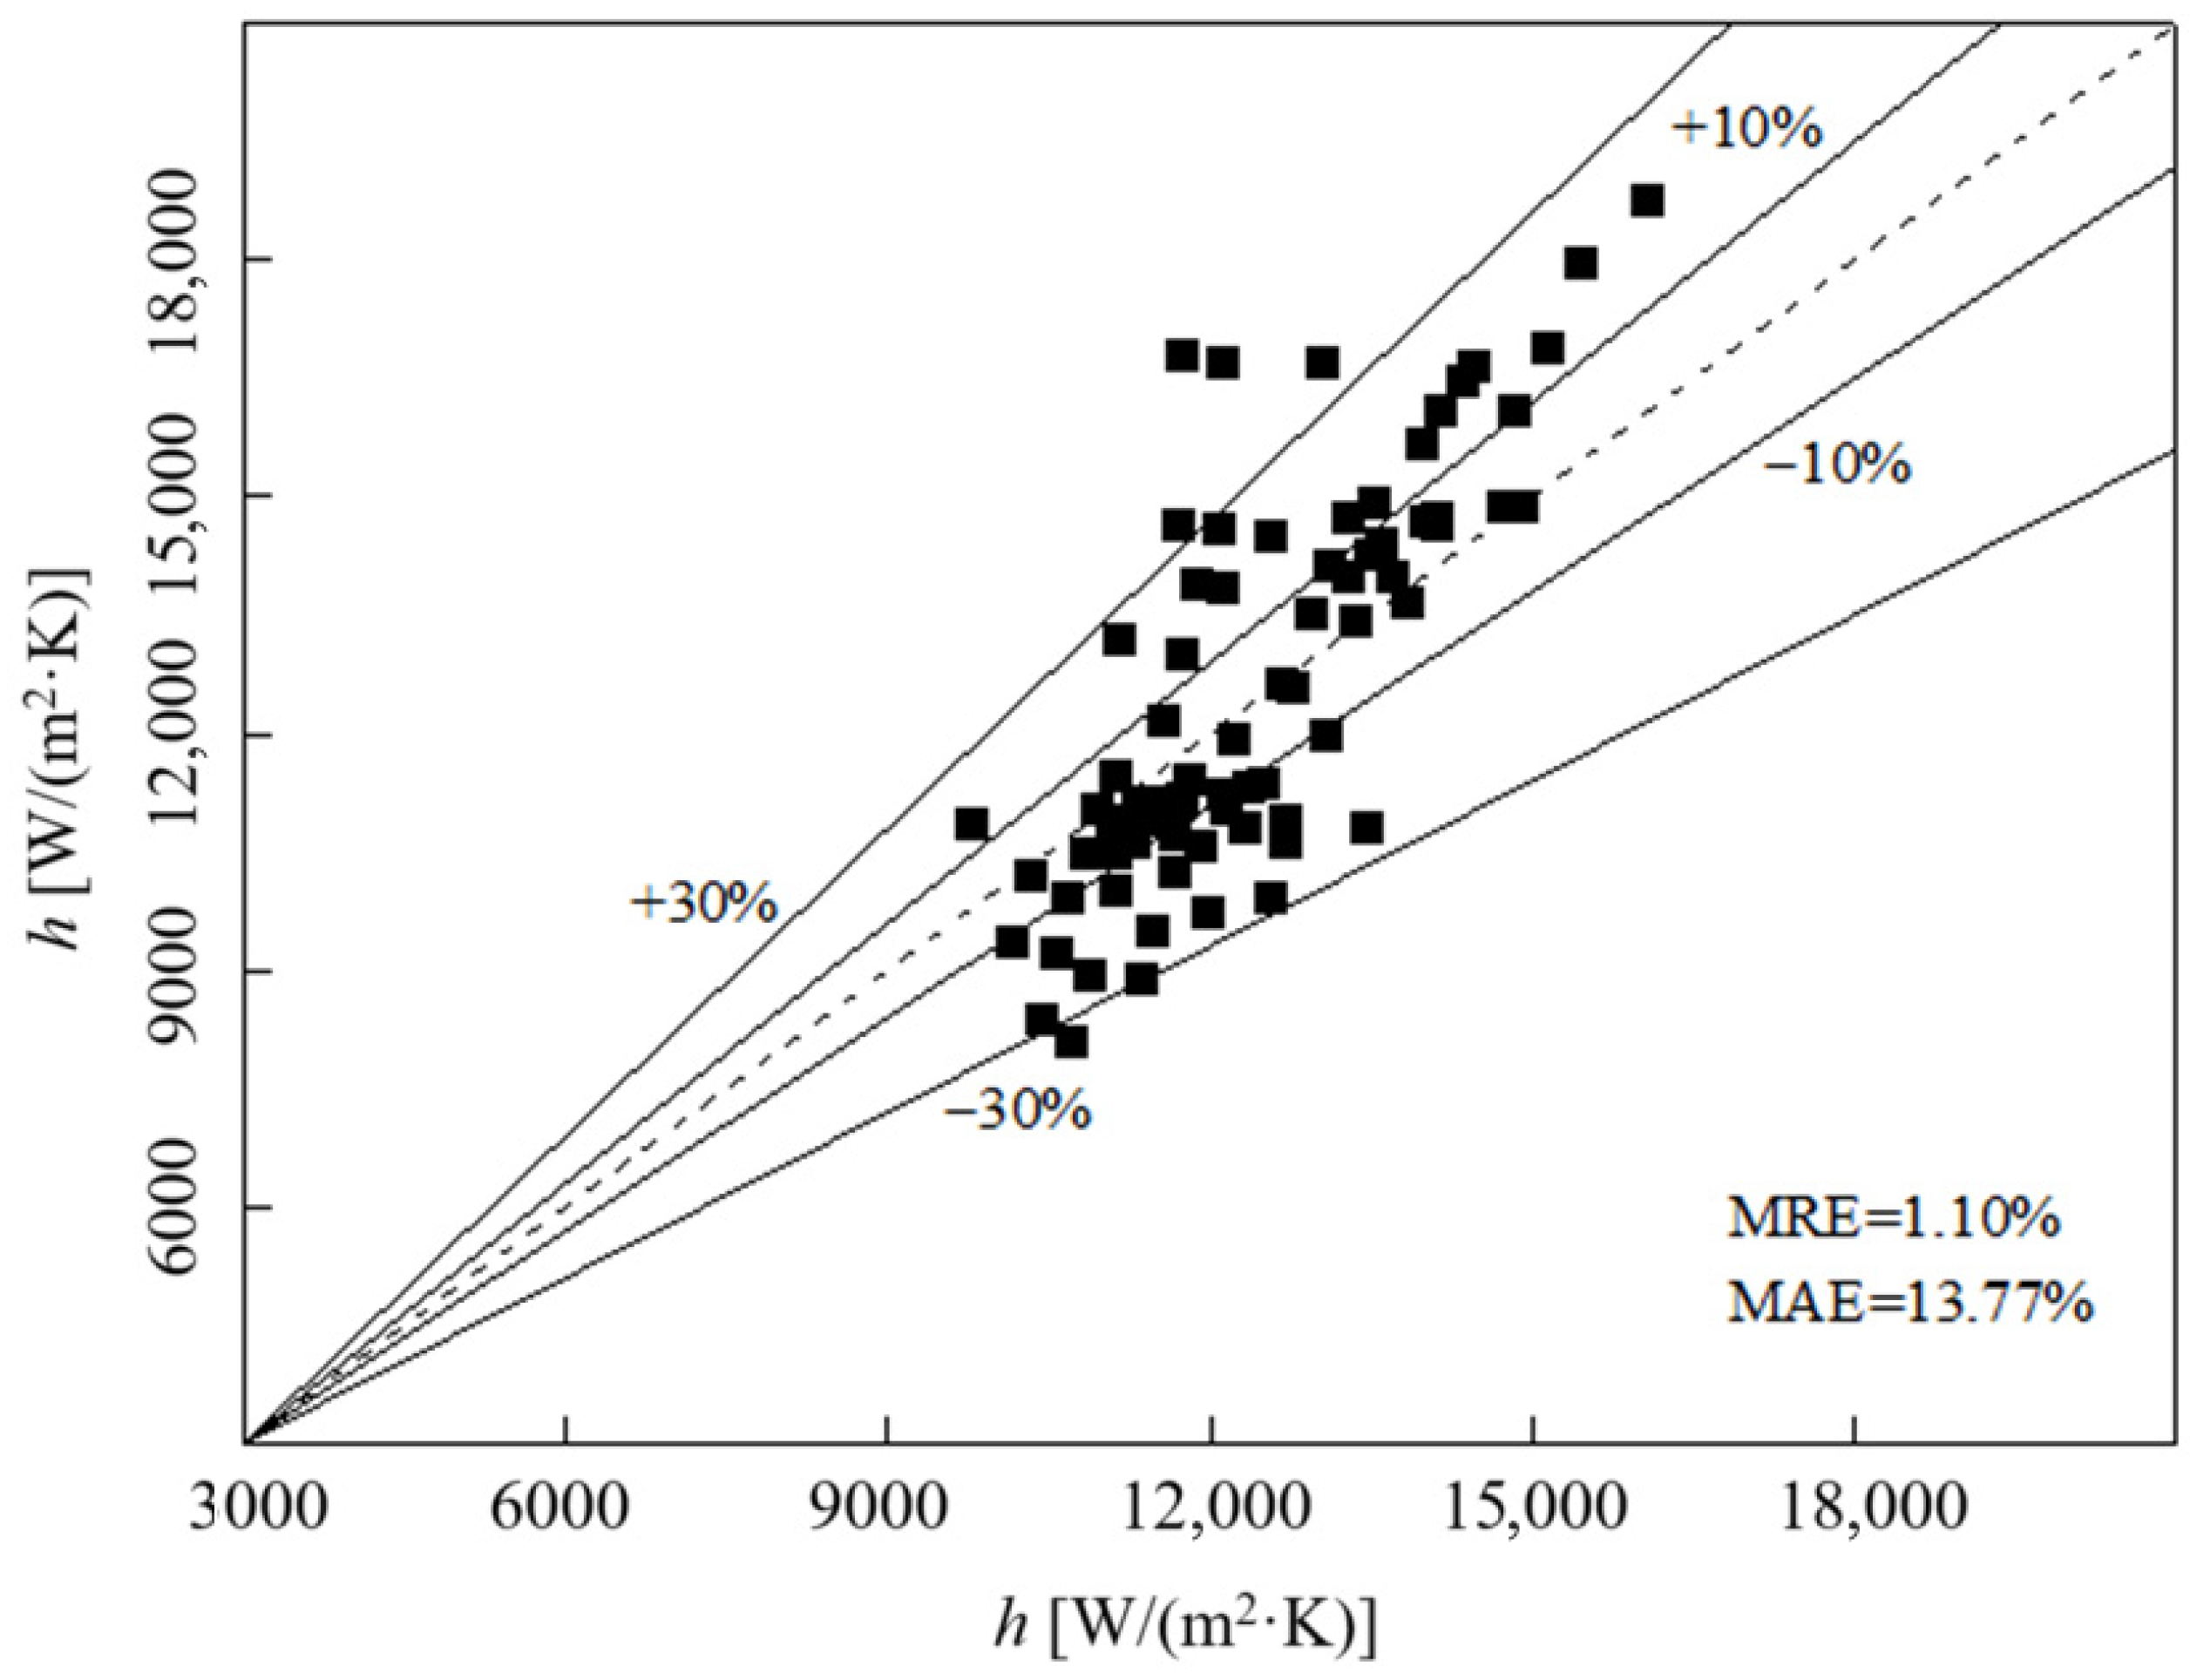
Figure 8 shows the prediction accuracy of the experimental data by the proposed correlation. It can be found that the average relative error remains within 10%. The flow rate ranges from 100 to 250 kg/h, while the saturation temperatures of R32 or R410a range between 7 and 11 °C. Also, this correlation is much more concentrated in small-diameter tubes (5 mm and 7 mm) for more precise predictions. Under high-flow conditions, the correlation systematically over-predicts the experimental data, whereas at low flow rates it generally under-predicts them, indicating satisfactory predictive accuracy. Moreover, when the saturation temperature is low, the correlation exhibits comparatively smaller prediction errors.

4. Conclusions

The refrigerant replacement has garnered significant attention in the industry due to the intensification of the greenhouse effect and heightened ecological protection efforts by governments. This study explored the boiling heat transfer characteristics and correlation prediction of the widely used R32 refrigerant and reached the following conclusions:
(1)
Observations of the variation in the R32 boiling heat transfer coefficient with mass flow rate across different experimental tubes and saturation temperatures reveal a non-monotonic trend: the average coefficient initially increases and then decreases with rising mass flow rate, irrespective of tube thickness.
(2)
Investigations into thermophysical properties such as latent heat, liquid-phase density, gas-phase density, and viscosity at varying saturation temperatures indicate that latent heat, liquid-phase density, and gas-phase viscosity decrease with increasing saturation temperature. Additionally, the effect of flow pattern change may also enhance heat transfer performance.
(3)
The average boiling heat transfer coefficients of R32 and R410A refrigerants under different mass flow rates and saturation temperatures are predicted by applying a correlation obtained by experimental statistics. The prediction accuracy is controlled within ±10%.
Basically, the transmission of the Reynolds number for two-phase flow does not have natural experience. Also, the local temperature, vapor quality, and film thickness will be further measured and visualized, which might help to fundamentally understand the change in boiling heat transfer along the flow direction. We may regard the above aspects as an important contribution in our next study.

Author Contributions

Conceptualization, W.C. and Y.L.; Methodology, B.Y.; Investigation, B.Y. and C.Z.; Data curation, C.Z.; Writing—original draft, B.Y.; Writing—review & editing, W.C. and Y.L.; Supervision, Y.L. All authors have read and agreed to the published version of the manuscript.

Funding

This work is supported by Zhuhai Science-Tech Innovation Bureau Under Grant 2220004003055.

Data Availability Statement

The original contributions presented in this study are included in the article. Further inquiries can be directed to the corresponding author.

Conflicts of Interest

Authors Bo Yu and Yuye Luo are employed by Gree Electric Appliances Inc. of Zhuhai. The remaining authors declare that the research was conducted in the absence of any commercial or financial relationships that could be construed as a potential conflict of interest.

Nomenclature

AcCross-section area, m2
BoBoiling number
CpSpecific heat at constant pressure, J/(kg·K)
dDiameter, m
GrGrashof number
hHeat transfer coefficient, W/(m2·K)
LTube length, m
PrPrandtl number
qMass flow rate, kg/h
QHeat exchange rate, W
ReReynolds number
TTemperature, K
ΔTTemperature difference, K
uVelocity, m/s
Greek symbols
ρDensity, kg/m3
λThermal conductivity, W/(mK)
ΦfTwo-phase friction multiplier
μFluid viscosity, Pa·s
μwallFluid viscosity at wall temperature, Pa·s
Subscripts
iInlet
lLiquid
oOutlet
mMean
maxMaximum
minMinimum
nbNucleate boiling
rRefrigerants
tTurbulent
wWater

References

  1. Strickland, N.M.; Wimbush, S.C.; Pantoja, A.; Pooke, D.M.; Fee, M.; Chamritskii, V.; Hartwig, Z.; Cheng, J.; Garberg, S.; Sorbom, B. Extended-Performance “SuperCurrent” Cryogen-Free Transport Critical-Current Measurement System. IEEE Trans. Appl. Supercond. 2021, 31, 9000305. [Google Scholar] [CrossRef]
  2. Oh, S.W.; Denisov, A.O.; Chen, P.; Petta, J.R. Cryogen-free scanning gate microscope for the characterization of Si0.7Ge0.3 quantum devices at milli-Kelvin temperatures. AIP Adv. 2021, 11, 125–130. [Google Scholar] [CrossRef]
  3. Janta, P.; Pinyo, D.; Yodta, Y.; Vasasiri, P.; Weidenbach, M.; Pursch, M.; Yang, X.G.; Kulsing, C. A multi-location peak parking approach for calculation of second dimensional retention indices for improved volatile compound identification with cryogen-free comprehensive heart-cut two-dimensional gas chromatography. Anal. Methods 2021, 13, 124–132. [Google Scholar] [CrossRef] [PubMed]
  4. Kryukov, E.; Owczarkowski, M.; Phillipps, D.; Linde, A.J.P.; Burgess, S.; Good, J. A new method to measure the temporal magnetic field instabilities in cryogen-free magnets for magnetic resonance. Solid State Nucl. Magn. Reson. 2021, 113, 101–107. [Google Scholar] [CrossRef]
  5. Yan, J.; Yao, J.; Shvarts, V.; Du, R.R.; Lin, X. Cryogen-free one hundred microkelvin refrigerator. Rev. Sci. Instrum. 2021, 92, 110–120. [Google Scholar] [CrossRef]
  6. Chaudhary, S.; Panda, J.J.; Mundlia, S.; Mathimalar, S.; Ahmedof, A.; Raman, K.V. A low noise cryogen-free scanning tunneling microscope–superconducting magnet system with vacuum sample transfer. Rev. Sci. Instrum. 2021, 92, 23–90. [Google Scholar] [CrossRef]
  7. Tian, J.; Chen, B.; Li, D. Light transmittance dynamics and spectral absorption characteristics during auxiliary cryogen spray cooling in laser dermatology. Lasers Med. Sci. 2022, 37, 2079–2086. [Google Scholar] [CrossRef]
  8. Li, Y.; Roell, S. Key designs of a short-bore and cryogen-free high temperature superconducting magnet system for 14 T whole-body MRI. Supercond. Sci. Technol. 2021, 34, 125–135. [Google Scholar] [CrossRef]
  9. Leveratto, A.; Armenio, A.A.; Traverso, A.; De Marzi, G.; Celentano, G.; Malagoli, A. Transport current and magnetization of Bi-2212 wires above liquid Helium temperature for cryogen-free applications. Sci. Rep. 2021, 11, 11660. [Google Scholar] [CrossRef]
  10. Zhang, H.; Yang, Y.; Jiang, Y.; Bai, L.; Yang, X.; Zhao, Y. Optimization of a Cryogen-Free Superconducting Prototype Generator with YBCO Field Windings. IEEE Trans. Appl. Supercond. 2021, 31, 5206905. [Google Scholar] [CrossRef]
  11. Awaji, S.; Badel, A.; Okada, T.; Takahashi, K.; Miyazaki, H.; Hanai, S.; Ioka, S.; Fujita, S.; Muto, S.; Iijima, Y.; et al. Robust REBCO insert coil for upgrade of 25 T cryogen-free superconducting magnet. IEEE Trans. Appl. Supercond. 2021, 31, 4300105. [Google Scholar] [CrossRef]
  12. Jang, J.Y.; Kim, M.S.; Hwang, Y.J.; Song, S.; Choi, Y.; Choi, Y.S. Development of a Cryogen-Free Compact 3 T Superconducting Magnet for an Electromagnetic Property Measurement System. Appl. Sci. 2021, 11, 3074. [Google Scholar] [CrossRef]
  13. Wu, W.; Li, D.; Chen, B.; Wang, G. A new mathematical model for accurate quantification of cryogen spray cooling in cutaneous laser surgery using realistic boundary conditions. Lasers Med. Sci. 2021, 36, 1609–1617. [Google Scholar] [CrossRef]
  14. Kumar, A.; Kumar, A.; Kochher, G. Potential of supercritical nitrogen to be used as cryogen for superconducting applications. Mater. Today Proc. 2021, 47, 4345–4349. [Google Scholar] [CrossRef]
  15. Bahce, E.; Sarigul, E. An investigation of the effects of cryogen application direction on Ti6Al4V alloy milling. J. Adv. Manuf. Eng. 2021, 2, 42–48. [Google Scholar]
  16. Coe, A.; Li, G.; Andrei, E. Scanning Probe Microscopy Combined with Low Temperature Cryogen-free Operation in an Ultra-High Vacuum High Field Environment. Bull. Am. Phys. Soc. 2022, 56, 96–110. [Google Scholar]
  17. Majoros, M.; Sumption, M.D.; Parizh, M.; Wan, F.; Rindfleisch, M.A.; Doll, D.; Tomsic, M.; Collings, E.W. Magnetic, mechanical and thermal modeling of superconducting, whole-body, actively shielded, 3 T MRI magnets wound using MgB2 strands for liquid cryogen free operation. IEEE Trans. Appl. Supercond. 2022, 36, 126–130. [Google Scholar] [CrossRef]
  18. Coe, A.; Li, G.; Andrei, E. Cryogen-free Ultra-High Vacuum Low Temperature High Field Proximal Probe System for the Exploration of Low Dimensional Materials. Bull. Am. Phys. Soc. 2021, 66, 30–50. [Google Scholar]
  19. Low, D.; Ferguson, G.M.; Jarjour, A.; Schaefer, B.T.; Bachmann, M.D.; Moll, P.J.; Nowack, K.C. Scanning SQUID microscopy in a cryogen-free dilution refrigerator. Rev. Sci. Instrum. 2021, 92, 083704. [Google Scholar] [CrossRef]
  20. Can, M.; Koluaçik, S.; Bahçe, E.; Gokce, H.; Tecellioglu, F.S. Investigation of thermal damage in bone drilling: Hybrid processing method and pathological evaluation of existing methods. J. Mech. Behav. Biomed. Mater. 2022, 126, 105–130. [Google Scholar] [CrossRef]
  21. Low, D.; Ferguson, G.M.; Jarjour, A.; Schaefer, B.T.; Nowack, K.C. Design files for a scanning superconducting quantum interference device operated in a cryogen-free dilution refrigerator. Zenodo 2021, 47, 118–120. [Google Scholar]
  22. Alajlan, A. Crescent-Shaped Hyperpigmentation Following Laser Hair Removal: Case Series of Fifteen Patients. Lasers Surg. Med. 2021, 53, 333–336. [Google Scholar] [CrossRef]
  23. Chen, J.C. Correlation for boiling heat transfer to saturated fluids in convective flow. Ind. Eng. Chem. Process Des. Dev. 1966, 5, 322–329. [Google Scholar] [CrossRef]
  24. Choi, K.I.; Pamitran, A.S.; Oh, J.T.; Saito, K. Pressure drop and heat transfer during two-phase flow vaporization of propane in horizontal smooth minichannels. Int. J. Refrig. 2009, 32, 837–845. [Google Scholar] [CrossRef]
  25. Gungor, K.E.; Winterton, R.H.S. A general correlation for flow boiling in tubes and annuli. Int. J. Heat Mass Transf. 1986, 29, 351–358. [Google Scholar] [CrossRef]
  26. Liu, Z.; Winterton, R.H.S. A general correlation for saturated and subcooled flow boiling in tubes and annuli, based on a nucleate pool boiling equation. Int. J. Heat Mass Transf. 1991, 34, 2759–2766. [Google Scholar] [CrossRef]
  27. Pamitran, A.S.; Choi, K.I.; Oh, J.T.; Park, K.W. Two-phase flow heat transfer of propane vaporization in horizontal minichannels. J. Mech. Sci. Technol. 2009, 23, 599–606. [Google Scholar] [CrossRef]
  28. Maghrabie, H.M.; Elsaid, K.; Sayed, E.T.; Abdelkareem, M.A.; Wilberforce, T.; Ramadan, M.; Olabi, A.G. Intensification of heat exchanger performance utilizing nanofluids. Int. J. Thermofluids 2021, 10, 100–117. [Google Scholar] [CrossRef]
  29. Attarzadeh, R.; Rovira, M.; Duwig, C. Design analysis of the “Schwartz D” based heat exchanger: A numerical study. Int. J. Heat Mass Transf. 2021, 177, 121–141. [Google Scholar] [CrossRef]
  30. Chupradit, S.; Jalil, A.T.; Enina, Y.; Neganov, D.A.; Alhassan, M.S.; Aravindhan, S.; Davarpanah, A. Use of Organic and Copper-Based Nanoparticles on the Turbulator Installment in a Shell Tube Heat Exchanger: A CFD-Based Simulation Approach by Using Nanofluids. J. Nanomater. 2021, 20, 96–110. [Google Scholar] [CrossRef]
  31. Cai, W.; Wang, F.; Chen, S.; Chen, C.; Liu, J.; Deng, J.; Kolditz, O.; Shao, H. Analysis of heat extraction performance and long-term sustainability for multiple deep borehole heat exchanger array: A project-based study. Appl. Energy 2021, 289, 116–120. [Google Scholar] [CrossRef]
  32. Safari, V.; Abolghasemi, H.; Kamkari, B. Experimental and numerical investigations of thermal performance enhancement in a latent heat storage heat exchanger using bifurcated and straight fins. Renew. Energy 2021, 174, 102–121. [Google Scholar] [CrossRef]
  33. Cooper, M.G. Heat flow rates in saturated nucleate pool boiling-a wide-ranging examination using reduced properties. Adv. Heat Transf. 1984, 16, 157–239. [Google Scholar]
  34. Chu, W.; Yan, G.; Zhang, H.; Zhao, F.; Wang, Q.; Wang, Q. A review on experimental investigations of refrigerant/oil mixture flow boiling in horizontal channels. Appl. Therm. Eng. 2021, 196, 117270. [Google Scholar] [CrossRef]
  35. Zhang, W.; Hibiki, T.; Mishima, K. Correlation for flow boiling heat transfer in mini-channels. Int. J. Heat Mass Transf. 2004, 47, 5749–5763. [Google Scholar] [CrossRef]
  36. Fang, X.; Wu, Q.; Yuan, Y. A general correlation for saturated flow boiling heat transfer in channels of various sizes and flow directions. Int. J. Heat Mass Transf. 2017, 107, 972–981. [Google Scholar] [CrossRef]
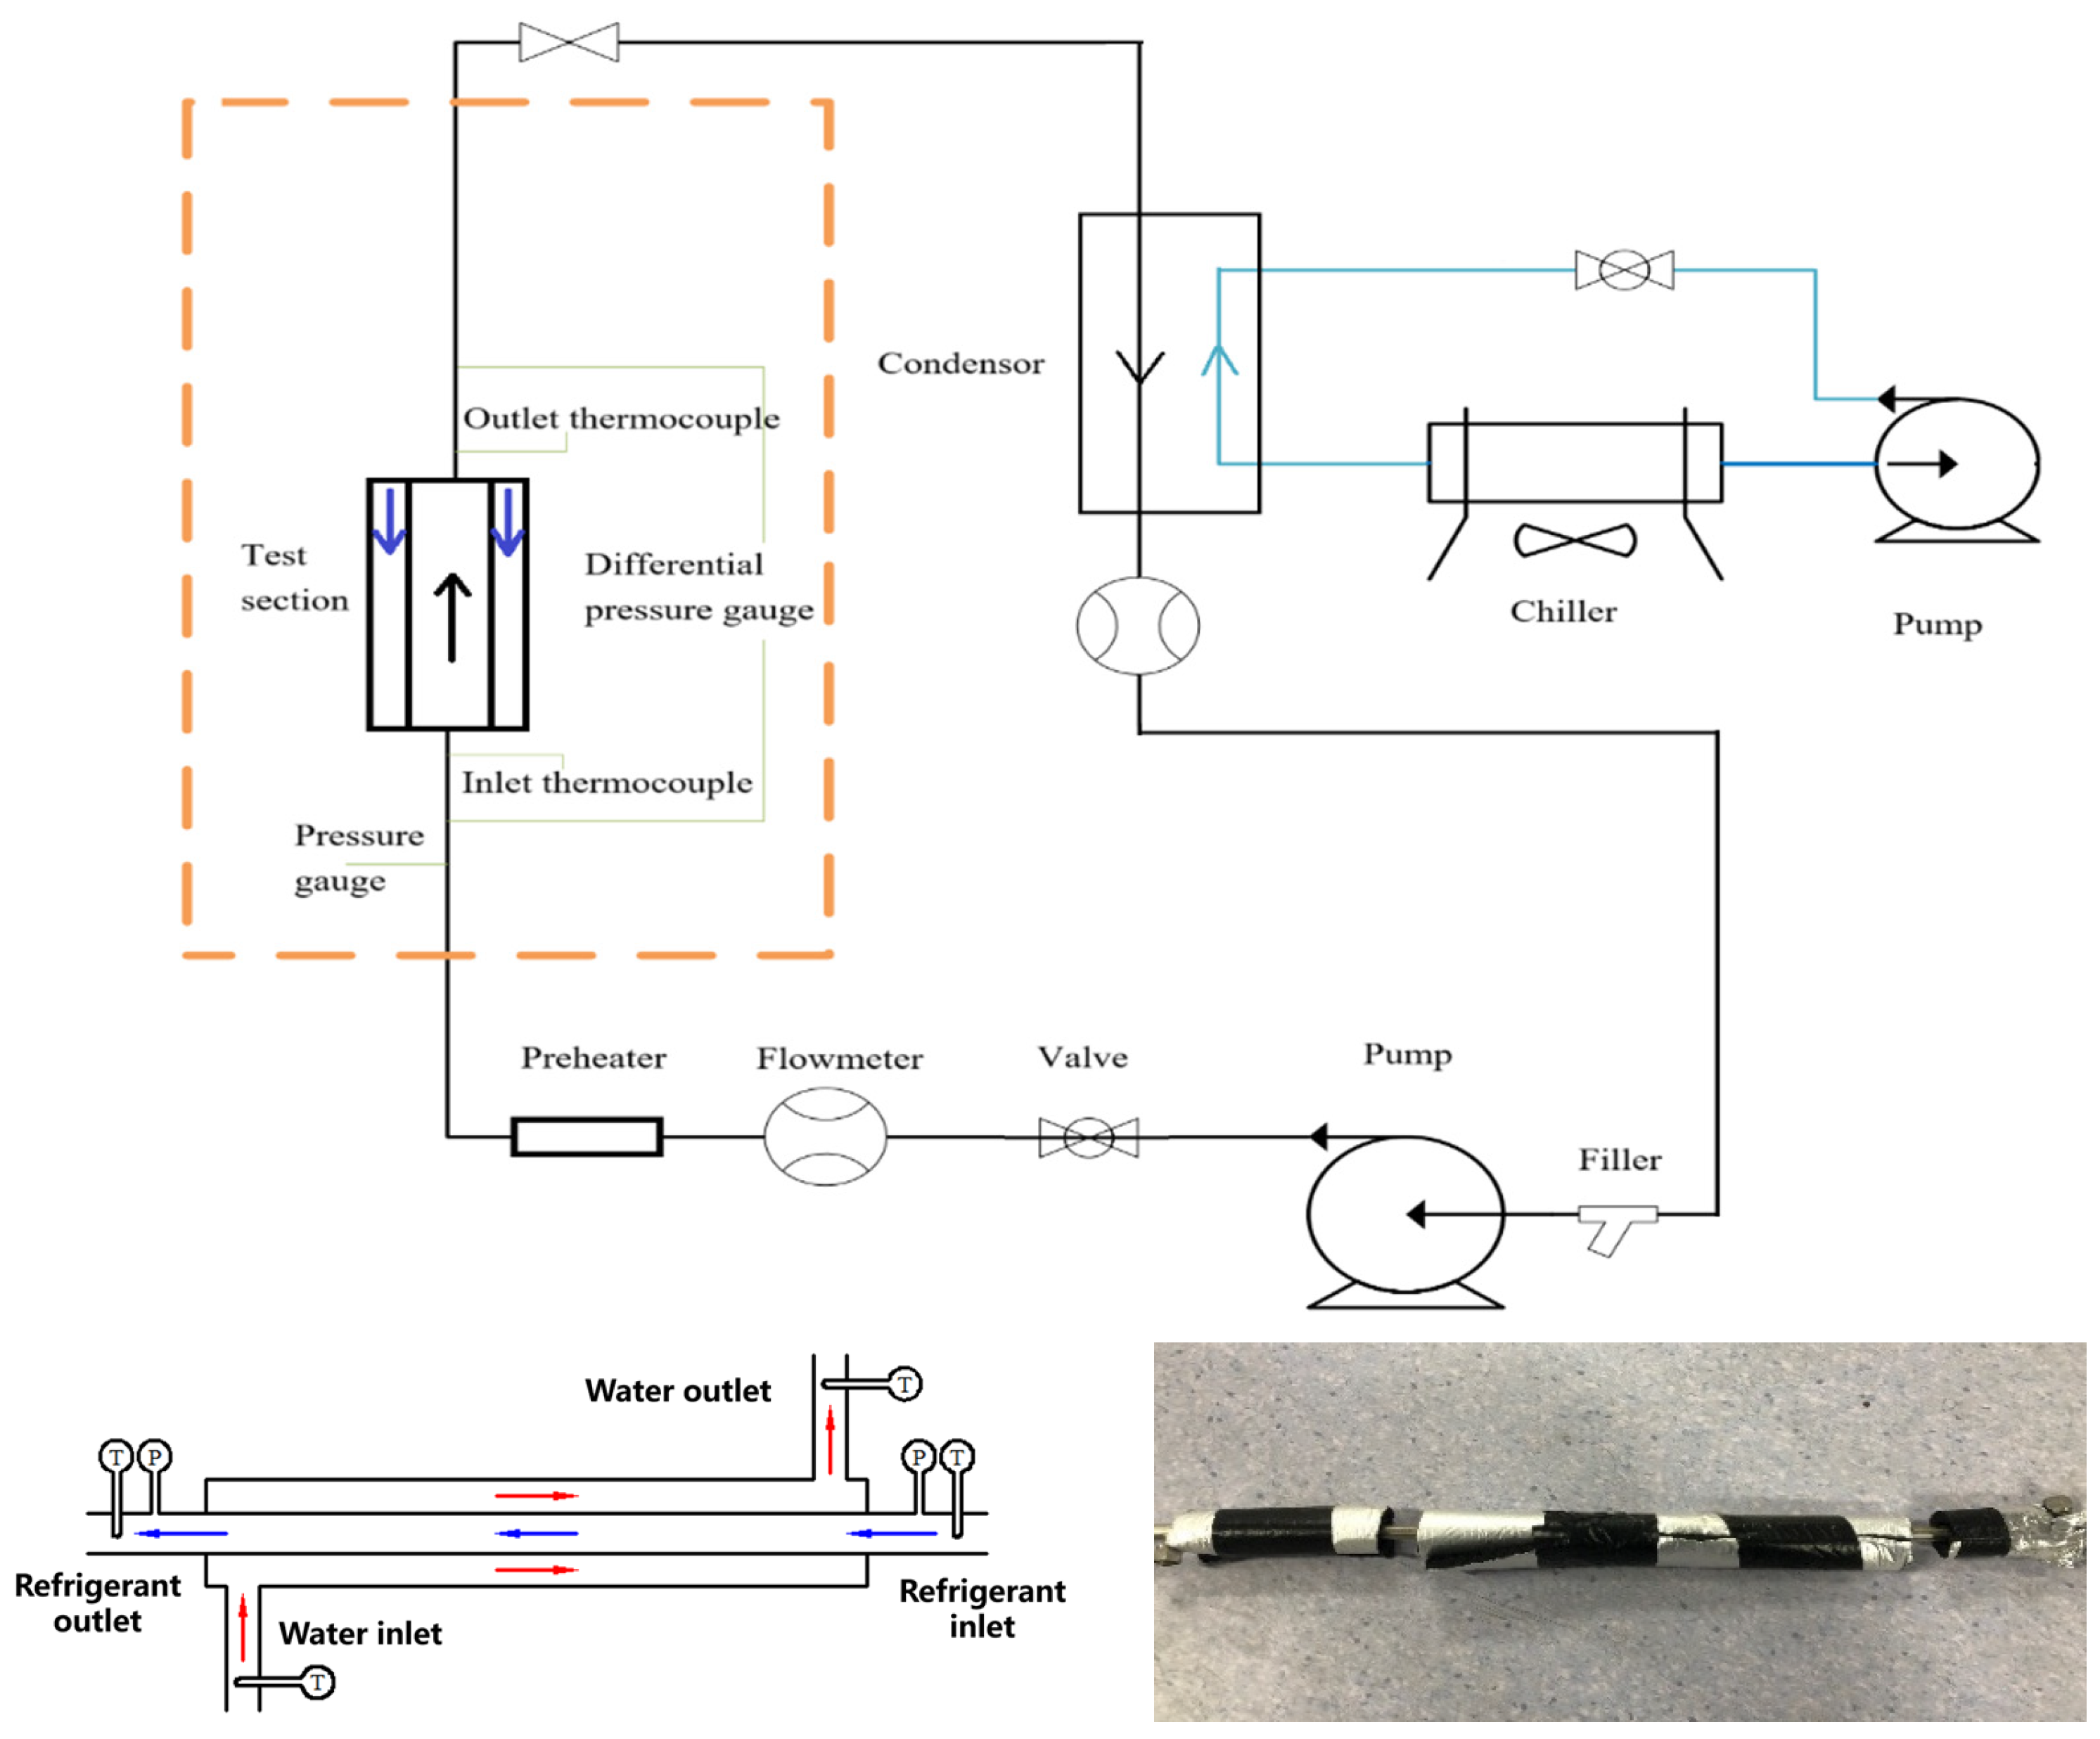
Figure 1. Schematic diagram of experimental system and experimental section.
Energies 18 05258 g001
Figure 2. The specific experimental process.
Energies 18 05258 g002
Figure 3. Changes in the boiling heat transfer coefficient of R32 refrigerant.
Energies 18 05258 g003
Figure 4. Thermophysical properties of R32 refrigerant at different temperatures.
Energies 18 05258 g004
Figure 5. Bubble generation and development at annular flow pattern.
Energies 18 05258 g005
Figure 6. Average boiling heat transfer coefficient under different pipe diameters and pipe shapes: (a) saturation temperature is 7 °C; (b) saturation temperature is 9 °C.
Energies 18 05258 g006
Figure 7. Comparison of boiling heat transfer coefficients between R32 refrigerant and R410A refrigerant: (a) data at a saturation temperature of 7 °C; (b) data at a saturation temperature of 9 °C.
Energies 18 05258 g007
Figure 8. Prediction accuracy by proposed correlation.
Energies 18 05258 g008
Table 1. Comparison of physical properties of R22, R410A, and R32.
TypeR22R410AR32
Boiling point/℃−40.8−51.5−51.7
Critical temperature/℃9672.178.1
Critical pressure/MPa4.994.935.81
FlammabilityNonflammableNonflammableLow flammability
ToxicityNothingNothingNothing
GWP17002100675
ODP0.03400
Molar mass86.4772.5852.02
Table 2. Comparison of theoretical thermal properties of R32 and R410A (at 25 °C).
TypeR410AR32Comparison/%
Suction pressure/MPa0.9981.018+2.0
Exhaust pressure/MPa3.3853.472+2.6
Pressure difference/MPa2.3872.454+2.8
Pressure ratio3.393.41+0.6
Refrigerating capacity per unit mass (kJ/kg)157.41241.04+53.1
Inspiratory specific volume0.02810.0389+38.4
Refrigerating capacity per unit volume5.5956.203+10.9
Input power per unit volume18221969+8.1
Coefficient of refrigeration3.073.15+2.6
Exhaust temperature/°C96.4118.4+22
Table 3. Information on measurement equipment.
EquipmentTypeRangeAccuracy
Flow ratesDMF-1-S30~400 kg·h−1±0.5% (R)
PressuresRosemount30510~6000 kPa±0.1% (FS)
ThermocouplesT−200~350 °C±0.5 °C
Disclaimer/Publisher’s Note: The statements, opinions and data contained in all publications are solely those of the individual author(s) and contributor(s) and not of MDPI and/or the editor(s). MDPI and/or the editor(s) disclaim responsibility for any injury to people or property resulting from any ideas, methods, instructions or products referred to in the content.