Article

Research on Primary Frequency Regulation Control Strategy of the Joint Hydropower and Battery Energy Storage System Based on Refined Model

by
Yifeng Gu
1,
Fangqing Zhang
1,*,
Youping Li
2,3,
Youhan Deng
3,4,
Xiaojun Hua
2,3,
Jiang Guo
1 and
Tingji Yang
1
1
School of Power and Mechanical Engineering, Wuhan University, Wuhan 430072, China
2
China Yangtze Power Co., Ltd., Wuhan 430010, China
3
Laboratory of Hydro-Wind-Solar Multi-Energy Control Coordination, Wuhan 430014, China
4
Institute of Science and Technology, China Three Gorges Corporation, Beijing 100038, China
*
Author to whom correspondence should be addressed.
Energies 2025, 18(19), 5249; https://doi.org/10.3390/en18195249
Submission received: 1 September 2025 / Revised: 29 September 2025 / Accepted: 1 October 2025 / Published: 2 October 2025
(This article belongs to the Special Issue Improvements of the Electricity Power System: 3rd Edition)

Abstract

This study aims to reduce reverse power and improve frequency regulation performance in hydropower systems. To achieve this objective, a refined hydropower plant (HPP) simulation model is developed and coupled with a battery energy storage system (BESS), implementing an Integrated Adaptive Virtual Droop Control (IAVDC) strategy. The refined HPP model achieves a simulation accuracy of 98.5%, representing a 26.2% improvement over conventional simplified models. With the BESS integrated under the IAVDC strategy, reverse power is completely eliminated, and frequency regulation time is substantially shortened. The results demonstrate that the joint HPP-BESS frequency regulation effectively mitigates the adverse impact of water hammer, while the proposed IAVDC strategy enhances system responsiveness and reduces frequency recovery time, thereby improving the quality of primary frequency control.

1. Introduction

With the rapid growth of wind and photovoltaic (PV) generation and the increasing demand on power grids, modern energy systems face unprecedented challenges in balancing supply and demand. Renewable energy sources are inherently intermittent and variable, causing significant fluctuations in system frequency and power flows [1,2,3]. These fluctuations create new requirements for the stability and reliability of interconnected grids. Primary frequency control is a fundamental mechanism for maintaining operational stability [4,5,6]. When the actual frequency deviates beyond a predefined deadband, generating units adjust their active power output via governor action to mitigate frequency excursions. This mechanism enables modern energy systems to respond quickly to disturbances by coordinating conventional generators, renewable sources, and control systems, ensuring high responsiveness and automation [7].
At present, thermal and hydropower generating units constitute the primary resources for frequency regulation in China. Among them, HPPs have increasingly assumed a dominant role in this domain owing to strong regulation capability, fast ramping characteristics, and environmentally friendly attributes [8]. Dash R et al. [9] developed a two-area hydro–wind complementary system and optimized the PID controller using long short-term memory networks and genetic algorithms. Meanwhile, Refs. [10,11,12] investigated load frequency control in multi-area interconnected power systems involving hydropower. However, the hydropower station models adopted in these works were simplified. According to [13], HPPs exhibit strong hydraulic–mechanical–electrical coupling characteristics. As such, simplified models fail to adequately capture the dynamic behavior during regulation, leading to a potential degradation in simulation accuracy.
The water hammer effect, resulting from the non-minimum phase characteristics of HPPs, has been identified as a detrimental factor in the process of frequency regulation [14]. Zhang et al. [15] analyzed the adverse impacts of the water hammer effect on grid voltage and frequency during the modeling and experimental validation of HPP–PV complementary systems. Han et al. [16] identified the water hammer effect as one of the primary causes of ultra-low-frequency oscillations in hydropower systems. Shu et al. [17] further proposed that the water hammer effect in HPPs can be mitigated through the integration of PV systems, thereby enhancing their frequency regulation performance.
Meanwhile, with the rapid development of energy storage technology, the application of energy storage in grid frequency regulation has attracted wide attention both domestically and internationally [18,19]. Using BESS as a case in point, an integrated control strategy enabling the joint participation of BESSs and super-capacitor energy storage systems in primary frequency regulation was proposed by Yang et al. [20]. Furthermore, Datta U et al. [21] demonstrated via simulation that BESSs can effectively contribute to grid primary frequency regulation, while simultaneously enhancing the penetration level of wind energy.
In summary, the joint regulation system of HPP–BESS proposed in this study is illustrated in Figure 1. When the balance between power generation and demand is disrupted, frequency fluctuations arise. In response, the HPP governor detects the frequency deviation and generates a control signal, which is transformed into a mechanical signal via the servo system. The signal then adjusts the guide vane opening of the turbine, thereby modulating output power of HPP to restore the supply–demand balance. Meanwhile, the BESS adjusts its output power rapidly and in real time according to the frequency deviation. The HPP and BESS jointly contribute to frequency regulation of the power system.
To further enhance the frequency regulation capability of the system, an IAVDC strategy is proposed in this paper, focusing on improving frequency regulation performance. A series of simulation experiments under various operating conditions are carried out to validate its effectiveness. The main contributions of this paper are summarized as follows:
(1)
A refined simulation model for joint frequency regulation system of HPP-BESS has been established.
(2)
The IAVDC strategy has been proposed, which effectively enhances the frequency regulation capability.
(3)
The proposed strategy has been validated through simulation experiments.
The structure of the remaining chapters is as follows. Section 2 presents the process of establishing the refined model for the HPP, including components such as the governor, servo system, waterway system, turbine, and generator. Section 3 analyzes the BESS model, IAVDC strategy, and evaluation indicators. Section 4 conducts analysis and validation through simulations. Section 5 discusses the advantages and limitations of this work. Section 6 presents the conclusions of the paper.

2. Refined Model of Hydropower Plant

2.1. Governor

The governor plays a vital role in the HPP by transforming the frequency deviation into an electrical signal Ygov, which is used to actuate the servomechanism and regulate the guide vane position of turbine. As shown in Figure 2
In order to mitigate the impact of frequent grid frequency fluctuations on the primary frequency regulation of the HPP, a frequency dead zone is generally added before the PID controller of the governor to improve system stability [22]. The associated mathematical expression is described as follows:
Δ f = 0 ε f f * ε f f * ε f f * > ε f f * + ε f f * < ε
In this context, f represents the measured frequency, f* represents the set frequency, ε denotes the value of frequency deadband, and Δf represents the frequency deviation output from the deadband.
If the absolute value of the difference between the measured frequency and the set frequency is within ε, the deadband output frequency deviation is 0, and the governor does not respond. If the difference between the measured frequency and the set frequency exceeds ε, the frequency deviation is calculated as the difference between the measured frequency and the set frequency minus the ε. If the difference between the measured frequency and the set frequency is less than −ε, the frequency deviation is calculated as the difference between the measured frequency and the set frequency plus ε. Thus, the frequency deadband output deviation will only be non-zero when the absolute value of the difference between the measured frequency and the set frequency exceeds ε, triggering the unit to perform primary frequency regulation.
The PID controller in the governor primarily receives the frequency deviation signal from the deadband and generates the control signal Ygov, as described by the following transfer function:
G G o v s = Y gov s f * s f s = K d s 2 + K p s + K i s + b p K i
Ygov(s), f(s), and f(s) represent the Laplace transforms of the governor output signal Ygov, f*, and f, respectively. bp is the steady-state slip coefficient, and s denotes the Laplace operator, while Kp, Ki, and Kd are the proportional, integral, and derivative gains, respectively.

2.2. Servo System

The servo system converts and amplifies the governor output signal Ygov into a corresponding mechanical signal to adjust the turbine guide vane opening. Its structure is depicted in Figure 3.
K1 represents the gain coefficient of the integrated amplifier, K2 is the gain coefficient of the electro-hydraulic converter, T1 is the response time constant of the auxiliary relay, T2 is the response time constant of the main relay, and K3 is the internal feedback gain coefficient.
G s e r v o = Y ( s ) Y g o v ( s ) = K 1 K 2 T 1 T 2 s 2 + ( K 1 K 2 K 3 ) s + K 1 K 2 T 1 T 2

2.3. Waterway System

In this paper, an approximate elastic water hammer model is used to describe the waterway system, with the following transfer function:
G h ( s ) = T w s 0.125 T r 2 s 2 + 1
Tw is the flow inertia time constant, and Tr represents the duration of the water hammer effect.

2.4. Turbine

As the core component of the HPP, the hydraulic turbine plays a crucial role in converting water flow energy into mechanical energy. Its dynamic characteristics are typically described by the discharge characteristic equation and the torque characteristic equation [13], as shown below:
M = M ( N , H , Y ) Q = Q ( N , H , Y )
M, Q, H, N, and Y correspond to the torque, discharge, water head, speed, and guide vane opening of the turbine, respectively. Because of its complex internal flow dynamics, the above equations do not have a well-defined analytical solution. A Taylor series expansion of Equation (5) is carried out in the vicinity of the equilibrium point, with the higher-order terms discarded to obtain an approximate linearized form, as given below.
m t = e n n t + e h h t + e y y t q t = e q n n t + e q h h t + e q y y t
In the equation, mt denotes the relative deviation of turbine torque, qt denotes the relative deviation of turbine discharge, ht denotes the relative deviation of turbine head, nt denotes the relative deviation of rotational speed, and yt denotes the relative deviation of guide vane opening; e h = m t / h t , e n = m t / n t , and e y = m t / y t represent the transfer coefficients of turbine torque with respect to head, rotational speed, and guide vane opening, respectively; e q h = q t / h t , e q n = q t / n t , and e q y = q t / y t represent the transfer coefficients of turbine discharge with respect to head, rotational speed, and guide vane opening, respectively.
Assuming that the hydraulic turbine operates under rated conditions and that speed variations are negligible (thus the influence of speed is ignored), the calculated values of the turbine transfer coefficients are as follows:
e y = 1 , e h = 1.5 , e q y = 1 , e q h = 0.5
When the penstock system is represented by a rigid model, the classical simplified hydraulic turbine model can be expressed as follows:
G t ( s ) = 1 T w s 1 + 0.5 T w s
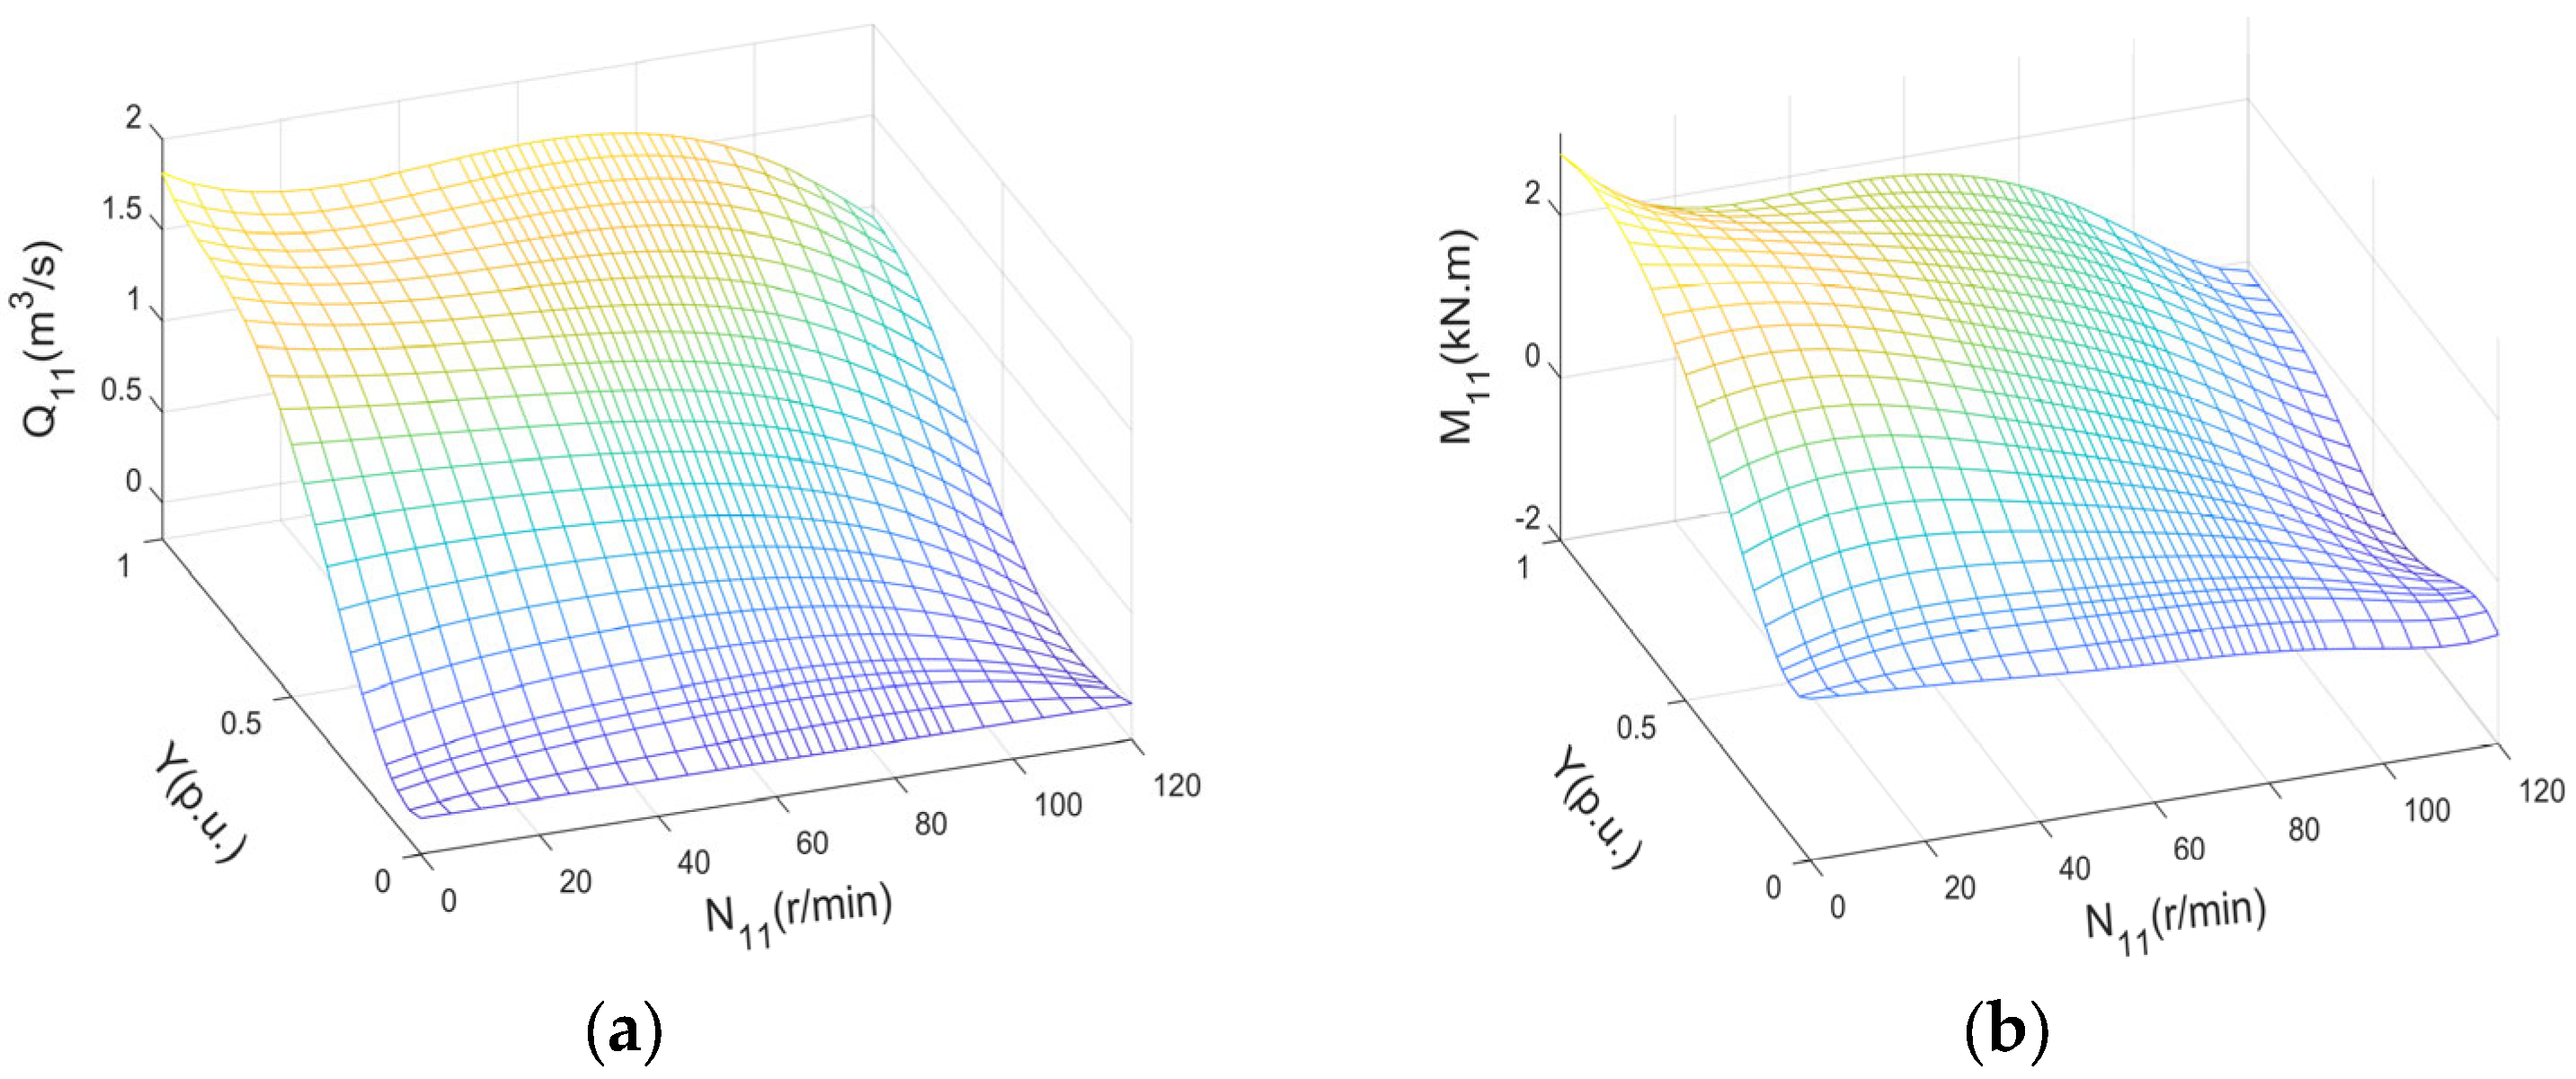
Equation (8) has been widely adopted in the modeling of frequency control in multi-energy systems; however, it only captures the classical characteristics of hydraulic turbines, failing to accurately represent turbine behavior under varying operating scenarios, thus introducing modeling inaccuracies. Hence, this paper adopts interpolation to construct the nonlinear model shown in Figure 4.
The input signals of the model are the guide vane opening Y and unit speed N11, with the output signals being unit flow rate Q11 and unit torque N11. The calculation method is as follows:
M 11 = M D 3 H ,   Q 11 = Q D 2 H ,   N 11 = N D 1 H

2.5. Generator

Since the generator model is only concerned with active power and frequency regulation, it can be described by Equation (10).
G g ( s ) = N ( s ) M ( s ) M l ( s ) = 1 T a s + e n
Here, Ml denotes the load torque, en represents the comprehensive self-regulation coefficient of the unit, and Ta is the inertia time constant of the unit, which is calculated as follows:
T a = 2 H
In Equation (11), H denotes the equivalent inertia of the system.

3. Control Strategy

3.1. Model of the Battery Energy Storage System

To enable the study of the amplitude–frequency characteristics of BESS during the frequency regulation process, the simulation model of BESS is divided into two components: the power conversion model and the SOC computation model, as follows:
  • Power conversion model
In this paper, a first-order inertia element is used to describe the external characteristics of the energy storage system participating in the power grid, as represented by the following equation:
G b ( s ) = 1 1 + T b s
Tb represents the time constant of the power conversion unit of BESS.
2.
SOC computation model
SOC indicates the available status of the remaining charge. Managing SOC is critical for the long-term participation of BESS in frequency regulation. The SOC calculation model developed in this paper is depicted in Figure 5.
The change in power of BESS is integrated to obtain the energy change, which is then divided by the rated capacity of the storage (Sn) to calculate the change in Soc, where Socov represents the initial capacity of the energy storage system.
The full simulation model of HPP–BESS is depicted in Figure 6. When the active power in the system becomes imbalanced with the load, the system frequency will change. The change in frequency triggers the governor to operate, adjusting the turbine guide vane opening and thus altering the output of the HPP. On the other hand, the BESS output is modified through the energy storage controller. Both the HPP and the BESS adjust their power outputs concurrently to achieve primary frequency regulation in the grid.
In the figure, Ph denotes the power of the HPP, Pbref and Pb denote the target power and actual power of the BESS, respectively, and Pl represents the load in the current system.

3.2. Integrated Adaptive Virtual Droop Control Strategy

The conventional control approach for the BESS involves simulating the droop characteristics of the generator unit to participate in primary frequency regulation, referred to as the virtual droop control strategy [20]. The expression is as follows:
P b , d ( s ) = K a Δ f ( s )
Ka represents the droop coefficient of the BESS.
Owing to the fixed droop coefficient, conventional droop control cannot effectively respond to varying system operating states. To address this limitation, a comprehensive droop control strategy is developed in this study, integrating virtual inertia control for enhanced adaptability and enabling SOC-based adaptive adjustment of the droop coefficient to ensure fast frequency regulation of the system.
1.
Virtual inertia control (VIC)
To improve the responsiveness of the BESS to system frequency deviations, the VIC element is introduced. When significant frequency fluctuations occur, the charging or discharging power of the BESS is increased to quickly counteract the deviation. In contrast, when the deviation is small, the output is reduced, thereby shortening the frequency recovery time. The corresponding calculation is given in Equation (14).
P b , i ( s ) = I b Δ f Δ t ( s )
Ib represents the virtual inertia coefficient.
2.
Adaptive virtual droop control
The adaptive droop control component adjusts the droop coefficient Kb based on variations in SOC, as illustrated in Figure 7 below. The formulas for calculating Kb during the charging and discharging processes are provided in Equations (15) and (16), respectively.
  • Discharging condition
K b = 0 , S oc ( 0 , S oc , min ) K b , max 2 S oc S oc , min S oc , ref S oc , min 2 , S oc ( S oc , min , S oc , ref ) K b , max 1 1 2 S oc S oc , max S oc , ref S oc , max 2 , S oc ( S oc , ref , S oc , max ) K b , max , S oc ( S oc , max , 1 ]
  • Charging condition
K b = K b , max , S oc ( 0 , S oc , min ) K b , max 1 1 2 S oc S oc , min S oc , ref S oc , min 2 , S oc ( S oc , min , S oc , ref ) K b , max 2 S oc S oc , max S oc , ref S oc , max 2 , S oc ( S oc , ref , S oc , max ) K b , max , S oc ( S oc , max , 1 ]
Kb,max denotes the maximum value of the droop coefficient, and Soc,min, Soc,max, and Soc,ref represent the minimum, maximum, and reference values of the SOC, respectively.
The overall expression for the integrated adaptive virtual droop control strategy is as follows:
P b r e f ( s ) = P b , i ( s ) + P b , d ( s ) = I b Δ f Δ t ( s ) K b Δ f ( s )

3.3. Evaluating Indicator

For the joint frequency regulation system of the HPP and BESS, three indicators will be used to evaluate the frequency regulation performance: reverse regulation power, regulation time, and integral quantity of electricity.
1.
Reverse regulation power Pre
Due to the “water hammer effect” of the HPP, during the initial phase of primary frequency regulation, the HPP generates power in the direction opposite to the target power, which is referred to as reverse regulation power Pre. The greater the reverse regulation power Pre, the higher the risk of the system losing balance and exceeding the frequency limits.
2.
Regulation time Ts
The regulation time Ts is defined as the time from when the system frequency deviation crosses the dead zone until the unit’s regulation stabilizes. In China, for example, the primary frequency regulation time for HPPs is required to be no longer than 24 s.
3.
Integral quantity of electricity IQE
IQE is an important indicator used by grid dispatching agencies to evaluate the regulation capability of power generation units [22]. The IQE calculation method used in this paper is presented in Equation (18).
H i = t 0 t t P t P 0 3600 d t
Hi: Practical integral quantity of electricity.
t0: The time when the system frequency surpasses the dead zone for the primary frequency regulation action of HPP.
tt: The time when the system frequency enters the dead zone for the primary frequency regulation action of HPP.
Pt: The actual active power output at time t.
P0: The actual active power output at time t0 (taken as the average value over the 3 s prior to t0).
If the system frequency does not recover to the primary frequency regulation dead zone within 60 s, the integration time is set to 60 s.

4. Results

This section conducts simulation analyses based on the primary frequency regulation model of the joint hydropower and battery energy storage system established earlier. In Section 4.1, the accuracy of the hydropower simulation model is validated and compared with that of a simplified model. In Section 4.2, under a sudden load increase, the performances of three scenarios—without BESS, with conventional virtual droop control, and with the proposed integrated adaptive virtual droop control—are compared. In Section 4.3, the robustness of the proposed strategy is verified by varying different values of Tw. In Section 4.4, the superiority of the proposed strategy is further confirmed under conditions of continuous load variation.
In this study, the hydropower system is assumed to be the sole primary energy source in the region, with the key parameters of the hydropower and energy storage models summarized in Table 1 and Table 2, respectively. All simulations were conducted in MATLAB/Simulink (R2023a, MathWorks Inc.), which provides a flexible environment for modeling dynamic systems and implementing control strategies. The refined HPP and BESS models, as well as the proposed IAVDC algorithm, were built within this platform to ensure accurate numerical computation and reproducible results.

4.1. Analysis of HPP Model Accuracy

To validate the accuracy of the hydropower system modeling, this study utilizes actual operational data from a domestic hydropower plant as a reference. The simulation results obtained from the proposed refined model and the conventional simplified model—whose structure and parameters are presented in Equation (8)—are compared, with the comparison results illustrated in Figure 8.
In Figure 8, the simulation spans 700 s, during which the turbine power increases in stages from 37% to 69%. The red curve represents the measured data, the blue curve depicts the simulation results of the refined model developed in this study, and the green curve shows those of the simplified model. As the simplified model is derived by linearizing the system around a specific operating point, it retains relatively high accuracy only in the initial phase of the simulation; at subsequent stages, its deviation from the measured data progressively enlarges.
To quantitatively assess the accuracy of the hydropower model, the accuracy evaluation formula is defined as follows:
δ = 1 1 N i = 1 N ( P s i m P r e a l ) 2 * 100 %
In this formula, δ denotes the model accuracy, N represents the number of samples, Psim corresponds to the simulated data, and Preal corresponds to the measured data. Based on the calculation, the refined hydropower model achieves an accuracy of 98.5%, whereas the simplified model reaches only 72.3%.

4.2. Analysis of System Response Under Load Increase

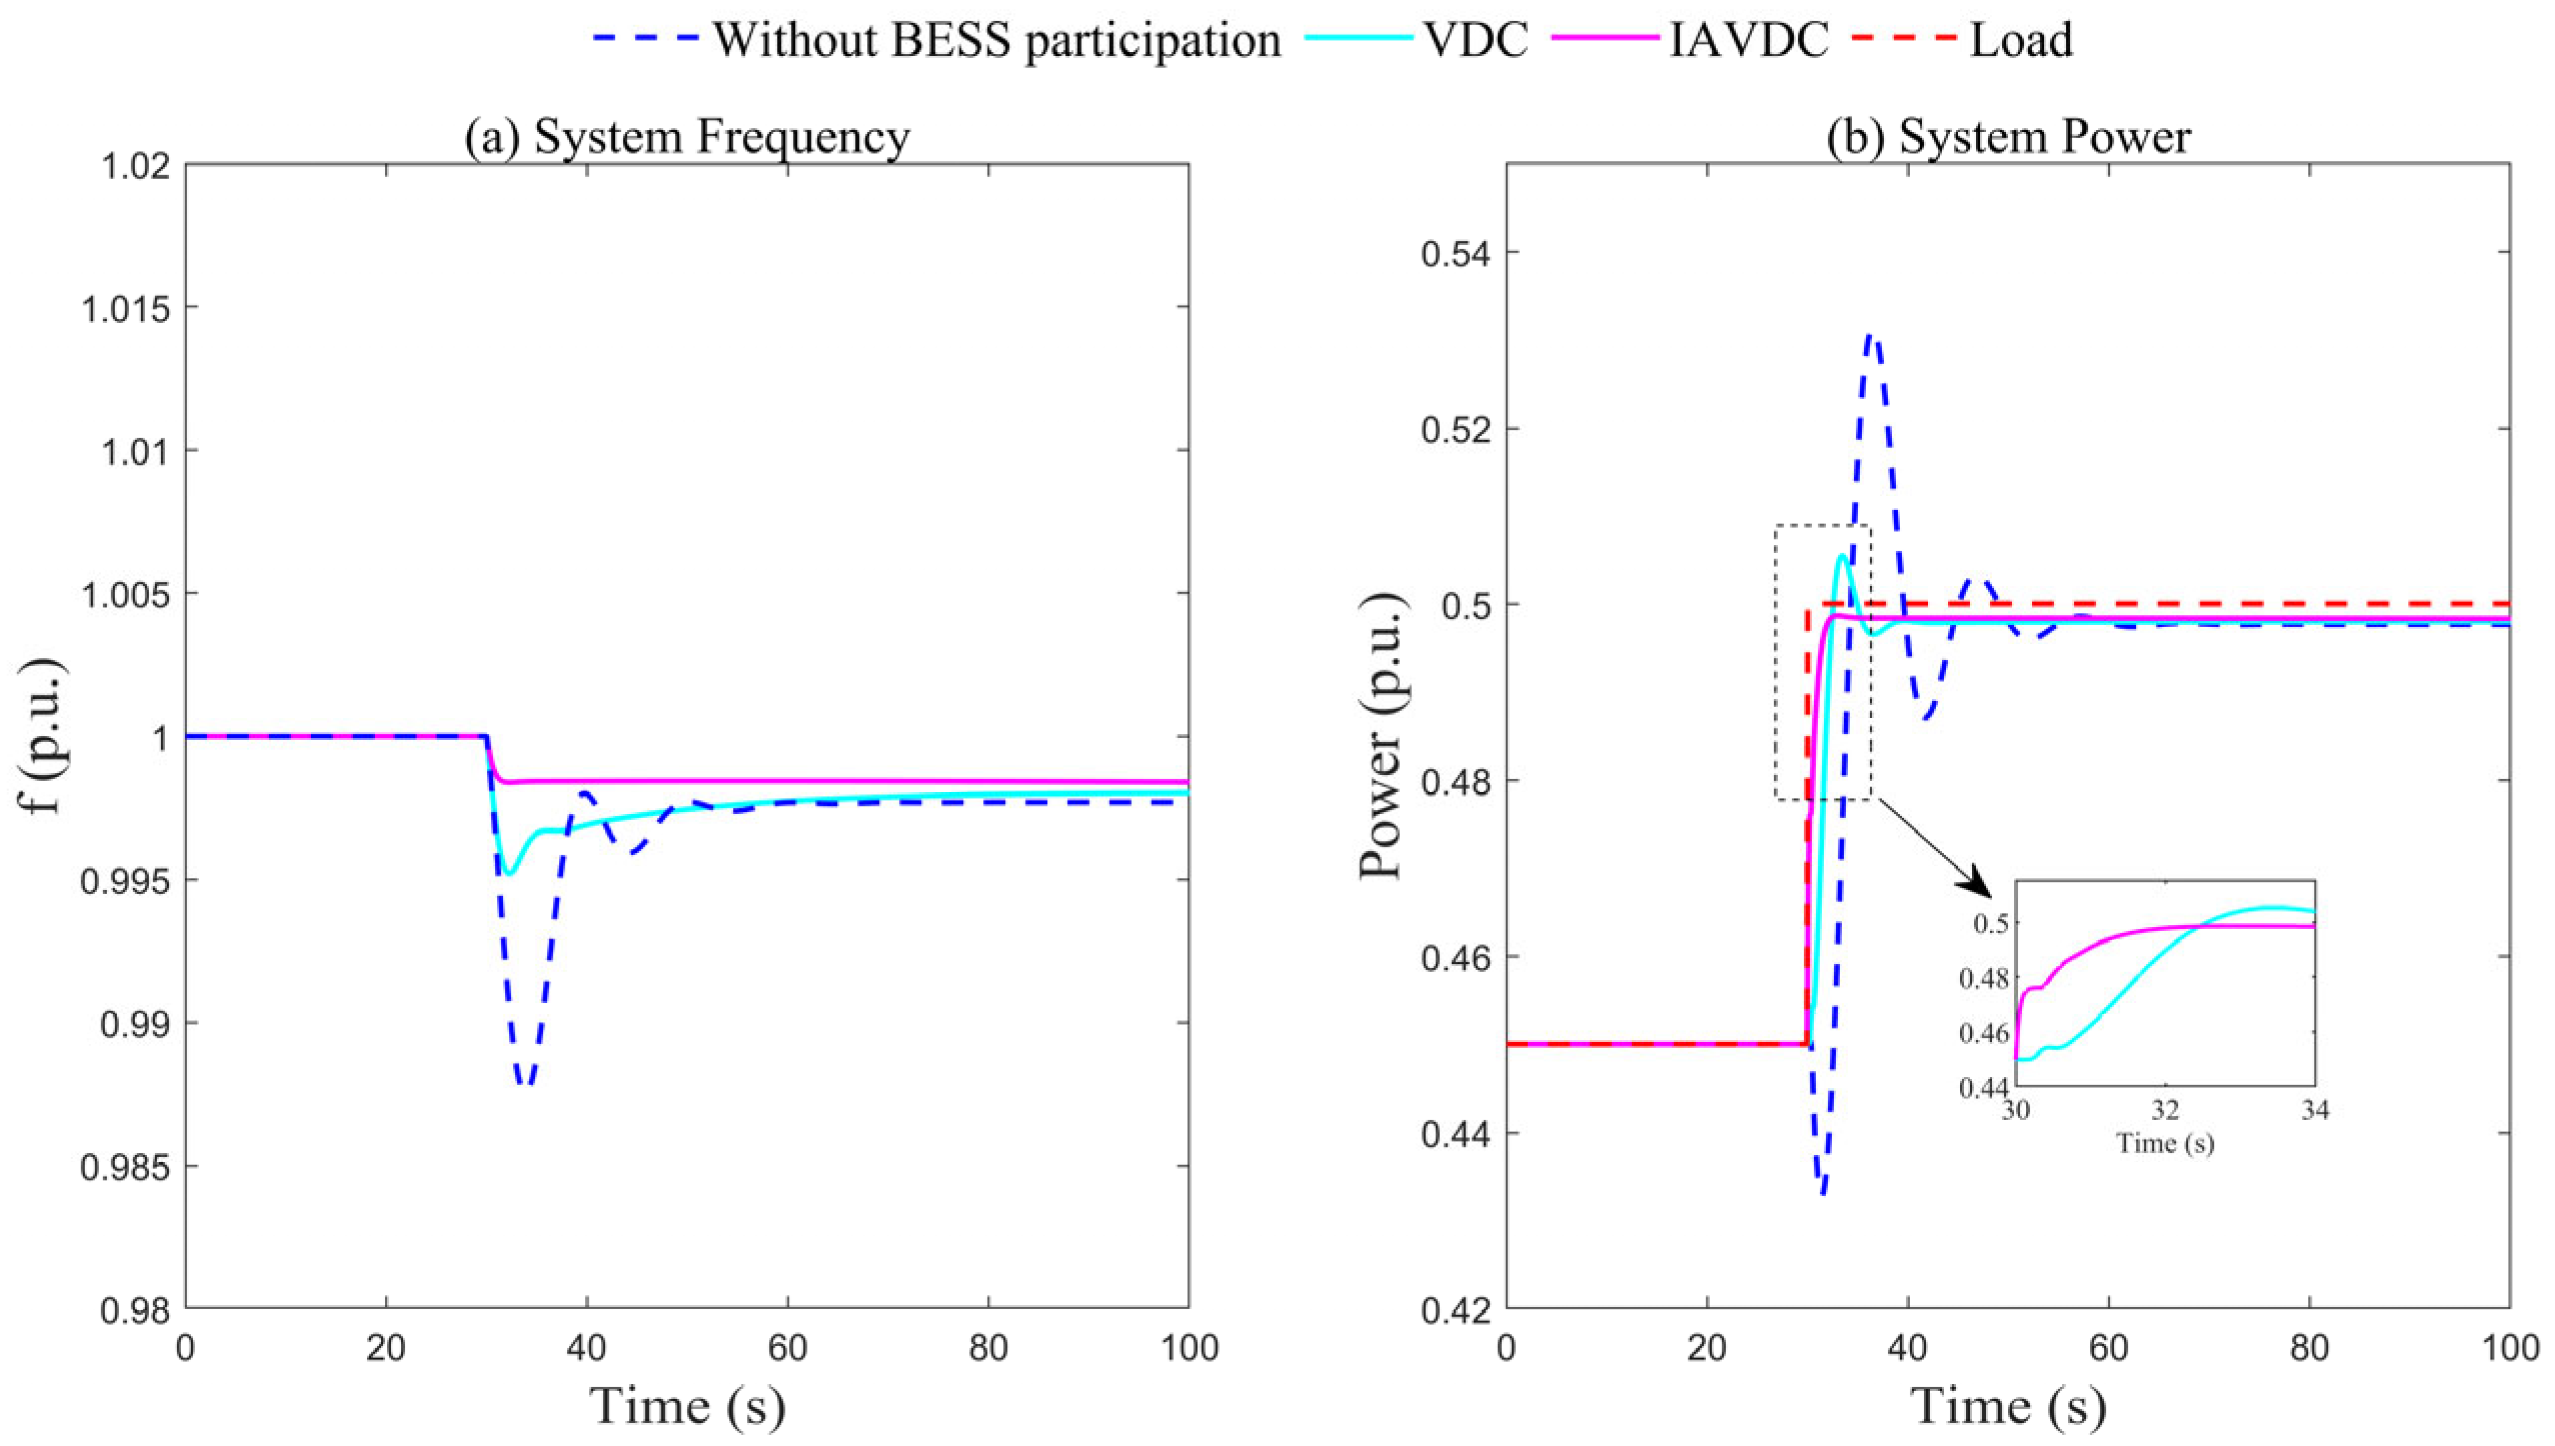
At 30 s, the system load is abruptly increased from 0.45 to 0.5. The simulation results under three scenarios—without BESS, with BESS operating under the VDC strategy, and with BESS operating under the IAVDC strategy—are compared in terms of system frequency and total power output, as illustrated in Figure 9.
Based on the results shown in Figure 9, after the integration of the BESS, the system’s reverse power is completely eliminated at 30 s, and the frequency reaches the dead zone more quickly. Due to the incorporation of the virtual inertia component, the IAVDC strategy enables faster system power regulation with reduced overshoot, as illustrated by the purple curve in Figure 9.
The detailed evaluation results are presented in Table 3. For conventional hydropower, the reverse power caused by the water hammer effect reaches 14.884 MW, whereas it is completely eliminated after integrating the BESS. Under the same operating condition, the regulation time of conventional hydropower is 23.385 s, barely meeting the frequency regulation requirement, with an integral quantity of electricity (IQE) of 658.620 kW·h. By contrast, with the proposed IAVDC strategy, the regulation time is shortened to only 1.846 s, and the IQE is increased to 792.036 kW·h, indicating a substantial enhancement in primary frequency regulation performance.

4.3. System Response to Sudden Load Decrease Under Different Parameters

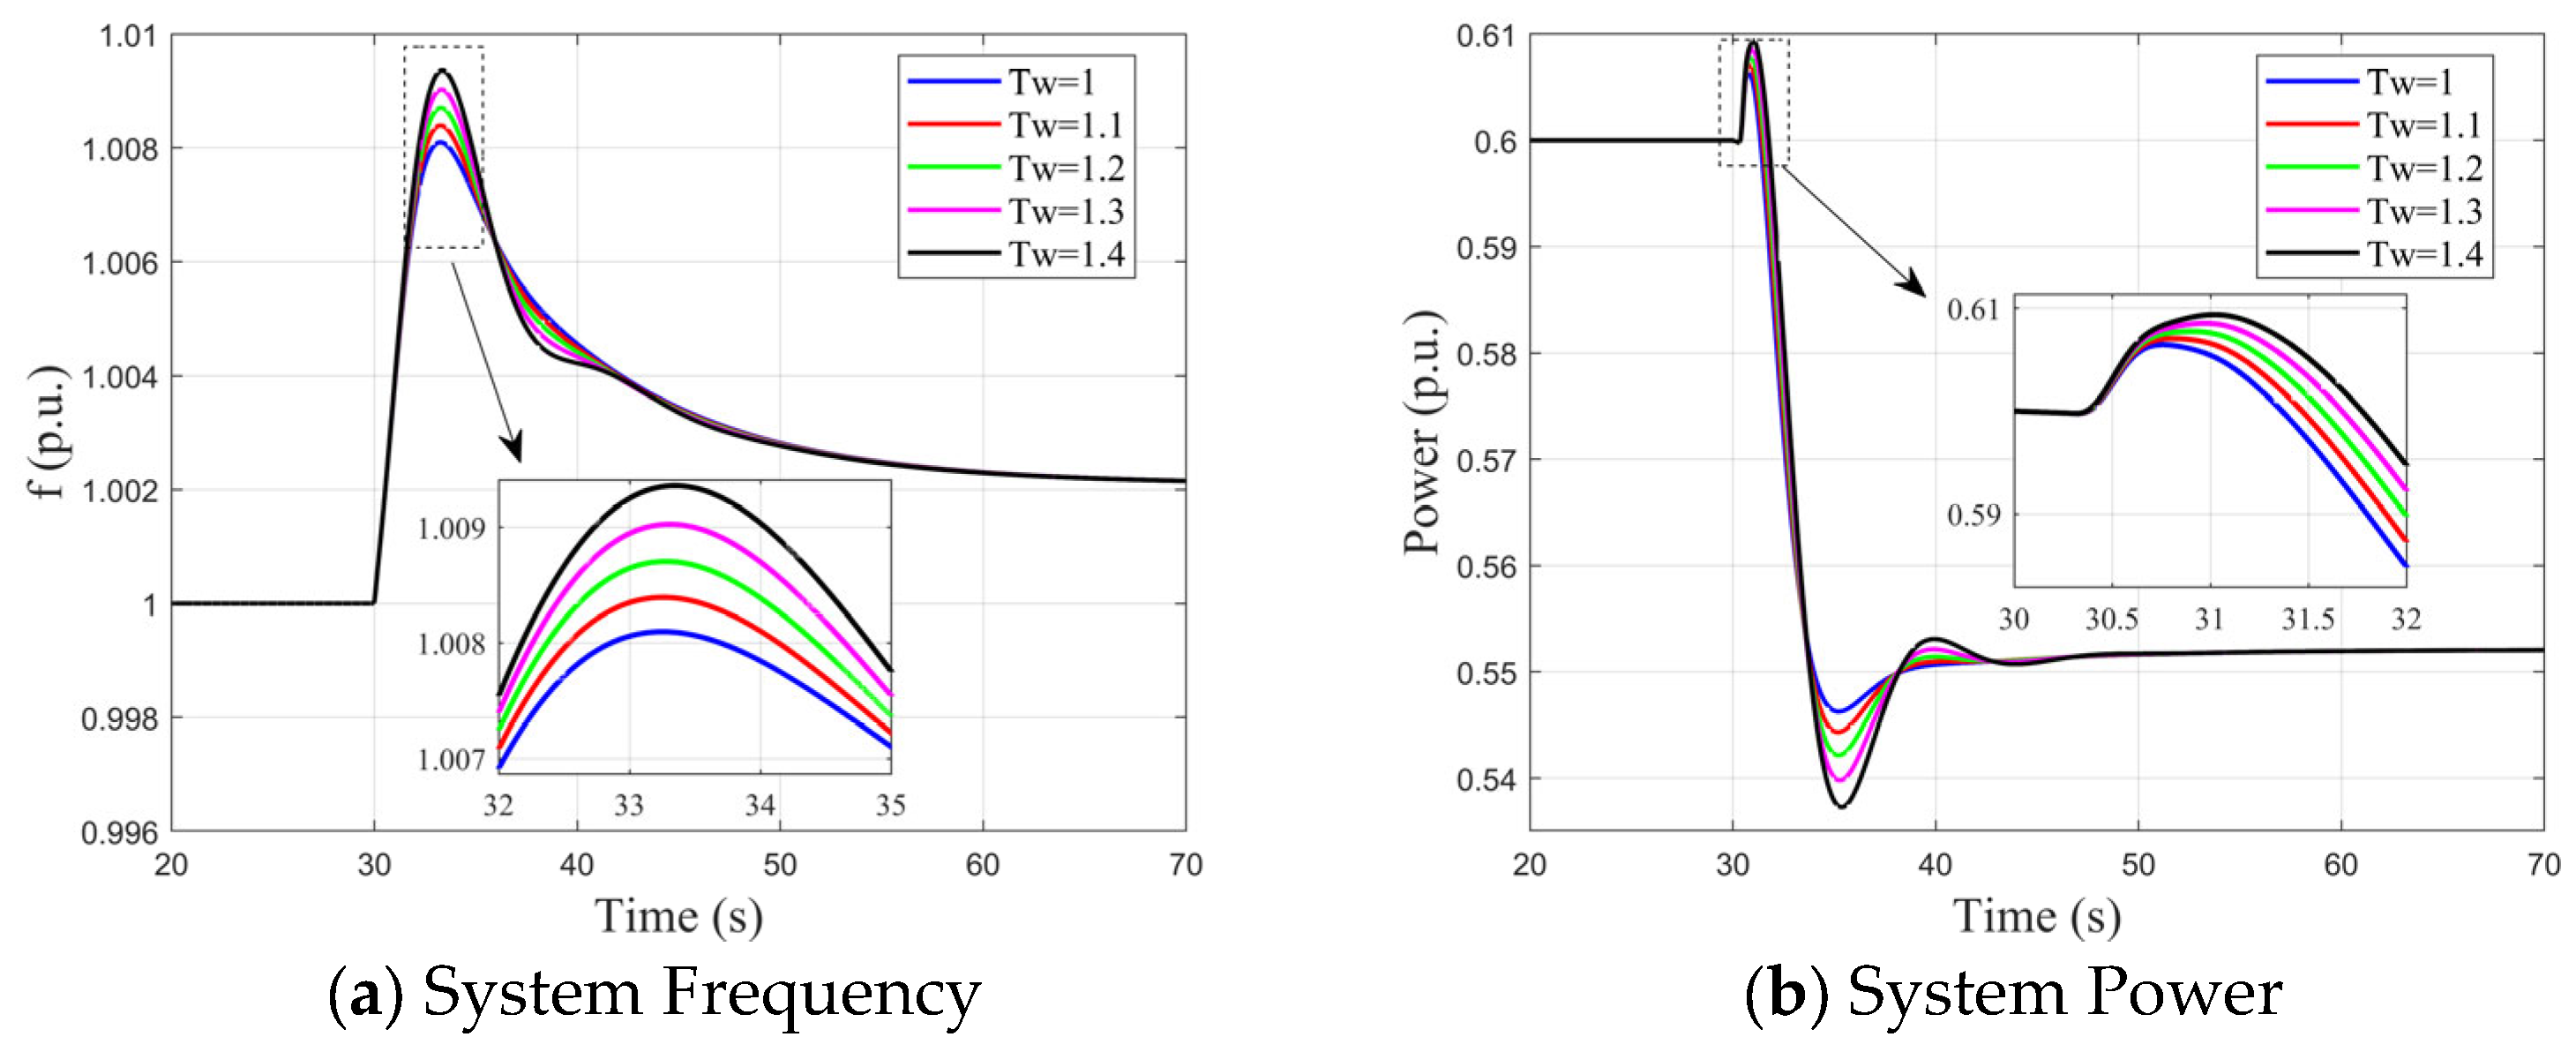
The system frequency and power response under a sudden load decrease are also of critical importance. In this section, the system load is abruptly reduced from 0.6 p.u. to 0.55 p.u. at 30 s. To further verify the robustness of the proposed strategy, comparative simulations are conducted under different Tw values for three cases: without BESS, with the VDC strategy, and with the IAVDC strategy. The corresponding results are presented in Figure 10, Figure 11 and Figure 12.
Figure 10 illustrates the frequency and power response of the system without BESS participation. Since Tw represents the water flow inertia time constant, a larger Tw indicates stronger water inertia, which results in more pronounced reverse power, prolongs the regulation time, and increases the risk of system oscillations. Figure 11 and Figure 12 present the system responses after the integration of BESS under the VDC and IAVDC strategies, respectively. The introduction of BESS eliminates the occurrence of reverse power, allowing the system power to directly adjust in the desired direction and significantly accelerating the regulation process. Moreover, the IAVDC strategy takes into account both system frequency and BESS power, enabling adaptive adjustment of the control action. Consequently, the system exhibits a smaller frequency deviation—only 0.0017 p.u.—and achieves a shorter regulation time.
The averaged evaluation results under varying values are also summarized in Table 4. Without BESS participation, larger Tw values lead to more severe reverse power and longer regulation times, thereby exacerbating system oscillations. In contrast, when the BESS is introduced, reverse power is fully eliminated, and the regulation time is consistently reduced. Specifically, with the proposed IAVDC strategy, the average regulation time is reduced to 3.214 s, compared with 22.147 s for conventional hydropower, while the average IQE is increased from 633.452 kW·h to 780.335 kW·h. These results further verify the robustness and superior performance of the proposed strategy under different hydraulic conditions.

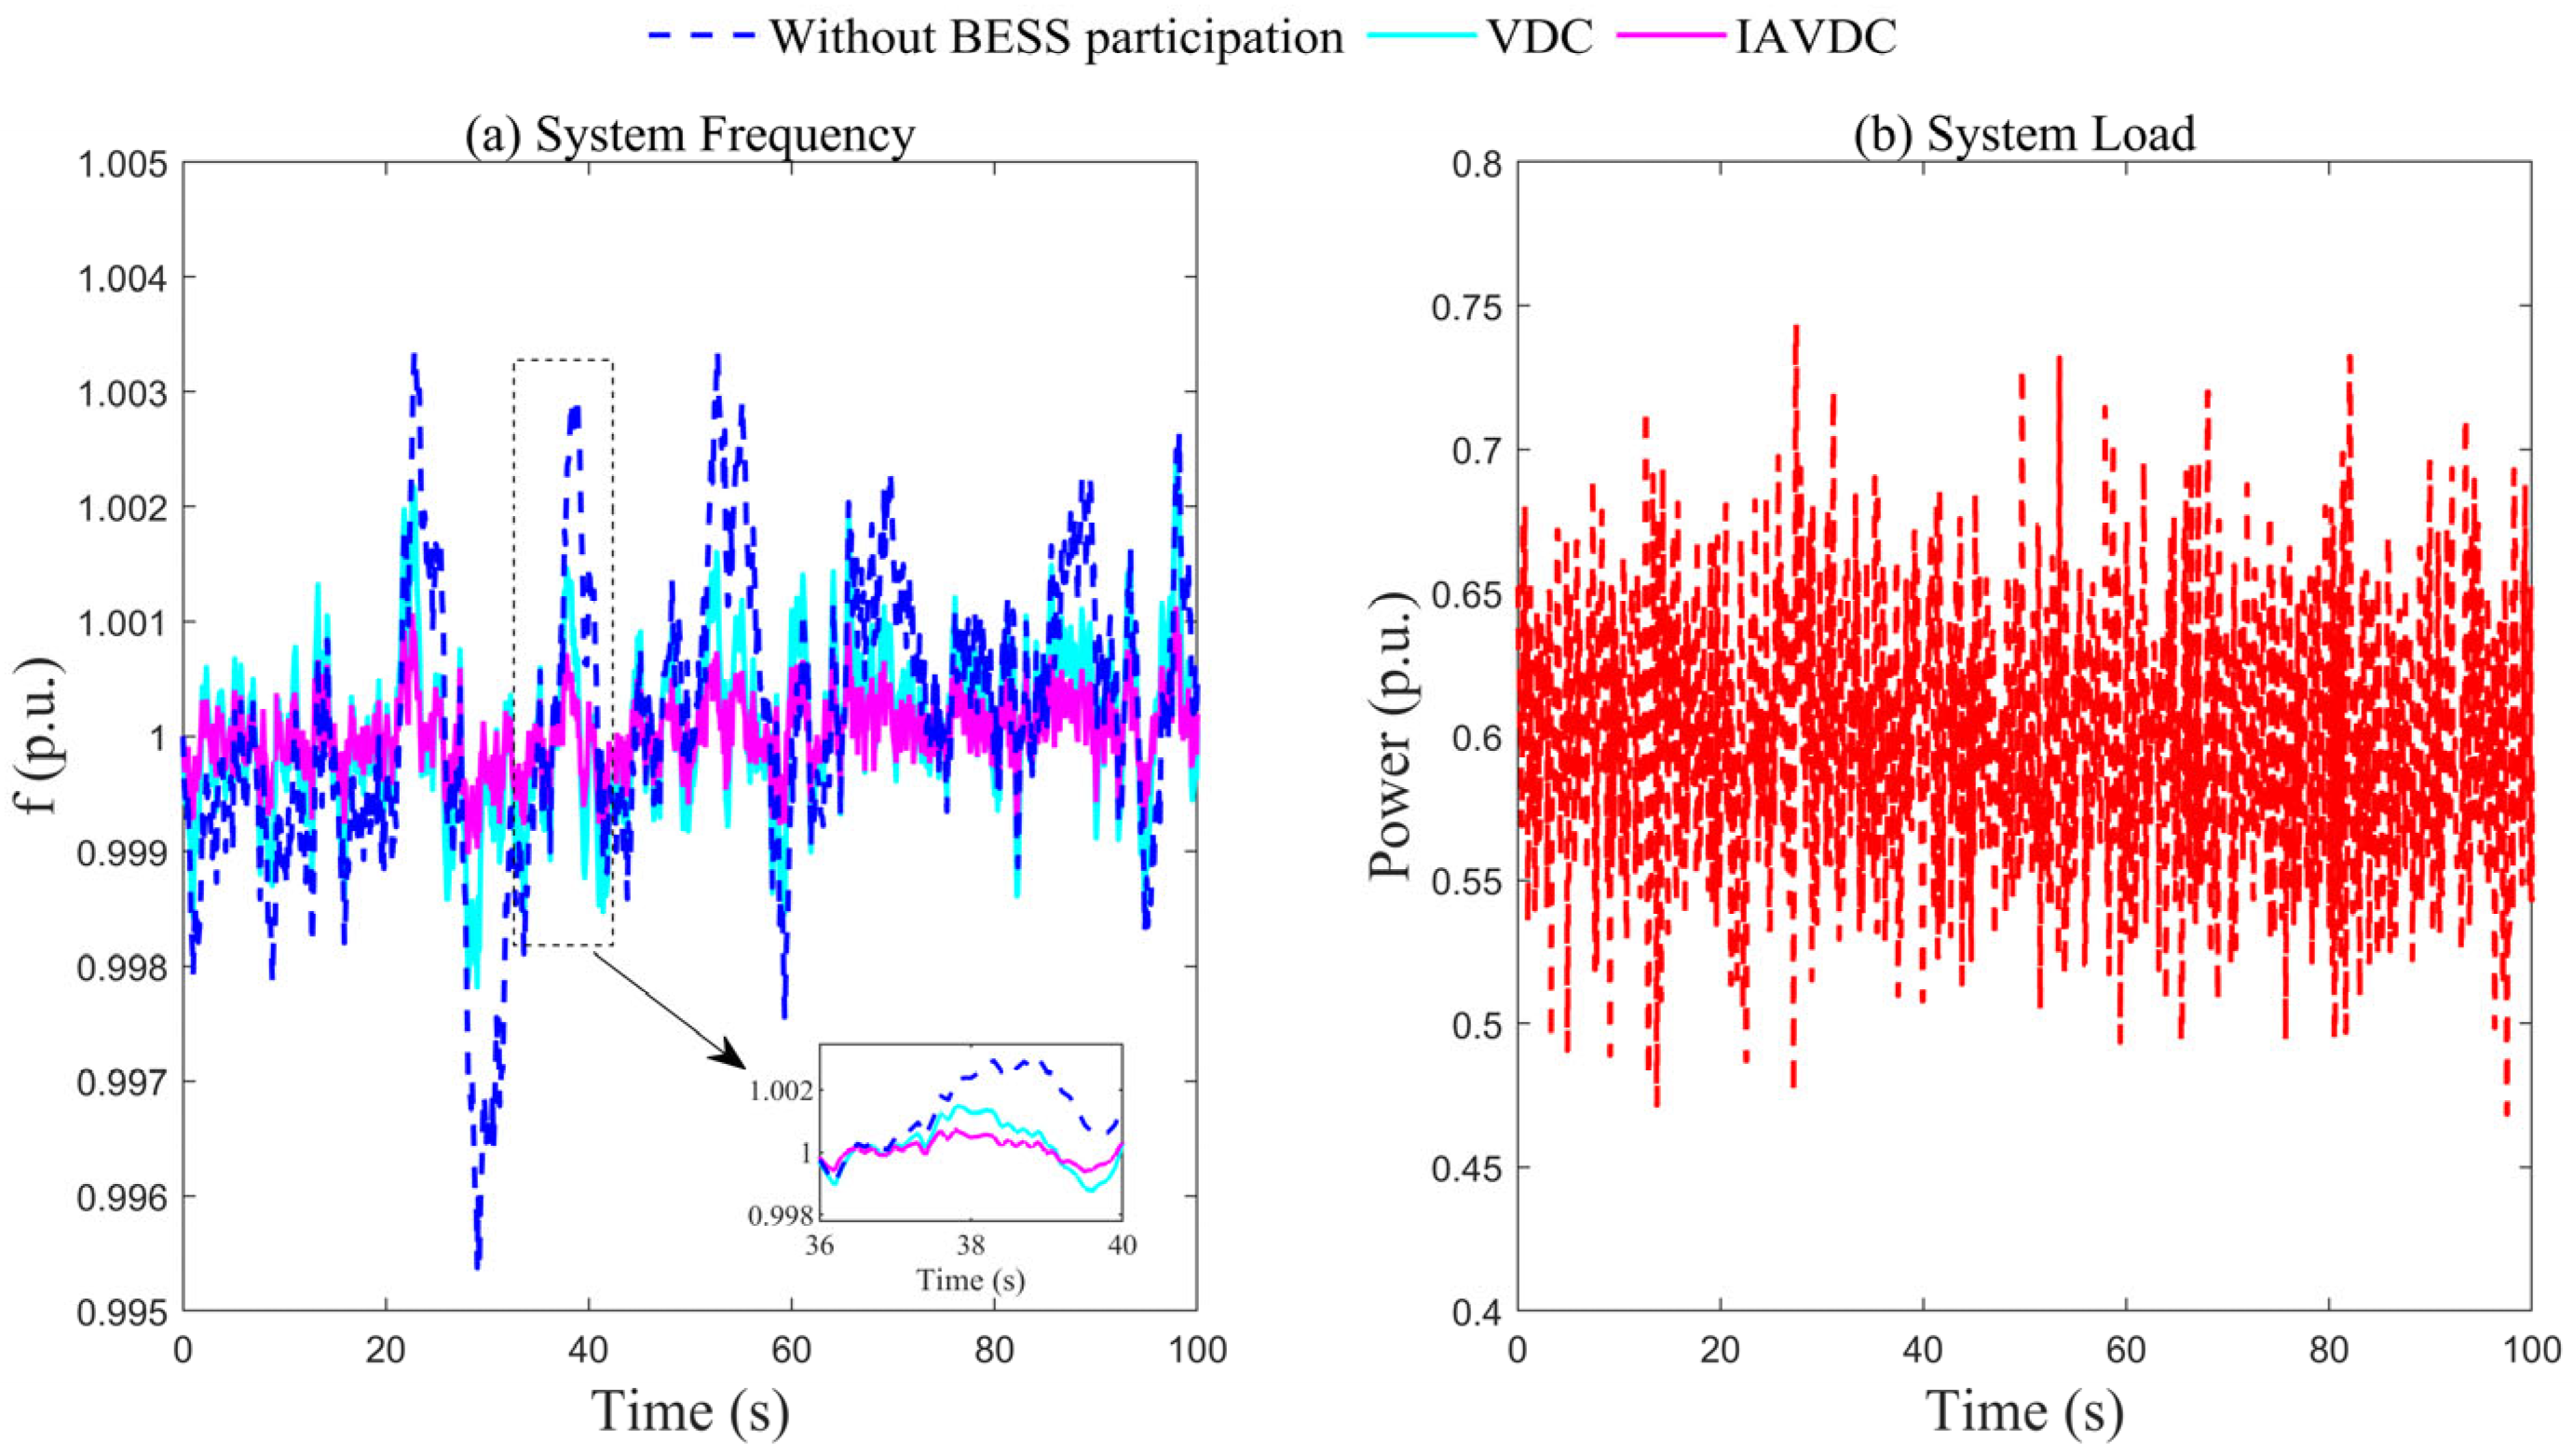
4.4. Analysis of System Response Under Continuous Load Variation

To realistically simulate continuous load variations and enhance the reliability of this study, the system response under continuously changing load conditions is analyzed, as illustrated in Figure 13. The load varies continuously between 0.48 p.u. and 0.74 p.u. Figure 13a shows the corresponding system frequency variations. When the BESS is not engaged, the system frequency fluctuates in accordance with the load, with a maximum deviation of 0.0047 p.u. After the integration of the BESS, the frequency fluctuations are significantly mitigated. In comparison with the VDC strategy, the implementation of the IAVDC strategy further stabilizes the system frequency, demonstrating superior frequency regulation performance.

5. Discussion

The control strategy for joint primary frequency regulation of the HPP–BESS has been evaluated through comprehensive simulation analyses. The results demonstrate that the proposed method offers the following advantages:
(1)
Mitigation of power reversal: The integration of the BESS effectively suppresses the reverse power induced by the water hammer effect of the HPP, thereby reducing the risk of frequency violations.
(2)
Enhanced frequency regulation performance: Under abrupt load variations, the IAVDC strategy enables faster regulation response and achieves a higher cumulative energy contribution.
Nevertheless, several limitations of this study should be acknowledged:
(1)
Flexible coordination and system stability: In the present study, the HPP and BESS operate simultaneously during primary frequency regulation. Future work could develop a more adaptive coordination mechanism, allowing the BESS to operate independently under minor frequency deviations while triggering joint operation only under significant deviations [23]. This would minimize HPP regulation losses, improve response speed, and further investigate long-term dynamic stability and damping characteristics, including low-frequency oscillation behavior [24,25].
(2)
Validation against advanced control methods and converter strategies: Although the current study relies on simulations, future research could compare the proposed IAVDC strategy with other advanced control methods (e.g., model predictive control, fuzzy-based strategies) and consider advanced BESS interfacing approaches, such as overmodulation for converters, to enhance robustness and practical applicability [26].
(3)
BESS degradation, economic feasibility, and capacity optimization: This study focuses on technical feasibility. Future work should assess the impact of BESS degradation, including cycle life and efficiency loss, on long-term frequency regulation. In addition, the economic feasibility of integrating BESS with HPPs and the influence on HPP regulation losses should be evaluated, along with optimal capacity allocation strategies for a comprehensive assessment of system performance [27].

6. Conclusions

This study developed a refined HPP model coupled with a BESS under an IAVDC strategy to improve frequency regulation and suppress reverse power. The proposed model achieved 98.5% simulation accuracy, outperforming conventional simplified models by 26.2%. Integrating the BESS eliminated reverse power caused by water hammer and significantly shortened frequency recovery time, enhancing primary frequency control quality. The IAVDC strategy further improved system responsiveness and stability, demonstrating the effectiveness of coordinated HPP-BESS regulation. Limitations include the use of specific operating conditions and the omission of long-term BESS performance and economic considerations, which warrant further investigation in future work.

Author Contributions

Writing—original draft preparation and methodology, Y.G.; methodology and data curation, F.Z.; data curation and resources, Y.L.; software and supervision, Y.D.; supervision and supervision, X.H.; writing—review and editing and project administration, J.G.; data curation and formal analysis, T.Y. All authors have read and agreed to the published version of the manuscript.

Funding

This research was supported by the China Yangtze Power Co., Ltd. project “Impact of wind and solar access on power system and power plant operation and simulation study” (No. Z242302010), and the Key R&D Program of Hubei Province “Research on Key Technologies for Integrated Hydro-Wind-Solar Multi-Energy Complementarity” (No. 2022AAA007).

Data Availability Statement

Dataset available on request from the authors.

Conflicts of Interest

Authors Youping Li and Xiaojun Hua was employed by the China Yangtze Power Co., Ltd. Author Youhan Deng was employed by the China Three Gorges Corporation. The authors declare that this study received funding from the China Yangtze Power Co., Ltd. The funder was not involved in the study design, collection, analysis, interpretation of data, the writing of this article or the decision to submit it for publication. The remaining authors declare that the research was conducted in the absence of any commercial or financial relationships that could be construed as a potential conflict of interest.

References

  1. Alturki, Y.A.; Alhussainy, A.A.; Alghamdi, S.M.; Rawa, M. A Novel Point of Common Coupling Direct Power Control Method for Grid Integration of Renewable Energy Sources: Performance Evaluation among Power Quality Phenomena. Energies 2024, 17, 5111. [Google Scholar] [CrossRef]
  2. Maitanova, N.; Schlüters, S.; Hanke, B.; von Maydell, K.; Agert, C. Quantifying Power and Energy Fluctuations of Photovoltaic Systems. Energy Sci. Eng. 2022, 10, 4496–4511. [Google Scholar] [CrossRef]
  3. Shi, Y.; Li, C.; Wang, H.; Wang, X.; Negnevitsky, M. A Novel Scheduling Strategy of a Hybrid Wind-Solar-Hydro System for Smoothing Energy and Power Fluctuations. Energy 2025, 320, 135268. [Google Scholar] [CrossRef]
  4. Meng, Y.; Li, X.; Liu, X.; Cui, X.; Xu, P.; Li, S. A Control Strategy for Battery Energy Storage Systems Participating in Primary Frequency Control Considering the Disturbance Type. IEEE Access 2021, 9, 102004–102018. [Google Scholar] [CrossRef]
  5. Zorchenko, N.V.; Chaplin, A.G.; Rad’kova, O.V.; Tyupina, T.G. Development Trends in Primary Frequency Control and Frequency Control Market. Power Technol. Eng. 2020, 54, 566–569. [Google Scholar] [CrossRef]
  6. Li, J.; Ma, Y.; Mu, G.; Feng, X.; Yan, G.; Guo, G.; Zhang, T. Optimal Configuration of Energy Storage System Coordinating Wind Turbine to Participate Power System Primary Frequency Regulation. Energies 2018, 11, 1396. [Google Scholar] [CrossRef]
  7. Nasirpour, N.; Madani, S.M.; Niroomand, M.; Muljadi, E. Closed-Loop Fast Primary Frequency-Response of Type-3 Wind Power Plants in Low Inertia Grids. IET Renew. Power Gener. 2021, 15, 2931–2943. [Google Scholar] [CrossRef]
  8. Michaud, F.; Robert, G. Dynamic Capability of Hydro Power Plants for Primary Load-Frequency Control. IFAC Proc. Vol. 2012, 45, 290–294. [Google Scholar] [CrossRef]
  9. Dash, R.; Reddy, K.J.; Mohapatra, B.; Bajaj, M.; Zaitsev, I. An Approach for Load Frequency Control Enhancement in Two-Area Hydro-Wind Power Systems Using LSTM + GA-PID Controller with Augmented Lagrangian Methods. Sci. Rep. 2025, 15, 1307. [Google Scholar] [CrossRef]
  10. Tuan, D.H.; Nguyen Ngoc Thanh, V.; Nguyen Chi, D.; Pham, V.H. Improving Frequency Control of Multi-Area Interconnected Hydro-Thermal Power System Using PSO Algorithm. Appl. Sci. 2025, 15, 2898. [Google Scholar] [CrossRef]
  11. Audomsi, S.; Wattana, S.; Uthathip, N.; Sa-Ngiamvibool, W. Development and Design of an Optimal Fuzzy Logic Two Degrees of Freedom-Proportional Integral Derivative Controller for a Two-Area Power System Using the Bee Algorithm. Energies 2025, 18, 915. [Google Scholar] [CrossRef]
  12. Daraz, A.; Malik, S.A.; Waseem, A.; Azar, A.T.; Haq, I.U.; Ullah, Z.; Aslam, S. Automatic Generation Control of Multi-Source Interconnected Power System Using FOI-TD Controller. Energies 2021, 14, 5867. [Google Scholar] [CrossRef]
  13. Xu, B.; Zhang, J.; Egusquiza, M.; Chen, D.; Li, F.; Behrens, P.; Egusquiza, E. A Review of Dynamic Models and Stability Analysis for a Hydro-Turbine Governing System. Renew. Sustain. Energy Rev. 2021, 144, 110880. [Google Scholar] [CrossRef]
  14. Zhang, H.; Liao, K.; Yang, J.; Zheng, S.; He, Z. Frequency-Constrained Expansion Planning for Wind and Photovoltaic Power in Wind-Photovoltaic-Hydro-Thermal Multi-Power System. Appl. Energy 2024, 356, 122401. [Google Scholar] [CrossRef]
  15. Zhang, M.; Xie, T.; Zhang, C.; Chen, D.; Mao, C.; Shen, C. Dynamic Model and Impact on Power Quality of Large Hydro-Photovoltaic Power Complementary Plant. Int. J. Energy Res. 2019, 43, 4436–4448. [Google Scholar] [CrossRef]
  16. Han, X.; Jiang, Q.; Liu, T.; Li, B.; Ding, L.; Chen, G. Research on Ultra-Low Frequency Oscillation Caused by Hydro Power in Hydro-Dominant Power System. In Proceedings of the 2018 International Conference on Power System Technology (POWERCON), Guangzhou, China, 6–9 November 2018; IEEE: Piscataway, NJ, USA, 2018; pp. 1909–1914. [Google Scholar]
  17. Shu, H.; He, Y.; Wang, G.; Zhang, H.; Shi, B.; Luo, S. Research on Water Hammer Effect and Cooperative Frequency Regulation Technology of PV-HBESS Compensated Hydroturbine. IEEE Trans. Sustain. Energy 2024, 16, 919–932. [Google Scholar] [CrossRef]
  18. Zhang, Y.J.A.; Zhao, C.; Tang, W.; Low, S.H. Profit-Maximizing Planning and Control of Battery Energy Storage Systems for Primary Frequency Control. IEEE Trans. Smart Grid 2016, 9, 712–723. [Google Scholar] [CrossRef]
  19. Arrigo, F.; Bompard, E.; Merlo, M.; Milano, F. Assessment of Primary Frequency Control through Battery Energy Storage Systems. Int. J. Electr. Power Energy Syst. 2020, 115, 105428. [Google Scholar] [CrossRef]
  20. Yan, L.; Shui, T.; Xue, T.; Wang, M.; Ma, N.; Li, K. Comprehensive Control Strategy Considering Hybrid Energy Storage for Primary Frequency Modulation. Energies 2022, 15, 4079. [Google Scholar] [CrossRef]
  21. Datta, U.; Kalam, A.; Shi, J. The Relevance of Large-Scale Battery Energy Storage (BES) Application in Providing Primary Frequency Control with Increased Wind Energy Penetration. J. Energy Storage 2019, 23, 9–18. [Google Scholar] [CrossRef]
  22. An, H.; Yang, J.; Yang, W.; Cheng, Y.; Peng, Y. An Improved Frequency Dead Zone with Feed-Forward Control for Hydropower Units: Performance Evaluation of Primary Frequency Control. Energies 2019, 12, 1497. [Google Scholar] [CrossRef]
  23. Yang, W.; Norrlund, P.; Saarinen, L.; Yang, J.; Guo, W.; Zeng, W. Wear and Tear on Hydro Power Turbines—Influence from Primary Frequency Control. Renew. Energy 2016, 87, 88–95. [Google Scholar] [CrossRef]
  24. Alanazi, M.; Salem, M.; Sabzalian, M.H.; Prabaharan, N.; Ueda, S.; Senjyu, T. Designing a New Controller in the Operation of the Hybrid PV-BESS System to Improve the Transient Stability. IEEE Access 2023, 11, 97625–97640. [Google Scholar] [CrossRef]
  25. Wang, Y.; Chen, S.; Yang, M.; Liao, P.; Xiao, X.; Xie, X.; Li, Y. Low-frequency oscillation in power grids with virtual synchronous generators: A comprehensive review. Renew. Sustain. Energy Rev. 2025, 207, 114921. [Google Scholar] [CrossRef]
  26. Li, S.; Zhou, J.; Zhou, F.; Niu, F.; Deng, W. A reduced current ripple overmodulation strategy for indirect matrix converter. IEEE Trans. Ind. Electron. 2024, 72, 3768–3777. [Google Scholar] [CrossRef]
  27. Li, X.; Song, J.; Ma, Y.; Zhu, Z.; Liu, H.; Wei, C. Capacity Planning for Hydro-Wind-Photovoltaic-Storage Systems Considering High-Dimensional Uncertainties. Energy Inform. 2025, 8, 3. [Google Scholar] [CrossRef]
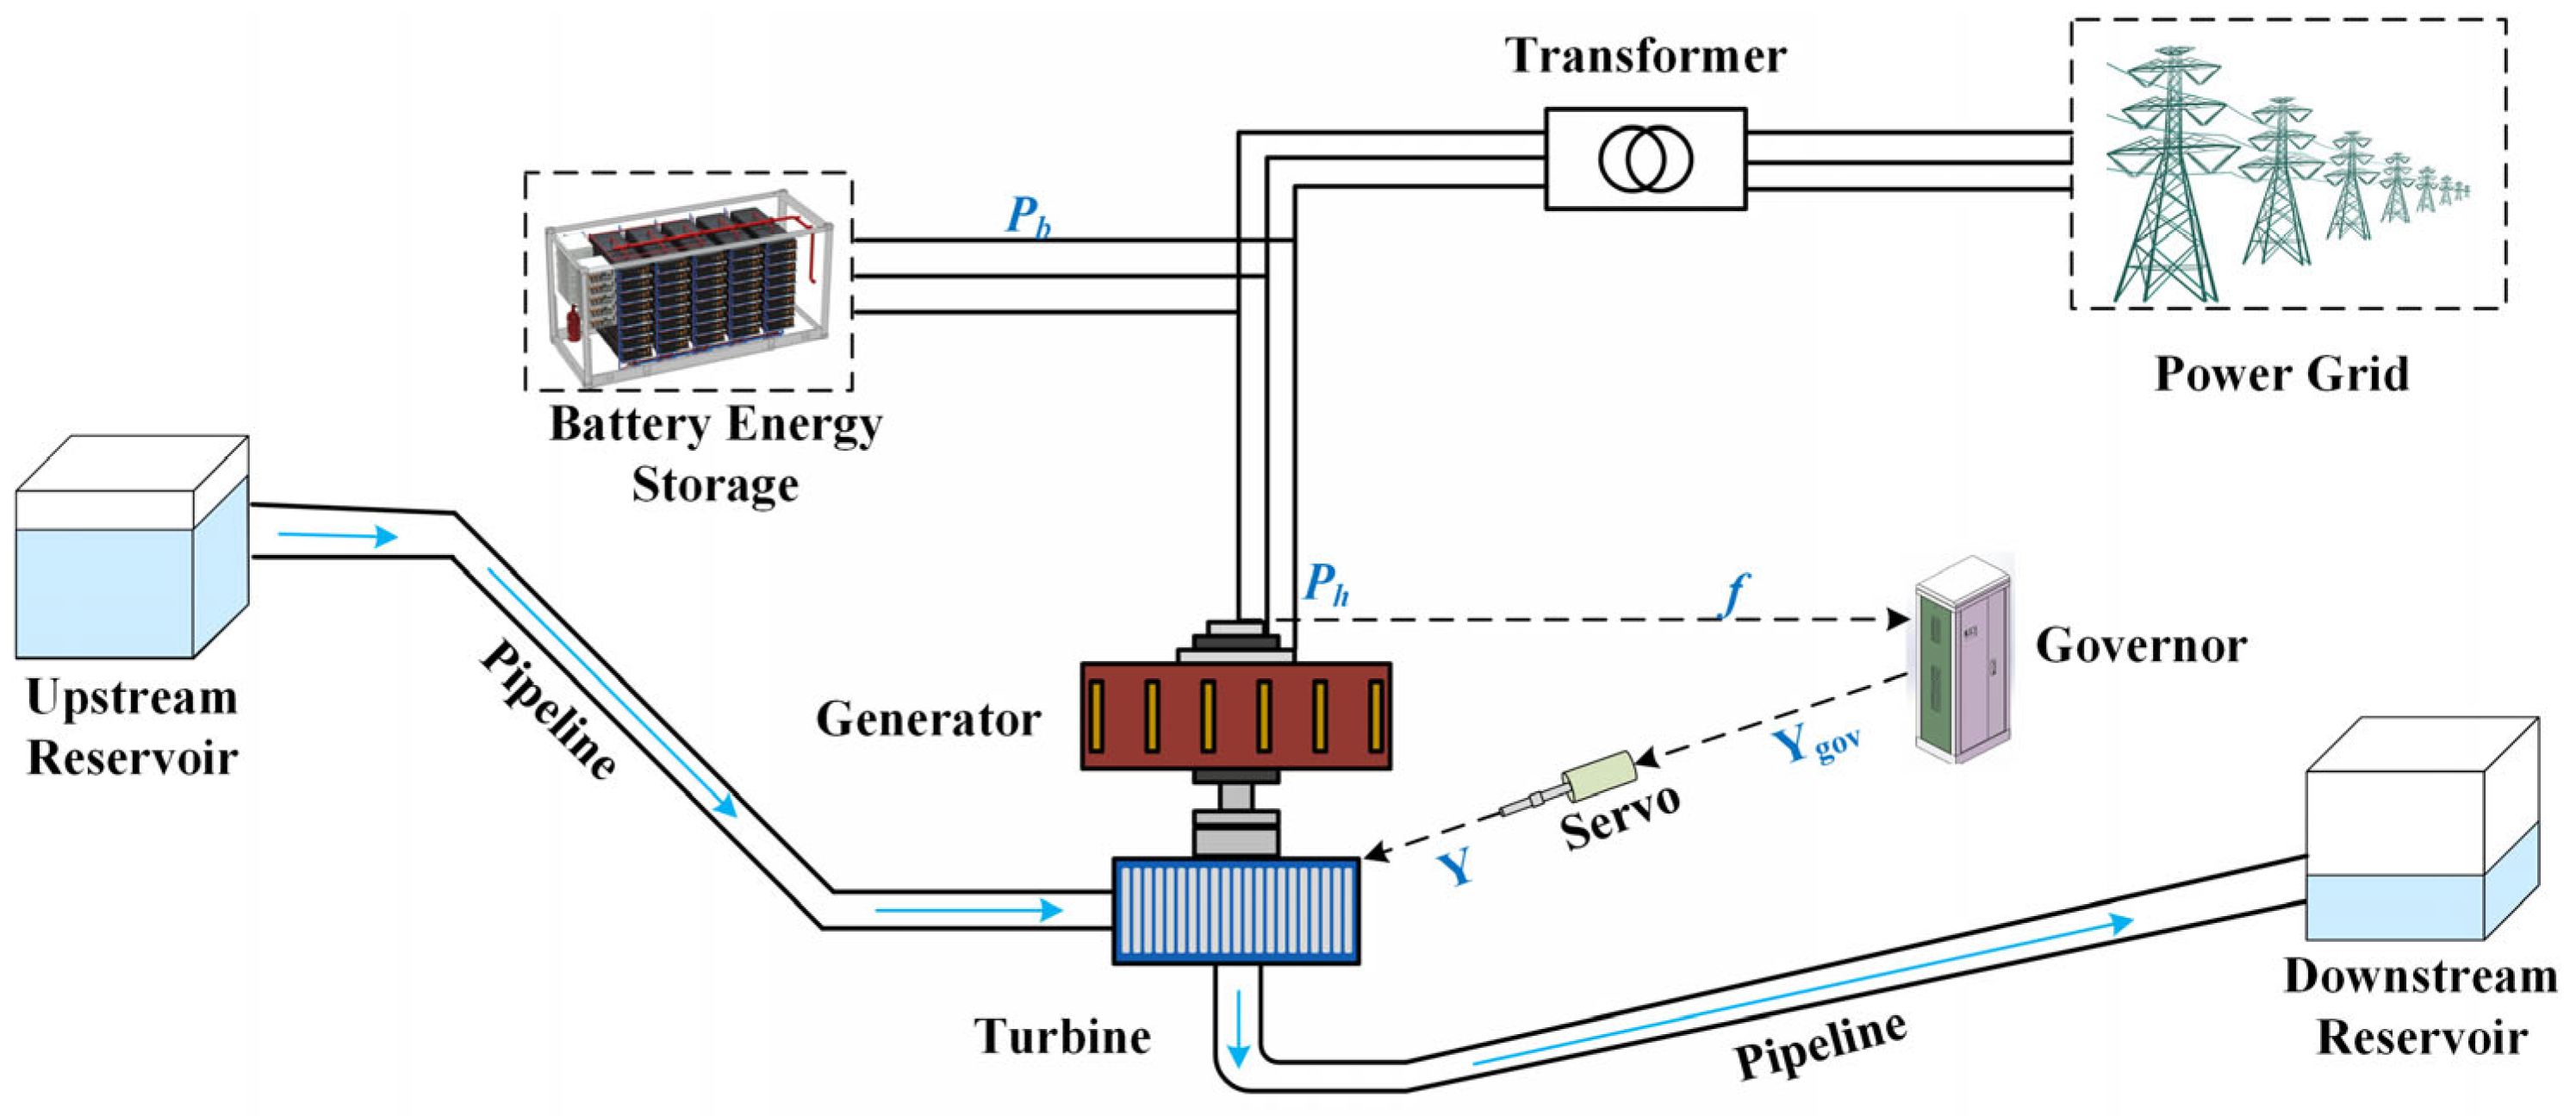
Figure 1. The joint regulation system of HPP–BESS.
Energies 18 05249 g001
Figure 2. Block diagram of the governor model.
Energies 18 05249 g002
Figure 3. Block diagram of the servo system model.
Energies 18 05249 g003
Figure 4. The nonlinear model of turbine: (a) discharge model; (b) torque model.
Energies 18 05249 g004
Figure 5. Block diagram of the SOC computation model.
Energies 18 05249 g005
Figure 6. Block diagram of the primary frequency regulation model.
Energies 18 05249 g006
Figure 7. The relationship between Kb and Soc under discharging and charging conditions.
Energies 18 05249 g007
Figure 8. Simulation accuracy comparison of refined vs. simplified HPP model.
Energies 18 05249 g008
Figure 9. The system response under load increase: (a): system frequency; (b) system power.
Energies 18 05249 g009
Figure 10. System response without BESS participation when Tw is changed.
Energies 18 05249 g010
Figure 11. System response of VDC strategy when Tw is changed.
Energies 18 05249 g011
Figure 12. System response of IAVDC strategy when Tw is changed.
Energies 18 05249 g012
Figure 13. System response under continuous load variation.
Energies 18 05249 g013
Table 1. Simulation parameters of the HPP model.
ParameterValueParameterValue
Kp4Ki0.5
Kd0.12Tw1.2
Tr0.32H137
Q91.02Ta13
en1.05Ph800
Table 2. Simulation parameters of the Bess model.
ParameterValueParameterValue
Kb,max50Ka30
Ib15Tb0.1
Soc,ref0.5Pb80
Table 3. The detailed evaluation results under load increase.
Control StrategyEvaluating Indicator
Pre (MW)Ts (s)IQE (kW·h)
Without BESS14.88423.385658.620
VDC02.477786.244
IAVDC01.846792.036
Table 4. The average evaluation results of sudden load decrease when Tw is changed.
Control StrategyEvaluating Indicator
Pre (MW)Ts (s)IQE (kW·h)
Without BESS7.23822.147633.452
VDC04.768722.688
IAVDC03.214780.335
Disclaimer/Publisher’s Note: The statements, opinions and data contained in all publications are solely those of the individual author(s) and contributor(s) and not of MDPI and/or the editor(s). MDPI and/or the editor(s) disclaim responsibility for any injury to people or property resulting from any ideas, methods, instructions or products referred to in the content.