Article

From Trends to Insights: A Text Mining Analysis of Solar Energy Forecasting (2017–2023)

1
SPE Laboratory, UMR CNRS 6134, University of Corsica Pasquale Paoli, Route des Sanguinaires, 20000 Ajaccio, France
2
Mines Paris, PSL University, Centre for Observation, Impacts, Energy (O.I.E.), Sophia-Antipolis, 06904 Antibes, France
*
Author to whom correspondence should be addressed.
Energies 2025, 18(19), 5231; https://doi.org/10.3390/en18195231
Submission received: 3 September 2025 / Revised: 27 September 2025 / Accepted: 29 September 2025 / Published: 1 October 2025
(This article belongs to the Special Issue Solar Energy Utilization Toward Sustainable Urban Futures)

Abstract

This study aims to highlight key figures and organizations in solar energy forecasting research, including the most prominent authors, journals, and countries. It also clarifies commonly used abbreviations in the field, with a focus on forecasting methods and techniques, the form and type of solar energy forecasting outputs, and the associated error metrics. Building on previous research that analyzed data up to 2017, the study updates findings to include information through 2023, incorporating metadata from 500 articles to identify key figures and organizations, along with 276 full-text articles analyzed for abbreviations. The application of text mining offers a concise yet comprehensive overview of the latest trends and insights in solar energy forecasting. The key findings of this study are threefold: First, China, followed by the United States of America and India, is the leading country in solar energy forecasting research, with shifts observed compared to the pre-2017 period. Second, numerous new abbreviations related to machine learning, particularly deep learning, have emerged in solar energy forecasting since before 2017, with Long Short-Term Memory, Convolutional Neural Networks, and Recurrent Neural Networks the most prominent. Finally, deterministic error metrics are mentioned nearly 11 times more frequently than probabilistic ones. Furthermore, perspectives on the practices and approaches of solar energy forecasting companies are also examined.

1. Introduction

Accurate solar energy forecasting is crucial for power plant operators and grid managers, particularly as the penetration of intermittent renewable generation in the energy mix continues to rise [1]. Refs. [2,3] both emphasize the importance of reliable solar energy forecasting, which can significantly enhance the quality of service and improve energy planning and distribution. Technological advancements in solar energy, such as improved smart grid technologies, further emphasize the importance of reliable forecasting for effective solar power utilization.
This study aims to examine the field of solar energy forecasting using text mining techniques. These methods, outlined by [4], are relevant because of their ability to extract meaningful patterns and insights from vast quantities of unstructured textual data, thereby improving decision-making processes. They facilitate automated text analysis, uncovering trends, conclusions, and relationships that would otherwise be imperceptible. They incorporate a range of methods such as information extraction, retrieval, query processing, natural language processing, categorization, and clustering, as detailed by [5].
Our research aims to identify key authors, journals, organizations, and countries involved in solar energy forecasting. Additionally, we collect, list, and analyze commonly used abbreviations in this field. This is not an exhaustive study but rather a focused analysis of main contributors and terminologies in the field of solar energy forecasting. The results will be mainly compared to a similar study [6] conducted for the period 2012–2017, allowing us to analyze trends over our study period of 2017–2023 as inclusive.
In this study, special attention will also be given to companies specializing in solar energy forecasting. Some of these companies were contacted and their websites visited to obtain detailed information on their general practices. This complements the information mentioned in [7] regarding solar energy forecasting by specialist companies.
This work has been designed to be reproducible, as it builds upon and complements previous studies. To ensure this, a detailed explanation of the methodology used is provided in the article.
The structure of this paper is organized as follows: Section 2 defines the primary research objectives and the methodological framework employed. Section 3 elaborates on the findings related to the infrastructure of research publications, covering prominent authors, journals, organizations, and countries. Section 4 analyzes abbreviations and provides a technical discussion on solar energy forecasting output variables, output formats, an overview of forecasting methods, and commonly used error metrics. Section 5 examines the distinction between forecasting, prediction, and estimation of solar energy. Section 6 provides an overview of companies and their practices. Finally, the last section concludes the paper with a summary of the main findings.

2. Research Objectives and Methodological Framework

This section discusses the research objectives and the methodology employed to address them, particularly in terms of data selection, extraction, and processing. These objectives are framed in reference to previous studies in the literature, which could benefit from updating or additional exploration.

2.1. Research Objectives

Establishing a solid foundation for this study is crucial for understanding the progression and current state of research in solar energy forecasting. Much of the research points in this study are grounded in the work of ref. [6], which serves as a pivotal benchmark for the analysis. The key objectives of this study are as follows:
  • Objective 1: ref. [6] identified the leading journals, authors, organizations, and countries in solar energy forecasting research from 2012 to 2017. The objective aims to update that analysis by identifying the current leaders in this field from 2017 to 2023, inclusive, thereby capturing the latest trends and shifts in scholarly influence and contributions.
  • Objective 2: ref. [6] also listed and elucidated the most commonly used abbreviations in solar energy forecasting within the 2012 to 2017 period. The aim is to ascertain whether new abbreviations have emerged since then, reflecting evolving terminologies and advancements in the field.
  • Objective 3: ref. [7] examined select companies specializing in solar energy forecasting. This study aims to expand that analysis to gain a more comprehensive understanding of these firms. By engaging with these companies and conducting research on them, the goal is to enhance the synergy between the academic community and the industry, fostering collaborative efforts and practical applications of research findings.
To address Objective 1, text mining was performed on metadata from 500 articles published between 2017 and 2023. The specifics of the selection process are outlined in Section 2.2.
For Objective 2, text mining was conducted on the full texts of a subset of 276 out of the 500 articles, rather than just the metadata. This subset was selected because the 276 articles are from ScienceDirect, part of the Elsevier group, and the availability of Elsevier’s Application Programming Interface (API) “(https://dev.elsevier.com/) (accessed on 23 April 2024)” facilitated the easy import of full texts for text mining purposes. Other publishers do not provide such straightforward access to full texts, making Elsevier’s API particularly advantageous for this research.
To address Objective 3, the same companies specializing in solar energy forecasting mentioned in [7] were either contacted directly or further researched online. The dataset selection and processing for text mining are detailed in Section 2.2 and Section 2.3, respectively.

2.2. Dataset Selection for Text Mining

The approach to article selection in this study differed from that of [6], particularly during the initial stages of literature collection. Recognizing the limitations of Google Scholar, as emphasized in [8], the methodology was expanded beyond this platform. Authors of [8] highlighted the constraints of Google Scholar’s Boolean query capabilities (using AND and OR), suggesting its use primarily as a supplementary resource in literature searches. By incorporating additional databases and employing more comprehensive search strategies, the aim was to compile a comprehensive and precise collection of relevant literature.
Initially, the term “solar energy forecasting” was searched on Google Scholar for 2017–2023, inclusive, and the first 500 results were analyzed. Five publishers together accounted for over 80% of these results. The remaining publishers each had fewer than 10 results. To be efficient, we focused on the top five publishers listed in order of their frequency: ScienceDirect, IEEE Xplore Digital Library, MDPI, SpringerLink and Wiley Online Library.
Boolean operator support was confirmed for the selected publishers’ databases in [8], with the exception of MDPI, which was not examined in that study. To address this, additional tests were carried out specifically on the MDPI platform, confirming that Boolean operators are supported and work accurately in titles, abstracts, full texts, and other sections.
Subsequently, to select our final dataset for our text mining analysis, we performed a detailed Boolean search using the criteria: (Photovoltaic OR PV OR solar) AND (forecasting OR prediction) AND (energy OR power OR irradiance OR radiation). This search was carried out in the databases of the selected publishers for the period from 2017 to 2023, inclusive. A system was employed to prioritize publishers based on their frequency of appearance among the first 500 results on Google Scholar. Only the top five publishers were retained, and their initial proportions were normalized to represent 100% of the dataset. Following this proportional allocation, a total of 500 articles were selected from the five databases for our final dataset. Table 1 shows the number of articles chosen from each database.
This study was intended to focus exclusively on solar forecasting for energy-related applications. While other uses—such as in agriculture—are possible, none of the 500 selected articles explicitly refer to non-energy domains.

2.3. Dataset Extraction and Processing for Text Mining

In this study, to address Objectives 1 and 2, the text mining process involved two stages: the first stage focused on metadata, and the second one on the full texts of the articles. This section will detail both processes in terms of methodology.

2.3.1. Metadata Extraction and Processing

To process the metadata, HTML files for the 500 articles were downloaded. We used specialized R scripts with the rvest package “(https://rvest.tidyverse.org/; accessed on 26 April 2024)”, a powerful tool for extracting data from HTML files, to automate the extraction of key information. This included identifying the journals of publication, the authors, their affiliations, and the countries associated with these affiliations. The scripts targeted specific HTML nodes to retrieve this data.
Standardizing this raw data was necessary due to the variety of sources, authors’ names, country names, or institutional affiliations could be presented slightly differently depending on the publisher. To address this, we used Jaccard hierarchical clustering [9], a method that organizes data into clusters based on their similarity, utilizing the Jaccard index to determine the degree of similarity between data pairs.
The Jaccard Index is calculated using the following formula: J A , B = A B A B . Where A and B are two sets for comparison. A B represents the number of elements common to both sets. A B represents the total number of unique elements in both sets combined. The Jaccard Index ranges from 0 to 1, where 0 means no similarity, and 1 means complete similarity.
This approach facilitated our manual verification and correction process, allowing us to standardize the data effectively.

2.3.2. Full-Text Extraction and Processing

As noted in Section 2.1, the full texts of 276 articles, a subset of the 500 articles, were retrieved using Elsevier’s API, which the research team had access to. This API facilitated the import of full-text articles from ScienceDirect for text mining purposes “(https://dev.elsevier.com/; accessed on 23 April 2024)”.
Subsequently, the full texts were analyzed using the same algorithm that Yang et al. [6] applied, which is akin to the approach suggested by [10], to identify all abbreviations. The algorithm employs a neighborhood search technique that scans the surrounding text of an abbreviation to find a potential match, identifying both a short form and a long form for an abbreviation. It then examines the vicinity for matches based on the initial letters and focuses on the short form located within parentheses ().
Afterward, only abbreviations that appeared five times or more were considered. Terms not directly or only marginally related to solar energy forecasting were manually removed, retaining only abbreviations relevant to solar energy forecasting methods, output types, output formats, and error metrics.

3. Findings from Data Mining: Analysis of Publication Infrastructure

This section presents the results of the metadata analysis carried out according to the methodology described in Section 2. The aim is to identify the main journals, authors, affiliations and countries involved in solar energy forecasting research. In addition, these results are juxtaposed with those of [6] to highlight trends and developments from 2017 to 2023 that are inclusive.

3.1. Prominent Journals

Figure 1 presents the top 20 journals that appear most frequently in our analysis of 500 articles. The six leading journals are Energy Reports (36), IEEE Access (35), Solar Energy (34), Renewable Energy (25), IEEE Transactions on Sustainable Energy (23), and Energy (23). Notably, four of these journals are published by Elsevier, including the most frequent one, while two are published by IEEE, including the second most frequent.
The top two journals in our analysis, Energy Reports and IEEE Access, do not feature in the top 20 journals listed by [6] in 2017. These journals were created relatively recently, in 2015 and 2013 respectively, and thus remained too new to be prominent in [6], which covered the period 2012–2017. However, 11 journals appear in both the 2017 ranking by [6] and our 2017–2023 analysis. These 11 journals include: Solar Energy, Renewable Energy, Renewable and Sustainable Energy Reviews, Energy Conversion and Management, Energy, Applied Energy, IEEE Transactions on Sustainable Energy, Energies, IEEE Transactions on Power Systems, Electric Power Systems Research, and IEEE Journal of Photovoltaics. Among them, the oldest is Solar Energy (established in 1957), while the most recent is IEEE Transactions on Sustainable Energy (launched in 2010), which has gained two positions between the 2012–2017 ranking and our 2017–2023 results. Table 2 presents the previous ranking from [6] alongside our updated 2017–2023 ranking for these 11 journals, including the magnitude of change in ranking position (Δ Rank). The results show that IEEE Transactions on Sustainable Energy (+2), Energies (+1), and Electric Power Systems Research (+3) gained positions, while Renewable and Sustainable Energy Reviews experienced the largest drop (−8).
Figure 1 also includes the impact factors for each journal, based on the most recent data available as of 14 August 2024. It shows no correlation between the ranking and impact factor. Moreover, Figure 1 highlights the fully open-access journals among those ranked, with the top two being fully open-access. This ranking emphasizes the journals that feature the highest number of publications with strong visibility indicators in the field of solar energy forecasting, without implying the superiority of one journal over another.

3.2. Prominent Authors

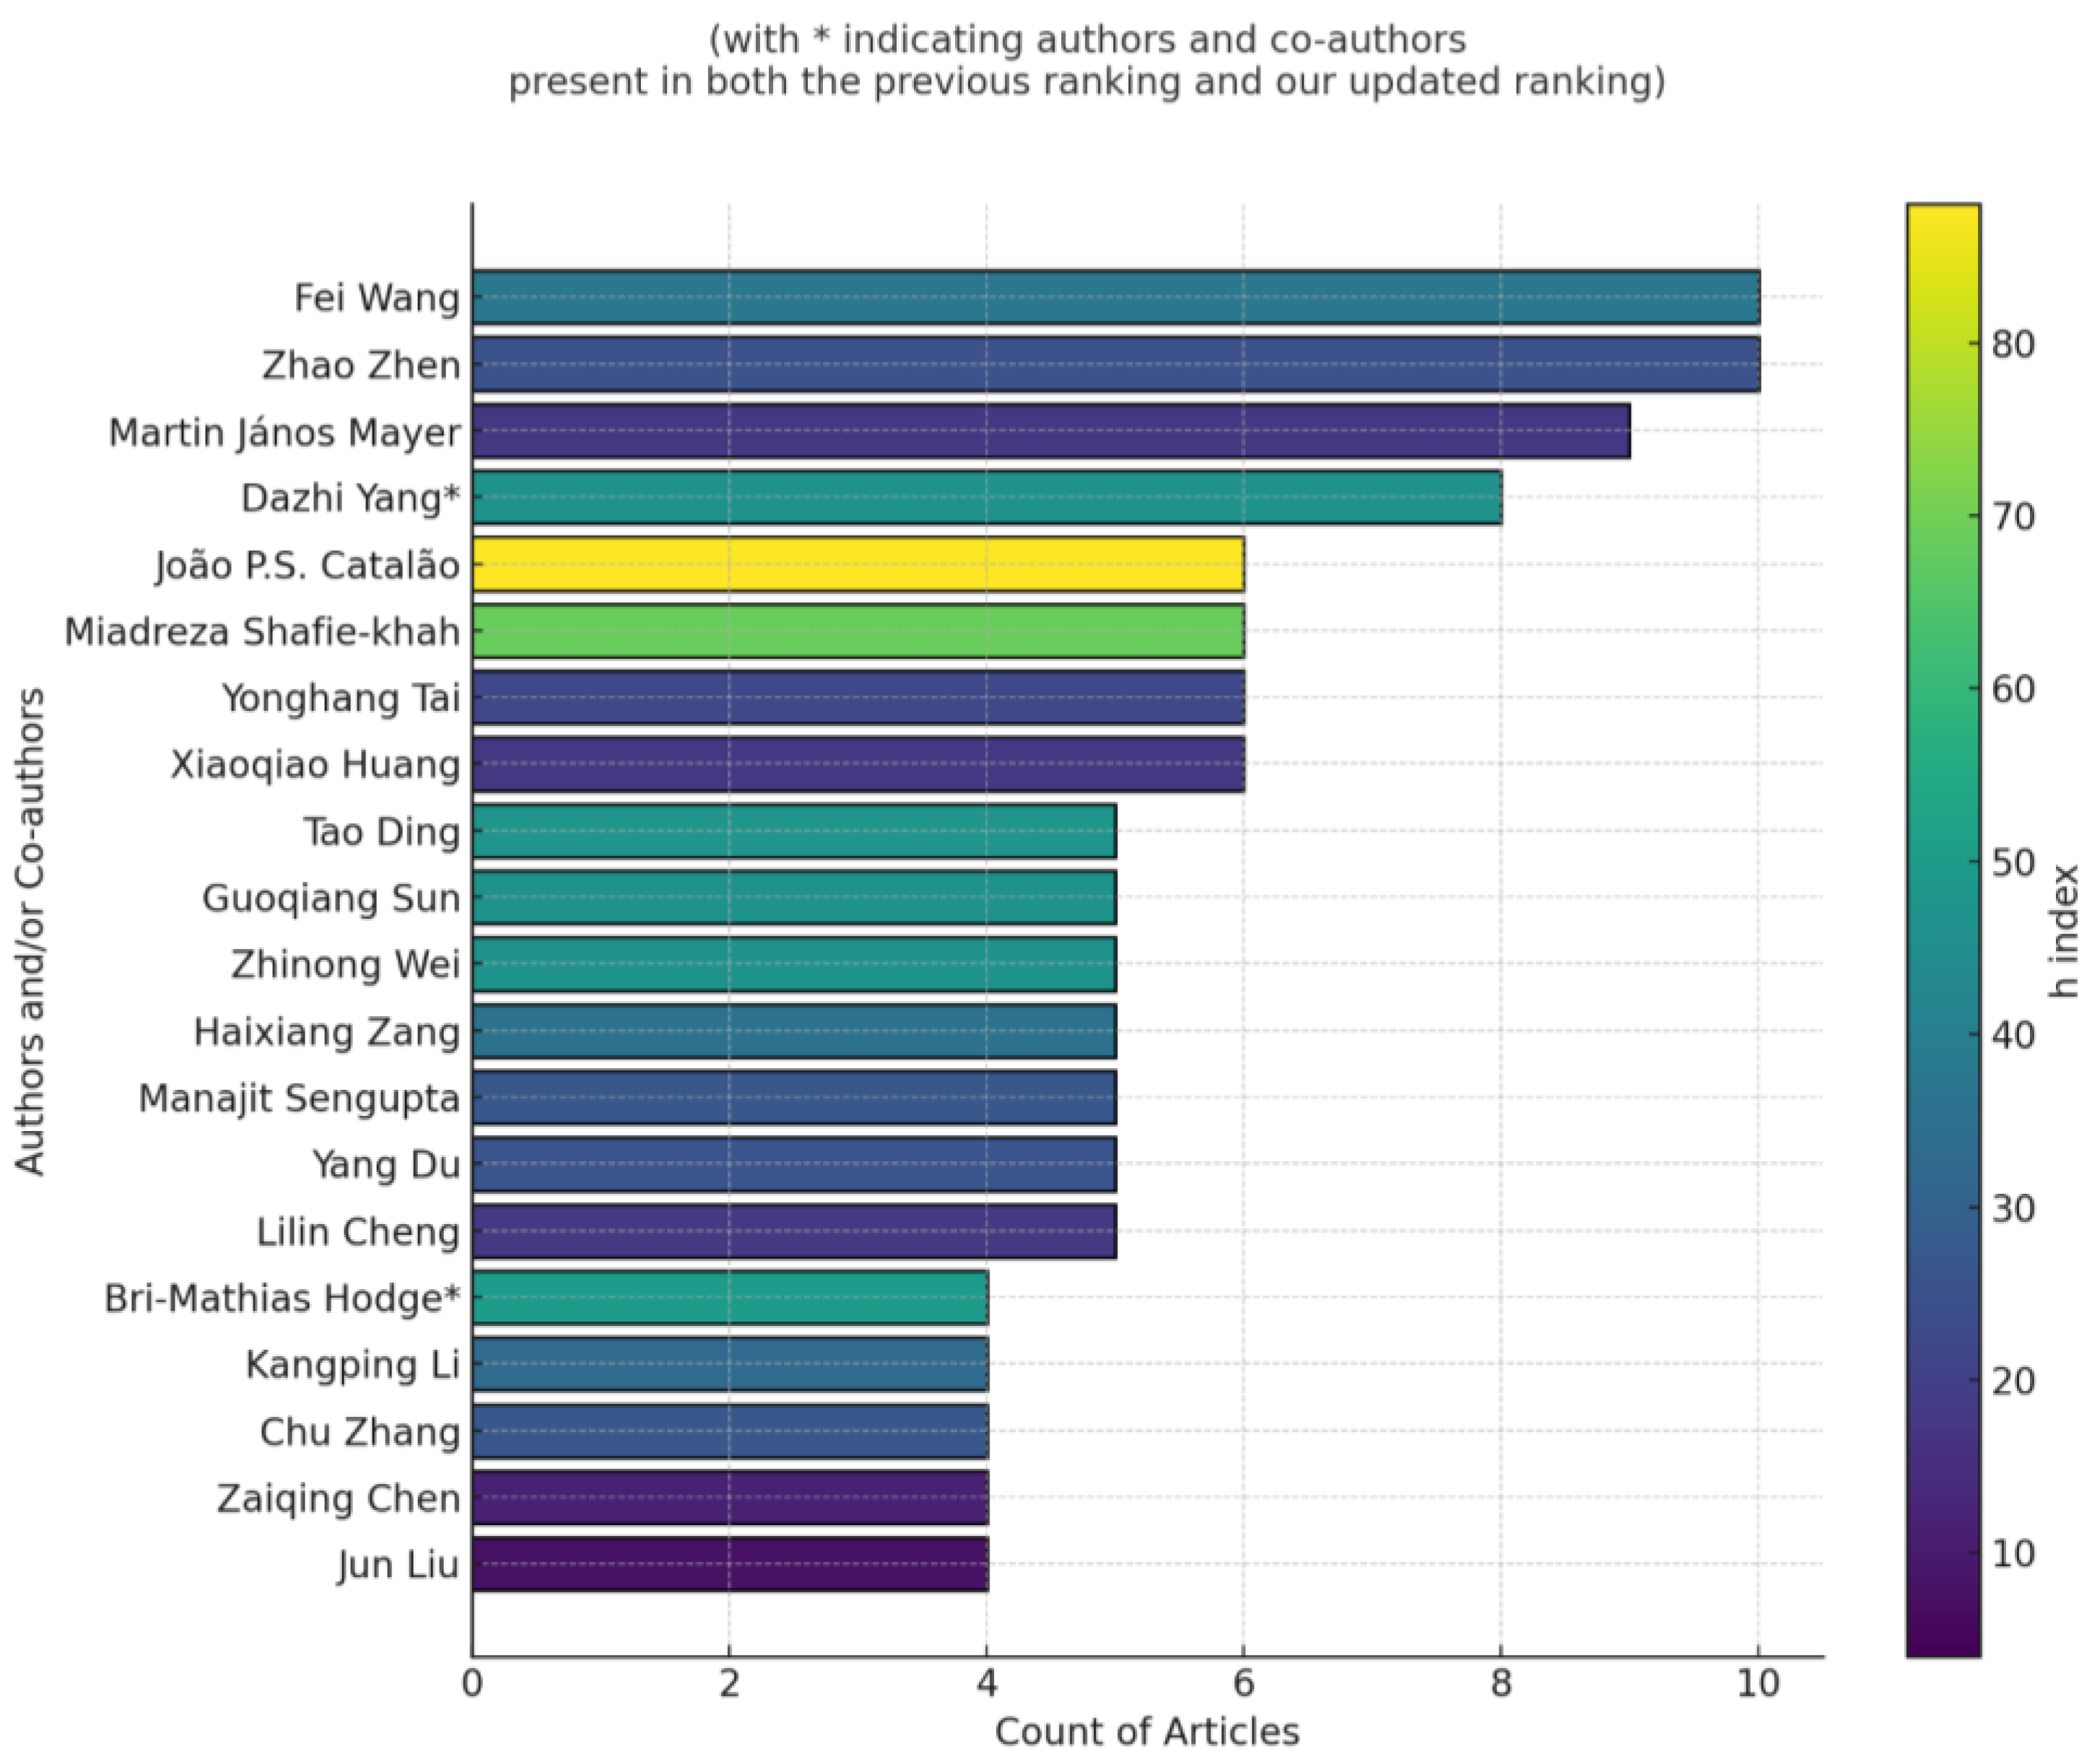
Figure 2 shows the top 20 authors most frequently appearing in our analysis, including both authors and co-authors. The four leading contributors are Fei Wang (10), Zhao Zhen (10), Martin János Mayer (9), and Dazhi Yang (8). A comparison between the 2017 ranking by [6] and our analysis covering 2017–2023, inclusive, shows that only two authors, Dazhi Yang and Bri-Mathias Hodge, appear on both lists. This difference may be due to the varying research periods—2012–2017 for [6] and 2017–2023, inclusive, for our analysis—as well as differences in article selection criteria, as detailed in Section 2.2, which slightly differ from the approach taken by [6].
Figure 2 also presents the h-index for each author, using the most recent data available from Scopus (https://www.scopus.com/) accessed on 14 August 2024, indicating no clear correlation between ranking and h-index.
This ranking does not imply that one author is better than another. Instead, it suggests that the researchers on the list have likely had more publications with good visibility indicators in solar energy forecasting than others during the 2017–2023 period.
Among the 20 authors and co-authors featured in this ranking, it is noteworthy that 14 are affiliated with institutions in China. Of the remaining six, two are based in the United States, while the others are distributed across Hungary, Portugal, Finland, and Australia, with one author in each of these countries. This distribution provides an initial overview of the geographical representation before the detailed ranking by country and affiliation is presented in Section 3.3.

3.3. Prominent Affiliations and Countries

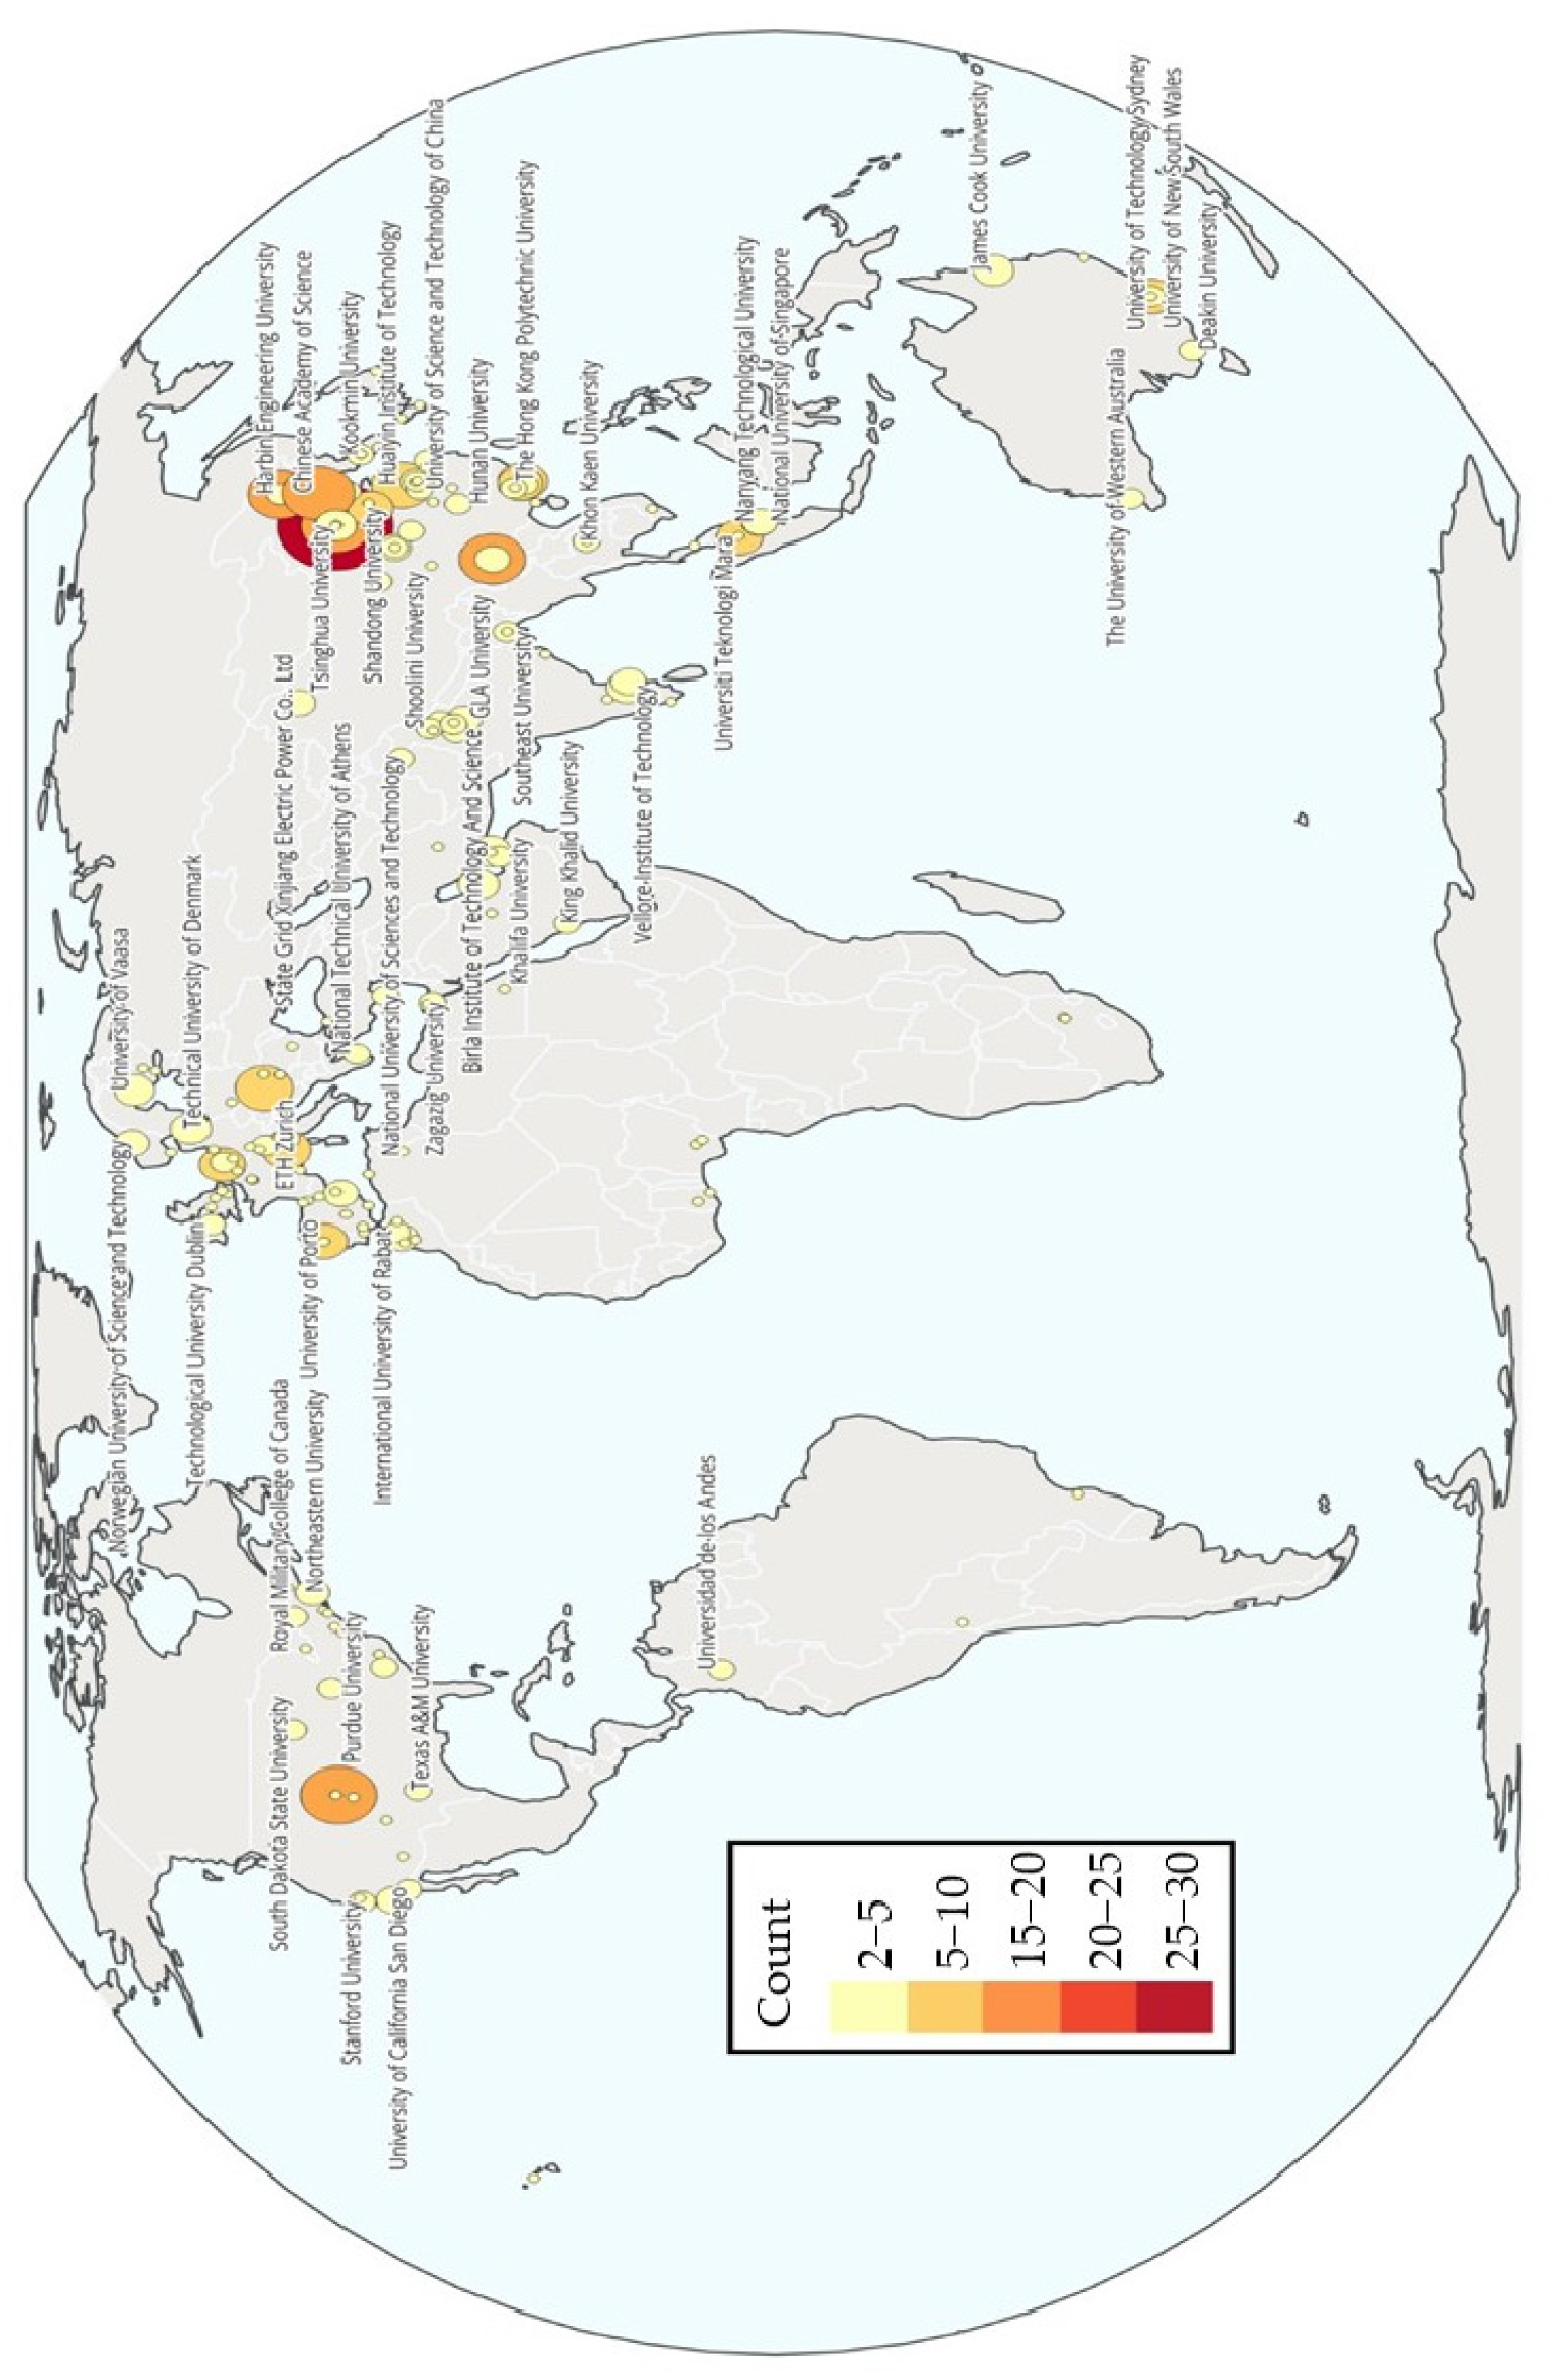
Figure 3 presents the analysis results of author affiliations across the 500 articles. Only affiliations appearing more than three times are shown by name in the plot. The top five affiliations are: North China Electric Power University (30), National Renewable Energy Laboratory (14), Tsinghua University (12), Harbin Institute of Technology (11), and Yunnan Normal University (11). It is noteworthy that four out of these five affiliations are located in China, with the exception of the National Renewable Energy Laboratory in the United States of America.
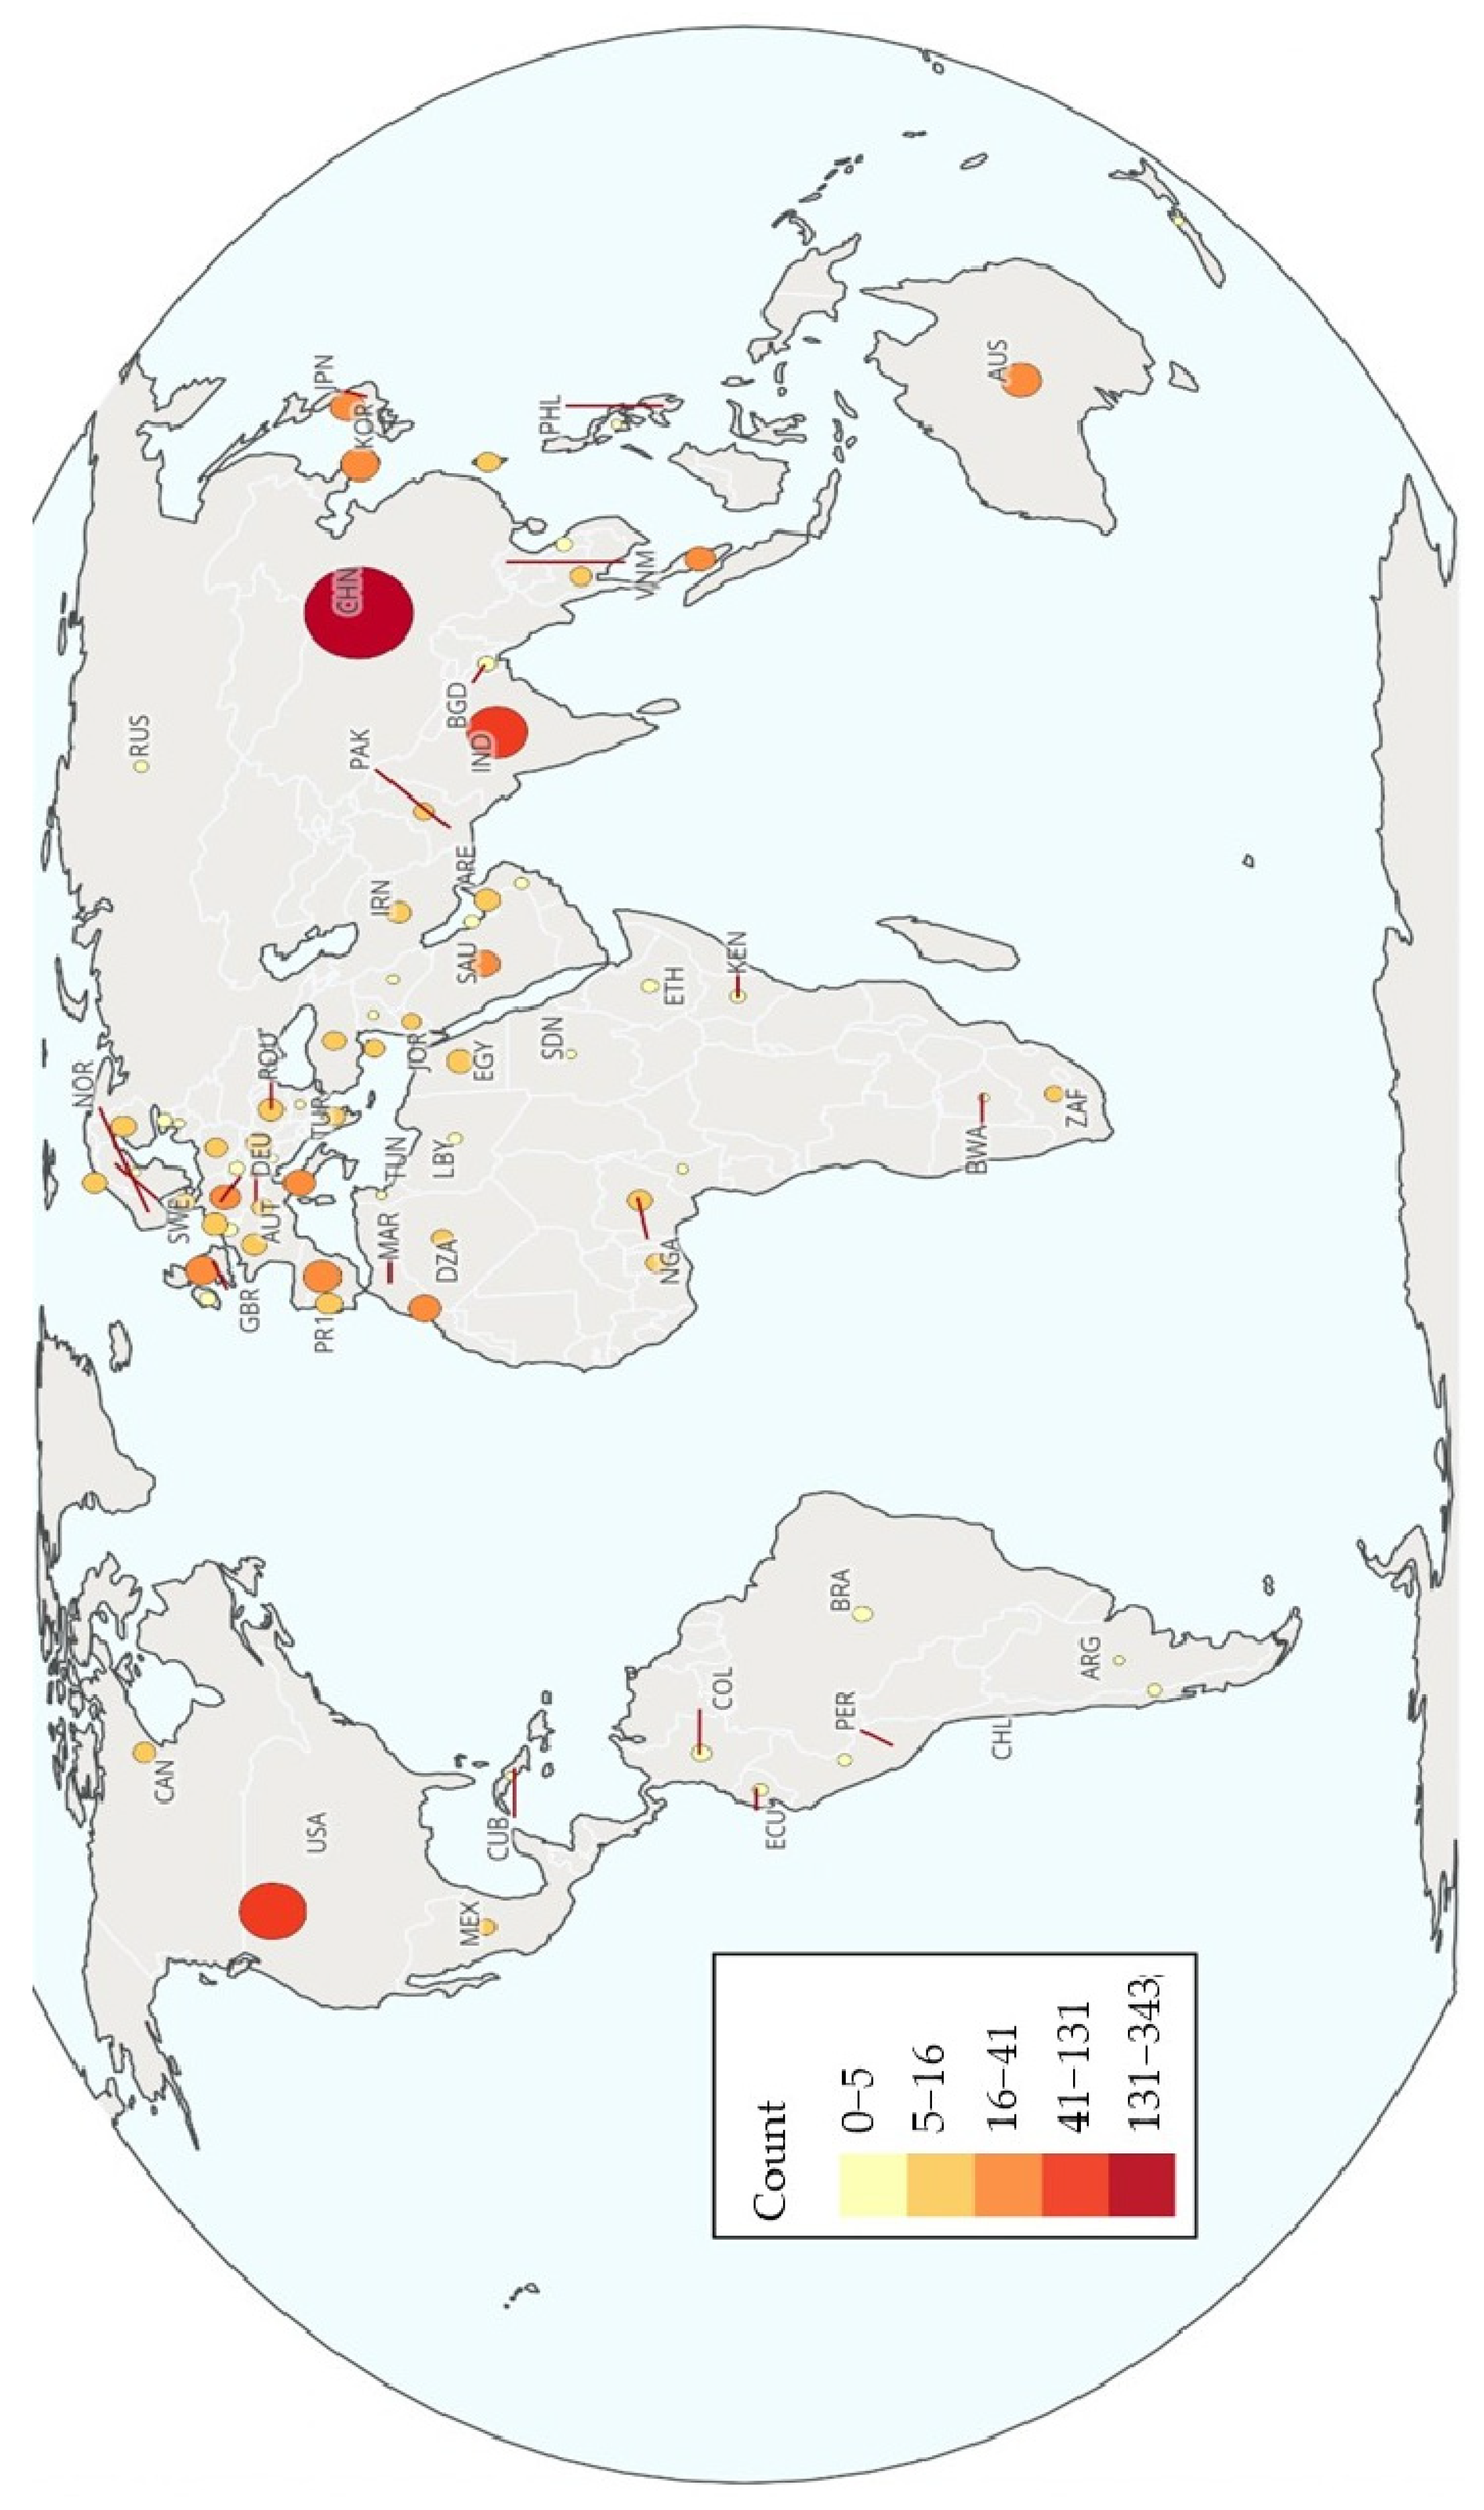
Figure 4 presents the results of our analysis on the countries of the authors’ affiliations across the 500 articles. These findings align with those in Figure 3 and the observations made about the authors in Section 3.2, with China (343) and the United States of America (131) leading, followed by India (107). This marks a shift compared to the findings of [6] for the 2012–2017 period, where the United States of America held the first position.

4. Findings from Data Mining: Analysis of Abbreviations and Technical Discussion

After identifying the research infrastructure in the previous section and comparing the results from 2017–2023 with data from earlier periods, this section will focus on a more technical discussion.
First, the output variables in solar energy forecasting will be examined, with particular attention to the physical nature of the forecast outputs. Next, the format of these outputs will be explored, including whether they are deterministic or probabilistic, and the various types of probabilistic designs at the output stage. Finally, the methods used in solar energy forecasting will be overviewed, followed by an overview of the error metrics commonly used in the literature.
This analysis will rely on text mining results where applicable to identify trends.

4.1. Output Variables in Solar Energy Forecasting

This section explores the variables typically forecasted in the literature for solar energy forecasting applications. Generally, some studies focus on forecasting solar radiation [11,12,13,14], while others directly forecast the resulting power or energy output [15,16,17,18,19].
In the context of solar radiation forecasting, the literature focuses on forecasting either irradiance, i.e., surface power density (W/m2), or irradiation, i.e., surface energy density (Wh/m2 or J/cm2). The abbreviations related to solar radiation forecasting (irradiance and irradiation), identified through the text mining analysis, are discussed in the following part of this section.
GHI stands for Global Horizontal Irradiance or Global Horizontal Irradiation, representing the total solar radiation received on a horizontal surface [20]. GHI is the sum of two components: BHI (Beam Horizontal Irradiance or Beam Horizontal Irradiation) and DHI (Diffuse Horizontal Irradiance or Diffuse Horizontal Irradiation). BHI refers to the direct solar radiation coming directly from the solar disk and striking a horizontal surface, while DHI represents the scattered solar radiation that reaches the surface.
DNI stands for Direct Normal Irradiance or Direct Normal Irradiation, which measures the direct solar radiation received on a surface perpendicular to the sun’s rays. DNI and BNI (Beam Normal Irradiance or Beam Normal Irradiation) refer to the same component; using D (Direct) instead of B (Beam) can cause confusion with Diffuse.
Photovoltaic modules are typically tilted to optimize energy production. GTI stands for Global Tilted Irradiance or Global Tilted Irradiation, which is the transposition of GHI onto the tilted plane of the photovoltaic modules. POA stands for Plane of Array, a term commonly used in the literature as an equivalent to GTI.
When GHI is the forecasted variable, converting it to photovoltaic system output involves two steps: first, estimating GTI from GHI and its components, then converting GTI into power or energy. The first step, while challenging, can be addressed using knowledge-based models [21,22,23] or trained models [24]. For the second step, power generation can be modeled using simple methods like Evans’ model [25], or more complex models that account for inverter and module physics. Simple models are often preferred since uncertainties in GHI forecasting are generally greater than those in PV modeling [26].
In the text mining analysis, GHI is notably more frequent compared to other abbreviations. This trend is mirrored in the literature, where the majority of solar radiation forecasting research predominantly focuses on GHI. However, as discussed in this section, for photovoltaic applications, it is essential to convert GHI to GTI and then to power or energy, while for concentrated solar power systems, the BNI component is crucial. Therefore, focusing solely on GHI is not sufficient from a practical perspective. It is important to highlight this in this work to remind the research community of the importance of incorporating practical considerations into scientific studies.
In [6], the abbreviations POA and GTI were not mentioned. This is not due to trends, as these are well-established technical concepts in the literature, even prior to 2017. It may instead be related to the limitations of text mining. Therefore, this section complements [6] on the output variables in solar energy forecasting.

4.2. Solar Energy Forecasting Output Formats

Before discussing the methods for solar energy forecasting in the next section, it is important to first understand the differences between deterministic and probabilistic forecasting. Deterministic forecasting produces a single, specific outcome per forecast, referred to as a point forecast [27]. In contrast, probabilistic forecasting provides additional insights by incorporating the uncertainty associated with the forecast [28]. This type of forecasting can produce various output formats, and the abbreviations related to these formats, identified through text mining analysis, are discussed in the following part of this section.
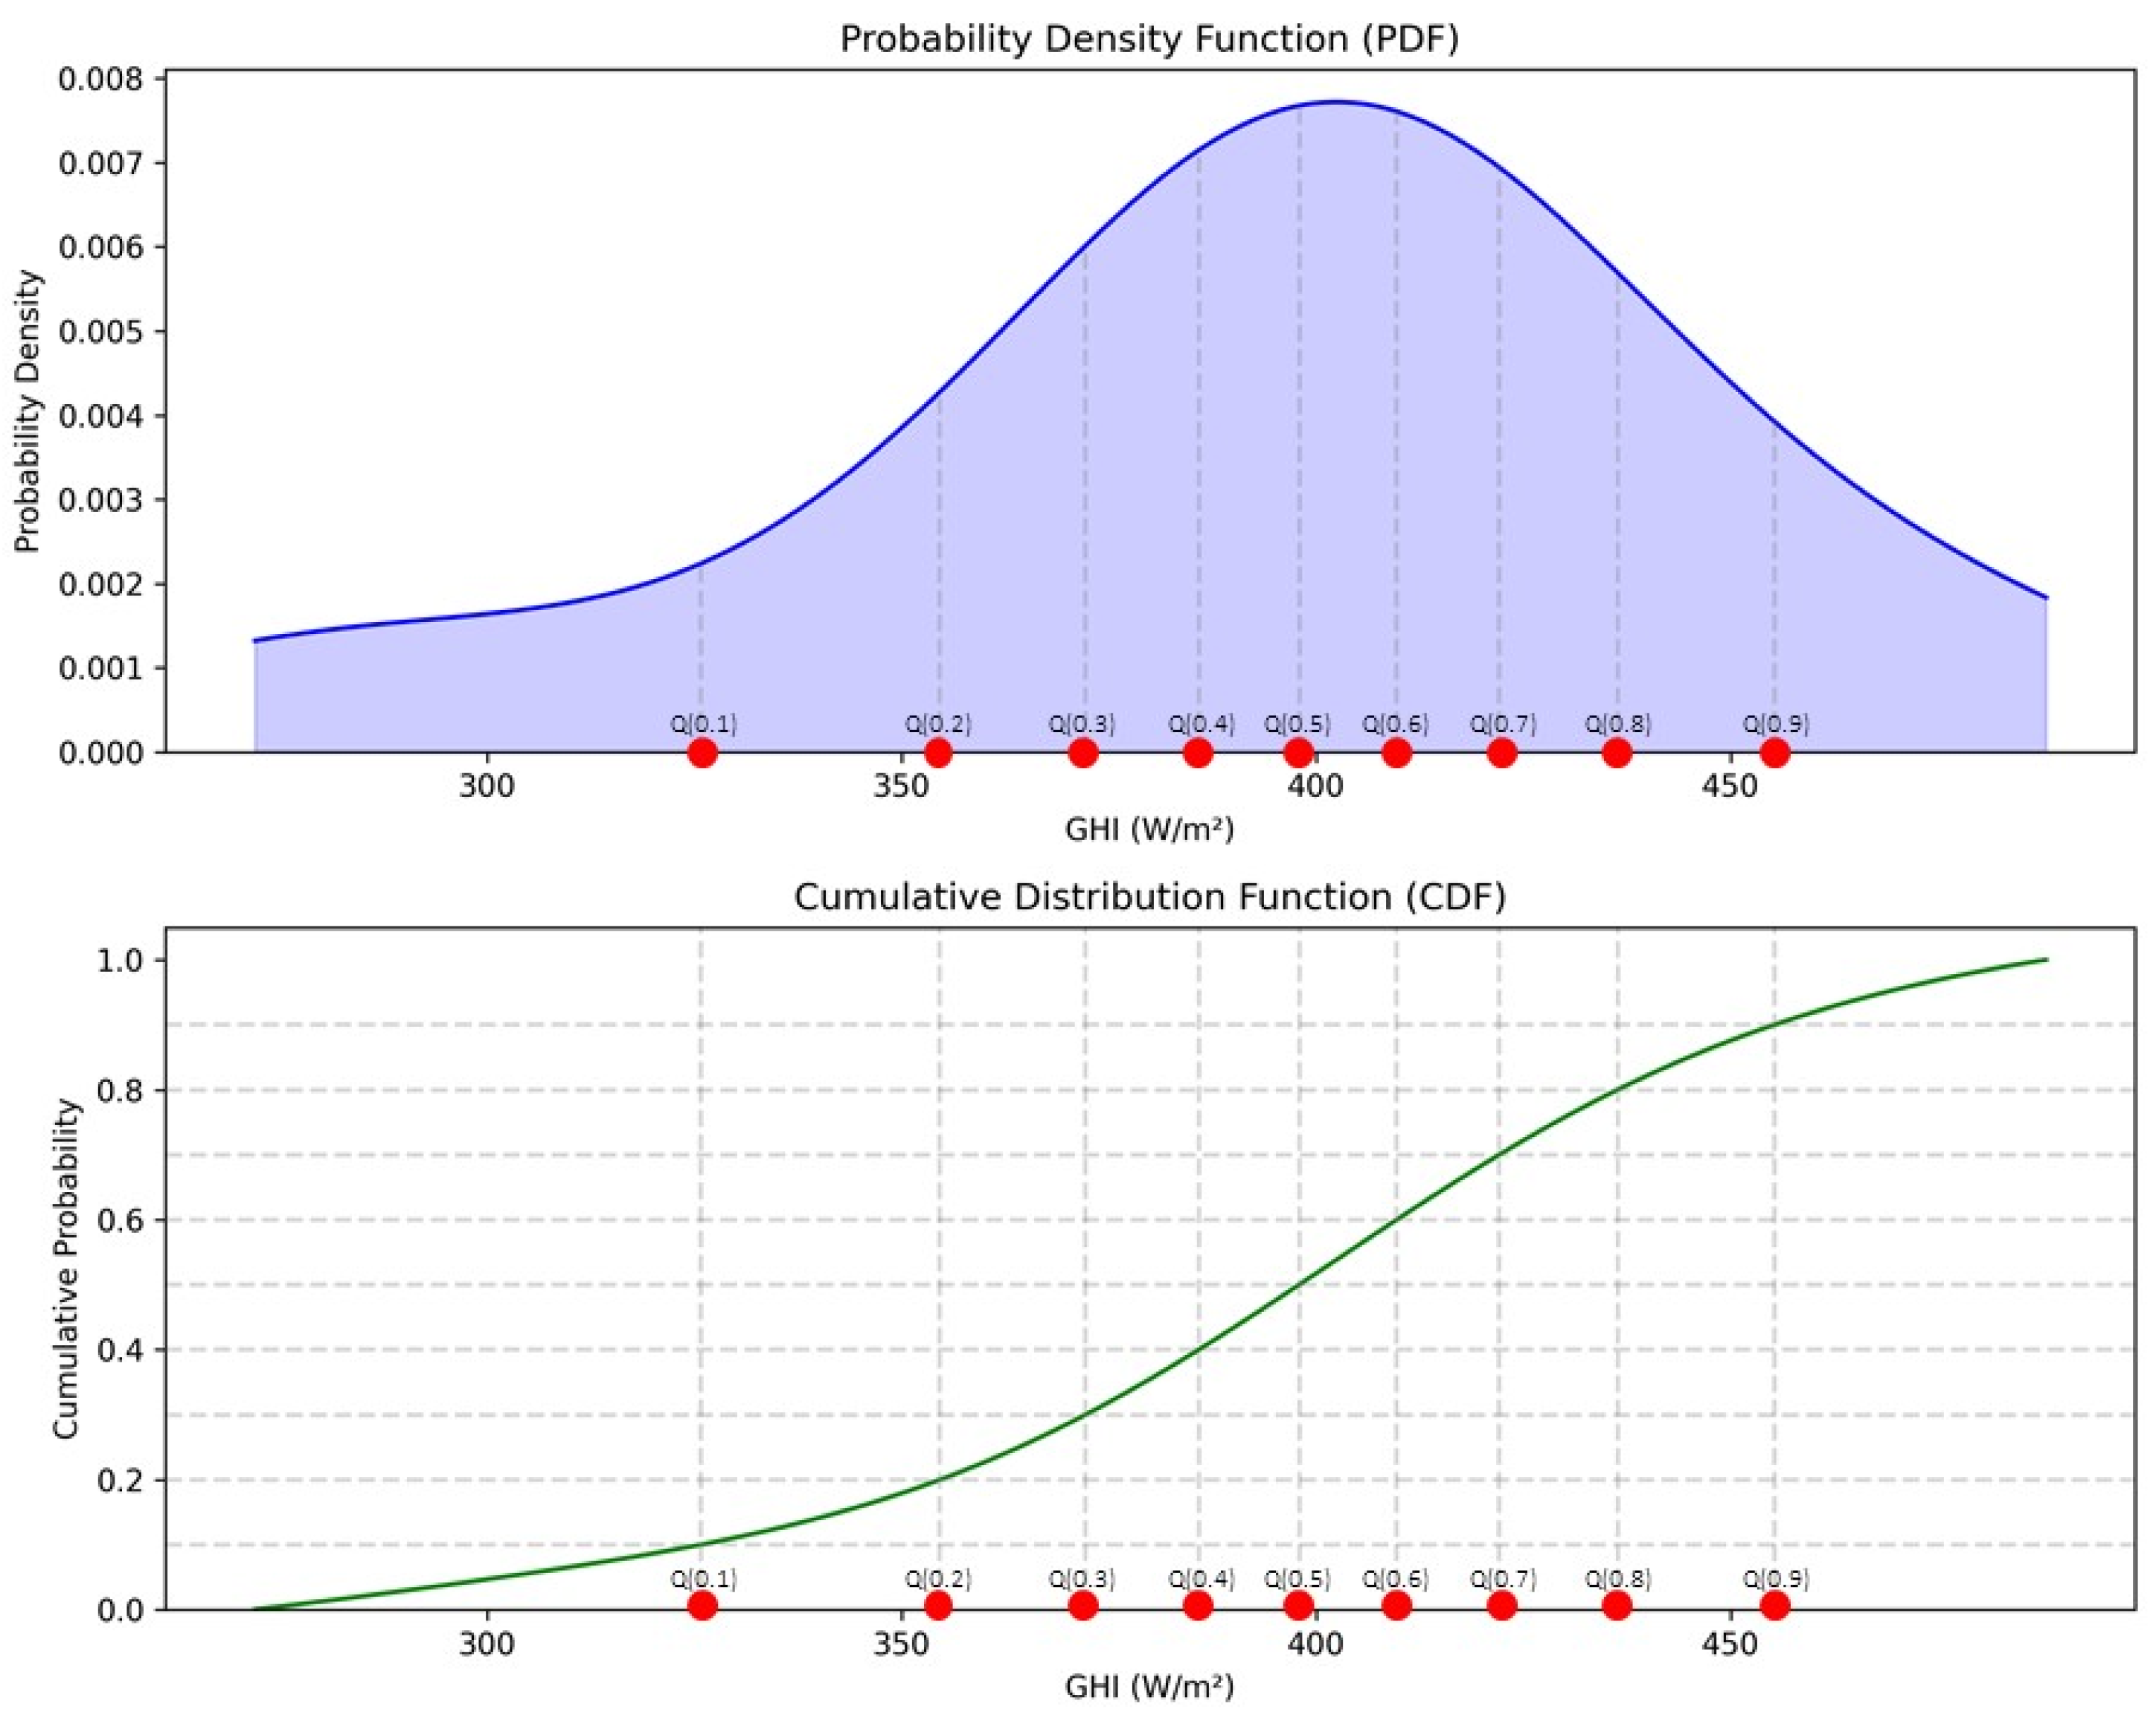
Probability Distribution Function (PDF) indicates the likelihood of different future outcomes within a range, providing the relative probability of observing specific values [29]. Cumulative Distribution Function (CDF) shows the total probability that a value will be less than or equal to a certain point. Mathematically, the CDF corresponds to the integral of the PDF. Figure 5 illustrates both the PDF and CDF for a given probabilistic Global Horizontal Irradiance(W/m2) forecast.
Prediction Interval (PI) is derived from quantiles of the PDF and CDF, defining the range within which a future observation is expected to fall with a certain level of confidence. For instance, to obtain an 80% confidence PI, the quantiles Q(0.1) and Q(0.9) are used to set the interval bounds (see Figure 5).
In the literature, all three outputs—PDF [30,31], CDF [32,33], and PI [34,35]—are commonly used. The key advantage of having a PDF or CDF is that they provide complete information, allowing for the derivation of PI if needed. However, starting with a PI alone, it is not possible to reconstruct the full PDF or CDF.
In the text mining analysis, based on frequency of occurrence, PDF ranks first, followed by CDF, and then PI.
Another output format, which does not have a commonly used abbreviation and thus did not appear in the text mining results, is scenario-based forecasting. In this approach, different possible future scenarios are generated. This format is commonly associated with Ensemble Prediction Systems (EPSs) within Numerical Weather Prediction (NWP) models (see Section 4.3.1 for further details on the functionality of EPS and NWP). A transition from scenario-based forecasting to CDF can be made. One of the simplest methods mentioned in the literature is as follows: suppose we have n scenarios. These scenarios are first sorted in ascending order, and each is then assigned an equal probability of 1/n, among other possible approaches [36].
The choice of output format in probabilistic forecasting is crucial as it affects the selection of error metrics (see Section 4.4 for more details).
In [6], the abbreviation PI was not mentioned. This omission is not due to trends, as PI is a well-established technical concept in the literature, even prior to 2017. Instead, it may be attributed to the limitations of text mining. Therefore, this section complements [6] regarding solar energy forecasting output formats.

4.3. Solar Forecasting Methods

This section focuses on the methods used in solar energy forecasting, which are generally categorized into two main types. The first classification is based on the type of data source: satellite imageries, sky imageries, numerical weather prediction (NWP) data, or on-site historical time series data [37,38,39]. The second classification concerns the data processing techniques used to produce forecasts, such as statistical techniques, machine learning techniques, physical satellite models, empirical methods, or persistence methods [40]. Additionally, hybridization approaches can be found within both classifications.

4.3.1. Classification Based on Type of Data Sources

It is important to note that the choice of data source is primarily driven by its spatio-temporal resolution. This section will provide an overview of each type of data source, emphasizing its spatio-temporal resolution, explaining its general principles, analyzing it in relation to relevant abbreviations identified through text mining where applicable, and comparing it with the findings in [6] to identify any trends.
  • Satellite and Sky Imageries:
Techniques based on satellite and sky imagery use images from sky imaging devices (cameras pointed at the sky) or geostationary meteorological satellites. Cloud movement can be predicted by calculating motion vectors from consecutive images [41,42]. The forecast can then be carried out using physical or empirical models. Alternatively, it can be done directly by inputting images into some deep learning models. Details on the physical satellite models, empirical models, and deep learning methods are presented in Section 4.3.2.
Geostationary meteorological satellites are designed to remain stationary above a specific point on Earth by matching their movement with the planet’s rotation, achieved by positioning them at an altitude of 35,786 km [43]. Equipped with a variety of sensors, including those for visible and infrared light, such satellites typically capture images every 10 to 15 min.
Solar energy forecasting techniques using satellite imagery are effective up to 6 h [7]. This limitation arises because satellite-based methods primarily rely on cloud motion advection, which provides reliable information on the displacement of existing cloud fields over short horizons. Beyond about 5–6 h, atmospheric dynamics such as cloud formation, dissipation, and changes in wind fields introduce greater uncertainty, reducing the predictive skill of purely satellite-driven approaches. However, the spatial resolution of these forecasts is relatively coarse, typically covering areas of several kilometers.
Table 3 features abbreviations linked to families of geostationary meteorological satellites, identified by our text mining analysis, accompanied by corresponding details for each. It is worth noting that, for the Himawari family of geostationary meteorological satellites, the abbreviation HIMAWARI was not found; instead, identification was made through the abbreviation JMA (Japan Meteorological Agency), which is the operator of this satellite family.
Table 3 is not exhaustive but includes those identified through text mining. The three families listed provide global coverage across all longitudes, with at least latitudes between −70° and +70° covered. An exhaustive list, including the history of inactive, operational, and planned geostationary satellites, along with their respective dates and other information, can be found at (https://space.oscar.wmo.int/satellites; accessed on 15 June 2024).
Sky imagery consists of cameras directed towards the sky that capture photos at regular intervals, providing frequent intra-hour updates on cloud conditions [44]. Their main advantage is the high spatiotemporal resolution they offer for solar forecasting compared to other techniques. They are particularly effective in predicting solar ramps [45].
The main abbreviations identified for sky imageries are (TSI) for Total Sky Imager and (ASI) for All Sky Imager or (WSI) for Whole Sky Imager, the latter two referring to the same system. Both TSI and ASI/WSI systems are commercially available solutions.
The TSI, developed earlier, captures sky images using a convex mirror for a large Field of View and does not require calibration [44]. Later, the ASI was introduced as a more affordable alternative, using a fisheye lens attached to a digital camera to expand the Field of View. While both devices are relatively expensive, the ASI is generally more affordable but requires calibration.
Concerning satellite imagery, in [6], the abbreviation HIMAWARI was not identified, whereas MSG and GOES were. However, in this study, the Himawari family of geostationary meteorological satellites was recognized through the abbreviation JMA (Japan Meteorological Agency), which operates the Himawari satellites, rather than through the expected abbreviation HIMAWARI.
Regarding sky imageries, TSI was identified in [6], but neither WSI nor ASI was identified. These terms have been in use in the literature since before 2017, so this is not a post-2017 trend. This could instead be attributed to the limitations of text mining. Consequently, this section complements [6] by addressing more abbreviations related to satellite and sky imagery in the context of solar energy forecasting.
  • Numerical Weather Predictions:
Numerical Weather Prediction (NWP) models predict the evolution of weather conditions over time. Mesoscale models in NWP focus on atmospheric features in specific areas like regions, countries, or continents, while global models capture atmospheric patterns on a global scale.
Using initial conditions from atmospheric measurements or satellite data, these NWP models solve partial differential equations to generate forecasts. Among the predicted variables, solar radiation, wind speed, and temperature can be found.
Table 4 presents abbreviations related to NWP models, along with corresponding details for each, using data verified as of 8 September 2024.
Among the models listed in Table 4, the ECMWF Ensemble Prediction System (EPS) is inherently probabilistic, as it generates probabilistic outputs by running multiple simulations with stochastic perturbations to the initial conditions [46]. This approach enables the estimation of prediction uncertainty. The WRF model can also be run in ensemble mode, making it adaptable for probabilistic forecasts.
In addition to the abbreviations listed in Table 4, there was also IFS, which stands for the Integrated Forecasting System from the European Centre for Medium-Range Weather Forecasts (ECMWF). IFS includes both the ECMWF Ensemble Prediction System and the ECMWF High-Resolution Forecast System.
NWP models are computationally intensive and are typically run only a few times per day, making them unsuitable for forecasts on intra-hour time scales. They stand out for their performance in forecasting horizons ranging from 6 h to up to 2 weeks. Their spatial resolution generally ranges from a few kilometers to several kilometers.
However, stand-alone NWP models are often not sufficient for accurate forecasts [47]. This limitation is why many studies focus on post-processing the outputs (see Section 4.3.2 for more details).
In [6], the abbreviations ECMWF EPS and AROME were not extracted, and this is not likely due to post-2017 trends. These terms have been in use in the literature since before 2017. Instead, this omission could be attributed to the limitations of text mining.
  • On-site Historical Time Series Data:
Historical on-site time series data comprise solar radiation measurements or PV power/energy output that form time series used for forecasting. These data are collected from on-site measurements. A key advantage of using local measurement data is its extensive temporal coverage, ranging from minutes to several hours, coupled with high spatial resolution, focused on a specific site (point-based). Refer to Section 4.3.2 for details on the treatment of historical time series data for solar energy forecasting.
One of the key abbreviations identified in this section through text mining is BSRN, which stands for the Baseline Surface Radiation Network (https://bsrn.awi.de/; accessed on 10 September 2024). It offers high-quality ground-based radiation measurements with high temporal resolution at various locations globally. This data has been widely used in numerous scientific publications, including [48,49,50].
Similarly, the abbreviation SURFRAD, standing for Surface Radiation Budget (https://gml.noaa.gov/grad/surfrad/; accessed on 10 September 2024), was also identified through text mining. SURFRAD is a seven-station radiation monitoring network in the USA that collects GHI, BHI, and DHI components at 1-min intervals. Its data have been applied in solar energy forecasting research. However, while BSRN was referenced in [6], SURFRAD was not.

4.3.2. Classification Based on Data Processing Methods

Following the discussion on data sources, the second classification focuses on the methods used to process the data to achieve the final forecast. These methods include physical satellite models, empirical methods, statistical techniques, machine learning techniques, and persistence methods.
  • Physical Satellite Models and Empirical Methods:
This section offers an overview of how satellite data and sky images are utilized by physical satellite models and empirical methods for solar energy forecasting.
The text mining analysis, related to this section, identified the abbreviation RTM, which stands for Radiative Transfer Model, and is also noted in [6].
Physical satellite models consist of Radiative Transfer Models (RTMs) that explicitly simulate the interaction between atmospheric components, such as gases and aerosols, with solar radiation, typically relying on input data derived from satellite observations [51]. When combined with cloud movement information predicted from cloud motion vectors based on consecutive images, these models can forecast solar radiation. Although physical models are complex and computationally demanding [26], they provide detailed forecasts.
In contrast, empirical methods use data obtained from satellite and sky images, combined with clear-sky models, empirical relationships and cloud motion data, to forecast solar radiation. A clear-sky model estimates the amount of solar radiation reaching the Earth’s surface under a cloud-free atmosphere [52]. The key metric, the clear-sky index Kc, represents the ratio between actual measured solar radiation and the estimated radiation under clear-sky conditions.
In satellite-based empirical methods, Kc is forecasted from satellite-measured reflectance using empirical relationships, combined with cloud movement data. The Kc index is then multiplied by the clear-sky radiation value to obtain the solar radiation forecast [41,53,54].
In a similar process, for sky images, after detecting and identifying clouds and applying cloud movement data, the Kc index is calculated based on empirical relationships derived from the image data. This index is also multiplied by the clear-sky radiation value to generate the forecasted solar radiation [55,56].
Empirical methods are well-established and frequently used in the literature compared to physical models. However, physical models have significant potential for improvement, particularly in refining direct and diffuse components individually [26].
A limitation of cloud movement vectors arises when clouds form or dissipate quickly within a timeframe shorter than the forecasting horizon.
  • Statistical and Machine Learning Methods:
This section discusses the statistical and machine learning methods used in solar energy forecasting, providing an overview of trends from 2017 to 2023 and comparing the results with those in [6], which focus on the period prior to 2017.
All the definitions that follow will be specific to the scope of this study, pertaining to solar energy forecasting.
Statistical methods use mathematical techniques and models to analyze data, focusing on identifying relationships, trends, and making forecasts based on historical data.
Machine learning involves algorithms that enable computers to learn from data and enhance their forecasts or decisions over time without explicit programming. Machine learning offers greater flexibility compared to traditional statistical methods, allowing for more complex and adaptive models.
Within statistical methods, we can categorize them into two main groups: Traditional Time Series Methods and Regression. Machine learning methods can be further divided into standard Machine Learning techniques, Neural Networks, and Deep Learning approaches.
Time series methods are designed to model and forecast historical time series data, capturing trends and seasonality over time. Regression techniques, on the other hand, forecast continuous outcomes based on the relationships between numerical variables.
Neural networks, inspired by the human brain, consist of layers of interconnected nodes that can process complex patterns, though they are typically limited in depth. Deep learning, an advanced subset of neural networks characterized by multiple layers, excels in handling highly complex tasks such as image recognition and sequence analysis.
The text mining analysis highlighted the distribution of categories by the frequency of abbreviations: Traditional Time Series Methods (9%), Regression (6%), standard Machine Learning techniques (16%), Neural Networks (20%), and Deep Learning approaches (49%). It is important to remember that, in our analysis, only abbreviations appearing five times or more were considered, as mentioned in Section 2.3.2.
The dominance of deep learning, representing nearly half of the methods, reflects a strong trend towards these approaches.
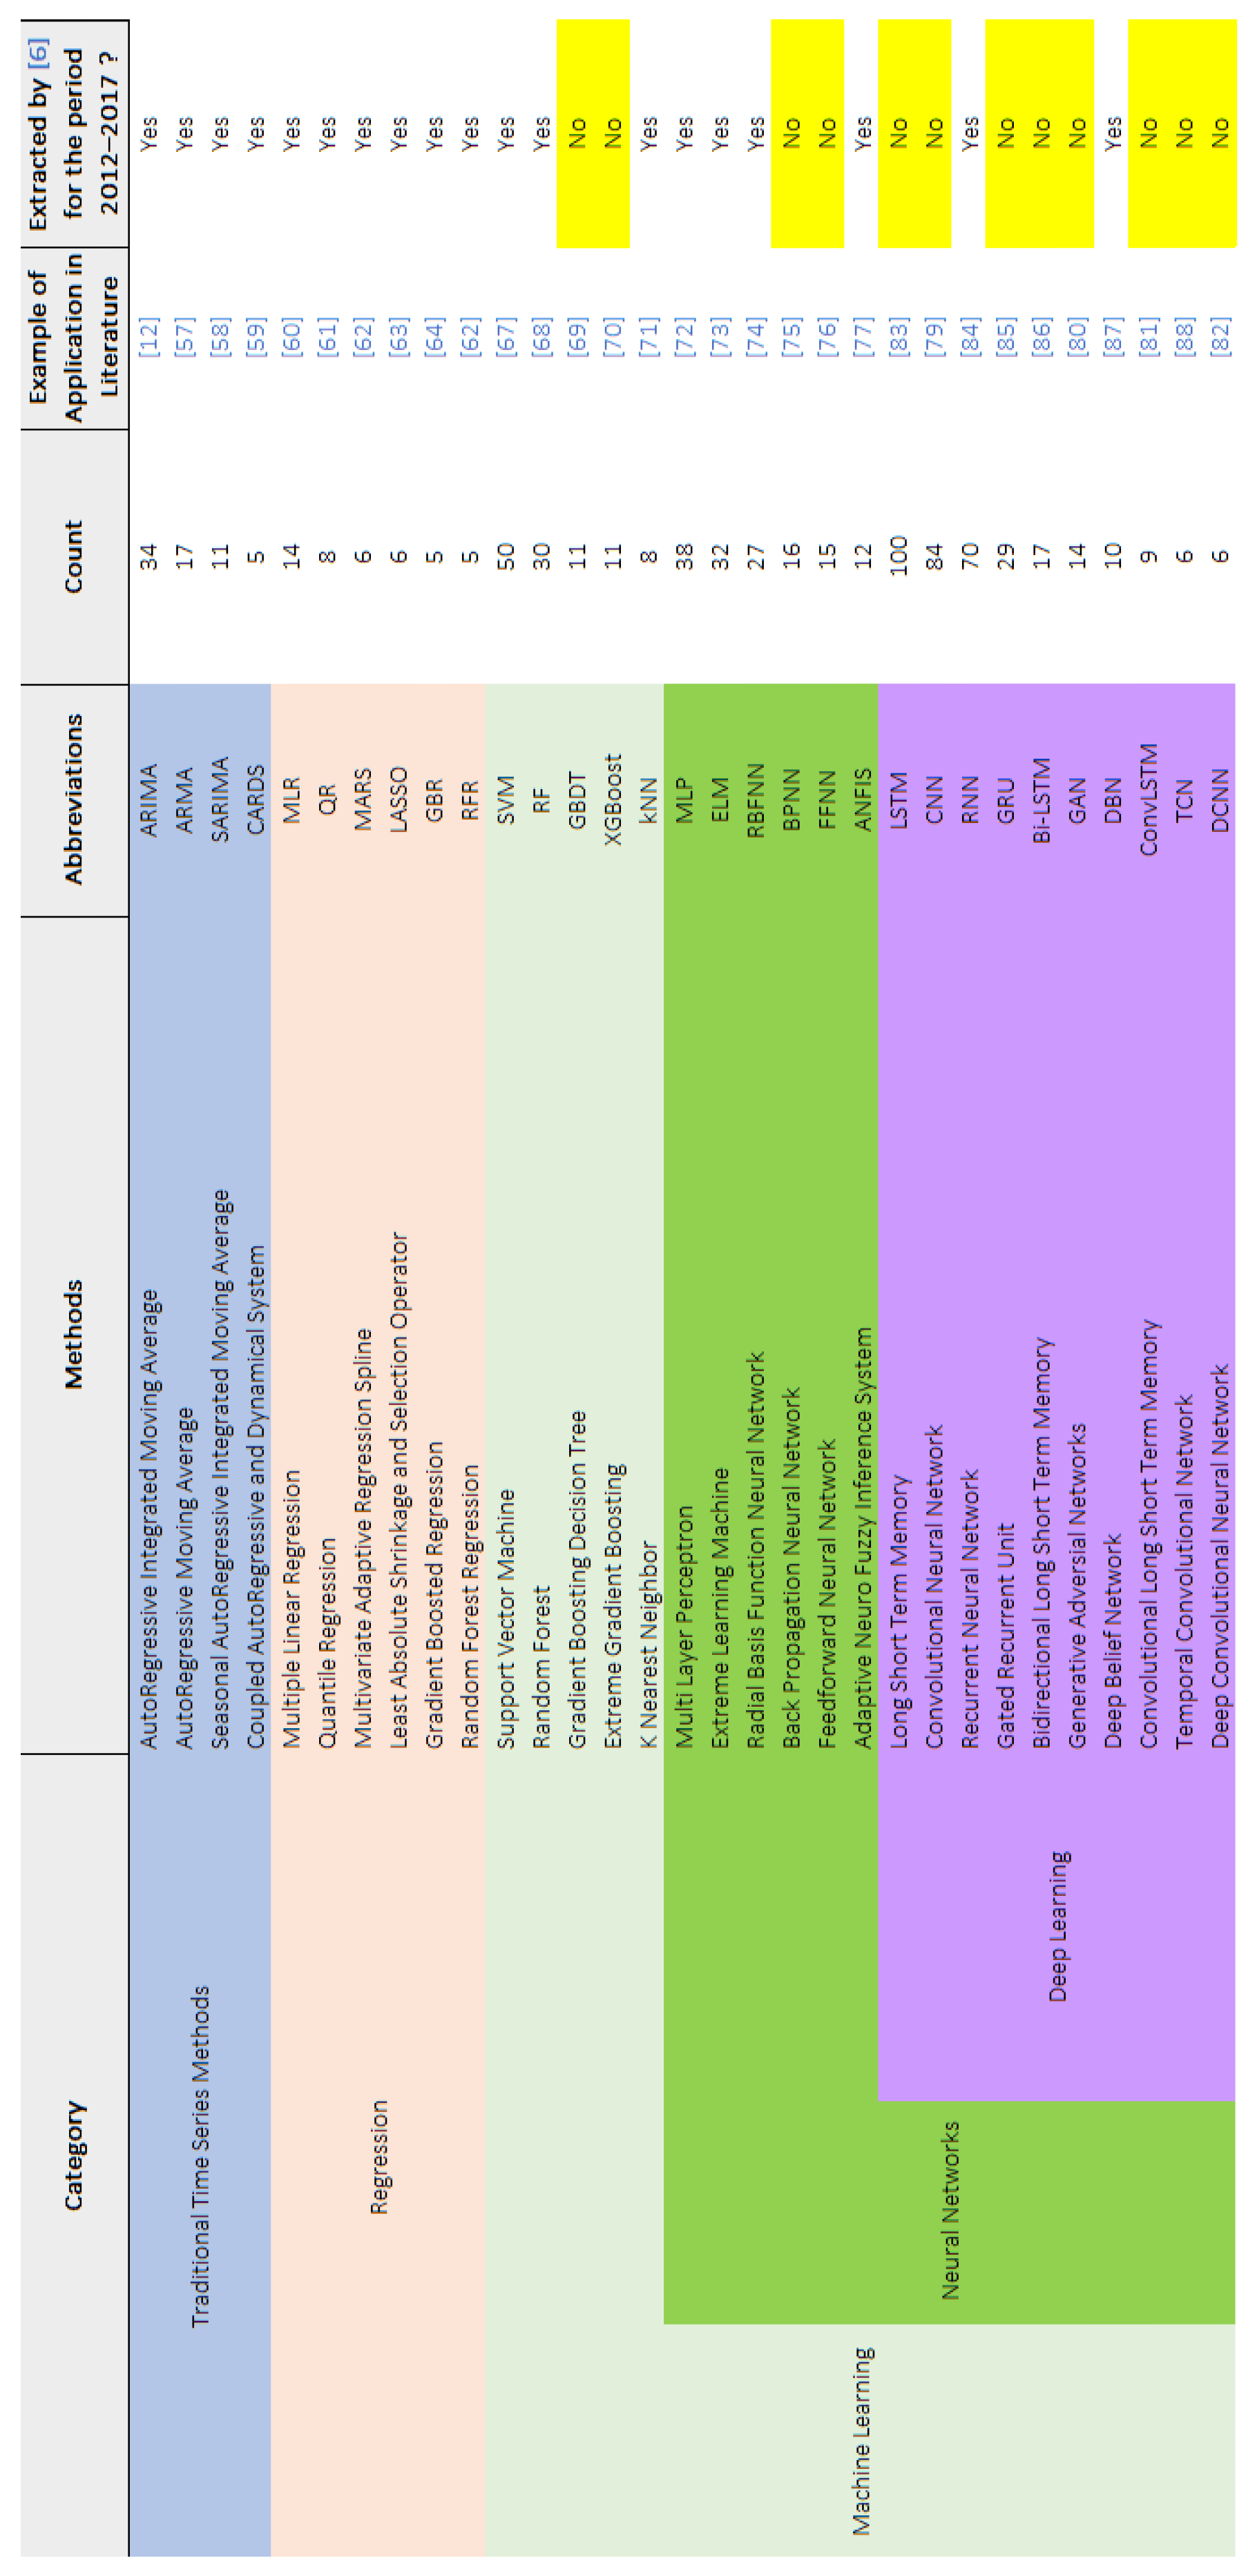
All the abbreviations found in each category are presented in Figure 6, which summarizes the identified methods, their abbreviation counts, examples of applications in the literature, and whether they were detected in the text mining analysis conducted by [6], which focused on the period before 2017. This is compared with our data covering 2017–2023 to highlight trends.
The top three methods identified in the text mining analysis, based on frequency, are all Deep Learning techniques: Long Short-Term Memory (LSTM) with 100 occurrences, Convolutional Neural Network (CNN) with 84, and Recurrent Neural Network (RNN) with 70.
Newly identified methods, not captured by [6], are found exclusively in the machine learning category and its subcategories. Notably, 8 out of 10 deep learning methods were not detected by [6] but identified in our analysis; we highlight the current trend. This trend, previously observed but not quantified in the literature, is now quantified through our results. It primarily reflects the advancements in computational capabilities that have enabled the shift towards more complex and effective deep learning models.
In comparison with Yang et al. [6], which covered the 2012–2017 period, the field was dominated by traditional time series approaches and shallow neural networks, while regression and standard machine learning techniques played only secondary roles. Deep learning methods were essentially absent at that time. By contrast, our 2017–2023 analysis reveals that deep learning has emerged as the leading category, reshaping the hierarchy of methods. Table 5 summarizes this shift in ranking across the main categories.
Figure 6 provides references for practical applications in the literature for each method identified through text mining analysis. Readers can refer to these sources for detailed information and theoretical context. After quantifying the trend, the remainder of this section gives an overview of how these methods are applied.
Traditional time series methods, by definition, handle numerical data and are therefore suitable for forecasting using historical time series [12,57,58,59]. Regression techniques are similarly applicable for forecasting based on numerical data relationships [60,61,62,63,64]. These approaches can also be used in the post-processing of NWP outputs [65,66].
Standard machine learning techniques and Neural Networks identified through text mining are also adept at handling numerical data and are therefore appropriate for forecasting using historical time series [67,68,69,70,71,72,73,74,75,76,77]. These methods can similarly be applied in the post-processing of NWP outputs [78].
In contrast, deep learning methods identified through text mining can either process images or exclusively handle numerical data. Convolutional Neural Networks (CNNs), Generative Adversarial Networks (GANs), Convolutional Long Short-Term Memory (ConvLSTM), and Deep Convolutional Neural Networks (DCNNs) are capable of processing images for forecasting purposes. For example:
  • In [79], two CNN models were developed that take sky images as input and forecast GHI as output. These models are commonly referred to as end-to-end models in the literature, as they are trained to input an image and output a forecasted radiation value.
  • In [80], a GAN model was introduced that uses solar irradiance maps created from satellite images, generating a forecast irradiance map from a solar irradiance map at time t.
  • In [81], a ConvLSTM approach was tested using sky images and irradiance history as inputs to forecast irradiance.
  • In [82], a DCNN end-to-end approach was employed to forecast GHI from sky images.
The other deep learning methods identified typically handle numerical data and are well-suited for forecasting with historical time series [83,84,85,86,87,88]. They can also be effectively applied in the post-processing of NWP outputs [89].
Figure 6. Abbreviations Related to Statistical and Machine Learning Methods Identified Through Text Mining Analysis with Corresponding Details: Full form, frequency of occurrence, example of application in the literature [12,57,58,59,60,61,62,63,64,67,68,69,70,71,72,73,74,75,76,77,79,80,81,82,83,84,85,86,87,88], and whether extracted or not in ref. [6] (non-extracted abbreviations in ref. [6] highlighted in yellow).
Energies 18 05231 g006
Among the methods identified in the text mining analysis, only Quantile Regression (QR) is specifically designed for probabilistic forecasting, though all the methods identified are theoretically adaptable for this purpose.
Hybridization of methods is also an option, allowing for the combination of their strengths, whether in handling time series or images. See Section 4.3.3 for more details.
  • Persistence:
This section discusses Persistence methods, which are frequently used as naive benchmark tools to assess the performance of forecasting models. Any improvements in forecasting should be measured against these standard reference techniques [90].
The simplest form of persistence assumes that the forecasted value at time t + h (the forecasting horizon) will be the same as the measured value at time t. This is known as simple persistence in the literature [91].
Text mining identified the following abbreviations related to persistence: SP and PeEn. SP stands for Smart Persistence, and PeEn stands for Ensemble Persistence.
In Smart Persistence, at time t, to forecast radiation at t + h, the clear sky radiation for t + h is first calculated (refer to Section 4.3.2 for information on clear sky models). This clear sky radiation is then multiplied by the clear sky index Kc from time t, and the resulting product provides the forecasted radiation for t + h [92].
Ensemble Persistence is applied in probabilistic forecasting, using historical data from recent days to build probability distribution functions for each time point t [27].
Text mining analysis can sometimes miss important concepts. One such concept is Climatology Persistence (CLIPER), a term frequently used in recent research. CLIPER combines climatology, the historical average of the predicted value, and simple persistence, using a convex combination [93,94,95].
However, CLIPER did not appear in the text mining results, meaning that it showed up fewer than five times in the analysis. A manual search for “(CLIPER) + solar energy forecasting” on Google Scholar identified only one article where CLIPER was in parentheses; in other cases, it appeared without them. As noted in Section 2.3.2, the text mining algorithm specifically detects terms in parentheses, which can cause it to overlook important terms when they are not presented in this format.
It is worth noting that some studies do not compare their models to reference methods, as highlighted by [96]. SP and PeEn were both present in text mining results of [6].

4.3.3. Hybridization

After presenting the methods according to two classifications—Data Source and Data Processing—it became evident that each data source has its own advantages and disadvantages, primarily related to spatial and temporal horizons for forecasting. Additionally, the processing methods differ in their nature, and they vary in complexity. For these reasons, hybridization is a viable option, enabling the combination of strengths from various approaches.
Hybridization can occur between data sources. For instance:
  • Ref. [12] combines cloudiness information as an exogenous variable with ground measurements to enhance forecast performance.
  • Ref. [97] integrates satellite and sky images for improved deterministic and probabilistic intra-hour GHI forecasting.
  • Ref. [98] merges same-day NWP forecasts with satellite data for more accurate forecasting.
Hybridization can also occur between data processing methods. For example:
  • Ref. [17] proposed an approach that combines several deep learning techniques, including LSTM and GRU, with a statistical method.
  • Ref. [99] suggested a hybridization of CNN and LSTM.
Since 2020, the literature has introduced several new methodological paradigms that align with this hybrid perspective:
  • Multi-modal learning, which fuses heterogeneous data types (e.g., images, time series, and physical features) into a unified model [100].
  • Graph-based learning, which models spatial-temporal relationships as graphs to better capture structural dependencies in the data [101].
In quantitative terms, hybridization across data sources remains limited, representing about 1.4% of the analyzed articles. Hybridization across data processing methods is more prevalent, representing about 10% of the analyzed articles. Within this category, CNN + LSTM approaches account for approximately 6.2% and other strategies contribute the remainder. In addition, emerging paradigms contribute further: graph-based learning accounts for ≈0.4% of the analyzed articles, while multimodal learning remains less frequent at ≈0.2%.
Unlike the period prior to 2017, when [6] did not identify clear tendencies toward hybridization, these results reveal a growing convergence between multiple data modalities and modeling strategies, reinforcing the increasing relevance of hybrid approaches in recent years.
Overall, hybridization—whether across data inputs, processing methods, or both—represents a promising direction for solar energy forecasting, offering enhanced adaptability across forecasting horizons and use-case requirements.

4.4. Error Metrics

After the previous section reviewed methods used in solar energy forecasting, the focus now shifts to key aspects of the error metrics used to evaluate forecasting performance.
Different error metrics are used depending on whether the forecast is deterministic or probabilistic. Several studies, including [6,102,103,104], provide analyses and formulas for these error metrics. Since these formulas are well-established and readily accessible, they are not repeated here. Readers interested in the formulas can refer to the cited references. This section will instead highlight trends and provide an overview.
Deterministic error metrics have received considerable attention in the literature and are often discussed more extensively than probabilistic ones, a trend confirmed by the text mining analysis.
Table 6 lists the error metric abbreviations captured, their full forms, classification as probabilistic or deterministic, frequency of occurrence, and examples from the literature. It reveals that deterministic error metrics are mentioned nearly 11 times more frequently than probabilistic ones.
According to our text mining analysis, the most widely used error metric in deterministic forecasting is the Root Mean Square Error (RMSE), with 142 occurrences. For probabilistic error metrics, the Continuous Ranked Probability Score (CRPS) is the most prominent, with 15 occurrences.
It is worth noting that rRMSE and nRMSE have the same formula, both referring to normalized versions of RMSE, typically normalized by the mean or by the range between the maximum and minimum values. Despite representing the same metric, they appear under two different abbreviations in the literature.
An important consideration is the categorization of probabilistic error metrics and their connection to Forecasting Output Formats (refer to Section 4.2 for more details on Solar Energy Forecasting Output Formats). The probabilistic error metrics listed in Table 6 fall into two primary categories:
  • Metrics assessing Prediction Interval (PI) quality: Prediction Interval Normalized Average Width (PINAW), Prediction Interval Coverage Probability (PICP), and Coverage Width-based Criterion (CWC).
  • Metrics evaluating Cumulative Distribution Function (CDF) quality: Brier Score (BS) and Continuous Ranked Probability Score (CRPS).
It is noted that no new abbreviations related to this section have emerged compared to [6].

5. Distinction Between Forecasting, Prediction, and Estimation

This study successfully identified and quantified trends, but it is important to acknowledge that a text mining approach has its limitations. While analyzing word frequency across selected articles, some confusion can arise, especially when terms are not consistently or accurately used. The scientific community sometimes employs terms that are not well-chosen, and definitions can be unclear or confusing.
This paper focuses on solar energy forecasting, specifically forecasting a future value X(t + h), where h is the time horizon, based on previous values measured at prior time points. However, confusion sometimes arises when calculating a variable X(t) from other variables measured at the same time, such as determining horizontal global irradiance, GHI(t), from meteorological data like wind speed, ambient temperature, and humidity.
In this context, “forecasting” and “prediction” are appropriate for determining a future value, while “estimation” is more suitable for calculating the value of a variable from other variables measured at the same time.
However, are these terms always used with their precise definitions? Not necessarily. For instance, in [119], the word “forecasting” appears in the title, but the literature review also covers models that estimate solar radiation based on existing meteorological data. In [120], “forecasting” is also found in the title and keywords, while the actual topic is using ANN models to determine solar irradiance from other meteorological data measured simultaneously. The word “prediction” is similarly used in the text. In [121], “prediction” is in the title of a paper where hourly solar irradiation for Kuala Lumpur is calculated based on sunshine hours, day, month, temperature, humidity, and location coordinates.
Thus, the presence of the terms “prediction” or “forecasting” in a paper’s title does not always indicate that the paper involves forecasting or predicting a future value. These instances are exceptions, and, with a large volume of articles, the errors caused by such confusion can be mitigated.

6. Companies

Until now, this work has focused on the existing scientific literature, primarily driven by academic researchers. The focus now shifts to providing an overview of companies operating in solar energy forecasting.
Ref. [7] is one of the few, if not the only, articles in the solar energy forecasting literature that discusses companies in the field. It provides a list of some companies operating in solar energy forecasting. [7] highlights the need to improve coordination between companies and end users at the utility level (i.e., grid operators).
In this section, additional insights will be provided, focusing on the same set of companies mentioned in [7], namely Steadysun (https://www.steady-sun.com/; accessed on 30 September 2025), address: 18 Rue du Lac Saint-André, 73370 Le Bourget-du-Lac, France, Reuniwatt (https://www.reuniwatt.com/; accessed on 30 September 2025), address: 14 rue de la Guadeloupe, 97490 Sainte-Clotilde, France, Solcast (https://www.solcast.com/; accessed on 30 September 2025), address: 32 Halloran St, Lilyfield 2040, Sydney, Australia; PO Box 772, Leichhardt NSW 2040, Australia, Openclimatefix (https://openclimatefix.org/; accessed on 30 September 2025), address: 5th Floor, Sustainable Ventures, County Hall, Belvedere Rd, SE1 7GP, United Kingdom and SolarAnywhere (https://www.solaranywhere.com/; accessed on 30 September 2025), address: Clean Power Research, 330 120th Ave NE, STE 200, Bellevue, WA 98005, United States of America.
Beyond these actors, industry surveys such as the IEA PVPS Task 16 report [122] identify a broader ecosystem of providers offering operational forecasting solutions. These include both specialized firms and large service providers that integrate solar forecasting into broader energy management platforms. In addition to the previously mentioned companies, the report cites Meteocontrol (https://www.meteocontrol.com; accessed on 30 September 2025), address: Pröllstr. 28, 86157 Augsburg, Germany, Suntrace (https://www.suntrace.de; accessed on 30 September 2025), address: Große Elbstraße 145C, 22767 Hamburg, Germany, WattTime (https://www.watttime.org; accessed on 30 September 2025), address: 490 43rd Street, Unit 221, Oakland, CA 94609, United States of America, Prediktor (https://www.prediktor.com; accessed on 30 September 2025), address: P.O. Box 296, N-1601 Fredrikstad, Norway, and GreenPowerMonitor (https://www.greenpowermonitor.com; accessed on 30 September 2025), address: Gran Via de les Corts Catalanes 130, 9th Floor, 08038 Barcelona, Spain. The report underlines those commercial solutions often differentiate themselves not only by forecast accuracy but also by integration capabilities, delivery formats such as API-based services or cloud dashboards, and the ability to tailor outputs to utility and market operator requirements.
Some of these companies were contacted directly, whereas information about others was gathered from their websites. It is important to clarify that Openclimatefix is not a private company but a non-profit research and development lab that uses an open-source approach in developing its solutions. The other mentioned are all private companies.
Based on our discussions and research on these companies, it has been observed that the approach taken by companies typically involves forecasting these solar radiation components (GHI, BNI, and DHI) and offering models to convert these forecasts into GTI and corresponding power or energy output. In contrast, the academic community, as mentioned in Section 4.1, primarily focuses on forecasting only GHI in most scientific publications related to solar radiation forecasting, while transposition studies are typically addressed separately in dedicated studies.
Another point is that recent prices of bifacial photovoltaic panels have become very competitive compared to monofacial ones. Today, bifacial photovoltaic technology is seen as having the potential to replace monofacial panels in the coming years due to its superior performance and the downward trend in its price [123]. Some of these solar energy forecasting companies now offer the option to convert predicted radiation into bifacial photovoltaic power/energy.
Additionally, some of these companies also provide Typical Meteorological Year (TMY) data and time series derived from satellite-based solar radiation estimations, which are crucial during the pre-study phase of solar projects and offer valuable insights. Others are positioning themselves for real-time monitoring of photovoltaic plants by comparing expected production with real-time data, enabling the tracking of installation health and anticipating maintenance needs.
The services provided by these solar energy forecasting companies are focused on practical applications, and academic researchers are encouraged to adopt a similar approach in their work. They are invited to take into account engineering aspects and practical applicability.
Finally, it should be acknowledged that this section does not aim to provide an exhaustive survey of all commercial actors worldwide. Instead, it offers exploratory insights based on a representative set of companies mentioned in [7], complemented with additional details from industry reports. A more systematic review of commercial providers would be necessary to fully capture the diversity of market actors and services.

7. Discussion

Between 2017 and 2023, research output was led by China, followed by the United States and India (Section 3.3). By contrast, during 2012–2017 [6], the distribution was more US-centered, with China emerging but not yet dominant and India outside the top three. This shift reflects the growing role of Asia in solar forecasting research and mirrors the broader global redistribution of PV deployment and investment.
Over the same period, the modelling landscape is marked by the predominance of deep-learning architectures (≈49%), with standard ML techniques representing ≈16%, shallow neural-network families ≈ 20%, traditional time-series frameworks ≈ 9%, and regression-based strategies ≈ 6%. In the 2012–2017 period [6], traditional time-series approaches and shallow neural networks were more prevalent. The reordering observed in 2017–2023 is consistent with the availability of larger datasets, the expansion of computational capacity, and the diffusion of methods across disciplines. Deep-learning models such as LSTM, CNN, and RNN appear frequently, suggesting that architectures initially developed in other fields are increasingly applied to solar forecasting tasks.
The results also indicate a measurable evolution toward hybrid modelling strategies. Across data sources (e.g., satellite data, NWP, sky images, ground-based measurements), explicit fusion is limited (≈1.4%) but illustrates the potential benefits of combining complementary information streams. Before 2017, ref. [6] did not report a systematic trend in this direction. Across processing paradigms, hybridization is more common (≈8.6%), with CNN + LSTM combinations accounting for ≈6.2%. In addition, graph-based learning contributes ≈0.4% and multimodal learning ≈0.2%. The rise in these approaches points to a diversification of modelling strategies, with a progressive move away from isolated paradigms. Compared to the earlier period, where hybridization was largely absent, the current literature shows the emergence of a more integrative methodological perspective.
In terms of evaluation, deterministic error measures remain dominant, appearing nearly an order of magnitude more frequently than probabilistic ones. This imbalance shows that point forecasts continue to structure most studies, while probabilistic evaluation is less represented. The emphasis on deterministic metrics aligns with historical practice, but the growing number of works mentioning interval and distributional measures indicates that the field is gradually opening to alternative forms of evaluation.
Regarding forecasted variables, the results confirm that GHI continues to dominate, while GTI and DNI appear less frequently.
It should be noted that a potential bias may have been introduced in the text-mining process. Although the structural analysis of authors, journals, and countries was conducted on a balanced dataset of 500 articles proportionally selected from Google Scholar results (as detailed in Section 2.2), the full-text abbreviation analysis was restricted to 276 ScienceDirect articles due to the accessibility of Elsevier’s API (as detailed in Section 2.3). As a result, abbreviations more frequently occurring in Elsevier journals could have been overrepresented. Nevertheless, this effect is considered minimal, since the vocabulary of abbreviations in the solar forecasting domain is universally employed across publishers. Moreover, as the main trends regarding research output, geographic distribution, and methodological categories were derived from the broader 500-article dataset, the overall validity of the findings is not compromised.
Another limitation relates to the standardization of raw metadata. Author names, institutional affiliations, and country designations were sometimes reported inconsistently across publishers, which could have introduced distortions in the structural analysis. As explained in Section 2.3.1, this issue was addressed by applying Jaccard hierarchical clustering, followed by manual verification and correction, to harmonize the entries. While this procedure improved the robustness of the dataset, it highlights that text-mining approaches are sensitive to data-cleaning steps.
A comparison with company practices indicates that industrial work often emphasizes integrated and application-driven forecasting pipelines, while academic work continues to focus on methodological innovation. This divergence reflects different priorities but also points to opportunities for convergence, especially in areas where research developments could address operational challenges.
Finally, it should be acknowledged that the section on companies was exploratory in nature. It provided insights based on a representative set of actors rather than a comprehensive global survey. A more systematic review of commercial providers would be required to fully capture the diversity of market actors and services.

8. Conclusions

This study applied text mining to metadata from 500 articles and 276 full texts published between 2017 and 2023, providing a quantitative overview of recent developments in solar forecasting research. The analysis identified leading authors, journals, and countries, as well as trends in forecasting variables, methodological approaches, and error metrics. While the 500-article metadata set, drawn from Google Scholar across multiple publishers, reduces distortions in rankings, the 276 full texts were sourced exclusively from ScienceDirect due to API accessibility. This may have introduced a slight bias in the abbreviation analysis, though the effect is considered negligible given the universality of technical vocabulary in the field.
Compared with the 2012–2017 period [6], several significant changes were observed. Research output is now concentrated in China, the United States, and India, marking a shift in the global geography of publications. Deep-learning architectures dominate the methodological landscape, while hybrid approaches, though still limited, are increasingly visible. By contrast, earlier studies emphasized traditional time-series models and shallow neural networks.
For forecasted variables, GHI remains the most prevalent, with GTI and DNI less frequently studied. In terms of evaluation, deterministic error metrics continue to dominate, with probabilistic measures still underrepresented, although their presence has increased compared to the pre-2017 literature.
Overall, the 2017–2023 period is characterized by the consolidation of deep learning, the emergence of hybridization strategies, and the persistence of established practices in variables and metrics. Taken together, these elements illustrate both continuity and transformation within the field.
Moreover, text-mining methodologies themselves are not free from limitations. Metadata standardization was required to correct inconsistencies in author names, institutions, and country designations, a process addressed using Jaccard clustering and manual verification. While this strengthened the robustness of the dataset, it highlights the sensitivity of results to data-cleaning procedures.
Finally, it should be noted that the exploratory overview of companies provided here is not exhaustive; a more systematic review of commercial actors would be required to fully capture the diversity of market practices.
Future work extending the analysis to the 2023–2028 period will allow a more detailed assessment of these trajectories and may reveal further diversification in modelling paradigms, evaluation practices, and industrial applications.

Author Contributions

Conceptualization, M.A., G.N. and C.V.; methodology, M.A., G.N. and C.V.; software, M.A.; validation, M.A., G.N. and C.V.; formal analysis, M.A., G.N. and C.V.; investigation, M.A., G.N. and C.V.; resources, M.A.; data curation, M.A.; writing—original draft preparation, M.A.; writing—review and editing, G.N. and C.V.; visualization, M.A.; supervision, G.N. and C.V. All authors have read and agreed to the published version of the manuscript.

Funding

This research received no external funding.

Data Availability Statement

The data that support the findings of this study are available from the corresponding author upon reasonable request.

Conflicts of Interest

The authors declare no conflicts of interest.

Abbreviations

The following abbreviations are used in this manuscript:
ANFISAdaptive Neuro-Fuzzy Inference System
APIApplication Programming Interface
ARIMAAutoRegressive Integrated Moving Average
ARMAAutoRegressive Moving Average
AROMEApplication of Research to Operations at Mesoscale
ASIAll Sky Imager
Bi-LSTMBidirectional Long Short-Term Memory
BHIBeam Horizontal Irradiance
BHIBeam Horizontal Irradiation
BNIBeam Normal Irradiance
BNIBeam Normal Irradiation
BPNNBack Propagation Neural Network
BSRNBaseline Surface Radiation Network
CARDSCoupled AutoRegressive and Dynamical System
CDFCumulative Distribution Function
CNNConvolutional Neural Network
ConvLSTMConvolutional Long Short-Term Memory
CRPSContinuous Ranked Probability Score
CWCCoverage Width-based Criterion
DCNNDeep Convolutional Neural Network
DBNDeep Belief Network
DHIDiffuse Horizontal Irradiance
DHIDiffuse Horizontal Irradiation
DNIDirect Normal Irradiance
DNIDirect Normal Irradiation
ECMWFEuropean Centre for Medium-Range Weather Forecasts
ELMExtreme Learning Machine
EPSEnsemble Prediction Systems
EUMETSATEuropean Organization for the Exploitation of Meteorological Satellites
FFNNFeedforward Neural Network
GANsGenerative Adversarial Networks
GBRGradient Boosted Regression
GBDTGradient Boosting Decision Tree
GFSGlobal Forecast System
GHIGlobal Horizontal Irradiance
GHIGlobal Horizontal Irradiation
GRUGated Recurrent Unit
GTIGlobal Tilted Irradiance
GTIGlobal Tilted Irradiation
HTMLHyperText Markup Language
HRESHigh-Resolution Forecast System
IEEEInstitute of Electrical and Electronics Engineers
JMAJapan Meteorological Agency
kNNk Nearest Neighbors
LASSOLeast Absolute Shrinkage and Selection Operator
LSTMLong Short-Term Memory
MADMean Average Deviation
MAEMean Absolute Error
MAPEMean Absolute Percentage Error
MARSMultivariate Adaptive Regression Spline
MBEMean Bias Error
MLRMultiple Linear Regression
MLPMulti-Layer Perceptron
MPEMean Percentage Error
MREMean Relative Error
MSEMean Squared Error
NAMNorth American Mesoscale
NCARNational Center for Atmospheric Research
NCEINational Centers for Environmental Information
NOAANational Oceanic and Atmospheric Administration
nRMSENormalized Root Mean Square Error
NWPNumerical Weather Prediction
nMAENormalized Mean Absolute Error
nMBENormalized Mean Bias Error
PDFProbability Distribution Function
PIPrediction Interval
PICPPrediction Interval Coverage Probability
PINAWPrediction Interval Normalized Average Width
POAPlane of Array
QRQuantile Regression
RBFNNRadial Basis Function Neural Network
RFRandom Forest
RFRRandom Forest Regression
RMSERoot Mean Square Error
RNNRecurrent Neural Network
rRMSERelative Root Mean Square Error
RTMRadiative Transfer Models
SARIMASeasonal AutoRegressive Integrated Moving Average
SPSmart Persistence
SVMSupport Vector Machine
TCNTemporal Convolutional Network
TMYTypical Meteorological Year
TSITotal Sky Imager
WRFWeather Research and Forecasting
WSIWhole Sky Imager
XGBoostExtreme Gradient Boosting

References

  1. IEA PVPS. Trends in Photovoltaic Applications 2023. International Energy Agency Photovoltaic Power Systems Programme, 2023. Available online: https://iea-pvps.org/wp-content/uploads/2023/10/PVPS_Trends_Report_2023_WEB.pdf (accessed on 3 September 2025).
  2. Diagne, M.; David, M.; Lauret, P.; Boland, J.; Schmutz, N. Review of solar irradiance forecasting methods and a proposition for small-scale insular grids. Renew. Sustain. Energy Rev. 2013, 27, 65–76. [Google Scholar] [CrossRef]
  3. Chaturvedi, K.D.; Isha, I. Solar power forecasting: A review. Int. J. Comput. Appl. 2016, 45, 28–50. [Google Scholar] [CrossRef]
  4. Galati, F.; Bigliardi, B. Industry 4.0: Emerging themes and future research avenues using a text mining approach. Comput. Ind. 2019, 109, 100–113. [Google Scholar] [CrossRef]
  5. Pande, V.C.; Khandelwal, A.S. A survey of different text mining techniques. IBMRD J. Manag. Res. 2014, 3, 125–133. Available online: http://www.ibmrdjournal.com (accessed on 3 September 2025).
  6. Yang, D.; Kleissl, J.; Gueymard, C.A.; Pedro, H.T.C.; Coimbra, C.F.M. History and trends in solar irradiance and PV power forecasting: A preliminary assessment and review using text mining. Sol. Energy 2018, 168, 60–101. [Google Scholar] [CrossRef]
  7. Paletta, Q.; Terrén-Serrano, G.; Nie, Y.; Li, B.; Bieker, J.; Zhang, W.; Dubus, L.; Dev, S.; Feng, C. Advances in solar forecasting: Computer vision with deep learning. Adv. Appl. Energy 2023, 11, 100150. [Google Scholar] [CrossRef]
  8. Gusenbauer, M.; Haddaway, N.R. Which academic search systems are suitable for systematic reviews or meta-analyses? Res. Synth. Methods 2020, 11, 181–217. [Google Scholar] [CrossRef]
  9. Hwang, C.M.; Yang, M.S.; Hung, W.L. New similarity measures of intuitionistic fuzzy sets based on the Jaccard index with its application to clustering. Int. J. Intell. Syst. 2018, 33, 1672–1688. [Google Scholar] [CrossRef]
  10. Schwartz, A.S.; Hearst, M.A. A simple algorithm for identifying abbreviation definitions in biomedical text. In Biocomputing; World Scientific: Singapore, 2003; pp. 451–462. [Google Scholar] [CrossRef]
  11. Azizi, N.; Yaghoubirad, M.; Farajollahi, M.; Ahmadi, A. Deep learning based long-term global solar irradiance and temperature forecasting using time series with multi-step multivariate output. Renew. Energy 2023, 206, 135–147. [Google Scholar] [CrossRef]
  12. Chodakowska, E.; Nazarko, J.; Nazarko, Ł.; Rabayah, H.S.; Abendeh, R.M.; Alawneh, R. ARIMA models in solar radiation forecasting in different geographic locations. Energies 2023, 16, 5029. [Google Scholar] [CrossRef]
  13. Neshat, M.; Nezhad, M.M.; Mirjalili, S.; Garcia, D.A.; Dahlquist, E.; Gandomi, A.H. Short-term solar radiation forecasting using hybrid deep residual learning and gated LSTM recurrent network with differential covariance matrix adaptation evolution strategy. Energy 2023, 278, 127701. [Google Scholar] [CrossRef]
  14. Yildirim, A.; Bilgili, M.; Ozbek, A. One-hour-ahead solar radiation forecasting by MLP, LSTM, and ANFIS approaches. Meteorol. Atmos. Phys. 2023, 135, 10. [Google Scholar] [CrossRef]
  15. Al-Ali, E.M.; Hajji, Y.; Said, Y.; Hleili, M.; Alanzi, A.M.; Laatar, A.H.; Atri, M. Solar energy production forecasting based on a hybrid CNN-LSTM-Transformer model. Mathematics 2023, 11, 676. [Google Scholar] [CrossRef]
  16. Kim, E.; Akhtar, M.S.; Yang, O.B. Designing solar power generation output forecasting methods using time series algorithms. Electr. Power Syst. Res. 2023, 216, 109073. [Google Scholar] [CrossRef]
  17. AlKandari, M.; Ahmad, I. Solar power generation forecasting using ensemble approach based on deep learning and statistical methods. Appl. Comput. Inform. 2024, 20, 231–250. [Google Scholar] [CrossRef]
  18. Alharkan, H.; Habib, S.; Islam, M. Solar power prediction using dual stream CNN-LSTM architecture. Sensors 2023, 23, 945. [Google Scholar] [CrossRef]
  19. Huang, C.; Yang, M. Memory long and short-term time series network for ultra-short-term photovoltaic power forecasting. Energy 2023, 279, 127961. [Google Scholar] [CrossRef]
  20. Yang, D.; Dong, Z.; Nobre, A.; Khoo, Y.S.; Jirutitijaroen, P.; Walsh, W.M. Evaluation of transposition and decomposition models for converting global solar irradiance from tilted surface to horizontal in tropical regions. Sol. Energy 2013, 97, 369–387. [Google Scholar] [CrossRef]
  21. Yang, D. Solar radiation on inclined surfaces: Corrections and benchmarks. Sol. Energy 2016, 136, 288–302. [Google Scholar] [CrossRef]
  22. Mubarak, R.; Hofmann, M.; Riechelmann, S.; Seckmeyer, G. Comparison of modelled and measured tilted solar irradiance for photovoltaic applications. Energies 2017, 10, 1688. [Google Scholar] [CrossRef]
  23. Evseev, E.G.; Kudish, A.I. The assessment of different models to predict the global solar radiation on a surface tilted to the south. Sol. Energy 2009, 83, 377–388. [Google Scholar] [CrossRef]
  24. Notton, G.; Voyant, C.; Fouilloy, A.; Duchaud, J.L.; Nivet, M.L. Some applications of ANN to solar radiation estimation and forecasting for energy applications. Appl. Sci. 2019, 9, 209. [Google Scholar] [CrossRef]
  25. Evans, D.L. Simplified method for predicting photovoltaic array output. Sol. Energy 1981, 27, 555–560. [Google Scholar] [CrossRef]
  26. Blanc, P.; Remund, J.; Vallance, L. Short-term solar power forecasting based on satellite images. In Renewable Energy Forecasting; Kariniotakis, G., Ed.; Woodhead Publishing: Cambridge, UK, 2017; pp. 179–198. [Google Scholar] [CrossRef]
  27. Antonanzas, J.; Osorio, N.; Escobar, R.; Urraca, R.; Martinez-de-Pison, F.J.; Antonanzas-Torres, F. Review of photovoltaic power forecasting. Sol. Energy 2016, 136, 78–111. [Google Scholar] [CrossRef]
  28. Zhang, Y.; Wang, J.; Wang, X. Review on probabilistic forecasting of wind power generation. Renew. Sustain. Energy Rev. 2014, 32, 255–270. [Google Scholar] [CrossRef]
  29. Alessandrini, S.; Delle Monache, L.; Sperati, S.; Cervone, G. An analog ensemble for short-term probabilistic solar power forecast. Appl. Energy 2015, 157, 95–110. [Google Scholar] [CrossRef]
  30. David, M.; Ramahatana, F.; Trombe, P.J.; Lauret, P. Probabilistic forecasting of the solar irradiance with recursive ARMA and GARCH models. Sol. Energy 2016, 133, 55–72. [Google Scholar] [CrossRef]
  31. He, Y.; Yan, Y.; Xu, Q. Wind and solar power probability density prediction via fuzzy information granulation and support vector quantile regression. Int. J. Electr. Power Energy Syst. 2019, 113, 515–527. [Google Scholar] [CrossRef]
  32. Huang, J.; Thatcher, M. Assessing the value of simulated regional weather variability in solar forecasting using numerical weather prediction. Sol. Energy 2017, 144, 529–539. [Google Scholar] [CrossRef]
  33. Doubleday, K.; Van Scyoc Hernandez, V.; Hodge, B.M. Benchmark probabilistic solar forecasts: Characteristics and recommendations. Sol. Energy 2020, 206, 52–67. [Google Scholar] [CrossRef]
  34. Voyant, C.; Motte, F.; Notton, G.; Fouilloy, A.; Nivet, M.L.; Duchaud, J.L. Prediction intervals for global solar irradiation forecasting using regression trees methods. Renew. Energy 2018, 126, 332–340. [Google Scholar] [CrossRef]
  35. Li, K.; Wang, R.; Lei, H.; Zhang, T.; Liu, Y.; Zheng, X. Interval prediction of solar power using an Improved Bootstrap method. Sol. Energy 2018, 159, 97–112. [Google Scholar] [CrossRef]
  36. David, M.; Le Gal La Salle, J.; Ramahatana Andriamasomanana, F.H.; Lauret, P. Probabilistic solar forecasts evaluation Part 1: Ensemble prediction systems (EPS). In Proceedings of the ISES Solar World Congress 2019/IEA SHC International Conference, Santiago, Chile, 3–7 November 2019; pp. 1–9. [Google Scholar] [CrossRef]
  37. Duchaud, J.L.; Voyant, C.; Fouilloy, A.; Notton, G.; Nivet, M.L. Trade-off between precision and resolution of a solar power forecasting algorithm for micro-grid optimal control. Energies 2020, 13, 3565. [Google Scholar] [CrossRef]
  38. Mitra, I.; Heinemann, D.; Ramanan, A.; Kaur, M.; Sharma, S.K.; Tripathy, S.K.; Roy, A. Short-term PV power forecasting in India: Recent developments and policy analysis. Int. J. Energy Environ. Eng. 2022, 13, 515–540. [Google Scholar] [CrossRef]
  39. Betti, A.; Pierro, M.; Cornaro, C.; Moser, D.; Moschella, M.; Collino, E.; Ronzio, D.; van der Meer, D.; Widén, J.; Visser, L.; et al. Regional Solar Power Forecasting; IEA-PVPS: Paris, France, 2020; Available online: https://iea-pvps.org/research-tasks/regional-solar-power-forecasting/ (accessed on 28 September 2025).
  40. Yang, B.; Zhu, T.; Cao, P.; Guo, Z.; Zeng, C.; Li, D.; Chen, Y.; Ye, H.; Shao, R.; Shu, H. Classification and summarization of solar irradiance and power forecasting methods: A thorough review. CSEE J. Power Energy Syst. 2023, 9, 978–995. [Google Scholar] [CrossRef]
  41. Carrière, T.; Amaro, E.; Silva, R.; Zhuang, F.; Saint-Drenan, Y.M.; Blanc, P. A new approach for satellite-based probabilistic solar forecasting with cloud motion vectors. Energies 2021, 14, 4951. [Google Scholar] [CrossRef]
  42. Magnone, L.; Sossan, F.; Scolari, E.; Paolone, M. Cloud motion identification algorithms based on all-sky images to support solar irradiance forecast. In Proceedings of the 2017 IEEE 44th Photovoltaic Specialist Conference (PVSC), Washington, DC, USA, 25–30 June 2017; pp. 1415–1420. [Google Scholar] [CrossRef]
  43. Ning, Z.; Hochard, G. Eyes in the Heavens: Satellite technologies in remote site monitoring. Geostrata 2017, 21, 50–55. [Google Scholar] [CrossRef]
  44. Lin, F.; Zhang, Y.; Wang, J. Recent advances in intra-hour solar forecasting: A review of ground-based sky image methods. Int. J. Forecast. 2023, 39, 244–265. [Google Scholar] [CrossRef]
  45. Logothetis, S.-A.; Salamalikis, V.; Nouri, B.; Remund, J.; Zarzalejo, L.F.; Xie, Y.; Wilbert, S.; Ntavelis, E.; Nou, J.; Hendrikx, N.; et al. Solar irradiance ramp forecasting based on all-sky imagers. Energies 2022, 15, 6191. [Google Scholar] [CrossRef]
  46. Leutbecher, M.; Palmer, T.N. Ensemble forecasting. J. Comput. Phys. 2008, 227, 3515–3539. [Google Scholar] [CrossRef]
  47. Barhmi, K.; Heynen, C.; Golroodbari, S.; Van Sark, W. A review of solar forecasting techniques and the role of artificial intelligence. Solar 2024, 4, 99–135. [Google Scholar] [CrossRef]
  48. Nielsen, A.H.; Iosifidis, A.; Karstoft, H. IrradianceNet: Spatiotemporal deep learning model for satellite-derived solar irradiance short-term forecasting. Sol. Energy 2021, 228, 659–669. [Google Scholar] [CrossRef]
  49. Le Gal La Salle, J.; David, M.; Lauret, P. A new climatology reference model to benchmark probabilistic solar forecasts. Sol. Energy 2021, 223, 398–414. [Google Scholar] [CrossRef]
  50. Boilley, A.; Thomas, C.; Marchand, M.; Wey, E.; Blanc, P. The solar forecast similarity method: A new method to compute solar radiation forecasts for the next day. Energy Procedia 2016, 91, 1018–1023. [Google Scholar] [CrossRef]
  51. Inman, R.H.; Pedro, H.T.C.; Coimbra, C.F.M. Solar forecasting methods for renewable energy integration. Prog. Energy Combust. Sci. 2013, 39, 535–576. [Google Scholar] [CrossRef]
  52. Yang, D. Choice of clear-sky model in solar forecasting. J. Renew. Sustain. Energy 2020, 12, 026101. [Google Scholar] [CrossRef]
  53. Garniwa, P.M.P.; Rajagukguk, R.A.; Kamil, R.; Lee, H. Intraday forecast of global horizontal irradiance using optical flow method and long short-term memory model. Sol. Energy 2023, 252, 234–251. [Google Scholar] [CrossRef]
  54. Rigollier, C.; Lefèvre, M.; Wald, L. The method Heliosat-2 for deriving shortwave solar radiation from satellite images. Sol. Energy 2004, 77, 159–169. [Google Scholar] [CrossRef]
  55. Caldas, M.; Alonso-Suárez, R. Very short-term solar irradiance forecast using all-sky imaging and real-time irradiance measurements. Renew. Energy 2019, 143, 1643–1658. [Google Scholar] [CrossRef]
  56. Pedro, H.T.C.; Coimbra, C.F.M.; David, M.; Lauret, P. Assessment of machine learning techniques for deterministic and probabilistic intra-hour solar forecasts. Renew. Energy 2018, 123, 191–203. [Google Scholar] [CrossRef]
  57. Colak, I.; Yesilbudak, M.; Genc, N.; Bayindir, R. Multi-period prediction of solar radiation using ARMA and ARIMA models. In Proceedings of the 2015 IEEE 14th International Conference on Machine Learning and Applications (ICMLA), Miami, FL, USA, 9–11 December 2015; pp. 1045–1049. [Google Scholar] [CrossRef]
  58. Kushwaha, V.; Pindoriya, N.M. Very short-term solar PV generation forecast using SARIMA model: A case study. In Proceedings of the 2017 7th International Conference on Power Systems (ICPS), Pune, India, 21–23 December 2017; pp. 430–435. [Google Scholar] [CrossRef]
  59. Huang, J.; Korolkiewicz, M.; Agrawal, M.; Boland, J. Forecasting solar radiation on an hourly time scale using a Coupled AutoRegressive and Dynamical System (CARDS) model. Sol. Energy 2013, 87, 136–149. [Google Scholar] [CrossRef]
  60. Abuella, M.; Chowdhury, B. Solar power probabilistic forecasting by using multiple linear regression analysis. In Proceedings of the SoutheastCon 2015, Fort Lauderdale, FL, USA, 9–12 April 2015; pp. 1–5. [Google Scholar] [CrossRef]
  61. Lauret, P.; David, M.; Pedro, H. Probabilistic solar forecasting using quantile regression models. Energies 2017, 10, 1591. [Google Scholar] [CrossRef]
  62. Srivastava, R.; Tiwari, A.N.; Giri, V.K. Solar radiation forecasting using MARS, CART, M5, and random forest model: A case study for India. Heliyon 2019, 5, e02692. [Google Scholar] [CrossRef] [PubMed]
  63. Tang, N.; Mao, S.; Wang, Y.; Nelms, R.M. Solar power generation forecasting with a LASSO-based approach. IEEE Internet Things J. 2018, 5, 1090–1099. [Google Scholar] [CrossRef]
  64. Persson, C.; Bacher, P.; Shiga, T.; Madsen, H. Multi-site solar power forecasting using gradient boosted regression trees. Sol. Energy 2017, 150, 423–436. [Google Scholar] [CrossRef]
  65. Bakker, K.; Whan, K.; Knap, W.; Schmeits, M. Comparison of statistical post-processing methods for probabilistic NWP forecasts of solar radiation. Sol. Energy 2019, 191, 138–150. [Google Scholar] [CrossRef]
  66. Verbois, H.; Saint-Drenan, Y.M.; Thiery, A.; Blanc, P. Statistical learning for NWP post-processing: A benchmark for solar irradiance forecasting. Sol. Energy 2022, 238, 132–149. [Google Scholar] [CrossRef]
  67. Zeng, J.; Qiao, W. Short-term solar power prediction using a support vector machine. Renew. Energy 2013, 52, 118–127. [Google Scholar] [CrossRef]
  68. Benali, L.; Notton, G.; Fouilloy, A.; Voyant, C.; Dizene, R. Solar radiation forecasting using artificial neural network and random forest methods: Application to normal beam, horizontal diffuse and global components. Renew. Energy 2019, 132, 871–884. [Google Scholar] [CrossRef]
  69. Wang, J.; Li, P.; Ran, R.; Che, Y.; Zhou, Y. A short-term photovoltaic power prediction model based on the gradient boost decision tree. Appl. Sci. 2018, 8, 689. [Google Scholar] [CrossRef]
  70. Li, X.; Ma, L.; Chen, P.; Xu, H.; Xing, Q.; Yan, J.; Lu, S.; Fan, H.; Yang, L.; Cheng, Y. Probabilistic solar irradiance forecasting based on XGBoost. Energy Rep. 2022, 8, 1087–1095. [Google Scholar] [CrossRef]
  71. Chu, Y.; Coimbra, C.F.M. Short-term probabilistic forecasts for direct normal irradiance. Renew. Energy 2017, 101, 526–536. [Google Scholar] [CrossRef]
  72. Muhammad Ehsan, R.; Simon, S.P.; Venkateswaran, P.R. Day-ahead forecasting of solar photovoltaic output power using multilayer perceptron. Neural Comput. Appl. 2017, 28, 3981–3992. [Google Scholar] [CrossRef]
  73. Rehiara, A.B.; Setiawidayat, S. Day ahead solar irradiation forecasting based on extreme learning machine. In Proceedings of the 2022 IEEE International Conference on Cybernetics and Computational Intelligence (CyberneticsCom), Malang, Indonesia, 16–18 June 2022; pp. 63–66. [Google Scholar] [CrossRef]
  74. Hong, Y.Y.; Chan, Y.H.; Yu, C.W. One-hour ahead solar irradiance/power forecasting using radial basis function neural network with fuzzy activation function. In Proceedings of the 2020 International Symposium on Computer, Consumer and Control (IS3C), Taichung City, Taiwan, 13–16 November 2020; pp. 339–343. [Google Scholar] [CrossRef]
  75. Aghmadi, A.; El Hani, S.; Mediouni, H.; Naseri, N.; El Issaoui, F. Hybrid solar forecasting method based on empirical mode decomposition and back propagation neural network. E3S Web Conf. 2021, 231, 02001. [Google Scholar] [CrossRef]
  76. Husein, M.; Chung, I.Y. Day-ahead solar irradiance forecasting for microgrids using a long short-term memory recurrent neural network: A deep learning approach. Energies 2019, 12, 1856. [Google Scholar] [CrossRef]
  77. Perveen, G.; Rizwan, M.; Goel, N. An ANFIS-based model for solar energy forecasting and its smart grid application. Eng. Rep. 2019, 1, e12070. [Google Scholar] [CrossRef]
  78. Martin, R.; Aler, R.; Valls, J.M.; Galvan, I.M. Machine learning techniques for daily solar energy prediction and interpolation using numerical weather models. Concurr. Comput. Pract. Exp. 2016, 28, 1261–1274. [Google Scholar] [CrossRef]
  79. Feng, C.; Zhang, J.; Zhang, W.; Hodge, B.M. Convolutional neural networks for intra-hour solar forecasting based on sky image sequences. Appl. Energy 2022, 310, 118438. [Google Scholar] [CrossRef]
  80. Wen, H.; Du, Y.; Chen, X.; Lim, E.G.; Wen, H.; Yan, K. A regional solar forecasting approach using generative adversarial networks with solar irradiance maps. Renew. Energy 2023, 216, 119043. [Google Scholar] [CrossRef]
  81. Agga, A.; Abbou, A.; Labbadi, M.; El Houm, Y. Short-term self-consumption PV plant power production forecasts based on hybrid CNN-LSTM, ConvLSTM models. Renew. Energy 2021, 177, 101–112. [Google Scholar] [CrossRef]
  82. Wang, H.; Yi, H.; Peng, J.; Wang, G.; Liu, Y.; Jiang, H.; Liu, W. Deterministic and probabilistic forecasting of photovoltaic power based on deep convolutional neural network. Energy Convers. Manag. 2017, 153, 409–422. [Google Scholar] [CrossRef]
  83. Yu, Y.; Cao, J.; Zhu, J. An LSTM short-term solar irradiance forecasting under complicated weather conditions. IEEE Access 2019, 7, 145651–145666. [Google Scholar] [CrossRef]
  84. Jaihuni, M.; Basak, J.K.; Khan, F.; Okyere, F.G.; Sihalath, T.; Bhujel, A.; Park, J.; Lee, D.H.; Kim, H.T. A novel recurrent neural network approach in forecasting short term solar irradiance. ISA Trans. 2022, 121, 63–74. [Google Scholar] [CrossRef] [PubMed]
  85. Wojtkiewicz, J.; Hosseini, M.; Gottumukkala, R.; Chambers, T.L. Hour-ahead solar irradiance forecasting using multivariate gated recurrent units. Energies 2019, 12, 4055. [Google Scholar] [CrossRef]
  86. Zameer, A.; Jaffar, F.; Shahid, F.; Muneeb, M.; Khan, R.; Nasir, R. Short-term solar energy forecasting: Integrated computational intelligence of LSTMs and GRU. PLoS ONE 2023, 18, e0285410. [Google Scholar] [CrossRef]
  87. Neo, Y.Q.; Teo, T.T.; Woo, W.L.; Logenthiran, T.; Sharma, A. Forecasting of photovoltaic power using deep belief network. In Proceedings of the TENCON 2017—IEEE Region 10 Conference, Penang, Malaysia, 5–8 November 2017; pp. 1189–1194. [Google Scholar] [CrossRef]
  88. Lin, Y.; Koprinska, I.; Rana, M. Temporal convolutional neural networks for solar power forecasting. In Proceedings of the 2020 International Joint Conference on Neural Networks (IJCNN), Glasgow, UK, 19–24 July 2020; pp. 1–8. [Google Scholar] [CrossRef]
  89. Papazek, P.; Schicker, I. A deep learning LSTM forecasting approach for renewable energy systems. In Proceedings of the EGU General Assembly 2021, Online, 19–30 April 2021; p. EGU21-9910. [Google Scholar] [CrossRef]
  90. Gneiting, T.; Lerch, S.; Schulz, B. Probabilistic solar forecasting: Benchmarks, post-processing, verification. Sol. Energy 2023, 252, 72–80. [Google Scholar] [CrossRef]
  91. Benavides Cesar, L.; Amaro, E.; Silva, R.; Manso Callejo, M.Á.; Cira, C.I. Review on spatio-temporal solar forecasting methods driven by in situ measurements or their combination with satellite and numerical weather prediction (NWP) estimates. Energies 2022, 15, 4341. [Google Scholar] [CrossRef]
  92. Chen, X.; Du, Y.; Lim, E.; Fang, L.; Yan, K. Towards the applicability of solar nowcasting: A practice on predictive PV power ramp-rate control. Renew. Energy 2022, 195, 147–166. [Google Scholar] [CrossRef]
  93. Yang, D. Making reference solar forecasts with climatology, persistence, and their optimal convex combination. Sol. Energy 2019, 193, 981–985. [Google Scholar] [CrossRef]
  94. Liu, B.; Wang, J.; Chen, J.; Li, B.; Sun, D.; Zhang, G. A probabilistic perspective on predictability of solar irradiance using bootstrapped correlograms and ensemble predictability error growth. Sol. Energy 2023, 260, 17–24. [Google Scholar] [CrossRef]
  95. Voyant, C.; Notton, G.; Duchaud, J.-L.; Gutiérrez, L.; Bright, J.M.; Yang, D. Benchmarks for solar radiation time series forecasting. Renew. Energy 2022, 191, 747–762. [Google Scholar] [CrossRef]
  96. Hong, T.; Pinson, P.; Wang, Y.; Weron, R.; Yang, D.; Zareipour, H. Energy forecasting: A review and outlook. IEEE Open J. Power Energy 2020, 7, 376–388. [Google Scholar] [CrossRef]
  97. Paletta, Q.; Arbod, G.; Lasenby, J. Omnivision forecasting: Combining satellite and sky images for improved deterministic and probabilistic intra-hour solar energy predictions. Appl. Energy 2023, 336, 120818. [Google Scholar] [CrossRef]
  98. Catalina, A.; Alaiz, C.M.; Dorronsoro, J.R. Combining numerical weather predictions and satellite data for PV energy nowcasting. IEEE Trans. Sustain. Energy 2020, 11, 1930–1937. [Google Scholar] [CrossRef]
  99. Sansine, V.; Ortega, P.; Hissel, D.; Ferrucci, F. Hybrid deep learning model for mean hourly irradiance probabilistic forecasting. Atmosphere 2023, 14, 1192. [Google Scholar] [CrossRef]
  100. Shan, S.; Li, C.; Ding, Z.; Wang, Y.; Zhang, K.; Wei, H. Ensemble learning based multi-modal intra-hour irradiance forecasting. Energy Convers. Manag. 2022, 270, 116206. [Google Scholar] [CrossRef]
  101. Carrillo, R.E.; Leblanc, M.; Schubnel, B.; Langou, R.; Topfel, C.; Alet, P.J. High-resolution PV forecasting from imperfect data: A graph-based solution. Energies 2020, 13, 5763. [Google Scholar] [CrossRef]
  102. Singla, P.; Duhan, M.; Saroha, S. Review of different error metrics: A case of solar forecasting. AIUB J. Sci. Eng. 2021, 20, 158–165. [Google Scholar] [CrossRef]
  103. Sobri, S.; Koohi-Kamali, S.; Rahim, N.A. Solar photovoltaic generation forecasting methods: A review. Energy Convers. Manag. 2018, 156, 459–497. [Google Scholar] [CrossRef]
  104. Voyant, C.; Notton, G.; Kalogirou, S.; Nivet, M.-L.; Paoli, C.; Motte, F.; Fouilloy, A. Machine learning methods for solar radiation forecasting: A review. Renew. Energy 2017, 105, 569–582. [Google Scholar] [CrossRef]
  105. Yagli, G.M.; Yang, D.; Srinivasan, D. Ensemble solar forecasting using data-driven models with probabilistic post-processing through GAMLSS. Sol. Energy 2020, 208, 612–622. [Google Scholar] [CrossRef]
  106. Alonso-Suárez, R.; David, M.; Branco, V.; Lauret, P. Intra-day solar probabilistic forecasts including local short-term variability and satellite information. Renew. Energy 2020, 158, 554–573. [Google Scholar] [CrossRef]
  107. Massidda, L.; Marrocu, M. Quantile regression post-processing of weather forecast for short-term solar power probabilistic forecasting. Energies 2018, 11, 1763. [Google Scholar] [CrossRef]
  108. Heydari, A.; Astiaso Garcia, D.; Keynia, F.; Bisegna, F.; De Santoli, L. A novel composite neural network based method for wind and solar power forecasting in microgrids. Appl. Energy 2019, 251, 113353. [Google Scholar] [CrossRef]
  109. Demir, V.; Citakoglu, H. Forecasting of solar radiation using different machine learning approaches. Neural Comput. Appl. 2023, 35, 887–906. [Google Scholar] [CrossRef]
  110. Obiora, C.N.; Ali, A.; Hasan, A.N. Forecasting hourly solar irradiance using long short-term memory (LSTM) network. In Proceedings of the 2020 11th International Renewable Energy Congress (IREC), Hammamet, Tunisia, 29–31 October 2020; pp. 1–6. [Google Scholar] [CrossRef]
  111. Alam, M.S.; Al-Ismail, F.S.; Hossain, M.S.; Rahman, S.M. Ensemble machine-learning models for accurate prediction of solar irradiation in Bangladesh. Processes 2023, 11, 908. [Google Scholar] [CrossRef]
  112. Arora, I.; Gambhir, J.; Kaur, T. Solar irradiance forecasting using decision tree and ensemble models. In Proceedings of the 2020 2nd International Conference on Inventive Research in Computing Applications (ICIRCA), Coimbatore, India, 15–17 July 2020; pp. 675–681. [Google Scholar] [CrossRef]
  113. Mathiesen, P.; Kleissl, J. Evaluation of numerical weather prediction for intra-day solar forecasting in the continental United States. Sol. Energy 2011, 85, 967–977. [Google Scholar] [CrossRef]
  114. Nespoli, A.; Ogliari, E.; Leva, S.; Pavan, A.M.; Mellit, A.; Lughi, V.; Dolara, A. Day-ahead photovoltaic forecasting: A comparison of the most effective techniques. Energies 2019, 12, 1621. [Google Scholar] [CrossRef]
  115. Mohammadi, K.; Shamshirband, S.; Anisi, M.H.; Alam, K.A.; Petković, D. Support vector regression based prediction of global solar radiation on a horizontal surface. Energy Convers. Manag. 2015, 91, 433–441. [Google Scholar] [CrossRef]
  116. Blaga, R.; Sabadus, A.; Stefu, N.; Dughir, C.; Paulescu, M.; Badescu, V. A current perspective on the accuracy of incoming solar energy forecasting. Prog. Energy Combust. Sci. 2019, 70, 119–144. [Google Scholar] [CrossRef]
  117. Zulkifly, Z.; Baharin, K.A.; Gan, C.K. Improved machine learning model selection technique for solar energy forecasting applications. Int. J. Renew. Energy Res. 2021, 11, 308–319. [Google Scholar] [CrossRef]
  118. Lateko, A.A.H.; Yang, H.T.; Huang, C.M. Short-term PV power forecasting using a regression-based ensemble method. Energies 2022, 15, 4171. [Google Scholar] [CrossRef]
  119. Babatunde, O.M.; Munda, J.L.; Hamam, Y.; Monyei, C.G. A critical overview of the (Im)practicability of solar radiation forecasting models. e-Prime Adv. Electr. Eng. Electron. Energy 2023, 5, 100213. [Google Scholar] [CrossRef]
  120. Kashyap, Y.; Bansal, A.; Sao, A.K. Solar radiation forecasting with multiple parameters neural networks. Renew. Sustain. Energy Rev. 2015, 49, 825–835. [Google Scholar] [CrossRef]
  121. Khatib, T.; Mohamed, A.; Sopian, K.; Mahmoud, M. Assessment of Artificial Neural Networks for Hourly Solar Radiation Prediction. Int. J. Photoenergy 2012, 2012, 946890. [Google Scholar] [CrossRef]
  122. Lorenz, E.; Nouri, B.; Cros, S.; Nielsen, K.P.; Fritz, R.; Good, G.; Pierro, M.; Hernandez, G.S.; Lauret, P.; David, M. Forecasting Solar Radiation and Photovoltaic Power. In Best Practices Handbook for the Collection and Use of Solar Resource Data for Solar Energy Applications, 4th ed.; Springer: Cham, Switzerland, 2024. [Google Scholar] [CrossRef]
  123. Kopecek, R.; Libal, J. Bifacial photovoltaics 2021: Status, opportunities and challenges. Energies 2021, 14, 2076. [Google Scholar] [CrossRef]
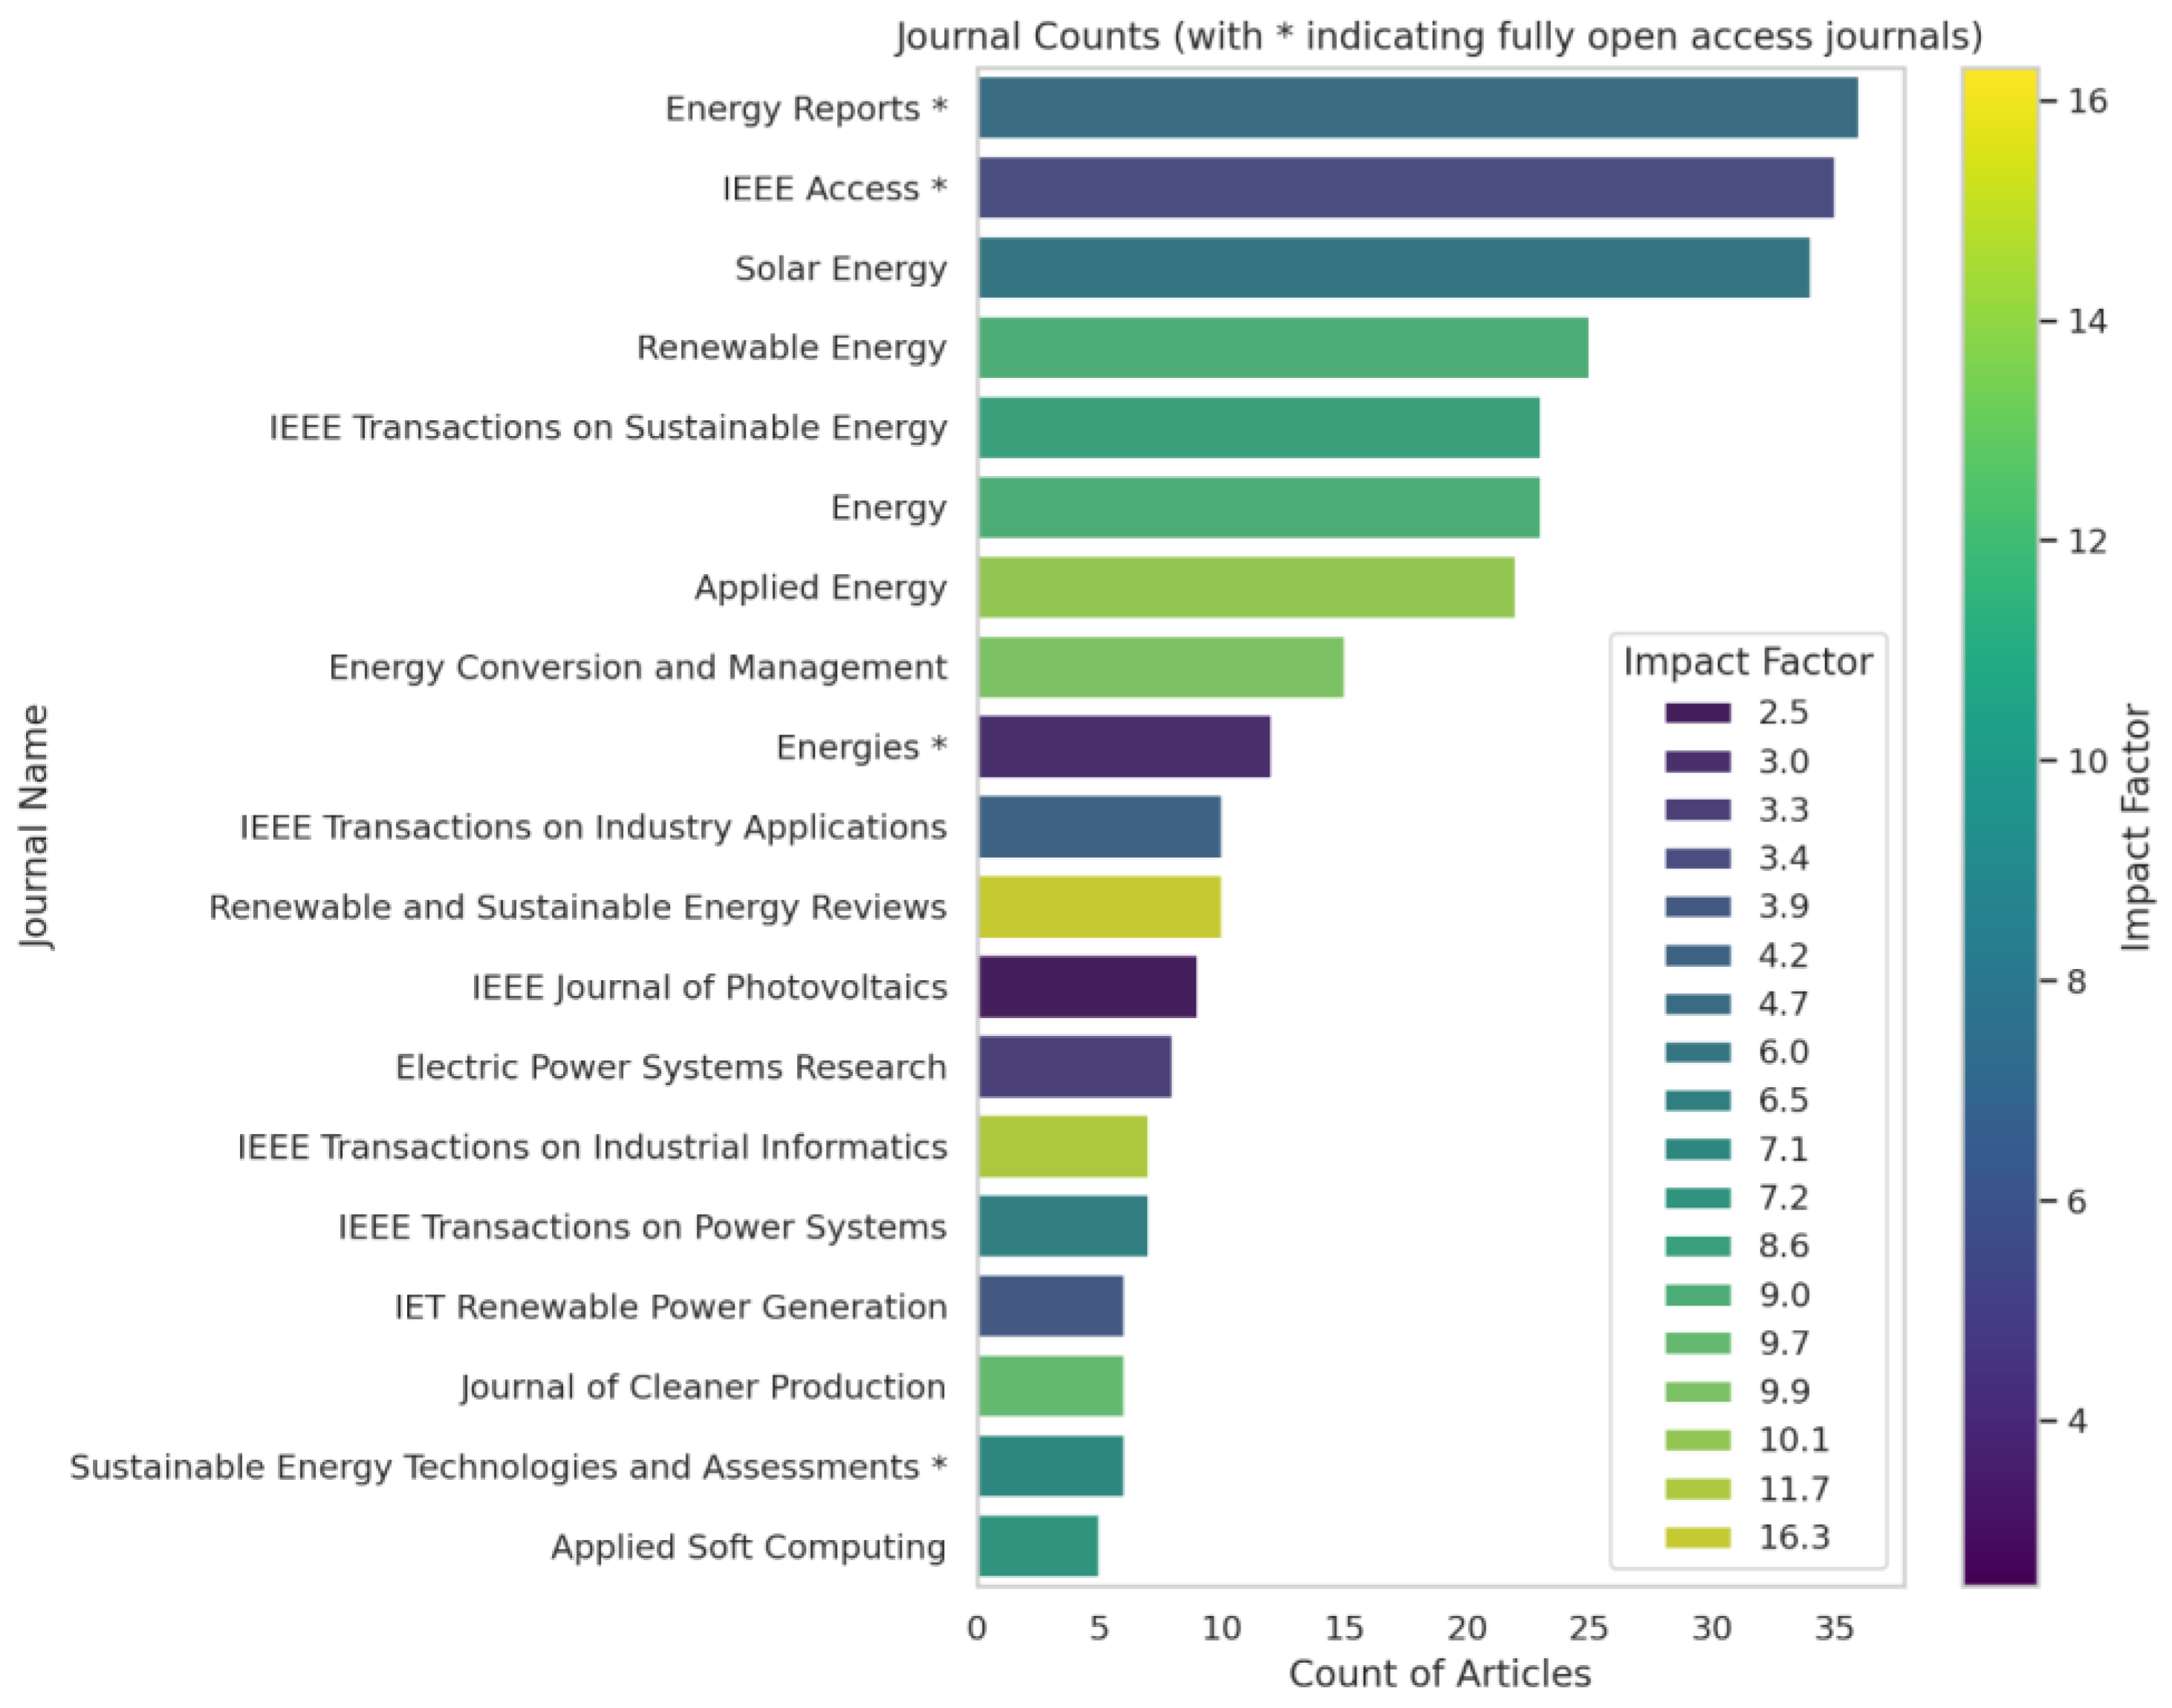
Figure 1. Top 20 Solar Energy Forecasting Journals Ranked by Number of Appearances in the 500 Articles.
Energies 18 05231 g001
Figure 2. Top 20 Solar Energy Forecasting Researchers Ranked by Number of Appearances in the 500 Articles.
Energies 18 05231 g002
Figure 3. Affiliations the Most Frequently Appearing in the 500 Articles.
Energies 18 05231 g003
Figure 4. Countries Most Frequently Represented in the 500 Articles.
Energies 18 05231 g004
Figure 5. Illustration of a PDF and CDF for a Given Probabilistic GHI Forecast (W/m2).
Energies 18 05231 g005
Table 1. Article Distribution by Database for the Final Dataset.
Database NameNumber of Articles
ScienceDirect276
IEEE Xplore Digital Library129
MDPI42
SpringerLink30
Wiley Online Library23
Total500
Table 2. Comparison between the 2012–2017 ranking by [6] and our updated 2017–2023 ranking of the 11 common journals, including the magnitude of change in ranking position (Δ Rank).
JournalsPrevious Ranking (Out of 20) [6]Updated Ranking (Out of 20)Δ Rank
Solar Energy13−2
Renewable Energy24−2
Renewable and Sustainable Energy Reviews311−8
Energy Conversion and Management48−4
Energy56−1
Applied Energy67−1
IEEE Transactions on Sustainable Energy75+2
Energies109+1
IEEE Transactions on Power Systems15150
Electric Power Systems Research1613+3
Table 3. Abbreviations Related to Geostationary Meteorological Satellite Families with Corresponding Details.
Geostationary Meteorological Satellites FamiliesAbbrev.Observation FrequencyOperator
Meteosat Second GenerationMSG15 minEuropean Organization for the Exploitation of Meteorological Satellites (EUMETSAT)
Geostationary Operational Environmental SatelliteGOES15 minNational Oceanic and Atmospheric Administration (NOAA), USA
Himawari-10 minJapan Meteorological Agency (JMA)
Table 4. Abbreviations Related to Numerical Weather Prediction Models with Corresponding Details.
NWP ModelsAbbrev.Global or MesoscaleForecast Horizon & Spatial Horizontal ResolutionOperator
Global Forecast SystemGFSGlobalForecast Horizon: 16 days
Spatial Horizontal Resolution: 28 km, but decreases to 70 km for forecasts extending from one to two weeks
National Centers for Environmental Information (NCEI), USA
High-Resolution Forecast SystemHRESGlobalSpatial Horizontal Resolution: 10 days
Spatial Resolution: 9 km
European Centre for Medium-Range Weather Forecasts (ECMWF)
Ensemble Prediction System EPSGlobalForecast Horizon: 15 days
Spatial Horizontal Resolution: 16 km
European Centre for Medium-Range Weather Forecasts (ECMWF)
North American Mesoscale NAMMesoscale—Continental United States of AmericaForecast Horizon: 3.5 days
Spatial Horizontal Resolution: 12 km
National Centers for Environmental Information (NCEI), USA
Application of Research to Operations at MesoscaleAROMEMesoscale—France and neighboring countriesForecast Horizon: 2 days
Spatial Horizontal Resolution: 2.5 km (1.3 km within France)
Météo-France
Weather Research and Forecasting WRFMesoscale—Can be configured to cover any specific geographic area, ranging from local to regional scales.Forecast Horizon: Depending on the configuration
Spatial Horizontal Resolution: Depending on the configuration
National Center for Atmospheric Research (NCAR) and National Oceanic and Atmospheric Administration (NOAA), USA
Table 5. Comparative ranking of statistical and machine learning method categories in the periods 2012–2017 [6] and 2017–2023 (this study).
Method CategoriesPrevious Ranking (2012–2017) [6]Updated Ranking (Out of 5)
Traditional Time Series Methods14
Neural Networks22
Standard Machine Learning Techniques33
Regression45
Deep Learning51
Table 6. Abbreviations Related to Error Metrics Identified Through Text Mining Analysis with Corresponding Details.
CategoryError MetricsAbbrev.CountExample of Application in Literature
Probabilistic ForecastContinuous Ranked Probability ScoreCRPS15[105]
Prediction Interval
Coverage Probability
PICP9[54]
Prediction Interval Normalized Average WidthPINAW7[106]
Brier ScoreBS6[107]
Coverage Width-based CriterionCWC5[108]
Deterministic ForecastRoot Mean Square ErrorRMSE142[109]
Mean Absolute ErrorMAE113[16]
Normalized Root Mean Square ErrornRMSE49[110]
Mean Absolute Percentage ErrorMAPE46[111]
Mean Squared ErrorMSE46[112]
Mean Bias ErrorMBE23[113]
Normalized Mean Absolute ErrornMAE17[114]
Relative Root Mean Square ErrorrRMSE11[115]
Normalized Mean Bias ErrornMBE6[116]
Mean Average DeviationMAD5[117]
Mean Relative ErrorMRE5[118]
Disclaimer/Publisher’s Note: The statements, opinions and data contained in all publications are solely those of the individual author(s) and contributor(s) and not of MDPI and/or the editor(s). MDPI and/or the editor(s) disclaim responsibility for any injury to people or property resulting from any ideas, methods, instructions or products referred to in the content.