Article

Trailing-Edge Noise and Amplitude Modulation Under Yaw-Induced Partial Wake: A Curl–UVLM Analysis with Atmospheric Stability Effects

by
Homin Kim
1,
Taeseok Yuk
1,
Kukhwan Yu
2 and
Soogab Lee
1,3,*
1
Department of Aerospace Engineering, Seoul National University, Seoul 08826, Republic of Korea
2
Agency for Defense Development, Yuseong-Gu, Daejeon, Republic of Korea
3
Institute of Engineering Research, Seoul National University, Seoul 08826, Republic of Korea
*
Author to whom correspondence should be addressed.
Energies 2025, 18(19), 5205; https://doi.org/10.3390/en18195205
Submission received: 12 August 2025 / Revised: 19 September 2025 / Accepted: 25 September 2025 / Published: 30 September 2025
(This article belongs to the Special Issue Progress and Challenges in Wind Farm Optimization)

Abstract

This study examines the effects of partial wakes caused by upstream turbine yaw control on the trailing-edge noise of a downstream turbine under stable and neutral atmospheric conditions. Using a combined model coupling the unsteady vortex lattice method (UVLM) with the Curl wake model, calibrated with large eddy simulation data, wake behavior and noise characteristics were analyzed for yaw angles from −30° to +30°. Results show that partial wakes slightly raise overall noise levels and lateral asymmetry of trailing-edge noise, while amplitude modulation (AM) strength is more strongly influenced by yaw control. AM varies linearly with wake deflection at moderate yaw angles but behaves nonlinearly beyond a threshold due to large wake deflection and deformation. Findings reveal that yaw control can significantly increase the lateral asymmetry in the AM strength directivity pattern of the downstream turbine, and that AM characteristics depend on the complex interplay between inflow distribution and convective amplification effects, highlighting the importance of accurate wake prediction, along with appropriate consideration of observer point location and blade rotation, for evaluating AM characteristics of a wind turbine influenced by a partial wake.

1. Introduction

Wind energy is commonly produced using wind farms—an array of wind turbines—designed to reduce costs related to grid installation and maintenance. However, this clustered configuration can be aerodynamically inefficient, as downstream turbines are exposed to the wakes of upstream turbines which degrade their aerodynamic performance. Wake steering, a kind of wind plant control strategy [1], aims to mitigate the wake effects by applying an intentional yaw misalignment to the upstream wind turbine. While the yawed turbine itself generates less power due to reduced axial wind velocity, its wake is deflected, allowing the downstream turbines to capture more energy.
Several field test studies have shown that the yaw-based wake steering can significantly improve wind farm performance. Howland et al. [2] tested an optimized wake steering protocol to an operational wind farm, where statistically significant power increase of 7–13% was achieved for wind speed condition near the site average. Fleming et al. [3] conducted a detailed field campaign to calibrate wake deflection models and implemented an optimized yaw-based control on a 4 MW turbine array based on the simulation model, where a clear increase in the downstream turbine power up to 29% occurred with no strong trend in upstream turbine power. In another field campaign of wake steering [4,5], Fleming et al. investigated the performance of wake steering applied to a pair of wind turbines at a commercial wind farm. In the initial results, they showed the yaw-based wake steering increased the combined power of the wind turbine pair by 4%. The power gain effect was more consistent and stronger in stable atmospheric conditions com-pared to unstable conditions. In the subsequent results, they examined two turbine pairs and reported that wake steering reduced wake loss by approximately 6.6%.
Owing to its demonstrated benefits, research on wake steering has remained highly active. Recent studies show that inter-turbine interactions under yaw control depend not only on the yaw magnitude but also on the yaw direction, the atmospheric stability condition, and other site-specific factors; consequently, the effectiveness of wake steering can vary with operating and environmental conditions. Wei et al. [6] performed large-eddy simulations (LES) for the NREL 5-MW reference turbine and found that the efficiency of active yaw control increases at lower wind speeds and lower turbulence intensity, and that both turbine spacing and yaw direction exert substantial influence on control performance. The stronger sensitivity to yaw direction observed under stable atmospheric conditions further indicates that stability is a key variable in yaw control. Abkar et al. [7] investigated the impact of wind veer induced by the Coriolis force on the wake of a yawed turbine and showed that veer can produce direction-dependent asymmetry in wake development. Shibuya et al. [8] combined wind-tunnel testing and LES to demonstrate pronounced yaw-directional differences in both the near-wake and far-wake. Moreover, P. Fleming [9] argued that the interaction between counter-rotating vortex pairs and wake rotation leads to a non-symmetric power response to positive versus negative yaw. Collectively, these results indicate that wake steering is effective, but its efficiency is conditional on yaw direction, atmospheric stability, and ambient wind conditions.
Fundamentally, the power increase from the wake steering strategy is primarily due to wake deflection, where a downstream wind turbine is swept by a partial wake instead of a full wake. The partial wake reduces the effects of wake deficit on the downstream wind turbine, increasing the inflow axial velocity and the power accordingly, but it also increases the asymmetry of inflow into the downstream wind turbine. This asymmetric non-uniform inflow caused by the partial wake leads to an increase in unsteadiness of aerodynamic loads on the downstream wind turbine blades, which may affect the structural and aeroacoustic characteristics. However, the asymmetric inflow conditions experienced by downstream turbines under wake steering have received comparatively less attention in the literature. Recently, a number of studies have started to investigate the structural aspects. Thedin et al. [10] investigated the effects of partial wake in the structural aspects. They performed a parametric study on five aligned wind turbines using FAST.Farm, the mid-fidelity simulation tool for wind plant performance, and confirmed that the up-stream yaw misalignment for total power enhancement significantly increased the fatigue loading of downstream turbines. Wei et al. [11] employed a high-fidelity simulation tool to investigate, in a two-turbine scenario, how the wake of a yawed upstream turbine influences the structural loads experienced by a downstream turbine. Han et al. [12] examined the effects of yaw control on the aerodynamic power and loads of downstream turbines in 3-turbine configuration using unsteady vortex lattice method (UVLM), where approximately 16% increase occurred in the peak-to-peak value of root flap-wise bending moment with 15-degree yaw misalignment. These recent studies indicate that non-uniform inflow induced by yawed turbines increases unsteady aerodynamic phenomena in downstream turbines, thereby influencing their structural response. Similarly, the non-uniform inflow and unsteady aerodynamics generated by turbine wakes may also affect the noise characteristics of downstream turbines. However, studies focusing on the aeroacoustic effects of such asymmetric inflow remain limited, and the impact of wake steering on noise generation has yet to be thoroughly investigated.
Wind turbine noise has emerged as an increasingly important issue in the development and deployment of wind energy systems, particularly as turbines grow in size and are installed closer to populated areas. Among various sources, aerodynamic noise—generated by unsteady blade-air interactions and turbulent inflow—is dominant for modern large-scale turbines [13]. Additionally, amplitude modulation (AM) is considered as an important feature of wind turbine noise characteristics. AM refers to the temporal fluctuation in the amplitude of noise emitted from the turbine, perceived as a “swishing” sound that varies in intensity as the blades pass by the observer. AM is known to significantly contribute to the perceived annoyance of wind turbine noise. Lee et al. [14] conducted a controlled listening test using amplitude-modulated wind turbine noise recordings, and found that both the equivalent sound level and modulation depth had statistically significant effects on perceived annoyance. Similarly, Kristy L. Hansen et al. [15] conducted a year-long field study and demonstrated a clear relationship between AM strength and annoyance reported by residents, noting that “AM is a weak but significant independent predictor of annoyance.” These findings emphasize that AM is not merely an acoustic characteristic but a critical factor in community response to wind turbine noise. In recent years, multiple studies have confirmed the link between AM and annoyance, highlighting that AM characteristics represent a critical factor in wind turbine noise from the perspective of community impact [16,17].
Accordingly, simulation-based studies on wind turbine noise and AM have also been conducted. Noise prediction approaches can generally be classified into high-fidelity methods, which require significant computational resources, and semi-empirical or engineering models, which are computationally more efficient. High-fidelity methods are typically based on large-eddy simulation (LES) or high-resolution CFD coupled with the Ffowcs Williams–Hawkings (FW–H) formulation. While such approaches enable accurate noise predictions by resolving detailed flow physics, their computational cost remains prohibitively high for wind-farm-scale applications. Bernardi et al. [18] demonstrated this methodology by combining LES with the permeable FW–H approach to perform noise analysis of the NREL 5-MW reference turbine.
For multi-turbine or wind-farm-level noise studies, engineering methods incorporating semi-empirical models are more commonly employed [19]. Among the most widely used approaches are the Brooks–Pope–Marcolini (BPM) model and the Amiet model, which have continued to see broad application in recent years. For instance, [20] developed an AM synthesis tool by transforming Amiet model predictions into the time domain, thereby enabling the analysis of wind turbine noise amplitude modulation. Mackowsk et al. [21] combined aerodynamic simulations from an aeroelastic code with the BPM model to investigate AM mitigation through individual blade pitch control. Barlas et al. [22] coupled LES-derived inflow fields with the BPM model with time reconstruction process and a noise propagation solver to compare AM characteristics when only the emission process was considered versus when propagation effects were also included.
Despite the considerable amount of research conducted on AM, the fundamental mechanisms responsible for its occurrence remain not fully understood. According to the review paper by Lee et al. [23], several contributing factors have been suggested—including high wind shear, the directivity pattern of trailing-edge noise, which is a dominant contributor to wind turbine noise in terms of noise emission, and convective amplification associated with rotating blade motion. Additionally, a number of studies have shown the relationship between wind shear and wind turbine noise AM. Oerlemans [24] conducted a simulation study using the Brooks, Pope and Marcolini (BPM) formulation and demonstrated that strong wind shear increases both normal amplitude modulation and other amplitude modulation. It was also noted that non-uniform inflow caused by other reasons including yaw, turbulence and wake of neighboring turbines can similarly influence AM characteristics. Tian et al. [25] investigated the influence of different atmospheric conditions on wind turbine trailing-edge noise using Amiet’s analytical model. Their results showed that under conditions of stronger wind shear, trailing-edge noise increased in the downwind direction, while AM became more pronounced in the cross-wind direction during the downward motion of the blades.
In this study, the effects of yaw-induced partial wake on trailing-edge noise and AM were investigated under different atmospheric boundary layer conditions. Two atmospheric stability regimes, stable and neutral, were considered to account for the influence of stability-dependent wake recovery. The wake of a yawed turbine was modeled using the Curl model calibrated with LES data, with stability-dependent mixing lengths applied to improve accuracy. To capture unsteady aerodynamic responses caused by partial wake impingement, the coupled Curl–UVLM was employed for aerodynamic analysis across a range of yaw misalignment angles (from –30° to +30°). Based on the unsteady aerodynamic calculation, trailing-edge noise and AM characteristics of the downstream turbine were evaluated using the BPM semi-empirical model, with a focus on the overall sound pressure level (OASPL) and the AM strength.
The significance of this study lies in its quantitative evaluation of the influence of yaw-induced partial wakes on the trailing-edge noise and AM characteristics of downstream turbines, an aspect that has not been sufficiently addressed in previous research on wake steering. While some previous research on non-uniform inflow has suggested that turbine–turbine interactions may influence AM characteristics, to the best of the authors’ knowledge, this is the first study to quantitatively evaluate the changes in noise characteristics induced by non-uniform inflow under wake steering conditions. In addition, by incorporating a semi-empirical noise prediction module into the Curl–UVLM coupled model developed in the authors’ previous work [12], this study presents a methodology that enables the analysis of unsteady aerodynamic phenomena and noise characteristics associated with yaw control in wind farms at a moderate computational cost. Unlike conventional engineering tools for wake steering, which often rely on actuator-disk representations and rotor-averaged quantities and therefore cannot fully capture the effects of non-uniform inflow, the proposed framework allows both unsteady aerodynamic and noise analyses to incorporate such effects while maintaining computational efficiency. Finally, the results demonstrate that partial wakes can substantially alter noise characteristics, including enhancing the asymmetry of trailing-edge noise AM directivity. These findings indicate that optimization of yaw control in wind farms should account not only for average power production but also for the noise characteristics induced by non-uniform inflow, particularly those associated with AM.
The remainder of this paper is organized as follows. Section 2 describes the predictive models employed in this study, including wake prediction of yaw-controlled turbines, unsteady aerodynamic analysis, and semi-empirical model for trailing-edge noise. Section 3 presents the simulation setup, such as the atmospheric boundary layer conditions, wind turbine model and configuration, and the setup of observer positions for noise evaluation. Section 4 discusses the simulation results, focusing on the velocity fields predicted by the Curl model calibrated with LES data, as well as the aerodynamic and trailing-edge noise characteristics of the downstream turbine. Finally, Section 5 concludes the paper with a summary of the main findings and remarks on future research directions.

2. Methodology

2.1. Curl Wake Model

In this study, the wake velocity field of a yawed wind turbine is calculated by Curl model implemented in FLOw Redirection and Induction in Steady-state (FLORIS) v2. FLORIS [26] is a control-oriented parametric model widely used for simulation studies on wake steering. The FLORIS frame-work consists of multiple wake models capable of capturing the wake dynamics of turbines subjected to yaw and tilt, which range from simplified Gaussian-based formulations to more advanced physics-informed approaches, such as Curl model. The Curl model provides enhanced accuracy by capturing key flow features—such as counter-rotating vortices (CRVs)—associated with yawed turbine wakes, albeit at the expense of increased computational demand compared to simple Gaussian-based wake models [27,28].
The original Curl model developed by Martínez-Tossas et al. [29] numerically solves a simplified and linearized Reynolds-averaged Navier–Stokes streamwise momentum equation for an incompressible flow where the tangential velocity field is added as a set of CRV pairs to the base flow. Bay et al. [30] improved the model by additionally consider the effects of added turbulence and vortex decay, leading to the governing equation expressed as
U u x + V u y + W u z = α d I + ν e f f 2 u x 2 + 2 u y 2 + 2 u z 2
where α d is tunable dissipation scaling parameter, I + is empirically determined added turbulence, and ν e f f is effective viscosity. Spanwise and vertical direction velocity components are calculated from the tangential velocities of the CRV pairs modeled as Lamb-Oseen vortices as follows:
V = i = 1 N y i Γ i 2 π y i 2 + z i 2 1 exp y i 2 + z i 2 4 ν e f f t + σ 2
W = i = 1 N z i Γ i 2 π y i 2 + z i 2 1 exp y i 2 + z i 2 4 ν e f f t + σ 2
u t = Γ 2 π r 1 exp r 2 4 ν e f f t + σ 2
where the vortex decay factor is determined by the effective viscosity. The effective viscosity of the flow is computed based on the mixing length model as shown below
ν e f f = l m 2 d u d z   ,     l m = κ z 1 + κ z / λ ,
where κ is von Kármán constant, z is the distance from the ground, d u / d z is the velocity gradient from the boundary layer profile, and λ is the value of the mixing length in the free atmosphere, which is set to be a constant value with assuming neutral atmospheric boundary layer (NBL) [31,32]. However, the use of a constant mixing length can lead to inaccuracies when modeling wake velocity fields across different atmospheric stability regimes. In general, stable atmospheric boundary layer (SBL) is characterized by weaker turbulent mixing, which leads to stronger wind shear, lower turbulence intensity and slower wake recovery [33]. Thus, the deflection and deformation of a yawed turbine’s wake should be more pronounced in SBL than NBL [4,34]. However, with a fixed value of mixing length regardless of atmospheric stability, stronger shear leads to larger values of d u / d z and effective viscosity, which accelerates the wake recovery in the wake model. Adjusting the tunable dissipation scaling parameter α d in Equation (1) to compensate for this unintended increase in viscosity can result in excessively small value of α d , making the generated wake shape unrealistic. Thus, it appears important to apply different mixing length values depending on atmospheric boundary layer conditions in order to generate accurate wake velocity fields using the Curl model. As atmospheric stability increases, the mixing length typically decreases due to suppressed turbulent mixing. In this study, λ = 9   m for SBL case, and λ = 15   m for NBL case were used [31,32,35].

2.2. Unsteady Vortex Lattice Method (UVLM)

In this study, the UVLM, coupled with the Curl model, is used to analyze the unsteady aerodynamics of a downstream wind turbine swept by a partial wake. In our previous study [12], the coupled Curl–UVLM model was employed to simulate a 3-turbine case with yaw control. A comparison with LES data verified that the aerodynamic analysis by the coupled model accurately captured the effects of the yawed turbine and the downstream turbines influenced by the resulting partial wake.
Figure 1 presents the overall flow chart of the coupled model. UVLM computes lift and drag forces assuming an incompressible, inviscid, and irrotational flow field except at the wakes and body boundaries. The blades are represented by vortex rings, and the vortex rings are shed from the blades at each time step, which represents the vortex shedding. Vortex strengths at control points are determined by solving algebraic equations derived from the Biot–Savart law and boundary conditions. Aerodynamic forces are then obtained using the Kutta–Joukowski theorem [36]. To account for the effects of airfoil thickness and viscous stall delay, the nonlinear vortex correction method is applied [37]. Finally, the corrected vortex strengths are used to compute unsteady aerodynamic forces, and the time-averaged thrust coefficient is passed to FLORIS for subsequent turbine computations. More detailed information on the UVLM and the coupled model can be found in our previous work [12].

2.3. Semi-Empirical Formulation for Trailing-Edge Noise

Based on the unsteady aerodynamic results from the coupled Curl–UVLM model, trailing-edge noise is predicted using the semi-empirical formulation developed by Brooks, Pope, and Marcolini [38]. As one of the most widely used models for predicting airfoil self-noise, including trailing-edge noise [23], the BPM model estimates noise levels using spectral scaling functions calibrated through extensive wind tunnel tests with various configurations of NACA 0012 airfoils. Specifically, for effective angles of attack below a certain threshold α * 0 , the BPM model decomposes trailing-edge noise into three distinct components: suction side component, pressure side component and angle of attack component. The formulations for each component are given as follows.
S P L p = 10 log 10 δ p * M 5 L D ¯ h r e 2 + A S t p S t 1 + K 1 3 + Δ K 1
S P L s = 10 log 10 δ s * M 5 L D ¯ h r e 2 + A S t s S t 1 + K 1 3
S P L α = 10 log 10 δ s * M 5 L D ¯ h r e 2 + B S t s S t 1 + K 2
where subscript s indicates suction side, subscript p pressure side, and subscript α the effect of angle of attack. δ * is boundary layer displacement thickness, M is freestream Mach number, L is the length of span, and r e is retarded observer distance. A and B are empirical functions that define spectral shapes as functions of Strouhal number S t and Reynolds number. K 1 , K 2 and Δ K 1 are amplitude functions. D ¯ h refers to high frequency directivity function, defined as
D ¯ h Θ e , Φ e 2 sin 2 Θ e 2 s i n 2 Φ e 1 + M c o s Θ e 1 + M M c c o s Θ e 2
where Θ e and Φ e are chordwise and spanwise angle, respectively, measured from the trailing edge to the stationary observer in the retarded coordinate system. M c is the Mach number of the flow speed past the trailing edge, which is assumed to be 0.8 times the Mach number of inflow velocity in this study, following [39].
For the angles of attack above the threshold α * 0 , the contribution of pressure and suction sides becomes negligible, and trailing-edge noise caused by stall becomes dominant as follows:
S P L p =
S P L s =
S P L α = 10 lo g 10 δ s * M 5 L D ¯ l r e 2 + A S t s S t 2 + K 2
where different spectral shape function and directivity function are used. The low frequency directivity function is defined as
D ¯ l Θ e , Φ e sin 2 Θ e s i n 2 Φ e 1 + M c o s Θ e 4
which implies that the low-frequency directivity resembles that of a translating dipole. The threshold angle of attack α * 0 is defined as the lesser of two values: the stall angle of the airfoil section and the angle corresponding to the peak of the amplitude function K 2 , which is defined as
γ 0 = 23.43 M + 4.651

Validation of Trailing-Edge Noise Prediction

In this study, trailing-edge noise is predicted using the BPM formulation based on the unsteady aerodynamic results obtained from the UVLM. To validate the noise analysis combining UVLM with the semi-empirical formulation, comparisons were made with the measured power and noise data of the full-scale Atlantic Orient Corporation (AOC) 15/50 wind turbine [40,41]. The general characteristics of the AOC 15/50 wind turbine are summarized in Table 1, with further details provided in [41]. Aerodynamic profiles, including blade section airfoils, chord lengths, and pitch distributions, can be found in [42].
Figure 2a compares the online power curve measured at hub height wind speeds with the time-averaged power predicted by the UVLM. From the cut-in wind speed of 4.9 m/s to around the cut-out wind speed of 22.3 m/s, the UVLM-predicted mean power was found to be in good agreement with the measured trend as a function of wind speed. In particular, it was observed that the UVLM predictions agree well with the measurements in the mid-range wind speed region, from 8 m/s to the rated wind speed of 12 m/s.
Next, to validate the noise predictions, the sound pressure level (SPL) was compared at the IEC 61400-11 [43] specified measurement position, located 32.5 m downstream of the wind turbine. Figure 2b compares the measured noise data under a steady wind speed of 8 m/s with the trailing-edge noise predictions obtained using the UVLM and BPM models. In the measurements, the contribution of turbulent inflow noise was excluded, and light boundary-layer tripping conditions—generally suitable for full-scale wind turbines—were considered. Except for a relatively strong tonal noise observed only in the measurements around 1600 Hz, the predicted trailing-edge noise showed good agreement with the full-scale wind turbine noise across most of the frequency range. This confirms that trailing-edge noise is generally the dominant component of wind turbine noise, particularly in cases where turbulence plays a minor role. The discrepancy near 1600 Hz is attributed to trailing-edge bluntness vortex shedding noise, which occurs when the trailing-edge thickness is relatively large and is primarily associated with the geometric characteristics of the trailing edge.

3. Simulation Setup

3.1. Atmospheric Boundary Layer

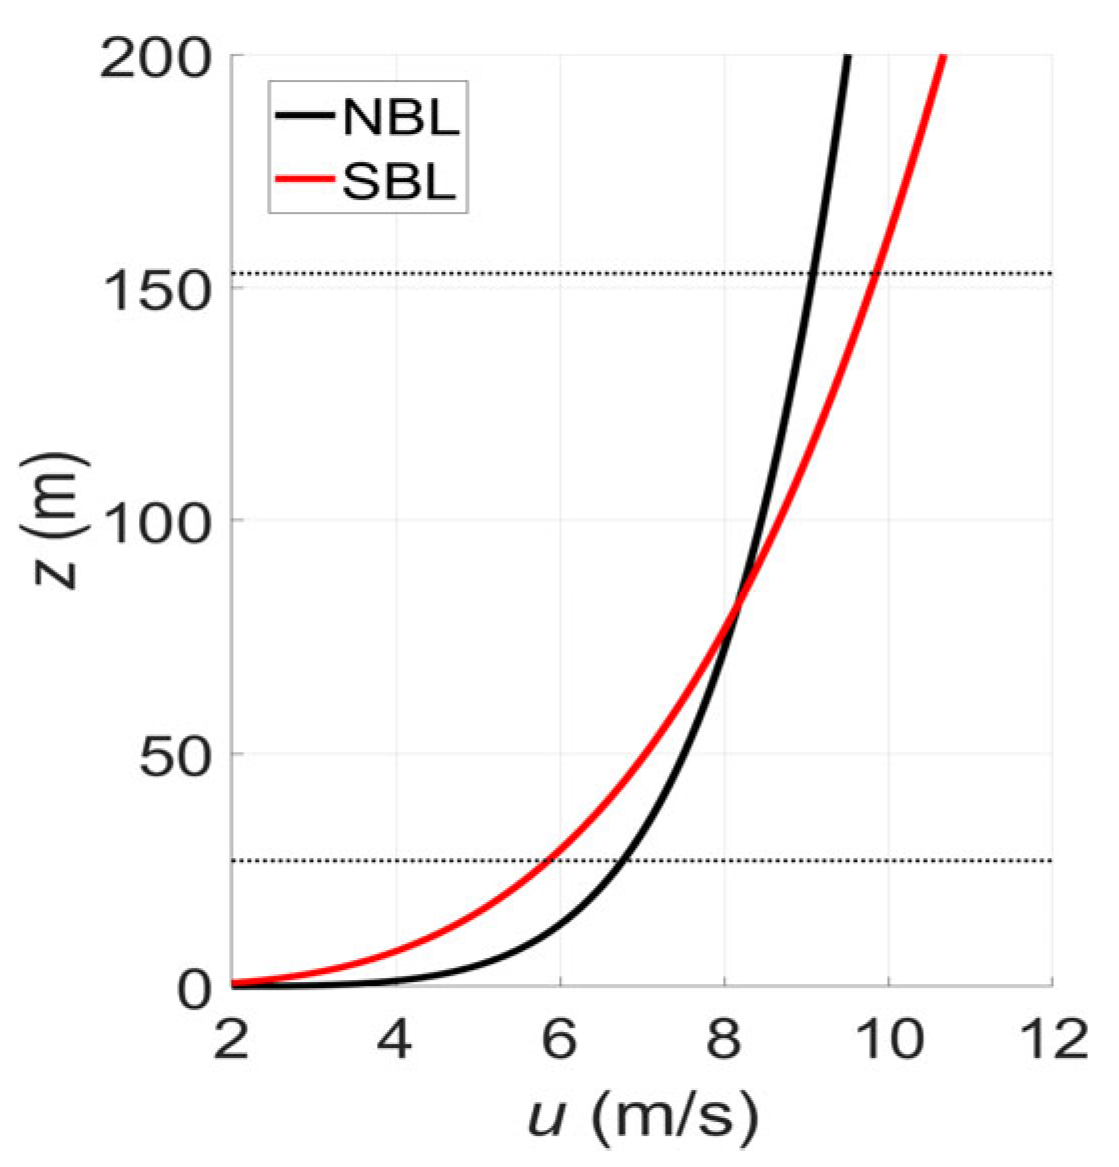
To account for the effects of different atmospheric stability, two freestream wind conditions—SBL and NBL—are considered. The specific freestream parameters are based on the LES study by Vollmer et al. [44] and are summarized in Table 2. These parameters are input to the Curl model to predict wake velocity fields according to yaw misalignment angles. The freestream velocity fields are generated from the hub height wind speeds and shear coefficients using a power law approximation as shown in Figure 3. In this study, only wind shear was considered in the freestream wind condition, while wind veer was assumed to be zero. The ambient streamwise turbulence intensity is used for turbulence model in Curl wake to calculate the wake dissipation.

3.2. Wind Turbine Model

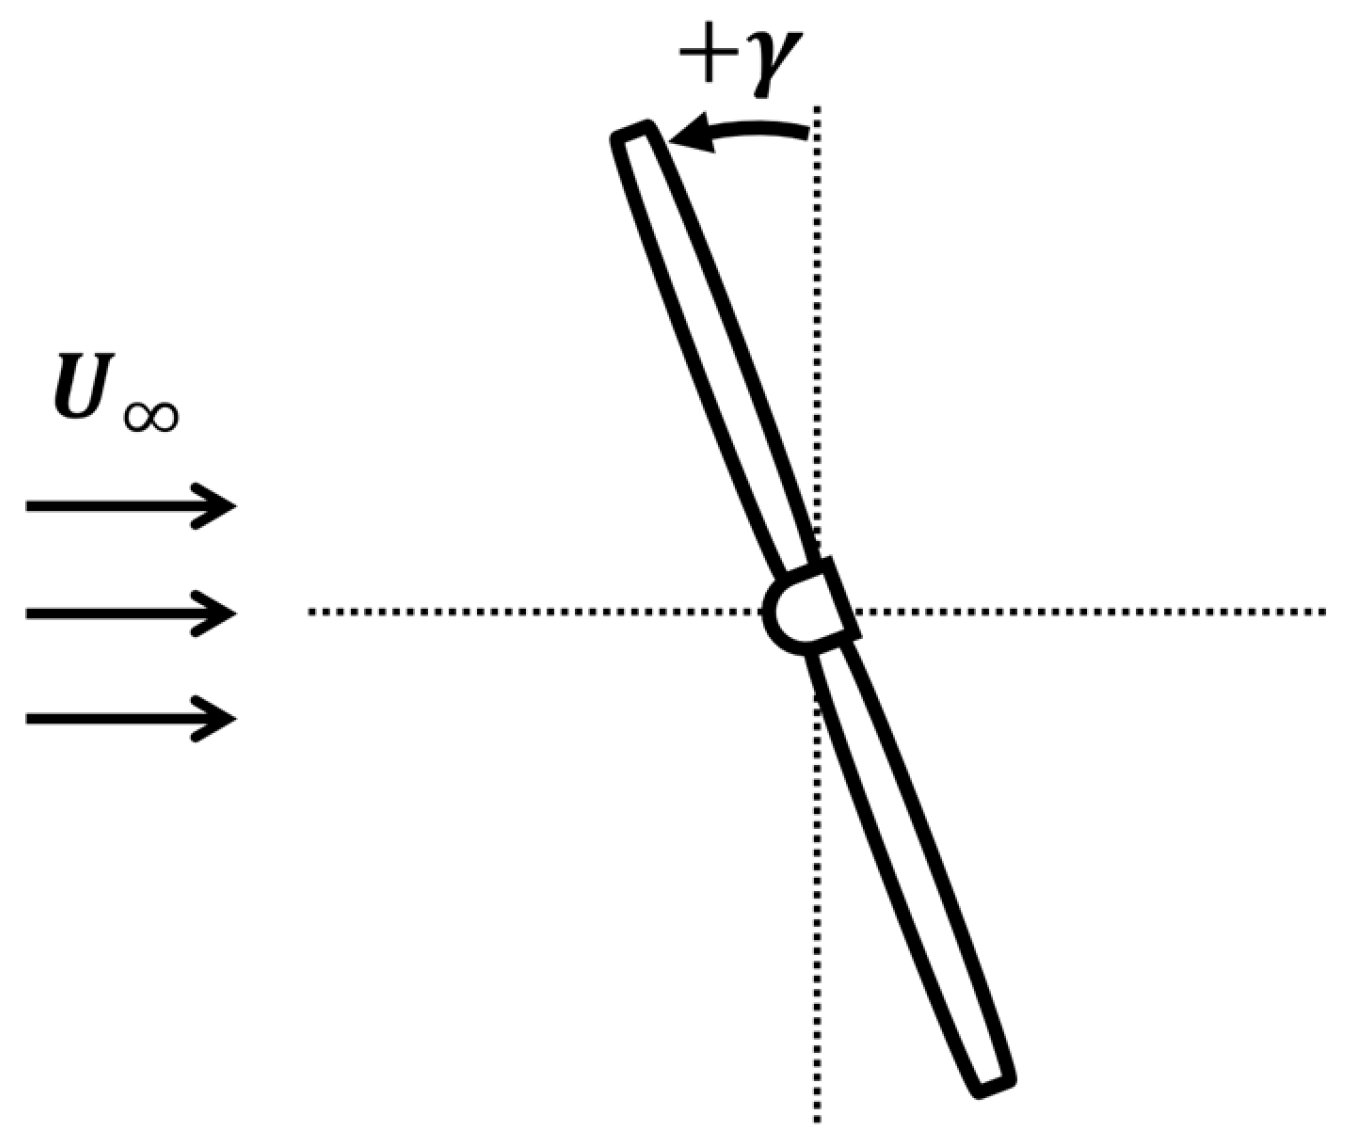
The NREL 5 MW reference wind turbine is used as the model turbine, and its general properties are listed in Table 3. The blade airfoil sections from root to tip consist of DU40, DU35, DU30, DU25, DU21, and NACA64 profiles. The detailed distribution is provided in [45]. A two-turbine configuration is simulated, where two NREL 5 MW turbines are aligned in series with a separation of six rotor diameters (6D), as shown in Figure 4. Yaw control is applied only to the upstream turbine, with yaw angles considered in the range of –30° to +30° at 15° intervals. The definition of yaw direction is illustrated in Figure 5. In the aerodynamic analysis model, the wind turbine blades are assumed to rotate counterclockwise when viewed from the upstream side.

3.3. Observer Points for Noise Analysis

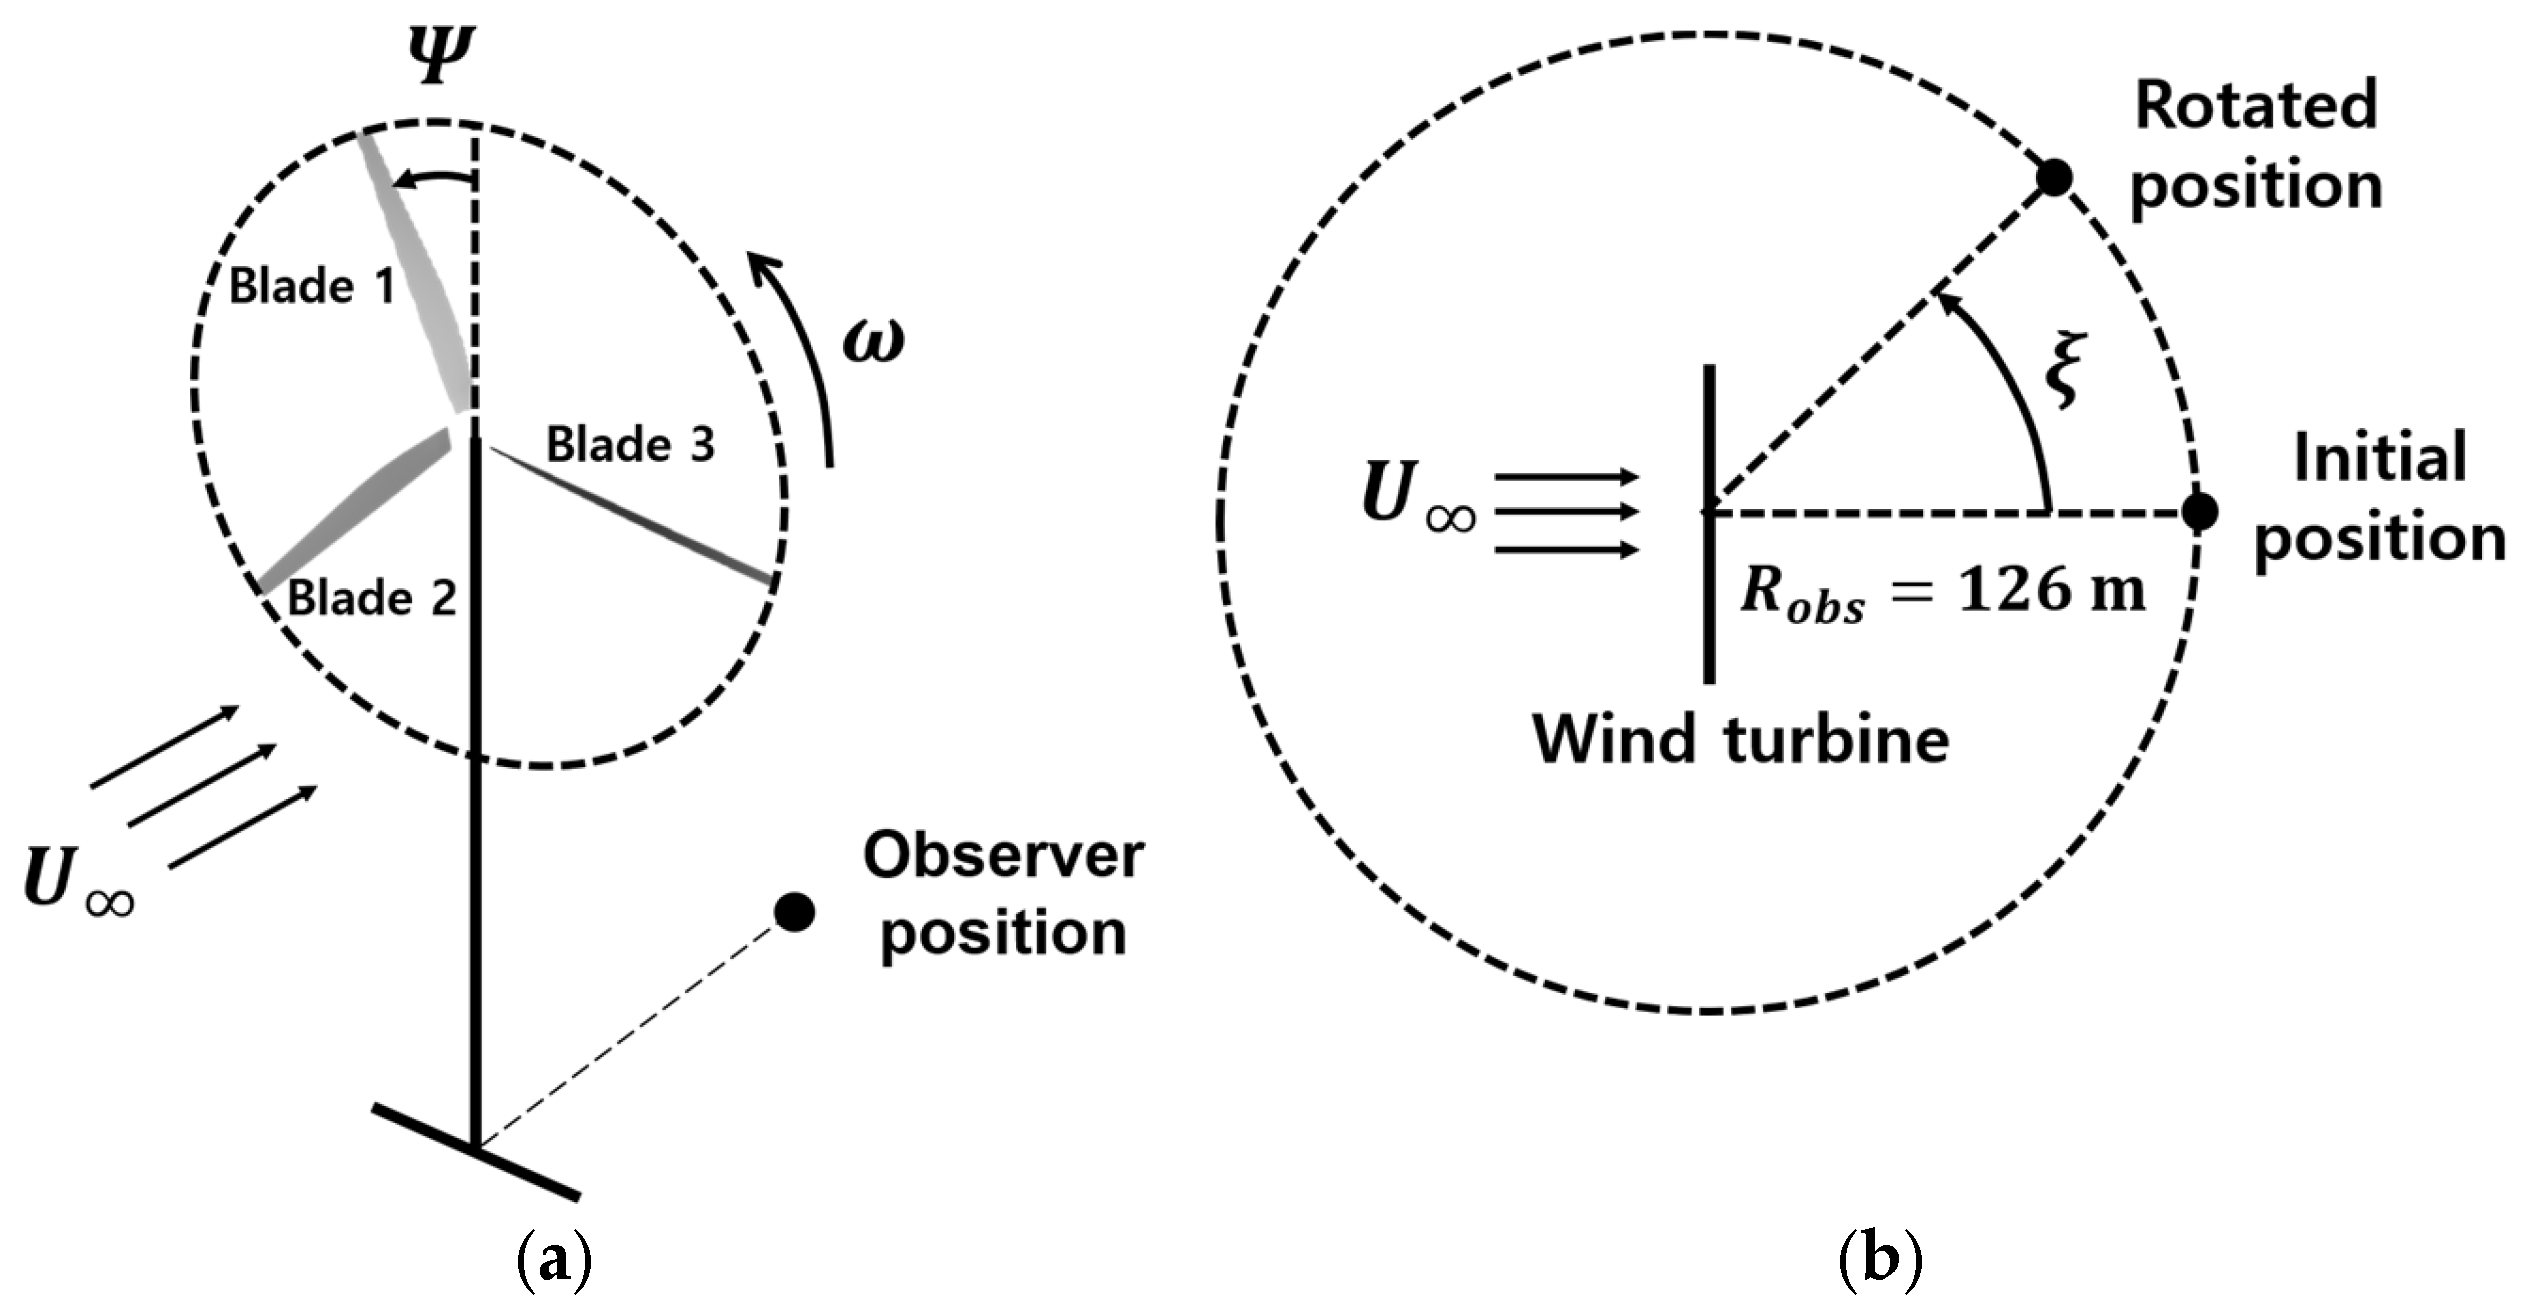
For the noise analysis, observer points are set to be located at ground level, at a distance equal to the rotor diameter (126 m) from the wind turbine location. Noise directivity is evaluated by rotating the initial observer point in 10° increments. The observing points for noise directivity relative to the wind turbine is illustrated in Figure 6, where the rotor azimuth angle Ψ and observer position angle ξ are defined. The rotor azimuth angle is referenced when a blade is at the top of the rotor disk, and the observer angle is defined with respect to the downstream direction. Figure 6a depicts that the rotor blades rotate counterclockwise when viewed from the upstream side, as mentioned earlier. At the onset of each revolution, Blade 1 is positioned at Ψ = 0 , with Blade 3 and Blade 2 following sequentially at angular intervals of 120°.

4. Results and Discussion

4.1. Wake Prediction with LES-Fitted Curl Model

To predict reasonable and realistic wake velocity fields of a yawed wind turbine, tuning parameters of the Curl model were fitted to the LES results by Vollmer [44]. Two tuning parameters of the Curl model, dissipation scaling parameter α d and initial velocity deficit parameter, were adjusted so that the wake center deflection and velocity deficit at hub height match those observed in the LES data. Also, as mentioned in 2.1, different values of mixing length were used depending on the atmospheric stability. The other parameters related to turbulence model were set based on the study by Bay et at [30]. Table 4 presents the values of the major tuning parameters used in this study.
Figure 7 illustrates the predicted streamwise wake velocity fields at a location 6D downstream of the upstream turbine. The black circle in each figure represents the downstream wind turbine rotor, which is swept by the predicted wake fields. The results for SBL and NBL are shown in the left and right columns, respectively. In each column, the results for different yaw angles are presented from the topmost case of −30° to the bottommost case of +30°, with increments of 15°. The generated wake fields under the SBL conditions exhibited a greater velocity deficit and more pronounced deformation in the wake center region compared to the NBL conditions. For both stability conditions, as the magnitude of yaw angle increased (from 0 to 30°), the wake moved farther from the rotor axis and became more distorted, accompanied by a slight reduction in wake deficit. As expected, positive yaw angles led to rightward wake deflection, while negative yaw angles caused the wake to deflect to the left. Due to the effect of wake rotation, the negative yaw resulted in a stronger wake depth with less deflection of the wake center compared to the positive yaw. Such variations in wake distribution with respect to the yaw direction directly influence the unsteady aerodynamic and noise characteristics of the downstream wind turbine as demonstrated in the results presented later.
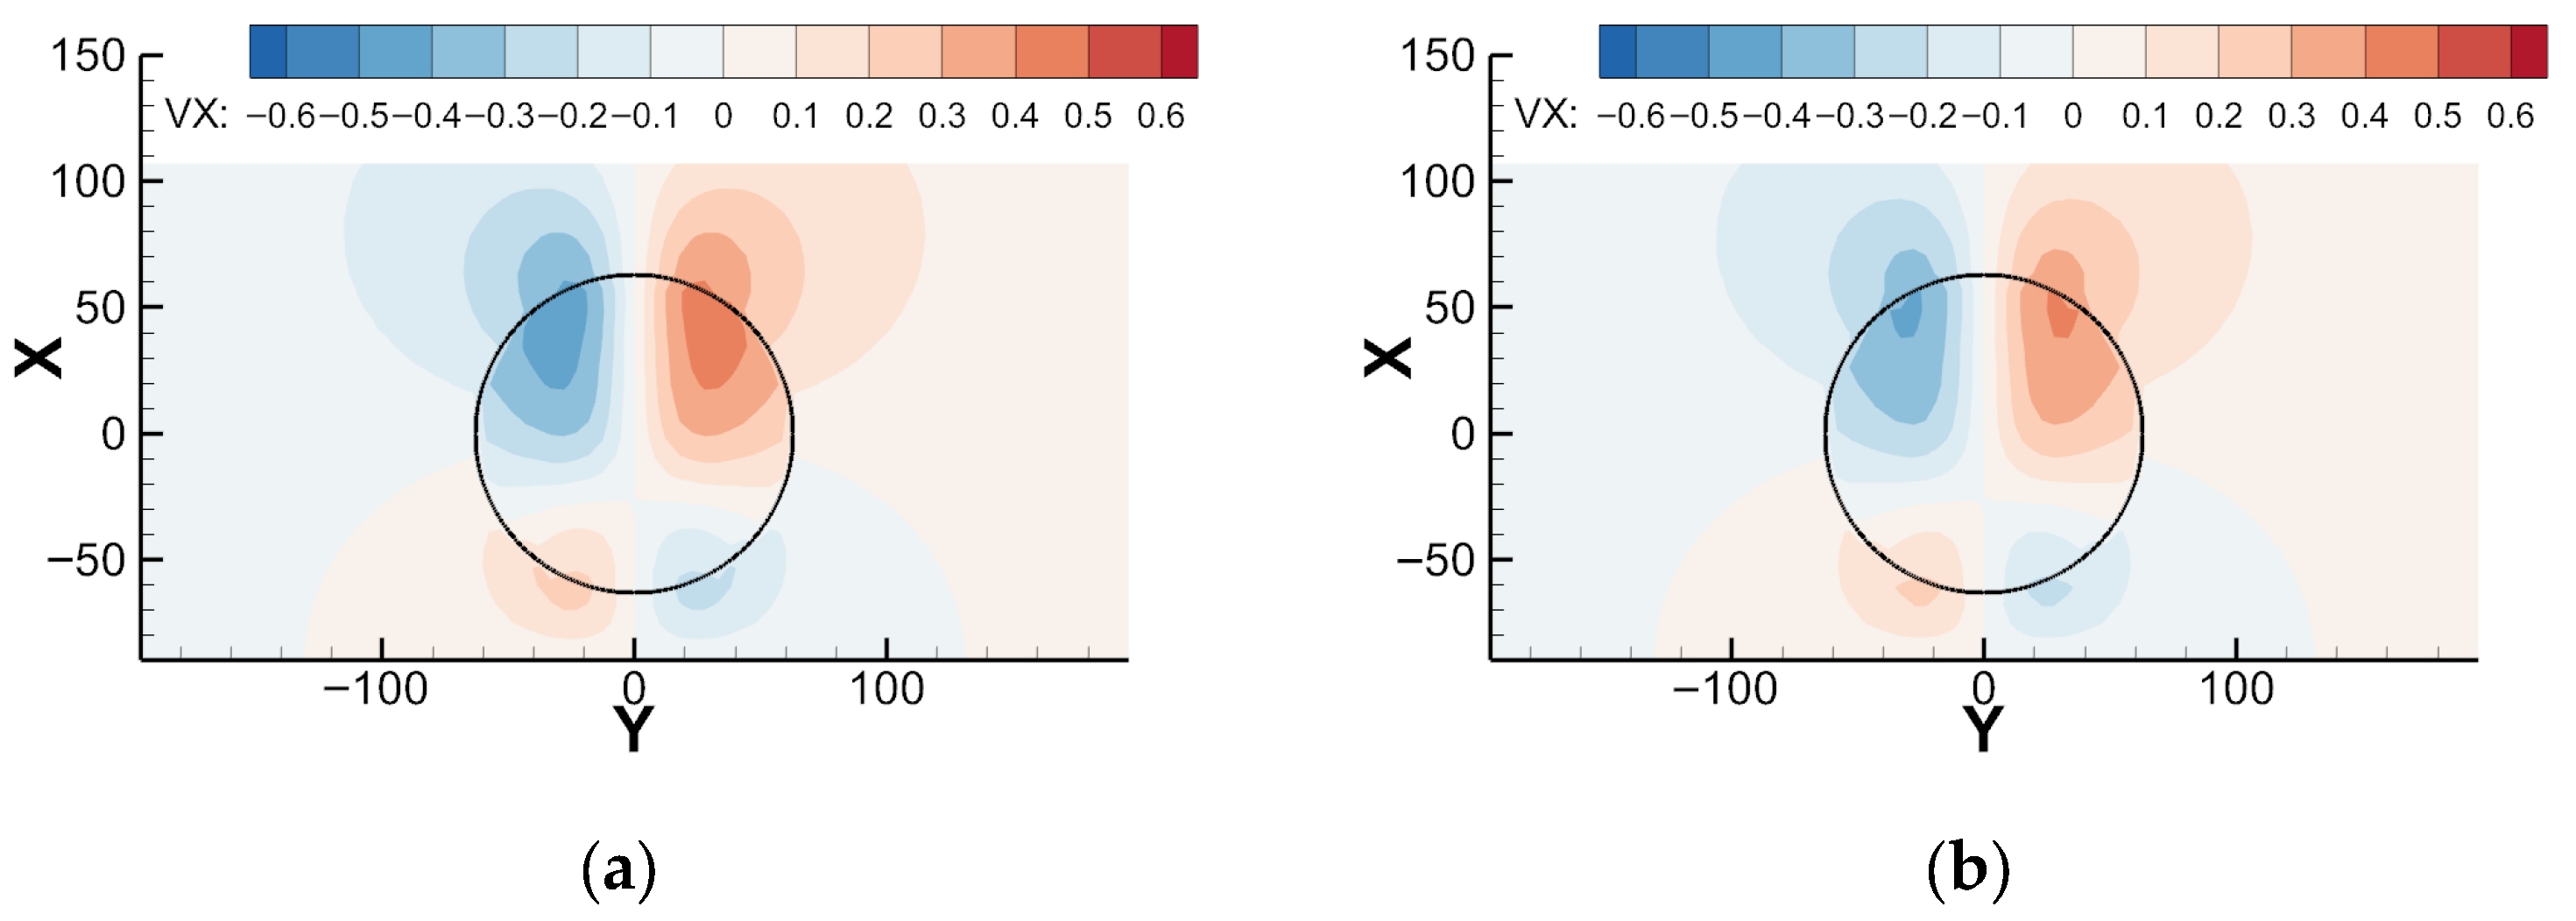
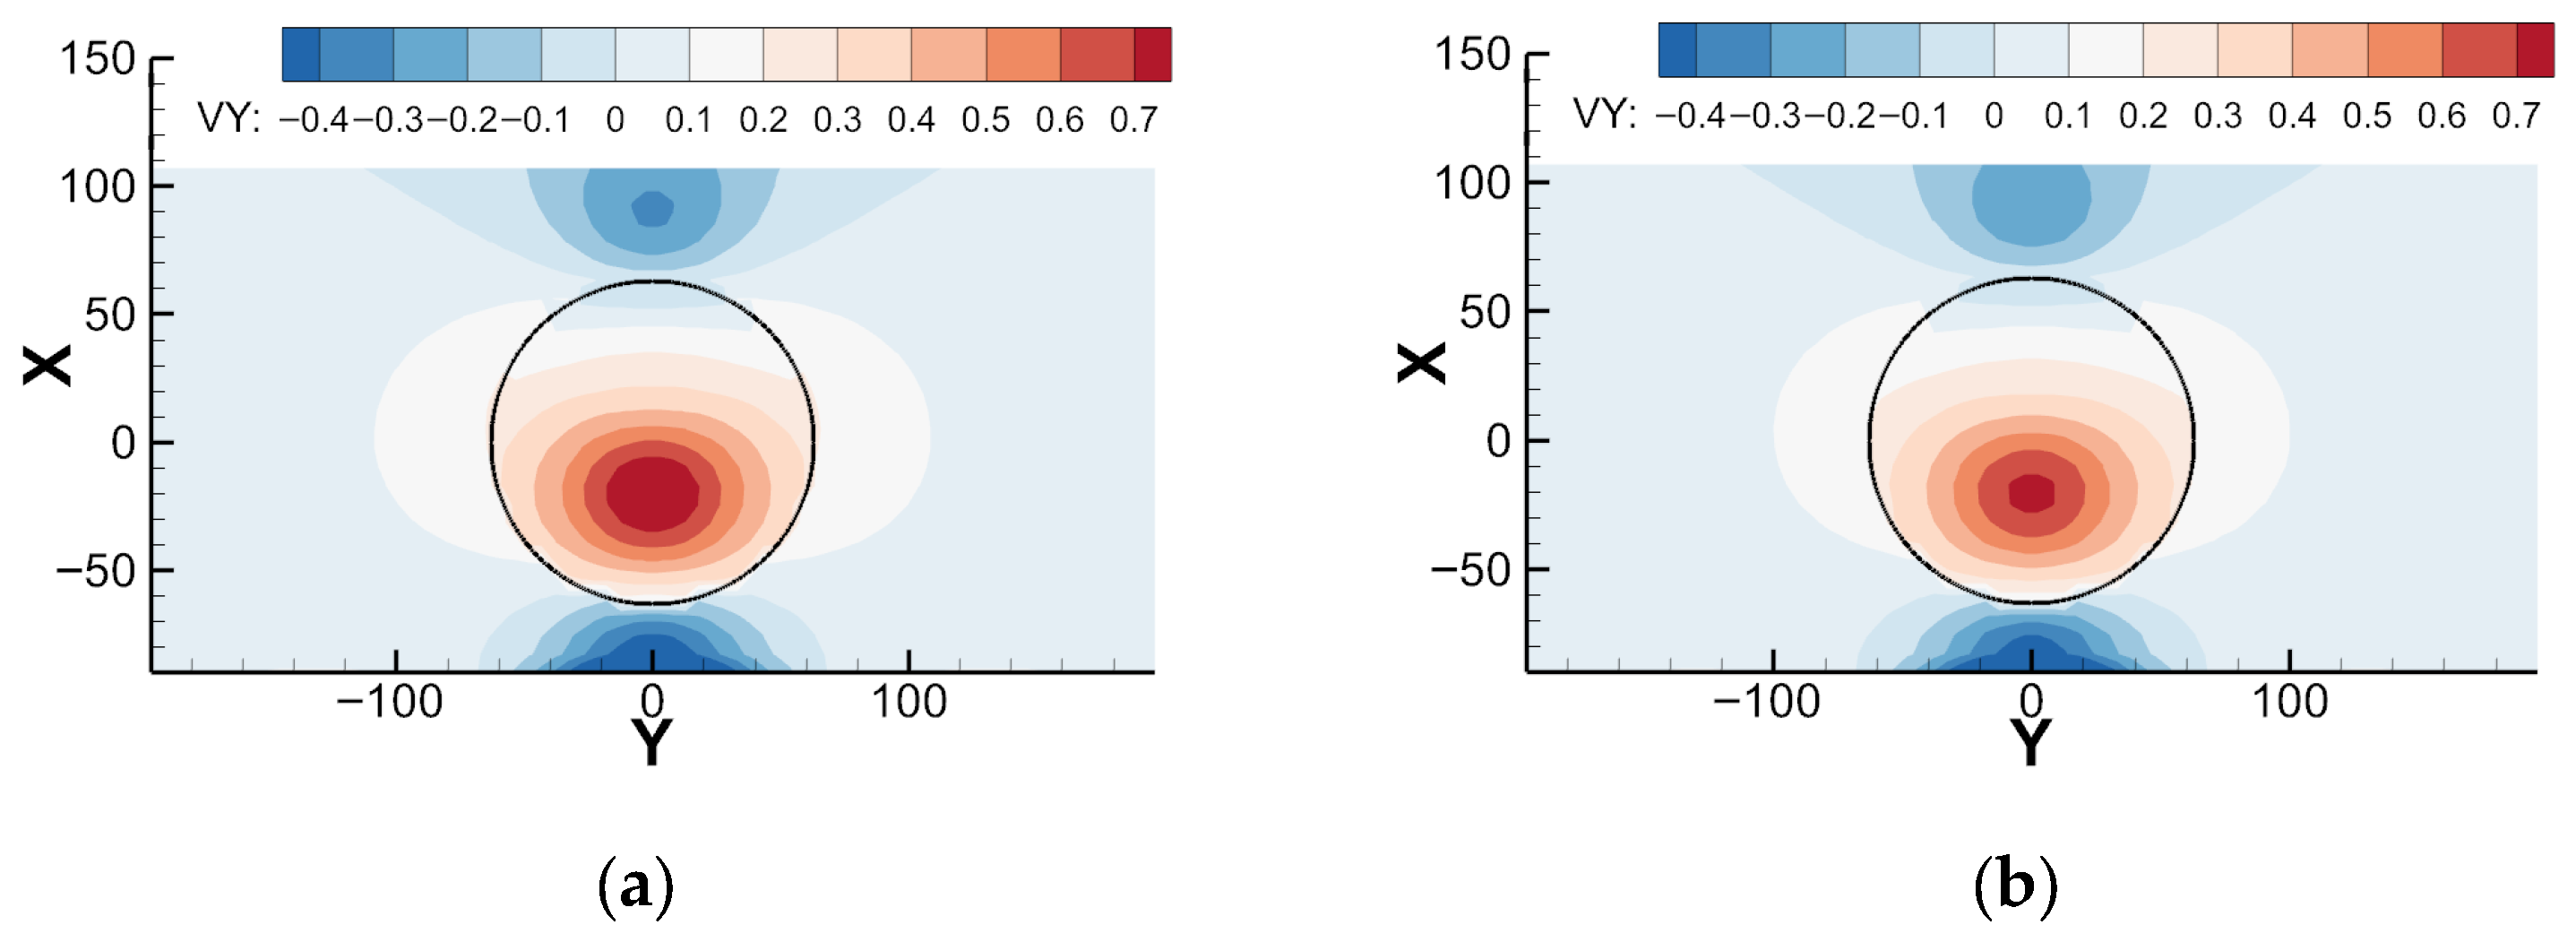
A yawed wind turbine’s wake is characterized by CRV pairs, which can be represented as vertical and spanwise velocity components. Although the magnitude of these velocity components in the lateral plane is relatively small, they play a crucial role in the wake’s deflection and distortion, with their effects becoming more pronounced under stable atmospheric conditions. Figure 8 and Figure 9 show the vertical and spanwise velocity components of the wake field predicted by the Curl model for a yaw misalignment angle of 30°. As depicted in the figures, the CRV structure was well captured, and its strength was found to be greater under SBL conditions compared to NBL. This suggests that the mixing length and tuning parameters applied in the Curl model were appropriately set to reflect the physical characteristics of wake behavior under different atmospheric stability conditions.
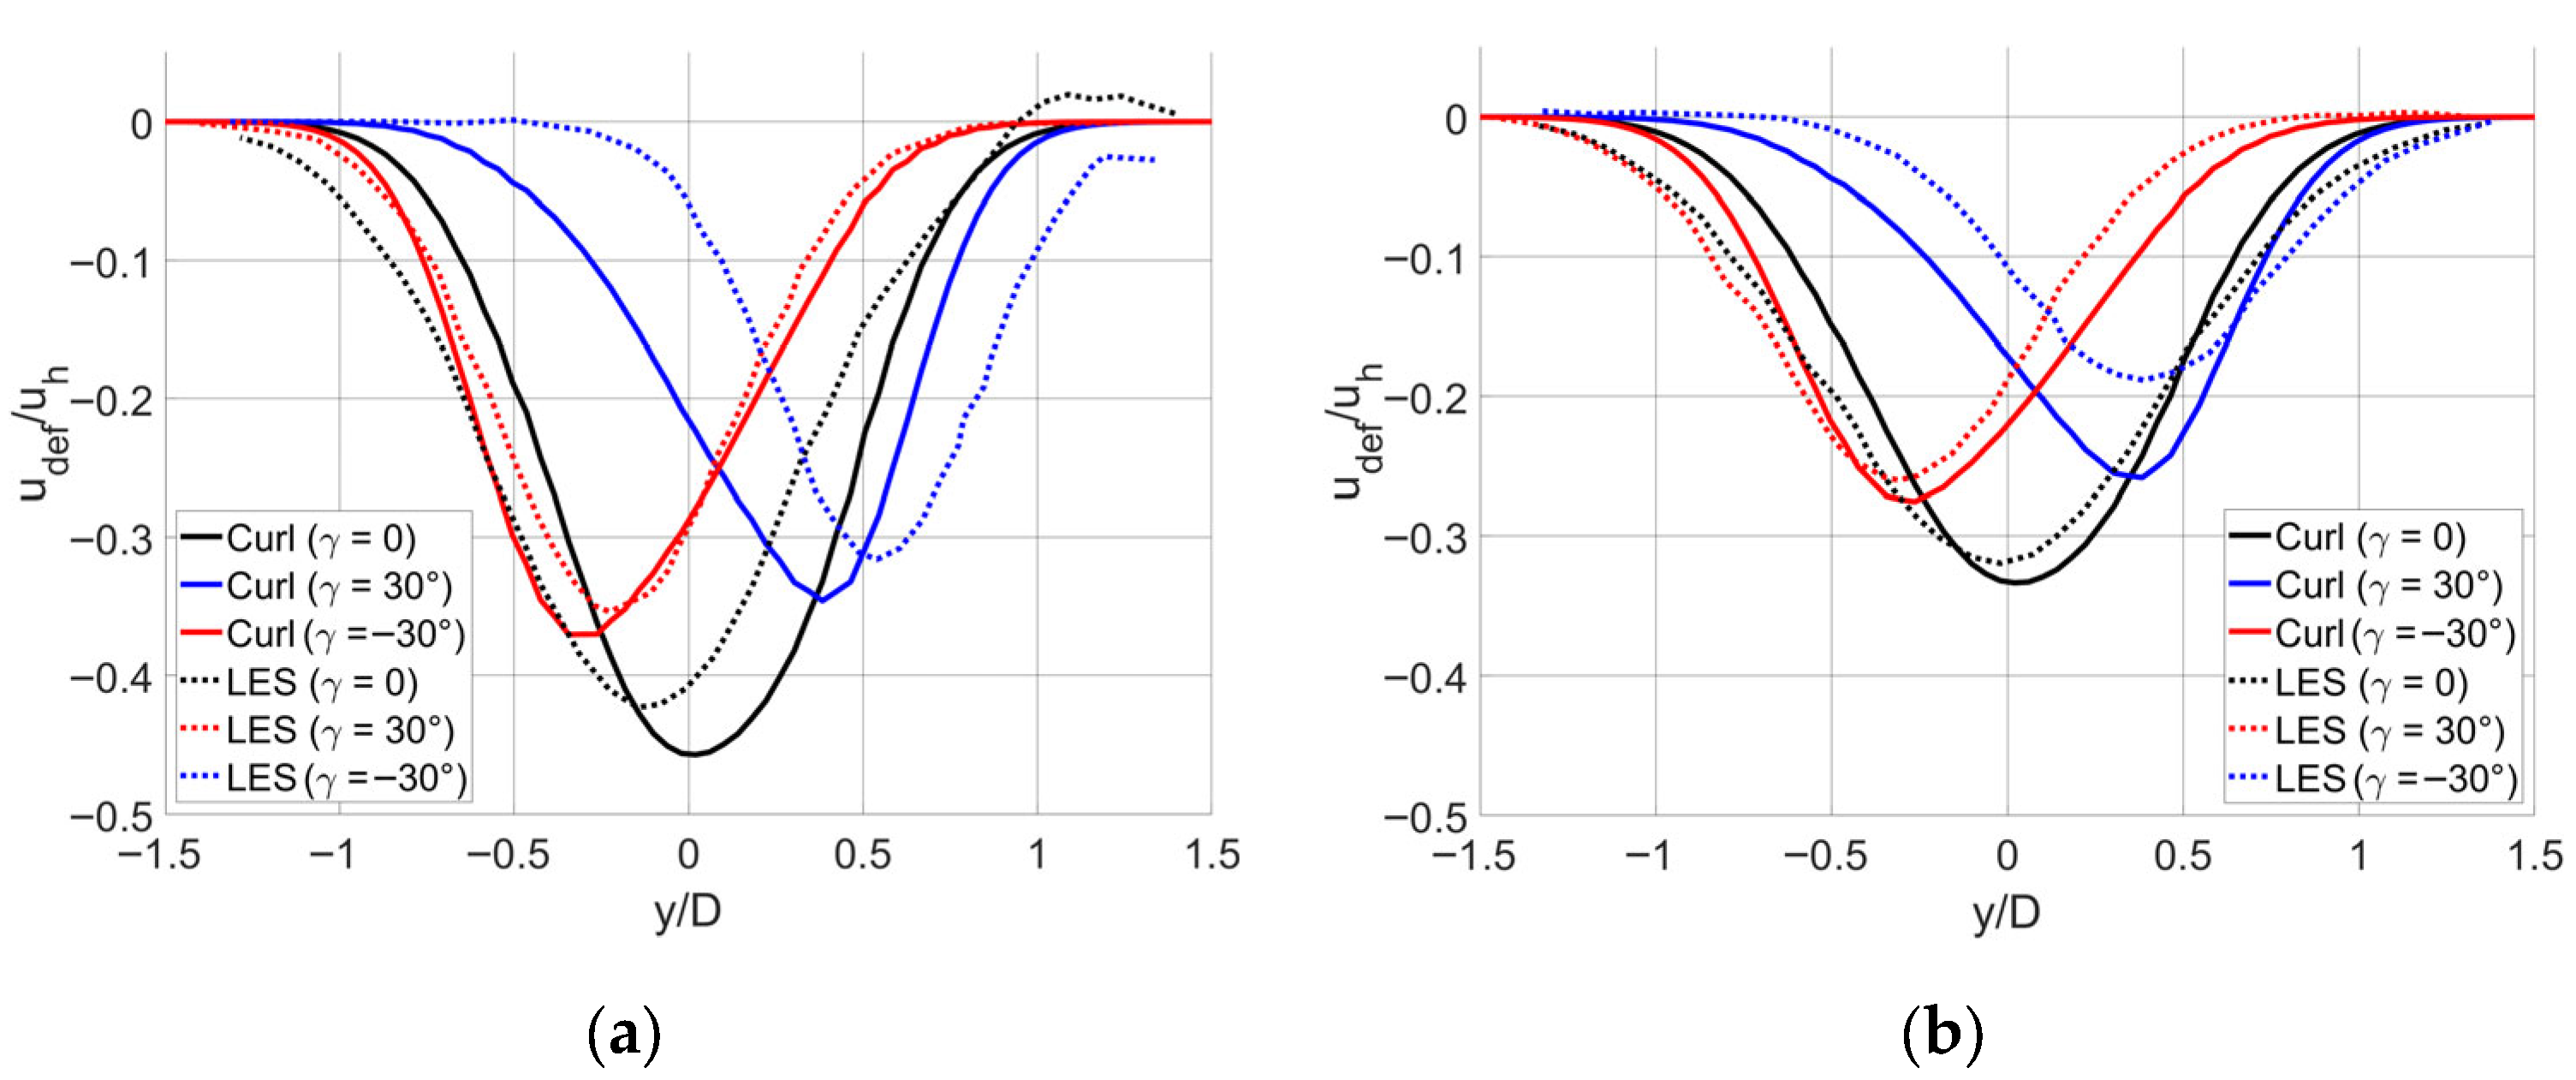
For the validation of predicted wake velocity fields, the normalized wake deficit and wake center position of the predicted wake and the referenced LES results [44] were compared. Figure 10 shows the normalized wake deficit distributions at hub height, predicted by the Curl model and LES, for SBL and NBL conditions. The normalized wake deficit was calculated by dividing the velocity deficit at each position at hub height—defined as the difference between the freestream wind speed and the streamwise wake velocity—by the freestream wind speed. The normalized wake center position was calculated by dividing the lateral position of the maximum wake deficit by the rotor diameter. Despite minor discrepancies, the magnitude of wake deficit and the location of wake center generally agreed well with the LES results, at different atmospheric stability conditions and yaw misalignment angles.
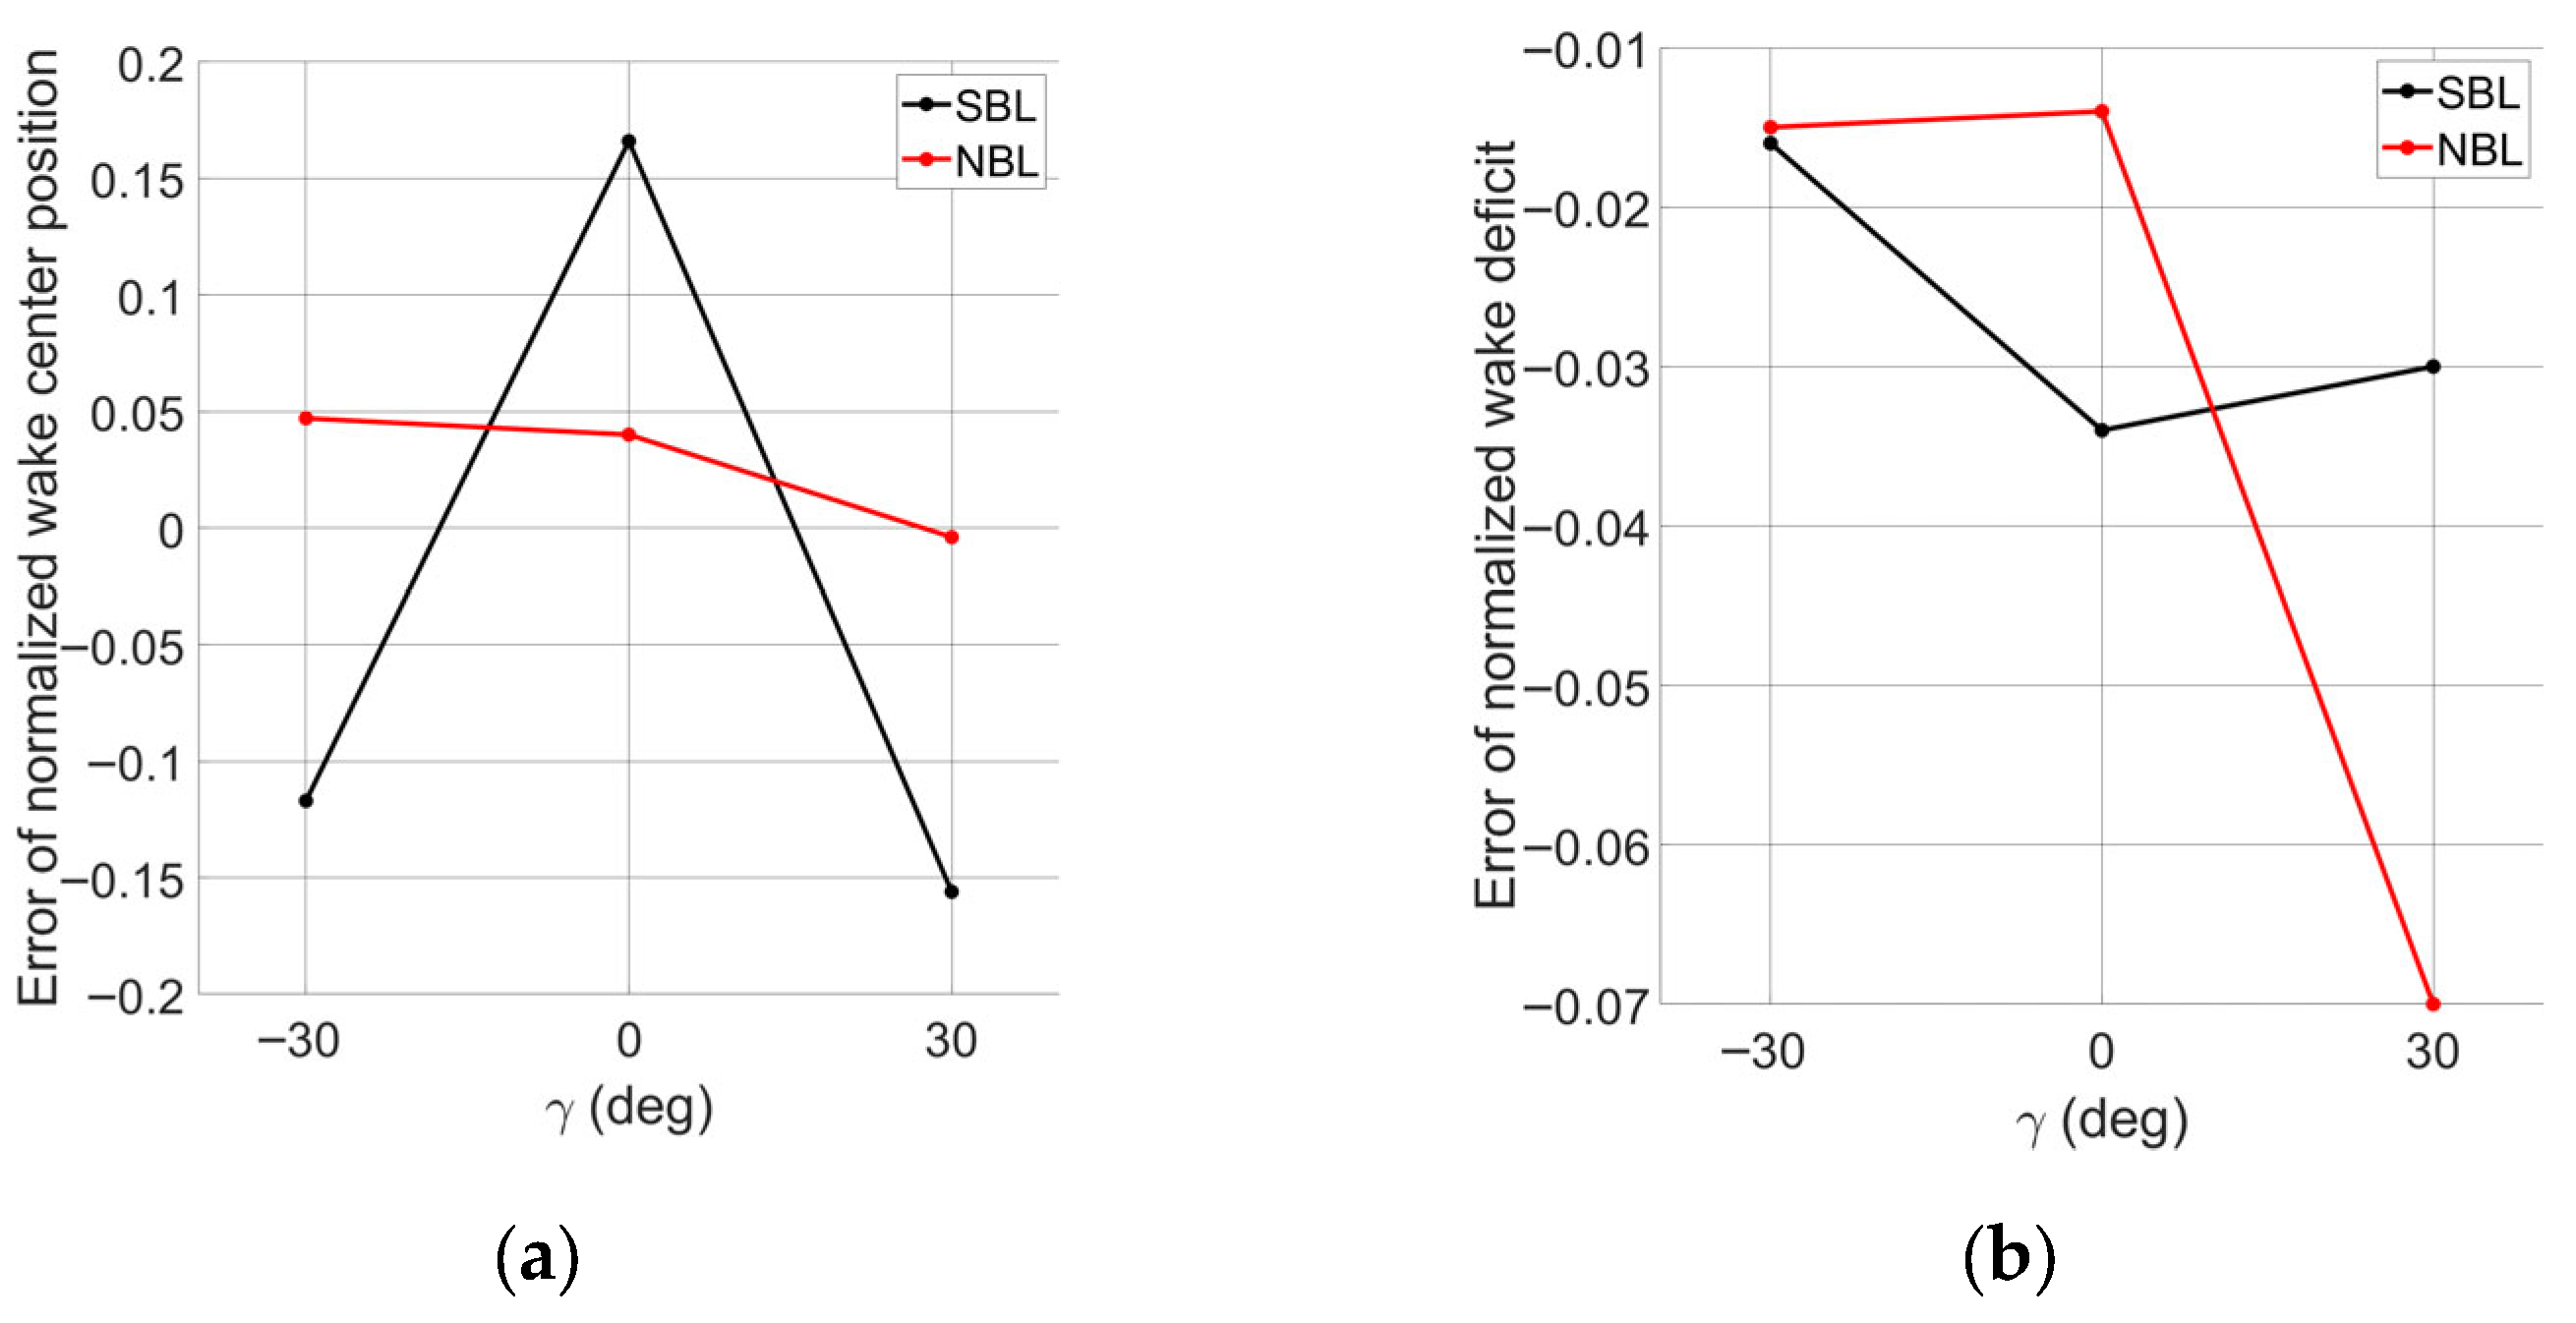
To provide a clearer error analysis, the differences in normalized wake center position and normalized wake deficit between the Curl model and LES results are presented in Figure 11. For the wake center position shown in Figure 11a, the errors were predicted to be within 5% of the rotor diameter under NBL conditions and around 10% under SBL conditions. In addition, the magnitude of the error did not vary significantly with yaw direction. The larger error observed under SBL compared to NBL appears to result from the slow wake recovery in SBL, which enhances the wake effects and thereby increases the discrepancy between the simplified Curl model and the LES predictions. For the wake deficit shown in Figure 11b, the error was within approximately 3% of the hub-height mean velocity, except for the 30° yaw case under NBL conditions. Moreover, the error was found to be larger at 0° and 30° yaw than at –30°, indicating that the prediction accuracy of wake deficit depends on the yaw direction. This difference is presumed to result from the fact that, unlike LES, the Curl model used in this study did not account for wind veer. The influence of yaw direction on wake distribution under yaw control has been discussed in previous studies, and the underlying mechanisms are generally attributed to two major factors: the interaction between the CRV, which is dependent on the yaw direction, and wake rotation [9], and the effect of wind veer caused by the Coriolis force [7]. In this study, while the Curl model accounted for the transverse velocities induced by the CRVs and the wake rotation due to rotating blades, wind veer was assumed to be zero, unlike the LES. The larger discrepancy observed at 30° yaw may be partly attributed to a possible constructive interaction between CRVs and wind veer, which could have shifted the wake center significantly toward the upper right relative to negative yaw conditions as in the LES results [11]. This suggests that employing appropriate wind veer input in the Curl model could improve the accuracy of wake distribution predictions under different yaw directions.
The predictions obtained using the Curl model similarly demonstrated, as with LES results, a stronger wake depth in the SBL condition compared to the NBL condition, as well as larger variations in the normalized wake deficit induced by yaw. Furthermore, the effect of wake rotation was well captured, showing stronger wakes under negative yaw conditions than under positive yaw. Overall, the errors were larger for positive yaw angles than for negative yaw angles, which is likely due to the LES results predicting a more pronounced wake deflection at hub height under positive yaw conditions.

4.2. Average Power and Variation of Effective Angle of Attack

The wake velocity fields computed in Section 4.1 were used as inflow conditions for unsteady aerodynamic analysis performed with the UVLM. The time step was set to 0.1 s. The rotor rotational speed for each case was obtained by interpolating the operating condition table of the NREL 5 MW turbine, based on the mean wind speed at the rotor plane. Under SBL and NBL stability conditions and yaw angles ranging from –30° to +30°, the rotor speed varied between 7.744 rpm and 8.435 rpm. This corresponds to approximately 71–77 time steps per rotor revolution.
Prior to analyzing the noise characteristics of the downstream turbine under partial wake conditions, the average power outputs of both turbines were examined to confirm the primary objective of wake steering in the two-turbine case: increasing total power output. Figure 12. shows how the average power output of the two turbines varied with yaw misalignment angle under SBL and NBL conditions. For both atmospheric stability conditions, the power output of the upstream turbine decreased with increasing yaw angle magnitude due to a reduction in axial inflow velocity. This trend followed an approximate proportionality to the square of the cosine of the yaw angle. For the upstream turbine power, the differences due to the atmospheric stability conditions were not significant. In addition, the difference in power reduction with respect to yaw direction was also small. When yaw is applied to the upstream turbine, advancing/retreating side effects and a skewed wake effect occur depending on the yaw direction. However, these effects appear in a nearly mirrored fashion with respect to yaw direction over one rotor revolution, and therefore the mean power of the upstream turbine is not significantly affected by yaw direction.
In contrast, the downstream turbine’s power increased with larger yaw angle magnitude, as the wake deflection increased the average inflow velocity on the wind turbine rotor. The power increase was more prominent for NBL than SBL because the slow wake recovery in SBL condition led to a larger wake deficit and smaller shift of the wake center. Also, the power increase in downstream turbine was more prominent for positive yaw than negative yaw, as the rotor was swept with deeper wake with negative yaw due to the effect of wake rotation as shown in Figure 7. The asymmetry in the power increase and decrease in the downstream turbine with respect to yaw direction has been reported in several studies [Ref] and is generally explained by two main mechanisms. The first is the interaction between the CRV pair and wake rotation. While the direction of wake rotation is fixed by the turbine’s rotational direction, the orientation of the CRV reverses depending on the yaw direction. Consequently, the two transverse velocity components interact either constructively or destructively depending on the yaw direction, leading to differences in the formation of the wake distribution. The second mechanism is the influence of wind veer induced by the Coriolis force. In the present study, wind veer was not considered, and the results demonstrate that yaw-directional differences in power variations can arise solely from the wake rotation effect, even in the absence of wind veer.
The maximum total power output was gained with γ = 15 ° in SBL condition and γ = 30 ° in NBL condition. The total power actually decreased with negative yaw, which implies the direction of yaw control, or the effect wake rotation, can significantly influence the effectiveness of wake steering.
The partial wake on the downstream turbine induces an aerodynamic unsteadiness. Figure 13 shows the distribution of effective angle of attack over the downstream turbine rotor. The upper row depicts the effective angle of attack distribution under SBL condition, while the lower row corresponds to the NBL condition. The results for different yaw angles are presented from the leftmost figures of −30° to the rightmost figures of +30°, with increments of 15°. Overall, distribution of effective angle of attack generally followed the inflow wind speed distribution on the rotor shown in Figure 7, where the asymmetry was more severe with negative yaw. To investigate the variation in effective angle of attack more clearly, the effective angle of attack variation experienced by an individual blade at r / R = 0.84 is presented in Figure 14. As the yaw angle magnitude increased, the rotating blade experienced greater fluctuation of effective angle of attack. The fluctuation strength was greater under SBL condition than NBL condition, as the inflow distribution into the downstream turbine was more asymmetric in SBL condition as shown in Figure 13. Also, the fluctuation strength was greater for negative yaw, as the rotor was swept by a deeper wake due to wake rotation effect. As the effective angle of attack is a crucial parameter in trailing-edge noise generation, the fluctuation in effective angle of attack can significantly influence the trailing-edge noise characteristics of downstream turbine.

4.3. Overall Sound Pressure Level and Amplitude Modulation of Trailing-Edge Noise

This section discusses the trailing-edge noise of the downstream turbine under the influence of a partial wake, computed using the BPM formulation based on unsteady aerodynamic results from the coupled Curl–UVLM model.
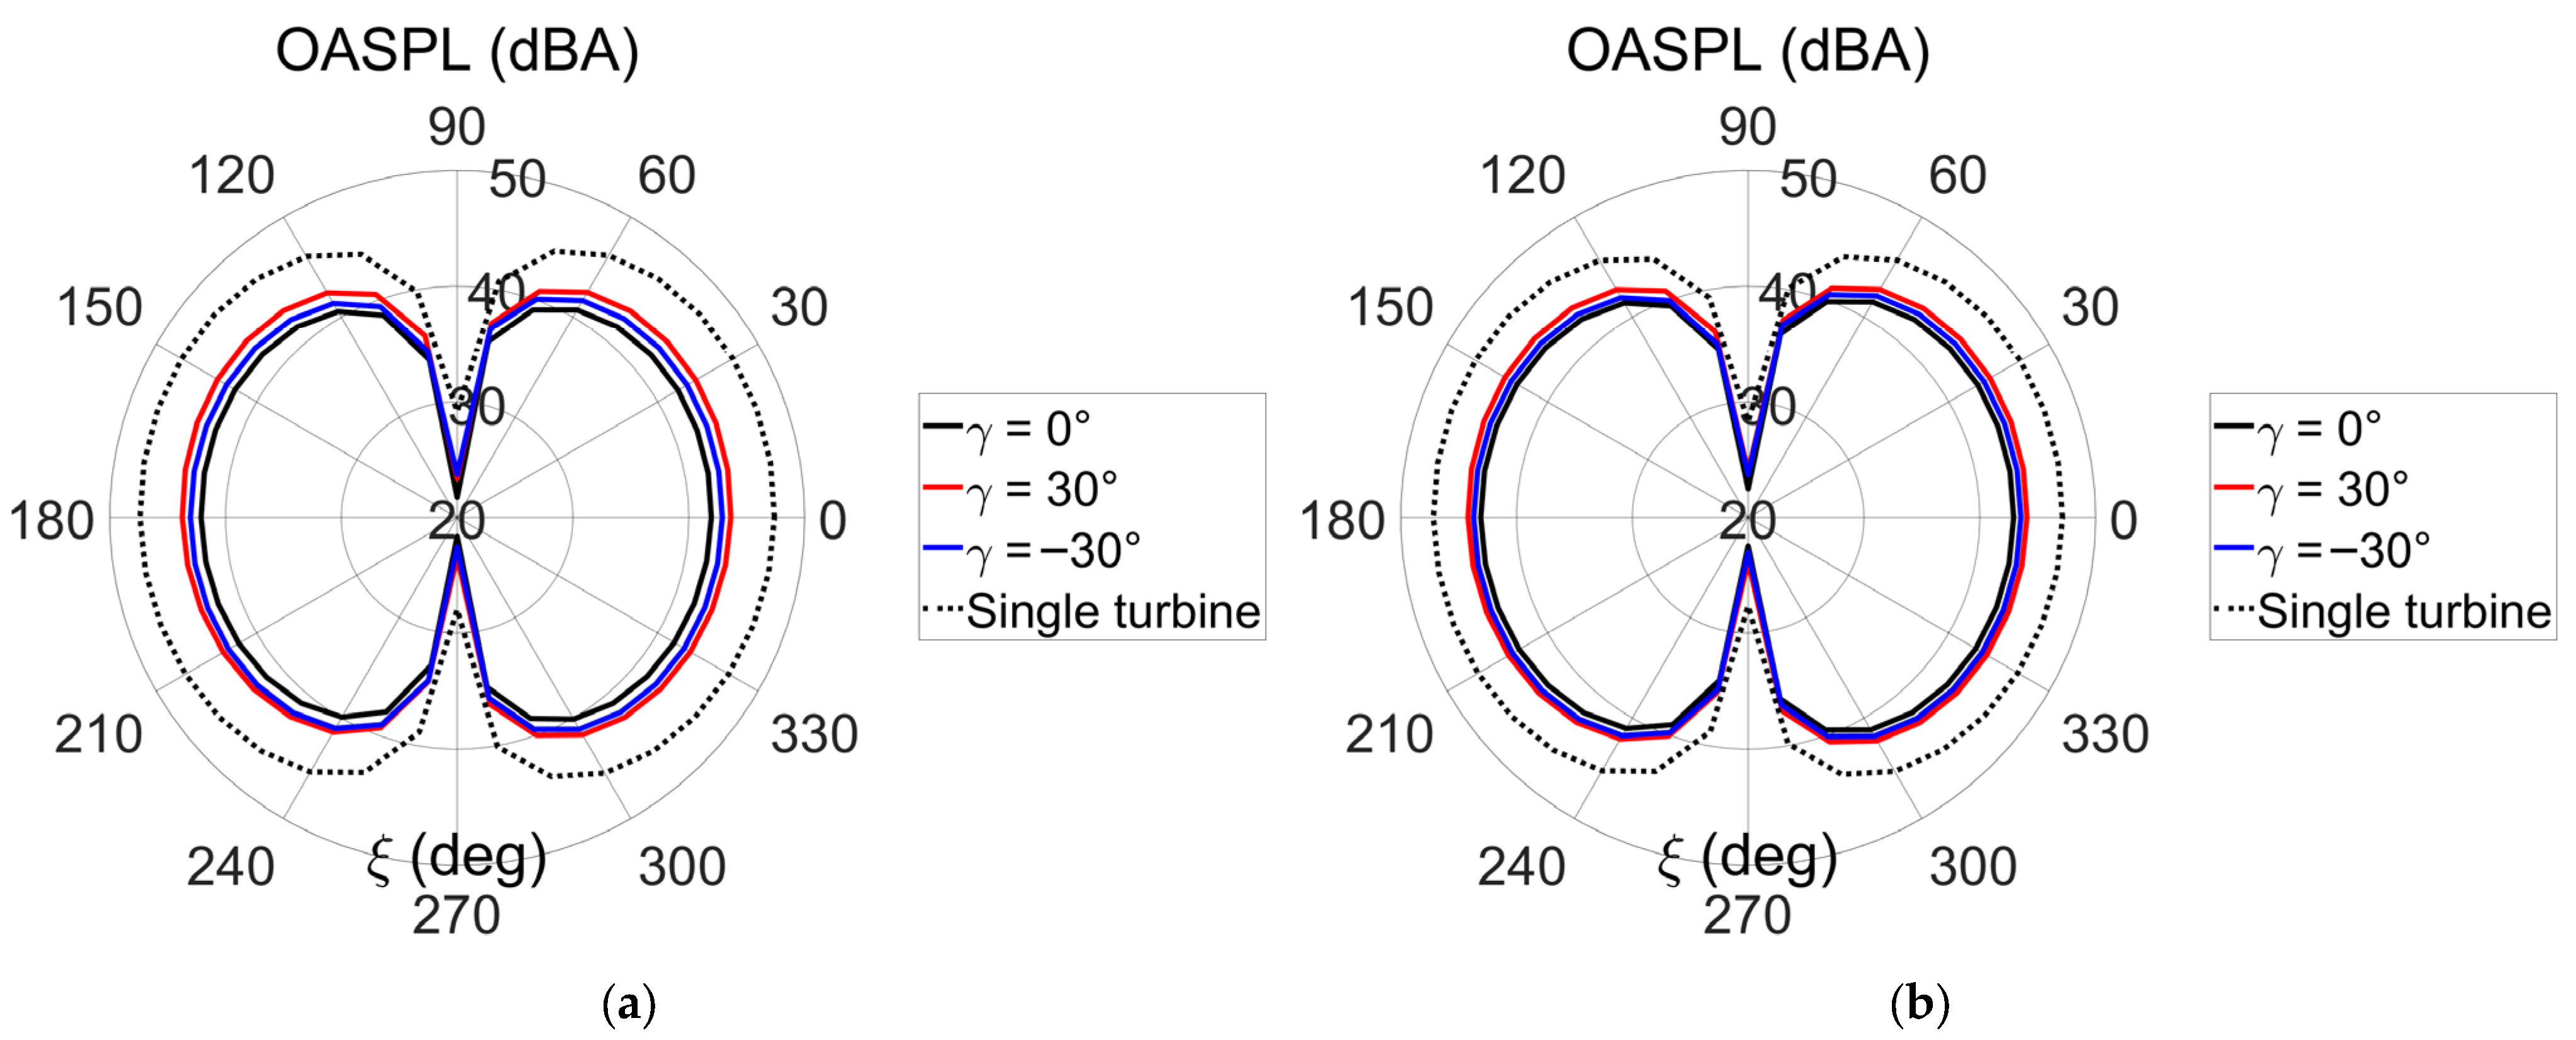
Initially, the OASPL, representing the time-averaged noise level at each observer location, was investigated. The OASPL was evaluated from the final 30 s of the simulation, after the wake had fully developed. At each time step, the BPM formulation was applied to compute the trailing-edge noise contributions from blade segments in one-third octave bands, which were combined at the observer position using the orthogonality of acoustic signals. The arithmetic mean of the resulting SPL values over the selected interval was then taken as the time-averaged OASPL. The OASPL directivity is depicted in Figure 15, with only the ±30° yaw cases included for clearer visualization. For baseline comparison of noise levels, the trailing-edge noise generated by the upstream turbine with zero yaw under freestream condition is also shown as black dotted lines. The observed pattern was consistent with the typical directivity of wind turbine trailing-edge noise, exhibiting lower sound levels in the crosswind direction and higher levels in the downwind direction. Regardless of the yaw angle, the downstream turbine emitted less trailing-edge noise than the upstream turbine, as the wake deficit led to smaller average inflow velocity and smaller average effective angle of attack and sectional wind speed, subsequently. For the downstream turbine, the OASPL increased with yaw misalignment, with a greater rise observed for positive yaw compared to negative yaw. This corresponds to the more rapid wake center displacement and greater wake deformation observed under positive yaw conditions. These results suggest that wake rotation affect the generation of trailing-edge noise as well. Also, the increase in OASPL by the partial wake was more prominent under SBL condition than NBL condition, which corresponds to the average power output results shown in Figure 12.
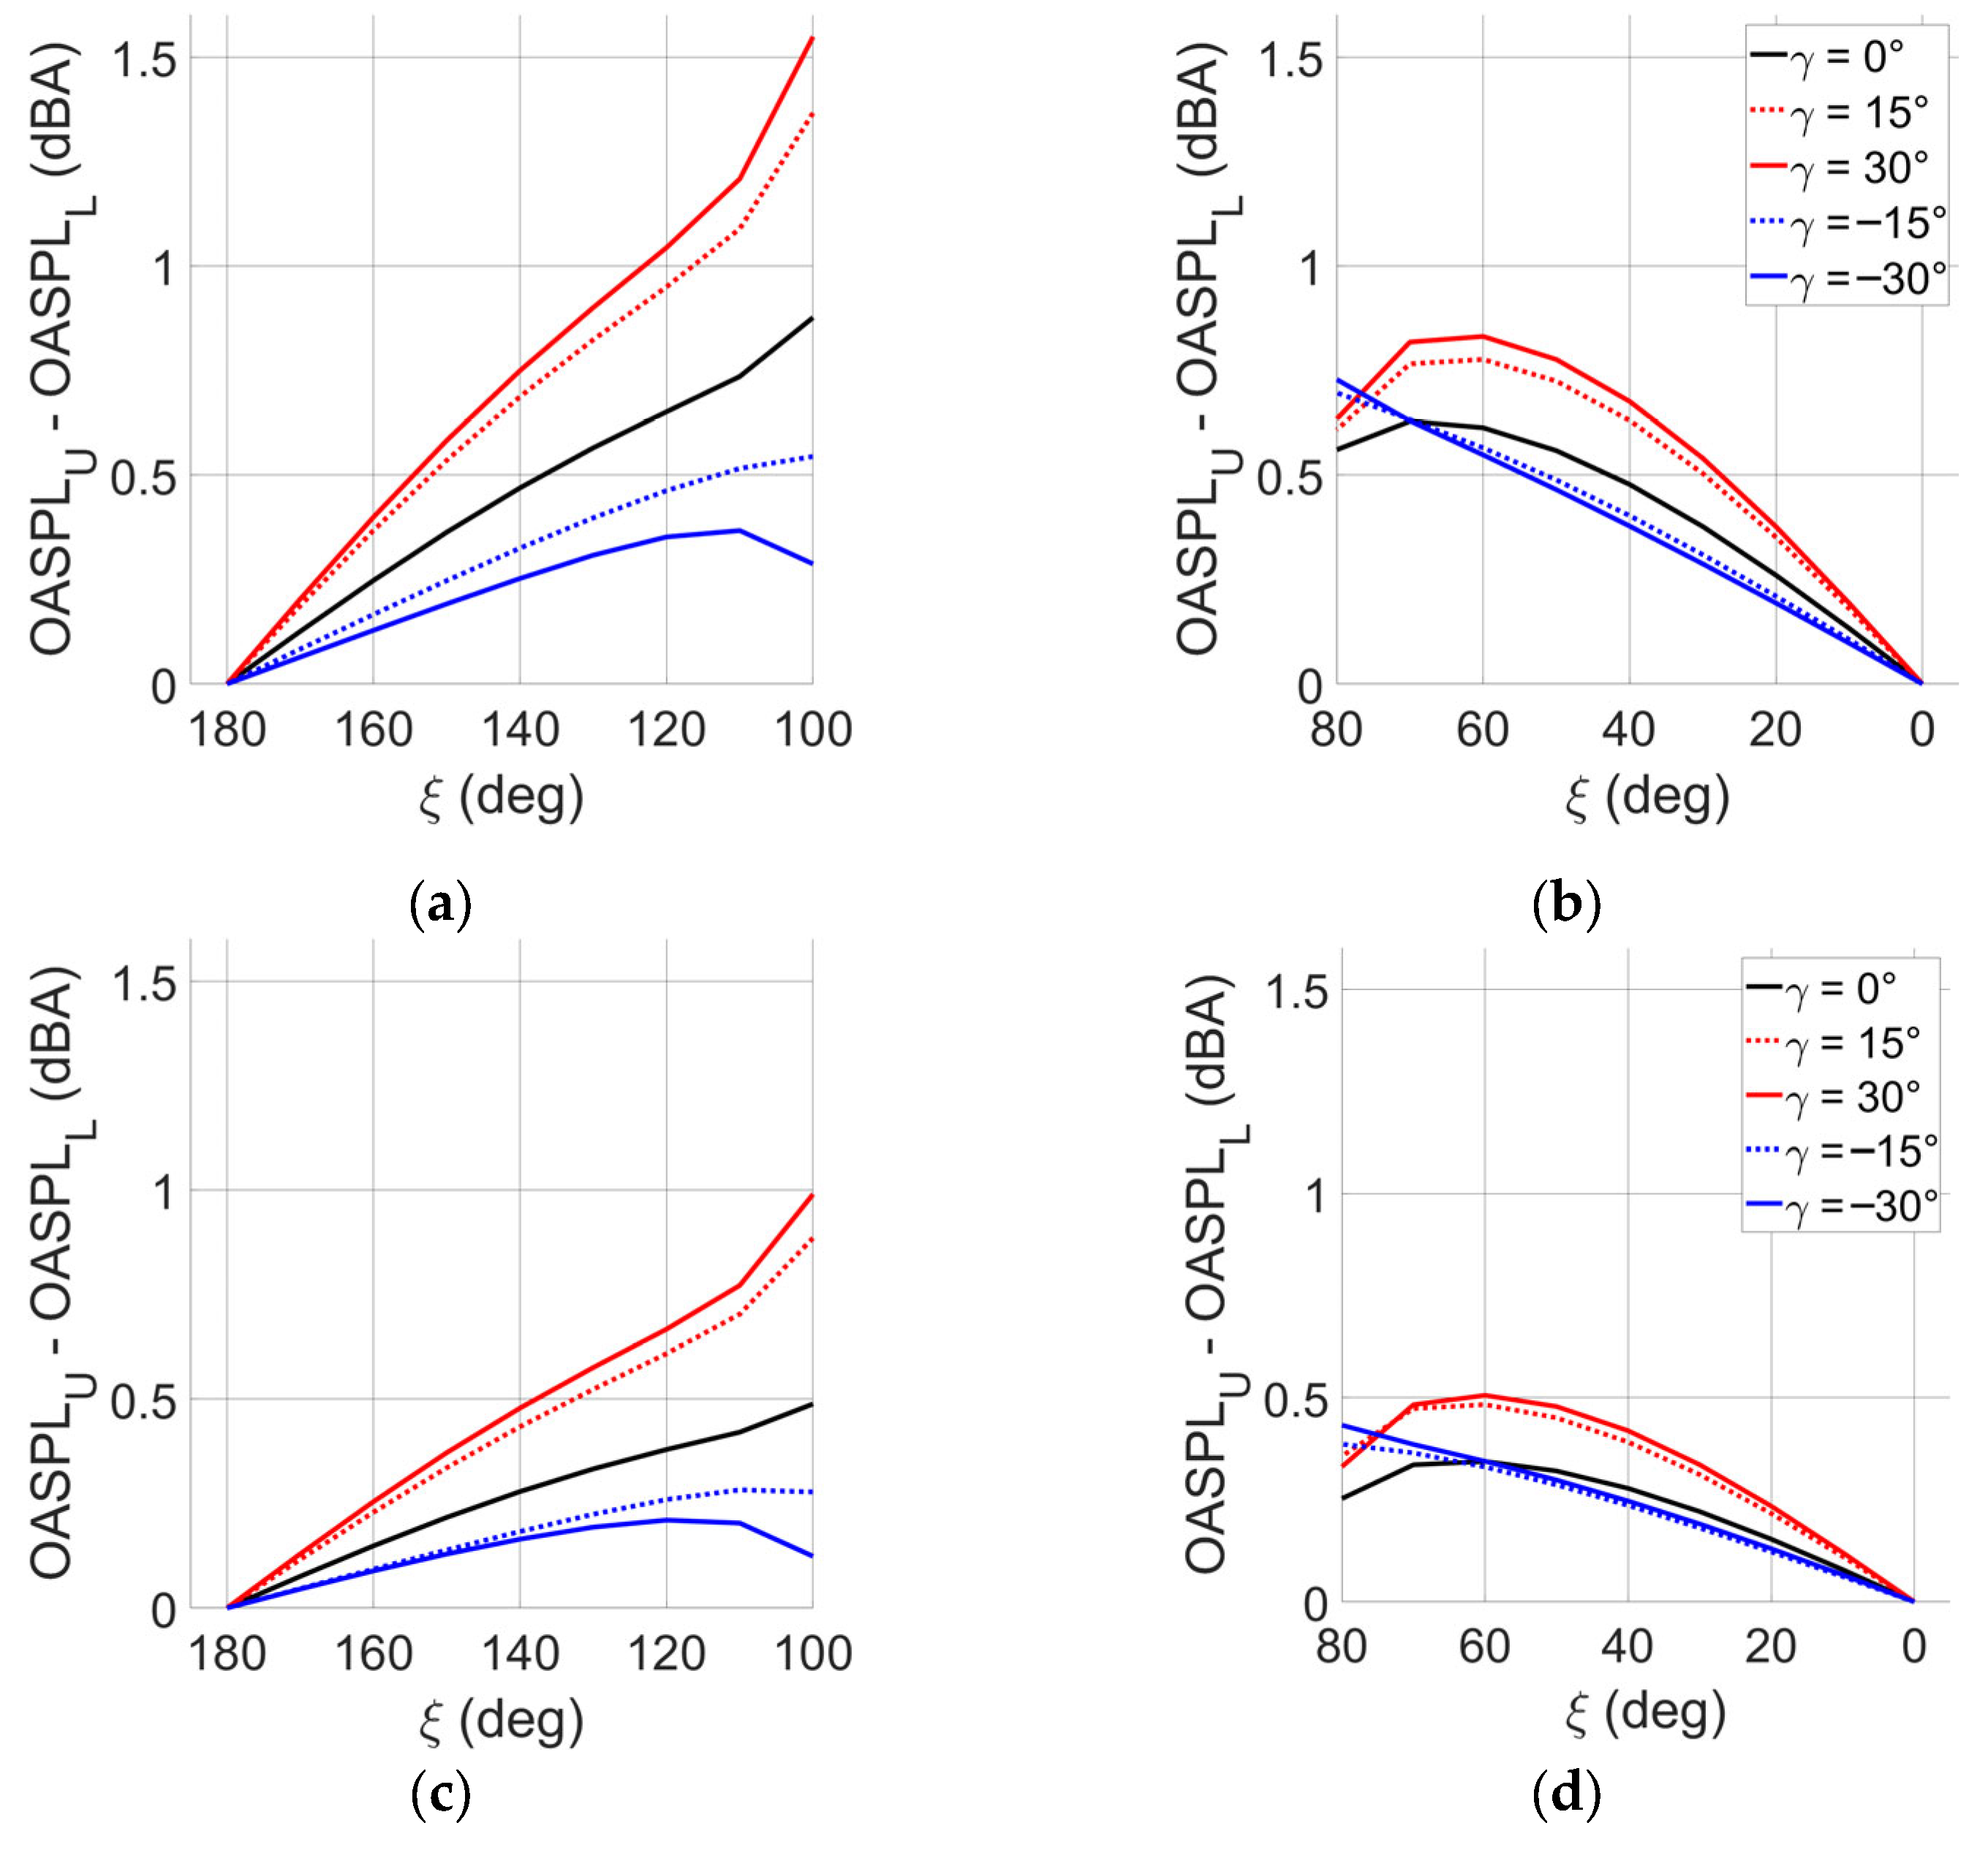
The partial wake caused by yaw control also intensifies the lateral asymmetry of the OASPL of the wind turbine under the partial wake. Figure 16 presents the difference in OASPL between receiver points located in the upper and lower semicircles of the noise directivity plot. For example, the value at ξ = 120 ° represents the OASPL at the observer point located at ξ = 120 ° minus the OASPL at the observer point located at ξ = 240 ° . The observer point at ξ = 90 ° is excluded because the trailing-edge noise emitted at this position is substantially lower than that at the other observer points. The results in Figure 16 indicate that, when viewed from upstream of the turbine, positive yaw increased the noise emission on the left side, whereas negative yaw increased it on the right side, especially for the upstream direction from the wind turbine ( 100 ° ξ 180 ° ) . This result corresponds to the fact that positive yaw deflects the wake to the right, whereas negative yaw deflects it to the left, which results in the asymmetric effective angle of attack distribution as depicted in Figure 13. Notice that the noise emission is already greater on the left side even with zero yaw. This is because, with the rotor blades rotating counterclockwise, the convective amplification effect at the upper semicircle is stronger than at the lower semicircle with respect to the observer point located at the ground level.
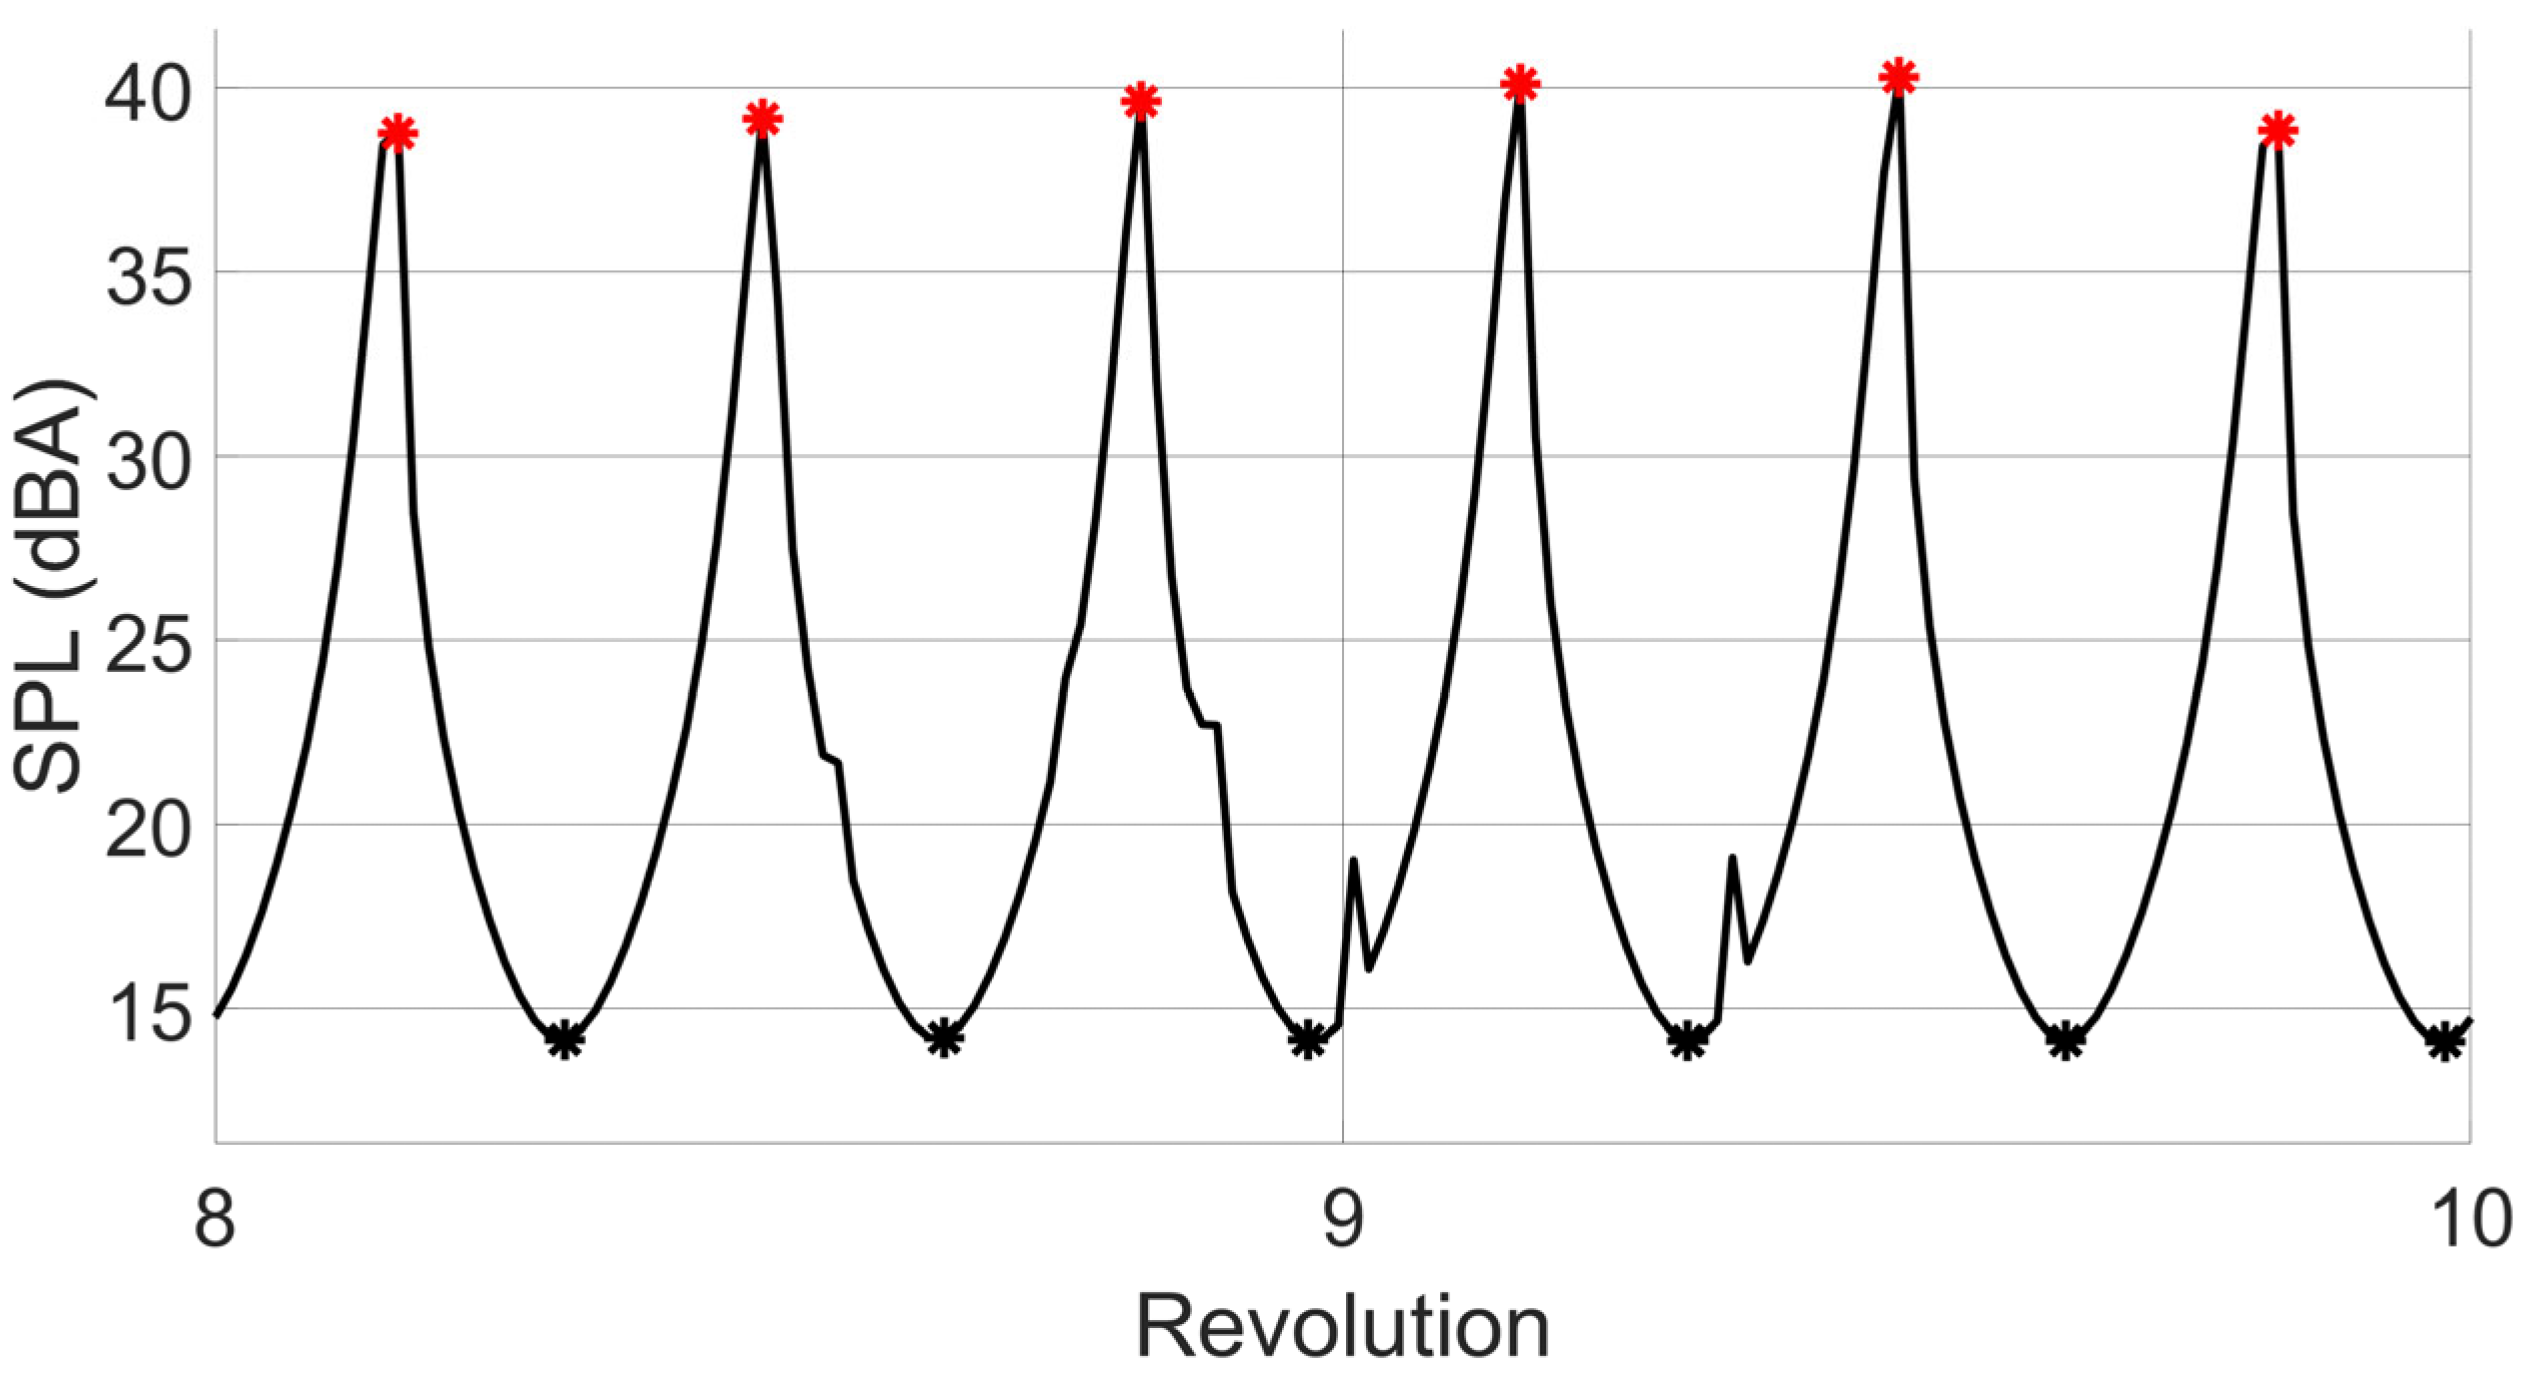
Next, the amplitude modulation of trailing-edge noise was examined. Figure 17 presents the temporal variation of trailing-edge noise SPL at the observer location of ξ = 90 ° with zero yaw under SBL condition. The red dots indicate local maxima, while black dots represent local minima. For a quantitative analysis, AM strength was defined as the difference between the local maximum and minimum SPL values and was obtained as follows. Firstly, all local maxima and minima of the SPL were identified over the final 30 s of the simulation. The arithmetic means of these local maxima and minima were then computed over three rotor revolutions. Finally, the difference between the averaged maximum and minimum values was taken as the AM strength. This definition and evaluation method of AM strength, based on the fluctuation of the total SPL predicted in the frequency domain, has also been employed in several AM studies, including that of Oerlemans [24,25]. In this approach, AM is assessed using SPL values obtained from semi-empirical models. However, since the BPM model provides SPL in 1/3 octave bands, the frequency information is less detailed compared with narrow-band data, which may reduce accuracy. Nevertheless, this method was adopted in the present study as it offers the simplest and most cost-effective way to evaluate AM without requiring additional procedures such as time reconstruction as the time-frequency domain coupled methodology used in [22].
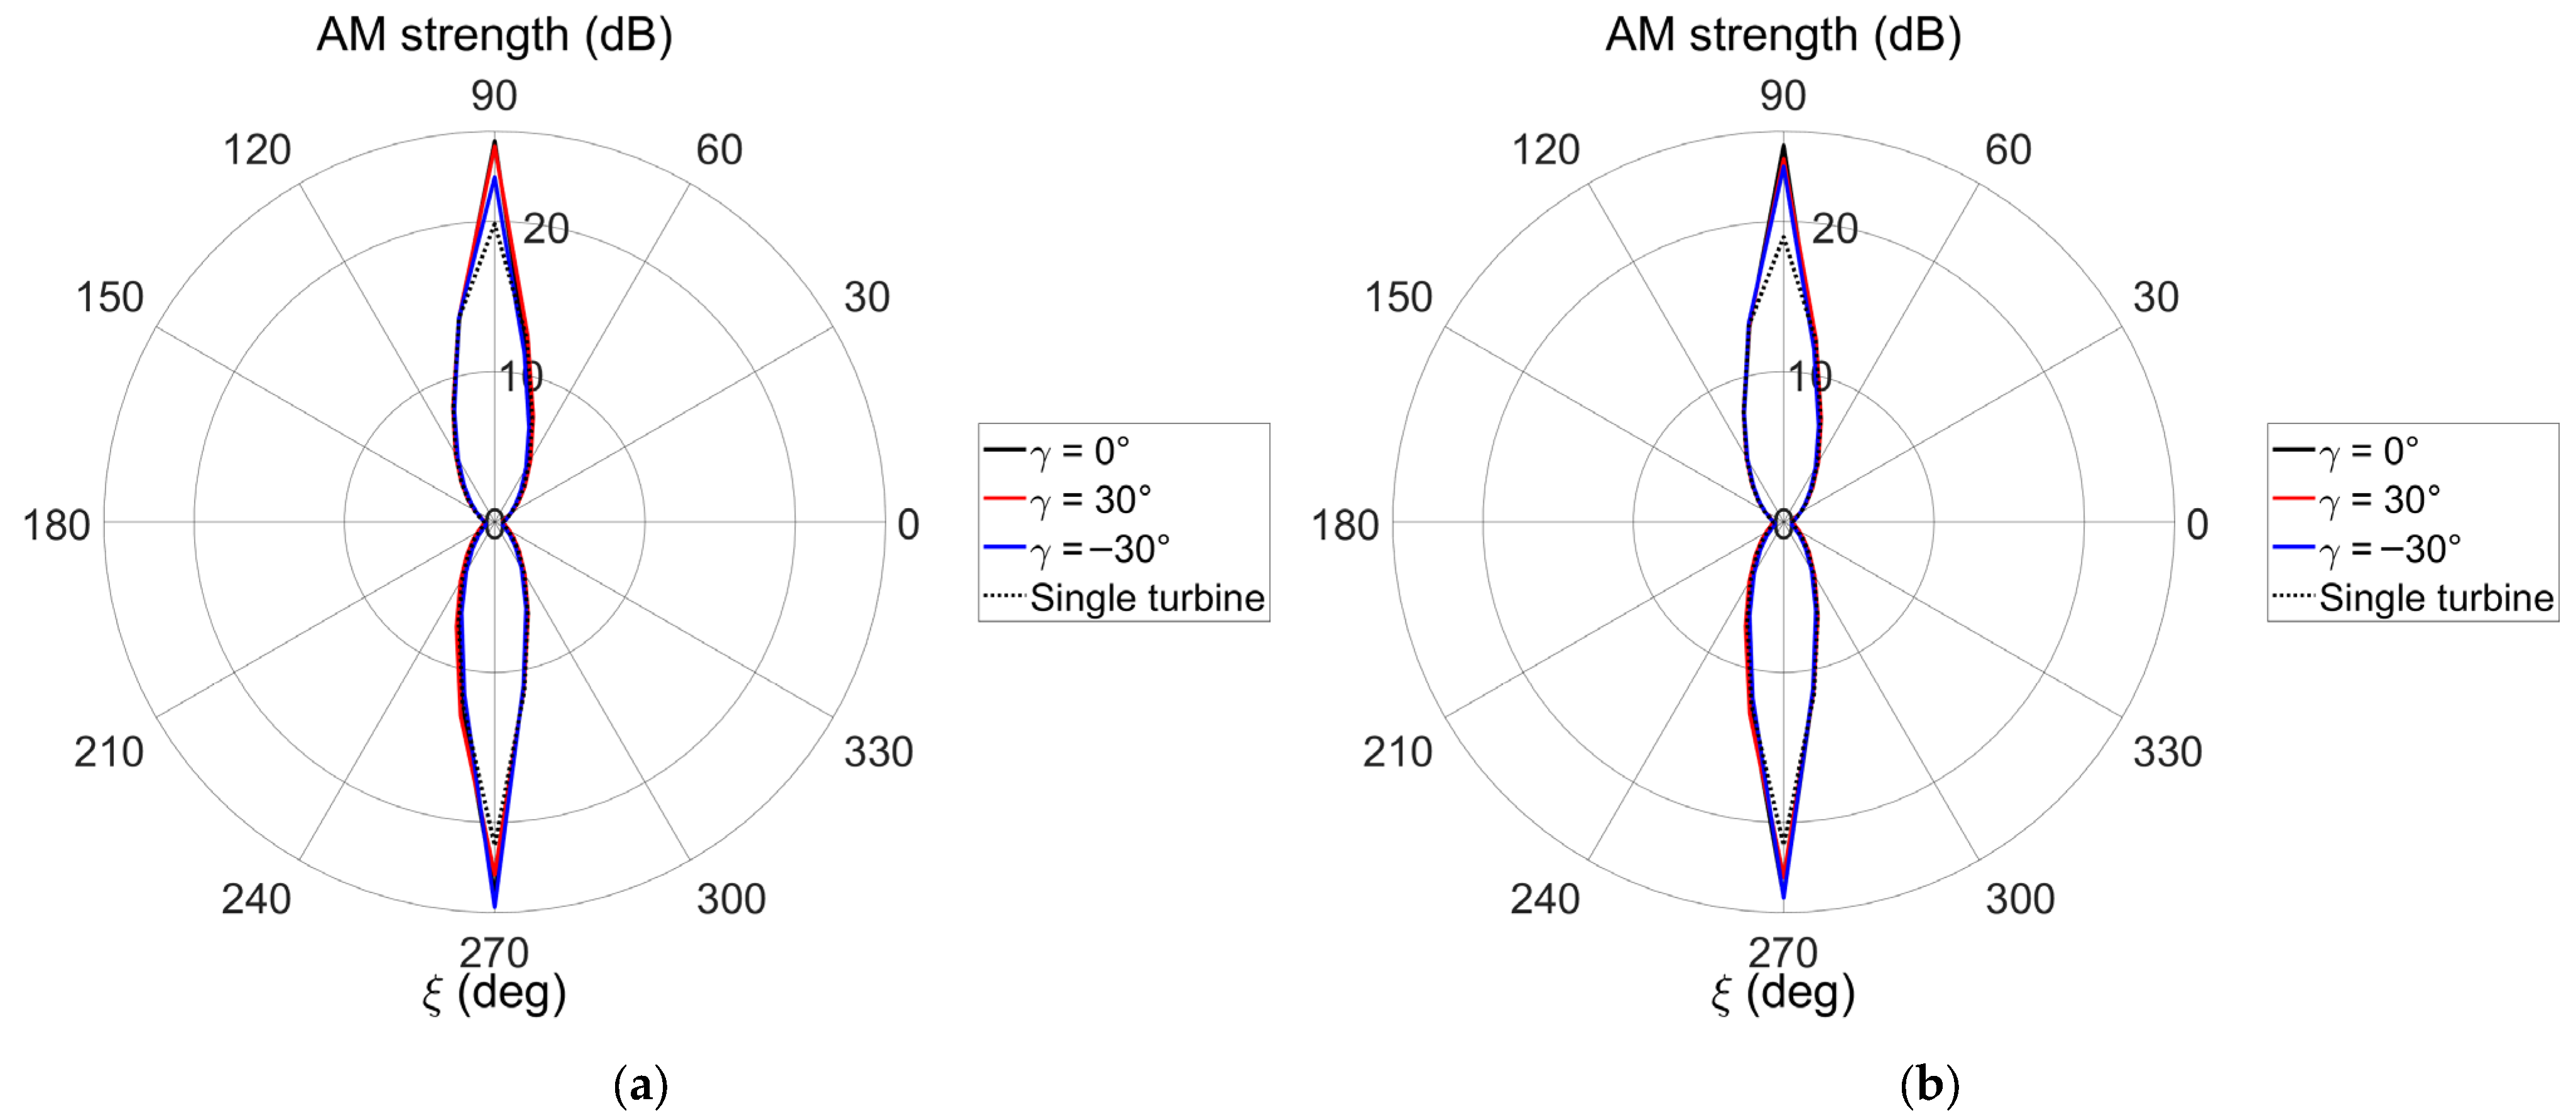
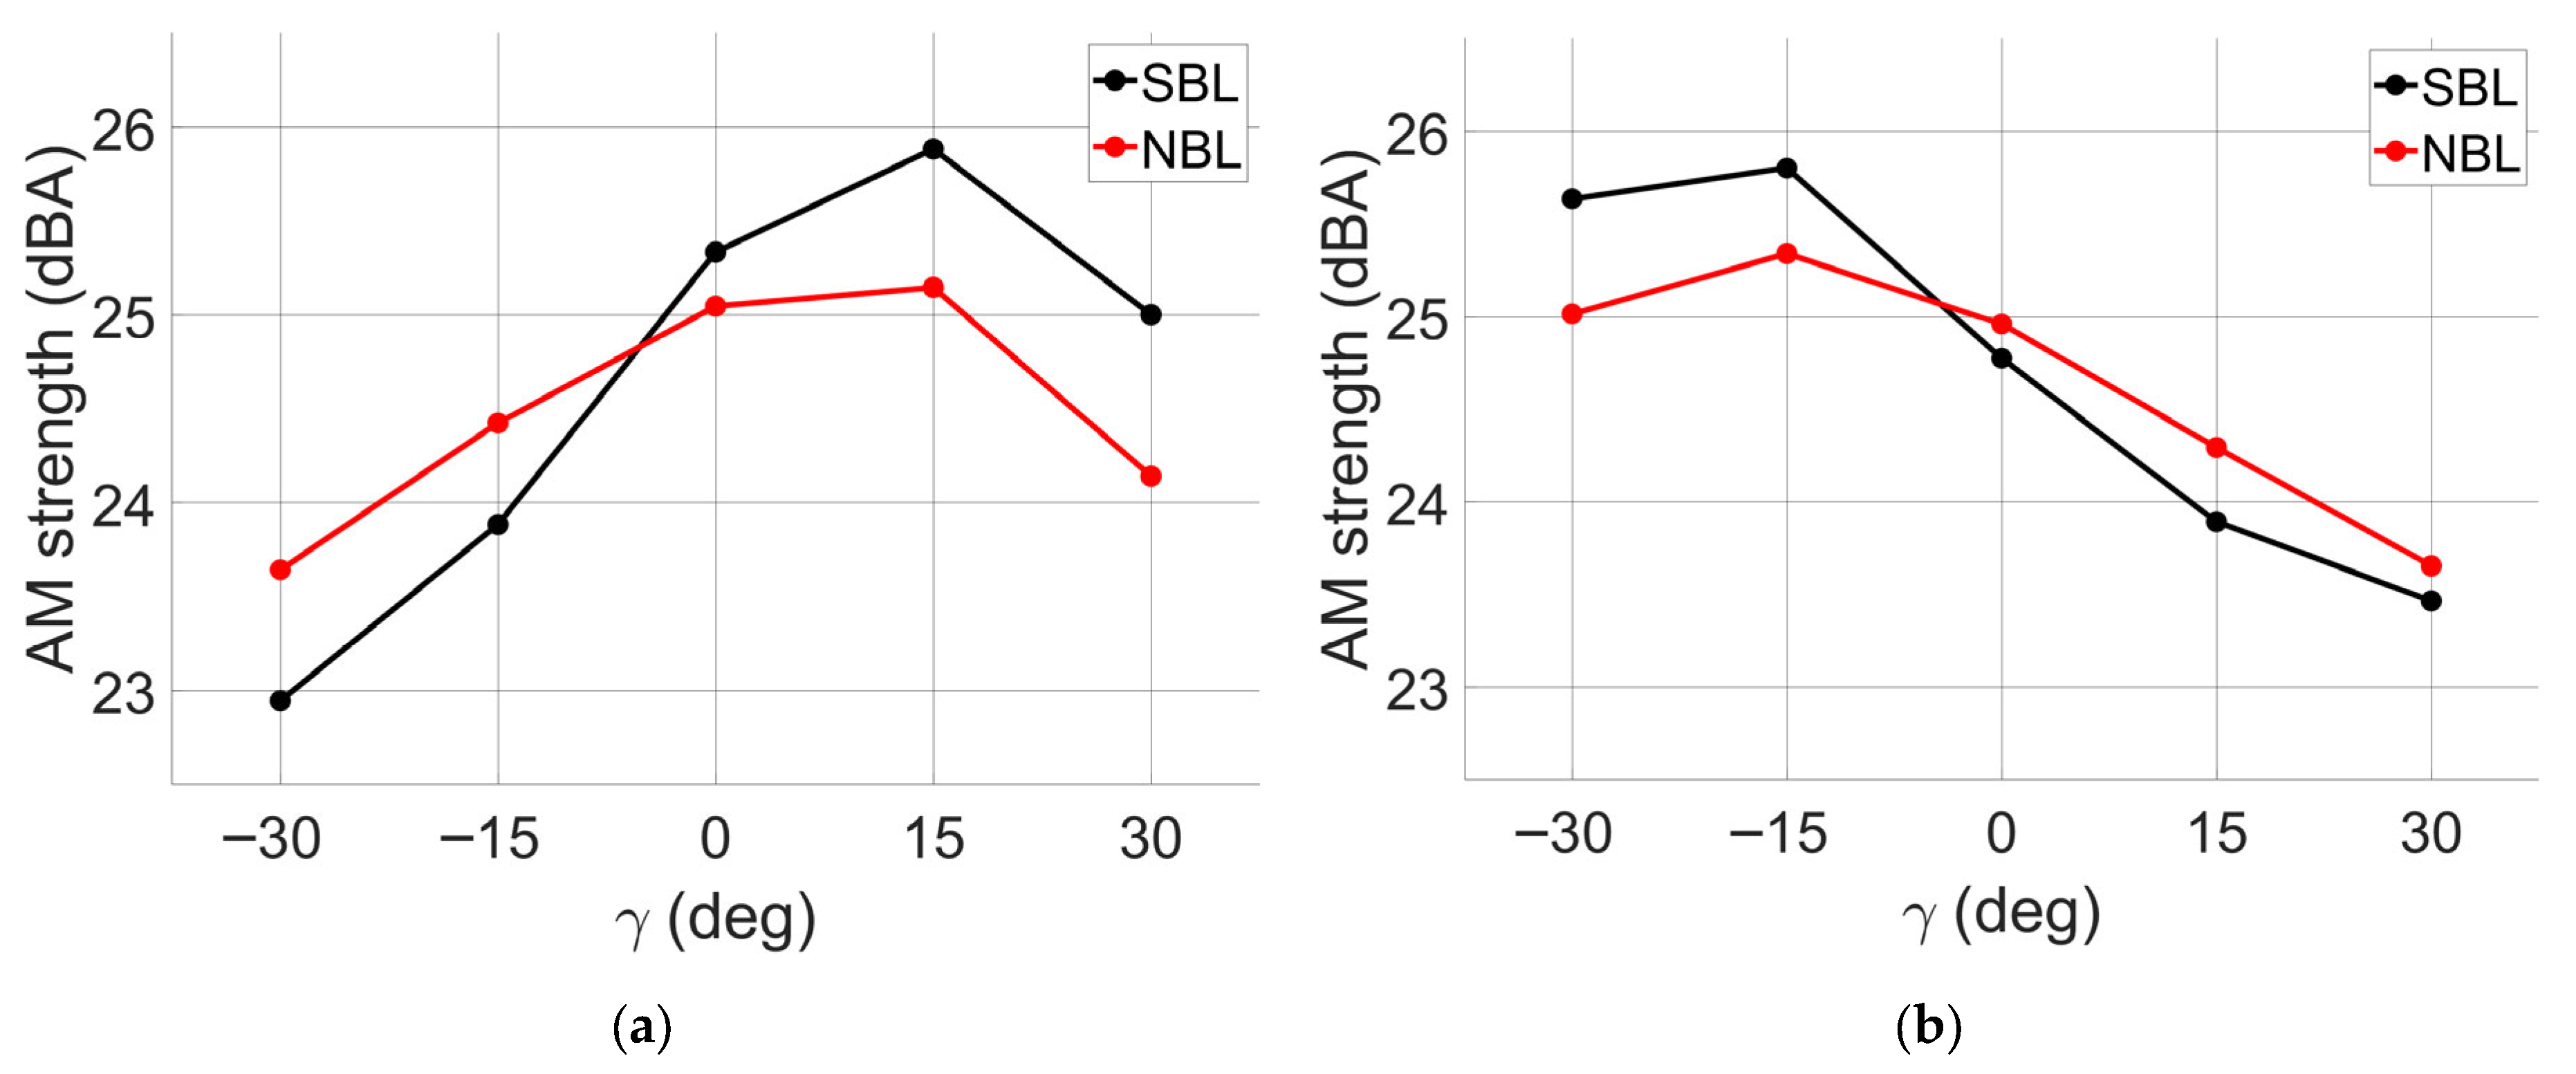
Figure 18 illustrates the AM directivity pattern based on the AM strength evaluated at each observer position, with only the ±30° yaw cases included for clearer visualization. The directivity pattern agreed with the well-known trend; that is, AM was negligible in the downwind direction but significantly stronger in the crosswind direction, opposite to the OASPL directivity pattern. For baseline comparison, the AM directivity pattern of the upstream turbine with zero yaw under the freestream condition is also shown as black dotted lines. The maximum AM strength for the upstream turbine was calculated to be approximately 20 dBA, which is about 5 dBA lower than that of the downstream turbine. Unlike the OASPL case, the AM strength directivity pattern did not allow for an intuitive, at-a-glance understanding of trends according to yaw angle. Therefore, only the AM strength in the crosswind direction was investigated separately. Figure 19 presents the AM strength at   ξ = 90 ° and ξ = 270 ° observer positions for different yaw angles. At the observer location ξ = 90 ° , AM strength generally increased from negative to positive yaw angles, except for γ = 30 ° . In contrast, at the observer location ξ = 270 ° , AM strength increased from positive to negative yaw angles, except for γ = 30 ° . This indicates that, within a certain range of yaw angles, the AM strength tends to increase as the wake deflects farther away from the observer location. This tendency was more pronounced under the SBL condition, where the wake remains stronger compared to NBL condition. However, when the wake deflection becomes excessively large in the direction opposite to the observer point, the AM strength either increases less or even decreases compared to the non-yawed case. That is, although the variation of AM strength with yaw angle for an observer located in the crosswind direction generally exhibits a linear trend, it becomes nonlinear when the yaw angle increases beyond a certain threshold, causing substantial wake deflection toward the side opposite to the observer location.
To further investigate this phenomenon, the trailing-edge noise emitted from each blade was examined at the time instants corresponding to the maximum and minimum SPL at the observer positions ξ = 90 ° and ξ = 270 ° . In Figure 20, the colored lines represent the trailing-edge noise emitted from each blade, while the black solid line indicates the total trailing-edge noise at the observer location. The black dotted lines are the minimum and maximum values of SPL when the yaw misalignment angle γ = 0 . At the beginning of each revolution, Blade 1 is located at the top position of the rotor. From these figures, the individual contribution of each blade at the instances of maximum and minimum SPL can be identified. At the instant of local maxima, the black dotted lines almost coincided with one of the colored lines, which indicate that the dominant contribution originated from the single blade closest to and approaching the observer point. In contrast, the instant corresponding to the local minimum of the total SPL was primarily determined by two of the colored lines, indicating that both the blade closest to the observer and the subsequent approaching blade contributed similarly to the overall trailing-edge noise. We refer to these blades “dominant blades” because they primarily dictate the timing of maximum and minimum trailing-edge noise emissions. Since AM strength was defined as the difference between the maximum and minimum SPL, it can be inferred that the inflow velocity encountered by the dominant blades—particularly in the outer regions near the blade tips—at the moments of maximum and minimum emissions directly influences the AM strength. If the increase in the maximum SPL exceeds that in the minimum SPL, the overall AM strength increases accordingly.
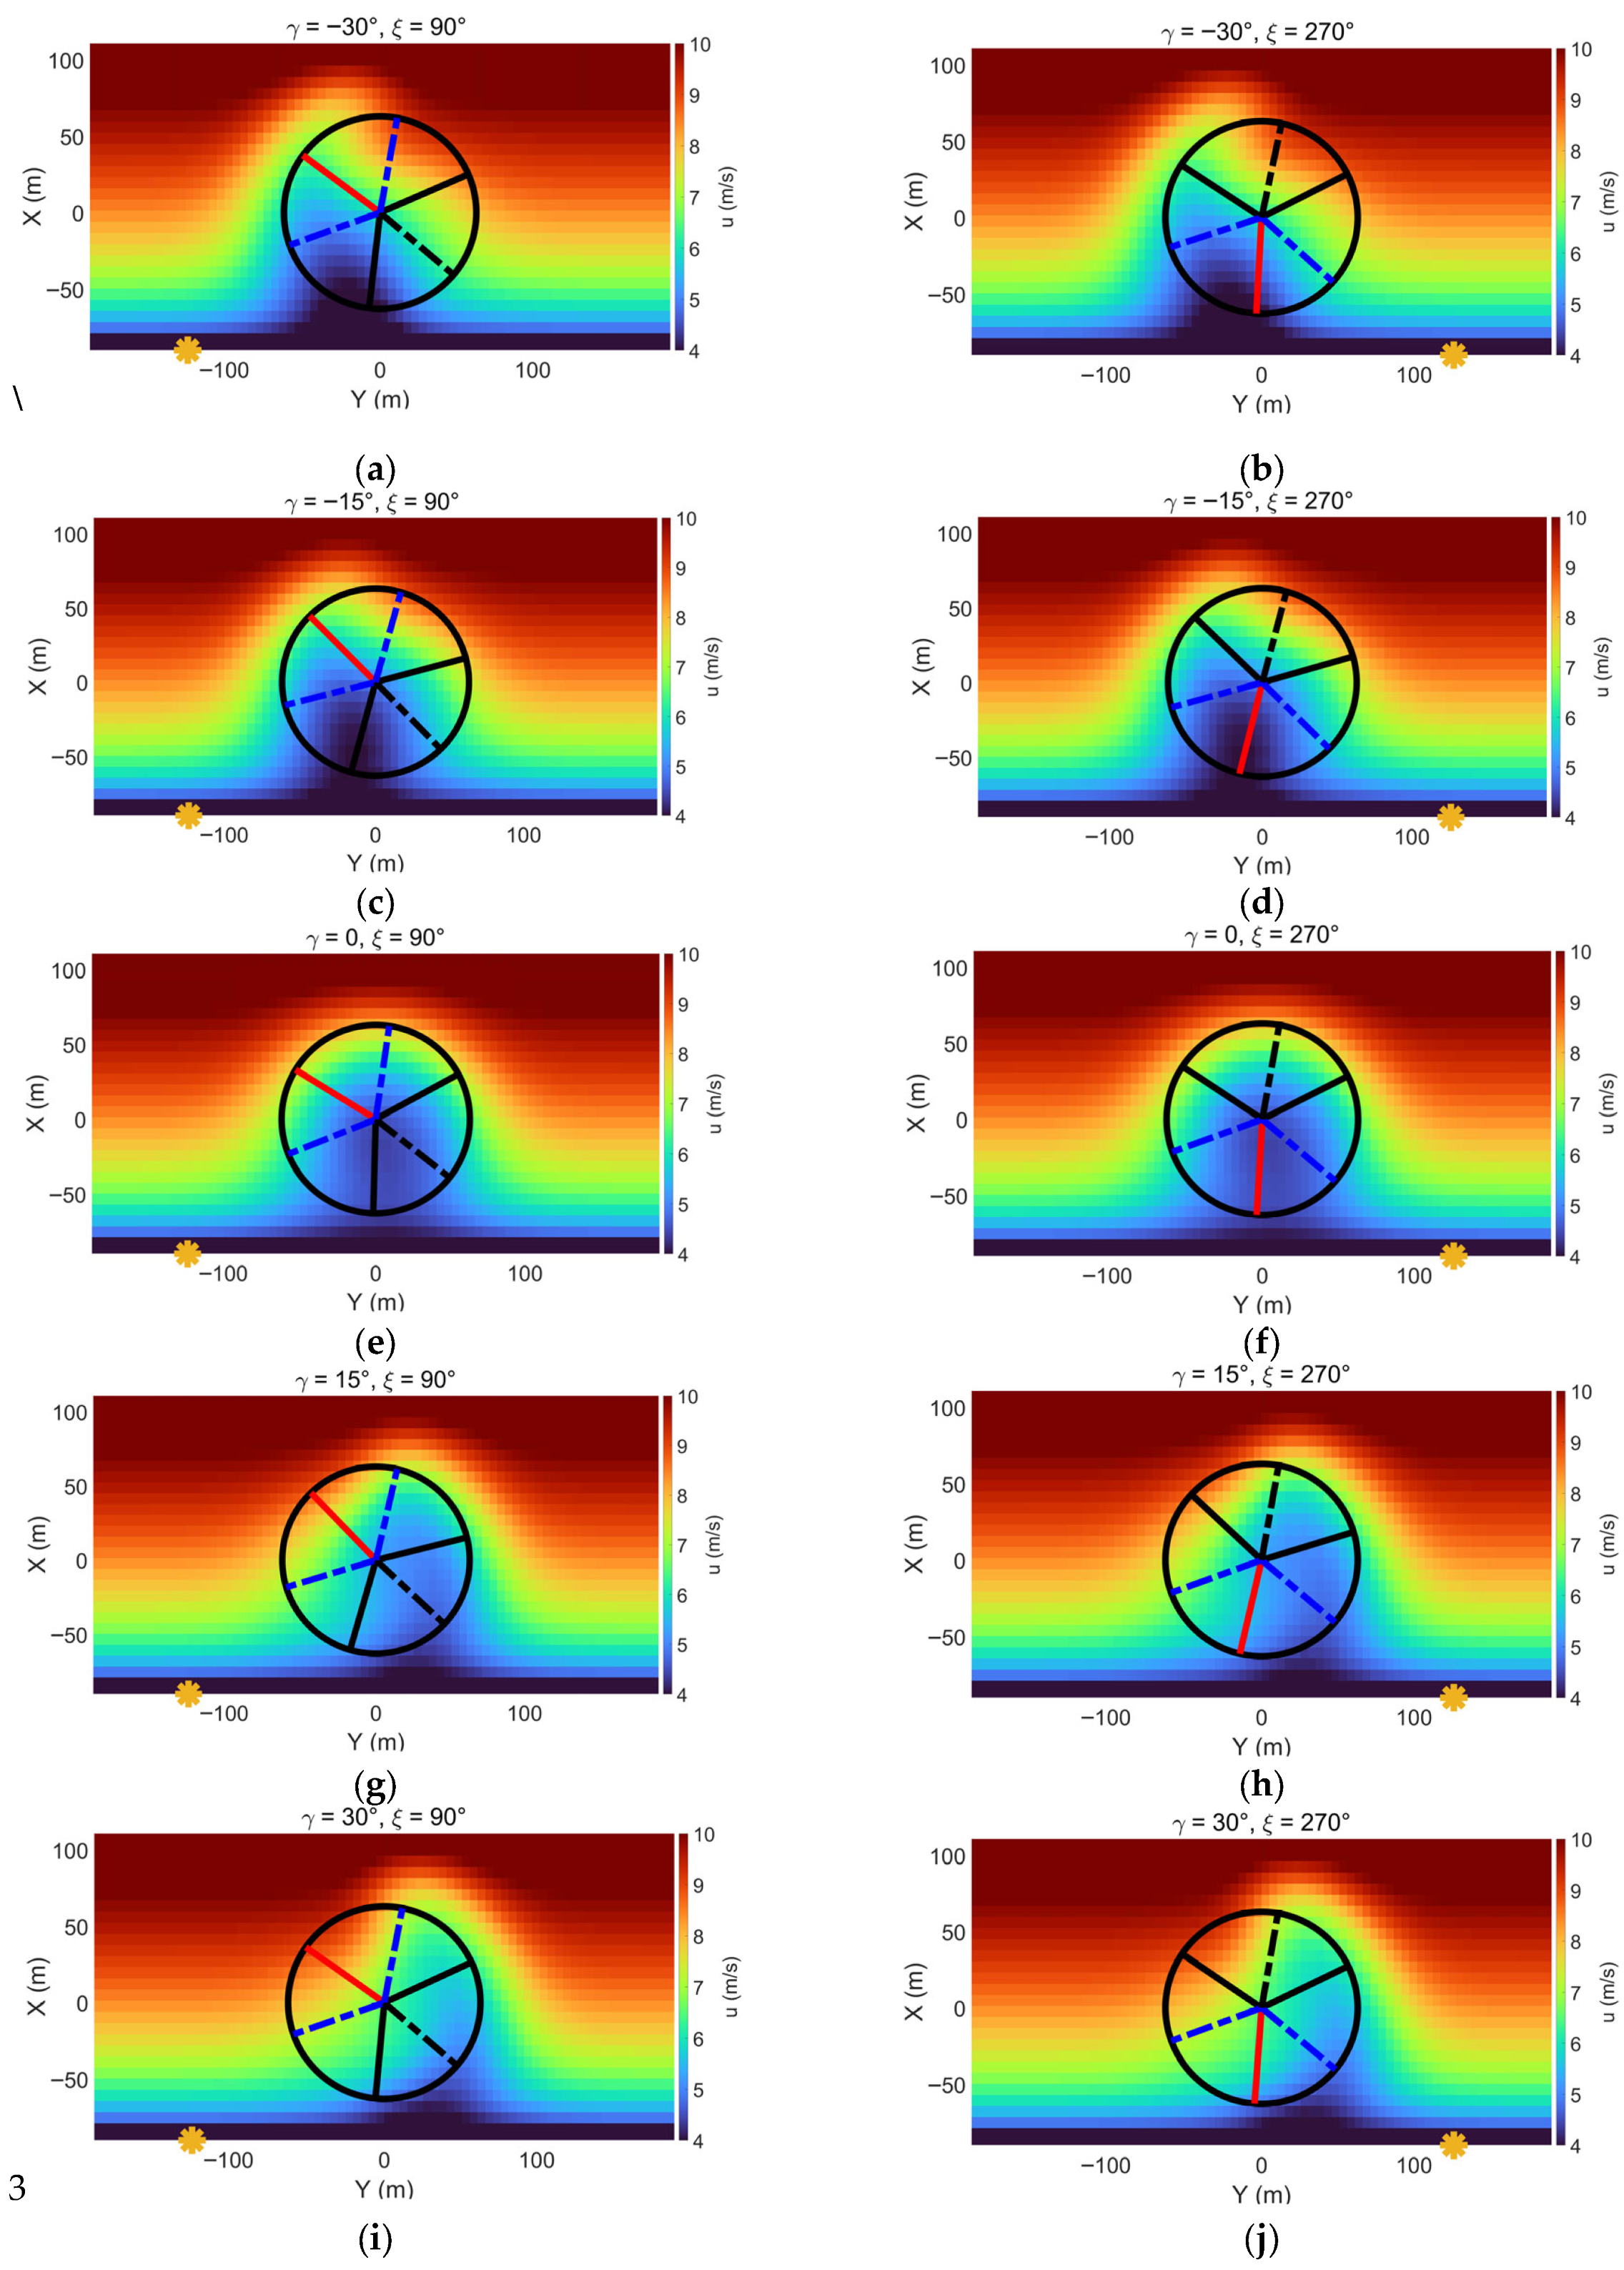
Figure 21 illustrates the positions of the rotor blades at the instants of maximum and minimum noise generation, overlaid with the asymmetric inflow velocity fields at the downstream turbine for observer positions at ξ = 90 ° and ξ = 270 ° , respectively. Solid lines represent the blade positions at the time of maximum noise, with the single dominant blade highlighted in red. Dashed lines indicate the blade positions at the time of minimum noise, with the two dominant blades highlighted in blue. The yellow asterisk marks the observer point. The results for the observer locations at ξ = 90 ° and ξ = 270 ° are presented in the left and right columns, respectively. In each column, the results for different yaw angles are presented from the topmost case of −30° to the bottommost case of +30°, with increments of 15°. It can be inferred from the figure that the time of maximum and minimum noise emission is determined by the combined effects of the inflow velocity distribution and convective amplification due to the blade rotation.
For the observer located at ξ = 90 ° , the maximum noise is largely influenced by the inflow from the upper-left region of the rotor, while the minimum noise is influenced by inflow from the upper-right and lower-left regions. As the value yaw angle increases from negative to positive, the wake center shifts from left to right, allowing higher-speed inflow to reach the upper-left region. This leads to a larger increase in maximum noise compared to the increase in minimum noise. Conversely, for the observer located at ξ = 270 ° , the maximum noise is primarily influenced by the lower region of the rotor, while the minimum noise is influenced by the lower-left and lower-right regions. As the value of yaw angle decreases from positive to negative, the dominant blade at the time of maximum noise passes closer to the wake center. Consequently, the maximum noise decreases more significantly than the minimum noise, resulting in an increase in AM strength.
However, as depicted in Figure 21b,i, when the wake deflection becomes too large in the direction opposite to the observer point ( γ = 30 °   for   ξ = 90 ° and γ = 30 °  for  ξ = 270 ° ), the portion of the wake sweeping across the rotor decreases. This results in a reduced difference between maximum and minimum noise, thereby lowering AM strength. This phenomenon is more prominent for positive yaw because the wake deflection and deformation are larger for the positive yaw than the negative yaw due to the wake rotation effect, resulting in a larger nonlinearity in AM strength variation for the observer point located at ξ = 90 ° than ξ = 270 ° as depicted in Figure 19.
In summary, the partial wake generated by yaw control significantly influenced the AM characteristics of the downstream turbine, with pronounced effects observed particularly at observer locations situated in the crosswind direction. The change in AM strength with yaw angle differed between observers positioned to the left and right sides of the turbine. From the perspective of each observer, AM strength exhibited a generally linear increase as the wake center moved farther away from the observer at moderate yaw angles. However, beyond a certain yaw angle threshold, a nonlinear behavior was observed. This nonlinear trend is attributed to increased wake deflection and distortion, which reduce the influence of the wake on the rotor—especially on the dominant blade. The nonlinear trend in AM strength variation implies that AM strength could decrease depending on the observer’s location even when fluctuations in the effective angle of attack increase due to asymmetric inflow distributions (Figure 14). This suggests that while increased asymmetry in the inflow distribution is an important factor enhancing AM strength, it is not the sole determinant. Rather, the AM characteristics of trailing-edge noise result from the complex interplay between inflow distribution and convective amplification induced by blade rotation.

5. Conclusions

This study investigated the impact of partial wake induced by upstream turbine yaw control on the trailing-edge noise characteristics of a downstream turbine under different atmospheric stability conditions by using the Curl-UVLM coupled model and a semi-empirical formulation. A two-turbine configuration was investigated with yaw control applied only to the upstream turbine, with the yaw angle varying from –30° to +30°. Two atmospheric stability conditions, SBL and NBL, were considered to examine the effect of yaw control under different stability conditions.
To accurately predict the wake behavior, the Curl model was tuned to LES results, applying different mixing length values depending on the atmospheric stability. Through the comparison of wake deficit and wake center shift at hub height, it was validated that the magnitude of wake deficit and the location of wake center generally agreed well with the LES results, at different atmospheric stability conditions and yaw misalignment angles. It was observed that, compared with the NBL condition, the wake recovery was slower under the SBL condition, resulting in a larger wake deficit and a stronger development of the CRVs.
For the two-turbine configuration, the average power results confirmed the effectiveness of wake steering regardless of atmospheric stability. The power gain was more pronounced under NBL than SBL, because slower wake recovery in SBL led to a larger wake deficit and a smaller shift of the wake center. For the upstream turbine, the power difference with respect to yaw direction was relatively small (within about 20 kW), whereas the downstream turbine showed a much larger asymmetry, with differences of up to 200 kW depending on yaw direction. This is attributed to the strong dependence of the downstream inflow distribution on the yaw-directional interaction between the CRVs generated in the upstream wake and the wake rotation. These results indicate that even without considering wind veer, asymmetry in downstream wake distribution and turbine power can arise solely from the interaction between wake rotation and CRV development.
The unsteady aerodynamic and noise analyses confirmed that partial yaw induces unsteady aerodynamic phenomena in the downstream turbine, such as fluctuations in the angle of attack, which in turn affect trailing-edge noise characteristics. To evaluate these effects, OASPL was used as a time-averaged noise metric, while AM strength was employed as an indicator of time-varying noise. Consistent with previous studies, OASPL was dominant in the streamwise direction, whereas AM strength was more pronounced in the crosswind direction. While the partial wake induced by yaw had little effect on the directivity of OASPL, it caused significant lateral asymmetry in AM directivity. Specifically, for crosswind observers located on both sides of the turbine, the AM difference between the two positions increased as the wake center was displaced away from the observer by yaw control. However, this trend held only within a certain range of yaw angles; when the yaw angle exceeded a threshold, resulting in a large displacement of the wake center, the AM asymmetry decreased because AM strength was reduced for both crosswind observers.
For a detailed analysis of this phenomenon, the trailing-edge noise emitted from each blade was examined at the time instants of the maximum and minimum noise emission. It was found that for a particular observer point, only some of the blades referred to as “dominant blades” primarily contributed to trailing-edge noise emission at the times of maximum and minimum noise, and therefore, the AM strength was significantly influenced by the inflow velocity encountered by the dominant blades at the timing of maximum and minimum noise emission. A large yaw angle exceeding a certain threshold causes large wake deflection and deformation, thereby reducing the difference between the inflow velocities experienced by the dominant blades at the instants of maximum and minimum noise emissions. This nonlinear trend in AM strength variation depending on yaw angle implies that, although greater inflow asymmetry increases the variability of the effective angle of attack, it does not necessarily lead to an increase in AM. Rather, the AM characteristics of trailing-edge noise is determined by the complex interplay between inflow distribution and convective amplification induced by blade rotation.
This study makes three main contributions. First, it provides the first quantitative evaluation of noise characteristics, particularly AM, under wake steering conditions. Second, it extends the Curl–UVLM coupled model with a semi-empirical noise module, offering a medium-cost framework that can capture the effects of non-uniform inflow more effectively than conventional engineering tools. Third, the results demonstrate that partial wakes substantially influence noise characteristics, particularly increasing the lateral asymmetry of AM characteristics. In summary, this study represents an initial step toward understanding the impact of partial wakes generated by yaw control on noise characteristics. The proposed medium-cost methodology is expected to contribute to future research on wake steering acoustics, particularly in the context of wind farm yaw optimization that accounts for noise considerations.
This study focused on noise emission, with particular attention to trailing-edge noise. For future work, the scope will be extended to account for the asymmetric turbulence distributions generated by partial wakes, which may affect turbulent inflow noise characteristics, as well as the effects of sound propagation. Such an extension will provide a more comprehensive understanding of the acoustic implications of wake steering.

Author Contributions

Conceptualization, H.K. and S.L.; Data curation, H.K., T.Y. and K.Y.; Formal analysis, H.K. and T.Y.; Investigation, H.K., T.Y. and K.Y.; Methodology, H.K. and S.L.; Project administration, S.L.; Resources, H.K. and S.L.; Software, H.K.; Supervision, S.L.; Validation, H.K. and T.Y.; Visualization, T.Y.; Writing—original draft, H.K. All authors have read and agreed to the published version of the manuscript.

Funding

This research received no external funding.

Data Availability Statement

The original contributions presented in this study are included in the article. Further inquiries can be directed to the corresponding author(s).

Conflicts of Interest

The authors declare no conflicts of interest.

Abbreviations

The following abbreviations are used in this manuscript:
AMAmplitude modulation
AOAEFFEffective angle of attack
CRVCounter-rotating vortex
DRotor diameter
D ¯ h High frequency directivity function
D ¯ l Low frequency directivity function
I + Added turbulence
K 1 ,   K 2 ,   Δ K 1 Amplitude functions
L Length of span
LESLarge eddy simulation
M Freestream Mach number
M c Mach number of the flow past the trailing edge
NBLNeutral atmospheric boundary layer
OASPLOverall sound pressure level
OASPLUOverall sound pressure level at the upper semicircle in noise directivity plot
OASPLLOverall sound pressure level at the lower semicircle in noise directivity plot
r Radial position
r e Retarded observer distance
R Rotor radius
R o b s Distance between wind turbine and observing point
SBLStable atmospheric boundary layer
SPLSound pressure level
S t Strouhal number
T I Ambient turbulent intensity
u Streamwise perturbation velocity
u d e f Wake deficit
u h Hub height wind velocity
u , 1 h u b Upstream turbine hub height freestream velocity
U Streamwise velocity components base flow
v Spanwise perturbation velocity
V Spanwise velocity components base flow
w Vertical perturbation velocity
W Vertical velocity components base flow
WTWind turbine
α d Dissipation scaling parameter
α s h Shear coefficient
α * 0 Threshold angle of attack
γ Yaw misalignment angle
γ 0 Peak of the amplitude function
Γ Vortex strength
δ * Boundary layer displacement thickness
Θ e Chordwise angle
κ Kármán constant
λ Mixing length
ν e f f Effective viscosity
ξ Observer position angle
σ Initial vortex core radius
Φ e Spanwise angle
Ψ Rotor azimuthal angle
ω Angular velocity
Subscript
p Pressure side component
s Suction side component
α Angle of attack component

References

  1. Annoni, J.; Gebraad, P.M.O.; Scholbrock, A.K.; Fleming, P.A.; Wingerden, J.-W. van. Analysis of Axial-Induction-Based Wind Plant Control Using an Engineering and a High-Order Wind Plant Model. Wind Energy 2015, 19, 1135–1150. [Google Scholar] [CrossRef]
  2. Howland, M.F.; Lele, S.K.; Dabiri, J.O. Wind Farm Power Optimization through Wake Steering. Proc. Natl. Acad. Sci. USA 2019, 116, 14495–14500. [Google Scholar] [CrossRef]
  3. Fleming, P.; Annoni, J.; Shah, J.J.; Wang, L.; Ananthan, S.; Zhang, Z.; Hutchings, K.; Wang, P.; Chen, W.; Chen, L. Field Test of Wake Steering at an Offshore Wind Farm. Wind Energy Sci. 2017, 2, 229–239. [Google Scholar] [CrossRef]
  4. Fleming, P.; King, J.; Dykes, K.; Simley, E.; Roadman, J.; Scholbrock, A.; Murphy, P.; Lundquist, J.K.; Moriarty, P.; Fleming, K.; et al. Initial Results from a Field Campaign of Wake Steering Applied at a Commercial Wind Farm—Part 1. Wind Energy Sci. 2019, 4, 273–285. [Google Scholar] [CrossRef]
  5. Fleming, P.; King, J.; Simley, E.; Roadman, J.; Scholbrock, A.; Murphy, P.; Lundquist, J.K.; Moriarty, P.; Fleming, K.; van Dam, J.; et al. Continued Results from a Field Campaign of Wake Steering Applied at a Commercial Wind Farm—Part 2. Wind Energy Sci. 2020, 5, 945–958. [Google Scholar] [CrossRef]
  6. Wei, D.; Wang, N.; Wan, D.; Strijhak, S. Parametric Study of the Effectiveness of Active Yaw Control Based on Large Eddy Simulation. Ocean Eng. 2023, 271, 113751. [Google Scholar] [CrossRef]
  7. Abkar, M.; Porté-Agel, F. Influence of the Coriolis Force on the Structure and Evolution of Wind Turbine Wakes. Phys. Rev. Fluids 2016, 1, 063701. [Google Scholar] [CrossRef]
  8. Shibuya, K.; Uchida, T. Wake Asymmetry of Yaw State Wind Turbines Induced by Interference with Wind Towers. Energy 2023, 280, 128091. [Google Scholar] [CrossRef]
  9. Fleming, P.; Annoni, J.; Churchfield, M.; Martinez-Tossas, L.A.; Gruchalla, K.; Lawson, M.; Moriarty, P. A Simulation Study Demonstrating the Importance of Large-Scale Trailing Vortices in Wake Steering. Wind Energy Sci. 2018, 3, 243–255. [Google Scholar] [CrossRef]
  10. Thedin, R.; Barter, G.; Jonkman, J.; Mudafort, R.; Bay, C.J.; Shaler, K.; Kreeft, J. Load Assessment of a Wind Farm Considering Negative and Positive Yaw Misalignment for Wake Steering. Wind Energy Sci. 2025, 10, 1033–1053. [Google Scholar] [CrossRef]
  11. Wei, D.; Wang, N.; Wan, D.; Strijhak, S. Numerical Study on the Asymmetry in Wake Steering of Wind Turbine Under Yawed Conditions. In Proceedings of the 32nd International Ocean and Polar Engineering Conference, Shanghai, China, 5–10 June 2022. [Google Scholar]
  12. Han, W.; Kim, H.; Son, E.; Lee, S. Assessment of Yaw-Control Effects on Wind Turbine-Wake Interaction: A Coupled Unsteady Vortex Lattice Method and Curled Wake Model Analysis. J. Wind Eng. Ind. Aerodyn. 2023, 242, 105559. [Google Scholar] [CrossRef]
  13. Oerlemans, S.; Fisher, M.; Maeder, T.; Kögler, K. Reduction of Wind Turbine Noise Using Optimized Airfoils and Trailing-Edge Serrations. AIAA J. 2009, 47, 1470–1481. [Google Scholar] [CrossRef]
  14. Lee, S.; Kim, K.; Choi, W.; Lee, S. Annoyance Caused by Amplitude Modulation of Wind Turbine Noise. Noise Control Eng. J. 2011, 59, 38. [Google Scholar] [CrossRef]
  15. Hansen, K.L.; Nguyen, P.; Micic, G.; Lechat, B.; Catcheside, P.; Zajamšek, B. Amplitude Modulated Wind Farm Noise Relationship with Annoyance: A Year-Long Field Study. J. Acoust. Soc. Am. J. Acoust. Soc. Am. 2021, 150, 1198–1208. [Google Scholar] [CrossRef]
  16. Nguyen, P.D.; Hansen, K.L.; Catcheside, P.; Hansen, C.H.; Zajamsek, B. Long-Term Quantification and Characterisation of Wind Farm Noise Amplitude Modulation. Measurement 2021, 182, 109678. [Google Scholar] [CrossRef]
  17. Blumendeller, E.; Gaßner, L.; Müller, F.J.Y.; Pohl, J.; Hübner, G.; Ritter, J.; Cheng, P.W. Quantification of Amplitude Modulation of Wind Turbine Emissions from Acoustic and Ground Motion Recordings. Acta Acust. 2023, 7, 55. [Google Scholar] [CrossRef]
  18. Bernardi, C.; Porcacchia, F.; Testa, C.; Palma, P.D.; Leonardi, S.; Cherubini, S. NREL-5MW Wind Turbine Noise Prediction by FWH-LES. Int. J. Turbomach. Propuls. Power 2023, 8, 54. [Google Scholar] [CrossRef]
  19. Nguyen, P.; Hansen, K.; Lechat, B.; Catcheside, P.; Zajamsek, B.; Hansen, C.H. Benchmark Characterisation and Automated Detection of Wind Farm Noise Amplitude Modulation. Appl. Acoust. 2021, 183, 108286. [Google Scholar] [CrossRef]
  20. Mascarenhas, D.; Cotté, B.; Doaré, O. Synthesis of Wind Turbine Trailing Edge Noise in Free Field. JASA Express Lett. 2022, 2, 033601. [Google Scholar] [CrossRef]
  21. Mackowski, L.; Carolus, T.H. Wind Turbine Trailing Edge Noise: Mitigation of Normal Amplitude Modulation by Individual Blade Pitch Control. J. Sound Vib. 2021, 510, 116279. [Google Scholar] [CrossRef]
  22. Barlas, E.; Zhu, W.J.; Shen, W.Z.; Dag, K.O.; Moriarty, P. Consistent Modelling of Wind Turbine Noise Propagation from Source to Receiver. J. Acoust. Soc. Am. 2017, 142, 3297–3310. [Google Scholar] [CrossRef]
  23. Lee, S.; Ayton, L.; Bertagnolio, F.; Moreau, S.; Chong, T.P.; Joseph, P. Turbulent Boundary Layer Trailing-Edge Noise: Theory, Computation, Experiment, and Application. Prog. Aerosp. Sci. 2021, 126, 100737. [Google Scholar] [CrossRef]
  24. Oerlemans, S. Effect of Wind Shear on Amplitude Modulation of Wind Turbine Noise. Int. J. Aeroacoustics 2015, 14, 715–728. [Google Scholar] [CrossRef]
  25. Tian, Y.; Cotté, B.; Chaigne, A. Wind Turbine Noise Modeling: Prediction of Amplitude Modulation and Influence of Atmospheric Conditions. In Proceedings of the Forum Acusticum, Kraków, Poland, 7–14 September 2014. [Google Scholar]
  26. Gebraad, P.M.O.; van Wingerden, J.W. A Control-Oriented Dynamic Model for Wakes in Wind Plants. J. Phys. Conf. Ser. 2014, 524, 012186. [Google Scholar] [CrossRef]
  27. Bastankhah, M.; Porté-Agel, F. A New Analytical Model for Wind-Turbine Wakes. Renew. Energy 2014, 70, 116–123. [Google Scholar] [CrossRef]
  28. King, J.; Fleming, P.; King, R.; Martínez-Tossas, L.A.; Bay, C.J.; Mudafort, R.; Simley, E. Control-Oriented Model for Secondary Effects of Wake Steering. Wind Energy Sci. 2021, 6, 701–714. [Google Scholar] [CrossRef]
  29. Martínez-Tossas, L.A.; Annoni, J.; Fleming, P.A.; Churchfield, M.J. The Aerodynamics of the Curled Wake: A Simplified Model in View of Flow Control. Wind Energy Sci. 2019, 4, 127–138. [Google Scholar] [CrossRef]
  30. Bay, C.J.; King, J.; Martìnez-Tossas, L.A.; Mudafort, R.; Hulsman, P.; Kühn, M.; Fleming, P. Toward Flow Control: An Assessment of the Curled Wake Model in the FLORIS Framework. J. Phys. Conf. Ser. 2020, 1618, 022033. [Google Scholar] [CrossRef]
  31. Blackadar, A. The Vertical Distribution of Wind and Turbulent Exchange in a Neutral Atmosphere. J. Geophys. Res. 1962, 67, 3095–3102. [Google Scholar] [CrossRef]
  32. Sun, J. Vertical Variations of Mixing Lengths under Neutral and Stable Conditions during CASES-99. J. Appl. Meteorol. Climatol. 2011, 50, 2030–2041. [Google Scholar] [CrossRef]
  33. Chamorro, L.P.; Porté-Agel, F. Effects of Thermal Stability and Incoming Boundary-Layer Flow Characteristics on Wind-Turbine Wakes: A Wind-Tunnel Study. Bound. Layer Meteorol. 2010, 136, 515–533. [Google Scholar] [CrossRef]
  34. Bartl, J.; Mühle, F.; Schottler, J.; Sætran, L.; Peinke, J.; Adaramola, M.; Hölling, M. Wind Tunnel Experiments on Wind Turbine Wakes in Yaw: Effects of Inflow Turbulence and Shear. Wind Energy Sci. 2018, 3, 329–343. [Google Scholar] [CrossRef]
  35. Huang, J.; Bou-Zeid, E. Turbulence and Vertical Fluxes in the Stable Atmospheric Boundary Layer. Part I: A Large-Eddy Simulation Study. J. Atmos. Sci. 2013, 70, 1513–1527. [Google Scholar] [CrossRef]
  36. Katz, J.; Plotkin, A. Low-Speed Aerodynamics; Cambridge University Press: Cambridge, UK, 2010. [Google Scholar]
  37. Kim, H.; Lee, S.; Lee, S. Numerical Analysis on the Aerodynamics of HAWTs Using Nonlinear Vortex Strength Correction. Curr. Appl. Phys. 2010, 10, S311–S315. [Google Scholar] [CrossRef]
  38. Brooks, T.F.; Pope, D.S.; Marcolini, M.A. Airfoil Self-Noise and Prediction; NASA-RP-1218; NASA Langley Research Center: Hampton, VA, USA, 1989.
  39. Bortolotti, P.; Branlard, E.; Platt, A.; Moriarty, P.; Sucameli, C.; Bottasso, C.L. Aeroacoustics Noise Model of OpenFAST; NREL/TP-5000-75731; National Renewable Energy Laboratory (NREL): Golden, CO, USA, 2020.
  40. Jacobson, R.; Meadors, M.; Jacobson, E.; Link, H. Power Performance Test Report for the AOC 15/50 Wind Turbine, Test B; National Renewable Energy Laboratory (NREL): Golden, CO, USA, 2003. [Google Scholar]
  41. Moriarty, P.; Migliore, P. Semi-Empirical Aeroacoustic Noise Prediction Code for Wind Turbines; NREL/TP-500-34478; National Renewable Energy Laboratory (NREL): Golden, CO, USA, 2003. [CrossRef]
  42. Dal Monte, A.; De Betta, S.; Raciti Castelli, M.; Benini, E. Proposal for a Coupled Aerodynamic–Structural Wind Turbine Blade Optimization. Compos. Struct. 2017, 159, 144–156. [Google Scholar] [CrossRef]
  43. IEC 61400-11; Wind Turbines—Part 11: Acoustic Noise Measurement Techniques. International Electrotechnical Commission (IEC): Geneva, Switzerland, 2012.
  44. Vollmer, L.; Steinfeld, G.; Heinemann, D.; Kühn, M. Estimating the Wake Deflection Downstream of a Wind Turbine in Different Atmospheric Stabilities: An LES Study. Wind Energy Sci. 2016, 1, 129–141. [Google Scholar] [CrossRef]
  45. Jonkman, J.; Butterfield, S.; Musial, W.; Scott, G. Definition of a 5-MW Reference Wind Turbine for Offshore System Development; NREL/TP-500-38060; National Renewable Energy Laboratory (NREL): Golden, CO, USA, 2009.
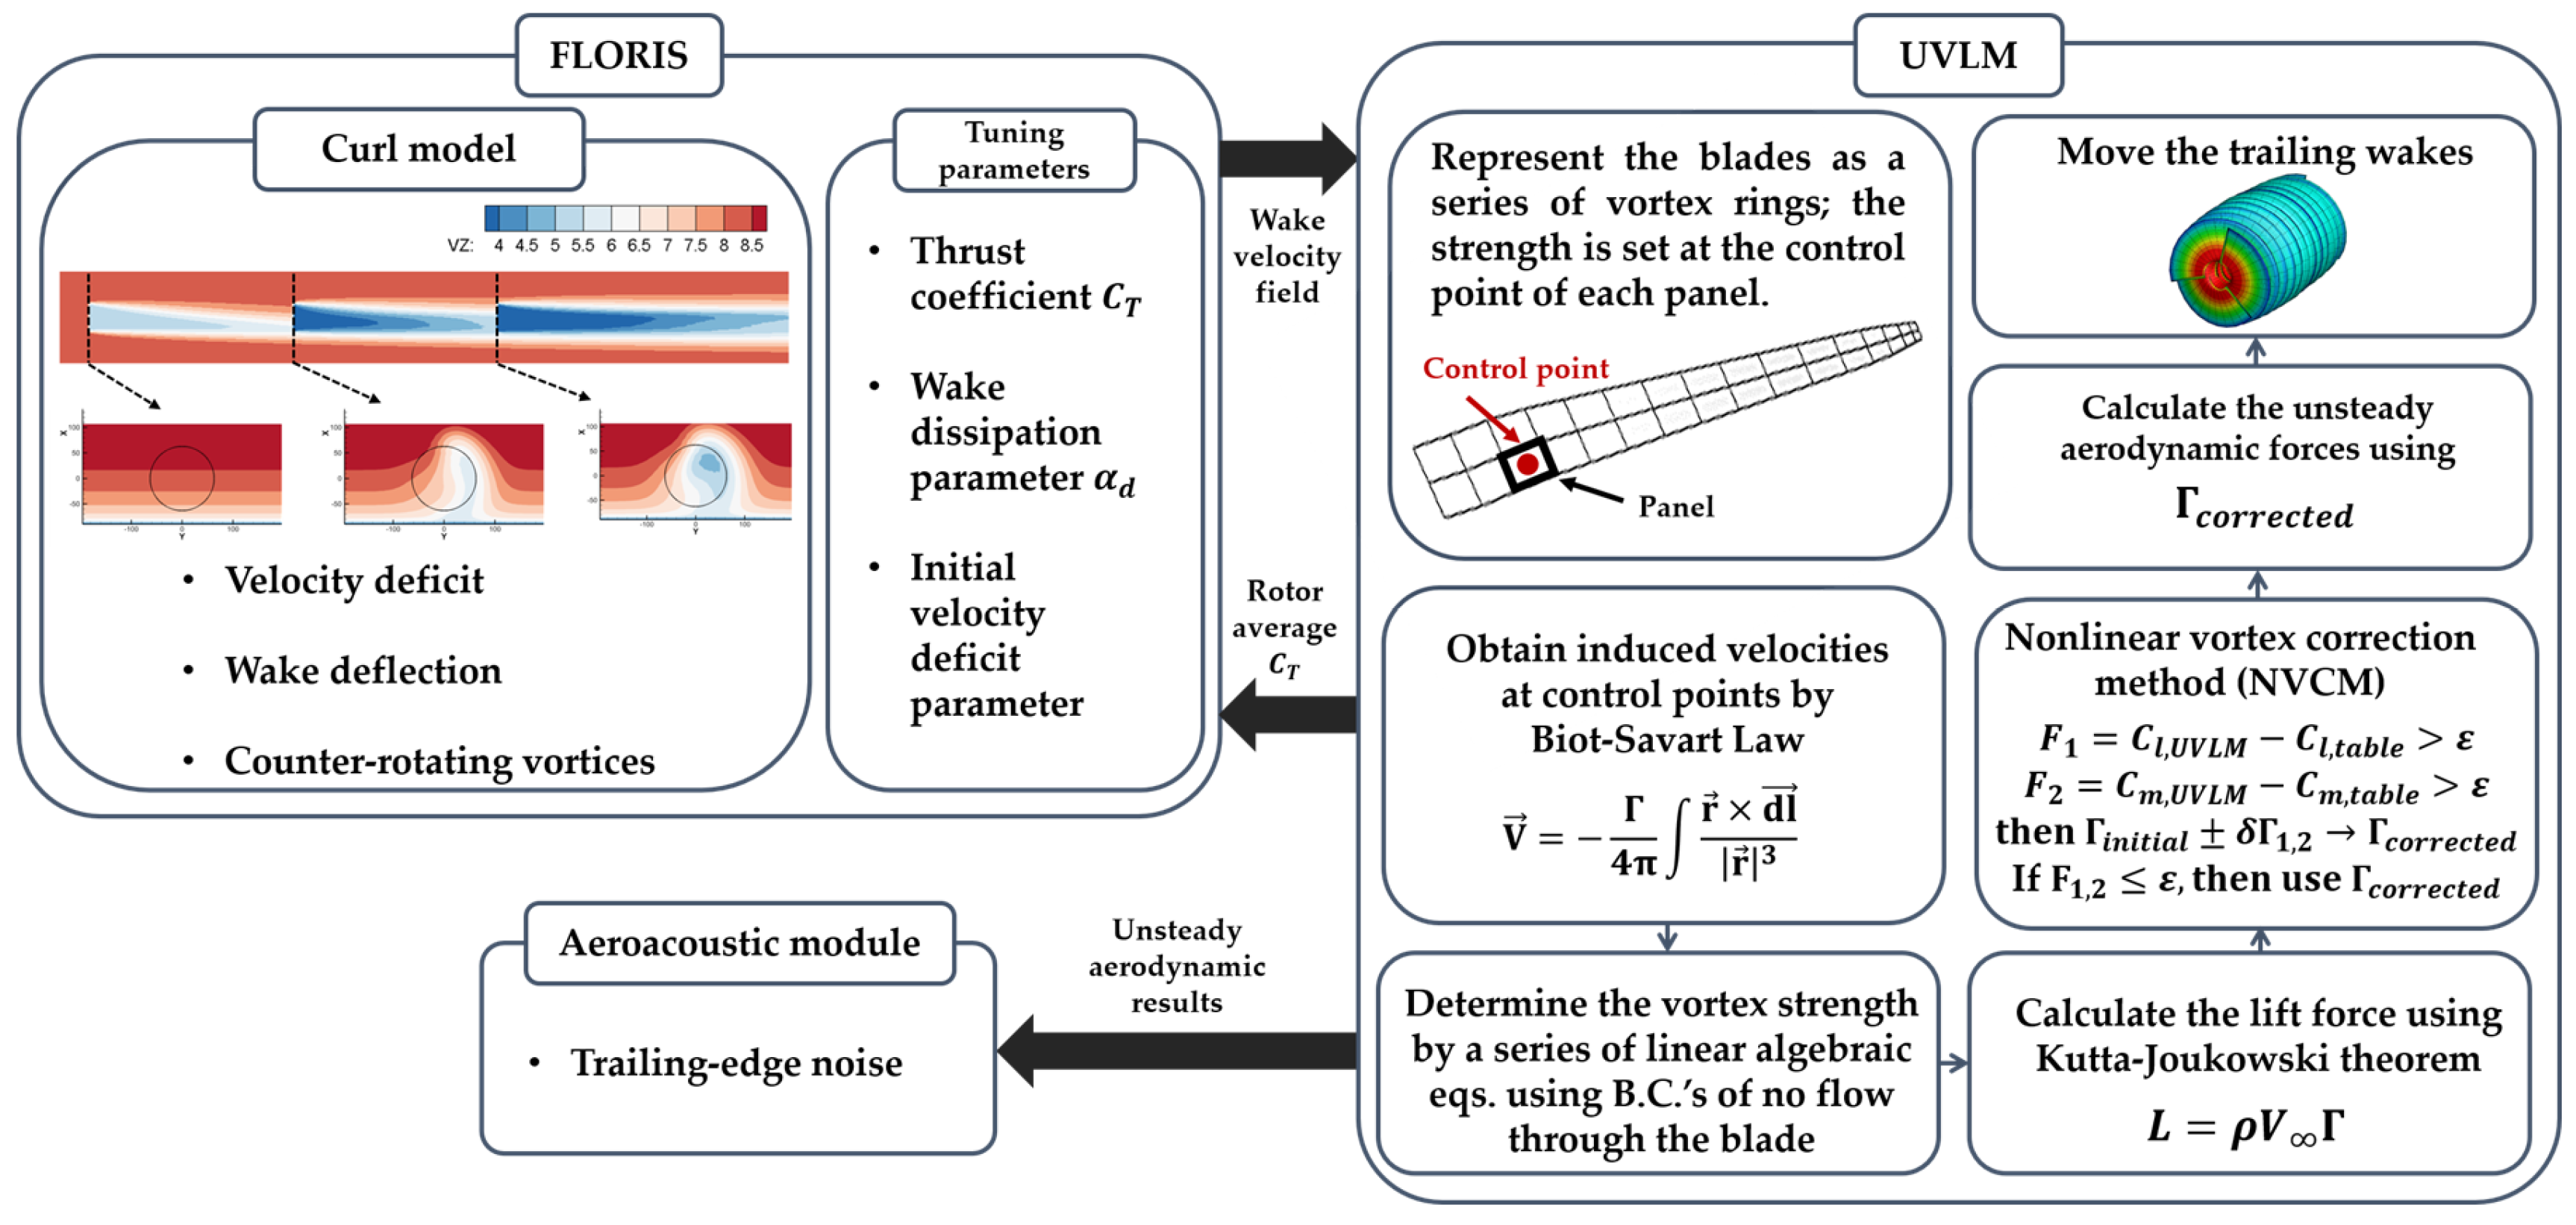
Figure 1. Overall flow chart of the coupled Curl–UVLM and the aeroacoustic module.
Energies 18 05205 g001
Figure 2. Validation against Atlantic Orient Corporation (AOC) 15/50 wind turbine measurements at the National Wind Technology Center, Colorado, USA. (a) Aerodynamic power; (b) Sound pressure level (SPL).
Energies 18 05205 g002
Figure 3. Wind profile for NBL and SBL cases.
Energies 18 05205 g003
Figure 4. Simulation setup: two-turbine configuration. The turbines are spaced 6D apart, and yaw control is applied only to the upstream turbine.
Energies 18 05205 g004
Figure 5. Definition of yaw direction (viewed from above).
Energies 18 05205 g005
Figure 6. Description of observer position. (a) Initial observer position and definition of rotor azimuth angle Ψ ; (b) Observer points for noise directivity analysis and definition of observer angle ξ (viewed from above).
Energies 18 05205 g006
Figure 7. Predicted streamwise wake velocity fields at a location 6D downstream of the upstream turbine. (a) γ = 30 ° (SBL); (b) γ = 30 ° (NBL); (c) γ = 15 ° (SBL); (d) γ = 15 ° (NBL); (e) γ = 0 (SBL); (f) γ = 0 (NBL); (g) γ = 15 ° (SBL); (h) γ = 15 ° (NBL); (i) γ = 30 ° (SBL); (j) γ = 30 ° (NBL).
Energies 18 05205 g007
Figure 8. Vertical direction velocity components of the predicted wake. (a) γ = 30 ° (SBL); (b) γ = 30 ° (NBL).
Energies 18 05205 g008
Figure 9. Spanwise direction velocity components of the predicted wake. (a) γ = 30 ° (SBL); (b) γ = 30 ° (NBL).
Energies 18 05205 g009
Figure 10. Distribution of normalized wake deficit at hub height. (a) SBL; (b) NBL.
Energies 18 05205 g010
Figure 11. Error analysis comparing the normalized wake distribution predicted by the Curl model with LES results. (a) Normalized wake center position; (b) Normalized wake deficit.
Energies 18 05205 g011
Figure 12. Time-average power of the upstream and downstream turbines. (a) SBL; (b) NBL.
Energies 18 05205 g012
Figure 13. Effective angle of attack distribution with different yaw angles. (a) γ = 30 ° (SBL); (b) γ = 15 ° (SBL); (c) γ = 0 (SBL); (d) γ = 15 ° (SBL); (e) γ = 30 ° (SBL); (f) γ = 30 ° (SBL); (g) γ = 15 ° (NBL); (h) γ = 0 (SBL); (i) γ = 15 ° (NBL); (j) γ = 30 ° (SBL).
Energies 18 05205 g013
Figure 14. Time variation of effective angle of attack at r / R = 0.84 with different yaw angles. (a) SBL; (b) NBL.
Energies 18 05205 g014
Figure 15. Overall sound pressure level (OASPL) directivity pattern. Single turbine indicates the upstream wind turbine with zero yaw under freestream inflow for each atmospheric stability condition. (a) SBL; (b) NBL.
Energies 18 05205 g015
Figure 16. Difference of OASPL of the upper and lower semicircle in the noise directivity plot. In each figure, the black solid line denotes zero yaw, the red dashed and solid lines denote +15° and +30° yaw, respectively, and the blue dashed and solid lines denote –15° and –30° yaw, respectively. (a) 100 ° ξ 180 ° (SBL); (b) 0 ° ξ 80 ° (SBL); (c) 100 ° ξ 180 ° (NBL); (d) 0 ° ξ 80 ° (NBL).
Energies 18 05205 g016
Figure 17. Time-varying SPL at ξ = 90 ° ( γ = 0 , SBL condition).
Energies 18 05205 g017
Figure 18. Amplitude modulation directivity pattern of downstream turbine. Single turbine indicates the upstream wind turbine with zero yaw under freestream inflow for each atmospheric stability condition. (a) SBL; (b) NBL.
Energies 18 05205 g018
Figure 19. Downstream turbine AM strength variation with yaw angle in the crosswind direction. (a) ξ = 90 ° ; (b) ξ = 270 ° .
Energies 18 05205 g019
Figure 20. Time variation of trailing-edge noise emitted by each blade in the crosswind direction with γ = 30 ° under SBL condition. (a) ξ = 90 ° ; (b) ξ = 270 ° .
Energies 18 05205 g020
Figure 21. Blade positions and dominant blades at the times of maximum and minimum trailing-edge noise emissions for different yaw angles and observer locations under SBL conditions. (a) γ = 30 ° ,   ξ = 90 ° ; (b) γ = 30 ° ,   ξ = 270 ° ; (c) γ = 15 ° ,   ξ = 90 ° ; (d) γ = 15 ° ,   ξ = 270 ° ; (e) γ = 0 ,   ξ = 90 ° ; (f) γ = 0 ,   ξ = 270 ° ; (g) γ = 15 ° ,   ξ = 90 ° ; (h) γ = 15 ° ,   ξ = 270 ° ; (i) γ = 30 ° ,   ξ = 90 ° ; (j) γ = 30 ° ,   ξ = 270 ° .
Energies 18 05205 g021
Table 1. General properties of AOC 15/50 wind turbine for validation.
PropertiesDescription
OrientationDownwind
Number of blades3
Rotor diameter15 m
Hub height25 m
Rated wind speed12 m/s
Cut-in wind speed4.9 m/s
Cut-out wind speed22.3 m/s
Blade airfoilsDUxx-A17, NACA64-A17
Table 2. Freestream wind condition parameters.
ParametersSBLNBL
u , 1 h u b (m/s)8.408.30
TI0.040.083
α s h 0.300.17
Table 3. General properties of NREL 5 MW wind turbine.
PropertiesDescription
OrientationUpwind
Number of blades3
Rotor diameter126 m
Hub height90 m
Rated wind speed11.4 m/s
Blade airfoilsDUxx-A17, NACA64-A17
Table 4. Tuned parameters of the Curl model.
Wake Model ParametersSBLNBL
α d 0.020.02
Initial wake deficit2.101.70
Mixing length (m)915
Disclaimer/Publisher’s Note: The statements, opinions and data contained in all publications are solely those of the individual author(s) and contributor(s) and not of MDPI and/or the editor(s). MDPI and/or the editor(s) disclaim responsibility for any injury to people or property resulting from any ideas, methods, instructions or products referred to in the content.