Article

GIS-Based Mapping and Development of Biomass-Fueled Integrated Combined Heat and Power Generation in Nigeria

by
Michael Ogheneruemu Ukoba
1,
Ogheneruona Endurance Diemuodeke
1,*,
Tobinson Alasin Briggs
1,
Kenneth Eloghene Okedu
2,* and
Chidozie Ezekwem
1
1
Energy and Thermofluids Research Group, Department of Mechanical Engineering, University of Port Harcourt, Choba, Port Harcourt PMB 5323, Rivers State, Nigeria
2
School of Information Technology and Engineering, Melbourne Institute of Technology, Melbourne, VIC 3000, Australia
*
Authors to whom correspondence should be addressed.
Energies 2025, 18(19), 5207; https://doi.org/10.3390/en18195207
Submission received: 17 July 2025 / Revised: 10 September 2025 / Accepted: 18 September 2025 / Published: 30 September 2025

Abstract

This research presents Geographic Information System (GIS) mapping and development of biomass for combined heat and power (CHP) generation in Nigeria. It includes crop and forest classification, thermodynamic, and exergo-economic analyses using ArcGIS, Engineering Equation Solver, and Microsoft Excel. Syngas generated from biomass residues powered an integrated CHP system combining a gas turbine (GT), dual steam turbine (DST), and a cascade organic Rankine cycle (CORC) plant. The net power output of the integrated system stood at 2911 MW, with a major contribution from the gas turbine cycle (GTC) unit. The system had a total exergy destruction of 6480 MW, mainly in the combustion chamber (2143 MW) and HP-HRSG (1660 MW), and produced 3370.41 MW of heat, with a flue gas exit temperature of 74 °C. The plant’s energy and exergy efficiencies were 87.16% and 50.30%, respectively. The BCHP system showed good economic and environmental performance, with an annualized life cycle cost of USD 93.4 million, unit cost of energy of 0.0076 USD/kWh kWh, and a 7.5-year break-even. The emissions and impact factors align with those of similar existing plants. It demonstrates that biomass residue can significantly support Nigeria’s energy needs and contribute to clean energy goals under the Paris Agreement and UN-SDGs. This work suggests a pathway to tackle energy insecurity, inform policymakers on biomass-to-energy, and serve as a foundation for future techno-economic–environmental assessment of biomass residues across suitable locations in Nigeria.

1. Introduction

Energy is the bedrock of present-day societal development [1,2]. The continuous increase in energy demand and climate change are issues that require urgent attention at the global, national, and sub-national levels. Knowing the adverse environmental implications of fossil fuels [1,2,3,4], their depletion rate, and the continuous reliance on developed countries for sustainable energy, it is imperative for developing economies to transition to renewable energy (RE) such as biomass, wind, solar, geothermal, hydro, etc., for useful energy generation [5,6,7]. Back in 2018, it was shown that only 12 years were left to cut the carbon dioxide emissions rate in half. Furthermore, it was shown that only about 420 gigatons of carbon dioxide emissions continue to stay below 1.5 °C [8]. Meanwhile, an estimate of 42 GtCO2 is emitted annually. Thus, there is barely a 50% chance of staying below 1.5 °C for global temperature stabilization [8].
African electricity generation capacity, as of 2018, stood at 850 TWh of the global electricity generation capacity of 26,607 TWh, where China leads and the USA follows with 7200 TWh and 4400 generation capacity, respectively [2,5]. The 850 TWh generation capacity is quite low for the African community and must be increased to meet the increasing energy demand and modern global societal development, technological invention, and industrialization [2,5,9,10,11]. Irregular electricity supply in the African community, and specifically Nigeria, with a population of more than 180 million, has resulted in a low standard of living, increased poverty levels, socio-economic imbalance, poor health care, low economic growth, and many more issues [2,12].
Agricultural data from the FAO [13] shows that food security, alongside other benefits, can be achieved via biomass (agro) sources. Biomass resources from crop and forest residues have great potential and stand as alternative sources of energy in Nigeria [14], which has been battling with the issue of sustainable energy in recent decades. Biomass energy is not only economic but also renewable, available, and carbon neutral [15]. Energy generation can be achieved via biomass conversion technology, including gasification, briquetting, biogas, direct combustion, etc. However, the utilization of biomass in developing countries has been limited to heating, cooking, and lighting [16,17].
The problem of poor access to electricity in sub-Saharan African countries has a major impact on rural communities and has led to the low standard of living of these communities [18]. Nigeria, with a population of over 180 million persons [2,9], is blessed with a large land area (approximately 1 million km2) suitable for agricultural activities. Over 70% of Nigerian farmers are small-scale farm-holders of less than 5 ha [19]. RE projects, such as those involving biomass, are usually small-scale energy generation projects designed to meet the load demands of facilities in a particular geographical location; hence, these projects encourage the decentralization of energy and have been identified as a major means to solve Nigeria’s incessant power irregularity. In setting up a biomass plant, one would first need to derive an estimate of the available crop and forest residues in the area of interest. The bulk nature of these residues poses storage, conversion, transportation, and handling challenges; hence, there is a need to ensure that the biomass plant is situated in a location where these residues are readily available in high quantities alongside other favorable conditions.
In order to effectively ascertain the biomass (crop and forest residues) availability in an area, the Geographic Information System (GIS) tool has been identified as a vital tool for this analysis. GIS is a computer-based system that captures and prepares, stores and maintains, manipulates and analyzes, and presents georeferenced data. Georeferenced data can easily be entered and analyzed in several ways, and the results are produced in the form of maps, color schemes, media, and symbol sets, based on the choices of the user. GIS technology is exceptional in the analysis of RE resources, geology, and environmentally correlated problems. It stores digital data in a location and retrieves and analyzes the data in a timely and efficient coded-map format. GIS is popular for use in statistical systems and advancing technology.
This research investigates the biomass potential and application for energy generation (electricity and thermal) in Nigeria. The study uses the Geographic Information System (GIS) tool to analyze crop residues obtainable in various locations for decentralized energy generation across Nigeria. Previous studies have applied GIS to biomass resource assessment, but their focus has largely been on localized resource mapping and feasibility analyses. This study is, therefore, novel as there are no prior studies on biomass mapping for sustainable heat and electricity generation in Nigeria. In addition, the work explored interconnected spaces between technology, economics, and the environment, providing a comprehensive range of insights for decision-makers in the energy sector of sub-Saharan Africa, with a particular focus on Nigeria.

2. Materials and Methods

Remotely sensed data, such as Land Use Land Cover (LULC), Global Positioning System (GPS) collected in pixel form from USGS [20], Digital Elevation Model (DEM), and other primary data imported from Excel, were uploaded and analyzed in the GIS platform. The following analysis was performed with the assistance of a GIS tool for Nigeria, and then streamlined to Edo State, which is the highest crop and forest producing state in the South-South (SS) zone of Nigeria. The South-South zone was considered due to the poor state of energy supply despite the high level of industrial activities that take place in the zone, compared with other zones in Nigeria.
Resource assessment: this includes the theoretical, technical, and economic resource assessment (see Ukoba et al. [7] for details).
  • Digitization: Data such as road networks and waterlines were digitized and uploaded into the GIS platform.
  • DEM analysis: Digital Elevation Model (DEM) analysis was performed on the obtained remotely sensed data to produce the slope, aspect, hill shade, and topographic data.
  • Buffer analysis: The Multiple-Ring Buffer analytical tool in the GIS domain was employed to create multiple buffer areas around the roads and waterlines, according to the stipulated criteria.
  • Multicriteria Decision (MCD) weighted overlay analysis: The criteria, including forest area, crop areas, settlement, grass lands, waterbodies, barren land, water source distance, accessibility, topography, and aspect, were considered, and the influence weights of the criteria were determined for Nigeria. Meanwhile, criteria including biomass residue area, settlement, accessibility, proximity to waterbody, slope, and aspect were determined for Edo state, Nigeria (see Ukoba et al. [7] for details).

2.1. Normalized Difference Vegetation Index (NDVI) Analysis

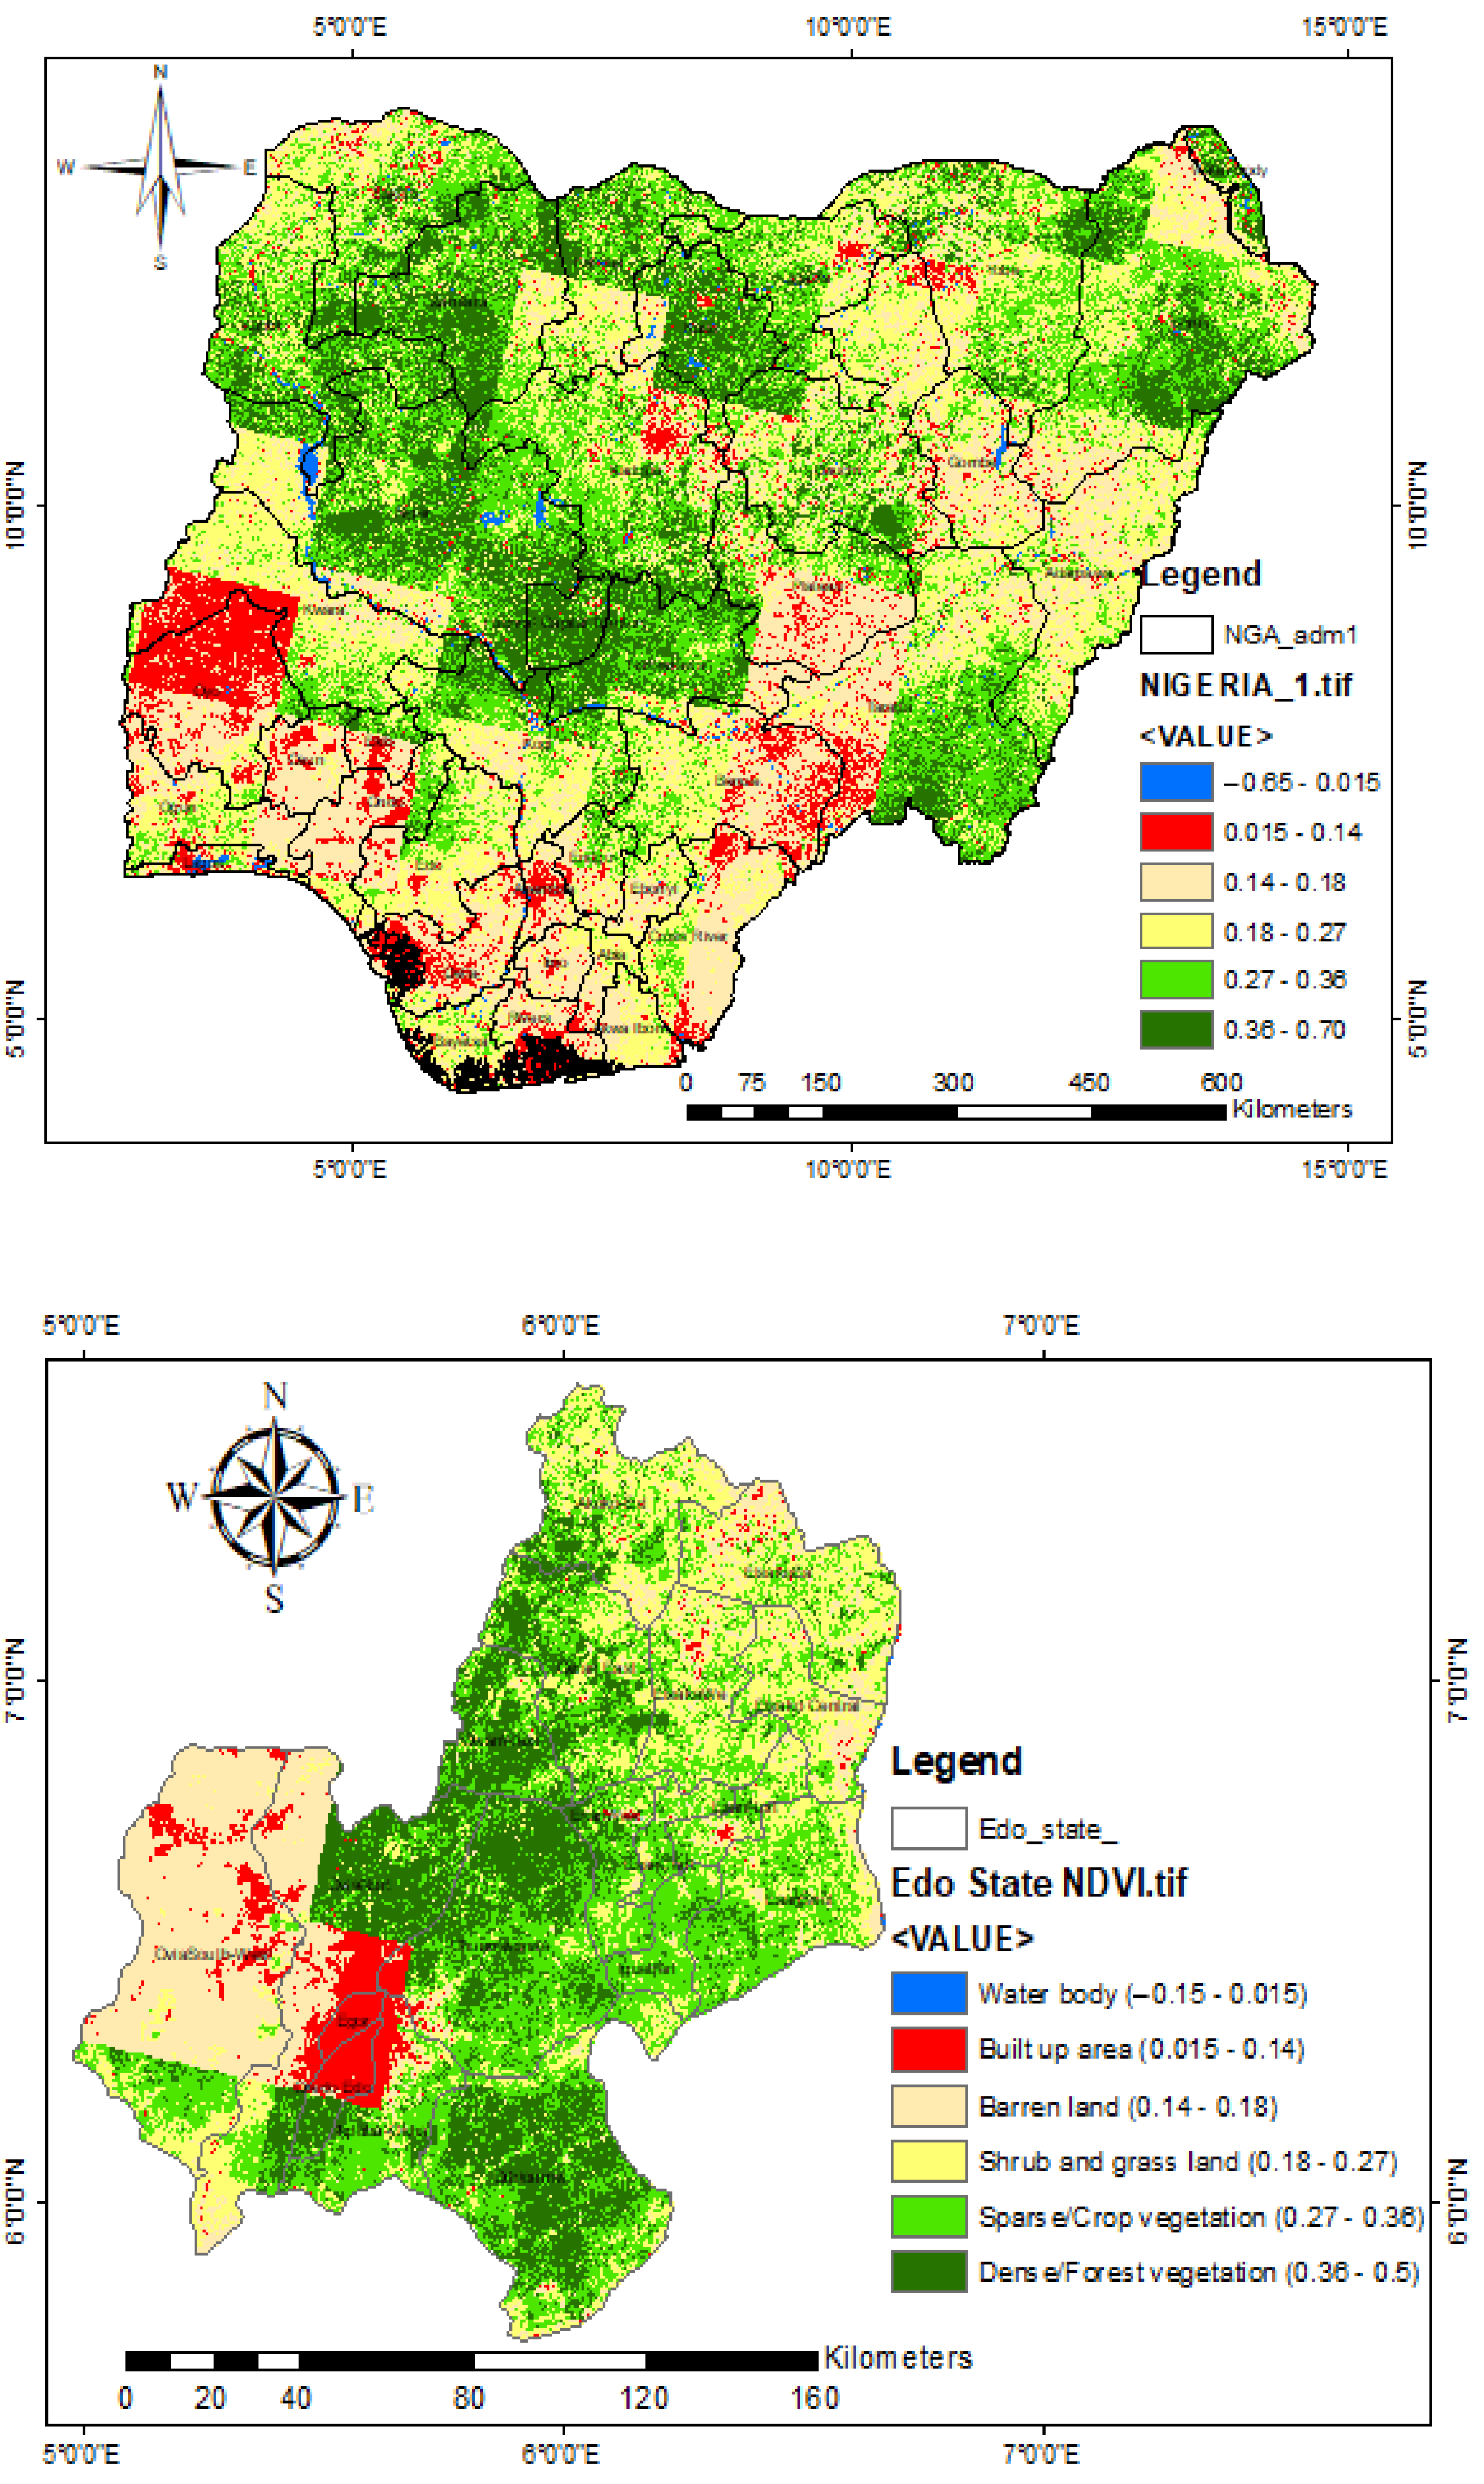
The NDVI is employed to quantify vegetation by assessing vegetation that is strongly reflected and absorbed (RED) in the near-infrared (NIR) regions. Its value ranges from 1 to +1. Negative values depict areas with a high water content, while values approaching +1 depict areas with dense green leaves [7]. Values from—1.00–0.015, 0.015–0.14, 0.14–0.18, 0.18–0.27, 0.27–0.36, and 0.36 indicate water areas, built-up areas, barren lands, shrub and grasslands, sparse vegetation (crop lands), and dense vegetation (forest lands), respectively. Meanwhile, the NDVI starting value range for the initial classification (water body) and the end value range for the final classification (dense vegetation) typically vary across different geographical locations [7].
The NDVI is estimated using Equation (1), which is given as [7]:
N D V I = N I R R E D N I R + R E D
Reclassification of criteria, weighted overlay analysis, and suitability analysis have been performed in the ArcGIS platform in a previous study [7]. Their analysis was streamlined to Edo state, Nigeria, where they obtained the optimal site locations.

2.2. Analysis of Biomass-Combined Heat and Power Plant (BCHPP)

This analysis is carried out for the locations with optimal biomass crop residues and forest residues in northern and southern Nigeria, respectively. The optimal sites are analyzed using the MCDA method to ensure they are situated in areas close to the residue production area and the access road, implying low transportation cost. Most of the southern communities where these forest residues are generated are largely associated with high CO2, flue gases, and other climate-pending gases due to the burning of these residues, while the northern communities where these crop residues are generated are mainly associated with pest and health hazards due to indiscriminate dumping of the crop residues, which are viewed as waste. Therefore, a sustainable BCHPP system is proposed for both electrical energy and thermal applications.
Figure 1 presents the proposed BCHPP system. The system consists of seven (7) units: combustor unit, gas cleaning (GC) unit, gas turbine cycle (GTC) unit, heat recovery (HRS) unit, steam turbine cycle (STC) unit, organic Rankine cycle (ORC) unit, and evaporator—condenser unit. Other components include expanders, pumps, a recuperator, and a post-heat-exchanger.

BCHPP System Description

This system comprises a gasifier (G), quench-scrubber (Q/S), sump, cyclone (Cy), compressor (Comp), combustion chamber (CC), gas turbine (GT), heat recovery systems, heat recovery steam generators (HRSG), heat recovery organic Rankine cycle generator (HRORCG), high and low pressure steam turbines (HPST and LPST), other steam turbines (ST1, ST2), heat exchangers (H1 and H2), pumps (P1, P2, P3, and P4), condenser (C), and evaporator–condenser unit (C−E). Figure 1 shows the layout of the proposed BCHP plant system.
In the gasifier plant, water is routed through a stainless-steel pipe connected to the walls of the combustion region of the gasifier, which is designed to reduce the impact of high temperature in the gasifier system. The water is heated up and converted to steam, which is utilized as part of the constituent for the controlled gasification process.
Unprocessed biomass residues are gathered and carried to the biomass plant site. They are pre-processed at the gasification unit to produce feed and remove undesirable/harmful materials using the emission-control system. The biomass residue is fed into the gasifier (G), where it is heated in the presence of oxygen and steam with a temperature range of 700–900 °C [21,22] to produce syngas (comprising methane (CH4) carbon II oxide (CO) and hydrogen (H2) gas), and routed to the gas cleaning unit (GCU) [23]. Cleaned gas (syngas) is then channeled to the gas turbine cycle (GTC) unit for energy generation and passed through the high-pressure heat recovery steam generator (HP-HRSG). Hot fluid obtained from the HP-HRSG is utilized to drive the DST system for energy generation. Again, the hot fluid obtained from the HP-HRSG is routed through the low-pressure heat recovery steam generator (LP-HRSG) to the heat recovery organic Rankine cycle (HRORC); next, it is channeled to the organic Rankine cycle (ORC) unit for electrical energy generation and then to the heat generation chamber (HGC) section to generate thermal energy.
Hence, two primary operations are performed here. The first operation involves gas cleaning and collection from the gasification process; the second process involves gas utilization to drive the system for combined heat and power (CHP) generation.
First operation (gas cleaning and collection): Flue gases from the combustion process at the gasifier operating between 700 and 900 °C [21,22] are passed through the quench-scrubber/cyclone system (where water is sprinkled to dampen the gas particles) down to the sump, where heavy particles (in moist form) fall into the lower part of the sump. The quench-scrubber also serves as an attemperator (regulates the temperature of the gas that passes through the system) and as a medium for filtering gas particles. The lighter particles (gases) at the surface of the sump vessel are channeled through a tube to the cyclone, where other gas particles are filtered out, and the clean gas is then channeled to the gas collector (GC) unit.
Second operation (gas utilization): A combined gas turbine (GT), dual steam turbine (DST), and cascade organic Rankine cycle (CORC) system for combined heat and power (CHP) was the system configuration considered in this system operation.
Clean gases (syngas) from the gas collector at state 2I and compressed air at state 2 are routed to the combustion chamber for proper combustion of the syngas in the gas turbine unit (GTU). The combusted product is passed down to drive the gas turbine (GT) for electrical generation. Flue gases from the exhaust of the GT are passed through a dual-pressure HRSG (HP-HRSG and LP-HRSG). The HRSG traps the heat generated from the exhaust of the GT to produce steam to run the dual-pressure steam turbine (ST) plant for electricity generation. The exhaust steam from the steam turbine is routed to a heat exchanger, where running water passes through and is converted to steam for heat generation (Heat Generation Chamber One, HGC 1). At the same time, the other section is channeled to a pump, which pumps the water (at low temperature and pressure) into the HRSG units and back into the ST systems for continuous operation. Hot gas from the exhaust of the LP-HRSG is routed to a heat recovery organic Rankine cycle (HRORC) generator to run a fluid turbine system operating in organic Rankine cycle (ORC). The heat produced from the HRORC is at a temperature of about 350 °C and is transferred to the fluid (Globaltherm-Omnitech) of the heat recovery ORC generator tubules. The internal energy from the tubes converts the working fluid into vapor in the heat recovery ORC generator. The vapor (at high temperature and pressure) is then expanded and sent to a turbo-generator (expander/ORC steam-generator) for electrical energy generation. Saturated vapor exiting the expander is condensed and pumped into the condenser–evaporator unit to further heat it up by the flue gas in the HRORCG for continuous operation. The condenser–evaporator unit connects the ORC plant at the lower region to the ORC plant of the upper section of the plant. The working fluids of the ORC plant at the upper and lower regions are as follows: Toluene (effective for high-temperature heat source [18,24,25]) and R113 (effective for low-temperature conditions [18,26]), respectively. The working fluid at the upper region rejects heat to that of the lower cycle and thus condenses, making the R133 (working fluid in the lower cycle) evaporate and result in expansion to produce electricity (at the expander section of the lower cycle). Meanwhile, the working fluid that leaves the lower expander interacts with that leaving the pump to improve its efficiency. Processes 17–18–19–20–17 and 22–23–24–24′–25–22 feature cascade-ORC electricity production, while 26–27–28 handle the thermal energy generation aspect.

2.3. Assumptions

The assumptions considered while modeling the biomass CHP plant system to simplify the analysis include the following [18,23,27,28]:
  • Kinetic and potential energies are negligible;
  • No heat loss;
  • Steady-state operation;
  • Gas behavior is the ideal gas behavior;
  • Gasification reaction is at equilibrium;
  • Control volume system;
  • Complete combustion process.

2.4. Gas Generation (Gasification) Model

The energy content in the biomass residue is trapped and utilized via the gasification conversion process. The gasifier, which converts the biomass residue into syngas, is modeled using Gibbs’ approach ([23,27,28,29]). The gasifier considered in this analysis is the downdraft gasifier since it closely approaches equilibrium based on ref. [30,31]. Therefore, the general biomass gasification equation sufficed:
C n H x O y N z + w H 2 O + m O 2 + 3.76 N 2 v H 2 H 2 + v C O C O + v C O 2 C O 2 + v H 2 O H 2 O + v C H 4 C H 4 + z 2 + 3.76 m N 2
where C n H x O y N z represents the dry constituent and ash of the biomass; w   represents the amount of water per mol of biomass; ( m o l / m o l b i o m a s s ) , v i ( m o l / m o l b i o m a s s ) , and m ( m o l / m o l b i o m a s s ) represent the specific molar amount of the biomass moisture, syngas constituent, and air, respectively.
The amount of water per mole of biomass ( w ) is given as follows [21,30];
w = M ¯ b i o m a s × M ¯ H 2 O ( 1 0.01 ) = 24 M C 18 ( 1 M C )
m = E R 1 + x 4 y 2
where M ¯ b i o m a s (g/mol) and M ¯ H 2 O (g/mol) represent the biomass and water molar masses, respectively; M C is the moisture content of biomass residue, assumed as 0.3 [–]); and E R [–] represents the equivalent ratio. Most biomass combustors operate at lean combustion (excess air condition) [31]. The excess air, which is termed the equivalent air (ER) ratio for the biomass gasifier system, is taken as 0.25 [29,32], which is the average value of a biomass gasifier plant system that varies between 0.2 and 0.3. If the equivalent ratio is too low ( E R < 0.2 ) , it leads to incomplete gasification, excess chars/tar formation, and low heating value (LHV) of the gas product, while an excess equivalent ratio value ( E R > 0.4 ) leads to excess product formation (CO2 and H2O) from complete combustion at the detriment of the desired product, resulting in a decrease heating value of the syngas [32].
The syngas specific molar amount is estimated based on the algorithm by Allesina et al. [28]. Based on the water–gas shift and methane formation equations presented in Equations (5) and (6), the equation constants, K 1   and K 2 ,   are first calculated using Equations (7) and (8), respectively.
K 1 : C O + H 2 O C O 2 + H 2
K 2 : C + 2 H 2 C H 4
K 1 = e 4276 T 3.961
K 2 = 7082.842 T 6567 I n T + 7.467 × 10 3 T 2 2.167 × 10 6 T 2 6 + 0.702 2 T 2 + 32.541
The chemical balance of the gas component is obtained from the generic gasification equation and water–gas and methane formation equations to obtain the specific molar amount.
C : v C O + v C O 2 + v C H 4 = 1
H : v H 2 + v H 2 O + 2 v C H 4 = x 2 + w
O : v C O + 2 v C O 2 + v H 2 O = w + 2 m + y
K 1 = v C O 2 × v H 2 v C O × v H 2 O
K 2 = v C H 4 v H 2 2 × v t o t a l
where Equations (9)–(13) are obtained from the reactant and product enthalpy of the biomass gasification energy balance equation. The solution presented by Zainal et al. [29] was used to obtain the unknown values.
The biomass waste LHV [kJ kg] is given as follows:
L H V b i o m a s = φ i L H V i i ( c r o p , f o r e s t )
where φ i [ ] represents the mass fraction of crop and forest residue;
L H V i = μ j L H V j
where μ j [ ] is the mass fraction of j ; j represents the different crop/forest residue products.
The mass flow rate of the biomass waste [kg/h] utilized for this analysis is the economic mass flow rate of the biomass waste. This is estimated by dividing the theoretical (also called available) mass of the biomass residue by the factor f R   , which represents the ratio of the theoretical energy potential of the biomass residue and its economic energy potential. This is expressed mathematically as follows:
m ˙ B W = m ˙ E , i i ( c r o p , f o r e s t )
m ˙ E = m ˙ T , i f R , i
f R , i = E t h e o r i t i c a l / E e c o n o m i c
where m ˙ E , i [ kg / hr ] represents the economic biomass residue mass flow rate of i per plant; f R [ ] and m ˙ T [ kg / hr ] represent the biomass residue mass factor and theoretical biomass residue flow rate, respectively; and E t h e o r i t i c a l   a n d   E e c o n o m i c   represent the theoretical and economic energy potential of biomass residue, respectively [7].

2.5. Thermodynamic Analysis of the BCHPP System

The biomass CHP plant comprises a gas turbine cycle, a dual steam turbine cycle, and a dual organic fluid turbine cycle. The thermodynamic analysis of the BCHPP system is based on the first law of thermodynamics, which is given by Equation (19).
d E d T = Q ˙ W ˙ + i n m ˙ ( h + V 2 2 + g z o u t m ˙ ( h + V 2 2 + g z
where d E (kJ), d t ( s ) , Q ˙ (kW), W ˙ ( k W ) , m ˙ ( k g ) , h   ( k J / k g ) , v ( m / s ) , g m s 2 , and z ( m ) represent change in energy (kJ), change in time (s), heat transfer, work transfer (kW), mass flow rate (kg), specific enthalpy, velocity, acceleration due to gravity, and elevation, respectively; meanwhile, the “in” and “out” indices represent inlet and outlet, respectively.
The exergy equation is as follows ([27,33]):
E x ˙ = E x ˙ i n E x ˙ o u t E x ˙ d = 1 T 0 T h Q ˙ h W ˙ P 0 V T 0 S ˙ g e n
where E x   ( k W ) ,   E x ˙ i n   ( k W ) , E x ˙ o u t   ( k W ) , and E x ˙ d T 0 S ˙ g e n   ( k W ) represent stream exergy rate, exergy-in, exergy-out, and exergy destroyed in the system, respectively; Q ˙ h   (kW) is the heat transfer rate at the boundary h; T 0 and T h (K) are the dead state temperature and the temperature at the system boundary, respectively; W ˙ (kW) is the work performed.
Going further, the exergy of the stream may be represented as follows:
E x ˙ = E x ˙ p e + E x ˙ k e + E x ˙ c + E x ˙ p
where E x ˙ p e   ( k W ) and E x ˙ k e   ( k W ) represent potential exergy and kinetic exergy, respectively; E x ˙ c   ( k W ) and E x ˙ p   ( k W ) represent chemical exergy and physical exergy, respectively, which are given as follows:
E x ˙ c = m ˙ h x i E x ¯ c , i R h T 0 x i I n x i
E x ˙ p = m ˙ h h h h 0 T 0 s h s 0
where h h is the enthalpy of the flowing stream, h 0 [kJ/kg] is the enthalpy of the surroundings, s h is the entropy of the flowing stream, s 0 [kJ/kg K] is the entropy of the surroundings, E x ¯ c , i is the chemical exergy of i   (air, fuel, refrigerant), and x i is the fraction of i   (air, fuel, refrigerant).
The first law efficiency, the second law efficiency, and the exergy destruction ratio ξ e x , d ( ) of the biomass combined power plant, and the second law efficiency of the BCHP plant components are respectively given as follows:
η I , C P P = W ˙ n e t , C P P + Q ˙ m m ˙ f L H V f
η I I , C P P = W ˙ n e t , C P P + Q ˙ m 1 T 0 T m E x ˙ c
ξ e x , d = E x ˙ d , j E x ˙ d , j
η I I , h = E x ˙ p r o d u c t E x ˙ f u e l
where j is the j-th component of the BCHP system.

2.6. Energy and Exergy Analysis of BCHP Components

2.6.1. Gas Turbine Cycle

Compressor
W ˙ c = m ˙ h c p Δ T h η h
s E x ˙ D , h = W ˙ c E x ˙ i n E x ˙ o u t
where W ˙ c represents the work of the compressor; m ˙ h , c p and Δ T h represent mass flow rate, isobaric-specific heat capacity of fluid, and isentropic temperature difference between compressor exit and inlet, respectively; E x ˙ D , c , E x ˙ i n , E x ˙ o u t (kW) represent exergy-destroyed, exergy-in, and exergy-out, respectively.
Preheater (fuel and air preheater)
Q ˙ H x , h = m ˙ h c p , h
T H x , h = m ˙ g c p , g T H x , g
E x ˙ D , H x , h = ( E x ˙ i n , h E x ˙ o u t , h ) + ( E x ˙ i n , j E x ˙ o u t , j )
where Q ˙ H x , k and E x ˙ D , H x , h represent the heat transfer rate and the exergy destroyed, respectively; m ˙ g , c p , g , T H x ,   g , and T H x , h represent mass flow rate, isobaric flue-gas-specific heat capacity, temperature difference of flue gas, and temperature difference of air/fuel, respectively.
Combustion chamber
Q ˙ c c = m ˙ g c p , g T 3 + m ˙ f L H V 1 η c c = m ˙ g c p , g T 2 + m ˙ f L H V
m ˙ g = m ˙ a + m ˙ f
E x ˙ D , c c = ( E x ˙ 2 + E x ˙ 2 ) E x ˙ 3
where η c c ( ) , Q ˙ c c , and E x ˙ D , c c represent the efficiency of the combustion chamber, the heat of combustion, and the exergy destroyed, respectively.
Gas turbine
W ˙ G T = m ˙ g ( T 3 ( T 4   s ) η G T = m ˙ g c p , g ( T 3 ( T 4   s ) η G T
E x ˙ D , G T = E x ˙ 3 E x ˙ 4 W ˙ G T
where W ˙ G T and E x ˙ D , G T represent the gas turbine work and the exergy destroyed, respectively.

2.6.2. Steam Turbine Cycle

Heat recovery steam generators ( H R S G i )
Q ˙ H R S G , i = m ˙ i Δ h i = m ˙ g c p , g Δ T g
E x ˙ D , H R S G , i = Δ E x ˙ g Δ E x ˙ i
where i = HP, LP; m ˙ i (kg/s), Q ˙ H R S G , i , and E x ˙ D , H R S G , i (kW) represent the mass flow rate, heat transfer rate, and exergy destroyed, respectively.
Steam turbines ( S T i )
m ˙ s T 9 = m ˙ H P T 7 + m ˙ L P T 8
W ˙ H P S T = m ˙ H P ( h 6 h 7 )
E x ˙ D , H P S T = E x ˙ 6 E x ˙ 7 W ˙ H P , S T
W ˙ L P , S T = m ˙ L P ( h 9 h 10 )
E x ˙ D , L P S T = E x ˙ 9 E x ˙ 10 W ˙ L P , S T
where W ˙ H P S T and W ˙ L P S T represent high-pressure and low-pressure work rate, respectively; and E x ˙ D , H P S T and E x ˙ D , L P S T (kW) represent exergy destroyed for high-pressure (HP) and low-pressure (LP), respectively.
Condenser
Q ˙ C D = m ˙ s ( h 10 h 11 ) = m ˙ a c p , a ( T 16 T 15 )
E x ˙ D , C D = E x ˙ 10 + E x ˙ 15 E x ˙ 11 E x ˙ 16
where m ˙ s (kg/s), Q ˙ C D   (kg/s), and E x ˙ D , C D (kW) represent the mass flow rate, heat rate, and exergy destroyed, respectively.
Pump
W ˙ P , H P = m ˙ H P ( h 13 h 12 a ) η P
E x ˙ D , H P = ( E x ˙ 13 E x ˙ 12 a ) + W ˙ P , H P
W ˙ P , L P = m ˙ L P ( h 12 h 11 ) η P
E x ˙ D , L P = ( E x ˙ 12 E x ˙ 11 ) + W ˙ P , L P
where W ˙ P , H P and W ˙ P , L P represent work rate transfer for the high-pressure pump and the low-pressure pump; and E x ˙ D , H P and E x ˙ D , L P represent their exergy destroyed.
Net power ( W ˙ n e t , , S ) and heat added ( Q ˙ A , S )
W ˙ n e t , S = W ˙ H P , S T + W ˙ L P , S T W ˙ P , H P W ˙ P , L P
Q ˙ A , S = Q ˙ H P , H P S G + Q ˙ L P , H R S G
First law efficiency ( η I , S T ) and second law efficiency ( η I I , S T )
η I , S T = W ˙ n e t , S T Q ˙ A , S T
η I I , S T = W ˙ n e t , S T ( E x ˙ 4 E x ˙ 14 )

2.6.3. Organic Rankine Cycle (ORC)

Simple Biomass CHP ORC
ORC heat recovery generators (ORC H R S G )
Q ˙ O R C , H R S G = m ˙ w ( h 17 h 20 ) = m ˙ g c p , g ( T 14 T 21 )
E x ˙ D , O R C , H R S G = ( E x ˙ 14 + E x ˙ 20 ) ( E x ˙ 17 + E x ˙ 21 )
ORC steam turbines ( W ˙ O R C , S T 1 )
Power produced by the ORC steam turbines, W ˙ O R C , S T 1 [kW] is given as follows:
W ˙ O R C , S T 1 = m ˙ w ( h 17 h 18 )
E x ˙ D , O R C , S T 1 = E x ˙ 17 E x ˙ 18 W ˙ O R C , S T 1
Exergy efficiency of the ORC turbine
η I I , O R C , S T 1 = W ˙ O R C , S T 1 ( E x ˙ 17 E x ˙ 18 )
ORC Condenser–Evaporator ( Q ˙ O R C , C E )
Q ˙ O R C , C E = m ˙ w ( h 18 h 19 )
E x ˙ D , O R C , C E = ( E x ˙ 18 + E x ˙ 25 ) ( E x ˙ 19 + E x ˙ 22 )
Exergy efficiency of ORC condenser–evaporator
η I I , O R C , C _ E = E x ˙ 22 E x ˙ 25 E x ˙ 18 E x ˙ 19
ORC fluid pump ( W ˙ O R C , w f P 3 )
W ˙ O R C , f P 3 = m ˙ w ( h 20 h 19 ) / η p
E x ˙ D , O R C , f P 3 = ( E x ˙ 19 E x ˙ 20 ) + W ˙ O R C , f P 3
Exergy efficiency of ORC fluid pump
η I I , O R C , f P 3 = E x ˙ 20 E x ˙ 19 W ˙ O R C , f P 3
where η p is the efficiency of the working fluid pump.
Simple ORC net power:
The net power W ˙ S , n e t is given as
W ˙ S O R C , n e t = W ˙ O R C , S T 1 W ˙ O R C , f P 3
First law efficiency ( η I , S O R C ) and second law efficiency ( η I I , S O R C ) for electrical energy generation:
The first law efficiency for electrical energy generation for the simple ORC plant ( η I , S O R C ) is
η I , S O R C = W ˙ S O R C , n e t Q ˙ S , O R C , H R S G = W ˙ S O R C , n e t m ˙ f × L H V
The second law efficiency for electrical energy generation is
η I I , S O R C = W ˙ S O R C , n e t E x ˙ 14 E x ˙ 21 = η I , S O R C 1 T 21 T 14
First law efficiency ( η I , S O R C , C H P ) and second law efficiency ( η I I , S O R C , C H P ) for simple ORC-combined heat and electrical energy generation:
The first law efficiency for heat and electrical energy generation ( η I , S O R C , C H P ) is
η I , S O R C , C H P = W ˙ S O R C , n e t + Q ˙ O R C , n e t m ˙ f × L H V
The second law for heat and electrical energy generation is
η I I , S O R C , C H P = η I , S O R C , C H P 1 T 21 T 14
Heat recovery factor ( f H R ):
The heat recovery factor of the system is given as
f S , H R = Q ˙ O R C , n e t m ˙ f × L H V × 100
Cascade Biomass CHP ORC
ORC Condenser–Evaporator ( Q ˙ O R C , C E ):
The heat load of the condenser–evaporator, Q ˙ O R C , C E , and the exergy destroyed at the condenser–evaporator, E x ˙ D , O R C , C E , are obtained from Equations (72) and (73).
ORC steam turbines ( W ˙ O R C , S T 2 ) :
Power produced by the ORC steam turbines, W ˙ O R C , S T 2 (kW), is given as
W ˙ O R C , S T 2 = m ˙ w ( h 22 h 23 )
E x ˙ D , O R C , S T 2 = ( E x ˙ 22 + E x ˙ 23 ) W ˙ O R C , S T 2
Exergy efficiency of the ORC turbine:
η I I , O R C , S T 2 = W ˙ O R C , S T 2 ( E x ˙ 22 E x ˙ 23 )
ORC fluid pump ( W ˙ O R C , w f , P k ):
W ˙ O R C , f P 4 = m ˙ w ( h 25 h 24 ) η p
E x ˙ D , O R C , f P 4 = ( E x ˙ 24 E x ˙ 25 ) + W ˙ O R C , f P 4
Exergy efficiency of ORC fluid pump:
η I I , O R C , f P 4 = E x ˙ 25 E x ˙ 24 W ˙ O R C , f P 4
ORC condense ( Q ˙ O R C , C ):
Q ˙ O R C , C = m ˙ w ( h 23 h 24 )
E x ˙ D , O R C , C = ( E x ˙ 23 + E x ˙ 26 ) ( E x ˙ 24 + E x ˙ 30 )
Exergy efficiency of ORC condenser–evaporator:
η I I , O R C , C = E x ˙ 30 E x ˙ 26 E x ˙ 23 E x ˙ 24
ORC heat exchanger ( Q ˙ H X ):
Q ˙ O R C , H X = m ˙ w ( h 21 h 29 )
E x ˙ D , O R C , H X = ( E x ˙ 21 + E x ˙ 27 ) ( E x ˙ 29 + E x ˙ 28 )
Exergy efficiency of ORC condenser–evaporator:
η I I , O R C , C = E x ˙ 28 E x ˙ 27 E x ˙ 21 E x ˙ 29
Cascade ORC net power ( W ˙ C O R C , n e t ):
The net power W ˙ n e t is given as
W ˙ C O R C , n e t = W ˙ C O R C , S T 2 W ˙ C O R C , f P 4
Daily heat extracted from the system is
Q ˙ C O R C , n e t = D o × E x ˙ 27
where D 0 represents the operation hours per day.
First law efficiency ( η I , C O R C ) and second law efficiency ( η I I , O R C ) for electrical energy generation:
The first law efficiency for electrical energy generation for the cascade organic Rankine cycle plant ( η I , C O R C ) is
η I , C O R C = W ˙ C O R C , n e t Q ˙ C O R C , H R S G = W ˙ C O R C , n e t m ˙ f × L H V
The second law efficiency for electrical energy generation is
η I I , C O R C = W ˙ C O R C , n e t E x ˙ 17 E x ˙ 26 = η I , C O R C 1 T 26 17
First law efficiency ( η I , C C H P ) and second law efficiency ( η I I , C C H P ) for heat and electrical energy generation:
The first law efficiency for heat and electrical energy generation for the BCHPP is
η I , C C H P = W ˙ C O R C , n e t + Q ˙ C O R C , n e t m ˙ f × L H V
The second law for heat and electrical energy generation is
η I I , C C H P = η I , C C H P 1 T 26 T 17
Heat recovery factor ( f H R ):
The heat recovery factor of the system is given as
f C , H R = Q ˙ C O R C , n e t m ˙ f × L H V × 100
Cascade Biomass CHP ORC cycle
Cascade ORC net power ( W ˙ C O R C , n e t ):
The net power W ˙ C O R C n e t is given as
W ˙ C M O R C , n e t = W ˙ C O R C , S T m W ˙ C O R C , w f , P n
where m = (1, 2) and n = (3, 4).
First law efficiency ( η I , C M O R C ) and second law efficiency ( η I I , C M O R C ) for electrical energy generation:
The first law efficiency for electrical energy generation for the combined simple–cascade organic Rankine cycle plant ( η I , C M O R C ) is
η I , C M O R C = W ˙ C O R C , n e t Q ˙ C O R C , H R S G = W ˙ C O R C , n e t m ˙ f × L H V
The second law efficiency for electrical energy generation is
η I I , C O R C = W ˙ C O R C , n e t E x ˙ 17 E x ˙ 26 = η I , C O R C 1 T 26 T 17
First law efficiency ( η I , C M C H P ) and second law efficiency ( η I I , C M C H P ) for heat and electrical energy generation:
The first law efficiency for heat and electrical energy generation for the system is
η I , C M C H P = W ˙ C M O R C , n e t + Q ˙ C O R C , n e t m ˙ f × L H V
The second law for heat and electrical energy generation is
η I I , C M C H P = η I , C M C H P 1 T 26 T 17

2.7. BCHP Plant Exergo-Economic Analysis

This section presents the economic analysis of the proposed BCHPP conducted in this study. It also takes into account the capital cost, maintenance cost, including the equipment cost of the proposed plant, and the cost of the energy streams [23,27,28,34].

2.7.1. Equipment/Components Cost

The cost of the components for the proposed BCHP can be obtained from Table 1. By applying the Chemical Engineering Plant Cost Index (CEPCI), the equipment cost of the proposed plant available in a referenced year can be converted to reflect the present year or period of the research (2020–2023 for the present research). The present equipment cost ( X ˙ k ) can, therefore, be obtained from Equation (96) [35]:
X ˙ k = X ˙ k , r e f × C l p C l r e f
where X ˙ , and X ˙ k , r e f [ U S D ] represent the present and referenced equipment cost, respectively, while C l p and C l r e f [ ] represent the cost index (CI) of the present and referenced period, respectively. The cost index of equipment for the reference year is presented in Table 1, while the cost index for the current period is assumed to be 603 [36].

2.7.2. Energy Streams and Material Cost Rate

Analyzing the energy stream and the material cost rate of the BCHP system is paramount in the exergoeconomic modeling of the plant, which can be obtained by performing a cost balance for the system components, supported by auxiliary equations as shown in Equations (97)–(100) [28,37]:
m C ˙ m , k + C ˙ n , k = C ˙ r , k + i C ˙ i , k + C ˙ k
C ˙ p = c p E x ˙ p
C ˙ n , k = c n W ˙
C ˙ r , k = c r Q ˙
The equipment cost, X k ( U S D ), of the various components of the biomass CHP plant system are expressed in Table 1, whereas the complete auxiliary equations are presented in Table 2.
The equipment cost is given as the cost per unit time, X ˙ k   ( U S D / s ) for the kth component is expressed as follows [36]:
X ˙ k = Z k × C R F × ϑ 3600 N
where ϑ   [ ] , N [—] and C R F [ ] represent maintenance cost factor, operating hr/yr, and capital recovery factor, respectively:
C R F = i ( 1 + i ) n ( 1 + i ) n 1
where i represents the interest rate, and n(yr) represents the system life or operating period.
The Net Cost (NPC) of the BCHPP system is given as
N P C = i 5 C i ; i 1 5 C o m b u s t o r , H e a t e x c h a n g e r , p u m p , e x p a n d e r , O & M
where C (USD) represents cost, and O & M represents the operation and maintenance.
C O & M = C O & M A + j = 2 N ( 1 + k ) j
where C O & M A (USD) represents the operation and maintenance annual cost.
The Annual Life Cycle Cost (ALCC) of the BCHPP system is given as
A L C C = F m , N N P C
where F m , N represents the capital recovery factor [38] and is given as
F m , N = m ( 1 + m ) N ( 1 + m ) N 1
The levelized cost of electricity (LCOE) is given as
L C O E = A L C C W ˙ n e t , e l e c   ×   C f
The break-even point [years] is given as
B E P = C I C W ˙ n e t , e l e c   ×   C f   ×   U E C

2.7.3. Biomass Plant System Analysis

The analysis of the proposed BCHPP carried out in this study is in line with that of [23,27,28,39]. The analysis covers economic, environmental, and sustainability analysis, as explained below.
Economic Analysis
This part handles the life cycle cost, X L C C [ U S D ] , annualized life cycle cost, X A L C C [USD/year], unit cost of energy, X U C O E   [USD/Wh], and the break-even point, X B E P   y e a r , which is presented mathematically in Equations (109)–(112).
The life cycle cost, X L C C [ U S D ] is given in Equation (78) as
X L C C = X i i ( X G , X E Q , X E C )
where X G ,   X E Q ,   a n d   X E C represent the gasifier cost, total BCHPP equipment cost, and engineering contingency cost, respectively.
The annualized life cycle cost, X A L C C , is given in Equation (110) as
X A L C C = X L C C × C R F
where C R F represent capital recovery factor fixed at 0.1337878 [—].
The unit cost of energy is given in Equation (111) as
X U C O E = X A L C C 365 × X D P
where X D P represents daily energy production, given by
X D P = 24 × W ˙ n e t , B C H P P
where W ˙ n e t ,   B C H P P represents the network of the combined biomass heat- and power-generating plant.
The break-even point is presented in Equation (113) as
B E P = X L C C X U C O E × X A P
where X A P represents annual energy production, given as
X A P = 365 × X D P
Environmental Analysis
The environmental impact of the proposed biomass CHP plant is analyzed by considering the amount of carbon dioxide ( C O 2 ) and carbon monoxide (CO) emitted. The amount of gaseous pollutant during the process of thermal power generation, as proposed by Oyedepo et al. [38], is a function of three major factors, namely, the adiabatic flame temperature ( T f ), the pressure drop in the combustor ( P c c ), and the retention time (t).
The amount of C O 2 , n ˙ C O 2   [ k g / s ] released and the specific emission of C O 2 , E C O 2 [kg/kWh] of the system are given as [28]
n ˙ C O 2 = y C O 2 × m ˙ g M ¯ C O 2 M ¯ g
E C O 2 = 3600 n ˙ C O 2 W ˙ n e t , B C H P P
The amount of C O , n ˙ C O [ kg / s ] is [40]
n ˙ C O = 1.79 × 10 2 × e 7800 T f P 2 2 × t × P c c P 2 0.5
where τ represents residence time, which is a constant and is assumed as 0.002 s [39], and T f represents the flame temperature (that is, T 3 for the proposed plant).
The amount of N O x , n ˙ N O x   [ k g / s ] released is given as [28]
n ˙ N O x = 1.5 × 10 15 × τ 0.5 × e 71 , 100 T f P 2 0.05 × t × P c c P 2 0.5
The fuel harmful emission factor, f H E F is therefore presented as [28]
f H E F = n ˙ C O 2 + n ˙ C O + n ˙ N O x m g
Environmental-thermal conservation factor f E C F and environmental-thermal impact factor f E I F , which are expected to have high and low values, respectively, are given as
f E C F = T 0 T 29
f E I F = 1 f E C F
where T 0 and T 29 represents the ambient temperature and exit flue gas temperature, respectively, of the system.
Sustainability Analysis
The parameters considered in this section include the following: sustainability index,   S I [—]; environmental sustainability exponent, S E n v [—]; energo-economical sustainability exponent, S E c o [—]; and sustainability exponent, S E [—].
Sustainability index, S I [v], evaluates the sustainability of the BCHP plant with regard to the biomass residue (fuel) resource; environmental sustainability exponent, S E n v [—], evaluates the process effectiveness and fuel utilization; and the energo-economical sustainability exponent, S E c o [—], evaluates the effectiveness of the energy conversion processes and their economic impact with respect to cost.
The sustainability index and the other exponents are expressed in Equations (122)–(125) as
S I = 1 1 η I I , B C H P
S E n v = η c c × f E C F × E x ˙ i n × W ˙ n e t , B C H P f H E F × h × E x ˙ d , B C H P
S E c o = I p c × E D T × A R E p c × P D T × X U C O E × X A L C C
S E = S E n v × S E c o
where η c c ,   f E C F   ,   E x ˙ i n ,   W ˙ n e t ,   B C H P ,   f H E F ,   h   , and E x ˙ d ,   B C H P represent the efficiency of the combustor, environmental-thermal conservation factor, fuel exergy input, net power of the plant, fuel harmful-emission factor, enthalpy rise, and exergy destroyed in the system, respectively. I p c   [ U S D / p e r s o n ] ,   E D T   [ y r ] ,   A R U S D y r , E p c   k W h p e r s o n ,   P D T [ y r ] ,   X U C O E [ U S D /kWh], and X A L C C   [ U S D ] represent income per capita, energy doubling time, annual revenue, energy per capita, population doubling time, unit cost of energy, and annualized life cycle cost, respectively.
The annual revenue, A R can be expressed as
A R = t   ×   W ˙ n e t , B C H P × N
where t [ U S D / k W h ] , W ˙ n e t ,   B C H P M W , and N [hr] represent tariff cost of biomass residue electricity, net power, and operating hours per year, respectively.
Table 1. Equipment cost of BCHP components.
System ComponentSymbol Equipment   Cos t   [ U S D ] Ref. Year C l r e f
Gasifier X G 2.9 × 10 6 ( 3.6 m ˙ w ) 0.7 1994368
Compressor X C 71.1 m ˙ w f 0.9 η c × r p I n ( r p ) 1994368
Combustor X C C   48.64 m ˙ a ( 0.995 P 3 P 2 × { 1 + exp 0.018 T 3 26.4 } 2011468
Gas turbine (micro) X G T 479.34 m ˙ a 0.92 η G T I n P i n P o u t × { 1 + exp 0.036 T i n 54.4 } 1994368
HRSG X H R S G , i     ( i = H P ,   L P ) 4745 h 3 l o g ( T i n T o u t ) + 11 , 520 m ˙ s + 658 m ˙ s 1.2 1998382
Steam turbine X S G , i     ( i = H P ,   L P ) 6000 ( W ˙ s T ) 0.71 1998382
Heat exchanger X H X , i     ( i = H G C 1 ,   H G C 2 ) 130 A H X 0.093 0.78 2011468
Pump X P , i     i = 1 , 2 , 3 , 4 3540 ( W ˙ P ) 0.71 1998382
Evaporator X E 130 × A E 0.093 0.78 2000394
Condenser X C O N D 1773 m ˙ w f 2000394
where m ˙ w f (kg/s) represents the mass flow rate of the working fluid. Source: [23,27,36,40].
Table 2. Thermodynamic cost balance and auxiliary equation of the GT_DST_CORC system.
Component SymbolCost Rate Balance
Compressor C ˙ c c 2 E x ˙ 2 = c 1 E x ˙ 1 + c C W ˙ C + X ˙ C
Syngas Storage C ˙ s y n g a s C ˙ 2 , f = c f E x ˙ 2
Combustion Chamber C ˙ c c c 3 E x ˙ 3 = c 2 E x ˙ 2 + c f E x ˙ 2 , f + X ˙ C C
c ˙ 3 = c ˙ 2 + c ˙ f
Gas Turbine C ˙ G T c 4 E x ˙ 4 + c G T W ˙ G T = c 3 E x ˙ 3 + X ˙ G T
HP-HRSG C ˙ H P _ H R S G c 5 E x ˙ 5 + c 6 E x ˙ 6 = c 4 E x ˙ 4 + c 13 E x ˙ 13 + X ˙ H P H R S G
LP-HRSG C ˙ L P H R S G c 14 E x ˙ 14 + c 8 E x ˙ 8 = c 5 E x ˙ 5 + c 12 b E x ˙ 12 b + X ˙ L P H R S G
HP Steam Turbine (HPST) C ˙ H P S T c 7 E x ˙ 7 + c ˙ H P S T W ˙ H P S T = c ˙ 6 E x ˙ 6 + X ˙ H P S T
LP Steam Turbine (LPST) C ˙ L P S T c 10 E x ˙ 10 + c L P S T W ˙ L P S T = c 9 E x ˙ 9 + X ˙ l P S T
HGC 1 (HXX 1) C ˙ H G C 1 c 11 E x ˙ 11 + c 16 E x ˙ 16 = c 10 E x ˙ 10 + c 15 E x ˙ 15 + X ˙ H G C 1
LP-Pump (pump 2) C ˙ L P P c 12 E x ˙ 12 = c 11 E x ˙ 11 + c L P P W ˙ P 2 + X ˙ L L P
HP Pump (pump1) C ˙ H P P c 13 E x ˙ 13 = c 12 a E x ˙ 12 a + c H P P W ˙ P 1 + X ˙ H L P
HRORCG C ˙ H R O R C c 17 E x ˙ 17 + c 21 E x ˙ 21 = c 14 E x ˙ 14 + c 20 E x ˙ 20 + X ˙ H R O R C
ORC Steam Turbine 1 C ˙ O R C S T 1 c 18 E x ˙ 18 + c O R C S T 1 W ˙ O R C S T 1 = c 17 E x ˙ 17 + X ˙ O R C S T 1
ORC Steam Turbine 2 C ˙ O R C S T 2 c 23 E x ˙ 23 + c O R C S T 2 W ˙ O R C S T 2 = c 22 E x ˙ 22 + X ˙ O R C S T 2
Evaporator–Condenser Unit C ˙ C E c 22 E x ˙ 22 + c 19 E x ˙ 19 = c 18 E x ˙ 18 + c 25 E x ˙ 25 + X ˙ C E
ORC Pump 3 (P-3) C ˙ P 3 c 20 E x ˙ 20 = c 19 E x ˙ 19 + c P 3 W ˙ P 3 + X ˙ P 3
ORC Pump 4 (P-4) C ˙ P 4 c 25 E x ˙ 25 = c 24 E x ˙ 24 + c P 4 W ˙ P 4 + X ˙ P 4
ORC Condenser C ˙ C O N D c 24 E x ˙ 24 + c 30 E x ˙ 30 = c 23 E x ˙ 23 + c 26 E x ˙ 26 + X ˙ C O N D
HGC 2 C ˙ H G C 2 c 29 E x ˙ 29 + c 28 E x ˙ 28 = c 21 E x ˙ 21 + c 27 E x ˙ 27 + X ˙ H G C 2
where c ( U S D / MWs ) represents the cost per energy unit and E x ˙ represents exergy ( kW ). Source: [23,27,35,40].

3. Results and Discussions

The results of the crop and forest classification analysis and the simulations of relevant parameters of agricultural (crop and forest) residues for the combined heat and power plant system are presented here. The input parameters, exergo-economic, environmental, and sustainability data of the combined gas turbine (GT), dual steam turbine (DST), and cascade organic Rankine cycle (CORC) system for combined heat and power (CHP) are presented in Table 3 and Table 4. The output data, which include the residue and energy content, plant thermodynamic characteristics, as well as the economic, environmental, and sustainability results, are presented in Table 5, Table 6, Table 7, Table 8 and Table 9.
Table 3. Input parameters for the BCHP plant system.
ComponentsParameterSymbolsValuesUnits
BCHP SystemInitial Parameter
Mass flow of residue m ˙ 23.70kg/s
Temperature of biomassT27.00°C
Initial pressure of residueP101.33kPa
Gasifier temperature T g 677.00°C
Design parameter
Ambient temperatureT127.00C
Ambient pressureP1101.33kPa
Compressor efficiency η c 85.00%
Combustor efficiency η c c 85.00%
Turbine efficiency η t , i 85.00%
Pump efficiency η p 90.00%
Syngas composition (higher heating value (HHV) of syngas)
Methane gas H H V C H 4 55.53MJ/kg
Hydrogen gas H H V H 2 141.80MJ/kg
Carbon (II) oxide H H V C O 10.10MJ/kg
Chemical exergy of syngas components
Methane gas e x ¯ C H 4 831.70kJ/mol
Hydrogen gas e x ¯ H 2 236.10kJ/mol
Carbon (II) oxide e x ¯ C O 275.10kJ/mol
Carbon (IV) oxide e x ¯ C O 2 19.87kJ/mol
Nitrogen gas e x ¯ N 2 0.72kJ/mol
Steam e x ¯ H 2 O 9.50kJ/mol
GT CycleDesign condition
Air inlet temperature T i 10.00°C
Pressure ratio r p 11.50
Temperature ratio r t 10.00
Syngas temperature T s y n g a s 677.00°C
ST CycleDesign condition
HP-HRSG pressure P H P 15,000Kpa
LP-HRSG pressure P L P 7500Kpa
HP-Pump mass flow rate m ˙ H P P 18m/s
LP-Pump mass flow rate m ˙ L P P 51m/s
HP-HRSG efficiency η H P _ H R S G 85%
LP-HRSG efficiency η L P _ H R S G 85%
ORCDesign condition
ORC-HRSG pressure P O R C _ H R S G 1500Kpa
ORC-Condenser pressure P O R C _ C O N D 465Kpa
Source: [23,27,40].
Table 4. Economic data of the BCHP plant system.
ParameterSymbolValueUnit
Fuel cost per energy unit c f 0.004 U S D / M W s
Engineering/contingency cost X E C C 0.150%
Interest rate i r 0.120
Operating h/yearN8760.000h
Maintenance factor ϑ 1.100
System lifespanN20.000yr
Sources: [23,27,35,39,40]
Environmental Data
ParameterSymbolValueUnitReference
Cost of CO2 emission X C O 2 3.50000 U S D / k g [40]
Cost of CO emission X C O 0.02086 U S D / k g [40]
Cost of NOx emission X N O x 6.85300 U S D / k g [41]
Sustainability Data
ParameterSymbolValueUnit
Income per capita I p c 2177.00 U S D / p e r s o n
Energy doubling time E D T   22.00yr
Energy per capita E p c 141.00 k W h / p e r s o n
Population doubling time P D T 25.00yr
Electricity tariff t 0.17 U S D /kWh
Source: [27,40].

3.1. Result of Crop and Forest Analysis

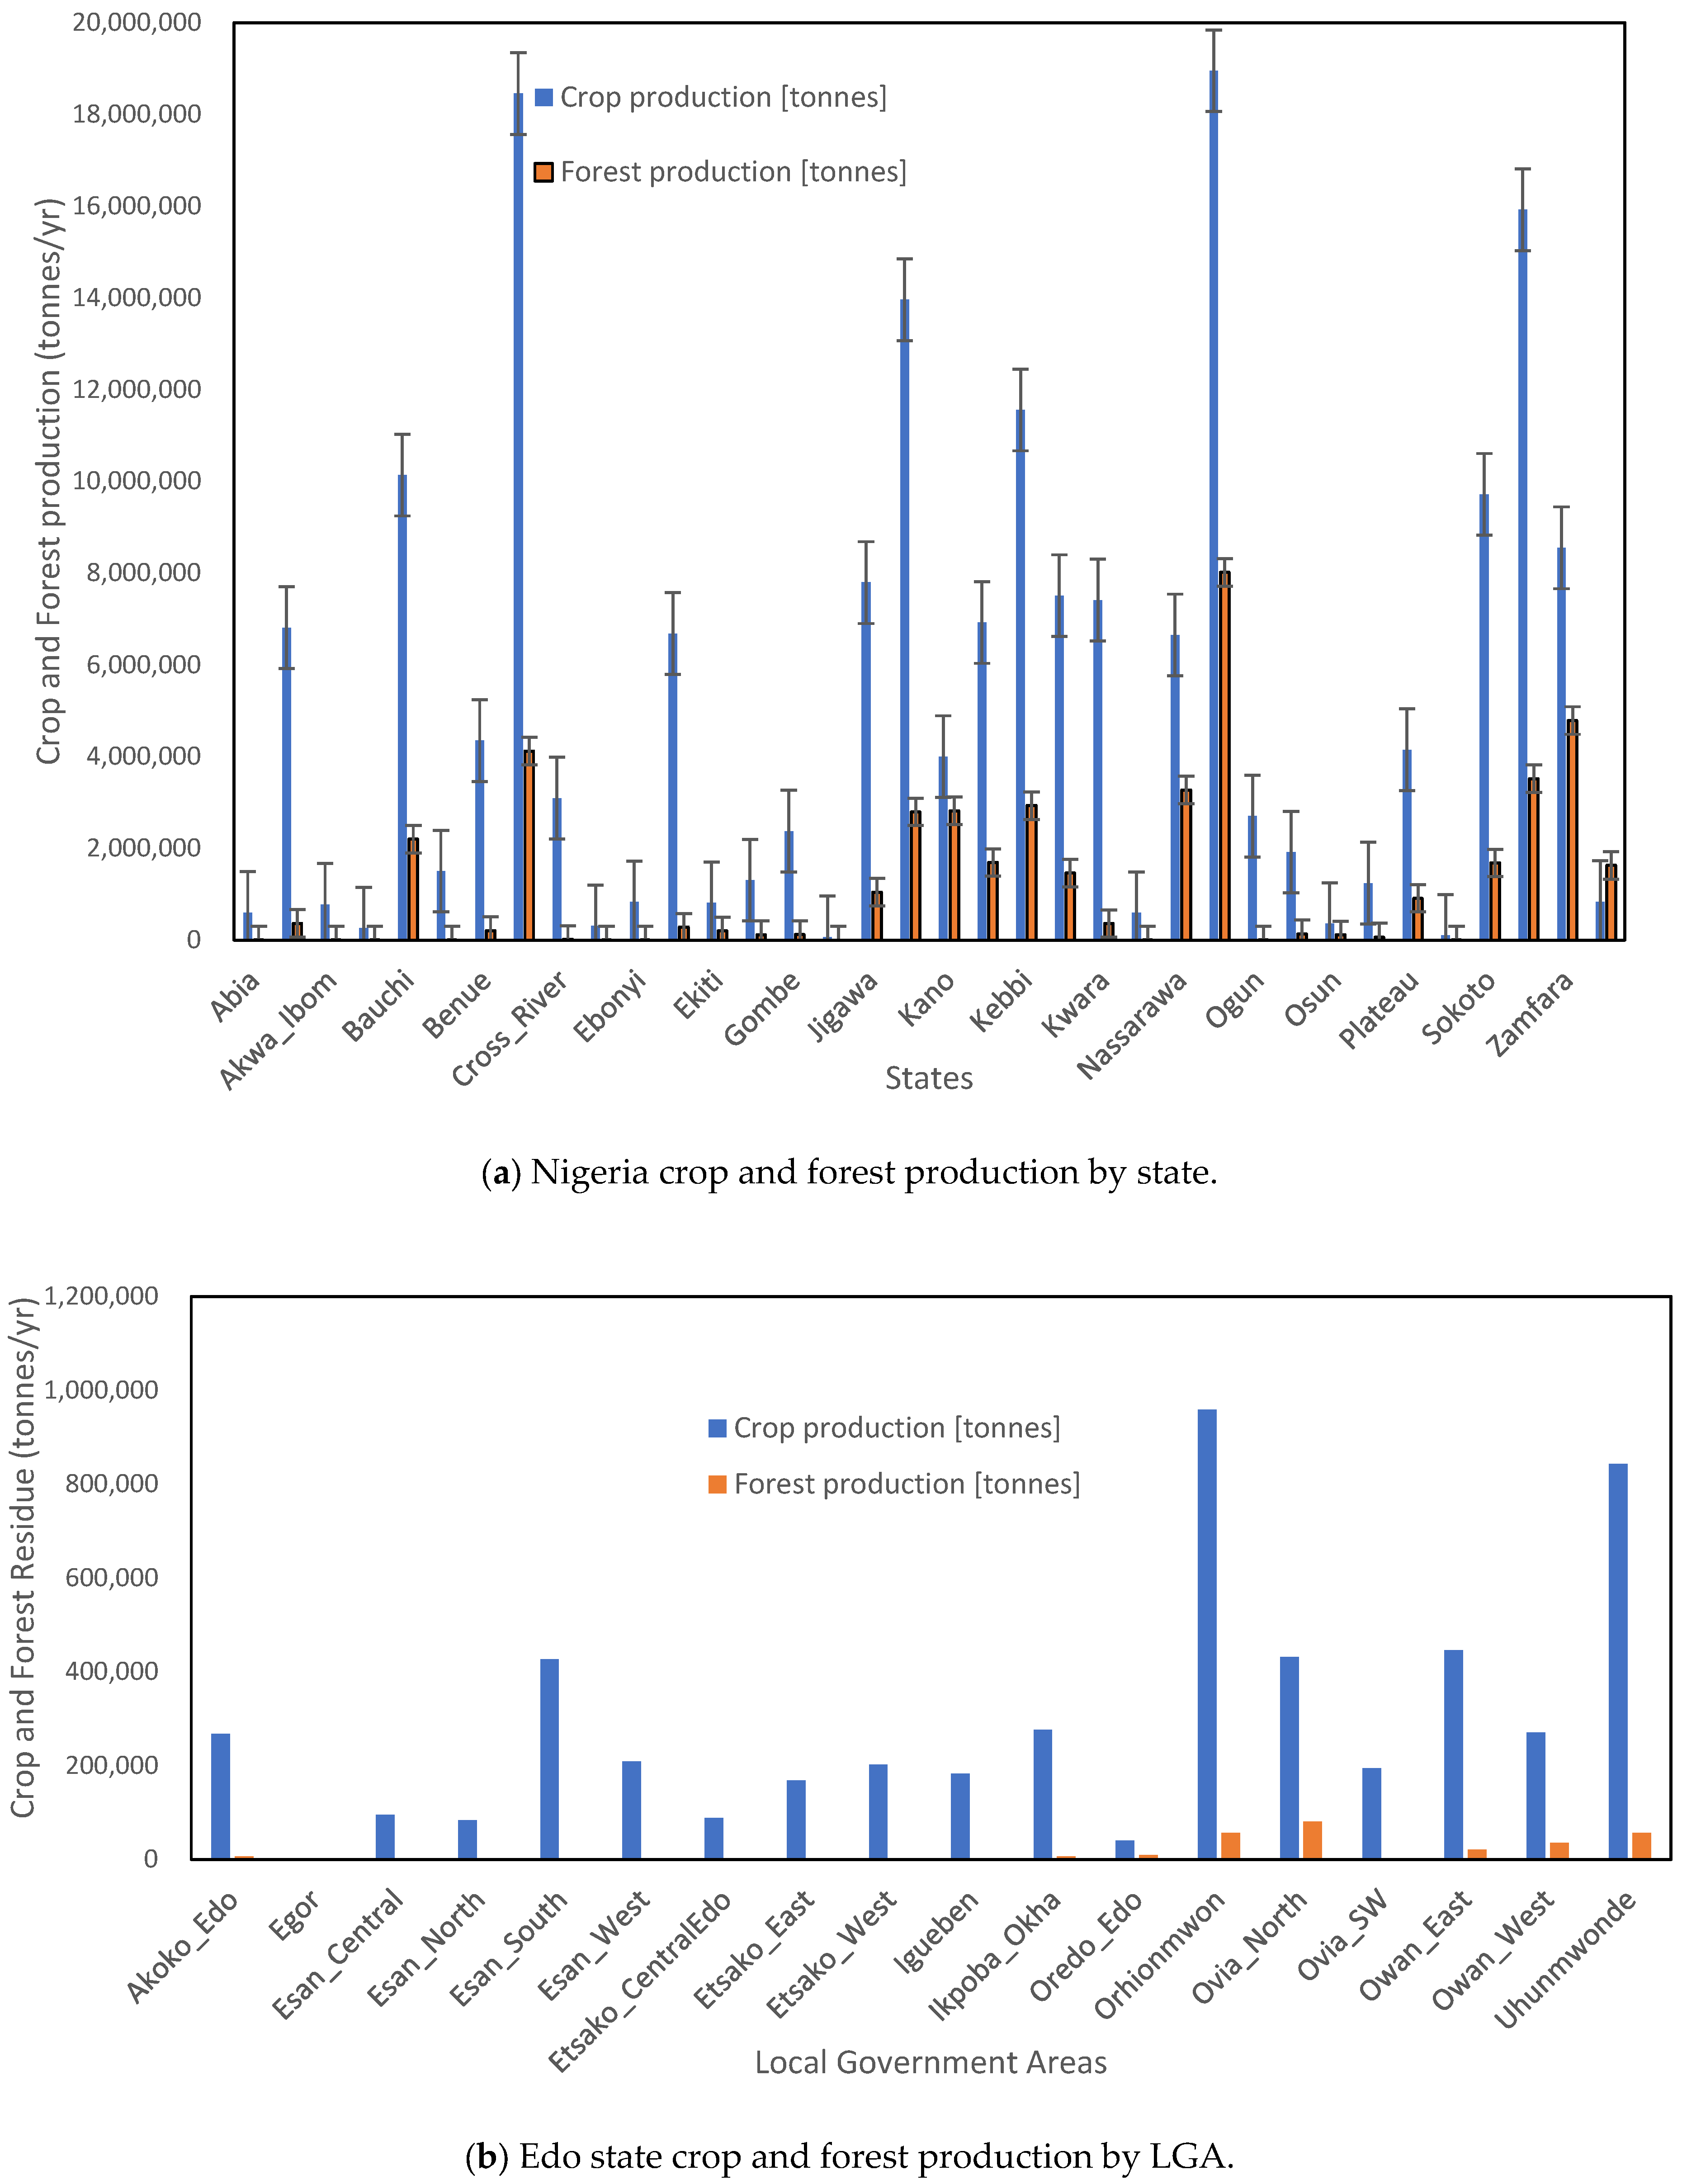
The crop and forest classifications of Nigeria and Edo State are presented in Figure 2. From the analysis performed on the ArcGIS platform, the crop and forest production data of Nigeria by states were obtained and are presented in Figure 3, based on 2019 and 2020 crop and forest production from FAO [13]. Edo state has the highest crop and forest production in the South-South geopolitical zone (comprising Rivers, Cross River, Bayelsa, Akwa-Ibom, Delta, and Edo state)—which is the zone of interest for biomass in the present research. The analysis of the proposed biomass plant was streamlined to a Local Government Area (LGA) in Edo State. The bar chart of crop and forest production by the local government in Edo state is presented in Figure 3. Orhionmwon LGA features the highest crop production and is the third-highest forest-resource-producing LGA. Orhionmwon LGA has also been identified as one of the optimal locations for a biomass plant in Edo State, Nigeria, as demonstrated by Ukoba et al. [7]. The proposed biomass CHP plant analysis is, therefore, performed for a site in Orhionmwon LGA, Edo state, Nigeria.
Table 5 presents the composition and energy content of the agricultural residues. The molecular formula of the biomass residue is presented as C 3.36 H 6.93 N 0.05 O 3 , following the procedures of Chandrappa & Das [42]. The higher heating value (HHV) of the biomass residue, the HHV of syngas, and the lower heating value (LHV) of syngas produced were obtained as 444.75, 30.47, and 17.15 [MJ/kg], respectively, which align with the values presented in refs [41,43].
Table 5. Analysis of Edo biomass residue composition and energy content of the produced syngas.
ResidueCompositionAshMC
CHONS
Crop40.097.3142.191.130.678.118.79
Forest48.975.9144.170.180.020.762.44
Moisture0.001.229.980.000.00
Total89.0614.4496.341.310.698.8711.23
Composition of elements (percentage by mass)
ElementMass (kg)Percentage (%)
Carbon89.0644.0
Hydrogen14.447.0
Oxygen96.3448.0
Nitrogen1.310.7
Sulfur0.690.3
Molecular formula of biomass residue: C 3.36 H 6.93 N 0.05 O 3
Energy content of biomass (crop and forest) residue and syngas
ParameterSymbolValueUnit
Higher heating value of residue H H V   r e s i d u e 444.75MJ/kg
Higher heating value of syngas H H V   s y n g a s 30.47MJ/kg
Lower heating value of Syngas L H V   b i o m _ r e s 17.15MJ/kg
Methane gas y C H 4 5.20%
Hydrogen gas y H 2 18.24%
Carbon (II) oxide y C O 17.00%
Carbon (IV) oxide y C O 2 12.77%
Nitrogen gas y N 2 35.36%
Steam y H 2 O 11.43%

3.2. Model Validation

Validation of the proposed GT-DST-CORC plant model was performed using biomass (crop and forest) compositions of 44% carbon, 7% hydrogen, 48% oxygen, 0.7% nitrogen, 0.3% sulfur, 11.23% moisture content, and a gasification temperature of 800 °C. The result obtained was compared with that of Ogorure et al. [27], Oko & Nwachukwu [23], Owebor et al. [39], and Odukoya et al. [44], operating under similar conditions, as presented in Table 6. According to Table 6, the results obtained by the current model fairly agree with those in the open domain. The disparity that exists may be attributed to the hypothesis of the equilibrium reaction and other assumptions. To validate the current model, the input data of Minutillo et al. [45] and Owebor et al. [39], whose compositions of methane (CH4), hydrogen (H), carbon dioxide (CO2), nitrogen (N), and other gases were 2.5%, 16%, 19.4%, 12.2%, 49.6%, 0.1%, 14.48%, 21.73%, 8.76%, and 49.24%, respectively, were compared. The result of their performance and relative errors (%), and the biomass composition of the current model, compared to those in the literature, are also presented in Table 6.
Table 6. Model validation.
Gasification Constituent Comparison
ParameterCurrent ModelLiterature [46]Error (%)Literature [28]Error (%)
Methane gas, y C H 4 ( % ) 5.202.5107.960.10b A.H
Hydrogen gas, y H 2 ( % ) 18.2416.014.0014.4825.97
Carbon (II) oxide, y C O (%)17.0019.412.3721.7321.77
Carbon (IV) oxide, y C O 2 (%)12.7712.24.678.7645.78
Nitrogen gas, y N 2 (%)35.3649.628.7149.2428.19
Steam, y H 2 O (%)11.43N.AN.A5.46b A.H
System Comparison
ParameterLiteratureCurrent Model
Energy efficiency (%)a 63.62; b 60.10; c 62.30; d 82.40 *62.94 (GT cycle)
87.16 ** (Integrated plant cycle)
UCOE (USD/kWh)a 0.0109; b 0.0100; c 0.0180 0.0066
Break-even point (years)a, c 7.5; b 9.07.5
CO2 emission (kg/MWh)a 141.20 c 148.22; b N.A141.73
Fuel harmful emission factor (-)a 0.01853; c 0.00090 b N.A0.16340
Sustainability index, S I (-)a 2.4300; c 2.2500; b N.A2.0121
Source: a [27]; b [23]; c [28]; d [44]; b N.A: Not available; b A.H: Above 100%. * Coal-fired combined-cycle with Kalina-cycle-cogeneration plant; ** GT-DST-CORC.

3.3. Thermodynamic Performance of the BCHP Plant System

The thermodynamic conditions, including the mass flow rate, pressure, temperature, the cost rate of stream energy, and the unit cost of stream exergy of the biomass GT-DST-CORC CHP plant, are presented in Table 8. Syngas was utilized in the integrated GT, DST, and CORC power plants for combined heat and power (CHP) generation. The net power of the BCHPP was 2911 MW of electricity, with a greater proportion obtained from the GTU, as presented in Table 8. The total exergy destroyed was obtained as 6480 [MW], the net heat generated was obtained as 3370.41 [MW], and the exit temperature of the flue gas was 74 °C. The combined GT, DST, and CORC thermal efficiency (87.16%) obtained in the current model is relatively higher compared to the 82.4% obtained by Odukoye et al. [44], but lower in terms of exergy efficiency (50.30%) compared to 72.2% in a coal-fired combined cycle with a Kalina-cycle cogeneration plant [47]. The variation could be attributed to differences in the HHV of the fuel utilized and the type of cycles employed in the different studies. As shown in Table 8, the largest exergy destroyed is seen in the combustion chamber, featuring about 33% of the total exergy destroyed, followed by the HRSG with about 26% of the total, which are comparable to the works of Odukoye et al. [44], Haseli et al. [47], and Owebor et al. [39]. The high exergy destruction in these components can be attributed to the rapid and high temperature drop in the components.

3.4. Exergo-Economic, Environmental, and Sustainability Results of the BCHP Plant

The exergo-economic, exergo-environmental, and sustainability analyses of the BCHP plant were conducted, with the results displayed in Table 9. The annualized LLC of the BCHP was estimated at USD 193.4 million, compared to USD 227.8 million and USD 320 million in the studies by Owebor et al. [39] and Jack and Oko [46], respectively. The unit cost of energy (UCOE) of the proposed plant was obtained as 0.0076 USD/kWh, which is relatively lower than that of Owebor et al. [39], Ogorure et al. [27], and Oko and Nwachukwu [23], whose average value stood at 0.01 USD/kWh. Moreso, the break-even point of the system was obtained as 7.5 years, which is similar to the work of Owebor et al. [39], Ogorure et al. [27], and Oko and Nwachukwu [23]. The relatively low cost seen in this study could be due to the better utilization of the primary energy resources in the present work.
The environmental assessment results presented in Table 9 show that the specific emissions of CO2, CO, and NOx were 141.73 [kg/MWh], 5.7 × 10⁻⁶ [kg/s], and 2.3 × 10⁻⁷ [kg/s], respectively. The specific emissions of CO2 obtained in this work are lower than those of Owebor et al. [39] at 148.22 kg/MWh, but slightly higher than the value of Ogorure et al. [27] at 141.2 kg/MWh. Also, the fuel harmful emission factor, environmental-thermal conversion factor, and environmental impact factor were obtained as 0.163, 0.86, and 0.14 [–], respectively, while the costs of CO2, CO, and NOx emissions were obtained as 111.42, 1.19, and 1.58 U S D /kg, respectively.
The sustainability index, energo-environmental sustainability, energo-economic sustainability, and sustainability exponent were estimated at 2.01, 5.62, 0.70, and 3.91 [–], respectively, as shown in Table 9.
Thermodynamic Results
Table 7. State conditions for the combined biomass GT-DST-CORC CHP plant.
State Mass Flow Rate, m ˙ [kg/s]Pressure
[Kpa]
Temperature [k]Cost Rate of Energy Stream [USD/s]Unit Cost of Exergy of Stream [USD/MWs]
1171.1101.3283.00.0000.000000
2171.11165.0619.40.0000.000000
2a23.7101.3300.02.3150.004000
3194.81107.01473.036.3920.004000
4194.8114.01027.020.9160.004000
5194.8111.7662.813.8920.004000
618.014700.0968.80.6010.001043
718.0114.0675.30.2610.001043
851.07350.0651.73.3350.002957
969.07350.0657.86.1520.004000
1069.070.0458.52.4880.004000
1169.068.6362.60.2650.004000
12a18.07500.0563.70.4890.001043
12b51.07500.0563.71.3870.002957
1318.015,000.0790.00.4970.001043
14194.8109.5585.012.7240.004000
1569.0101.3300.00.0000.000000
1669.099.3445.80.0000.000000
1768.01470.0379.91.7940.004000
1868.0465.0344.31.0450.004000
1968.0455.7332.70.380.004000
2068.01500.0333.30.4110.004000
21194.8107.3394.29.8750.004000
2268.01470.0379.91.7940.004000
2368.0465.0344.31.0450.004000
2468.0455.7332.70.380.004000
2568.01500333.30.4110.004000
2669.0101.3300.00.0000.000000
2769.099.3343.50.0000.000000
2869.097.31372.30.0000.000000
29194.8105.2347.29.1740.004000
3069.099.3343.50.0000.000000
Table 8. Thermo-economics and thermodynamic characteristics of the BCHPP (GT-DST-CORC-CHP) system.
Thermo-Economics Results
ComponentXk [MUSD] X ˙ k  [USD/s] C ˙ D , k  [USD/s]fk [%]
Compressor11.1964600.0522850.0068188.47171
Combustion Chamber0.5752980.0026871.485320.18054
Gas Turbine6.2282690.0290850.381887.07721
HP-HRSG517.2000002.41521812.1698416.55953
LP-HRSG165.3000000.77191711.159516.46961
HP Steam Turbine (HPST)44.6883000.2086850.4621031.11061
LP Steam Turbine (LPST)68.2558100.3187417.267634.20149
HGC 10.0009410.0000040.276030.00159
LP-Pump (pump 2)111.7760000.5219710.0003699.96167
HP Pump (pump1)111.7760000.5219710.0008099.84683
HRORCG4.6270000.0216072.595720.82554
ORC Steam Turbine 158.7700000.2744440.1577363.50367
ORC Steam Turbine 258.7700000.2744440.1577363.50367
Evaporator–Condenser Unit0.1845730.0008620.017424.71368
ORC Pump 3 (P-3)2.0040000.0093580.0086651.94638
ORC Pump 4 (P-4)2.0040000.0093580.0020382.16418
ORC Condenser0.1845730.0008620.107980.79192
HGC 2 0.0224000.0001054.588230.00001
Total1163.5640005.43360440.8457834.51832
Thermodynamic Characteristics of System Components
ComponentHeat/Work, Q ˙ k / W ˙ k ) [MW]Input Exergy, E x ˙ i n  [MW]Exergy Destroyed, E x ˙ d  [MW]Exergy Efficiency, η I I  [%]
Compressor1673.001674218.062
Combustion Chamber3340.0011,2432143.081
Gas Turbine3776.00910093.098
HP-HRSG2853.0052301660.057
LP-HRSG609.983470490.023
HP Steam Turbine (HPST)177.13576149.054
LP Steam Turbine (LPST)324.401540592.035
HGC 13367.00622341.057
LP-Pump (pump 2)1143.00660.635
HP Pump (pump1)2581.004693.930
HRORCG1799.003180367.049
ORC Steam Turbine 1162.2444825.087
ORC Steam Turbine 2 162.2444825.087
Evaporator–Condenser1799.0026130.048
ORC Pump 3 (P-3)8.54950.891
ORC Pump 4 (P-4)8.54950.891
ORC Condenser3074.00261170.046
HGC 23.41226171.023
Thermodynamic Characteristics of BCHP Plant Configurations
ConfigurationParameterSymbolValueUnit
GT_DST_CORCNet power W ˙ G T _ D S T _ C O R C 2911.00MW
Net heat Q ˙ G T _ D S T _ C O R C 3370.41MW
Thermal Efficiency η G T _ D S T _ C O R C , I 87.16%
Exergy efficiency η G T _ D S T _ C O R C , I I 50.30%
Exergy destroyed E x ˙ D , B C H P P 6480.00MW
Flare gas temperature T s t a c k ,   e x i t 74.20°C
Table 9. Exergo-economic, environmental, and sustainability results of BCHP plant.
Exergo-Economic Result
ParameterSymbolValueUnit
Gasification unit cost X G 106.803100M USD
Combine BCHP plant equipment cost X G T D S T C O R C 1163.563600M USD
Engineering and contingency cost X E C C 174.534500M USD
Life cycle cost X L C C 1444.901200M USD
Daily energy production cost X D E P 69,864.000000MWh/d
Annualized energy production cost X A E P 25,500,360.000000MWh/d
Annualized LCC X A L C C 193.441600M   U S D /year
Unit cost of energy X U C O E 0.007587 U S D /kWh
Breakeven pointBEP7.500000Year
Environmental Result
Amount of CO2 n ˙ C O 2 31.8338kg/s
Specific emission of CO2 E C O 2 141.7267kg/MWh
Amount of CO n ˙ C O 5.702 × 10⁻⁶kg/s
Amount of NOx n ˙ N O x 2.301 × 10⁻⁷kg/s
Fuel harmful emission factor f H E F   0.1634
Environmental-thermal conversion factor f E C F 0.8641
Environmental thermal impact factor f E I F 0.1359
Cost of CO2 X C O 2 111.4184 U S D /kg
Cost of CO X C O 1.189 × 10⁻⁷USD/kg
Cost of NOx X N O x 1.577 × 10⁻⁶USD/kg
Sustainability Result
Sustainability index S I 2.0121
Energo-environmental sustainability S E n v 5.6206
Energo-economic sustainability S E c o 0.6952
Sustainability exponent S E 3.9073

3.5. Simulation

Key parameters, such as equipment cost, interest rate, mass flow rate of biomass residue (feed), combustion temperature, pressure ratio, temperature ratio, and flue gas temperature, were varied to determine how they influence the performance of the BCHP plant system and its sustainability.

3.5.1. Effect of Equipment Cost

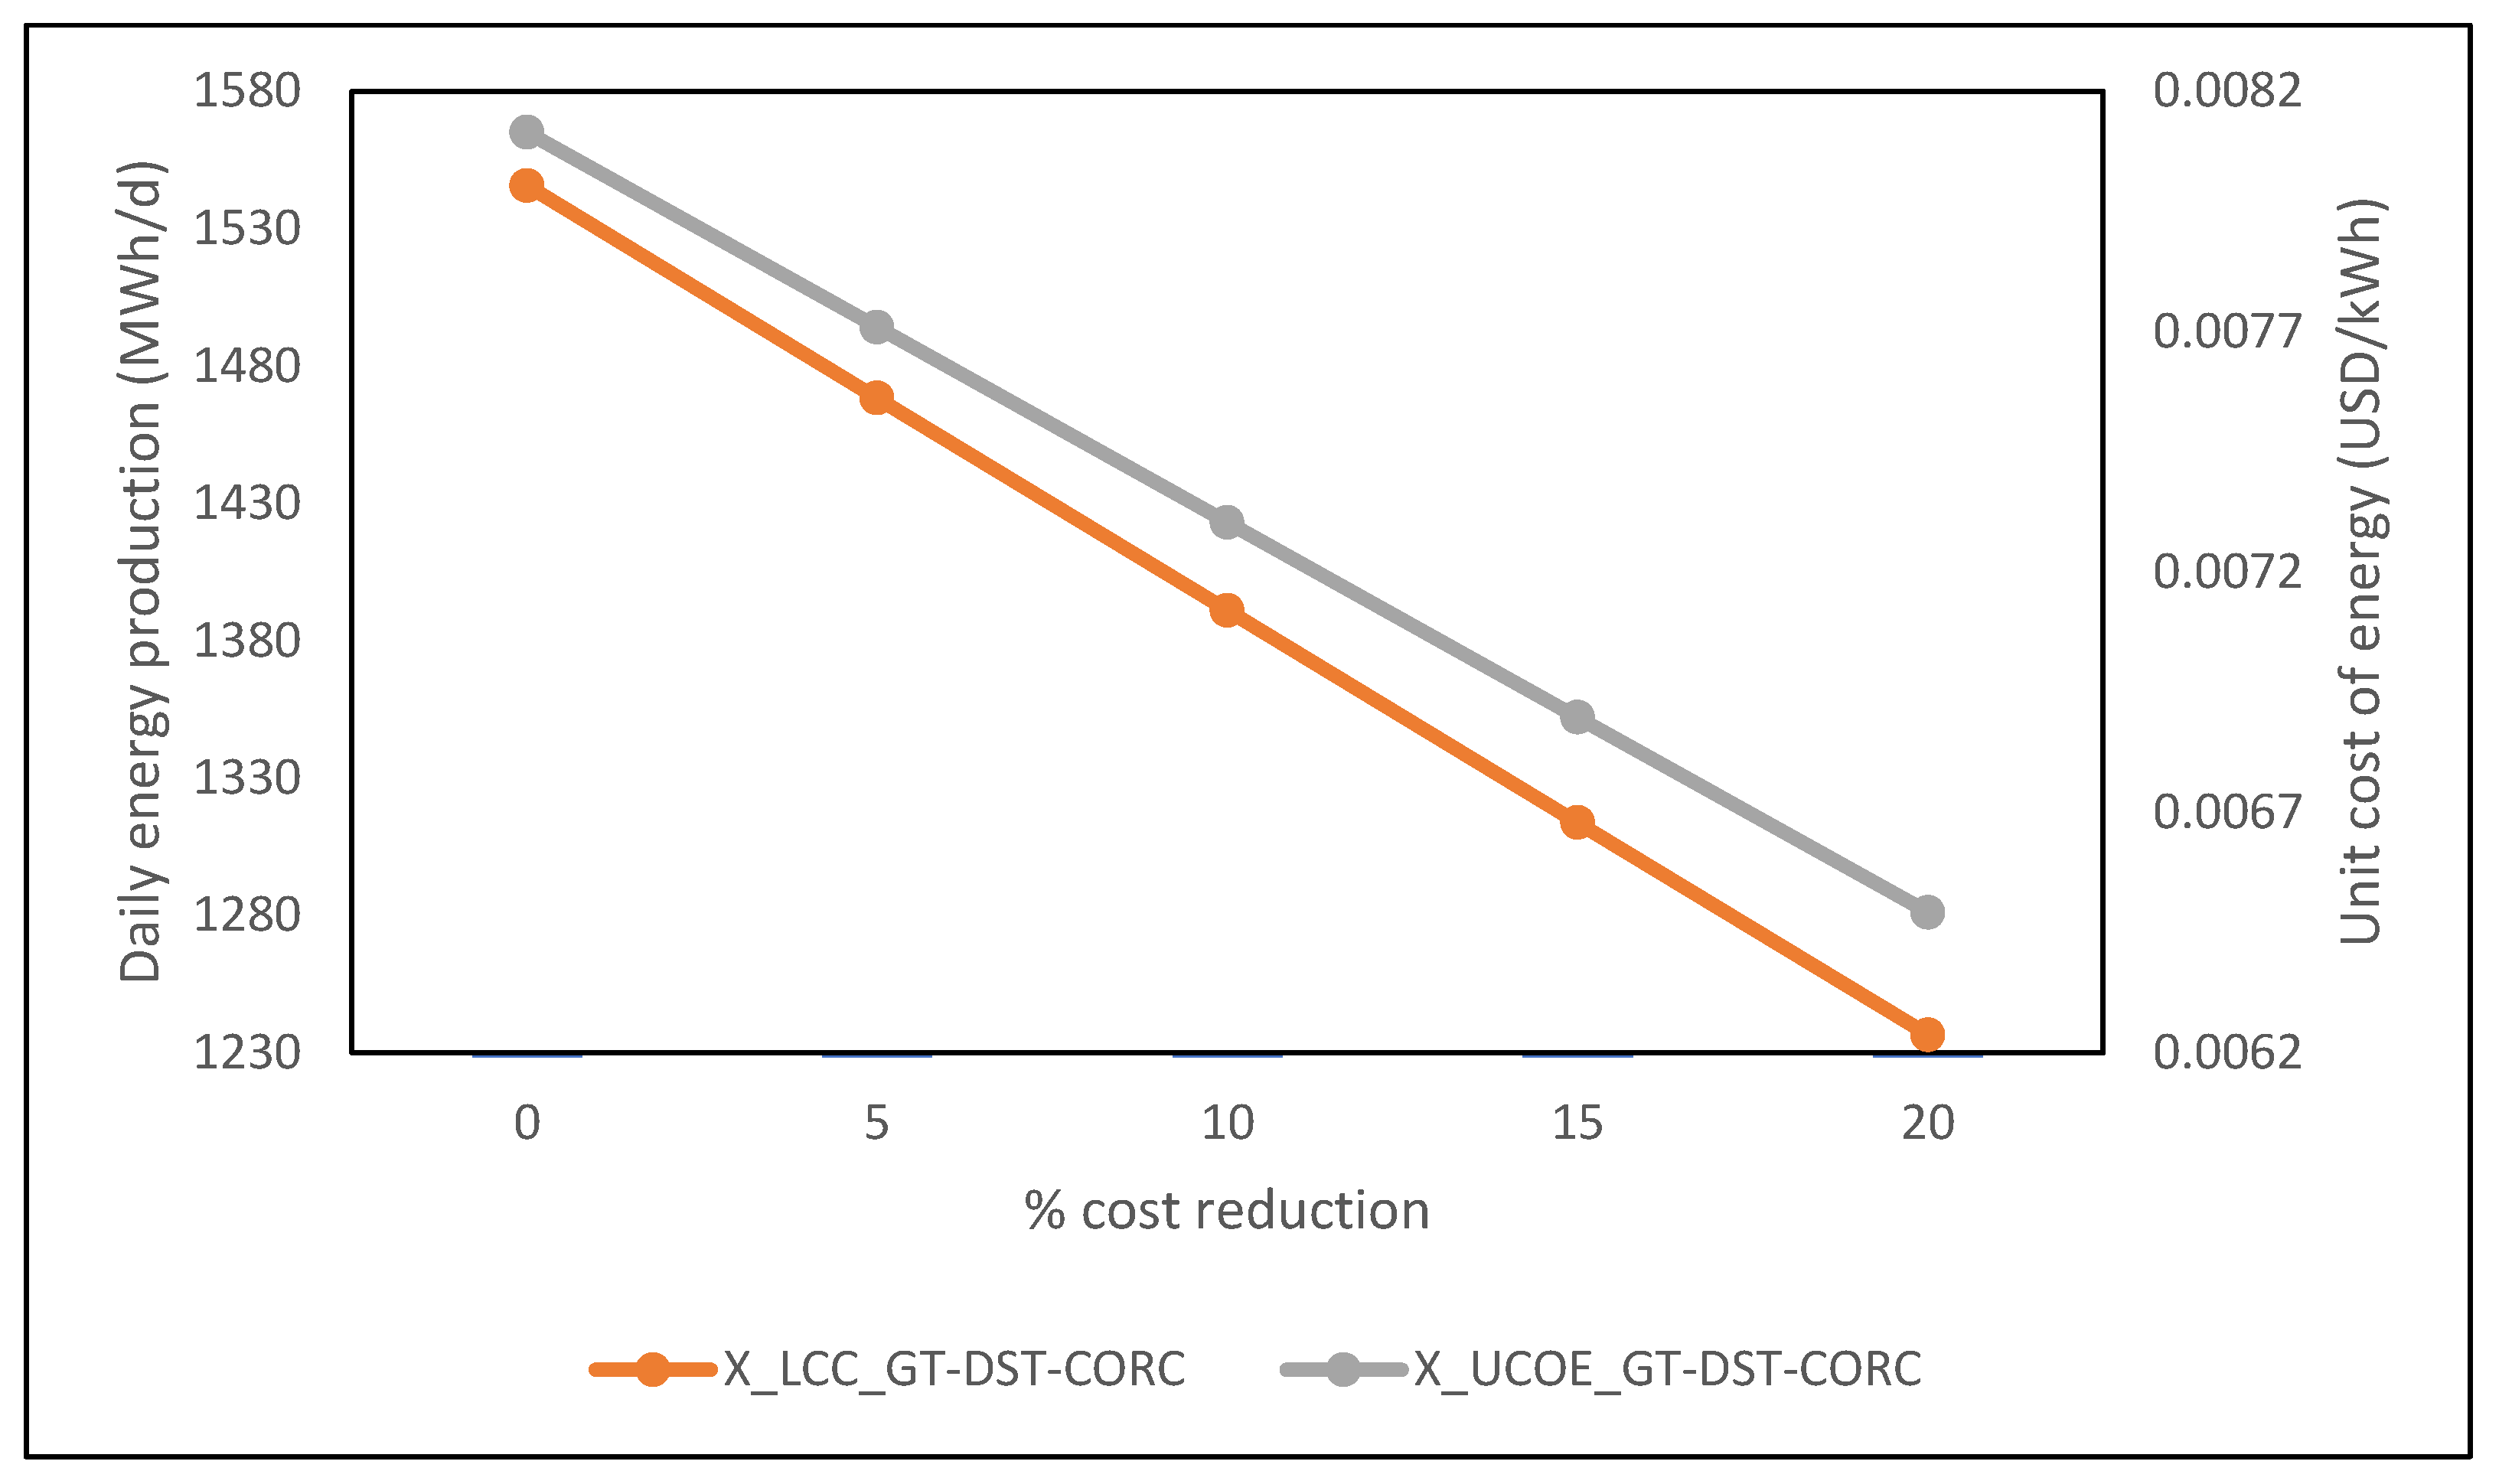
The effect of percentage equipment cost reduction on the life cycle cost ( X L C C ) and the unit cost of energy (UCOE) for the biomass GT-DST-CORC CHP system are presented in Figure 4. It was shown that the higher the percentage of equipment cost reduction (i.e., the lower the equipment cost), the lower the life cycle cost and unit cost of energy, which is similar to the trend reported by Ogorure et al. [27].

3.5.2. Effect of Interest Rate

The effect of a change in interest rate on the unit cost of energy (UCOE) and break-even point (BEP) of the system is displayed in Figure 5. It can be observed that an increase in the interest rate leads to an increase in the UCOE but a decrease in the BEP. A similar trend was reported by Owebor et al. [39] and Ogorure et al. [27].

3.5.3. Effect of Combustion Temperature

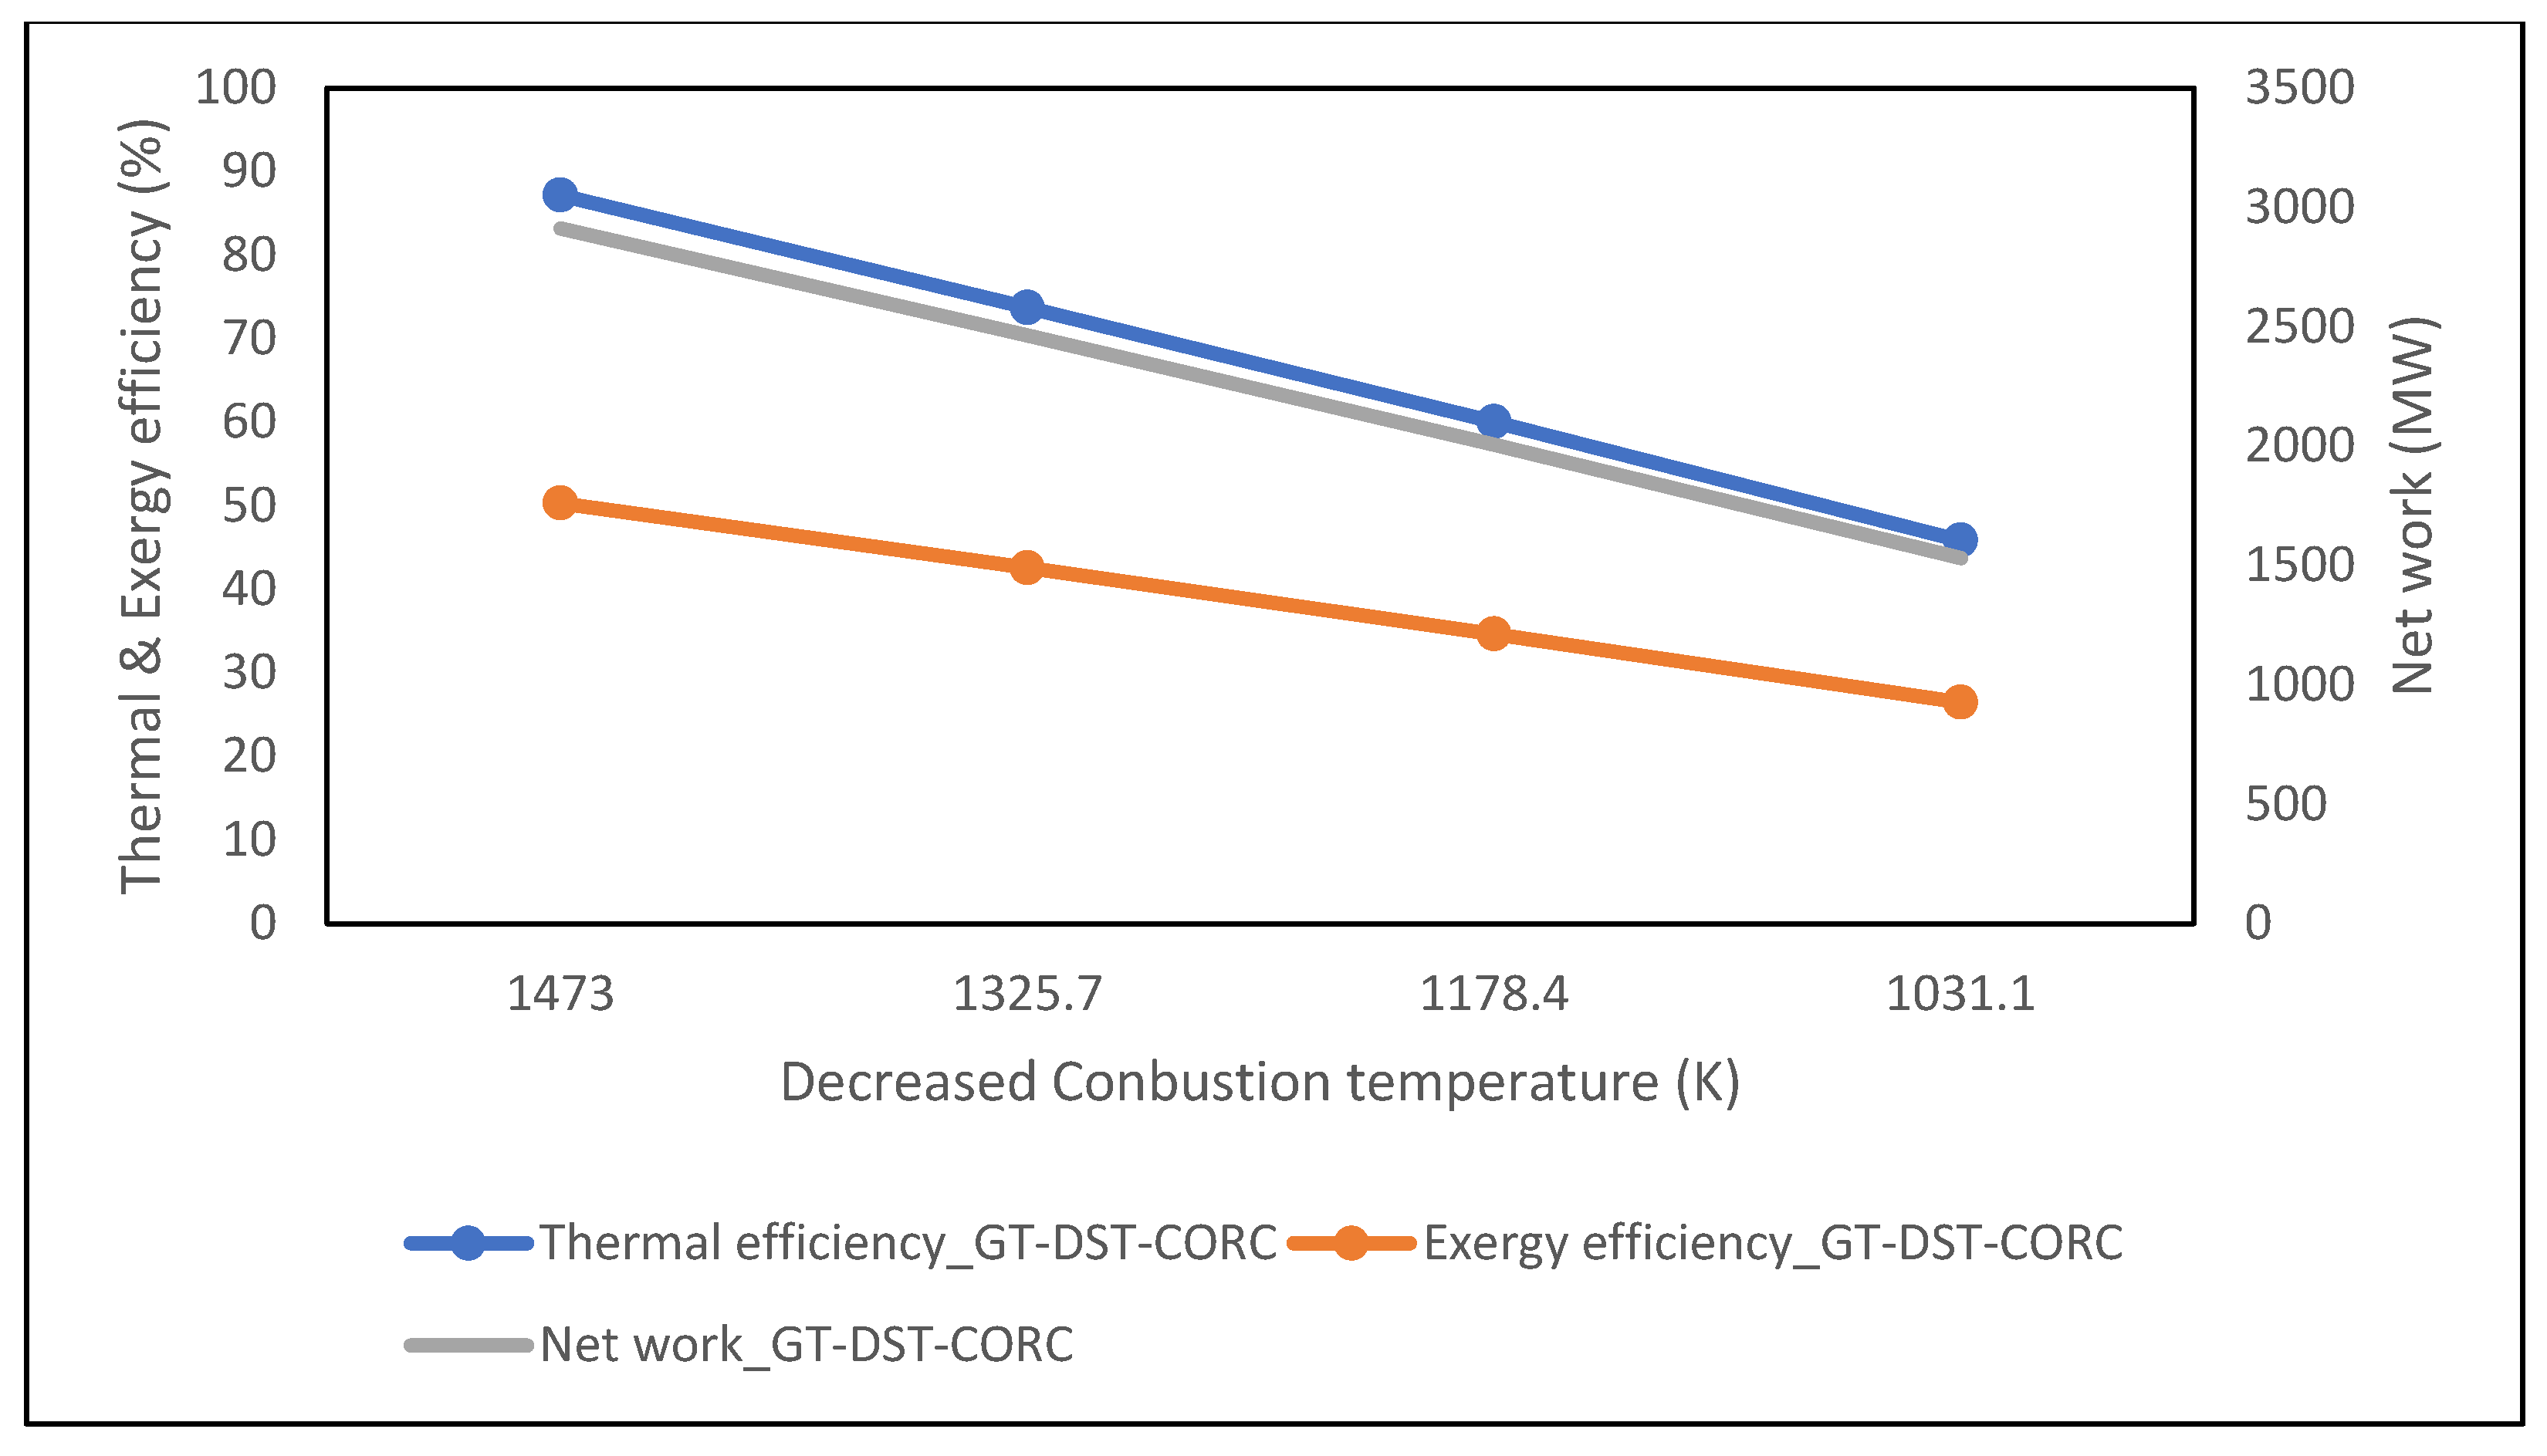
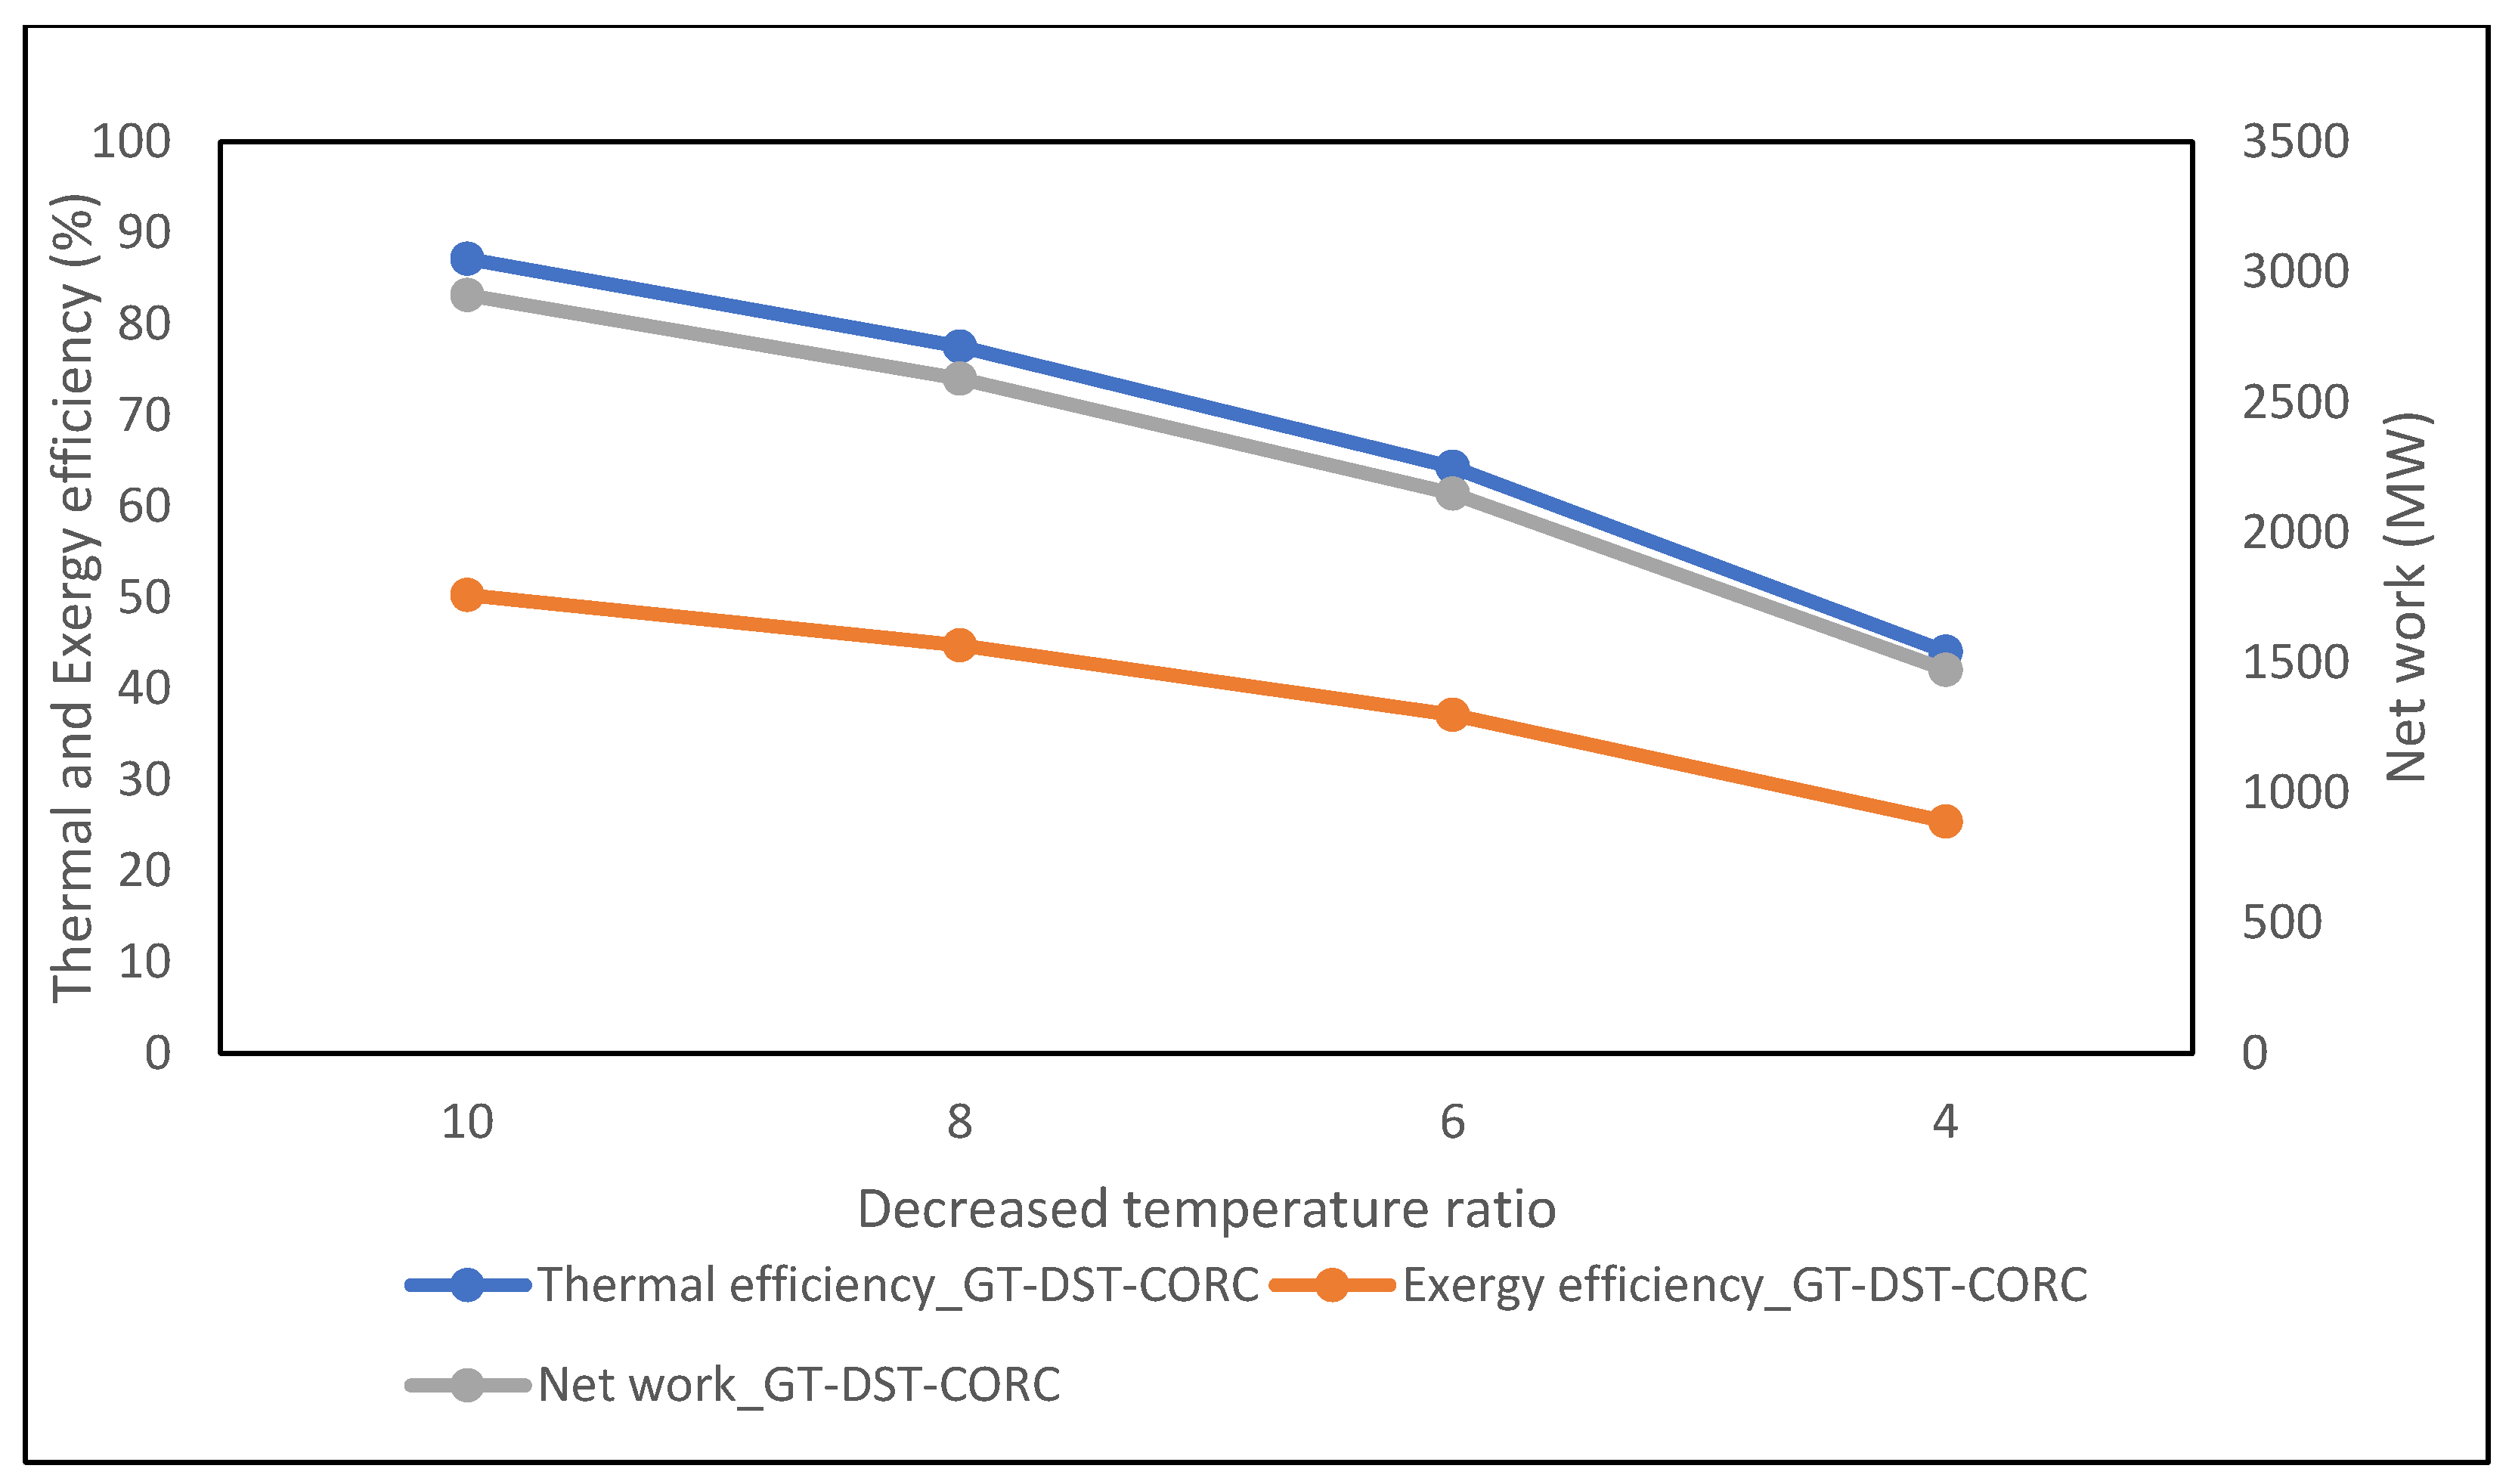
The effect of the combustion temperature on the thermal efficiency, exergy efficiency, and network of the BCHP plant system is displayed in Figure 6. It can be observed that a decrease in the combustion temperature leads to a decrease in the thermal efficiency, exergy efficiency, and the network of the BCHP system.

3.5.4. Effect of Pressure Ratio

The effect of the change in the pressure ratio on the thermal efficiency, exergy efficiency, and network of the BCHP plant system is displayed in Figure 7. It can be observed that a decrease in the pressure leads to an increase in the thermal efficiency, exergy efficiency, and the network of the BCHP system. A similar trend was reported by Owebor et al. [39], Ogorure et al. [27], and Oko and Nwachukwu [23].

3.5.5. Effect of Temperature Ratio

The effect of the change in the temperature ratio on the thermal efficiency, exergy efficiency, and network of the BCHP plant system is displayed in Figure 8. It can be observed that a decrease in the pressure leads to a decrease in the thermal efficiency, exergy efficiency, and the network of the BCHP system. A similar trend had been reported by Owebor et al. [39] and Ogorure et al. [27].

3.5.6. Effect of Flue Gas Temperature

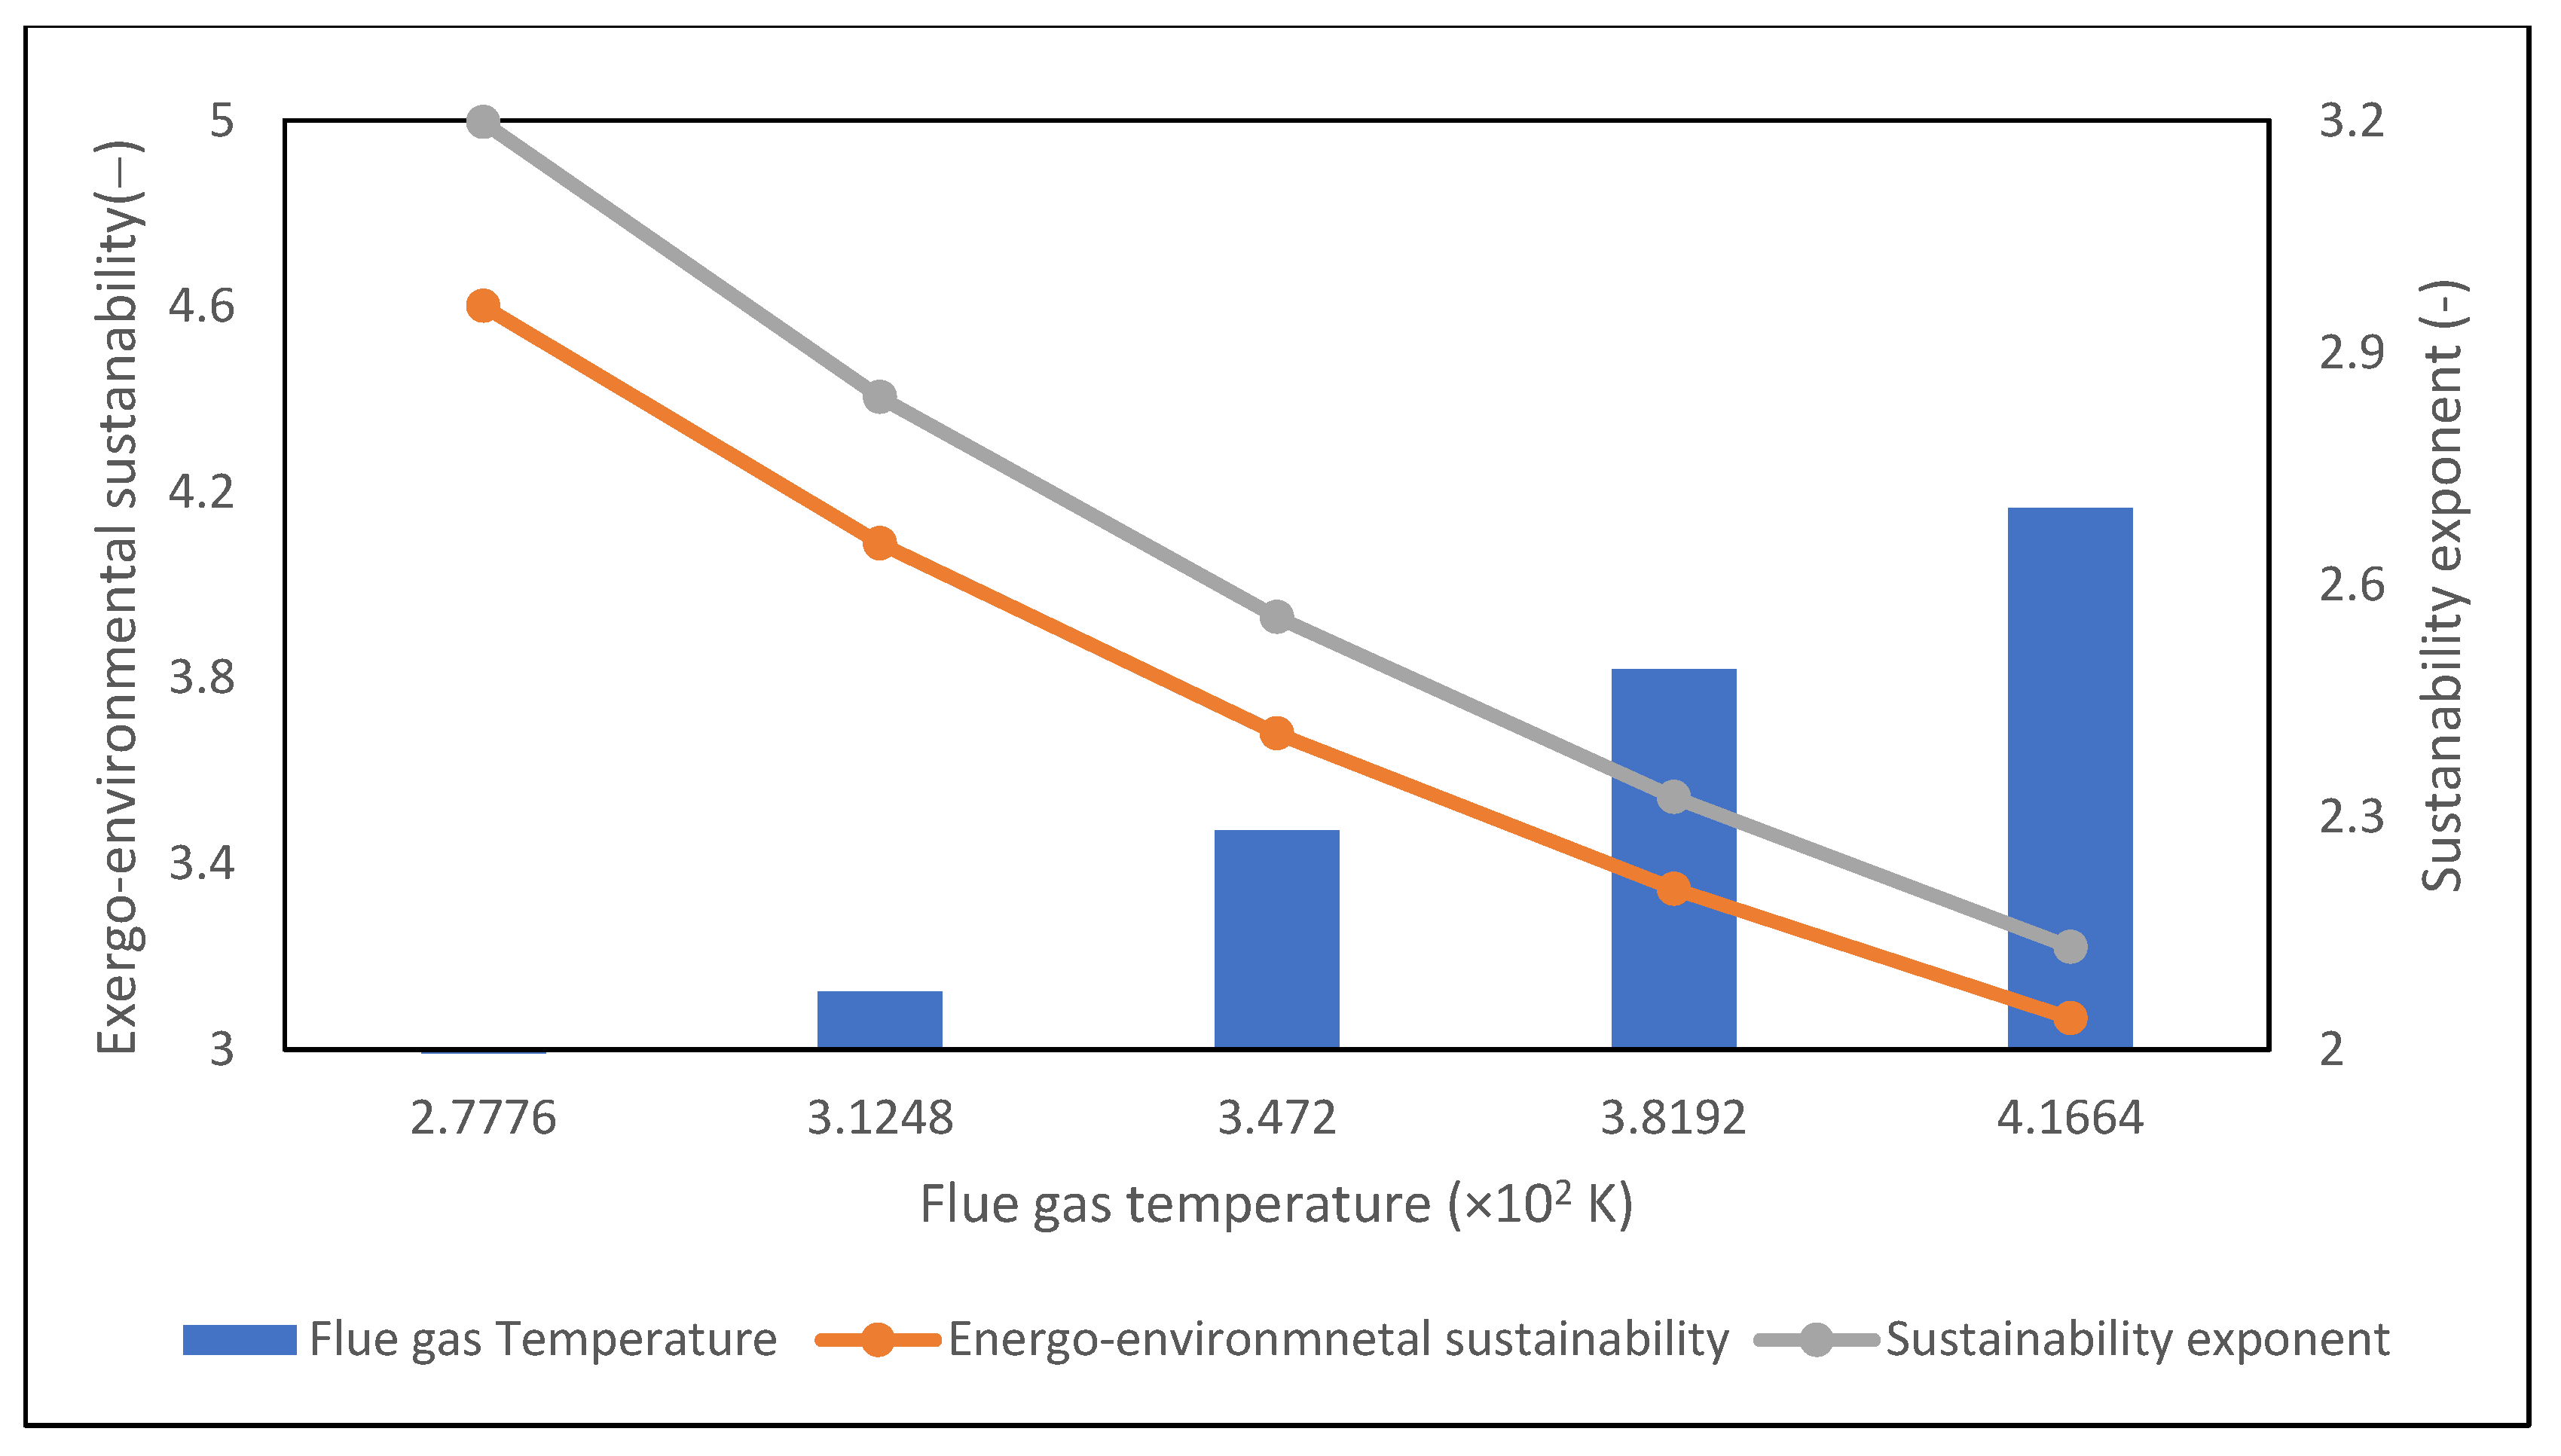
The effect of flue gas temperature on the energo-environmental sustainability and the sustainability exponent of the BCHP plant system is displayed in Figure 9. It can be observed that an increase in the interest rate leads to a decrease in the energo-environmental sustainability and sustainability exponent. A similar trend was reported by Owebor et al. [39] and Ogorure et al. [27].

4. Conclusions

This work presents the GIS mapping of biomass for energy generation potential in Nigeria. The crop and forest classification analyses were performed in the ArcGIS platform to identify a prospective suitable site for a combined heat and power (CHP) system, utilizing the integration of energy systems. The agricultural residue composition and energy content of the biomass resource were estimated. The higher heating value (HHV) of the biomass residue, HHV of syngas, and lower heating value (LHV) of syngas produced were obtained as 444.75, 30.47, and 17.15 [MJ/kg], respectively.
The thermodynamics, economics, and exergo-economics performances of the proposed biomass residue CHP were undertaken. The thermodynamic model of the BCHP plant was framed and implemented in the EES platform, and pre- and post-processing of data were performed in Microsoft Excel. Key findings indicate that the syngas-fired integrated GT, DST, and CORC power plant for combined heat and power (CHP) generation is capable of producing 2911 MW of electricity. The total exergy destruction rate was obtained as 6480 [MW], with the largest exergy destruction occurring in the combustion chamber, followed by the HRSG. The net heat generated was obtained as 3370.41 [MW], while the exit temperature of the flue gas was 74 °C, with a thermal efficiency of 87.16%. The net power from the BCHP plant is sufficient to meet the power requirements of the area, and excess power can be transmitted to the national grid to boost power supply. The exergo-economic, environmental, and sustainability analyses were conducted. From the results, the annualized LLC, unit cost of energy (UCOE), and break-even point of the BCHP were obtained as U S D 193.4 million, 0.0076 U S D /kWh, and 7.5 years, respectively. The environmental analysis results suggest that the specific emissions of CO2, CO, and NOx were obtained as 141.73 [kg/MWh], 5.7   ×   10 6 [kg/s], and 2.3   ×   10 7 [kg/s], respectively. The fuel harmful emission factor, environmental-thermal conversion factor, and environmental impact factor were obtained as 0.163, 0.86, and 0.14 [–], respectively, while the costs of CO2, CO, and NOx emissions were obtained as 111.42, 1.19, and 1.58 U S D /kg. The sustainability index, energo-environmental sustainability, energo-economic sustainability, and sustainability exponent were also obtained as 2.01, 5.62, 0.70, and 3.91 [–], respectively.
The obtained results depict the effectiveness of integrating various thermodynamic cycles in a single platform to obtain improved thermodynamic performance, reduced cost of a unit of energy, and reduced environmental impact. This research revealed that agricultural industries have strong potential to provide clean and affordable energy in developing countries, particularly in sub-Saharan African nations, with relatively poor energy access. Thus, this study suggests that policymakers should promote biomass residue-to-energy generation, specifically in the agrarian communities. Also, attention should be given to the development of an appropriate business model framework that promotes the economic competitiveness of agricultural industries vis-à-vis the energy industry.
Nevertheless, the accuracy of the GIS-based resource mapping depends on the availability, resolution, and reliability of remote sensing and land use data, which may vary across regions. The economic and exergo-economic analyses are sensitive to local cost structures, equipment prices, labor rates, and emissions penalties. Therefore, the results cannot be transferred directly to other countries without considering local context data.

Author Contributions

Conceptualization, O.E.D.; methodology, M.O.U.; software, K.E.O. and C.E.; validation, M.O.U., O.E.D., T.A.B., K.E.O. and C.E.; formal analysis, M.O.U.; investigation, M.O.U. and C.E.; resources, O.E.D., T.A.B. and K.E.O.; data curation, M.O.U. and C.E.; writing—original draft preparation, M.O.U.; writing—review and editing, O.E.D., T.A.B., K.E.O. and C.E.; visualization, M.O.U. and C.E.; supervision, O.E.D. and T.A.B.; project administration, O.E.D. and T.A.B.; funding acquisition, O.E.D. All authors have read and agreed to the published version of the manuscript.

Funding

The work was supported by the project entitled “Renewable energies for Africa: Effective valorization of agri-food wastes (REFFECT AFRICA)” through the second author. This project has received funding from the European Union’s Horizon 2020 Research and Innovation Program under the Grant Agreement number 101036900.

Data Availability Statement

The original contributions presented in the study are included in the article, further inquiries can be directed to the corresponding author.

Conflicts of Interest

The authors declare no conflicts of interest.

References

  1. Takase, M.; Kipkoech, R.; Essandoh, P.K. A comprehensive review of energy scenario and sustainable energy in Kenya. Fuel Community 2021, 7, 100015. [Google Scholar]
  2. Owebor, K.; Diemuodeke, E.O.; Briggs, T.A.; Imran, M. Power Situation and renewable energy potentials in Nigeria e A case for integrated multi-generation technology. Renew. Energy 2021, 177, 773–796. [Google Scholar] [CrossRef]
  3. Pande, C.B.; Moharir, K.N.; Singh, S.K.; Varade, A.M.; Elbeltagi, A.; Khadri, S.; Choudhari, P. Estimation of crop and forest biomass resources in a semi-arid region using satellite data and GIS. J. Saudi Soc. Agric. Sci. 2021, 20, 302–311. [Google Scholar] [CrossRef]
  4. Ben-iwo, J.; Manovic, V.; Longhurst, P. Biomass resources and biofuels potential for the production of transportation fuels in Nigeria. Renew. Sustain. Energy Rev. 2016, 63, 172–192. [Google Scholar] [CrossRef]
  5. IEA. World Energy Outlook 2019. Available online: https://www.iea.org/ (accessed on 17 September 2025).
  6. Alex-Oke, T.; Bamisile, O.; Cai, D.; Adun, H.; Ukwuoma, C.C.; Tenebe, S.A.; Huang, Q. Renewable energy market in Africa: Opportunities, progress, challenges, and future prospects. Energy Strategy Rev. 2025, 59, 101700. [Google Scholar] [CrossRef]
  7. Ukoba, M.; Diemuodeke, E.; Briggs, T.; Imran, M.; Ojapah, M.; Owebor, K.; Nwachukwu, C.; Aminu, M.D.; Okedu, K.; Kalam, A.; et al. Optimal sites for agricultural and forest residues energy conversion plant using geographic information system. Heliyon 2023, 9, e19660. [Google Scholar] [CrossRef]
  8. Intergovernmental Panel on Climate Change (IPCC). Global Warming of 1.5 °C An IPCC Special Report on the Impacts of Global Warming of 1.5 °C Above Pre-Industrial Levels and Related Global Greenhouse Gas Emission Pathways, in the Context of Strengthening the Global Response to the Threat of Climate Change; IPCC: Geneva, Switzerland, 2018. [Google Scholar]
  9. Ukoba, M.O.; Diemuodeke, E.O.; Briggs, T.A.; Imran, M.; Owebor, K.; Nwachukwu, C.O. Geographic information systems (GIS) approach for assessing the biomass energy potential and identification of appropriate biomass conversion technologies in Nigeria. Biomass Bioenergy 2023, 170, 106726. [Google Scholar] [CrossRef]
  10. Irfan, M.; Zhao, Z.Y.; Ahmad, M.; Mukushimana, M.C. Critical factors influencing wind power industry: A diamond model based study of India. Energy Rep. 2019, 5, 1222–1235. [Google Scholar] [CrossRef]
  11. Souza, L.L.P.d.; Hamedani, S.R.; Lora, E.E.S.; Palacio, J.C.E.; Comodi, G.; Villarini, M.; Colantoni, A. Theoretical and technical assessment of agroforestry residue potential for electricity generation in Brazil towards 2050. Energy Rep. 2021, 7, 2574–2587. [Google Scholar] [CrossRef]
  12. Oyedepo, S.O. Energy and sustainable development in Nigeria: The way forward. Energy Sustain. Soc. 2012, 2, 15. [Google Scholar]
  13. Food and Agricultural Organization of the United Nations (FAO). Energy Conservation in the Mechanical Forest Industries. FAO FORESTRY PAPER 93. 1990. Available online: https://www.fao.org/4/t0269e/t0269e00.htm (accessed on 17 September 2025).
  14. Oyedepo, S.O.; Dunmade, I.S.; Adekeye, T.; Attabo, A.A.; Olawole, O.C.; Babalola, P.O.; Oyebanji, J.A.; Udo, M.O.; Kilanko, O.; Leramo, R.O. Bioenergy technology development in Nigeria—Pathway to sustainable energy development. Int. J. Environ. Sustain. Dev. 2019, 18, 175–205. [Google Scholar] [CrossRef]
  15. Kayanta, E.E.; Bello, A.A.; Habon, D.; Elijah, R.I. Availability assessment of groundnut and beans residue using remote sensing and GIS—A case study of Bogoro Local Government Area, Bauchi State, Nigeria. J. Remote Sens. GIS 2018, 7, 249. [Google Scholar]
  16. Jekayinfa, S.O.; Orisaleye, J.I.; Pecenka, R. An Assessment of Potential Resources for Biomass Energy in Nigeria. Resources 2020, 9, 92. [Google Scholar] [CrossRef]
  17. Janssen, R.; Ruth, D. Bioenergy for Sustainable Development in Africa; Springer Science & Business Media: Berlin, Germany, 2011. [Google Scholar]
  18. Ikumapayi, O.M.; Kazeem, R.A.; Ige, E.O.; Ofotoku, D.O.; Adaramola, B.A.; Ting, T.T.; Laseinde, O.T.; Jen, T.; Akinlabi, E.T. Thermo-economic comparative analysis of a simple and cascaded organic Rankine power plants fired by rice husks. Clean. Eng. Technol. 2023, 17, 100692. [Google Scholar] [CrossRef]
  19. Central Intelligence Agency (CIA). The World Factbook: Nigeria; CIA: Washington, DC, USA, 2012.
  20. United States Geological Survey (USGS). Science Explorer. Science for a Changing World. 2021. Available online: https://earthexplorer.usgs.gov (accessed on 17 September 2025).
  21. Saleh, S.; Samad, N.A.F.A. Syngas software for biomass gasification process. In IOP Conference Series: Materials Science and Engineering; IOP Publishing Ltd.: Bristol, UK, 2019. [Google Scholar] [CrossRef]
  22. GS 122-1; FIRED HEATERS TO API 560. B. Standards Group: London, UK, 1996.
  23. Oko, C.O.C.; Nwachukwu, C.O. Thermo-economic analysis of a waste-to-energy integrated multi-generation power plant. Int. J. Ambient. Energy 2020, 41, 334–347. [Google Scholar] [CrossRef]
  24. Carcasci, C.; Winchler, L. Thermodynamic analysis of an organic rankine cycle for waste heat recovery from an aeroderivative intercooled gas turbine. Energy Procedia 2016, 101, 862–869. [Google Scholar] [CrossRef]
  25. Saha, B.; Chakraborty, B.; Pundeer, P. Thermodynamic and thermo economic analysis of organic rankine cycle with multi-objective optimization for working fluid selection with low-temperature waste sources in the Indian industry. In Proceedings of the 5th international seminar on ORC power systems, Athens, Greece, 9–11 September 2019; pp. 5–12. [Google Scholar]
  26. Darvish, K.; Ehyaei, M.; Atabi, F.; Rosen, M. Selection of optimum working fluid for organic rankine cycles by exergy and exergy-economic analyses. Sustain. Times 2015, 7, 15362–15383. [Google Scholar] [CrossRef]
  27. Ogorure, O.J.; Oko, C.O.C.; Diemuodeke, E.O.; Owebor, K. Energy, exergy, environmental and economic analysis of an agricultural waste-to-energy integrated multigeneration thermal power plant. Energy Convers. Manag. 2018, 171, 222–240. [Google Scholar] [CrossRef]
  28. Allesina, G.; Simone, P.; Guidetti, L.; Paolo, T. Modeling of coupling gasification and anaerobic digestion processes for maize bioenergy conversion. Biomass Bioenergy 2015, 81, 444–451. [Google Scholar] [CrossRef]
  29. Zainal, Z.A.; Ali, R.; Lean, C.H.; Seetharamu, K.N. Prediction of performance of a downdraft gasifier using equilibrium modeling for different biomass materials. Energy Convers. Manag. 2001, 42, 1499–1515. [Google Scholar] [CrossRef]
  30. McAllister, S.; Chen, J.Y.; Fernandez-Pello, A.C. Fundamentals of Combustion Processes; Mechanical Engineering Series; Springer: Berlin/Heidelberg, Germany, 2011. [Google Scholar]
  31. Reed, T.B.; Das, A. Handbook of Biomass Downdraft Gasifier Engine Systems; Biomass Energy Foundation: Normal, IL, USA, 1988. [Google Scholar]
  32. Basu, P. Chapter 6—Design of biomass gasifiers. In Biomass Gasification and Pyrolysis; Academic Press: Cambridge, MA, USA, 2010; pp. 167–228. [Google Scholar]
  33. Oko, C.O.C. Engineering Thermodynamics: An Algorithmic Approach, 2nd ed.; University of Port Harcourt Press: Port Harcourt, Nigeria, 2011. [Google Scholar]
  34. Chitsaz, A.; Mehr, A.S.; Mahmoudi, S.M.S. Exergoeconomic analysis of a trigeneration system driven by a solid oxide fuel cell. Energy Convers. Manag. 2015, 106, 921–931. [Google Scholar] [CrossRef]
  35. Shokati, N.; Mohammadkhani, F.; Yari, M.; Mahmoudi, S.M.S.; Rosen, M.A. A comparative exergoeconomic analysis of waste heat recovery from a gas turbine-modular helium reactor via organic rankine cycles. Sustainability 2014, 6, 2474–2489. [Google Scholar] [CrossRef]
  36. Lazzaretto, A.; Tsatsaronis, G. SPECO: A systematic and general methodology for calculating efficiencies and costs in thermal systems. Energy 2006, 31, 1257–1289. [Google Scholar] [CrossRef]
  37. Ren, J.; Xu, C.; Qian, Z.; Huang, W.; Wang, B. Exergoeconomic analysis and optimization of a biomass integrated gasification combined cycle based on externally fired gas turbine, steam Rankine cycle, organic Rankine cycle, and absorption refrigeration cycle. Entropy 2024, 26, 511. [Google Scholar] [CrossRef] [PubMed]
  38. Oyedepo, S.O.; Fagbenle, R.O.; Adefila, S.S.; Alam, M.M. Thermoeconomic and thermoenvironomic modeling and analysis of selected gas turbine power plants in Nigeria. Energy Sci. Eng. 2015, 3, 423–442. [Google Scholar] [CrossRef]
  39. Owebor, K.; Oko, C.O.C.; Diemuodeke, E.O.; Ogorure, O.J. Thermo-environmental and economic analysis of an integrated municipal waste-to-energy solid oxide fuel cell, gas-, steam-, organic fluid- and absorption refrigeration cycle thermal power plants. Appl. Energy 2019, 239, 1385–1401. [Google Scholar] [CrossRef]
  40. Wygonik, E.; Goodchild, A. Evaluating CO2 emissions, cost, and service quality trade-offs in an urban delivery system case study. IATSS Res. 2011, 35, 7–15. [Google Scholar] [CrossRef]
  41. Kokalj, F.; Samec, N. Combustion of Municipal Solid Waste for Power Production. In Advances in Internal Combustion Engines and Fuel Technologies; InTech: Vienna, Austria, 2013. [Google Scholar] [CrossRef]
  42. Chandrappa, R.; Das, D.B. Waste Quantities and Characteristics. In Environmental Science and Engineering; Springer Science and Business Media Deutschland GmbH: Berlin, Germany, 2012; pp. 47–63. [Google Scholar] [CrossRef]
  43. Owebor, K.; Diemuodeke, O.E.; Briggs, T.A.; Eyenubo, O.J.; Ogorure, O.J.; Ukoba, M.O. Multi-criteria optimisation of integrated power systems for low-environmental impact. Energy Sources Part A Recovery Util. Environ. Eff. 2022, 44, 3459–3476. [Google Scholar] [CrossRef]
  44. Odukoya, A.; Dincer, I.; Naterer, G.F. Exergy analysis of a gasification-based combined cycle with solid oxide fuel cells for cogeneration. Int. J. Green Energy 2011, 8, 834–856. [Google Scholar] [CrossRef]
  45. Minutillo, M.; Perna, A.; Jannelli, E.; Cigolotti, V.; Nam, S.W.; Yoon, S.P.; Kwon, B.W. Coupling of Biomass Gasification and SOFC—Gas Turbine Hybrid System for Small Scale Cogeneration Applications. In Energy Procedia; Elsevier Ltd.: Amsterdam, The Netherlands, 2017; pp. 730–737. [Google Scholar] [CrossRef]
  46. Jack, T.A.; Oko, C.O.C. Exergy and exergoeconomic analysis of a municipal waste-to-energy steam reheat power plant for Port Harcourt city. Int. J. Ambient. Energy 2018, 39, 352–359. [Google Scholar] [CrossRef]
  47. Haseli, Y.; Dincer, I.; Naterer, G.F. Thermodynamic analysis of a combined gas turbine power system with a solid oxide fuel cell through exergy. Thermochim. Acta 2008, 480, 1–9. [Google Scholar] [CrossRef]
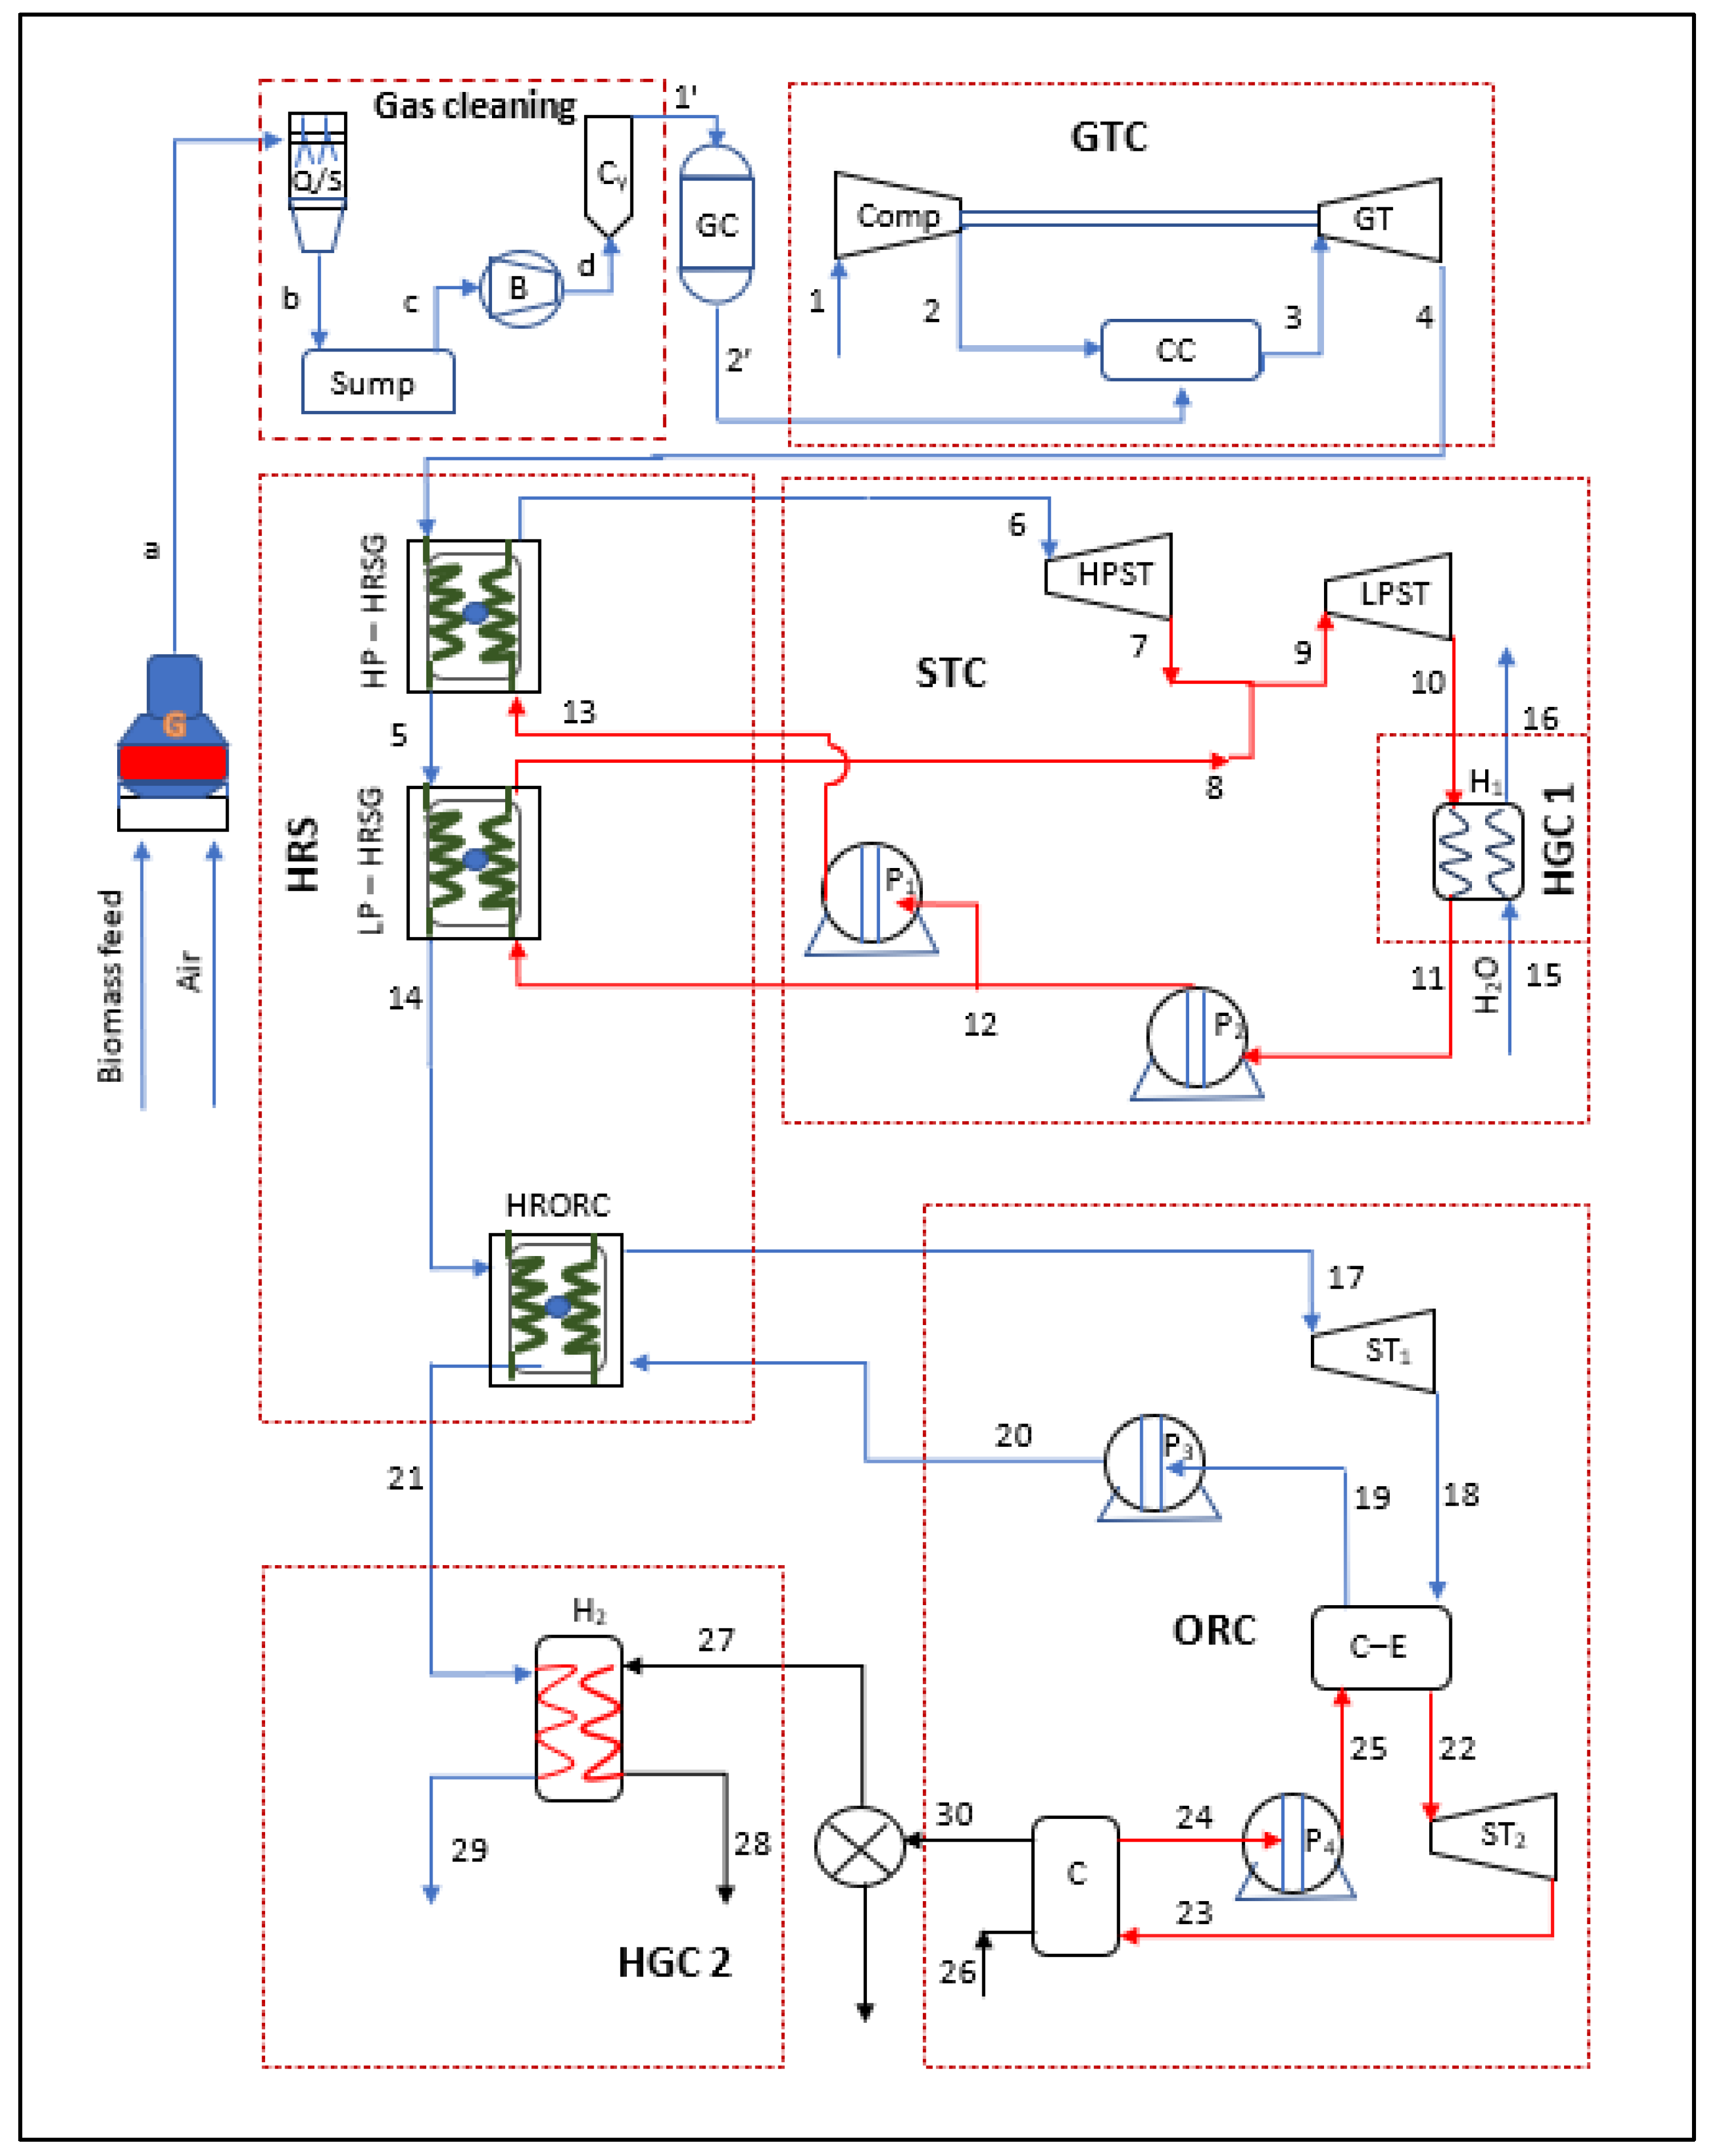
Figure 1. Layout of the proposed BCHP plant system.
Energies 18 05207 g001
Figure 2. Nigeria and Edo state LULC and biomass distribution map.
Energies 18 05207 g002
Figure 3. Bar chart of Nigeria and Edo state energy crop and forest production.
Energies 18 05207 g003
Figure 4. Effect of percentage reduction in equipment cost on DEP and UCOE.
Energies 18 05207 g004
Figure 5. Effect of interest rate, i (-), on break-even-point, BEP (yr), and unit cost of energy (UCOE).
Energies 18 05207 g005
Figure 6. Effect of decreased combustion temperature on thermal efficiency, exergy efficiency, and network of the BCHPP system.
Energies 18 05207 g006
Figure 7. Effect of a change in the pressure ratio on thermal efficiency, exergy efficiency, and network of the BCHPP system.
Energies 18 05207 g007
Figure 8. Effect of a change in the temperature ratio on thermal efficiency, exergy efficiency, and network of the BCHPP system.
Energies 18 05207 g008
Figure 9. Effect of flue gas temperature on exergo-environmental sustainability and sustainability exponent.
Energies 18 05207 g009
Disclaimer/Publisher’s Note: The statements, opinions and data contained in all publications are solely those of the individual author(s) and contributor(s) and not of MDPI and/or the editor(s). MDPI and/or the editor(s) disclaim responsibility for any injury to people or property resulting from any ideas, methods, instructions or products referred to in the content.