Article

A Decoupled Two-Stage Optimization Framework for the Multi-Objective Coordination of Charging Efficiency and Battery Health

1
School of Electronic and Control Engineering, Chang’an University, Middle Section of Nan Erhuan Road, Beilin District, Xi’an 710064, China
2
School of Electronic Information, Central South University, 932 Lushan Road, Yuelu District, Changsha 410075, China
*
Author to whom correspondence should be addressed.
Energies 2025, 18(19), 5180; https://doi.org/10.3390/en18195180
Submission received: 29 August 2025 / Revised: 24 September 2025 / Accepted: 27 September 2025 / Published: 29 September 2025

Abstract

A fundamental challenge in lithium-ion battery charging is the inherent trade–off between charging speed and battery health. Fast charging tends to accelerate battery degradation, while slow charging extends downtime and intensifies range anxiety, heightening concerns over inadequate driving range during operation. This contradiction has become a key bottleneck restricting the advancement of electric vehicles. In response to the limitations of conventional charging strategies and optimization methods, which typically intensify this trade–off, this study proposes a novel two–stage fast charging optimization strategy for lithium–ion batteries. The proposed method first introduces a hybrid clustering algorithm that combines the canopy algorithm with bisecting K–means to achieve adaptive SOC staging. This staging is guided by the nonlinear characteristics of the internal resistance with respect to the state of charge (SOC), allowing for a data–driven division of charging phases. Following staging, a closed–loop optimization framework is developed. A wavelet neural network (WNN) is employed to precisely capture and approximate the nonlinear characteristics of the charging process for performance prediction, upon which a multi–strategy enhanced multi–objective particle swarm optimization (MOPSO) algorithm is applied to efficiently search for Pareto–optimal solutions that balance charging time and ohmic loss. In addition, an active learning mechanism is incorporated to refine the WNN using selectively sampled data iteratively, thereby improving prediction accuracy and the robustness of the optimization process. Experimental results demonstrate that when the SOC reaches 70%, the proposed method shortens the charging time by 12.5% and reduces ohmic loss by 31% compared with the conventional constant current–constant voltage (CC–CV) strategy, effectively achieving a balance between charging efficiency and battery health.

1. Introduction

In the context of the global transition toward sustainable energy and transportation, electric vehicles have become a key direction for innovation in the automotive industry. However, the trade–off between charging time and battery lifespan has severely restricted large–scale adoption. Compared with the rapid refueling of conventional internal combustion engine vehicles, reducing the charging time of electric vehicles solely by increasing the charging current accelerates battery degradation. The main manifestations are lithium dendrite formation and abnormal growth of the solid electrolyte interphase (SEI) film. The disordered growth of lithium dendrites can pierce the separator and cause short circuits, creating potential safety risks. During fast charging, heat generation may accumulate if not dissipated effectively, which can trigger thermal runaway. This phenomenon is essentially a chain exothermic reaction and represents a critical cause of severe safety accidents, including fire and explosion [1]. Therefore, enhancing fast charging efficiency while ensuring battery health and safety has become a central challenge for technological breakthroughs in electric vehicles, with direct implications for the sustainable development of the industry [2].
In lithium–ion battery charging research, the constant current–constant voltage (CC—CV) strategy is widely adopted due to its operational simplicity [2]. However, it exhibits notable limitations in controlling charging losses. During the constant current (CC) phase, the fixed current cannot adapt to the dynamic polarization effects occurring throughout charging, leading to polarization accumulation and additional energy loss. The constant voltage (CV) phase accounts for approximately 50% of the total charging time; the gradually decreasing current results in low charging efficiency [3]. Prolonged high voltage also accelerates electrode degradation and triggers side reactions, causing energy loss and potentially altering the internal battery structure, which increases subsequent charging losses. Overall, the CC–CV strategy neglects the dynamic evolution of the battery’s internal states during charging and is thus insufficient for effectively mitigating various losses while balancing charging efficiency and battery health [2].
To overcome the inherent shortcomings of the CC–CV strategy, such as inadequate control of charging losses and neglect of internal battery dynamics, recent studies have proposed the multistage constant current (MCC) charging strategy in combination with intelligent optimization algorithms. The core concept is to divide the entire charging process into several phases, with each phase adopting a specific, optimized constant current value that typically decreases stepwise as the state of charge (SOC) increases. Within the MCC framework, determining the transition points between phases is critical to defining the overall performance of the strategy. Based on this principle, the MCC strategy has evolved into two major technical paths: voltage–based multistage constant current (VMCC) and state–of–charge–based multistage constant current (SMCC) [3].
The VMCC strategy uses a preset voltage as the switching criterion. The battery is first charged with a constant current, and once the terminal voltage reaches the preset threshold, the current switches to a lower constant value until charging is complete [3]. This strategy is easy to implement and relies solely on measurable voltage parameters. However, it has significant limitations. The mapping between terminal voltage and key internal characteristics, such as SOC and internal resistance, is easily affected by polarization effects and temperature fluctuations. As a result, voltage cannot accurately reflect the battery’s true state, limiting the VMCC strategy’s ability to meet the high-performance requirements of fast charging scenarios.
The SMCC charging strategy uses SOC as the switching condition and can better accommodate the dynamic changes in internal resistance with SOC [2]. Compared with the CC–CV and VMCC strategies, its core advantage lies in its direct correlation with the battery’s internal electrochemical state, rather than relying solely on externally measurable terminal voltage signals. This gives the strategy stronger adaptability.
A complete SMCC optimization framework typically involves two key components: SOC staging and the determination of the optimal charging current for each phase. In recent years, research has focused primarily on the latter, i.e., how to efficiently and accurately determine the optimal current profile. This has led to two main technical approaches: experiment-based methods and computation-based methods [4,5].
Experimental methods evaluate charging strategies through charge–discharge tests. They provide realistic results but require numerous repetitions. This process is time–consuming and inefficient. To improve efficiency, Vott [4,6] applied the Taguchi method. It identifies optimal charging currents using a limited number of experiments. Attia [7,8] designed closed–loop optimization systems. Machine learning models predict battery degradation over the full lifecycle under multi–stage constant current conditions. Predictions are based on early data from the first 100 cycles. A Bayesian optimizer then selects long–life charging strategies. However, these approaches mainly target multi–stage constant current scenarios with five stages or fewer. The parameter space is limited. For larger current ranges or higher–stage optimizations, complexity and workload increase. This often leads to incomplete parameter exploration and local optima.
Given the limitations of experiment–based methods, researchers have begun to explore computation-based optimization approaches grounded in battery modeling. The core of the fast charging process lies in solving complex multi–objective optimization problems (MOPs), which require balancing mutually constrained objectives such as charging time, energy loss, and battery aging [9]. Therefore, model–based computational methods aim to describe battery characteristics accurately and to coordinate multiple objectives using optimization algorithms [7]. For relatively simple charging strategies, Ahn [8] and others attempted to calculate the optimal current using algebraic and geometric methods. However, as the complexity of the charging strategy increases, the number of current–related variables and their interactions grows rapidly, leading to exponential increases in computational complexity and workload. This severely limits the practical applicability of such methods. Genetic algorithms (GAs) and particle swarm optimization (PSO) are typical population–based intelligent algorithms and are widely used in charging optimization problems due to their general adaptability [10,11]. The non–dominated sorting genetic algorithm II (NSGA–II) introduces fast non-dominated sorting and crowding distance calculation, enabling more efficient handling of multiple conflicting optimization objectives [12,13,14]. These algorithms simulate evolutionary processes or swarm behavior to iteratively search the solution space and obtain relatively optimal results. However, such algorithms are essentially close to exhaustive search methods, often requiring a large number of iterations to sufficiently explore the variable space. As a result, there remains significant room for improvement in both computational efficiency and global search capability.
Approaches for SOC staging in charging optimization include both methods for determining the number of phases and techniques for defining phase boundaries. Early research primarily focused on equal–interval division of the SOC range based on a predefined number of phases, particularly in the context of SMCC charging strategies. This method divides the entire SOC range into equally sized sub–intervals, offering simplicity and ease of implementation. However, it cannot dynamically adjust the interval width according to the actual distribution of battery characteristics, such as internal resistance. Increasing the number of phases may lead to higher computational complexity while providing only marginal gains in optimization accuracy.
To address the limitations of equal division, researchers have proposed adaptive SOC staging methods that reflect the battery’s intrinsic physical characteristics. The core idea is to generate SOC phases dynamically based on the battery’s electrochemical properties, rather than setting them manually in advance [15]. For example, Liu et al. [16] proposed an adaptive multistage charging strategy based on a temperature–SOC surface model, which can dynamically adjust the charging mode according to the coupled effects of temperature and SOC. This method performs particularly well under low–temperature charging conditions. As for determining the number of charging phases, current research still lacks systematic methods based on battery characteristics. Most existing approaches rely on repeated experiments or empirical assumptions, which require substantial computational effort and lack precision. To avoid the heavy workload caused by repetitive trials, some studies have explored more intelligent methods for phase number determination. For instance, Ahn [8] and colleagues introduced a cost function that considers both charging loss and computation time. By minimizing this cost function, the optimal number of phases under the equal-division method can be identified [17]. Although Ahn’s approach is theoretically more rigorous, its application still requires large-scale experiments to gather basic data on charging loss and computation time under different phase numbers, and thus does not fully eliminate the problem of repeated testing.
In summary, existing charging strategies and optimization methods for lithium–ion batteries still face several challenges. The traditional CC–CV strategy cannot adapt to the dynamic variation of polarization effects, resulting in high energy loss and low efficiency. The VMCC strategy relies on voltage to represent the battery state, which is highly susceptible to disturbances from polarization and temperature, thus reducing the accuracy of current switching. The SMCC strategy uses SOC as the switching condition, allowing it to directly correlate with the battery’s internal state and avoid the interference–prone nature of voltage–based characterization. However, SMCC strategies using a one–step optimization process still face problems in both phase segmentation rationality and optimization efficiency. Simultaneously handling SOC segmentation and current optimization increases the dimensionality of the decision variables, creating a trade–off between segmentation adaptability and algorithmic search efficiency. Prioritizing current optimization may cause the solution to deviate from the internal resistance–SOC characteristics, while joint optimization can slow convergence and increase the risk of trapping in local optima.
To address the aforementioned issues, this study proposes a two-step multi-objective optimization strategy based on SOC segmentation and active learning. The strategy aims to balance charging time and energy loss during the charging process. Its core is to decouple two highly coupled subproblems: SOC segmentation and current optimization. Unlike traditional single–step methods, SOC segmentation is performed first to ensure charging adaptability. Charging currents are then optimized based on the segmentation results. In the first step, an improved canopy–bisecting K–means hybrid clustering algorithm is used. It adaptively divides charging stages according to the nonlinear relationship between battery internal resistance and SOC. Narrow segments are applied in low–SOC regions where internal resistance changes rapidly. Wider segments are used in high–SOC regions with stable resistance. This enhances the adaptability of SOC segmentation to the battery’s internal state. In the second step, a wavelet neural network–multi–objective particle swarm optimization (WNN–MOPSO) co–optimization framework is constructed. The WNN, using Mexican hat wavelets as activation functions, serves as a surrogate model to accurately fit nonlinear relationships during charging and predict charging time and ohmic losses. The MOPSO algorithm is enhanced with logistic chaotic initialization and adaptive t–distribution mutation to rapidly search for optimal currents at each stage. An active learning mechanism is also introduced to further improve optimization accuracy. Key samples are selected from the Pareto front to enrich the training set, iteratively enhancing the surrogate model’s predictive accuracy in critical regions. This forms a closed–loop optimization system. Considering that faster charging often generates excessive heat, which is a critical constraint on battery safety and performance, the strategy intrinsically manages thermal load by minimizing ohmic losses. To validate the framework’s effectiveness in enhancing thermal stability and slowing degradation, a series of comparative experiments were conducted. Differences in thermal behavior and charging performance between the proposed and conventional strategies provide direct evidence of their advantages.

2. Battery Characteristic Testing and Model Parameter Identification

The equivalent circuit model (ECM) is widely adopted for lithium–ion battery modeling due to its simple structure and its capability to accurately represent the electrochemical characteristics of batteries [16]. Considering the significant polarization effects during the charging process, many studies employ a second–order RC model as the equivalent circuit model to balance model accuracy and computational complexity [18]. For detailed derivations, refer to Appendix A.
The battery characterization studies comprise a capacity test, a voltage characteristic test, and a hybrid pulse power characterization (HPPC) test. The tests were performed on Panasonic NCR–18650B battery cells, with characteristics detailed in Table 1.
To accurately construct the battery ECM and obtain key parameters, systematic experiments are required to quantify the battery’s core characteristics. These include actual usable capacity, the mapping between OCV and SOC, and model parameters such as ohmic resistance and polarization resistance. These data provide essential support for subsequent charging strategy optimization. The actual usable capacity is determined through capacity characterization tests to eliminate random errors in capacity measurements. The OCV–SOC relationship is obtained from voltage characterization tests, providing a fundamental mapping for battery state estimation. Key model parameters, such as ohmic resistance and polarization resistance, are identified using offline HPPC tests. These tests focus on capturing the dynamic variation of parameters across different SOC ranges. The detailed procedures, operational steps, data processing methods, and relevant figures, including the OCV–SOC curve and HPPC testing profiles, are provided in Appendix B, Battery Characterization Experiments and Parameter Acquisition, for reference.
Figure 1 shows the parameter identification results for the ohmic internal resistance, R 0 , and the polarization resistances, R 1 and R 2 .
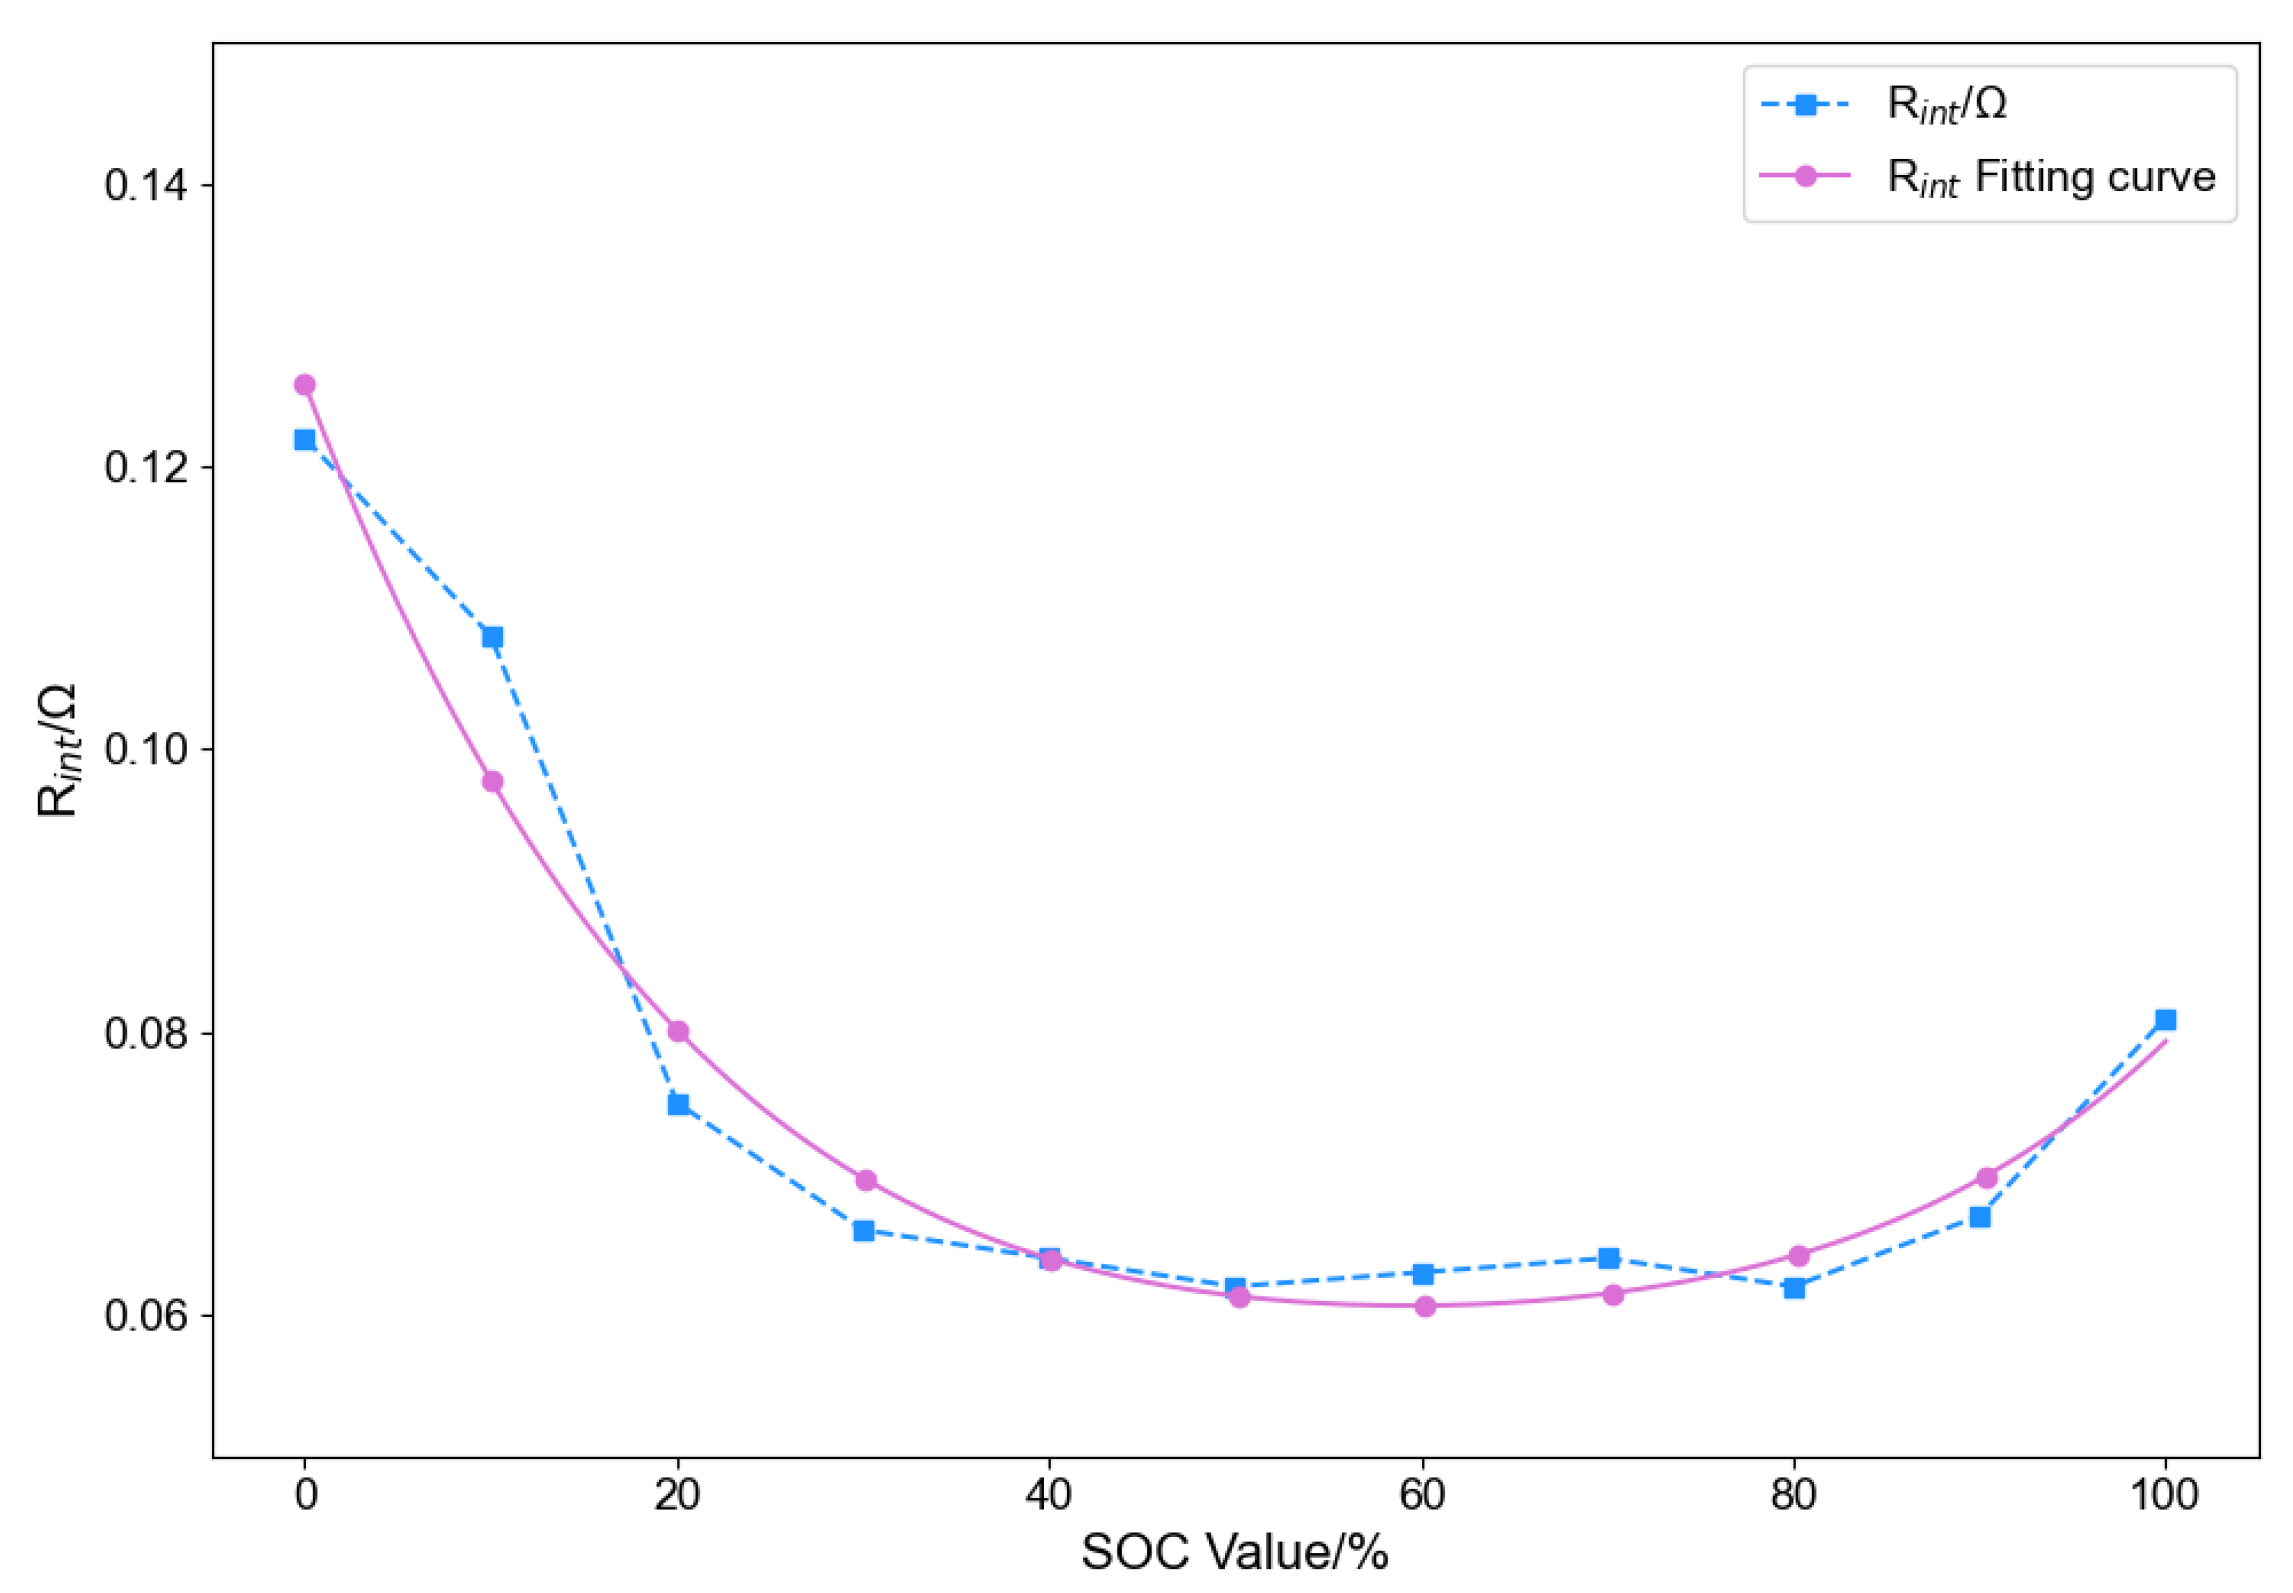
The ohmic and polarization internal resistances have a uniform "U–shaped" pattern concerning SOC, with elevated values at the extremes and diminished values towards the midpoint. When the SOC exceeds 20%, the impact of the C–rate on these resistances is deemed negligible. Consequently, the mean of the internal resistance values recorded at 0.3 C, 0.6 C, and 0.9 C is chosen. In steady–state conditions, the total internal resistance of the battery is considered the aggregate of the ohmic and polarization resistances, as delineated in Equation (1).
R int = R ¯ 0 + R ¯ 1 + R ¯ 2 ,
where R ¯ 0 , R ¯ 1 , and R ¯ 2 are the average values of the ohmic internal resistance and the polarization internal resistances, respectively. The fitting results for the battery’s internal resistance are shown in Figure 2.
Figure 3 juxtaposes the ohmic losses calculated under 0.2 C–1 C constant current settings utilizing two distinct resistance values: the mean internal resistance and the C–rate–dependent resistance. The findings demonstrate that both computed loss values rise consistently with the C–rate. At the 0.2 C rate, the relative inaccuracy of the averaging approach attains 5.62%. Consequently, the charging current is limited to the range of 0.3 C to 1 C. The average relative error of the ohmic loss calculated using the averaging method within this range is 2.18%.

3. Two–Step Optimization Based on Adaptive SOC Staging

3.1. Improved SMCC Strategy

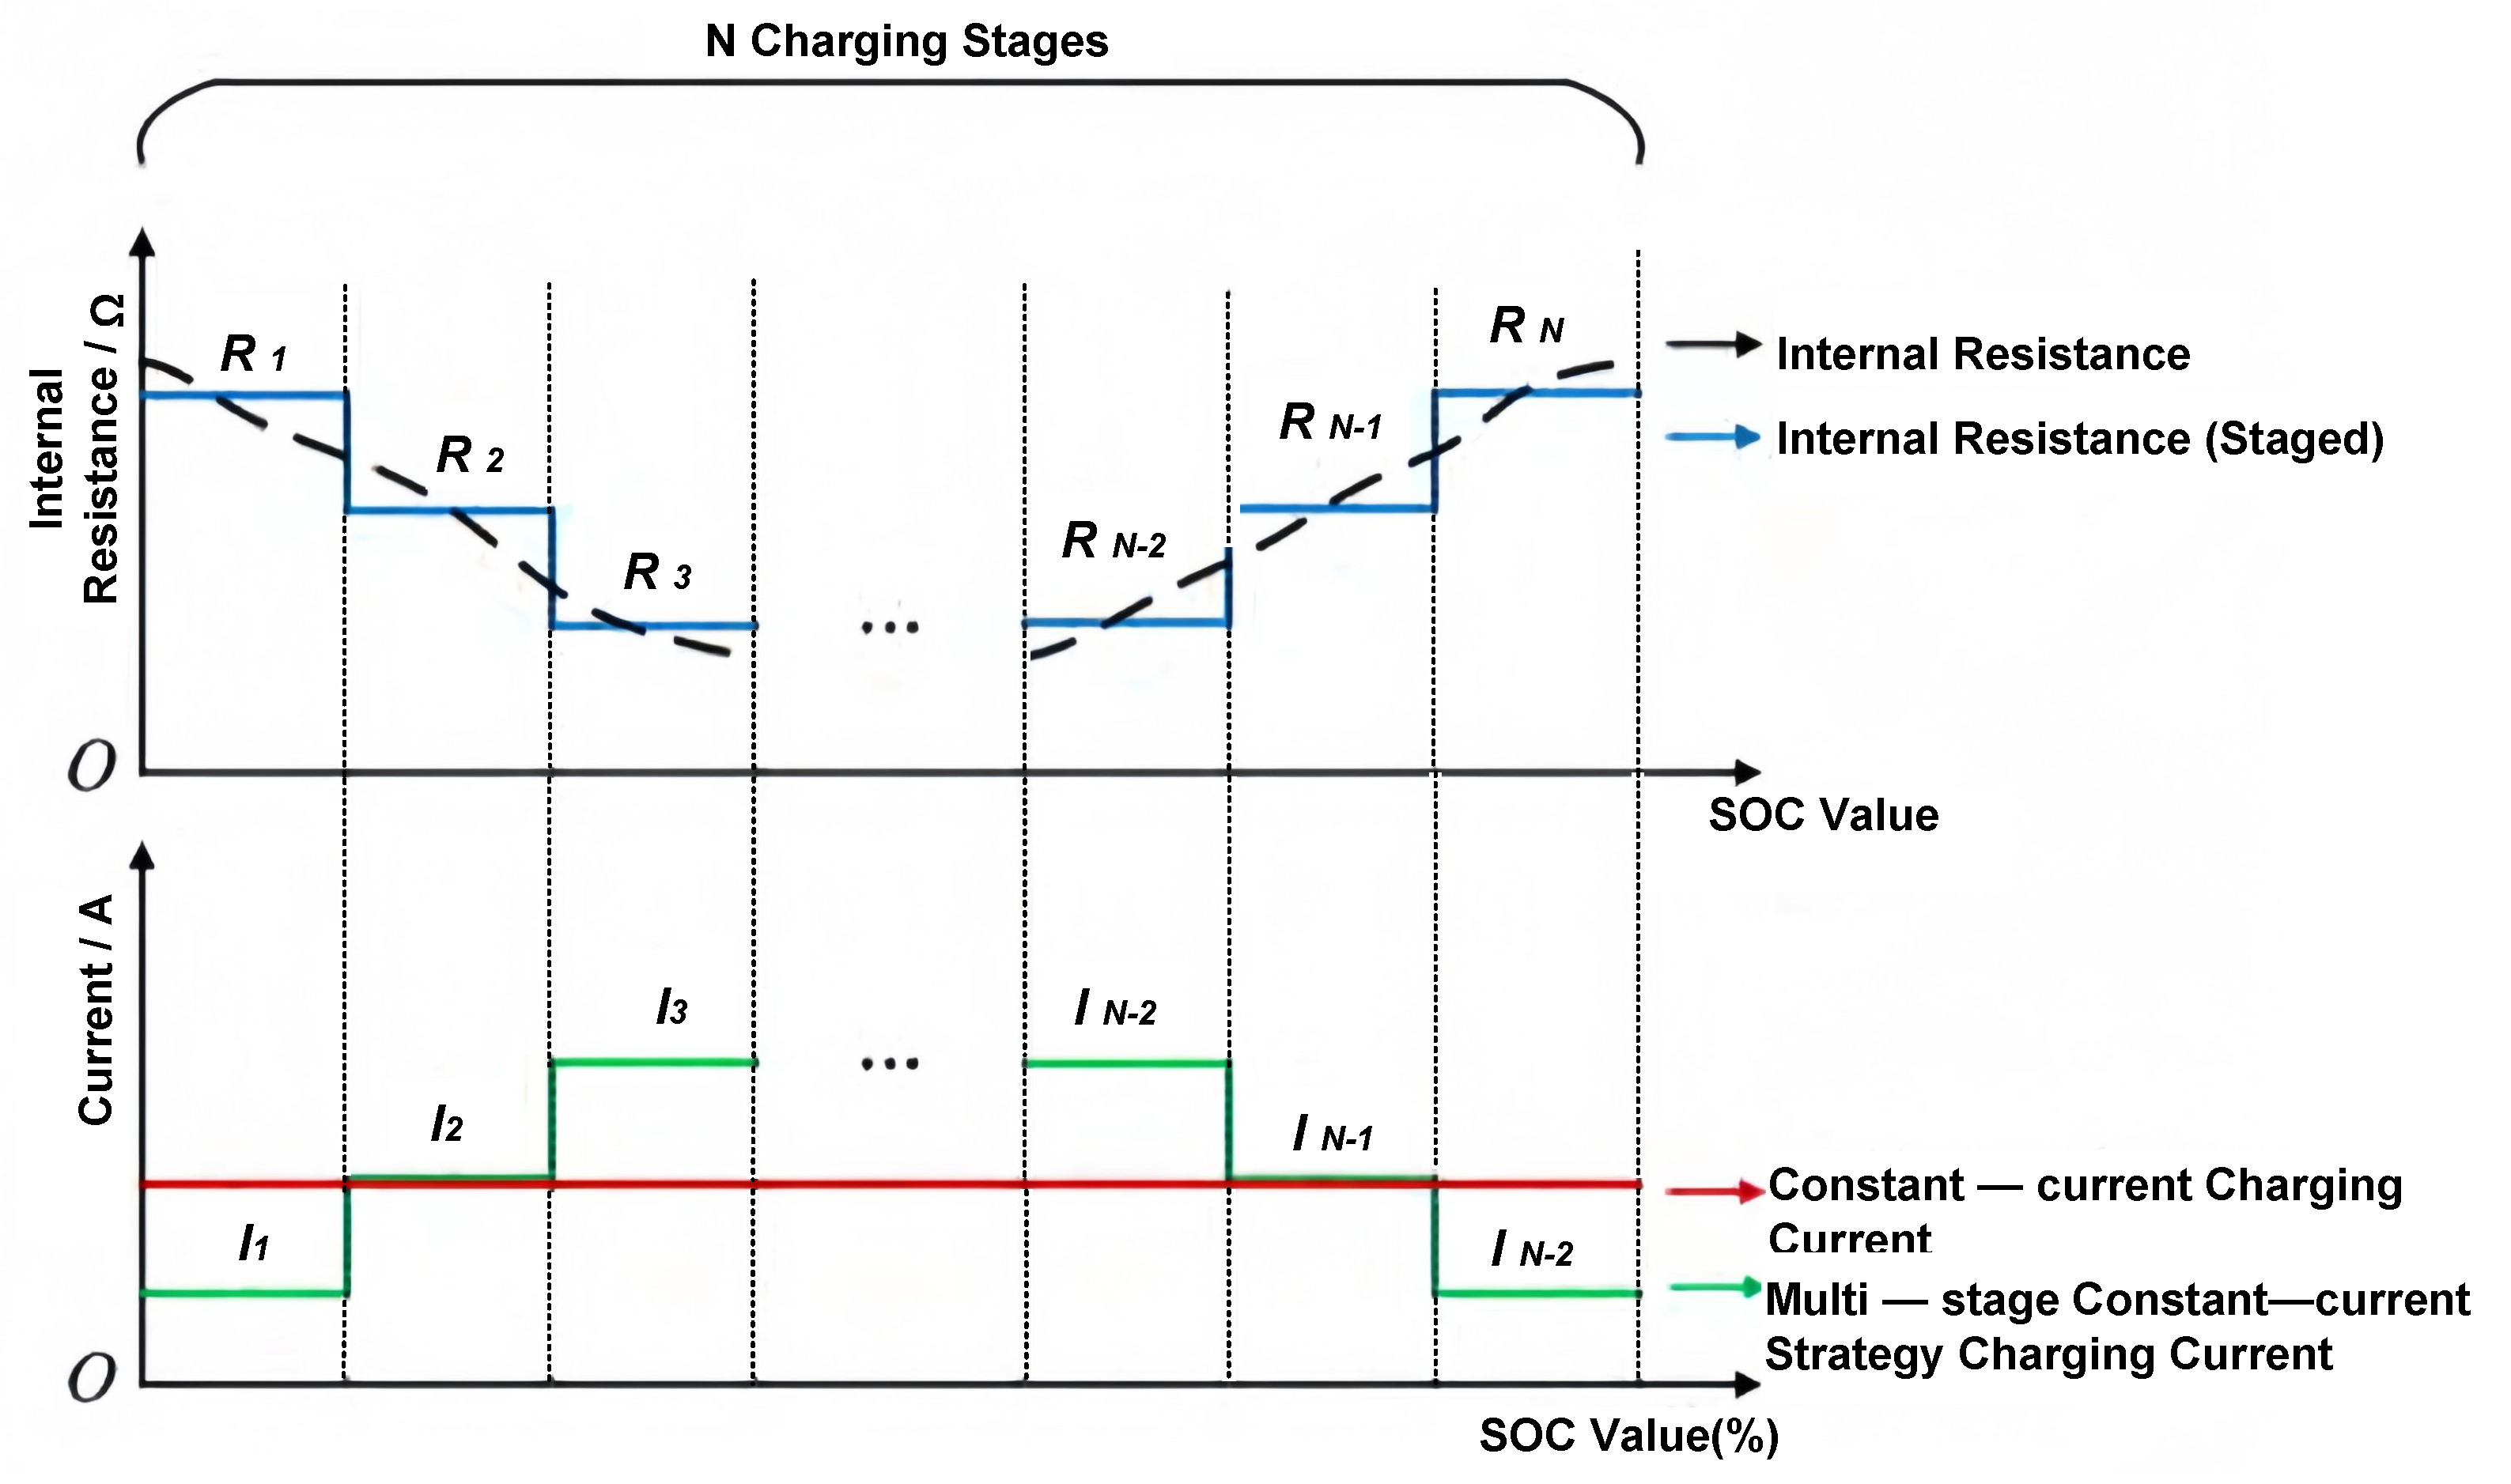
The SMCC charging strategy seeks to enhance the charging efficiency of lithium–ion batteries [19], specifically by staging the process according to the SOC [20]. This technique segments the charging process into several constant current phases. Figure 4 exemplifies the constant current charging phase of the conventional CC–CV method. The charging current at each phase demonstrates an inverse relationship with the battery’s internal resistance. This feature efficiently minimizes energy loss during charging without prolonging the total charging time.
The primary factor contributing to battery charging loss is ohmic loss. Ohmic loss directly affects charging efficiency and is closely associated with the increase in battery temperature during charging, as well as aging and performance degradation over extended use. This study characterizes charging loss as the sum of ohmic losses throughout each charging phase, as delineated in Equation (2).
E loss = i = 1 N I i 2 R i t i i = 1 , 2 , , N .
In the equation, E l o s s represents the charging loss. N is the total number of charging phases. I i , R i , and t i , respectively, represent the charging current, internal resistance, and time for the i-th phase.
To further account for the variation characteristics of battery internal resistance at different SOC stages, an improved SMCC strategy is employed. Unlike the equal-division strategy, the width of each stage in the improved SMCC strategy is not uniform. For ease of description, a coefficient λ is introduced.
λ i = z i z i 1 z max z min .
In the equation, Z m a x represents the upper SOC limit. Z m i n represents the lower SOC limit. Z i is the SOC switching threshold for the i-th phase.
Therefore, the charging time for each battery phase and the total charging time can be expressed as shown in Equations (4) and (5).
t i = λ i Q I i ( z max z min ) ,
T = i = 1 N t i .
In the equation, Q denotes the actual available capacity of the battery, while T signifies the overall charging time. According to the aforementioned definitions and derivations, the current in each step must exhibit a negative correlation with the internal resistance to minimize charging losses. Consequently, the current for each phase must adhere to the following relationship:
i = 1 N I i t i = I 0 T i = 1 N I i 2 R i t i < I 0 2 i = 1 N λ i R i T m , n { 1 , 2 , , N } , m n : R m R n I m I n .

3.2. Charging Strategy Optimization Model

The principal objectives for optimizing the lithium–ion battery charging process are to reduce charging time and diminish battery degradation. Traditional multi–objective optimization methods consolidate many objectives into a single goal by employing weighting coefficients. This approach can easily include human subjective preferences. A recent study employs the charging current of each step as a decision variable to formulate a multi-objective optimization model. This technique removes the impact of subjective weighing on the prioritization of objectives. The objective functions of the multi–objective optimization model for battery charging are delineated in Equation (6). The objective functions of the multi–objective optimization model for battery charging are specified as follows:
min ( f 1 , f 2 ) f 1 = T f 2 = E loss .
The model constraints include two types. The first type consists of constraints for the improved SMCC charging strategy, as shown in Equation (7). The second type consists of battery characteristic constraints, which are detailed in Equation (8).
2.5 V U L 4.2 V 0.3 C I 1 C 0 z z max .
Z m a x is established by the higher state of charge limit derived from the battery’s maximum permissible charging current assessment. The battery examined in this study attains a SOC of 79.3% cut-offching the charging cut–off voltage. Nevertheless, literature [20] suggests that the SMCC method can expedite the charging rate prior to reaching the upper SOC limit; yet, its efficiency is inferior to that of the conventional constant voltage strategy during the latter phase of the constant voltage stage. Consequently, this paper establishes Z m a x at 70% and does not examine the constant voltage region beyond this threshold.

3.3. Two–Phase Optimization Charging Strategy

The two–stage charging method is based on adaptive SOC partitioning. It incorporates staged optimization and an iterative framework combining WNN with MOPSO and active learning. The concrete process is detailed in Figure 5. At the initial stage of optimization, an advanced hybrid clustering algorithm integrating the canopy and bisecting K–means methods is applied to improve the partitioning of charging data. The hybrid clustering algorithm dynamically determines the number of charging phases and the staging methods based on the distribution characteristics of internal resistance with respect to the SOC curve. This method produces the SOC staging results. The second optimization phase employs the results of SOC staging along with the established parameters of the battery equivalent circuit model to compute the optimal operating currents. This is achieved by a closed–loop active learning system that combines a WNN with a multi–strategy enhanced MOPSO algorithm.

3.3.1. Step 1: SOC Staging Optimization Based on the Clustering Algorithm

The improved SOC staging method relies on a clustering algorithm that considers the variation patterns and distribution characteristics of internal resistance in relation to the SOC throughout the charging process. The concrete workflow is illustrated in Figure 5. The calibrated internal resistance–SOC curve is sampled at 1% SOC increments. The internal resistance value for each sample interval is derived from the leftmost point of that period. Subsequently, all sample points are utilized to create a two–dimensional dataset containing SOC and internal resistance as feature characteristics. All sample points are then normalised. Ultimately, cluster analysis is conducted on the sample points utilizing the Euclidean distance. The internal resistance values associated with each cluster center are designated as the distinctive internal resistance values for staging.
The conventional K-means algorithm randomly chooses initial cluster centroids during the initialization phase. This randomness may lead to clustering findings becoming ensnared in local optima, hindering an accurate representation of the data’s true distribution features. This study employs a canopy–bisecting K–means hybrid clustering algorithm for SOC partitioning optimization. The core logic of the hybrid algorithm is to achieve precise clustering through a two–stage collaboration. Initially, the canopy algorithm executes a pre–clustering phase. The fundamental premise is to employ two distance thresholds, d 1 and d 2 , to delineate the extent of the relationship between a sample point and a cluster center. If the Euclidean distance from a sample point to a canopy center is less than d 1 , the point is incorporated within the canopy’s coverage. If the distance is less than d 2 , the point is incorporated into the canopy and simultaneously excluded from the candidate centers to prevent redundant clustering. To streamline parameter configuration and enhance pre-clustering efficiency. In this study, D is defined as the average distance between any two points in the sampling set. Parameters d 1 and d 2 are set equal to D, enabling rapid determination of a reasonable cluster number and providing the basis for the subsequent stage. This method facilitates the swift identification of an adequate number of clusters and establishes a basis for subsequent actions.
The bisecting K–means algorithm subsequently executes the clustering operations based on the initial clusters generated by the canopy algorithm. The bisecting K–means algorithm improves the standard K–means by repeatedly bisecting the data. This process reduces the tendency of the standard method to converge to a local optimum. In each iteration, it identifies the cluster with the highest sum of squared errors (SSE) for bisection. This procedure persists until the designated number of clusters is attained. SSE functions as the primary clustering criterion, with its computation algorithm presented in Equation (9).
S = i = 1 k j = 1 M i ( x i j c i ) 2 , x i j C i , i = 1 , 2 , , N .
In the equation, S represents the calculated value of the sum of squared errors. C i is the i-th cluster. C i and x i , j are the cluster center and a data point of the i-th cluster, respectively. j is the index of a data point within the i-th cluster. M i is the number of data points in the i-th cluster.
This synergistic method establishes the number of clusters using pre–clustering and refines clusters via iterative bisection, so as to avoid the randomness associated with conventional K–means initialization. It enhances the global optimality of clustering results by the dynamic optimization of the SSE. This ultimately establishes a basis for SOC staging that more precisely corresponds with the characteristics of the internal resistance–SOC curve.

3.3.2. Step 2: Tiered Current Multi-Objective Optimization Solution

This section seeks to optimize the charging current I = [ I 1 , I 2 , , I n ] for each segment, according to the defined SOC phase framework. The objective is to achieve a balanced, multi-dimensional minimization of charging time T and resistive loss E loss . Traditional optimization methods rely on extensive, time–consuming physical testing and struggle to accurately depict the nonlinear characteristics of the battery. A synergistic framework consisting of data sampling, WNN modeling, multi–objective particle swarm optimization (MOPSO), and active learning iteration was established to address this issue. The exact technique is as follows:
(1)
Construction of the Initial Sample Library
The Latin hypercube sampling (LHS) technique is employed to ensure that the initial training data uniformly and comprehensively represent the whole solution space. This method generates initial current combinations within the search space. The battery physical model described in Appendix A. is utilized for each existing combination, as detailed in Equations (4)–(6). The model calculates the corresponding actual charging time and resistive loss. This approach generates an initial sample library D with precise labels. The collection provides exceptional data support for the initial training of the WNN approximation model.
(2)
WNN Modeling
A complex nonlinear mapping relationship characterizes the charging process, linking the staged current combinations to the resultant charging time and ohmic loss. This complexity arises from the dynamic changes in the battery’s intrinsic electrochemical characteristics. The arrangement of staged current combinations affects the charging rate and energy conversion efficiency at each level, leading to variations in overall charging time and ohmic loss.
A WNN approximation model is employed in the fitting phase to accurately delineate the mapping relationship. The model’s input comprises the current set combination, whereas the outputs denote charging time and resistive loss. This study does not directly set the key network parameters. Instead, a systematic optimization and screening is conducted. The focus is on the number of hidden layer neurons and the type of activation wavelet function.
The number of neurons in the hidden layer is a crucial factor affecting the learning ability and generalization performance of the WNN. An inadequate sample size may cause the model to fail to accurately capture the nonlinear properties of the data, thereby causing underfitting. This hinders an accurate evaluation of the effects of staged current combinations on charging time and resistive loss. Conversely, an excessive number may result in overfitting, causing the model to overly adapt to noise in the training data. This reduces its generalization ability for new combinations and increases processing costs.
This work employs a five–fold cross–validation method for parameter optimization to objectively determine the optimal number of neurons. The charging method utilizes a five–phase framework, leading to a constant input layer dimension of five, which aligns with the five charging currents. The number of hidden layer neurons is assessed within the candidate range of [ 10 , 15 , 20 , 25 ] . The model’s root mean square error (RMSE) on the test set serves as the principal evaluation statistic. A diminished RMSE number indicates a smaller deviation between the model’s predicted and actual values, signifying improved predictive accuracy. The five–fold cross–validation method aids in determining the optimal number of hidden layer neurons that balances predictive accuracy with computational efficiency, while preserving the model’s generalization capacity.
Table 2 demonstrates that with 20 hidden–layer neurons, the WNN attains the minimal RMSE in its predictions. The root mean square error for charging time is 142.3 s, and for ohmic loss, it is 38.5 joules. Despite the extended model training time for this configuration compared to employing 10 or 15 neurons, the notable enhancement in prediction accuracy illustrates the benefits of this parameter value.
In summary, using 20 concealed neurons guarantees elevated prediction accuracy while keeping computing expenses within a manageable scope. This method achieves an ideal equilibrium between prediction performance and computational economy. It offers dependable performance assistance for the following enhancement of the charging method utilizing the WNN approximation model. To attain an accurate fit throughout the training and optimization process, the input and output data are initially standardized. A backpropagation technique utilizing exact gradients is subsequently implemented. This algorithm incrementally adjusts the network weights, biases, and the scaling or translation parameters of the wavelets to reduce the mean squared error between the anticipated and actual values.
In choosing the activation function, informed by the aforementioned network structure optimization results, attention now turns to the appropriateness of the wavelet basis function. The Mexican hat wavelet function, being the second derivative of the Gaussian function, displays a symmetric "hat–shaped" waveform. It is acutely responsive to the ephemeral fluctuations occurring during the battery’s charging and discharging phases. This enables precise capturing of nonlinear characteristics, such as the fast variations in internal resistance at low state–of–charge phases. Concurrently, being a real–valued symmetric function, its response to the bidirectional signals of voltage and current during both charging and discharging is impartial. This mitigates issues like the Haar wavelet’s inadequate resolution for minor, abrupt variations and the feature extraction bias of the Daubechies wavelet due to its asymmetry. These attributes render it more appropriate for representing the intricate dynamic properties of a battery. The Mexican hat wavelet function is presented in Equation (10):
ψ ( x ) = cos ( 1.75 x ) exp ( 0.5 x 2 ) .
In the equation, x denotes the normalized input feature variable.
(3)
Enhanced MOPSO for Multi–Objective Pareto Front Exploration
A multi-strategy enhanced MOPSO algorithm [18,19,21] is utilized to search for the Pareto optimal solution, employing the prediction results of the trained WNN as the objective function. Four essential improvement tactics are proposed to markedly boost the global search capabilities, convergence speed, and stability of the basic MOPSO.
  • Logistic Chaotic Initialization
The distribution features of the initial population directly influence the global search efficiency of the algorithm. Traditional random initialization often causes particles to cluster locally in the solution space. This increases the risk of premature convergence to a local optimum. A logistic chaotic map is employed to produce the first particle swarm to resolve this issue. The logistic map exemplifies a one–dimensional nonlinear dynamical system. Despite its straightforward mathematical formulation, it can generate intricate chaotic behavior [22]. When the control parameter is fixed at a certain value, the resulting sequence demonstrates characteristics including ergodicity, pseudo-randomness, and pronounced sensitivity to initial conditions. Utilizing these attributes, an initial swarm can be generated that is more evenly distributed and provides broader coverage than groups formed through conventional pseudo–random numbers. This establishes a robust basis for the algorithm’s global search functionality.
The iterative equation for the Logistic map is defined as shown in Equation (11).
x k + 1 = μ · x k ( 1 x k ) .
In this equation, x k denotes the chaotic variable produced during the k-th iteration, with values spanning from 0 to 1. The initial value x 0 is randomly chosen from the interval [ 0 , 1 ] , excluding fixed values such as 0, 0.25, 0.5, 0.75, and 1. The variable μ serves as the chaotic control parameter, with a range from 0 to 4.
When the control parameter μ = 4 , the logistic map can produce a chaotic sequence that spans the full interval from 0 to 1. This sequence has a more uniform distribution compared to conventional pseudo–random numbers. The disordered sequence is subsequently transformed linearly to the real search space of the charging current, delineated by [ l b j , u b j ] , where l b j and u b j represent the lower and upper bounds of the j-th dimensional variable, respectively. This guarantees that the initial particles are evenly and extensively dispersed within the feasible solution space, hence improving population diversity and establishing a basis for the algorithm to evade local optima. The initial position P i , j of the j-th dimension for the i-th particle is determined by Equation (12).
P i , j = l b j + x i · ( u b j l b j ) .
The logistic chaotic initialization method guarantees that the initial particle swarm attains a uniform and extensive distribution throughout the entire possible solution space. This considerably increases population variety, hence augmenting the algorithm’s capacity to evade local optimal solutions. Algorithm 1 delineates the initialization procedure of the multi–strategy enhanced MOPSO. It basically builds the initial particle swarm with the Logistic chaotic map to augment population variety and establish a basis for global optimization.
Algorithm 1 Multi-Strategy Enhanced MOPSO–Part 1: Initialization.
1:
Input: ObjectiveFunctions, pop_size, dim, max.iter, archive_size, var_min, var_max
2:
Output: External_Archive: A set of non–dominated solutions (the Pareto front)
3:
procedure Initialize_Population ▷ Phase 1: Initialization using Logistic Chaos Map
4:
       P o p u l a t i o n empty list
5:
       x c h a o s a random value in (0,1), avoiding fixed points
6:
      for  i 1 to p o p _ s i z e  do
7:
             p a r t i c l e . p o s i t i o n new array of size d i m
8:
            for  j 1 to d i m  do
9:
                  x c h a o s 4.0 × x c h a o s × ( 1 x c h a o s )
10:
                p a r t i c l e . p o s i t i o n [ j ] v a r _ m i n [ j ] + x c h a o s × ( v a r _ m a x [ j ] v a r _ m i n [ j ] )
11:
           end for
12:
             p a r t i c l e Create_Particle( p a r t i c l e . p o s i t i o n )
13:
            p a r t i c l e . o b j e c t i v e s Evaluate(ObjectiveFunctions, p a r t i c l e . p o s i t i o n )
14:
            p a r t i c l e . p b e s t . p o s i t i o n p a r t i c l e . p o s i t i o n
15:
            p a r t i c l e . p b e s t . o b j e c t i v e s p a r t i c l e . o b j e c t i v e s
16:
           Add p a r t i c l e to P o p u l a t i o n
17:
      end for
18:
       E x t e r n a l _ A r c h i v e Update_Archive( P o p u l a t i o n , empty archive, a r c h i v e _ s i z e )
19:
      return  P o p u l a t i o n , E x t e r n a l _ A r c h i v e
20:
end procedure
2.
Adaptive t–Distribution Mutation
An adaptive t–distribution mutation operator is incorporated post particle location updates to avert premature convergence of the algorithm during the iteration phase [23]. This operator adeptly equilibrates the algorithm’s global exploration and local exploitation skills by dynamically modifying the perturbation intensity. The mutation operation for the particle population is delineated in Equation (13).
X k = X k + η t ( k ) X k .
In the equation, X k denotes the particle’s current position, and the outcome of the operation yields the new position upon mutation. The variable t ( k ) is a random variable that adheres to a t–distribution, with the iteration number k representing its degrees of freedom.
Figure 6 illustrates the dynamic alteration in the form of the t–distribution’s probability density function as the degrees of freedom vary. During the initial phases of iteration, when k is minimal, the distribution exhibits a wide profile akin to a Cauchy distribution. This facilitates the generation of perturbations with substantial step sizes, thereby helping the algorithm perform global search and avoid entrapment in local optima. In the advanced phases of iteration, as k escalates, the distribution’s shape progressively constricts, converging towards a Gaussian distribution. As a result, the perturbation step size diminishes, enabling a meticulous search within the vicinity of the previously identified optimal solutions.
Additionally, to regulate the overall strength of the mutation and prevent excessively large mutation values from causing the algorithm’s results to diverge, an adaptive mutation control parameter η is introduced, as shown in Equation (14).
η = k max k k max .
In the equation, k m a x denotes the maximum iteration count. The parameter η drops linearly from 1 to 0 throughout the iteration phase. This architecture maintains a robust influence of the mutation in the initial phases of iteration, hence enhancing the algorithm’s global exploration capacity. The impact of the parameter progressively diminishes in the later phases of iteration to guarantee convergence stability. This architecture allows the adaptive t–distribution mutation technique to markedly enhance the performance and stability of the MOPSO algorithm.
3.
Velocity Clamping
In the conventional PSO technique, particle velocity may escalate considerably across iterations. This may result in particles exceeding the effective search bounds or bypassing the optimal solution area, causing algorithm instability or potential divergence [17]. A velocity clamping approach is specifically formulated to tackle this issue. The principle sets dynamic upper and lower bounds, V max and V min , for each particle’s velocity. These bounds correspond to the search range of the decision variables. Upon updating the velocity in each iteration, if it surpasses V m a x , it is restricted to V m a x . If it falls below V m i n , it is restricted to V m i n . The velocity clamping mechanism restricts particle movement within a single iteration, hence maintaining the stability and convergence of the search process. Algorithm 2 effectively addresses the issue of numerical instability.
Algorithm 2 Multi-Strategy Enhanced MOPSO–Part 2: Main Iteration Loop.
1:
procedure Main_Loop(Population, External_Archive) ▷ Phase 2: Main Iteration Loop
2:
      for  k 1 to m a x . i t e r  do
3:
            for each p a r t i c l e in P o p u l a t i o n  do
4:
                    g b e s t TOURNAMENT_SELECTION( E x t e r n a l _ A r c h i v e )                     ▷ Strategy 1
5:
                    V m a x 0.2 × ( v a r _ m a x v a r _ m i n )                                        ▷ Strategy 2: Clamping
6:
                   for  j 1 to d i m  do
7:
                          r 1 , r 2 random values in [ 0 , 1 ]
8:
                          v c o g n i t i v e c 1 × r 1 × ( p a r t i c l e . p b e s t _ p o s i t i o n [ j ] p a r t i c l e . p o s i t i o n [ j ] )
9:
                          v s o c i a l c 2 × r 2 × ( g b e s t . p o s i t i o n [ j ] p a r t i c l e . p o s i t i o n [ j ] )
10:
                        p a r t i c l e . v e l o c i t y [ j ] w × p a r t i c l e . v e l o c i t y [ j ] + v c o g n i t i v e + v s o c i a l
11:
                        p a r t i c l e . v e l o c i t y [ j ] max ( V m a x [ j ] , min ( p a r t i c l e . v e l o c i t y [ j ] , V m a x [ j ] ) )
12:
                   end for
13:
                    p a r t i c l e . p o s i t i o n p a r t i c l e . p o s i t i o n + p a r t i c l e . v e l o c i t y
14:
                   CLIP( p a r t i c l e . p o s i t i o n , v a r _ m i n , v a r _ m a x )
15:
                    σ random from t–distribution with k degrees of freedom              ▷ Strategy 3
16:
                    α 1 ( k / m a x . i t e r )
17:
                    m u t a t e d _ p o s i t i o n p a r t i c l e . p o s i t i o n + α × σ × t r a n d
18:
                    p a r t i c l e . p o s i t i o n CLIP( m u t a t e d _ p o s i t i o n , v a r _ m i n , v a r _ m a x )
19:
                    p a r t i c l e . o b j e c t i v e s Evaluate(ObjectiveFunctions, p a r t i c l e . p o s i t i o n )
20:
                   if Dominates( p a r t i c l e . o b j e c t i v e s , p a r t i c l e . p b e s t . o b j e c t i v e s ) then
21:
                        p a r t i c l e . p b e s t . p o s i t i o n p a r t i c l e . p o s i t i o n
22:
                        p a r t i c l e . p b e s t . o b j e c t i v e s p a r t i c l e . o b j e c t i v e s
23:
                   end if
24:
          end for
25:
           E x t e r n a l _ A r c h i v e    Update_Archive( P o p u l a t i o n E x t e r n a l _ A r c h i v e , a r c h i v e _ s i z e )
26:
     end for
27:
     return  E x t e r n a l _ A r c h i v e
28:
end procedure
4.
Crowding Distance–Based Tournament Leader Selection
A superior Pareto front must fulfill the criteria of convergence and diversity. In the MOPSO algorithm, particles must identify a global best leader (gbest) from an external archive containing non–dominated solutions. This gbest thereafter directs the search procedure. When only the highest–performing leader is chosen, particles tend to aggregate in localized areas of the front, resulting in a diminished variety within the solution set. Consequently, a tournament selection procedure is employed to identify the gbest. Two possible solutions are randomly selected from the external archive. The solutions are initially evaluated according to their dominance relationship, with the dominant solution prevailing. If no dominance relationship is present, the solution in the less populated area is selected. The tournament selection process increases the likelihood of selecting solutions in sparse areas of the Pareto front as leaders. This drives particles to explore uncharted areas, addressing gaps in the front’s distribution and ultimately enhancing the diversity and homogeneity of the solution set.
Algorithm 3 delineates the sub–processes encompassed under the multi-strategy improved MOPSO. This encompasses the crowding–degree–based tournament leader selection and the external archive update approach, both aimed at improving the diversity and homogeneity of the solution set.
Algorithm 3 Multi–Strategy Enhanced MOPSO–Part 3: Sub-procedures.
1:
procedure TOURNAMENT_SELECTION(Archive)                                            ▷ Strategy 4
2:
      candidate1 ← Randomly select from Archive
3:
      candidate2 ← Randomly select from Archive
4:
      if Dominates(candidate1, candidate2) then
5:
            return candidate1
6:
      else if Dominates(candidate2, candidate1) then
7:
              return candidate2
8:
      else
9:
              if candidate1.crowding_distance > candidate2.crowding_distance then
10:
                  return candidate1
11:
             else
12:
                  return candidate2
13:
             end if
14:
      end if
15:
end procedure
16:
procedure UPDATE_ARCHIVE(Population, Archive, archive_size)
17:
      Combined_Set ← Archive ∪ Population
18:
      Non_Dominated_Set ← Find non-dominated solutions in Combined_Set
19:
      if size of Non_Dominated_Set > archive_size then
20:
            CALCULATE_CROWDING_DISTANCE(Non_Dominated_Set)
21:
            Sort(Non_Dominated_Set) by descending crowding distance
22:
            return TRUNCATE(Non_Dominated_Set to archive_size)
23:
      else
24:
            return Non_Dominated_Set
25:
      end if
26:
end procedure
(4)
Closed–Loop Optimization Mechanism Based on Active Learning
This framework incorporates an active learning mechanism to enhance the prediction accuracy of the WNN approximation model along the Pareto front, establishing a closed–loop iterative process of optimization, sampling, and retraining. Upon completion of the initial optimization, the framework executes multiple rounds of active learning iterations.
In each iteration, a small set of representative candidate charging strategies is randomly selected from the current MOPSO–derived Pareto front as key samples, typically consisting of five strategies. The physical model delineated in Equations (8)–(11) is employed to precisely assess these five techniques, augment them with true labels, and acquire their actual performance metrics. The newly obtained real sample points are subsequently incorporated into the sample library. The WNN model is retrained using the larger library to improve its forecast accuracy in the region of possibly optimal solutions. The MOPSO method is subsequently conducted on the revised approximation model to attain a more accurate search. This iterative methodology effectively produces a Pareto front that closely resembles the genuine optimal solutions of the physical system. This is accomplished through the profound integration of data-driven modeling and multi–objective optimization, offering both theoretical and technical assistance for the rapid charging of power batteries.
To further highlight the advantages of the proposed method in addressing the coordinated optimization of SOC segmentation and current allocation, a mechanism–level comparison with existing mainstream optimization frameworks is necessary. Compared with conventional hierarchical or hybrid optimization frameworks, the proposed two–step decoupling approach exhibits fundamental differences in mechanism. Specifically, hierarchical frameworks typically consist of upper– and lower–level models that interact iteratively to handle coupled problems [24]. Hybrid frameworks aim to integrate multiple optimization algorithms to solve the same complex problem [25,26]. These traditional methods usually address SOC segmentation and current allocation simultaneously within a single optimization framework. Although such synchronous modeling can balance adaptability and performance to some extent, it significantly increases the dimensionality of decision variables. Consequently, the search space expands rapidly, reducing optimization efficiency, slowing convergence, and often leading to local optima.
In contrast, the proposed method explicitly decouples SOC segmentation from current optimization. SOC segmentation is first determined independently using a canopy–bisecting K–means clustering algorithm based on the nonlinear relationship between battery internal resistance and SOC. This ensures that segmentation accurately reflects the battery’s internal physical characteristics and remains stable during optimization. Current optimization is then performed under the fixed segmentation structure using the WNN-MOPSO active learning framework to rapidly search for multi–objective optimal solutions. This sequential, decoupled approach effectively avoids redundant searches caused by high–dimensional coupling. It improves global convergence and computational efficiency while ensuring that the optimization results are highly consistent with the battery’s true physical characteristics. Therefore, the proposed decoupling framework is not a simple variant of hierarchical or hybrid methods. It represents a fundamental advancement in both theoretical logic and solution mechanisms.

4. Results and Discussion

4.1. Analysis and Discussion of Optimization Results

Clustering-Based Multi–Phase Optimization Results

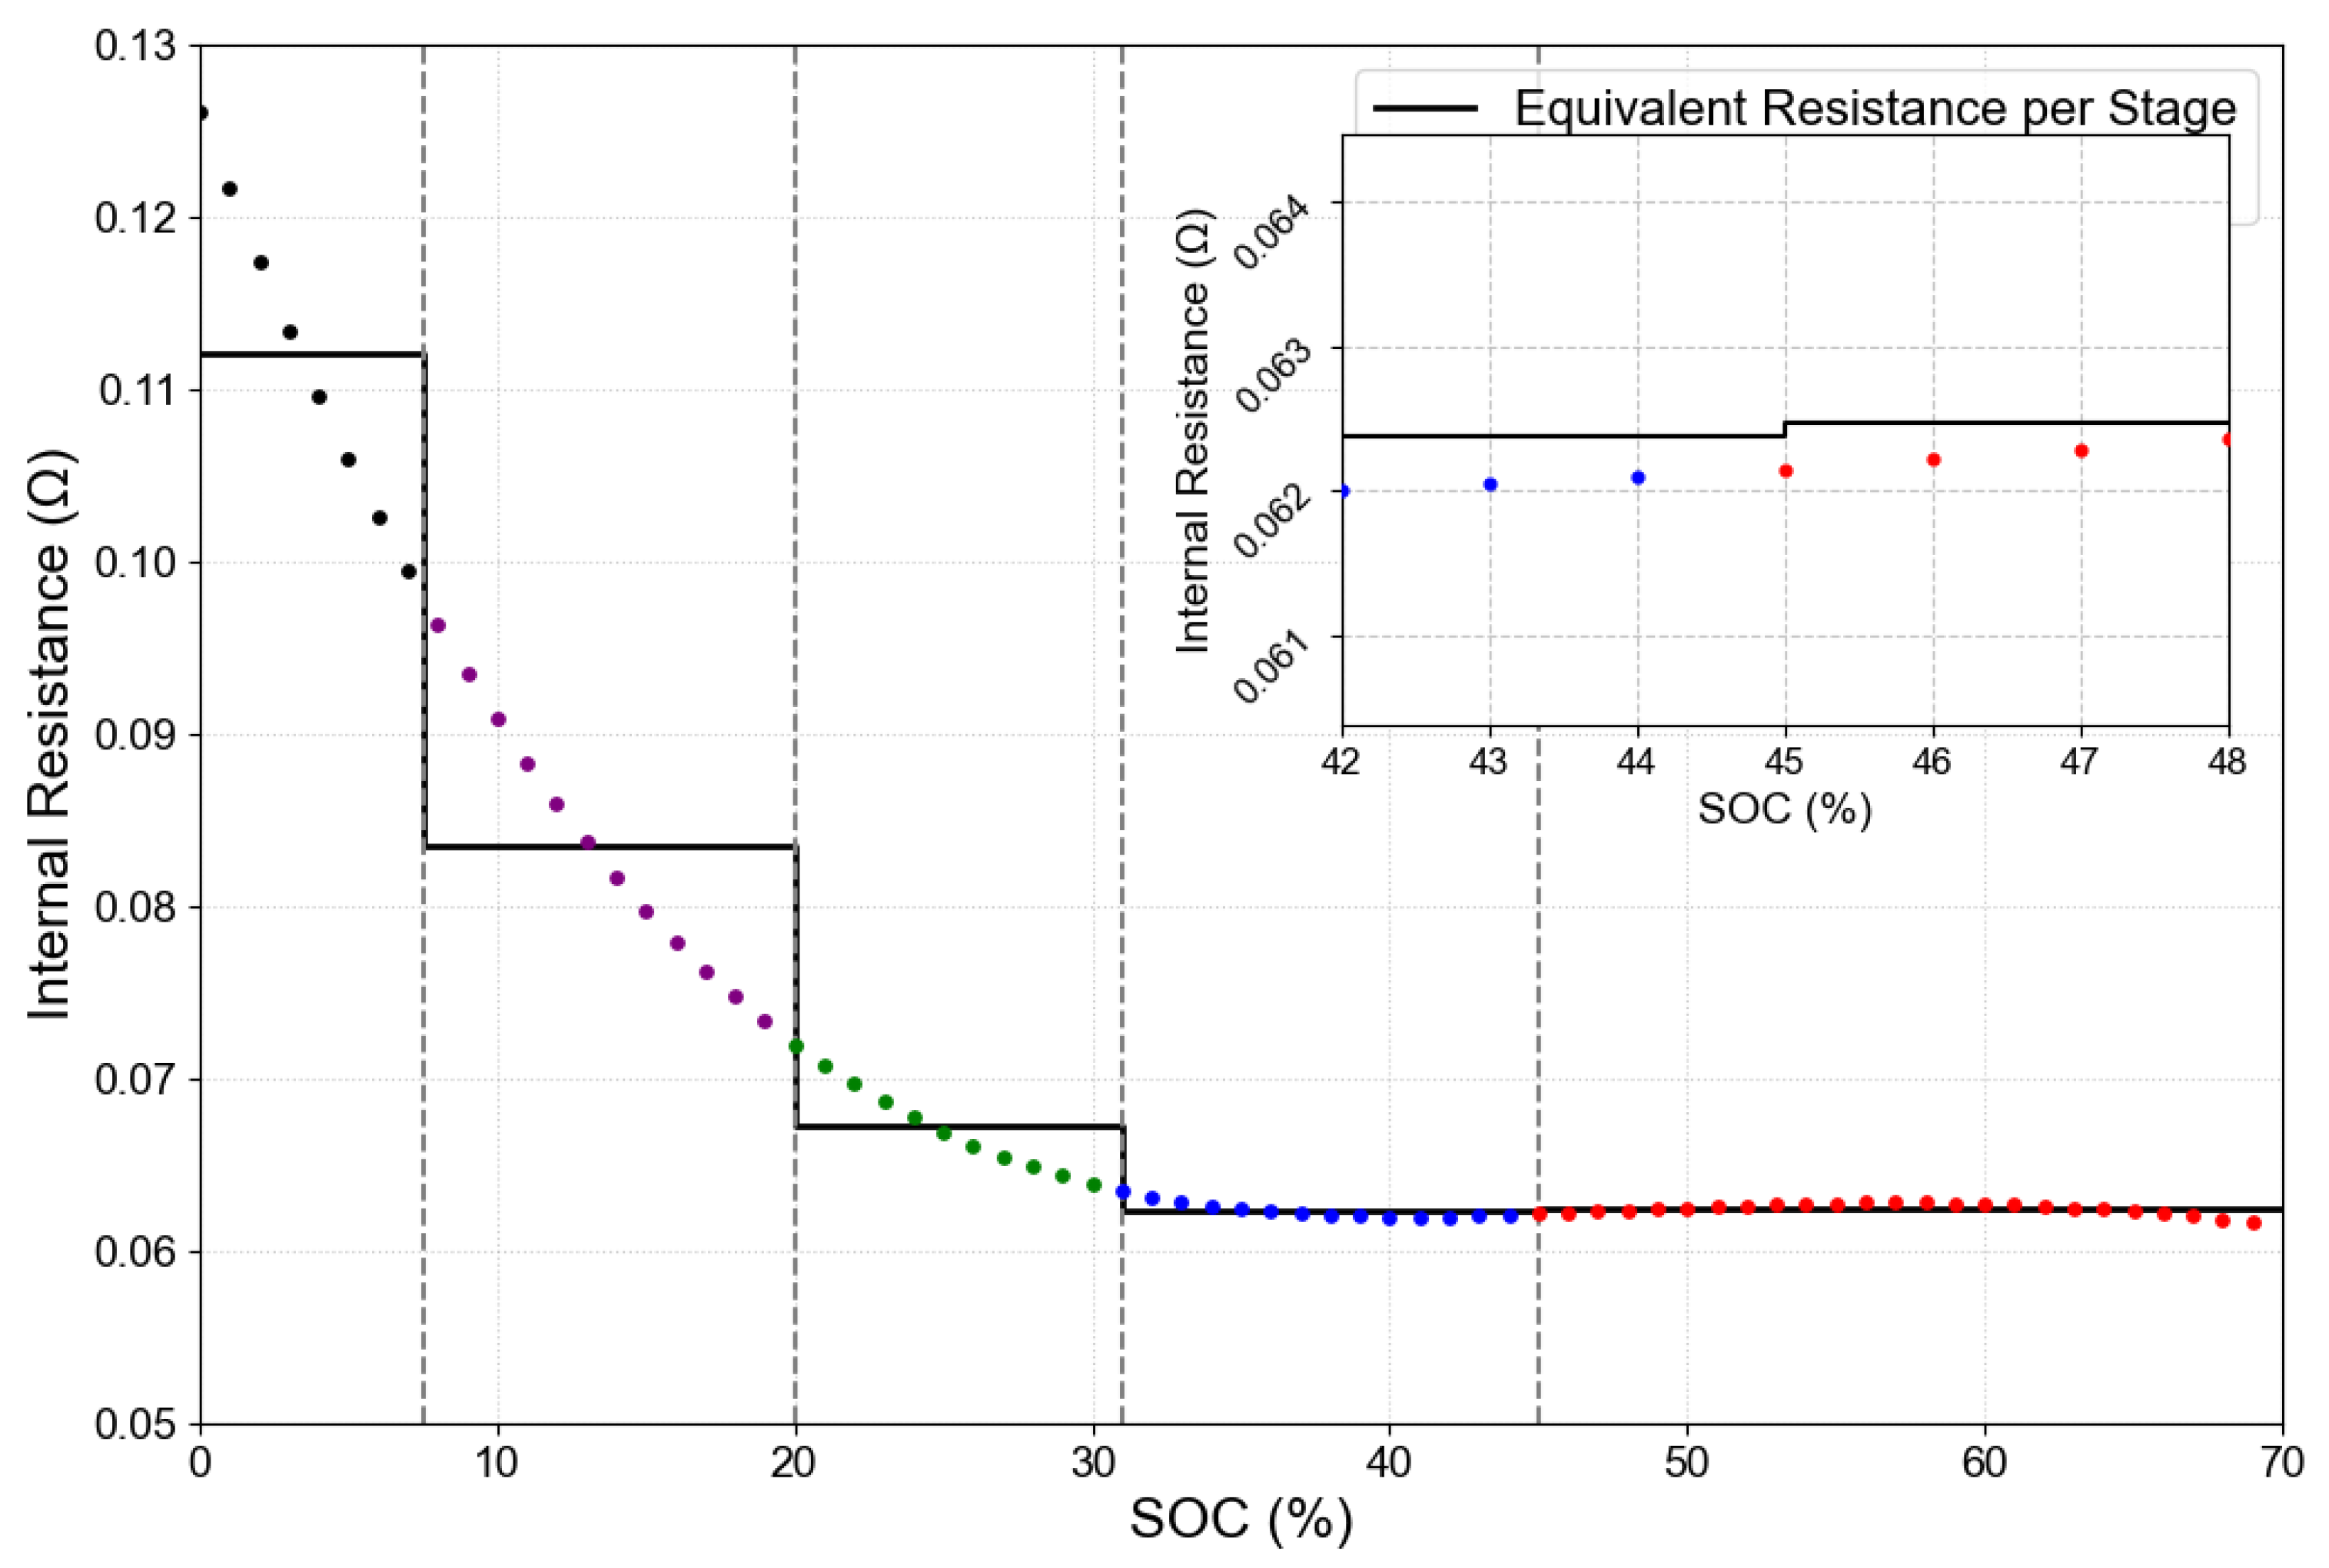
Figure 7 illustrates that each point corresponds to a sample derived from the fitted internal resistance curve of the battery, with a step size of 1% for the SOC. The canopy method was utilized on these sample points, leading to the identification of five clusters. This entails segmenting the variation process of internal resistance concerning SOC into five discrete phases. The SOC staging outcome adjusts to the dynamic fluctuation properties of internal resistance as SOC fluctuates. This clustering–based staging method effectively identifies internal resistance characteristics across various SOC intervals by analyzing the distribution pattern of the internal resistance–SOC curve, all while ensuring computational efficiency. This establishes a sound basis for interval segmentation in the next phase of optimization of the charging current.
As shown in Figure 8, the figure illustrates the changes in the sum of squared errors (SSE) of the internal resistance within each cluster as well as the total SSE for the entire set of internal resistance sample points. These changes correspond to different numbers of clusters obtained from the bisecting K–means algorithm. The internal resistance sample points were derived from the fitted curve using a 1% step size of the SOC.
It can be observed from Figure 8 that both types of SSE decrease as the number of clusters increases. Notably, distinct inflection points appear at four and three clusters, respectively. When the number of clusters exceeds four, the rate of decrease for both SSE metrics slows significantly, and further increases in the number of phases no longer result in substantial reductions. This indicates that the SOC staging corresponding to five clusters already meets the accuracy requirements for describing the internal resistance variation process. Increasing the number of phases beyond this point yields limited improvements in descriptive accuracy.
To control the variables in the comparative experiment, the number of phases for the equal-division multi–phase constant current charging strategy is also set to five. The specific division results for the optimized staging method and the equal–division method are shown in Table 3.
At a low SOC, the internal resistance diminishes swiftly as the SOC rises. The refined SOC staging technique resolves this issue by employing narrower SOC intervals to precisely capture these variations. At an elevated state of charge, the internal resistance remains consistent and exhibits less variation, so the optimal staging employs broader intervals, consequently simplifying the charging method. The optimized technique more accurately aligns with the real pattern of internal resistance variation with state of charge than equal-division staging. An SSE study indicated a 53.6% enhancement in the accuracy of internal resistance description. This enhancement is ascribed to the markedly elevated information entropy of resistance variations in the low state of charge area. The narrow phases accurately delineate this high–entropy region by augmenting sampling density, but the large phases in the high SOC region diminish the complexity of decision variables, achieving a balance between precision and processing efficiency. To assess the efficacy of each enhancement method in the MOPSO algorithm, the fundamental operational parameters are established as detailed in Table 4. This study employs three prominent performance evaluation metrics: the inverted generational distance (IGD), the diversity metric (DM), and the spacing (SP) metric. Table 5 presents the comparative findings on standard benchmark functions, including ZDT2, ZDT4, and ZDT6. In the ZDT2 test function, the IGD of the enhanced MOPSO diminished from 0.429 for the standard MOPSO to 0.010, indicating a reduction of 97.6%. This notable enhancement mostly results from the synergy between the Logistic chaotic initialization and the crowding-degree-based tournament leader selection process. The Logistic chaotic initialization establishes a basis for global search by producing a uniformly distributed beginning population, so effectively circumventing the local clustering typical of conventional random initialization. The crowding-degree selection process improves the homogeneity of the solution set by favoring solutions in sparse regions as leaders.
In the ZDT4 test function, the DM of the enhanced MOPSO diminished from 2.896 for the standard MOPSO to 1.445, indicating a decrease of 50.1%. The fundamental mechanism driving this enhancement is the implementation of the adaptive t-distribution mutation operator. During the initial phases of iteration, the t–distribution is expansive and generates substantial disturbances, facilitating the algorithm’s escape from local optima. In the last phases, the distribution constricts and the perturbation step size diminishes, facilitating a meticulous search in the vicinity of the ideal solution. This methodology harmonizes global exploration with local exploitation. In the ZDT6 test function, the IGD of the enhanced MOPSO was about equivalent to that of the standard MOPSO. The velocity clamping method efficiently mitigated excessive disturbances from the mutation operator, leading to a substantial enhancement in the stability of the solution set.
The enhanced MOPSO demonstrates greater efficacy in multi–objective optimization contexts compared to the baseline PSO algorithm. The PSO method does not provide a mechanism to control the diversity of the solution set. As a result, its IGD on the ZDT2 test is significantly better than that of the enhanced MOPSO. However, the uniformity of its solution set, measured by the SP metric, remains insufficient. This complicates the simultaneous attainment of convergence and diversity, which are essential in multi–objective optimization. This finding corresponds with the discoveries made by Ahn et al., indicating that the efficacy of single-objective optimization methods is constrained in multi–objective scenarios.
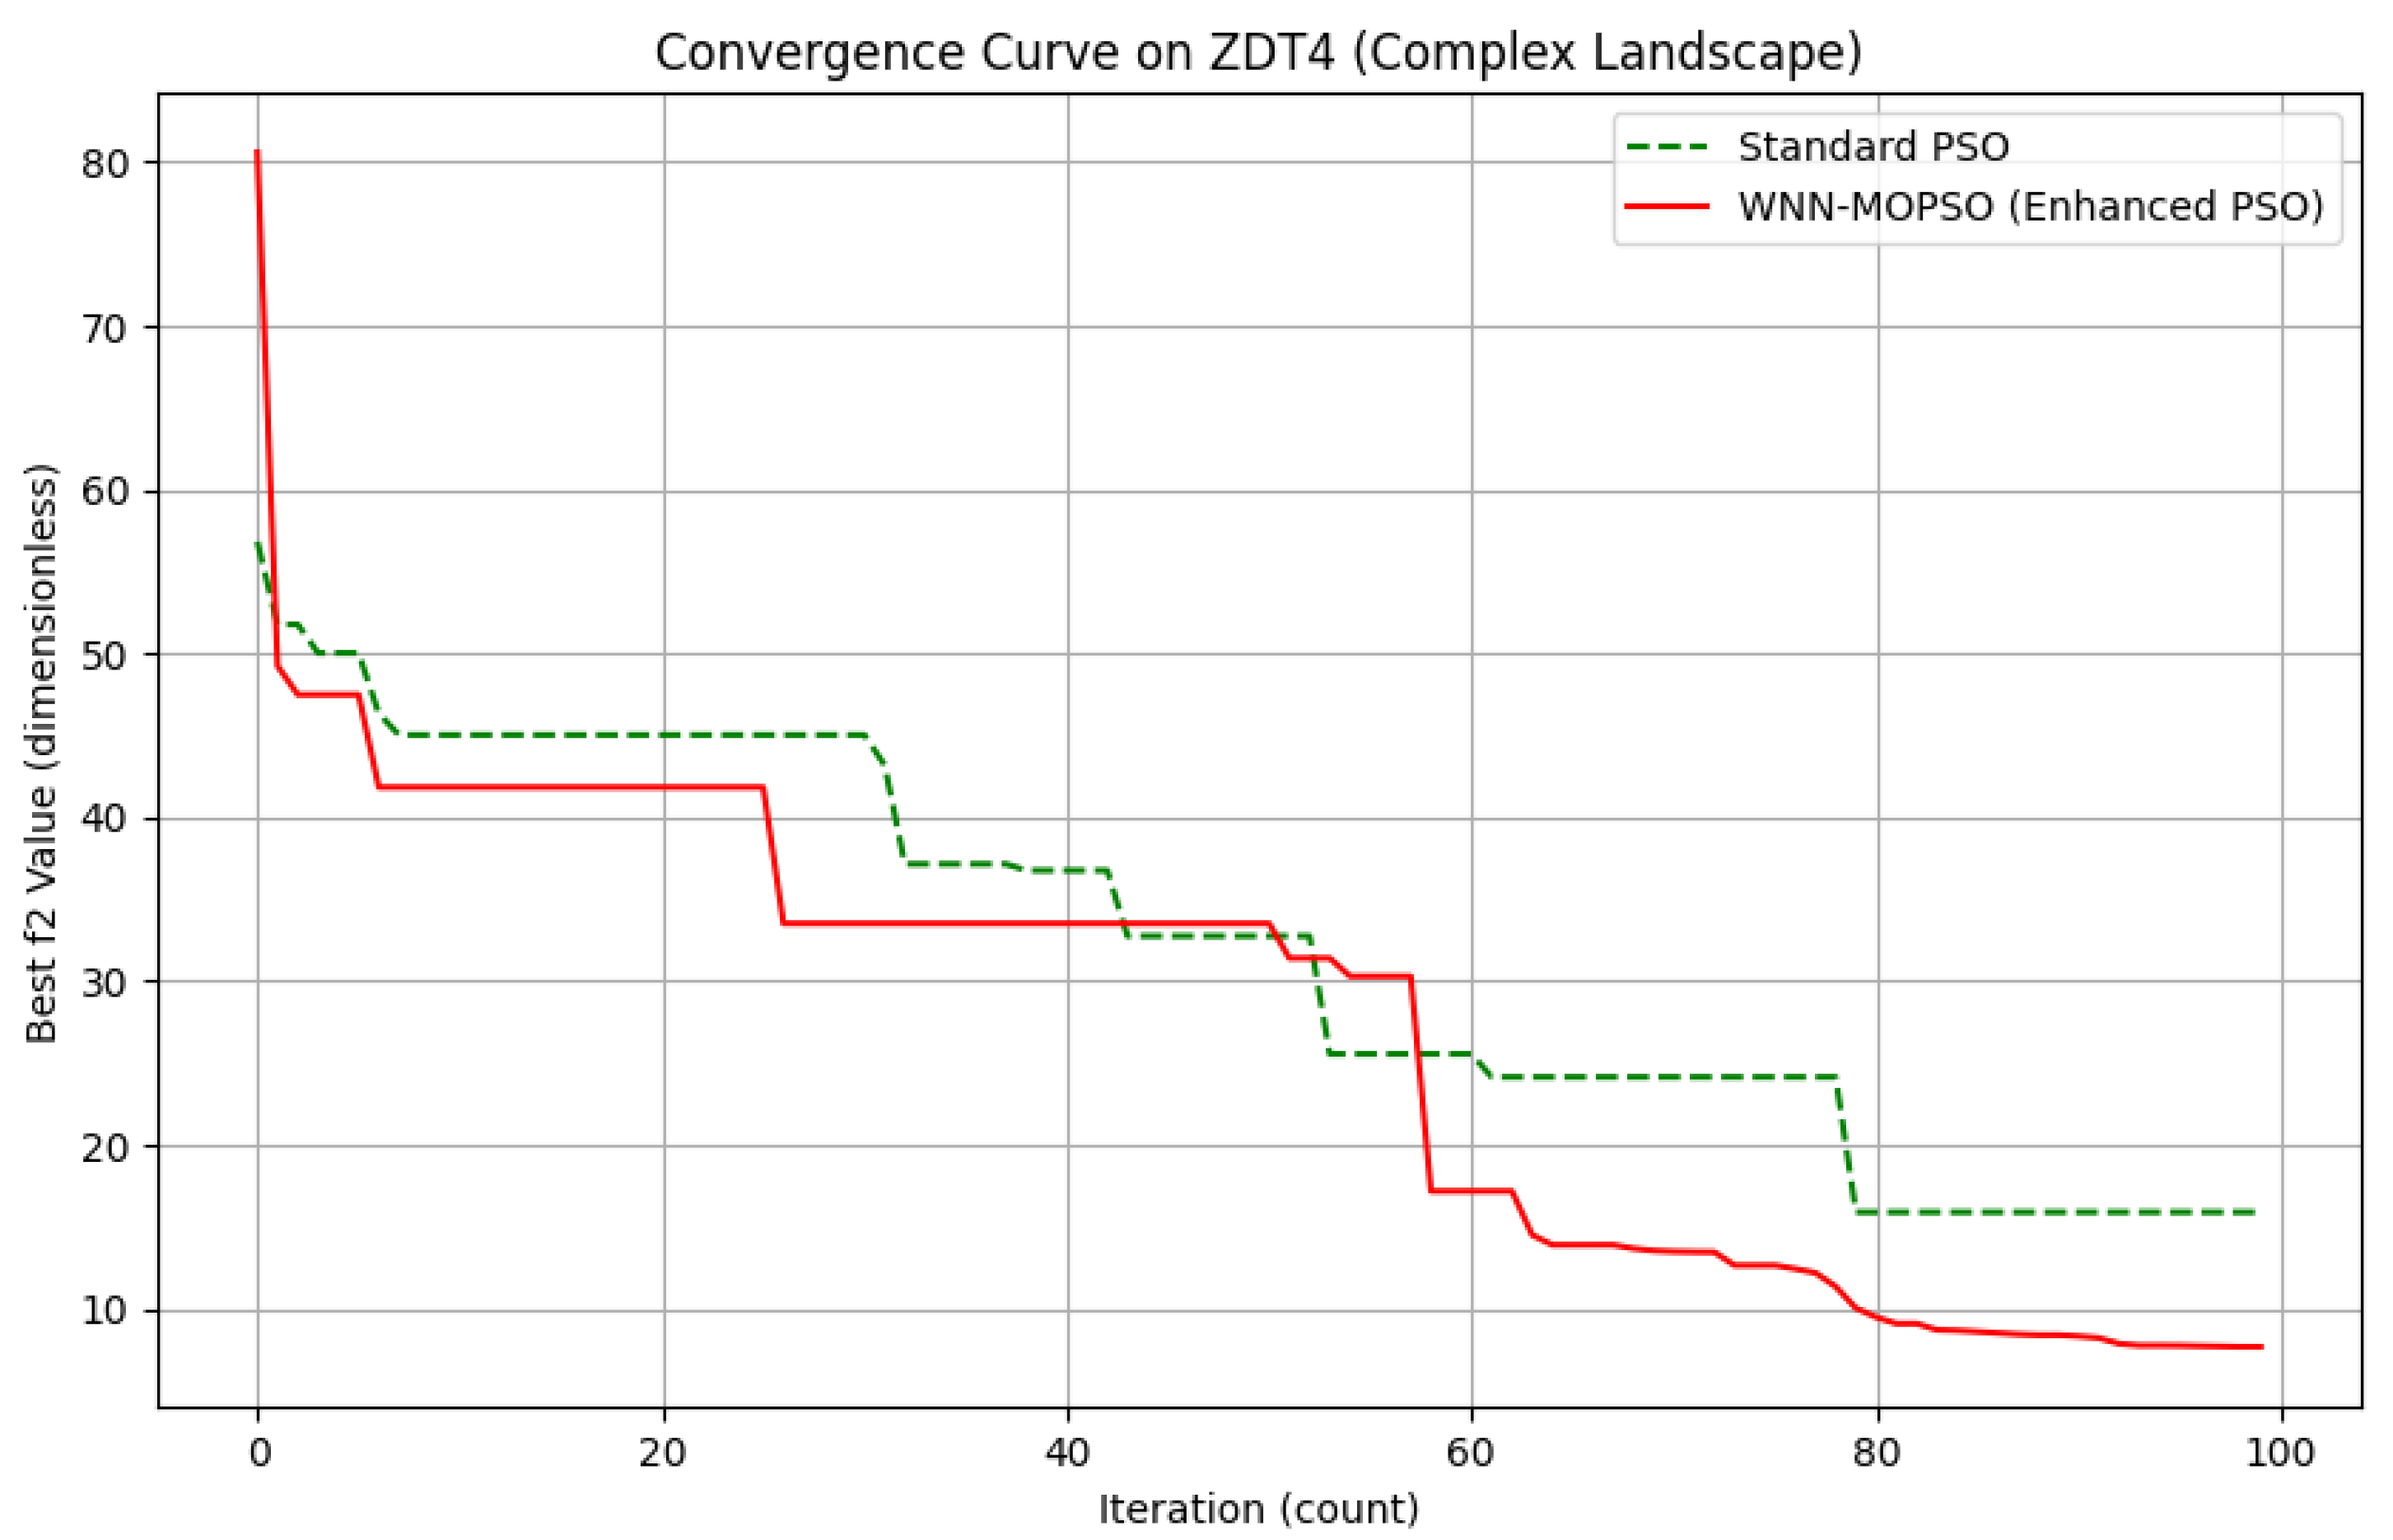
To more intuitively demonstrate the advantages of the improved strategy in addressing complex optimization problems, Figure 9 presents a comparison of the convergence processes of the improved multi–objective particle swarm optimization (MOPSO) and standard particle swarm optimization (PSO) on the ZDT4 test function. ZDT4 is well known for containing numerous local optima, posing a significant challenge to the global search capability of optimization algorithms. As shown in the figure, standard PSO frequently enters plateau phases during iterations, indicating convergence to local optima and difficulty escaping them. In contrast, the proposed improved MOPSO, leveraging its adaptive t–distribution mutation operator, exhibits strong exploratory capability and effectively avoids local optima traps. It continues to search for better solutions throughout the iteration process. This visual evidence is consistent with the numerical results in Table 5, where the improved algorithm achieves a 50.1% increase in the DM. Together, these results demonstrate the superior performance and robustness of the proposed strategy in handling complex nonlinear optimization problems.
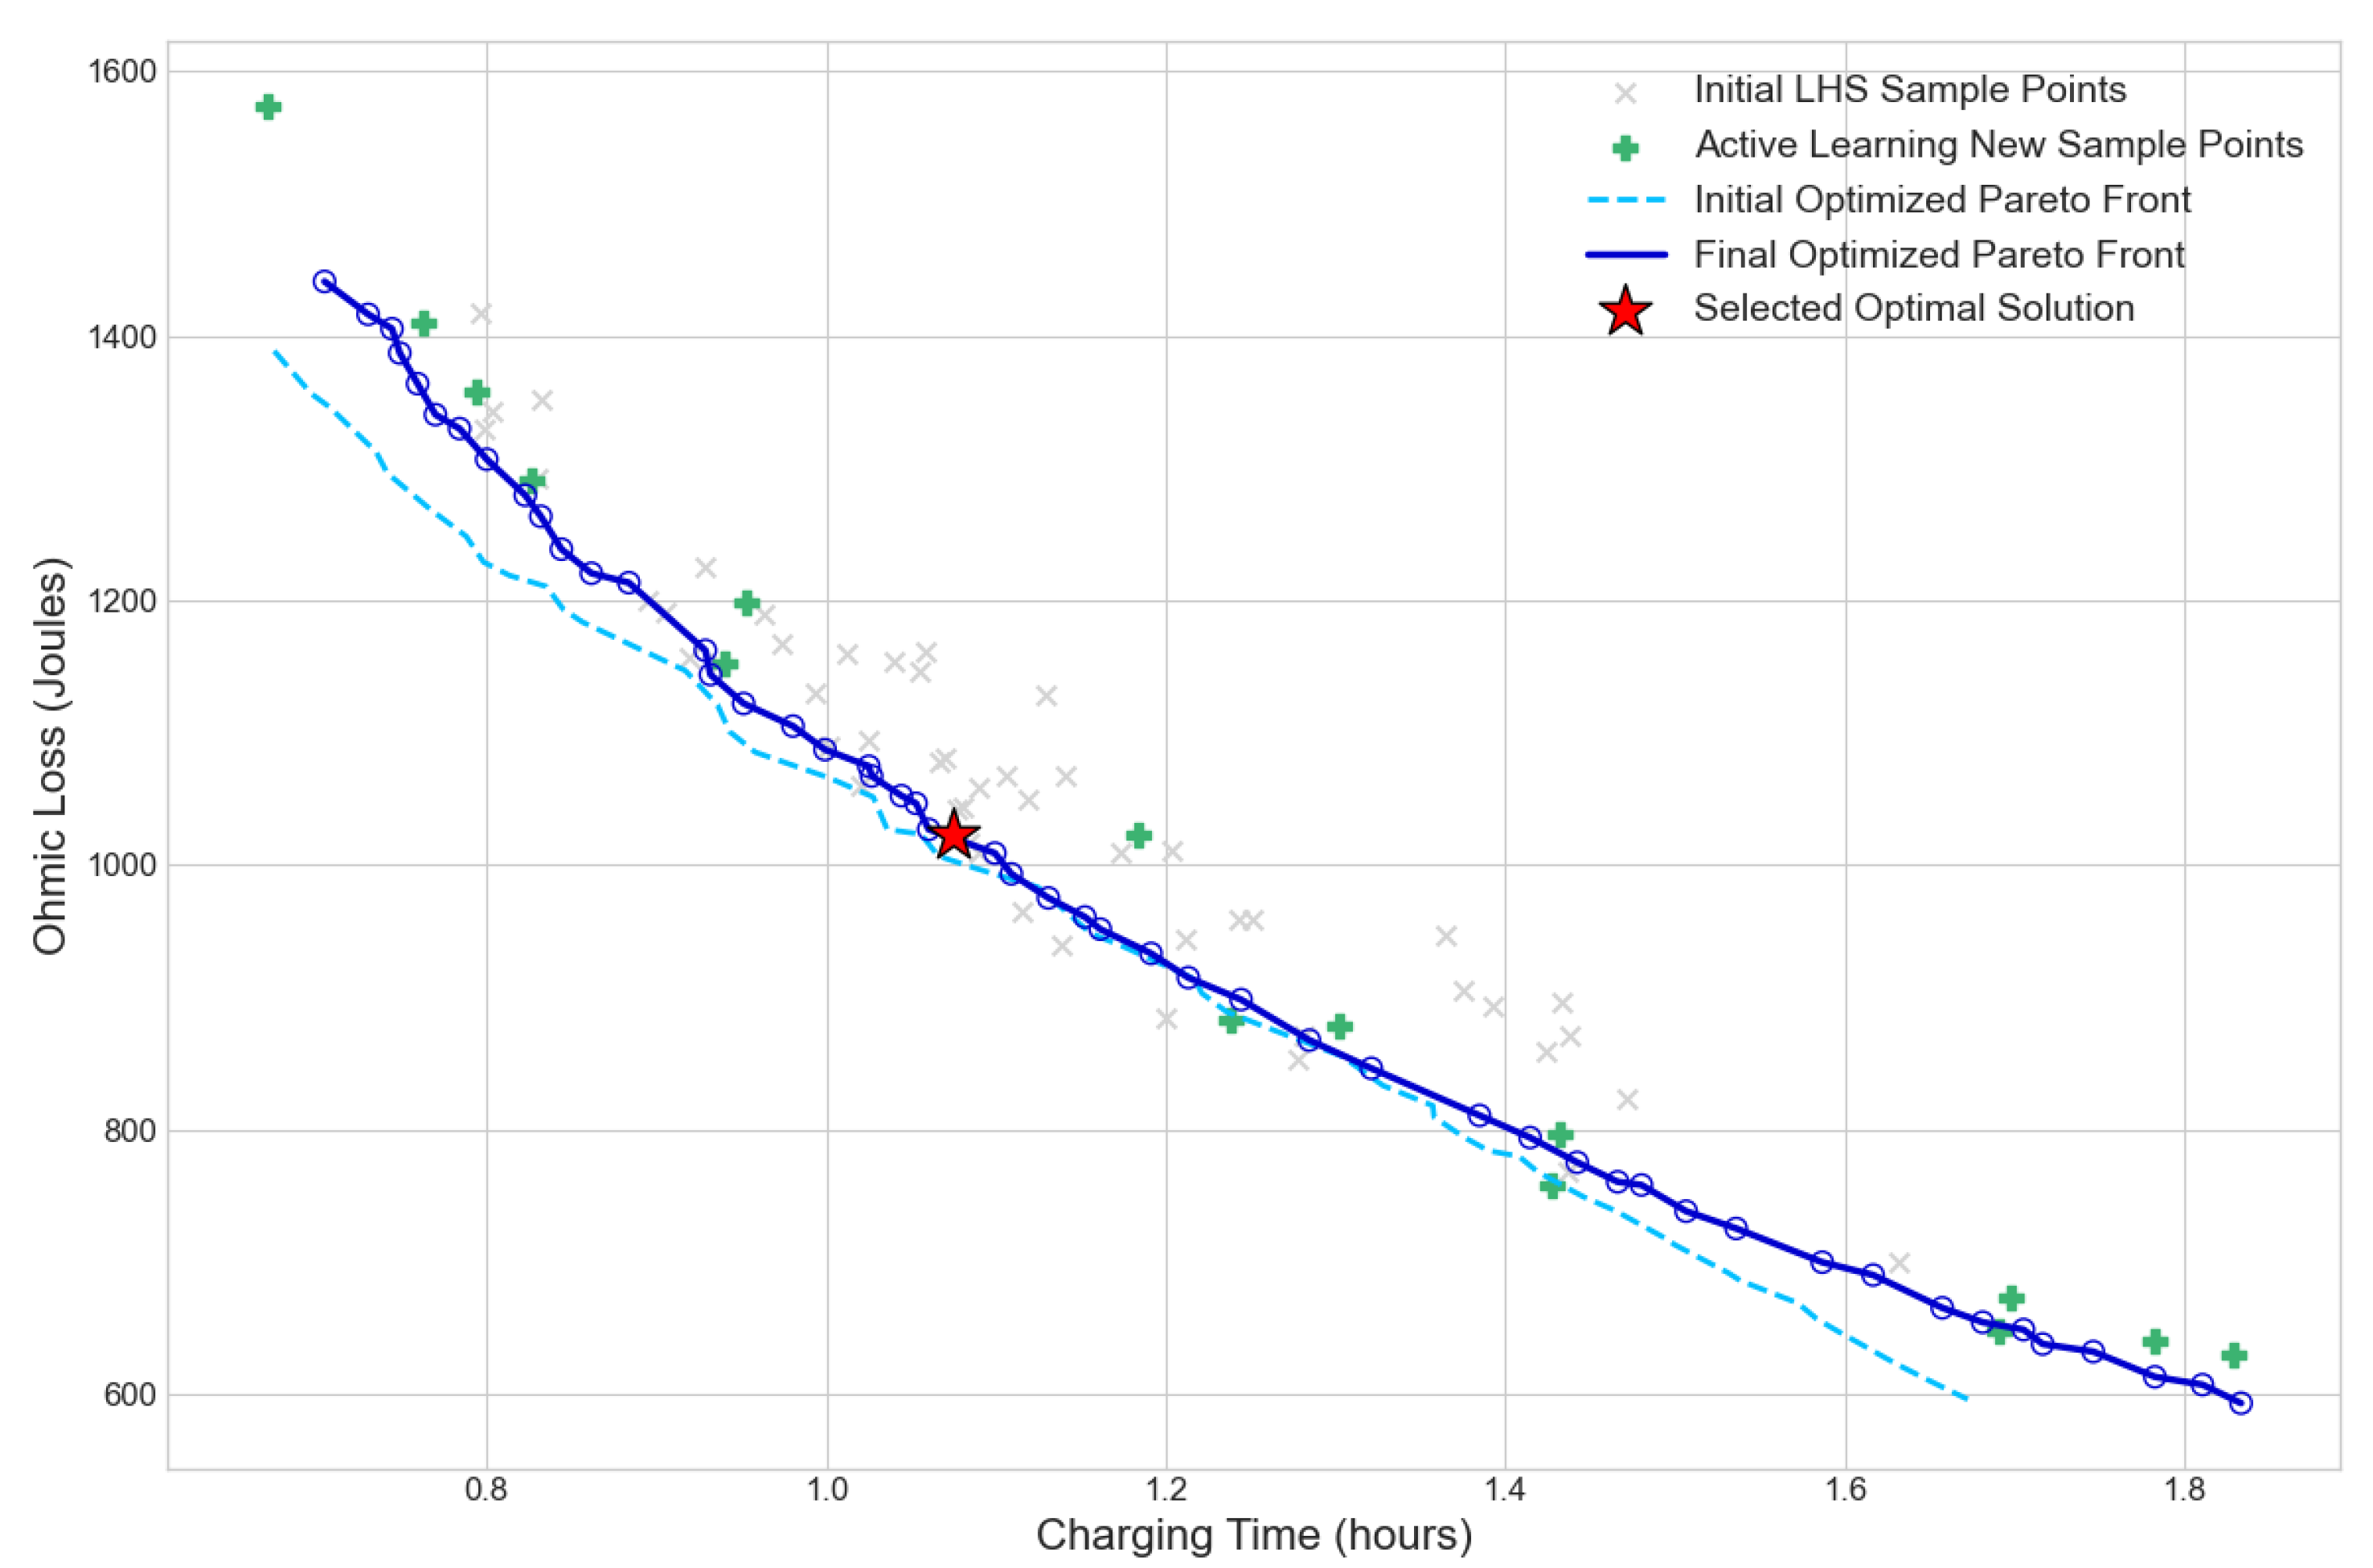
The core advantage of the battery charging multi-objective optimization strategy, based on SOC staging and a WNN–MOPSO active learning framework, is multifaceted. Its strength lies in the precise adaptation of the staging concept to battery characteristics. Algorithmic enhancements further improve optimization efficiency. The active learning mechanism plays a crucial role in ensuring optimization accuracy. The results shown in Figure 10 demonstrate that the active learning mechanism effectively improves the approximation model’s fitting accuracy for the complex nonlinear relationships inherent in the battery charging process. Although the model corrections influence the results, the final optimized Pareto front may not visually dominate the initial preliminary front. However, the final front more accurately and reliably approximates the true optimal solutions of the physical system. This verifies the advanced nature and effectiveness of the proposed framework for addressing battery charging multi–objective optimization problems. The selected optimal solution, marked with a red star in the figure, further highlights the practical value of the framework. It illustrates the ability to provide decision–makers with diverse optimized options, allowing adaptation to various practical charging requirements.

4.2. Comparative Experimental Analysis

4.2.1. Analysis of Experimental Results for Wavelet Basis Function Selection

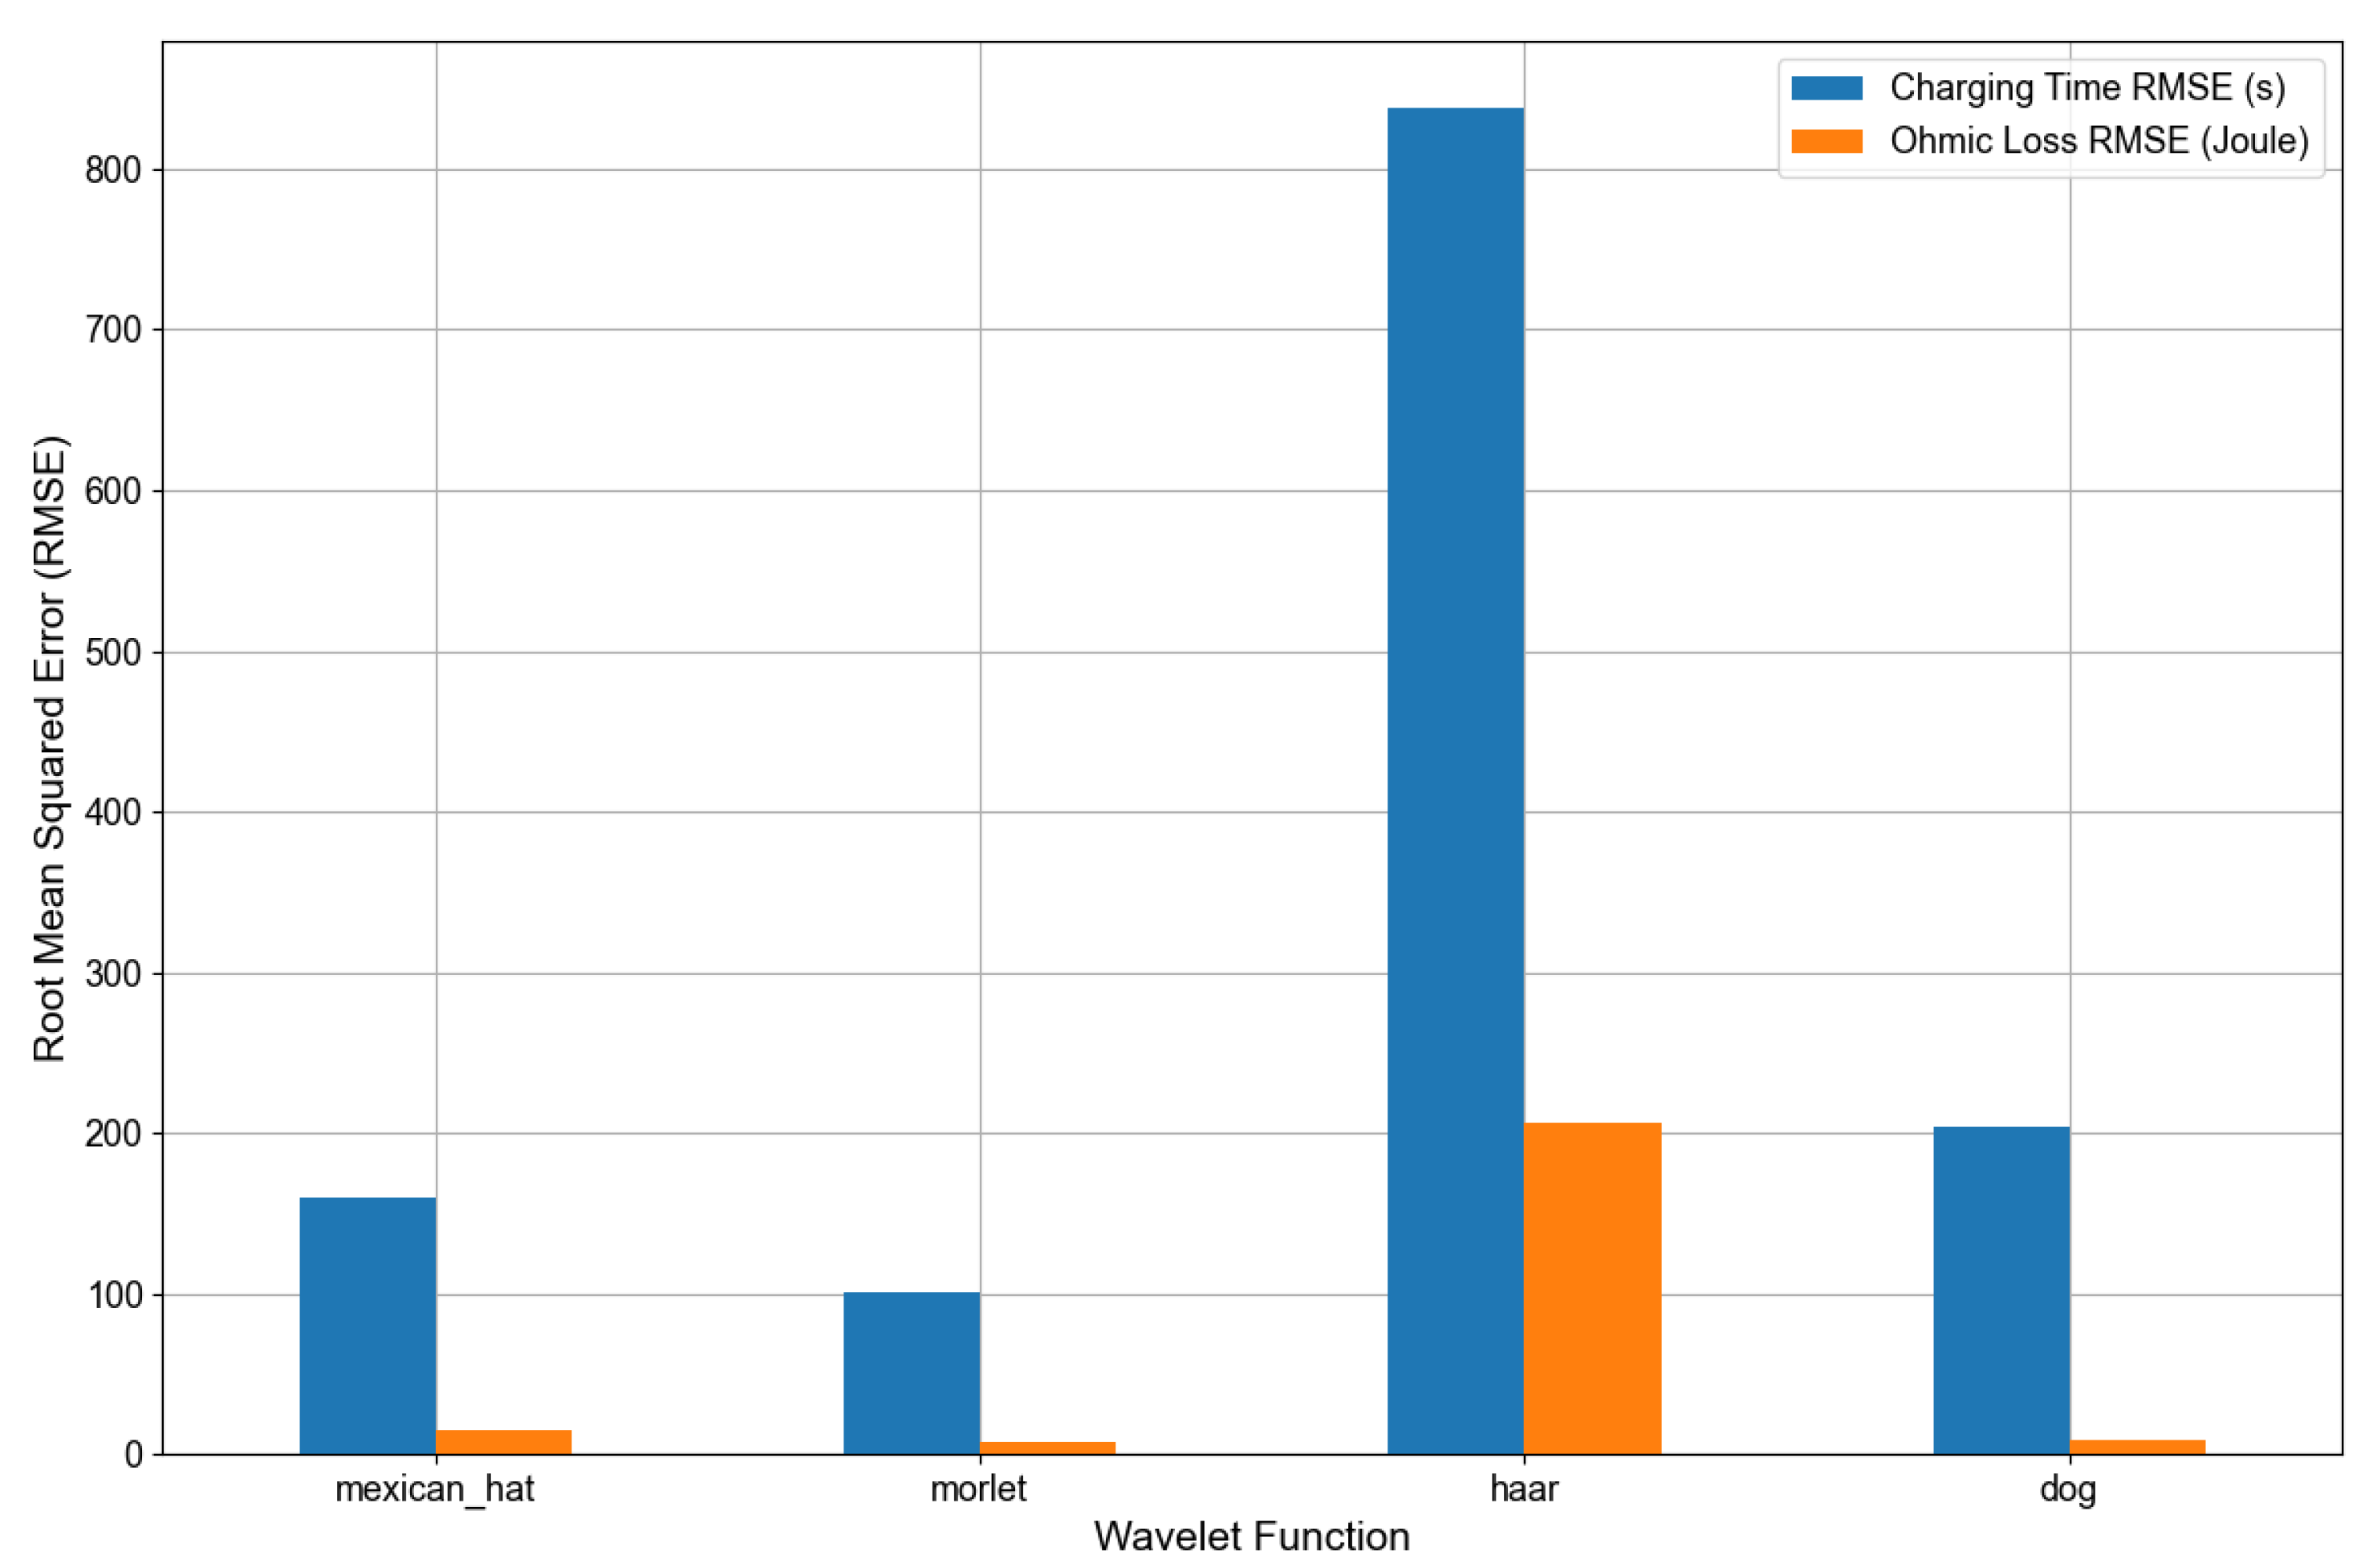
Figure 11 illustrates an experiment undertaken to quantitatively assess the efficacy of the Mexican Hat wavelet as the activation function for the WNN, by comparing the RMSE of four distinct wavelet bases in forecasting charging time and ohmic loss. The findings reveal that the Haar wavelet had the poorest performance, with RMSE values of 560.45 for charging time and 125.76 for ohmic loss prediction. These values are 285% and 790% superior to those of the Mexican hat wavelet. This is due to the first–order discontinuity typical of the Haar wavelet, which cannot accommodate the smooth dynamic variations of battery parameters.
The performances of the Morlet wavelet and the Mexican hat wavelet were comparable. The Morlet wavelet demonstrated marginally superior performance in predicting charging time, whilst the Mexican hat wavelet’s RMSE for ohmic loss prediction was merely 1.7% greater. Both wavelets provide continuous and smooth waveforms that precisely represent the dynamic charging process. While the difference of Gaussians (DOG) wavelet demonstrated a marginally reduced error in predicting ohmic loss, its error in charging time prediction was 38.5% more than that of the Mexican hat wavelet, revealing a performance disparity.
The Mexican hat wavelet exhibits superior performance for prediction accuracy and stability. Its symmetrical and continuous properties, coupled with its sensitivity to polarization variations, render it highly effective in capturing the nonlinear attributes of battery charging. This offers dependable assistance for the WNN approximation model and guarantees the efficacy of the ensuing optimization framework.

4.2.2. Ablation Study Verification for the Performance Enhancement of the WNN–MOPSO Algorithm Driven by Multi–Strategy Synergy

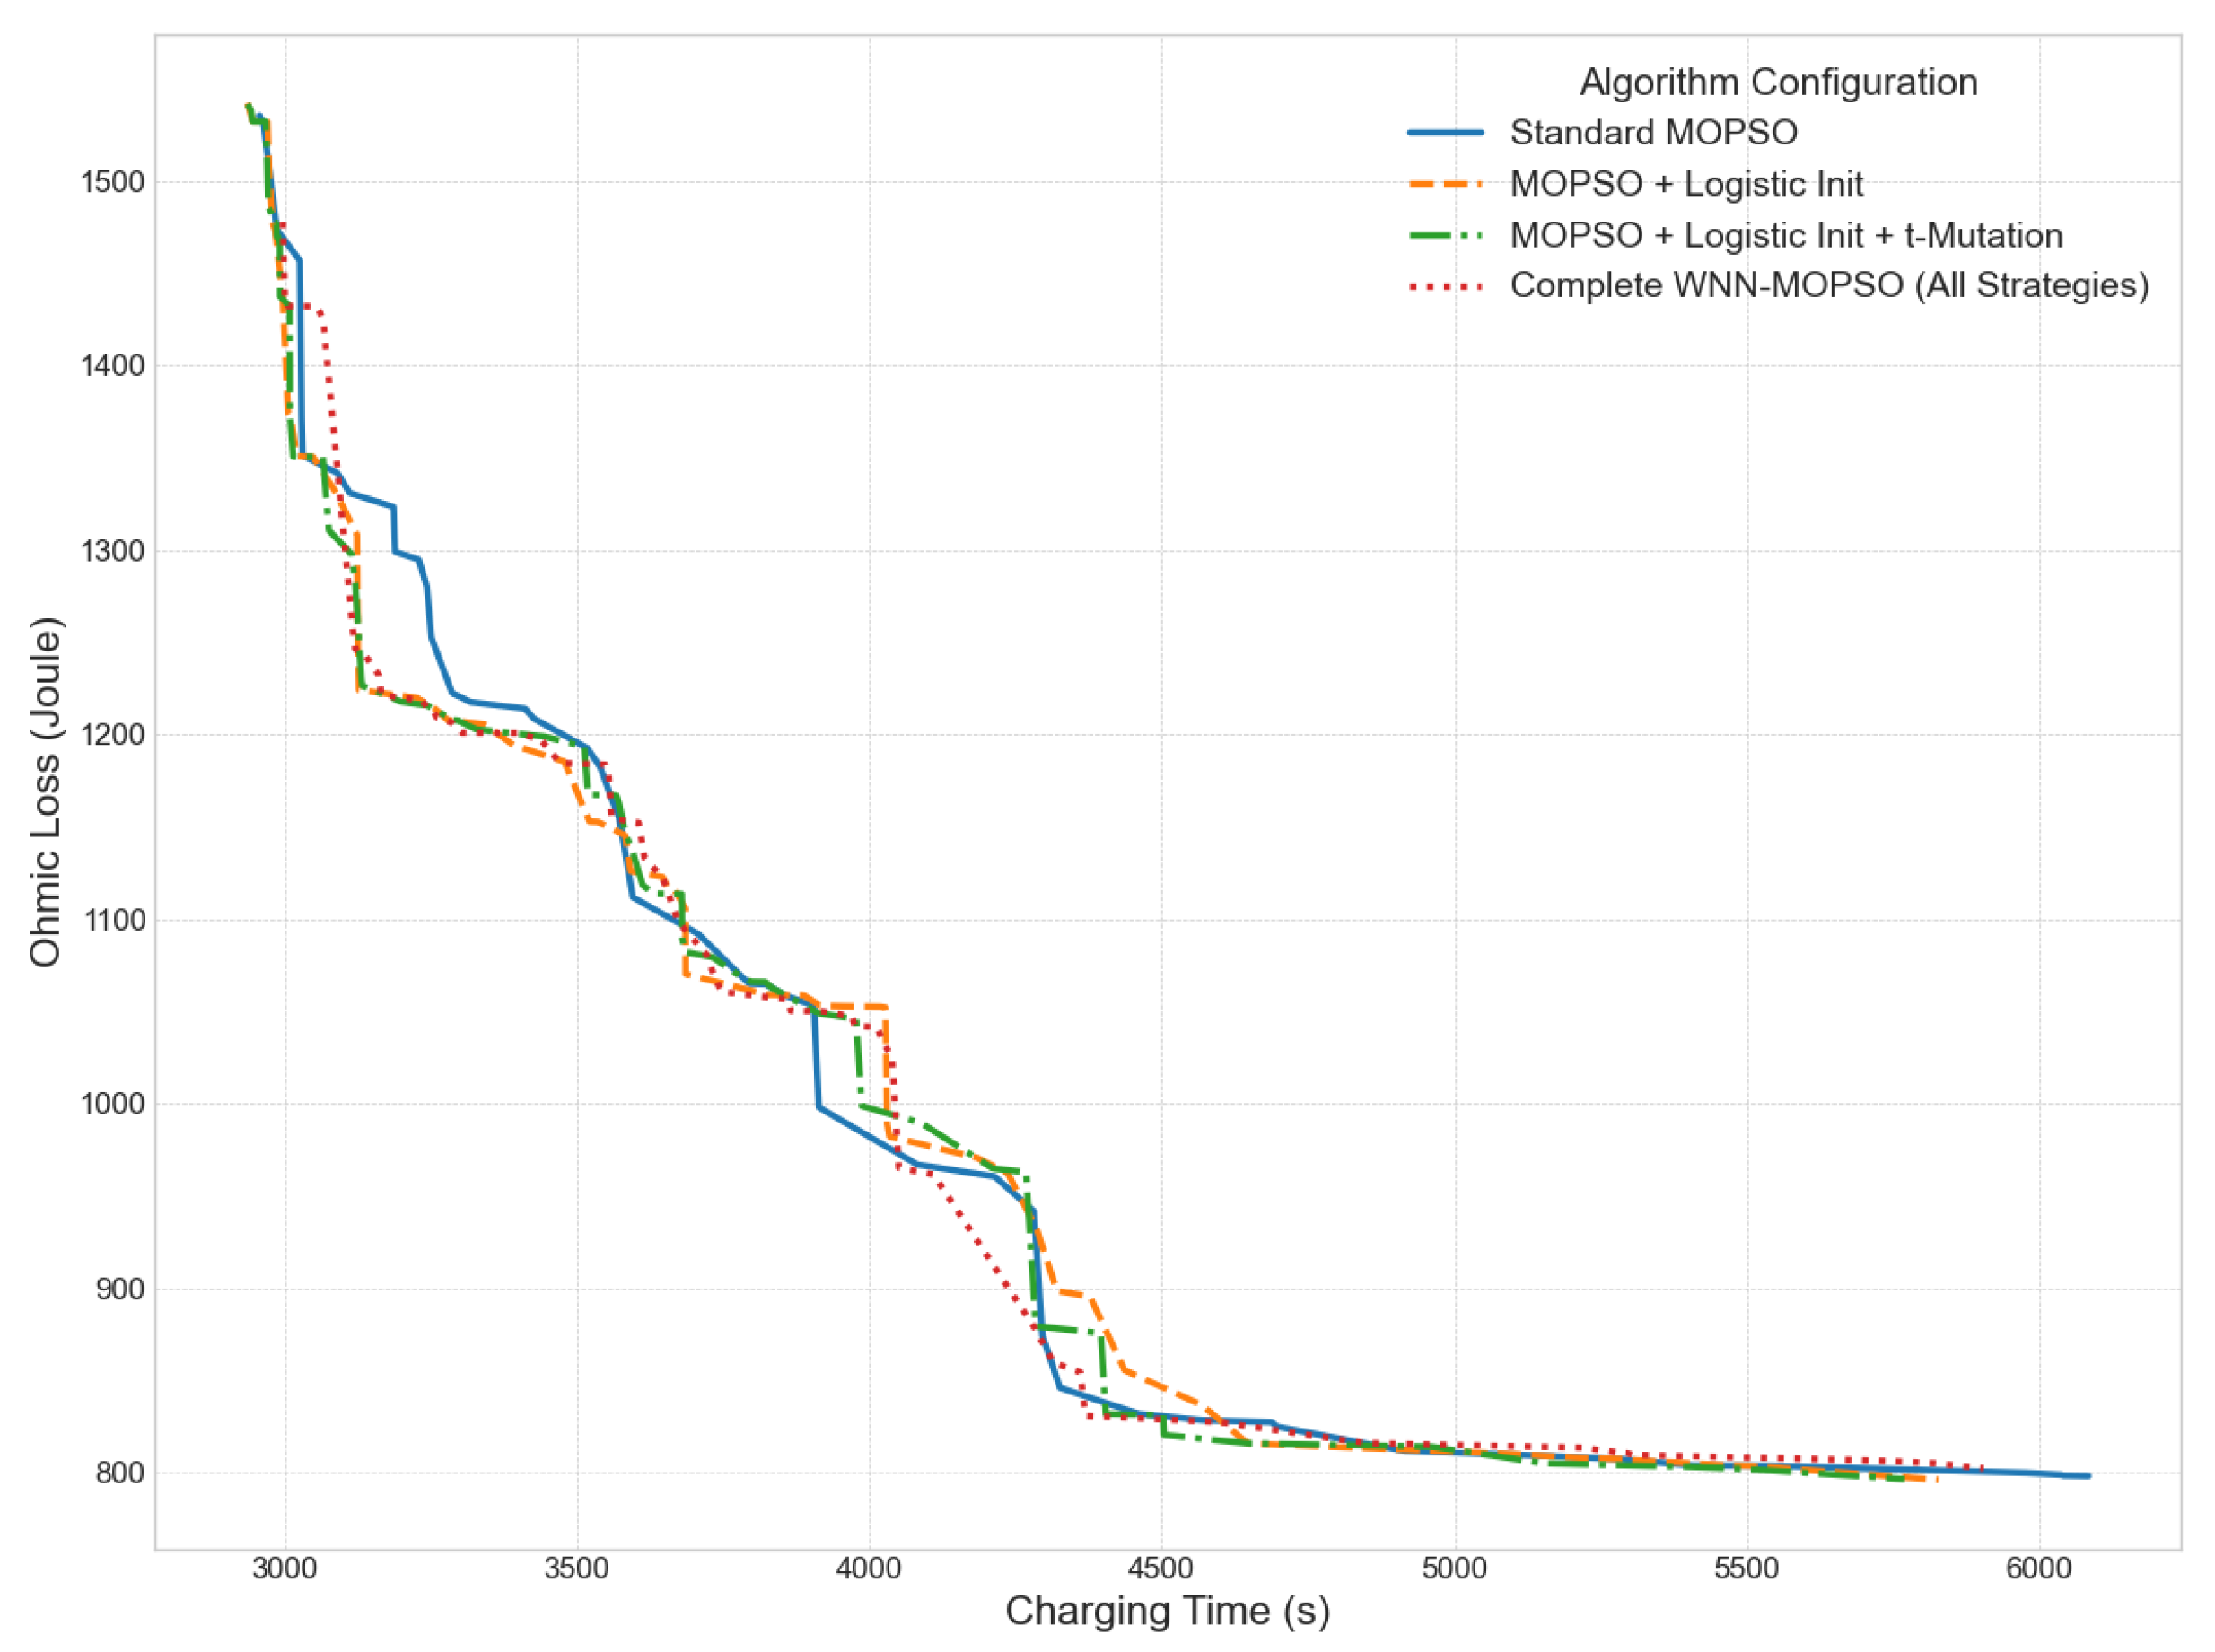
Figure 12’s ablation study employs charging time, ohmic loss, and the dominance relationship of the Pareto fronts as primary evaluation measures, statistically validating the performance enhancements of various optimization strategies on the WNN–MOPSO algorithm. Charging time and ohmic loss are the principal parameters that directly assess charging efficiency and energy loss.
In the tests, owing to random population initialization and local convergence challenges, the Pareto front of the typical MOPSO algorithm is situated in the upper–right quadrant of the charging time–ohmic loss two–dimensional space, indicative of prolonged charging time and elevated ohmic losses. The introduction of Logistic chaotic initialization results in a shift of the entire Pareto front towards the lower–left region, signifying diminished ohmic loss for equivalent charging time or a reduced charging time for the same ohmic loss. The enhanced integration of the t–distribution mutation technique results in further optimization of both metrics, particularly at a charge time of 4000 s. The Pareto front of the optimized method surpasses that of alternative variants in most areas, attaining a superior equilibrium between rapid charging and little loss. The properties of dominance and distribution of the Pareto front are essential evaluation criteria for multi–objective optimization, including convergence and diversity. Convergence is indicated by the closeness of the Pareto front to the actual optimal boundary, with the comprehensive strategy’s front being nearer to the theoretical optimum. Diversity indicates the consistency of solution distribution over the Pareto front. The strategy’s capacity to investigate sparse regions is confirmed by comparing the coverage of solution sets throughout various charging time intervals.
In summary, the numerical comparison of charging time and ohmic loss, along with the analysis of the dominance and distribution of the Pareto front, elucidates the mechanisms by which each strategy enhances algorithm performance. This confirms the efficacy of the multi–strategy synergy in harmonizing global exploration with local exploitation.

4.2.3. Performance Comparison of Three Charging Strategies

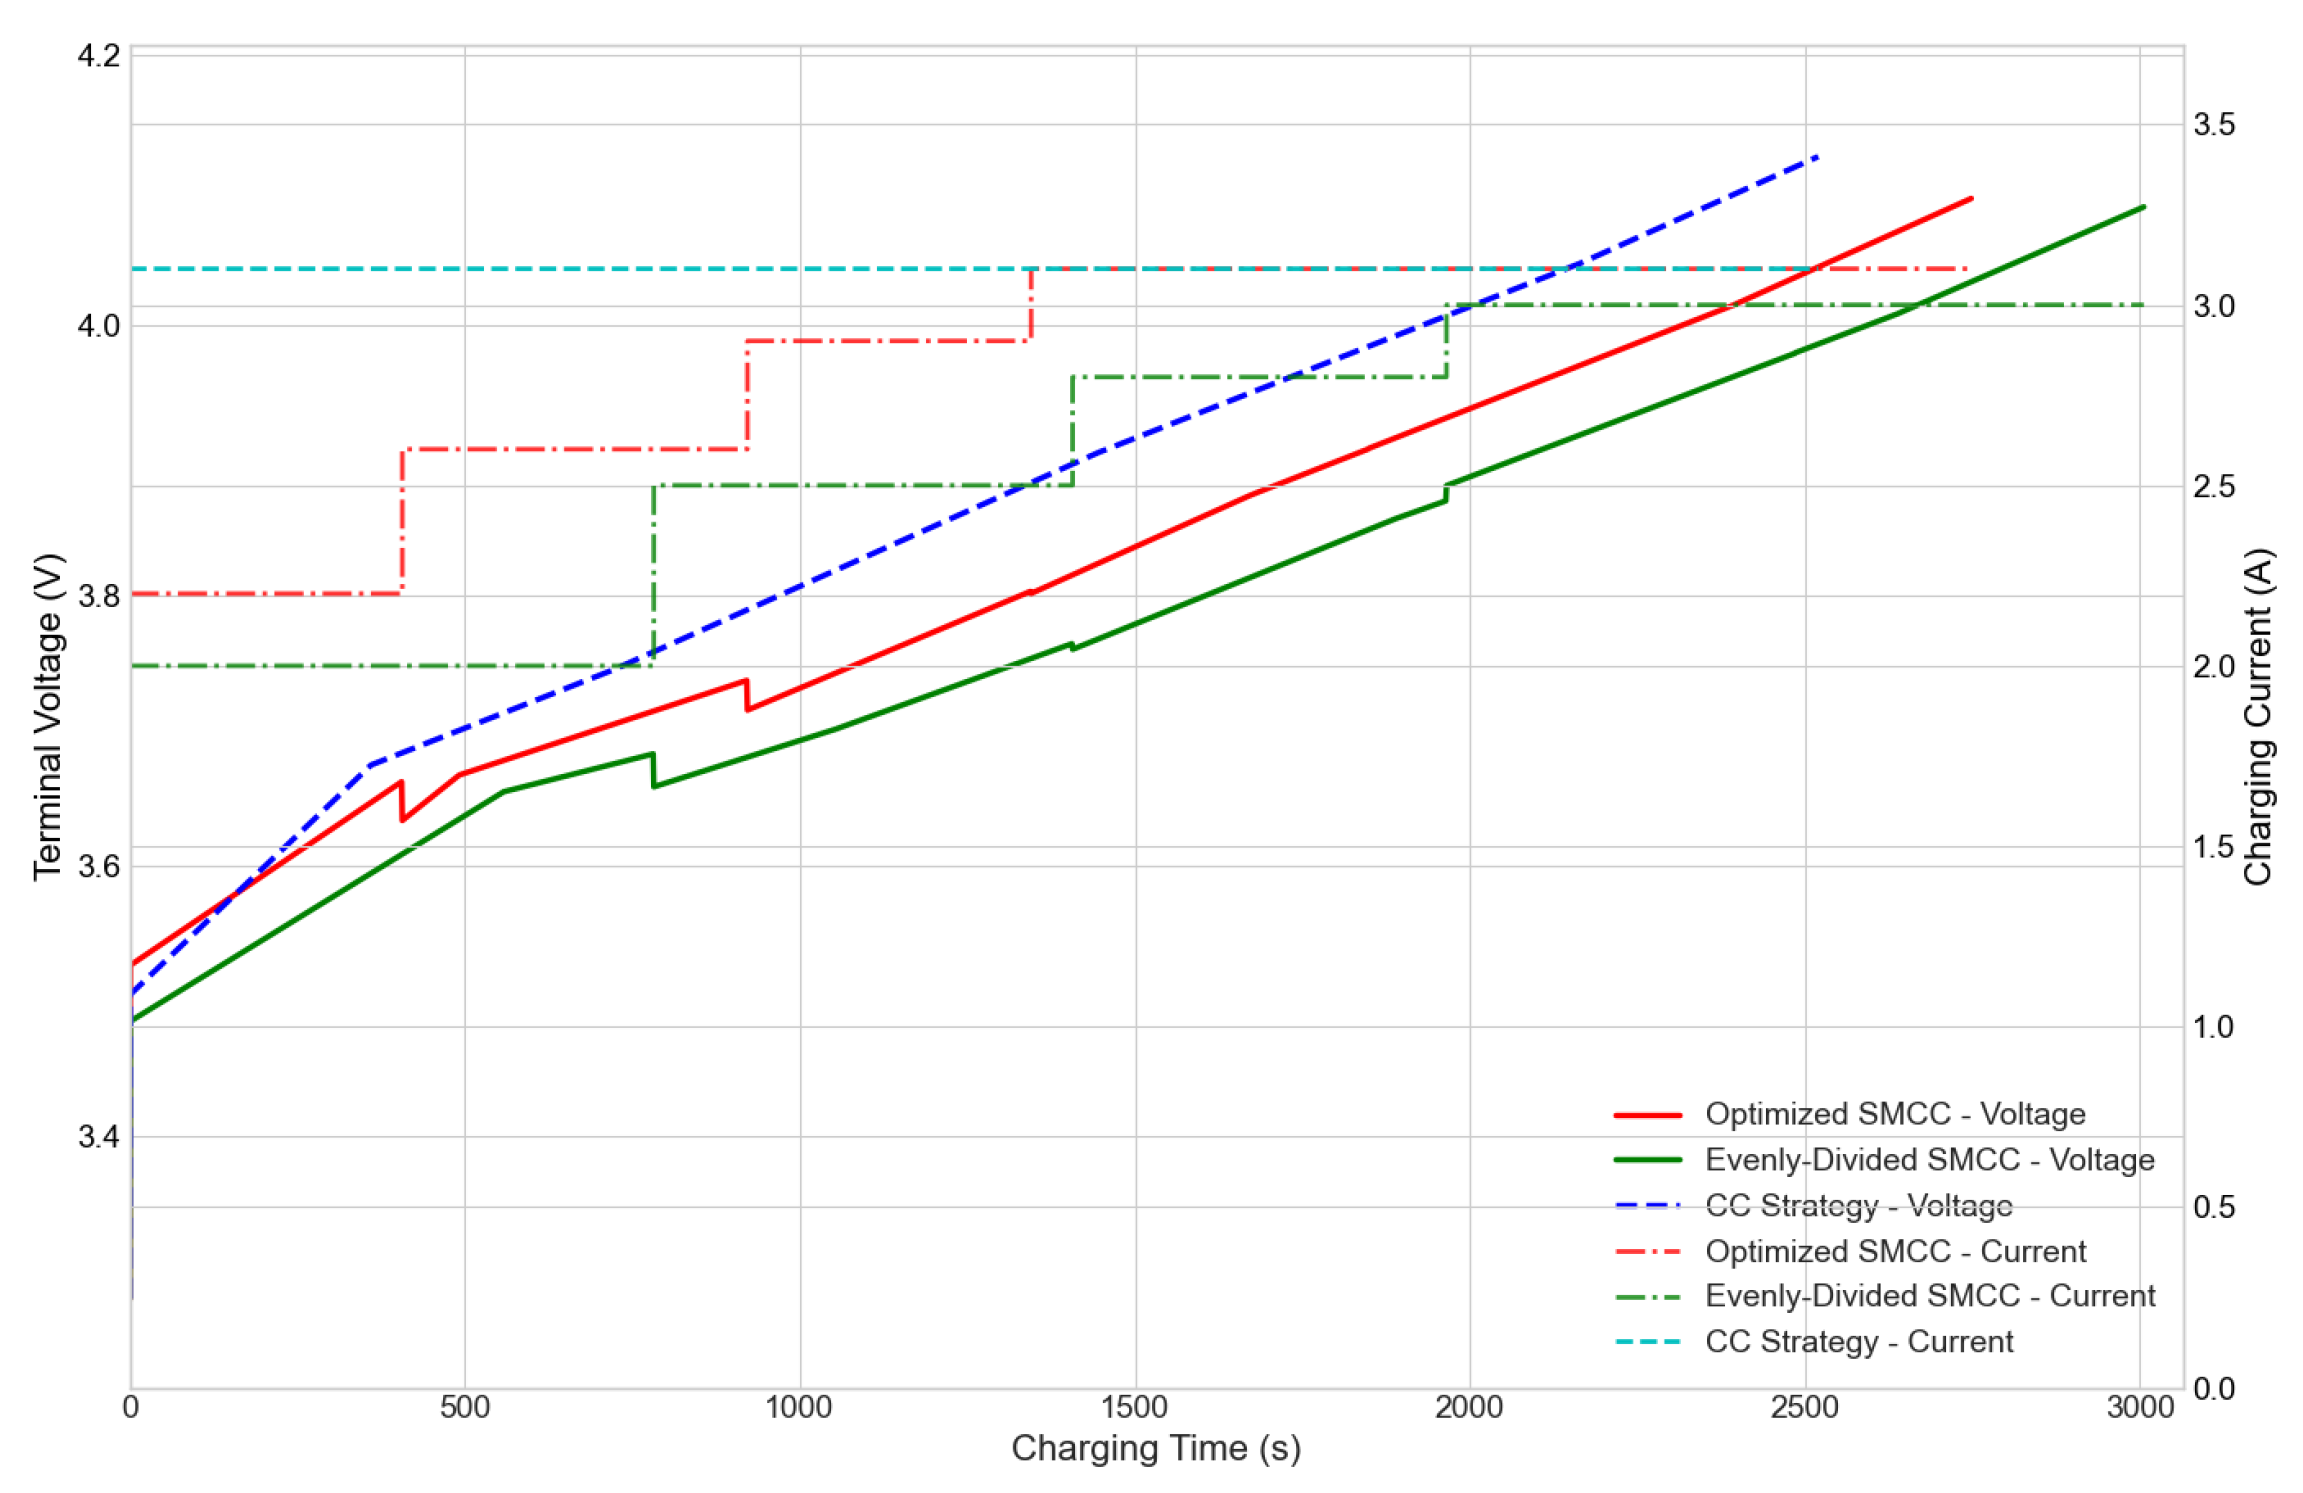
Figure 13 illustrates an experiment that employs charging time, peak terminal voltage, and ohmic loss as fundamental assessment criteria. This analysis examines the performance disparities among three techniques during the charging process to 70% SOC: the CC approach, the equal–division multi–phase constant current strategy, and the optimized multi–phase constant current strategy. The performance discrepancies stem from their level of adaptability to the dynamic properties of the battery’s internal resistance. The CC approach operates with a constant current of 3.1 A. Despite having the quickest charging time, its terminal voltage remains constantly elevated. The constant high current, disregarding the “U-shaped” distribution of internal resistance according to SOC, results in heightened ohmic loss and may expedite battery degradation. This illustrates the disadvantage of “rapid charging at the expense of health”. The equal–division multi–phase approach segments the SOC range into uniform intervals. Its charging time is prolonged due to the failure to adjust to the dynamic fluctuations in internal resistance. This method compromises time for battery longevity, highlighting the constraints of sluggish charging with diminished efficiency. The optimized multi–phase constant current technique employs canopy–bisecting K–means clustering to facilitate adaptive state of charge staging. It generates a current profile that exhibits a negative correlation with internal resistance. This entails employing elevated current during low–resistance intervals and reduced current during high–resistance times. The final charging time is approximately 2750 s, representing an 8.3% reduction compared to the equal–division technique, and the peak terminal voltage is markedly diminished. Simultaneously, the WNN’s precise modeling of nonlinear charging relationships enhances the accuracy of ohmic loss predictions. This offers dependable assistance for the MOPSO in identifying the optimal current, facilitating a synergistic enhancement of charging speed and battery health.
In conclusion, a quantitative analysis of charging time, peak terminal voltage, and ohmic loss demonstrates that the optimized technique surpasses the limitations of the constant current and equal–division strategies. This is accomplished by dynamically adjusting to the internal resistance characteristics, therefore validating the efficacy of the characteristic adaptation–intelligent optimization charging logic.

4.2.4. Convergence Performance Comparison of Different Optimization Algorithms

When evaluating the convergence performance of the proposed improved MOPSO algorithm, NSGA–II is selected as the benchmark for comparison, as NSGA–II represents a classical method in the field of multi-objective optimization and has been widely applied in engineering scenarios such as battery charging strategy optimization. The comparison with NSGA–II enables a clearer validation of the advantages of the proposed improvements in convergence efficiency and accuracy. Figure 14 juxtaposes the convergence processes of the enhanced MOPSO, the conventional MOPSO/PSO, and the NSGA-II. The aim is to reduce ohmic loss while adhering to a charging time of 3000 s. The results indicate that all three algorithms have a two–phase pattern of rapid convergence succeeded by stable convergence. In the initial 25 iterations, the decrease in ohmic loss constitutes over 85% of the overall enhancement, demonstrating their efficacy in identifying high–potential areas inside the solution space. Following 50 iterations, the curves stabilize and reach a convergence plateau phase, wherein the quality of the solution set ceases to improve substantially.
Regarding final convergence accuracy, the particle swarm–based algorithms, specifically the enhanced MOPSO and the conventional MOPSO/PSO, surpass NSGA–II. The ultimate ohmic loss for the initial two stabilizes at 1448 J, while for NSGA–II, it is 1449 J. This disparity arises from the "information sharing" mechanism of particle swarm algorithms, which is more adept at addressing the continuous solution space attributes of charge optimization. The benefits of the enhanced MOPSO are apparent during the entire convergence process. The initial answer is 1.2% to 2.0% superior to the other methods and approaches the ideal value by the 25th iteration. Its convergence rate is 15% superior to the normal MOPSO/PSO and 20% superior to NSGA–II. These findings confirm the efficacy of the tactics in the enhanced MOPSO. The logistic chaotic initialization enhances the quality of the initial solution, but the adaptive t–distribution mutation expedites convergence to the optimal solution. The collaboration between these two enables the method to provide enhanced convergence efficiency and precision in constrained continuous optimization challenges, such as charging optimization.

4.2.5. Comparison of Pareto Fronts for Three Strategies

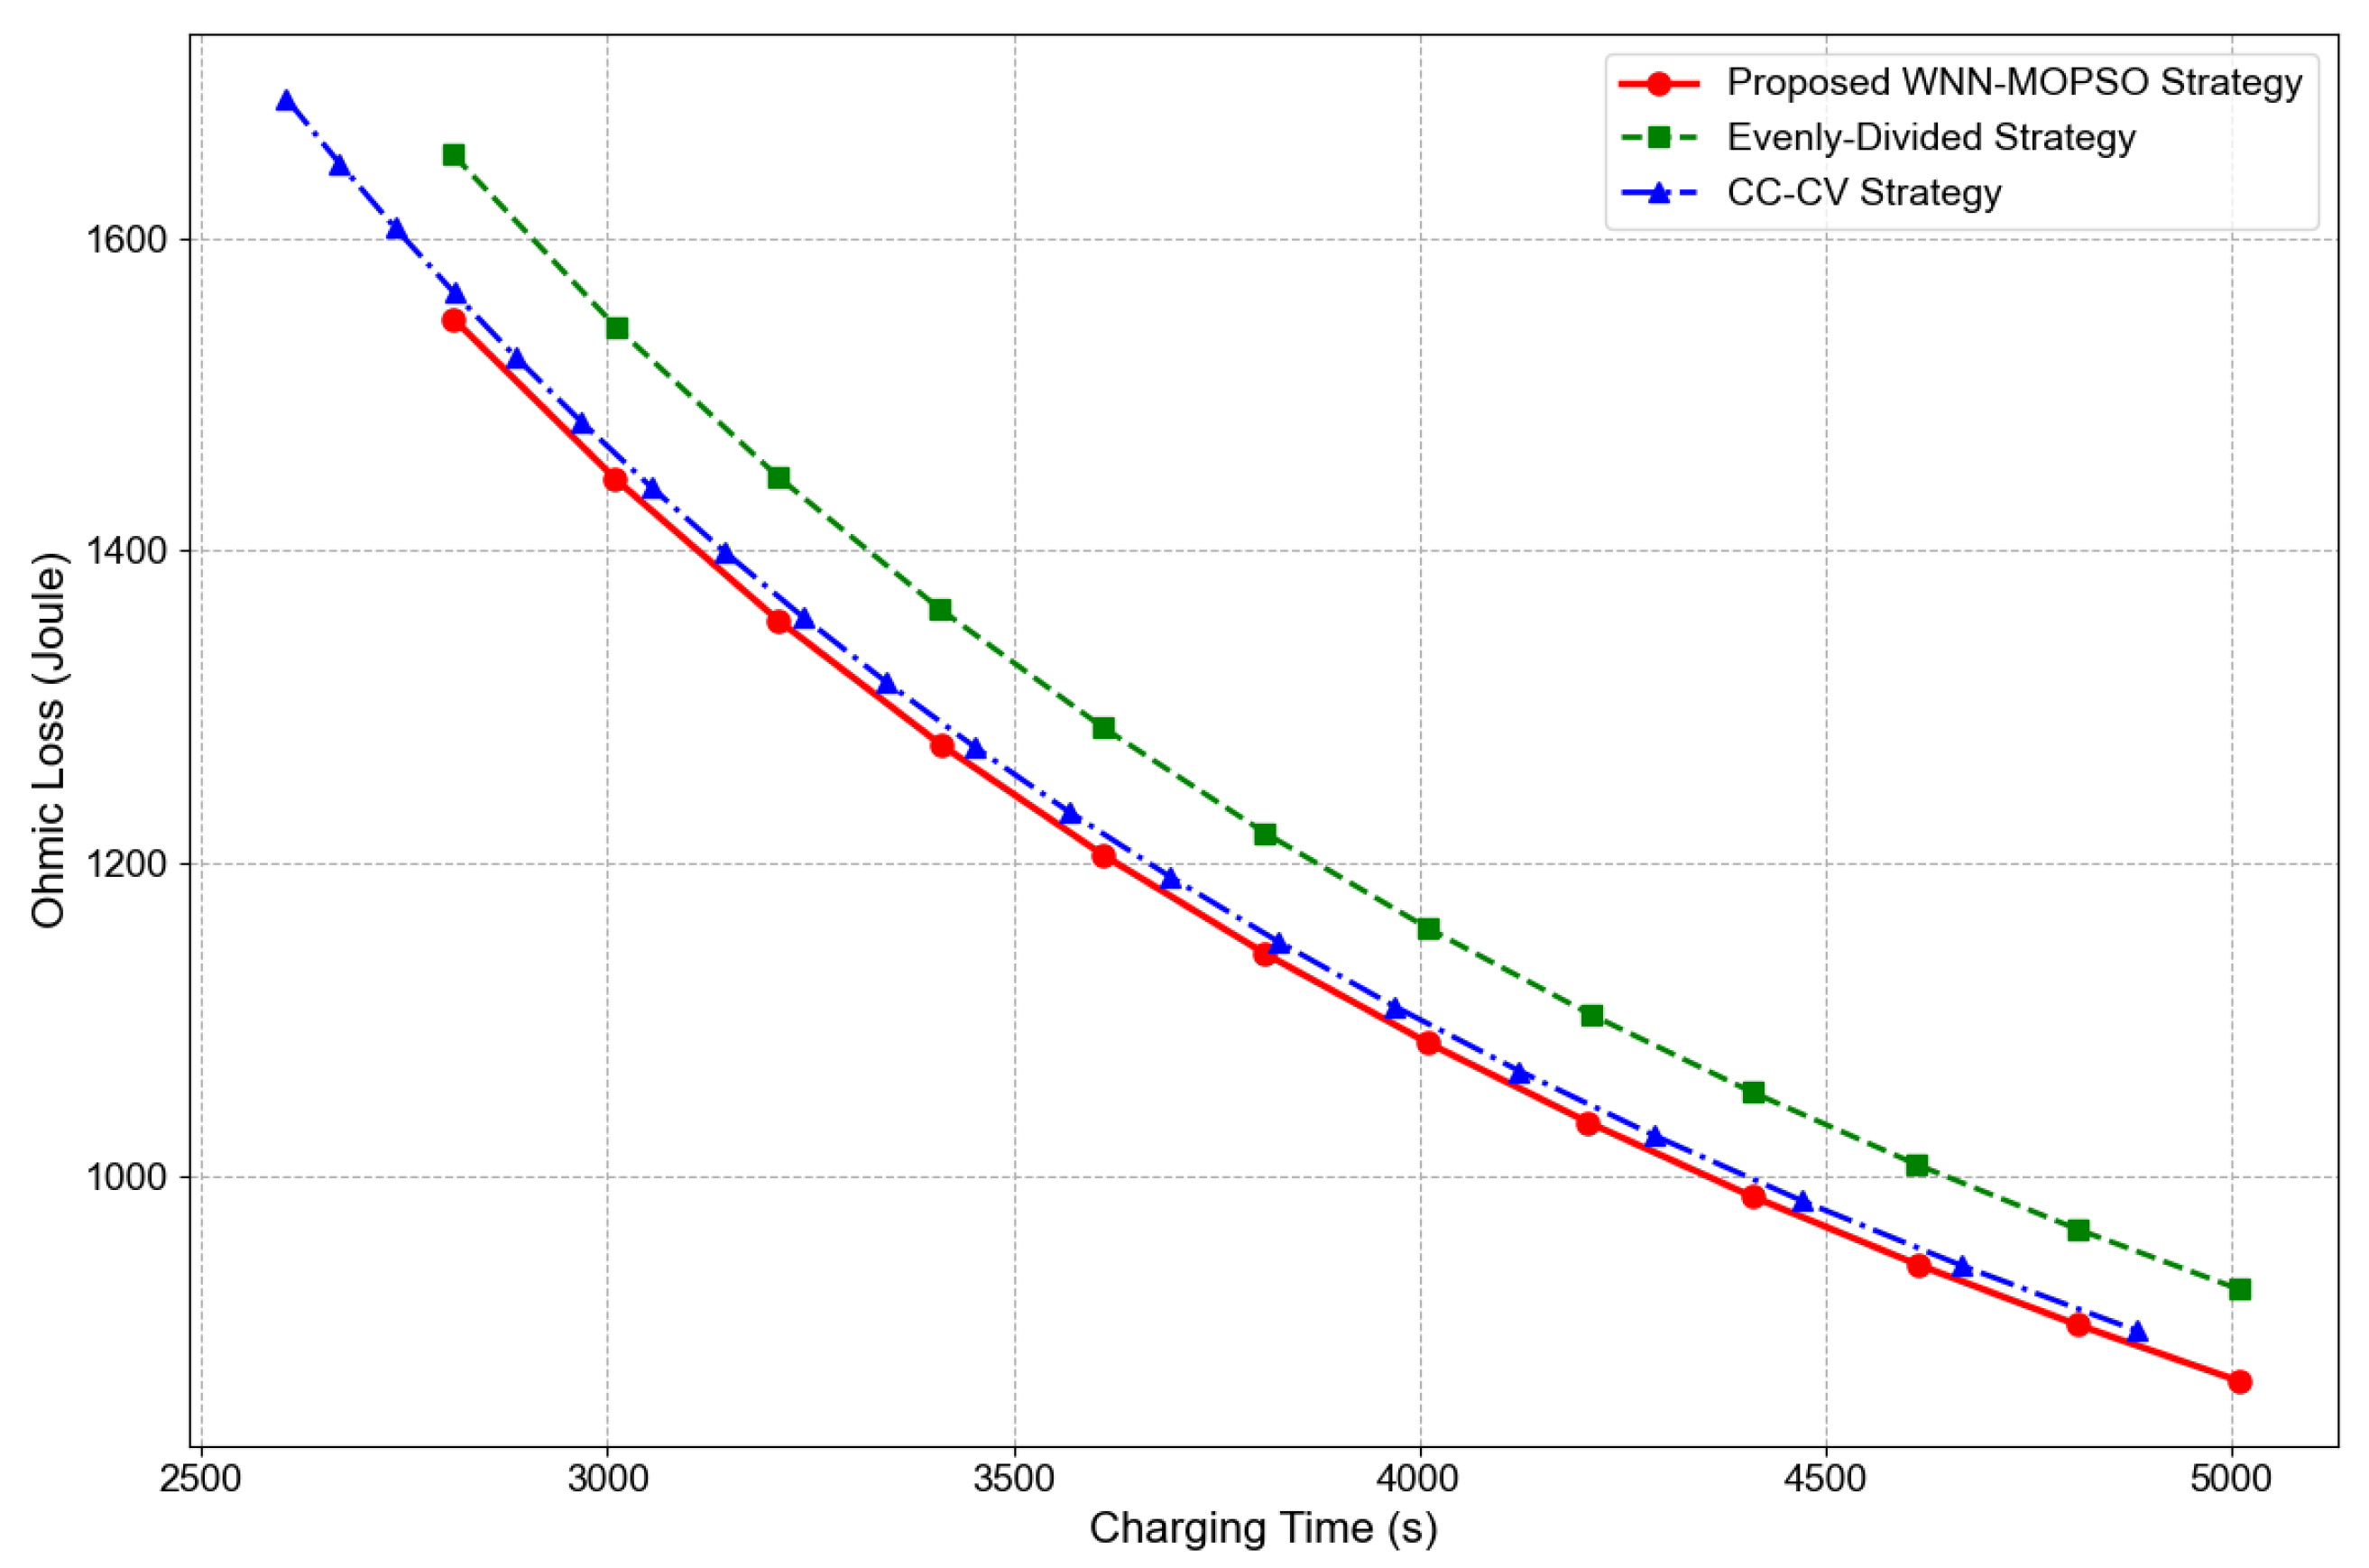
Figure 15 illustrates a comparison of the Pareto fronts for three techniques, with charging time and ohmic loss as the primary evaluation criteria. The strategies include the WNN–MOPSO optimization strategy, the CC–CV method, and the equal-division multi–phase constant current strategy. Their performance curves encompass a charging time interval from 2600 s to 5100 s and an ohmic loss range from 900 joules to 1700 joules. All three illustrate the inverse relationship between charging time and ohmic loss. Extending the charging time by reducing the current density helps reduce ohmic loss. The Pareto front of the WNN–MOPSO optimization technique exhibits dominance throughout the whole spectrum. The associated ohmic loss for any specified charging time is inferior to that of the other two solutions, hence affirming its superiority in reconciling “rapid charging” with “minimal loss.” The efficacy of the CC–CV method is average. The equal–division multi-phase constant current method demonstrates the greatest ohmic loss, underscoring its constraints.
This substantiates two fundamental conclusions. The efficacy of multi–phase constant current techniques typically surpasses that of the single–phase CC–CV strategy. The primary reason is that multi–phase techniques can modulate the charging current in increments to more precisely accommodate the dynamic fluctuations in the battery’s internal resistance throughout the charging process. Secondly, within the multi-phase techniques, the WNN–MOPSO strategy markedly outperforms the equal–division strategy. This results from the synergistic effect of two fundamental advantages. The clustering-based adaptive SOC staging method enhances staging accuracy by 53.6%, as indicated by an SSE study. The WNN model attains high-precision predictions of the charging process, with a forecast RMSE as low as 14.2. This offers dependable assistance for the optimization search of the MOPSO algorithm.

4.3. Experimental Validation

To validate the practical effectiveness of the proposed optimization framework, comparative charging experiments were conducted using a 3.1 Ah NMC pouch cell. The ambient temperature was precisely controlled at (25 ± 0.5) °C using a temperature-controlled chamber. A type–T thermocouple (accuracy ±0.1 °C) monitored the cell surface temperature in real time, while charging voltage, current, and capacity data were recorded. A fixed charging duration of 4000 s was set as a constraint. The performance of the proposed adaptive segmentation–WNN–MOPSO strategy was compared with that of a uniform SMCC strategy and a conventional CC strategy, with analysis focusing on thermal stability and charging performance.

4.3.1. Thermal Stability Analysis

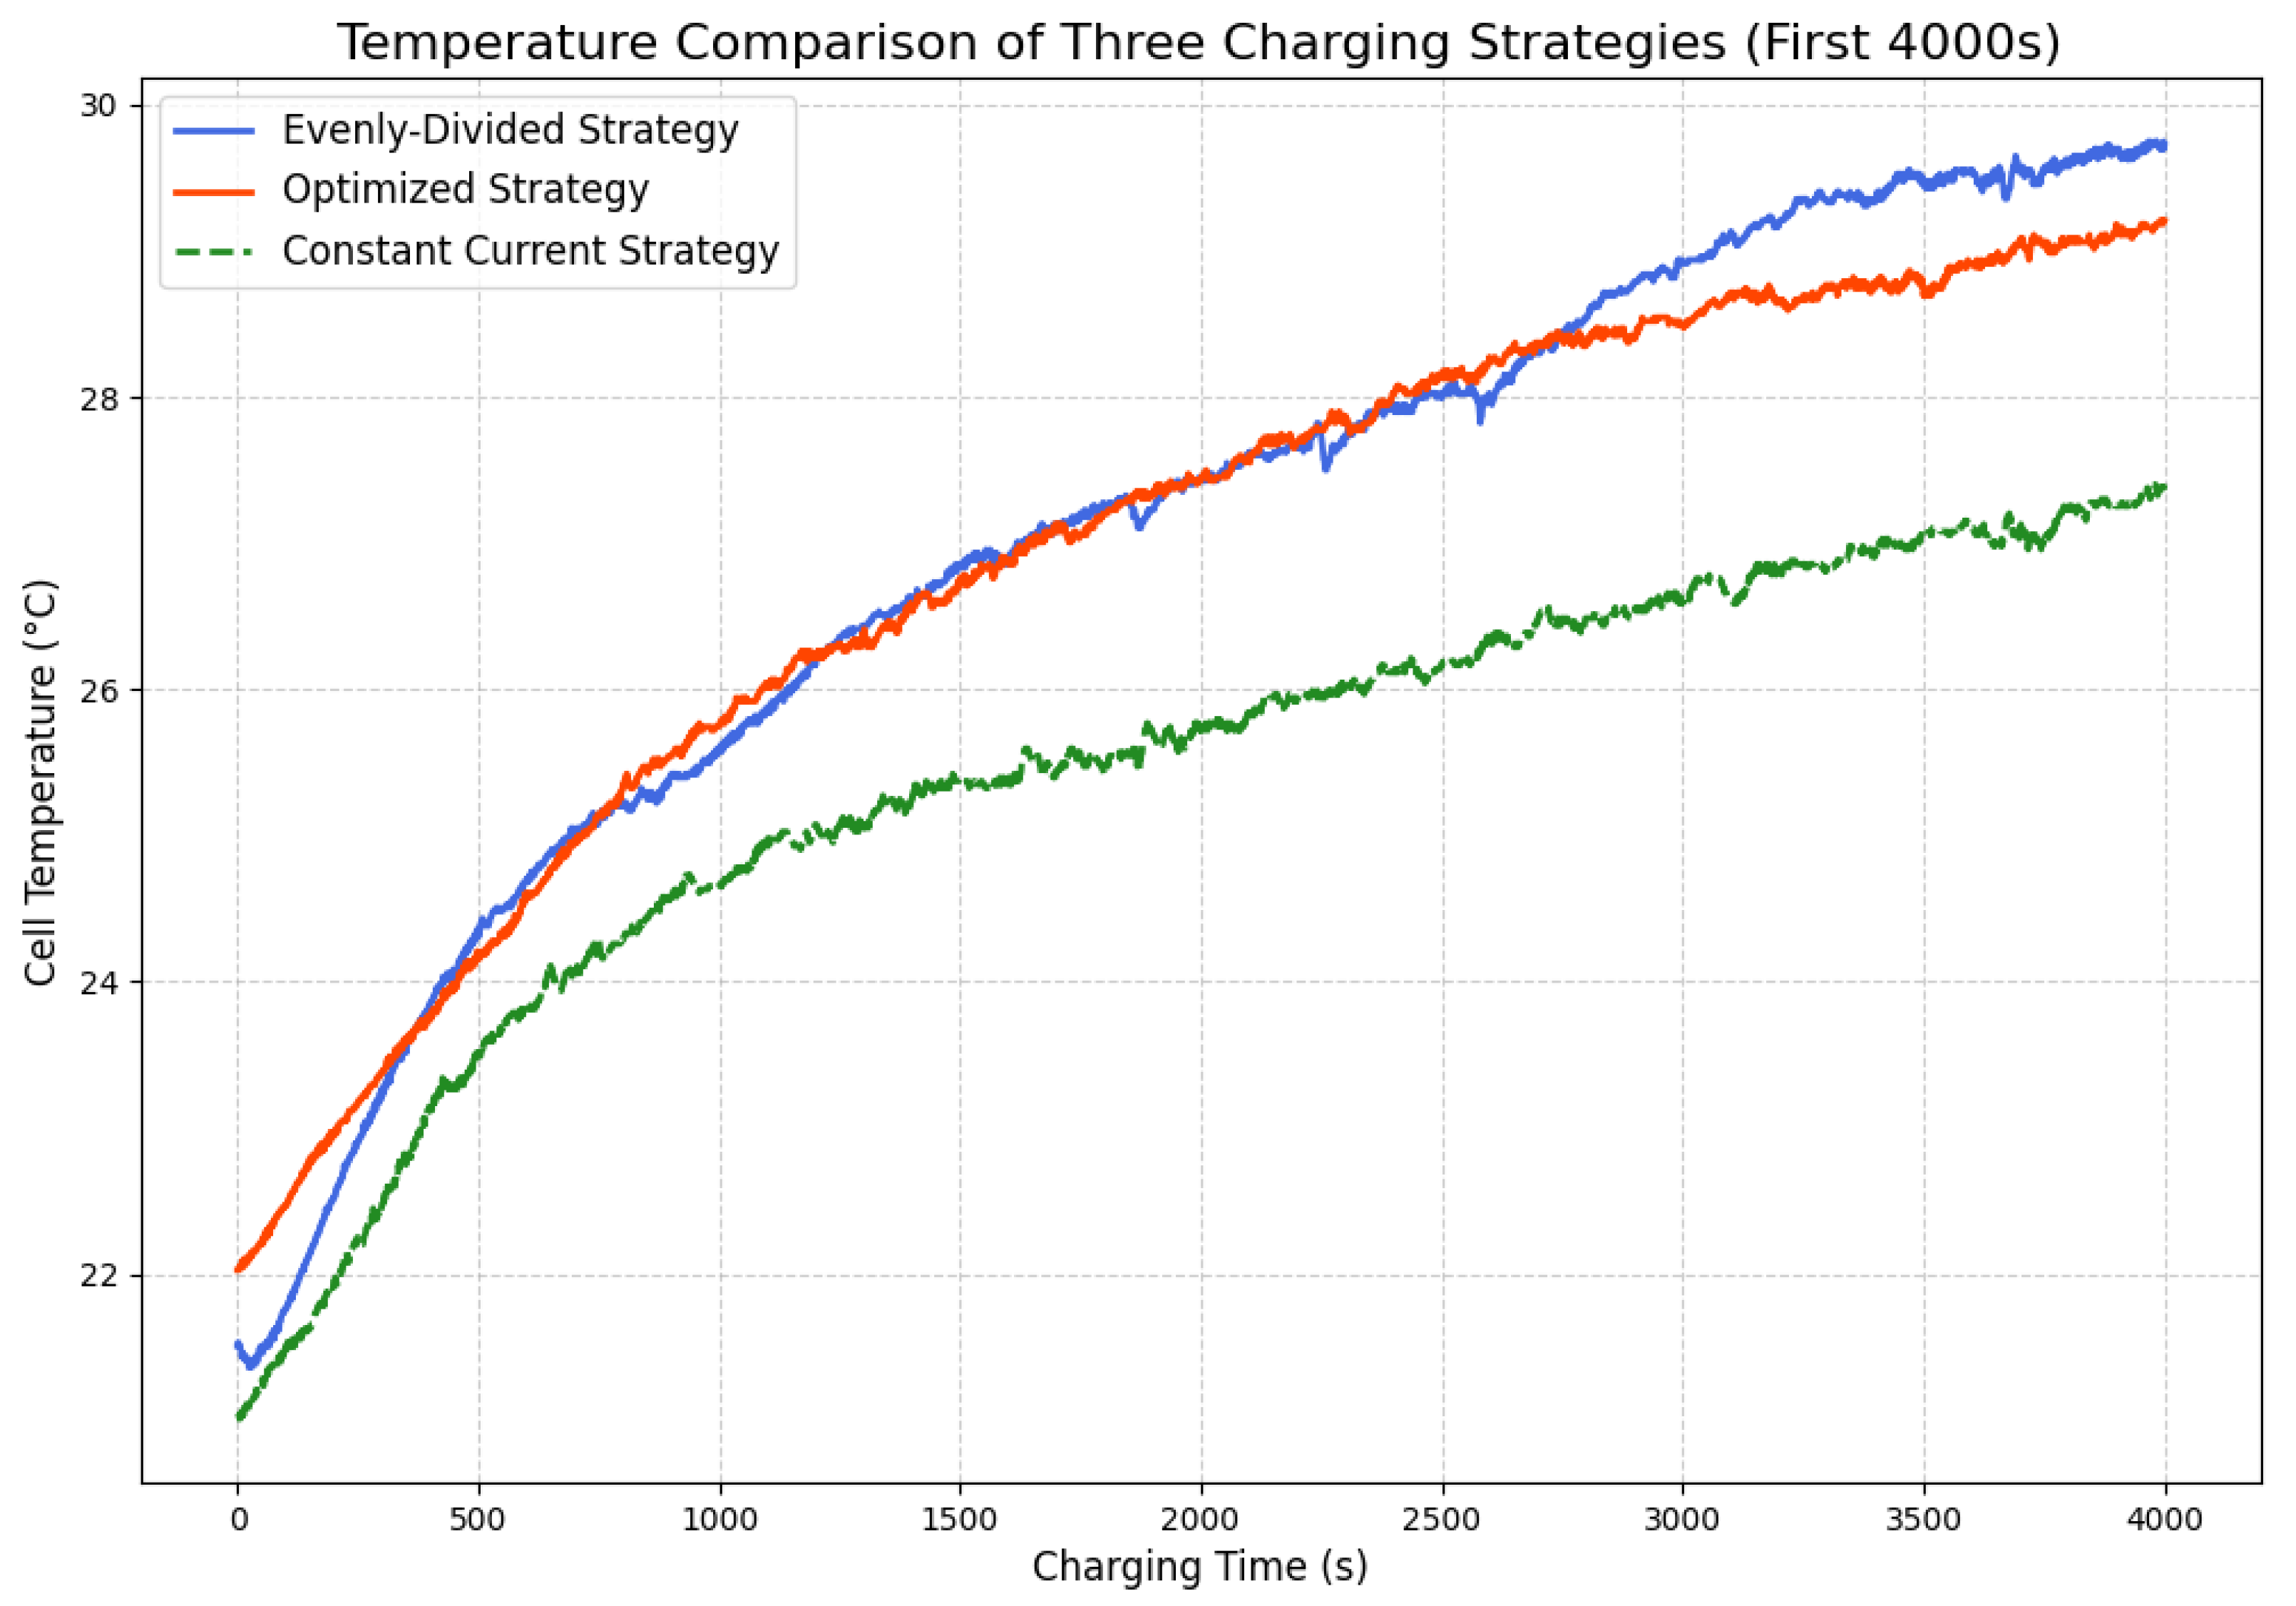
Thermal stability, as a key indicator determining the safety limits and state of health of lithium-ion batteries, highlights the technical advantages of the proposed optimization strategy. As shown in Figure 16, under the constraint of a fixed 4000-s charging duration, the adaptive WNN–MOPSO strategy, uniform SMCC strategy, and conventional CC strategy exhibit distinctly different thermal behaviors. The proposed optimization strategy maintains the lowest temperature throughout the charging cycle. Its peak temperature at the end of charging is only 22.8 °C, which is 0.8 °C lower than the uniform SMCC strategy and 0.4 °C lower than the conventional CC strategy. This superior thermal performance directly validates the rationale of minimizing ohmic losses as the core optimization objective. The strategy uses a canopy–bisecting K–means clustering algorithm to accurately identify regions with highly sensitive internal resistance. By intelligently allocating lower currents in both low–SOC stages with high internal resistance and high–SOC stages, the strategy suppresses heat generation at the source, establishing a coordinated regulation mechanism among current, internal resistance, and heat generation.
Compared with the traditional constant current–constant voltage (CC–CV) strategy, the clustering-based adaptive segmentation method actively reduces charging current in high-SOC regions, significantly mitigating the risk of side reactions caused by sustained high voltage and temperature rise. In this experiment, the high–SOC range is 55–70%. Previous studies have confirmed that under high SOC conditions, lithium dendrite formation and abnormal growth of the SEI film are prone to occur. The intensification of these side reactions directly accelerates battery capacity decay [7,18]. Moreover, elevated temperatures in high-SOC regions further accelerate degradation of electrode active materials and damage to the internal battery structure [9]. Although long–term cycling tests were not conducted in this study, the coupling mechanism between thermal effects and battery aging suggests that the clustering–based optimization strategy can effectively reduce battery degradation rates in high–SOC regions, leading to improved cycle life performance compared with the traditional CC–CV strategy.
Furthermore, the reduction in peak temperature not only slows the battery degradation process but also has significant implications for overall safety. Lower temperature levels help prevent thermal runaway caused by localized overheating, thereby reducing the risks of battery swelling, leakage, and even fire [27]. This indicates that the proposed optimization strategy enhances both cycle life and operational safety, providing a solid foundation for its application in electric vehicles and energy storage systems.

4.3.2. Charging Performance Analysis

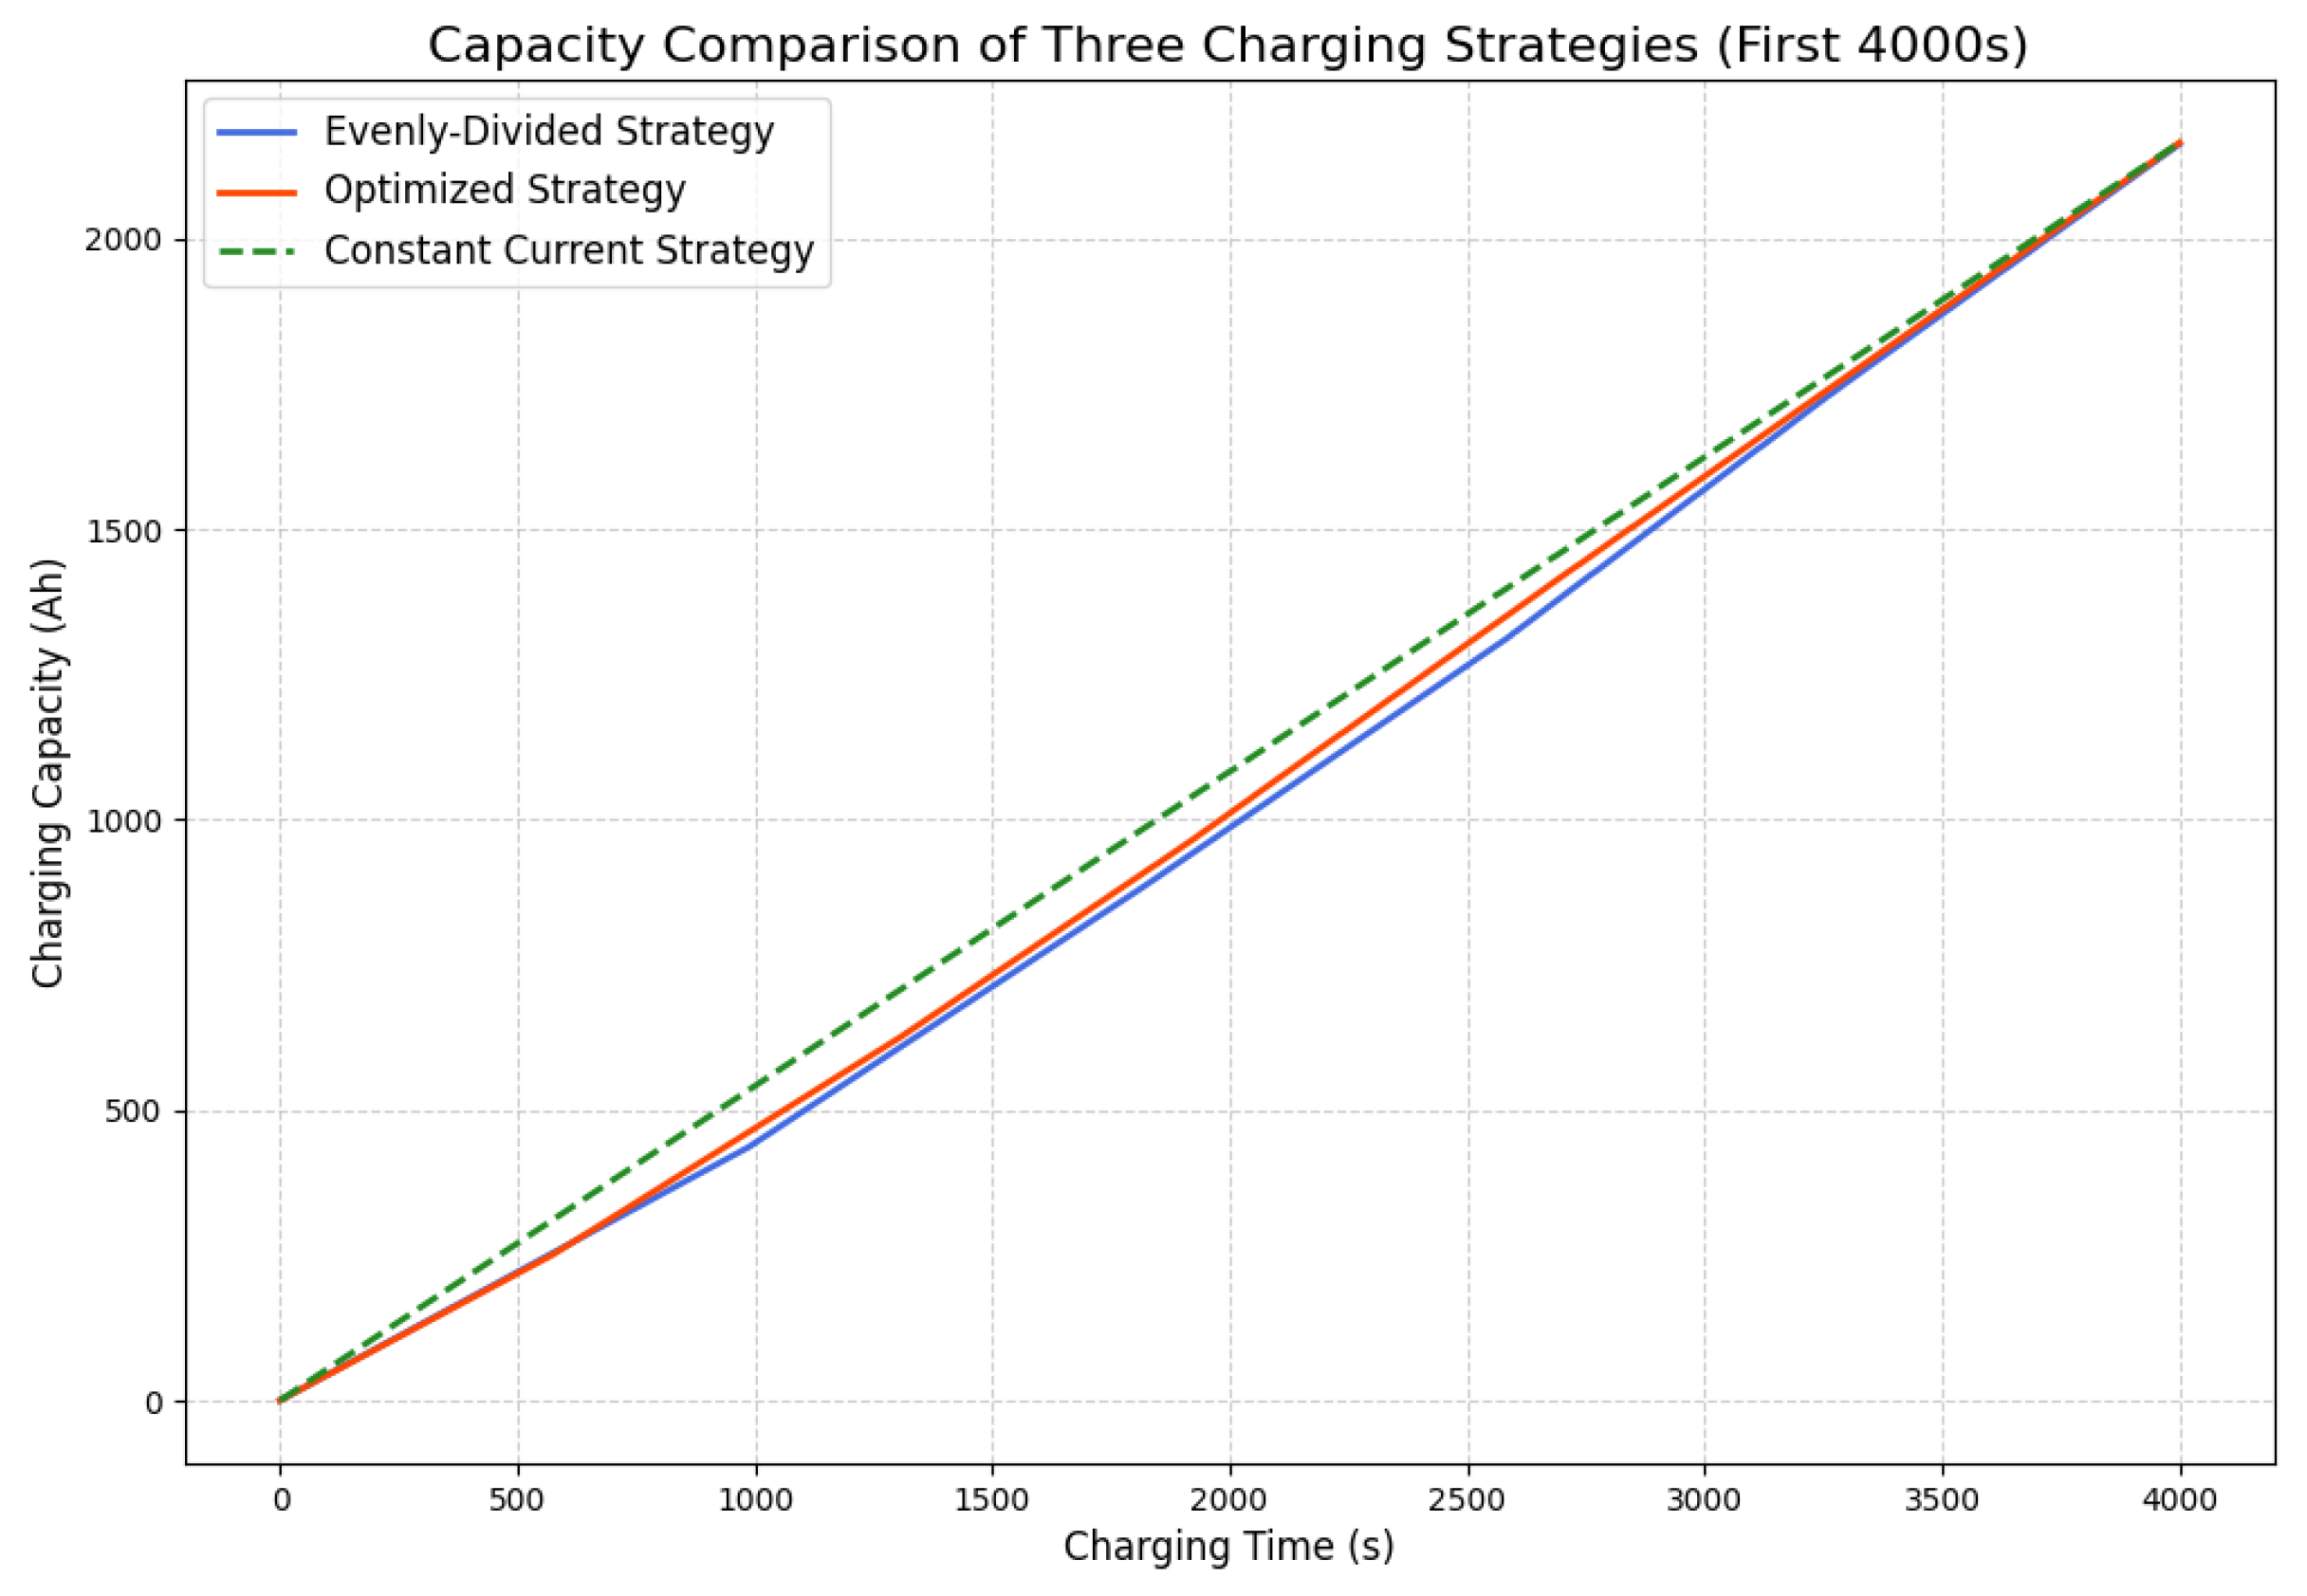
To ensure a fair performance comparison among the adaptive segmentation–WNN–MOPSO strategy, the uniform SMCC strategy, and the conventional CC strategy, it is essential to verify the consistency of task completion under the same charging duration constraint. The experiment set a fixed charging duration of 4000 s. Figure 17 presents the charging capacity curves of the three strategies, visually showing their task completion. The key value of this result is that it directly confirms the significant improvement in thermal stability shown in Figure 16. This improvement is not achieved by compromising charging speed or reducing charging capacity. Instead, it stems from precise regulation of the charging current profile by the optimization strategy. Using canopy–bisecting K–means clustering for adaptive SOC segmentation, combined with accurate fitting of nonlinear charging relationships by the WNN model and multi–objective optimization by the MOPSO algorithm, the current allocation dynamically adapts to the variation of battery internal resistance with SOC. This approach maintains charging rate and capacity while suppressing ohmic heat generation and polarization losses at the source, ultimately achieving a coordinated benefit of fast charging, low thermal impact, and high efficiency.

5. Conclusions

This research examines the fundamental trade-off in lithium-ion battery charging, specifically the equilibrium between charging velocity and battery longevity. A two-phase multi-objective optimization approach is proposed, utilizing SOC staging and a WNN-MOPSO active learning framework. The primary results are derived from theoretical modeling, algorithm enhancement, and experimental validation.
  • The SOC staging technique utilizes an enhanced canopy–bisecting K–means clustering algorithm to adaptively partition the charging process. This segmentation is predicated on the "U–shaped" distribution characteristic of the internal resistance against the SOC curve. This solution decreases the internal resistance SSE by 53.6% compared to the five–phase equal–division method. It utilizes tight phases in the low SOC region to precisely capture the dynamic properties of internal resistance, while implementing wide phases in the high–SOC region to streamline the charging control method. This method markedly improves the flexibility of the battery’s internal condition.
  • A WNN approximation model was developed with the Mexican hat wavelet as its activation function, exhibiting enhanced predictive accuracy. Its RMSE for ohmic loss is 790% lower than that of the Haar wavelet. Moreover, its charging time prediction inaccuracy is 38.5% smaller than that of the DOG wavelet. This model can effectively replace practical experiments in modeling the nonlinear relationships of the charging process. The MOPSO method incorporates numerous essential tactics, such as Logistic chaotic initialization, adaptive t-distribution mutation, and crowding–degree–based tournament leader selection. This technique reduces the IGD metric by 97.6% on the ZDT2 test function, demonstrating enhanced convergence and variety of the solution set, hence facilitating a swift search for optimal solutions.
  • The active learning strategy functions inside a cycle of optimization, sampling, and retraining. In this procedure, high–potential solutions are chosen from the Pareto front. The samples are utilized to calibrate the physical model and rectify the prediction bias of the WNN. This technique exhibits significant efficiency: the IGD between the Pareto front and the genuine optimal boundary can be decreased by 87.6% after merely five repetitions. This outcome clearly demonstrates the efficacy of the iterative optimization method. The notable enhancement verifies that the co–evolutionary mechanism of modeling and optimization can efficiently and consistently augment the optimization capacity for intricate battery systems.
  • The experimentally observed lower charging temperature corroborates the reduced theoretical ohmic losses revealed in earlier simulations. This not only directly confirms the proposed strategy’s significant suppression of peak charging temperature but also experimentally validates its core capability to enhance battery thermal stability. Furthermore, the reduction in peak temperature during charging can slow the rates of internal side reactions and degradation of electrode active materials, effectively delaying battery aging and providing critical technical support for extending cycle life.
In summary, the two–stage optimization strategy proposed in this study integrates adaptive SOC segmentation, algorithmic improvements, and active learning to establish a high-efficiency optimization and accuracy–assurance framework for lithium-ion battery charging. It provides a solution that balances charging efficiency and battery health, offering both theoretical and practical value. Future research could further explore hybrid strategies by combining the WNN–MOPSO framework with other optimization techniques. Such approaches may achieve stronger global search performance and offer improved solutions to this fundamental trade–off problem.

Author Contributions

Conceptualization, X.Y. and X.L.; Methodology, X.Y.; Software, L.S.; Validation, X.Y., L.S. and X.C.; Formal analysis, X.C.; Investigation, X.Y. and L.S.; Resources, X.L.; Data curation, L.S.; Writing–original draft preparation, X.Y.; Writing-review and editing, X.L. and X.C.; Visualization, L.S.; Supervision, X.L.; Project administration, X.L.; Funding acquisition, X.L. All authors have read and agreed to the published version of the manuscript.

Funding

This research was funded by the Shaanxi Qin Chuang Yuan “Scientist + Engineer” Team Construction Project under Grant No. 2023KXJ-297. It was also supported by the 2024 Xi’an Municipal Program for Collaborative R&D on Generic Technology Platforms, grant number 24GXPT0002 (Project on Key Technologies of Charging, Discharging, and Safety for New Energy Vehicle Clusters).

Informed Consent Statement

Not applicable. This study focuses on the research and development of new energy vehicle charging/discharging technologies and safe charging systems, which do not involve human subjects, patient data, or any individual identifiers. Therefore, no informed consent was required for the conduct of this research or for its publication.

Data Availability Statement

The The raw data supporting the conclusions of this article will be made available by the authors on request. Due to the ongoing nature of the project and confidentiality agreements, the data cannot be made publicly available.

Conflicts of Interest

The authors declare no conflicts of interest. The funder (The 2024 Xi’an Municipal Program for Collaborative R&D on Generic Technology Platforms) had no role in the design of the study; in the collection, analyses, or interpretation of data; in the writing of the manuscript; or in the decision to publish the results.

Abbreviations

The following abbreviations are used in this manuscript:
CCConstant Current
CVConstant Voltage
MCCMultistage Constant Current
VMCCVoltage-based Multistage Constant Current
SMCCState-of-Charge-based Multistage Constant Current
MOPMulti-Objective Problem
PSOParticle Swarm Optimization
WNNWavelet Neural Network
MOPSOMulti-Objective Particle Swarm Optimization
HPPCHybrid Pulse Power Characterization
IGDInverted Generational Distance
DMDiversity Metric
NSGA-IINon-dominated Sorting Genetic Algorithm II
SSESum of Squared Errors
RMSERoot Mean Square Error

Appendix A. Electrochemical Model (ECM) Construction
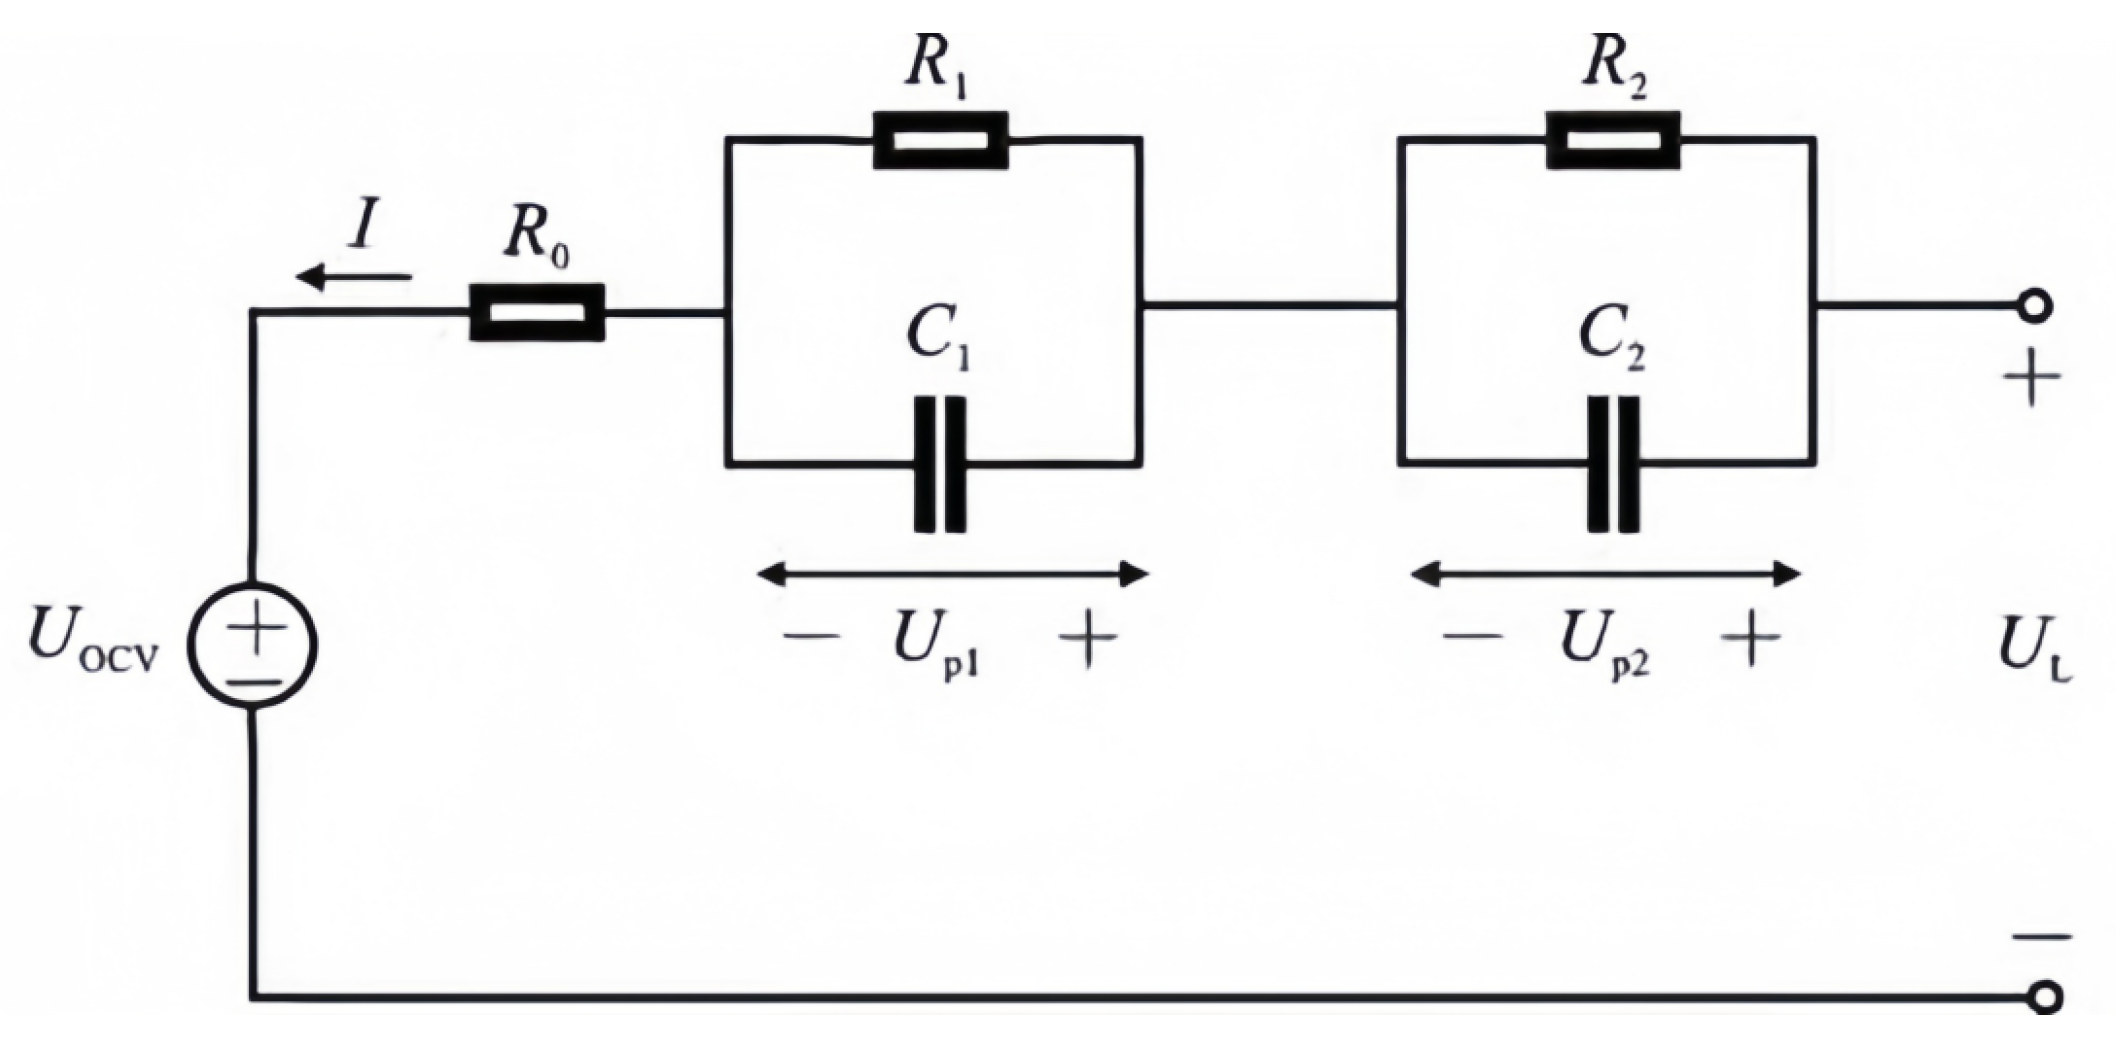
As depicted in Figure A1, the second-order RC equivalent circuit model predominantly consists of the open circuit voltage (OCV) U OCV , ohmic internal resistance R 0 , and two resistor–capacitor (RC) branches. The RC branches comprise polarization resistances R 1 and R 2 , along with their respective polarization capacitances C 1 and C 2 . This configuration delineates the concentration polarization and electrochemical polarization phenomena that transpire at varying temporal scales during battery charging and discharging. The terminal voltage of the battery U L and the polarization voltages U p 1 and U p 2 are delineated by Equations (A1) and (A2), respectively.
U L = U OCV + U p 1 + U p 2 + I R 0 ,
U p 1 ( t ) = U p 1 ( t 0 ) exp t 0 t R 1 C 1 + t 0 t exp τ t R 1 C 1 · I ( τ ) C 1 d τ U p 2 ( t ) = U p 2 ( t 0 ) exp t 0 t R 2 C 2 + t 0 t exp τ t R 2 C 2 · I ( τ ) C 2 d τ .
The SOC of the battery is calculated based on the Coulomb counting method, as shown in Equation (A3).
z ( t ) = z ( t 0 ) + t 0 t I ( τ ) 3600 Q d τ ,
where Z ( t ) is the SOC; I ( τ ) is the charge/discharge current; Q is the actual available capacity of the battery; t is the time variable; t 0 is the initial time.
Figure A1. Second-order RC equivalent circuit model.
Energies 18 05180 g0a1

Appendix B. Battery Characterization Tests and Parameter Acquisition
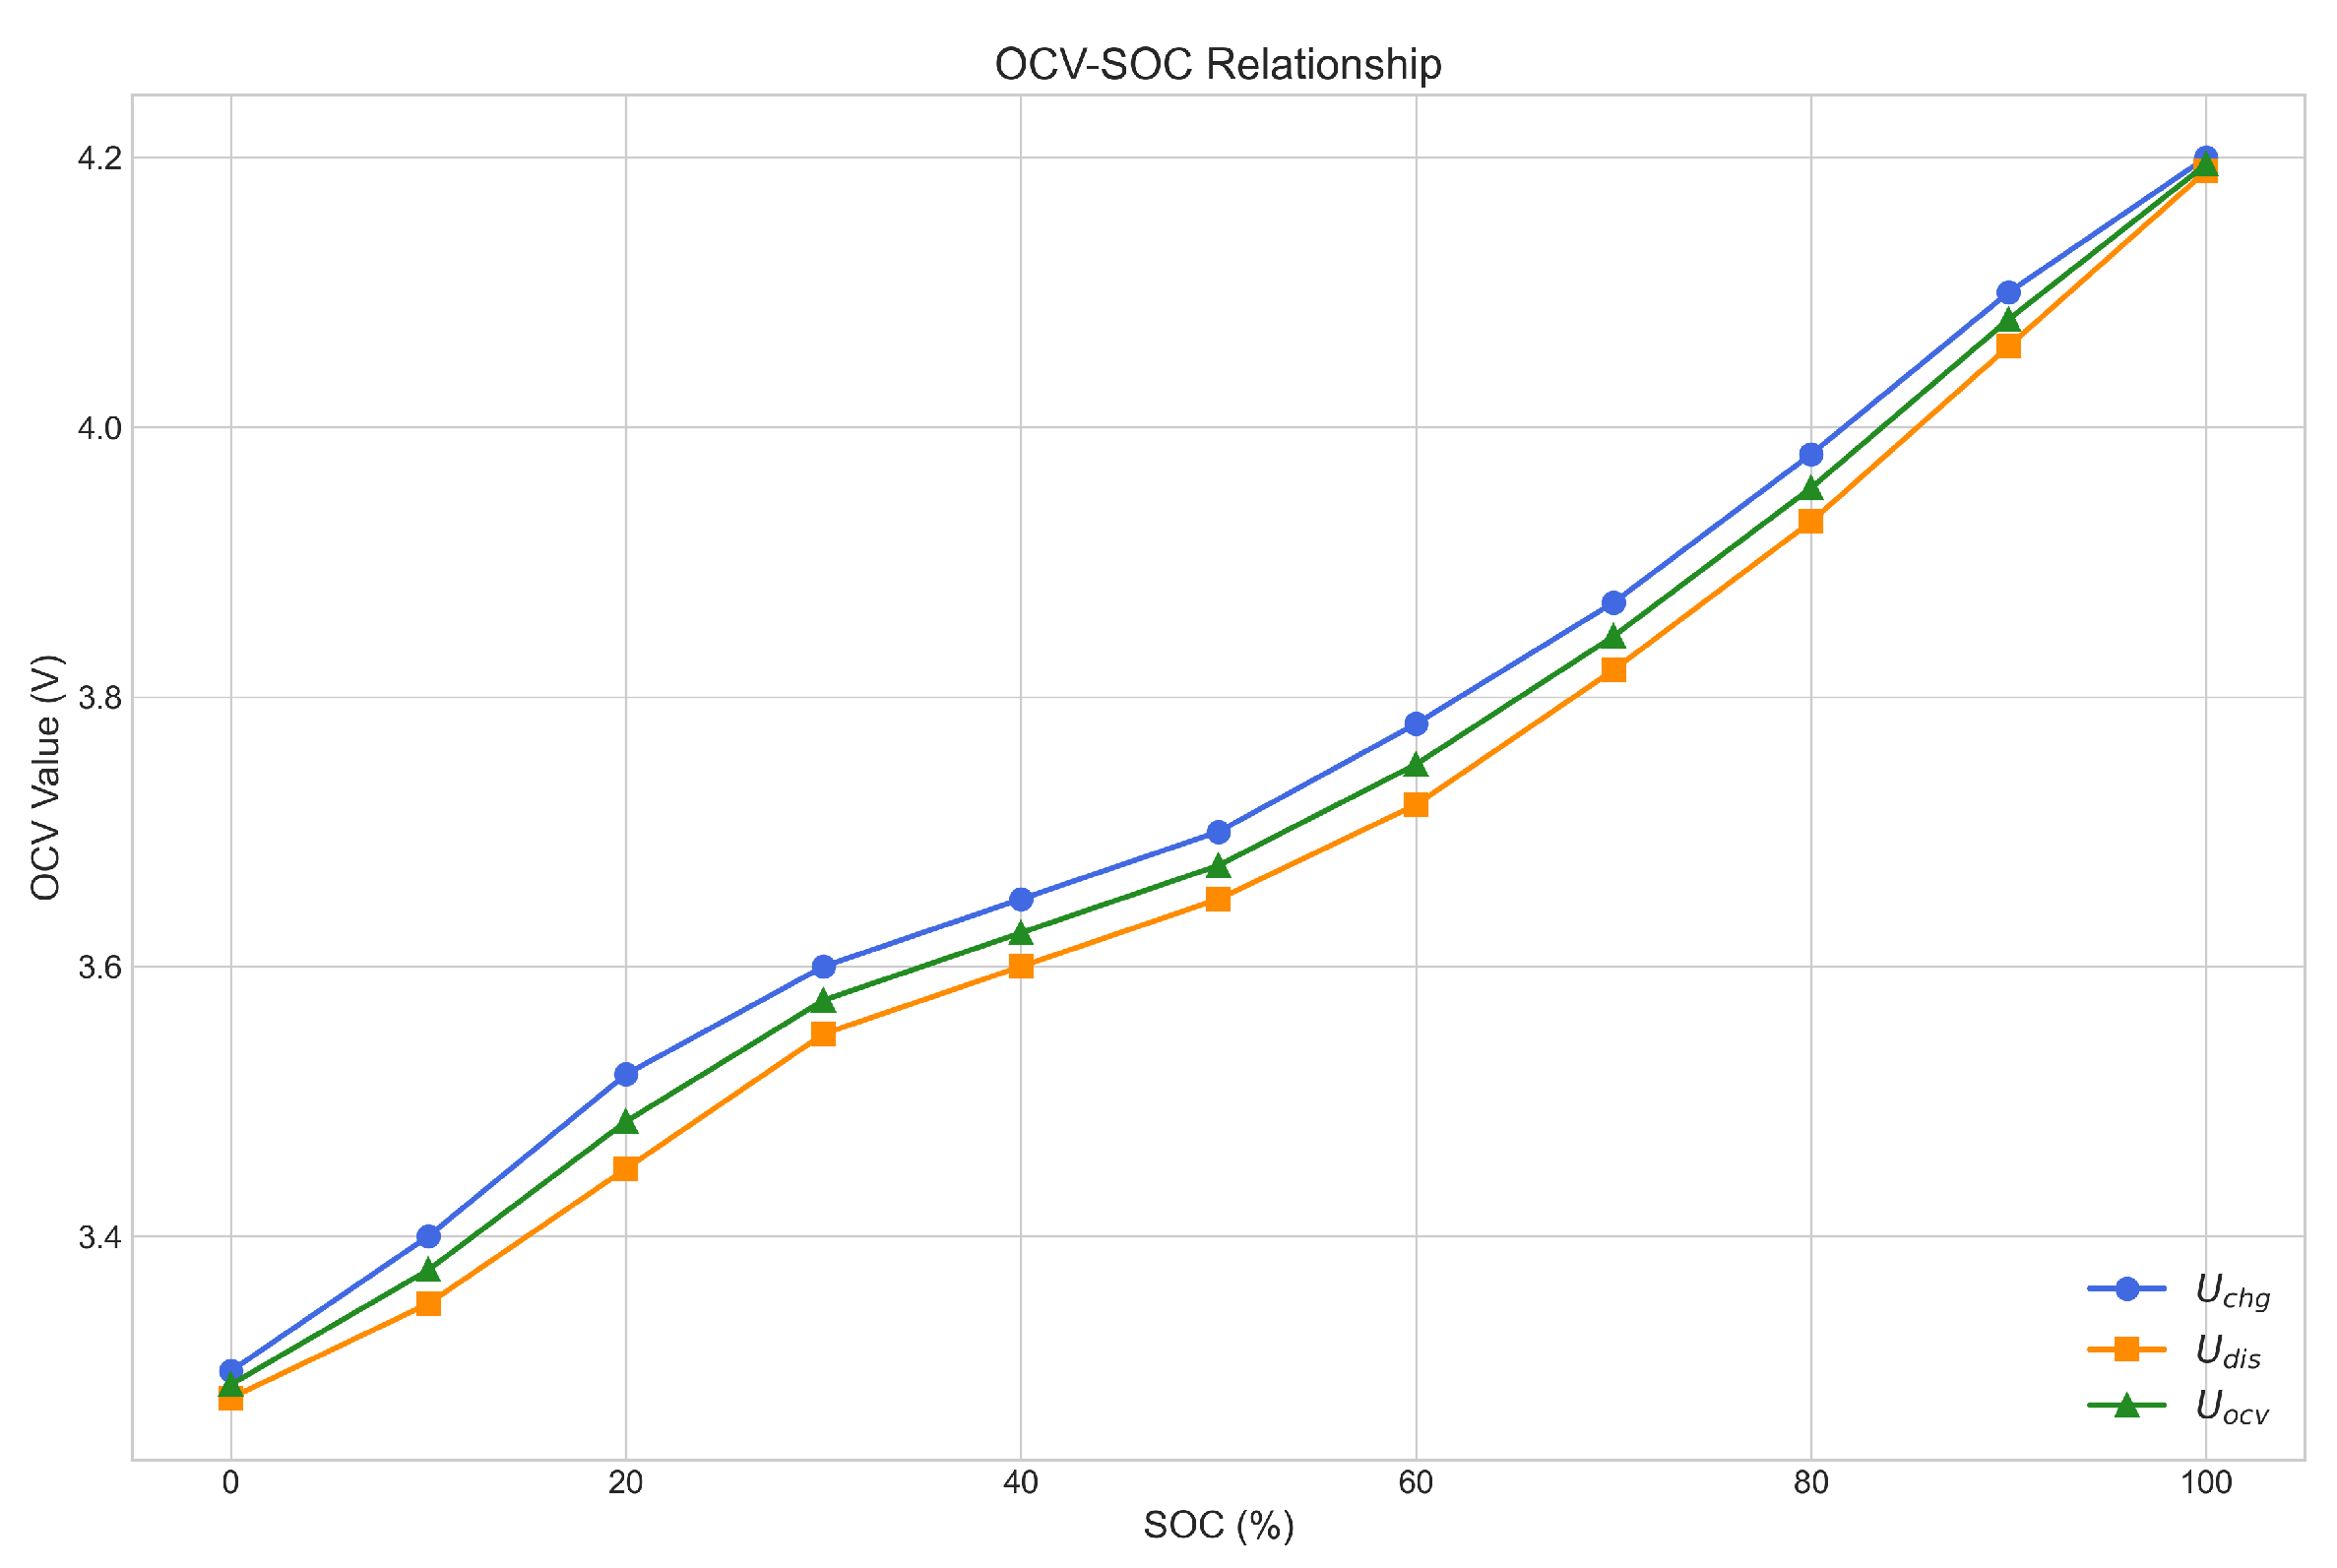
The battery’s real available capacity was ascertained using a capacity test. In this operation, a fully charged battery was discharged at a constant current (CC) rate of 0.3 C till reaching the cut-off voltage. The examination was conducted thrice. Given that the relative error among the values was below 2 % , the mean of the three measurements was considered the actual capacity, determined to be 3.10 A · h.
A voltage characterization test was performed to determine the correlation between the open-circuit voltage (OCV) and SOC. The process entailed charging or discharging the battery to predetermined state of charge levels at a steady current, succeeded by a 5-h rest interval to facilitate voltage stabilization prior to measurement. The OCV was assessed independently for both the charging and discharging procedures. The ultimate OCV of the battery is represented by Equation (A1). The results of the voltage characterization test are illustrated in Figure A2.
U O C V = 1 2 U c h g + U d i s ,
where U c h g is the open-circuit voltage during the charging process; U d i s is the open-circuit voltage during the discharging process.
Model parameter identification was performed based on offline multi-rate HPPC tests. Pulse test cycles were performed at 10% SOC intervals with an additional cycle at 5% SOC to better characterize parameter variations at low SOC levels.
Figure A3 depicts the current profile at a 50% state of charge condition as an illustration. A single cycle of this test comprises three sets of charge–discharge pulses at different C-rates and two supplementary charging pulses. The current rate ratio of discharge to charge pulses is 1:0.75, while the ratio of discharge to supplementary charge pulses is 1:0.25. Prior to each pulse cycle, the battery was depleted at a constant current to a specified state of charge and then allowed to rest for 2 h to achieve equilibrium. The battery’s voltage response to a single current pulse change, Δ I , consists of two components: an instantaneous voltage drop, Δ U , and a polarization voltage, U p . The immediate voltage drop across a capacitor primarily results from its ohmic internal resistance, as the voltage cannot fluctuate rapidly. The ohmic resistance, R 0 , can be calculated using Equation (A2). Equation (A3) is employed to simulate the voltage response curve related to the polarization process.
R 0 = Δ U Δ I
Figure A2. The relationship between open-circuit voltage (OCV) and state of charge (SOC).
Energies 18 05180 g0a2
Figure A3. HPPC (hybrid pulse power characterization) test conditions.
Energies 18 05180 g0a3
U p ( t ) = U ocv + Δ I R 1 exp t 0 t R 1 C 1 + Δ I R 2 exp t 0 t R 2 C 2 .

References

  1. Bondarde, M.P.; Wadekar, P.H.; Some, S. Synthesis of sulfur-doped carbon nanoparticle for the improvement of supercapacitive performance. J. Energy Storage 2020, 32, 101783. [Google Scholar] [CrossRef]
  2. Kumar, K.; Pareek, K. Fast charging of lithium-ion battery using multistage charging and optimization with Grey relational analysis. J. Energy Storage 2023, 68, 107704. [Google Scholar] [CrossRef]
  3. Dong, H.; Huang, W.; Zhao, Y. Low complexity state-of-charge estimation for lithium-ion battery pack considering cell inconsistency. J. Power Sources 2021, 515, 230599. [Google Scholar] [CrossRef]
  4. Vott, C.; Chen, X.; Shen, W.; Kapoor, A. New charging strategy for lithium-ion batteries based on the integration of Taguchi method and state of charge estimation. J. Power Sources 2015, 273, 413–422. [Google Scholar] [CrossRef]
  5. Zhang, C.; Jiang, J.; Gao, Y.; Zhang, W. Charging optimization in lithium-ion batteries based on temperature rise and charge time. Appl. Energy 2017, 194, 569–577. [Google Scholar] [CrossRef]
  6. Sungur, B.; Kaleli, A. State of charge estimation for lithium-ion batteries using optimized model based on optimal HPPC conditions created using Taguchi method and multi-objective optimization. Appl. Sci. 2024, 14, 9245. [Google Scholar] [CrossRef]
  7. Attia, P.M.; Grover, A.; Jin, N.; Severson, K.A.; Markov, T.M.; Liao, Y.H.; Chen, M.H.; Cheong, B.; Perkins, N.; Yang, Z.; et al. Closed-loop optimization of fast-charging protocols for batteries with machine learning. Nature 2020, 578, 397–402. [Google Scholar] [CrossRef]
  8. Ahn, J.H.; Lee, B.K. High-efficiency adaptive-current charging strategy for electric vehicles considering variation of internal resistance of lithium-ion batteries. IEEE Trans. Power Electron. 2019, 34, 3041–3052. [Google Scholar] [CrossRef]
  9. Lin, X.W.; Li, Y.B.; Wu, W.T.; Zhou, Z.F.; Chen, B. Advances on two-phase heat transfer for lithium-ion battery thermal management. Renew. Sustain. Energy Rev. 2024, 189, 114052. [Google Scholar] [CrossRef]
  10. Nouri, A.; Lachheb, A.; El Amraoui, L. Optimizing efficiency of Vehicle-to-Grid system with intelligent management and ANN-PSO algorithm for battery electric vehicles. Electr. Power Syst. Res. 2024, 226, 109936. [Google Scholar] [CrossRef]
  11. Wang, Z.; Wang, L.; Wang, S.; Zhang, Z. Multi-objective optimization of electric vehicle charging and discharging in a V2G network using a hybrid Harris Hawks and Particle Swarm Optimization algorithm. Energy 2023, 282, 128221. [Google Scholar] [CrossRef]
  12. Yang, R.; Lu, J.; Sun, Z.; Huang, W. Multi-objective optimization of parking charging strategy for extended-range hybrid electric vehicle based on MOMSA. World Electr. Veh. J. 2025, 16, 203. [Google Scholar] [CrossRef]
  13. Ma, H.; Zhang, Y.; Sun, S.; Liu, T.; Shan, Y. A comprehensive survey on NSGA-II for multi-objective optimization and applications. Artif. Intell. Rev. 2023, 56, 15217–15270. [Google Scholar] [CrossRef]
  14. Deb, K.; Pratap, A.; Agarwal, S.; Meyarivan, T. A fast and elitist multiobjective genetic algorithm: NSGA-II. IEEE Trans. Evol. Comput. 2002, 6, 182–197. [Google Scholar] [CrossRef]
  15. Deb, K.; Agrawal, S.; Pratap, A.; Meyarivan, T. A fast elitist non-dominated sorting genetic algorithm for multi-objective optimization: NSGA-II. In Parallel Problem Solving from Nature PPSN VI. PPSN 2000. Lecture Notes in Computer Science; Springer: Berlin/Heidelberg, Germany, 2000; Volume 1917, pp. 849–858. [Google Scholar] [CrossRef]
  16. Li, K.; Zhang, H.; Xie, Y.; Fu, C. Study on self-adaptive multistage constant current charging based on electro-thermal-aging coupling model. J. Northeast. Univ. Nat. Sci. 2019, 40, 1323–1329. [Google Scholar] [CrossRef]
  17. Lei, H.; Hu, X.; Zhao, J.; Deng, D.; Wang, R. Research progress and prospects of public transportation charging station layout methods. World Electr. Veh. J. 2024, 15, 63. [Google Scholar] [CrossRef]
  18. Aghili Mehrizi, A.; Yeganehdoust, F.; Madikere Raghunatha Reddy, A.K.; Farhad, S. Challenges and issues facing ultrafast-charging lithium-ion batteries. Batteries 2025, 11, 209. [Google Scholar] [CrossRef]
  19. Duan, S.; Xia, K.; Zhu, W. Multi-stage optimization charging strategy for lithium-ion batteries considering diverse application scenarios. Energy Storage Sci. Technol. 2025, 14, 779–788. [Google Scholar] [CrossRef]
  20. Tobias, A.V.; Wahab, A. Autonomous ‘self-driving’ laboratories: A review of technology and policy implications. R. Soc. Open Sci. 2025, 12, 250646. [Google Scholar] [CrossRef]
  21. Cheng, F.; Liu, H. Charging strategies optimization for lithium-ion battery: Heterogeneous ensemble surrogate model-assisted advanced multi-objective optimization algorithm. Energy Convers. Manag. 2025, 342, 120170. [Google Scholar] [CrossRef]
  22. Acikkapi, M.S.; Ozkaynak, F. A method to determine the most suitable initial conditions of chaotic map in statistical randomness applications. IEEE Access 2021, 9, 1482–1494. [Google Scholar] [CrossRef]
  23. Yang, X.; Liu, J.; Liu, Y.; Xu, P.; Yu, L.; Zhu, L.; Chen, H.; Deng, W. A novel adaptive sparrow search algorithm based on chaotic mapping and t-distribution mutation. Appl. Sci. 2021, 11, 11192. [Google Scholar] [CrossRef]
  24. Chen, W.; Wu, H.; Gao, H.; Li, Y. A Two-Layer Optimization Strategy for Battery Energy Storage Systems to Achieve Primary Frequency Regulation. Energies 2023, 16, 2811. [Google Scholar] [CrossRef]
  25. Lee, C.-H.; Chang, T.-W.; Hsu, S.-H.; Jiang, J.-A. Taguchi-based PSO for searching an optimal four-stage charge pattern of Li-ion batteries. J. Energy Storage 2019, 23, 444–453. [Google Scholar] [CrossRef]
  26. Zhao, J.; Song, C.; Li, G. Fast-Charging Strategies for Lithium-Ion Batteries: Advances and Perspectives. ChemPlusChem 2022, 87, e202200155. [Google Scholar] [CrossRef] [PubMed]
  27. Feng, X.; Ouyang, M.; Li, X.; Lu, L.; Li, J.; He, X. Thermal runaway mechanism of lithium ion battery for electric vehicles: A review. Energy Storage Mater. 2018, 10, 246–267. [Google Scholar] [CrossRef]
Figure 1. Identification results for ohmic and polarization internal resistance.
Energies 18 05180 g001
Figure 2. Internal resistance fitting results.
Energies 18 05180 g002
Figure 3. Calculation results of ohmic loss at different C–rates.
Energies 18 05180 g003
Figure 4. Diagram of stepwise multiple constant–current (SMCC) strategy.
Energies 18 05180 g004
Figure 5. Two-phase state of charge (SOC) optimization strategy.
Energies 18 05180 g005
Figure 6. Probability density function graphs of adaptive t–distribution.
Energies 18 05180 g006
Figure 7. Staged optimization results.
Energies 18 05180 g007
Figure 8. Sum of squared errors vs. number of phases.
Energies 18 05180 g008
Figure 9. Comparison of the convergence curves of the improved multi-objective particle swarm optimization (MOPSO) and standard particle swarm optimization(PSO) on the ZDT4 test function.
Energies 18 05180 g009
Figure 10. Results of the WNN-MOPSO framework with active learning iteration.
Energies 18 05180 g010
Figure 11. Comparison of prediction accuracy for four different wavelet basis functions.
Energies 18 05180 g011
Figure 12. Performance analysis of the WNN–MOPSO algorithm driven by multiple synergistic strategies.
Energies 18 05180 g012
Figure 13. Comparison of charging time for three charging strategies.
Energies 18 05180 g013
Figure 14. Convergence process comparison between MOPSO and non-dominated sorting genetic algorithm II (NSGA-II) for minimizing ohmic loss at a 3000s charging time.
Energies 18 05180 g014
Figure 15. Comparison of Pareto fronts for three strategies.
Energies 18 05180 g015
Figure 16. Temperature profile comparison of the three charging strategies.
Energies 18 05180 g016
Figure 17. Charging capacity comparison of the three charging strategies.
Energies 18 05180 g017
Table 1. Main parameters of the battery.
Battery ParameterValueBattery ParameterValue
Nominal Capacity /(A·h)3.25Charging Cut–off Voltage/V4.2
Maximum Charging Current/A1 CDischarging Cut–off Voltage/V2.5
Standard Charging Current/A0.5 C
Table 2. Comparison of wavelet neural network (WNN) performance with different numbers of hidden layer neurons.
Number of NeuronsRMSE of Charging Time (s)RMSE of Ohmic Loss (J)Training Time (ms/Epoch)
10158.445.23.1
15146.841.74.5
20142.338.55.2
25143.139.86.6
Table 3. Comparison of segmentation results by phase.
PhaseInternal Resistance ( Ω )Range Width (%)
Equal Div.OptimizedEqual Div.Optimized
10.10250.1120148
20.07220.08361412
30.06290.06731411
40.06240.06241414
50.06250.06251425
Total SSE
   Equal Division0.0028
   Optimization0.0013
Table 4. Algorithm test parameter settings.
Parameter NameAlgorithm NameValue
Population SizePSO/MOPSO/MOPSO Improved100
Total Number of IterationsPSO/MOPSO/MOPSO Improved250
Archive SizeMOPSO/MOPSO Improved100
Inertia Weight wMOPSO/MOPSO Improved0.5
Learning Factors c 1 , c 2 MOPSO/MOPSO Improved1.5, 1.5
Neighborhood Size kMOPSO Improved5
Velocity Limiting FactorMOPSO Improved0.2
Mutation OperatorMOPSO ImprovedPolynomial Mutation
Table 5. Results of standard test functions (mean and standard deviation).
Test FunctionMetricPSOMOPSOImproved MOPSO
Mean
(Std. Dev.)
Mean
(Std. Dev.)
Mean
(Std. Dev.)
IGD0.367295
(0.070451)
0.429102
(0.290745)
0.010145
(0.001940)
ZDT2DM5.054480
(0.532240)
1.412817
(0.000815)
1.413160
(0.001817)
SP0.475596
(0.078511)
0.010616
(0.003143)
0.009268
(0.002339)
IGD6.006661
(2.264237)
7.338512
(3.618626)
7.338512
(3.618626)
ZDT4DM151.445495
(27.401011)
2.895908
(3.190638)
1.445408
(2.217614)
SP18.963343
(4.462454)
0.401359
(0.453505)
0.260423
(0.564899)
IGD0.237902
(0.031811)
0.046466
(0.000353)
0.046515
(0.000389)
ZDT6DM8.532387
(0.382996)
2.402346
(1.310316)
2.853585
(1.749217)
SP0.362554
(0.099496)
0.120608
(0.130768)
0.139851
(0.146945)
Disclaimer/Publisher’s Note: The statements, opinions and data contained in all publications are solely those of the individual author(s) and contributor(s) and not of MDPI and/or the editor(s). MDPI and/or the editor(s) disclaim responsibility for any injury to people or property resulting from any ideas, methods, instructions or products referred to in the content.