Article

Neutronic and Thermal Coupled Calculations for an HTGR Pebble with Discrete Power Generation Using Serpent and OpenFOAM

by
Michał Górkiewicz
1,* and
Jakub Sierchuła
1,2
1
National Centre for Nuclear Research (NCBJ), A. Sołtana 7, 05-400 Otwock-Świerk, Poland
2
Faculty of Environmental Engineering and Energy, Poznan University of Technology, Piotrowo 3a, 60-965 Poznan, Poland
*
Author to whom correspondence should be addressed.
Energies 2025, 18(19), 5148; https://doi.org/10.3390/en18195148 (registering DOI)
Submission received: 28 August 2025 / Revised: 23 September 2025 / Accepted: 25 September 2025 / Published: 27 September 2025

Abstract

The High Temperature Gas-cooled Reactor (HTGR) is characterized by a high output temperature and inherent safety due to its fuel design. However, the double heterogeneity of the reactor component structure poses a challenge in thermal analyses, where fuel temperature is a key safety parameter. In this paper, a methodology for coupled thermal and neutron calculations with power discretization is developed to accurately reflect the spatial phenomena occurring in the moderator. The method is based on the point generation of power in the thermal model, and these points are determined based on the location of the fuel in the neutron model. The multi-physics interface capabilities of the Serpent code were used to investigate several configurations of the thermal model mesh and its alignment with the fuel. The impact of the radial discretization of power density was further analyzed in detail. The study revealed that the highest accuracy was achieved when the thermal model mesh was aligned with the TRi-structural ISO-tropic (TRISO) fuel particle size, and the TRISO particle arrangement was centered relative to the mesh cells. Moreover, it was found that due to the power–temperature feedback phenomena, the power is shifted outwards within a range of 1% of the relative power density.

1. Introduction

The High Temperature Gas-cooled Reactor (HTGR) is a promising technology with significant potential for different industrial applications [1,2]. The growing interest in this technology forces the need for a deeper understanding of the phenomena that occur in the reactor to make its operation more efficient and safe. The distinctive feature of HTGRs is the TRi-structural ISO-tropic (TRISO) fuel particles, consisting of a kernel containing fissile material surrounded by layers of porous carbon, pyrolytic carbon, and silicon carbide (SiC). These particles have a diameter of roughly 1 mm and are embedded within larger graphite matrix structures (pebbles or prismatic blocks). The complexity arising from this arrangement is referred to as double heterogeneity. The integrity of the TRISO particles is an essential factor in terms of HTGR safety. Although it has been demonstrated that TRISO is a mechanically and thermally robust fuel, it is critical to ensure that the temperature limit is not exceeded, beyond which the TRISO layers may fail to retain radioactive fission products within the particle [3]. The definition of a geometry that incorporates double heterogeneity is well established in Monte Carlo neutron transport codes such as MCNP [4] or Serpent [5], but its implementation in thermal analyses remains challenging [6]. The above statement can be addressed to the randomness of the distribution of TRISO particles within the HTGR fuel component, which arises from the technical aspects of the manufacture of the HTGR fuel components. That is, during the formation of the fuel zone within the fuel element, the TRISO particles are overcoated with the layer of the graphitic material in the rotating drum. The size of the overcoated particles is within the range of 1.1 to 1.5 mm [7], which has an impact on the mutual distances between particles. The further molding and pressing of the particles and the matrix graphite powder mixture contribute further to the randomness of the distribution of the former. The influence of TRISO distribution on HTGR performance is determined by the fact that nuclear fission occurs only in the TRISO kernels. Since these kernels occupy only about 1–10% of the total mixture volume, depending on the packing fraction and the particle design, their spatial arrangement affects the reactor behavior. Thus, kernel distribution significantly contributes to the power distribution within a fuel component. Moreover, the spatial self-shielding effect and thermal–neutronic feedback may cause significant differences in internal heat sources in the TRISO kernels at various locations in the HTGR fuel elements [6]. In pebble-bed HTGRs, an additional time-dependent source of complexity arises from the recirculation and rearrangement of fuel pebbles. Pebble motion modifies the local fuel composition and neutron moderation, thereby influencing the power distribution [8]. On a larger scale, the distribution of power is significantly influenced by the position of burnable poisons, the presence of a reflector, or control rods [9]. Since these local and global power variations directly affect the temperature field, new methods are being developed to provide more accurate temperature distributions in analyses of HTGR fuel components, with regard to the aforementioned problems. A common method to include double heterogeneity in thermal analyses of HTGRs is to homogenize the TRISO particles with the graphite matrix and describe the mixture using effective solid parameters [10]. One example of a more advanced method is the multiscale expansion homogenisation method, which distinguishes between the macro-scale domain, where effective material properties are defined, and the fine scale, where local fluctuations are resolved through so-called cell problems. This allows the computation of a macro-scale solution enriched when needed by reconstructed fine scale fields that preserve sub-resolution accuracy [11]. However, these methods typically rely on the assumption of scale separation and periodicity in the microstructure, which may not hold the case of the stochastic or irregular TRISO distributions [12]. The approach currently being developed involves integrating computational codes covering various physical issues into a single coherent computational system. This makes it possible to perform not only multi-physics simulations, but also multi-scale simulations using tools that take into account phenomena occurring in different geometric orders of magnitude. This is particularly suitable for HTGR analyses due to their dual heterogeneity. The Cardinal application, which combines neutron, thermo-hydraulic, and fuel performance calculations, is worth mentioning here. The applicability of this tool for performing multiscale analyses of the entire HTGR core has already been demonstrated through appropriate data mapping between individual codes [13]. A special case of such mapping is Heat Source Decomposition, in which the heat source is divided into an average value and a fluctuation component. Macro-scale is first analysed using the average value, while the fluctuation is used to solve a representative micro-scale case, and the final solution is the superposition of the average solution and representative fluctuations [14,15]. A slightly simpler approach involves homogenizing material properties within a representative domain and applying a sub-model for calculations at the micro-scale corresponding to that domain. An example of this approach is coupled calculations using the OpenMC neutron code, OpenFOAM thermal-fluid code, and an analytical one-dimensional heat transport sub-model in the TRISO particle [16]. This method allows the determination of average and peak thermal conductivity, which can be further used in a simplified model to obtain the average and peak temperature of the fuel component [17]. In an alternative Improved Two Temperatures Method, the mixture of TRISO and graphite matrix is represented by a central region of pure fuel surrounded by the matrix. Heat transfer equations are then corrected using coefficients that take into account the actual heat transfer surfaces [18]. Although the methods mentioned above allow for effective determination of maximum HTGR fuel temperatures, they are based on the assumption of a certain homogeneity in the arrangement of TRISO particles. This paper presents a preliminary proposal for a method of analyzing HTGR fuel assemblies using the open-source OpenFOAM code and the Serpent code, which requires the use of a single computational mesh for both codes, and is presented as an example of the Very High Temperature Reactor (VHTR) fuel pebble [19]. The proposed method allows the non-periodicity of the power distribution caused by the randomness of the distribution of TRISO particles within the pebble to be mapped. At the current stage of the study, macro-scale calculations have been carried out, with particular attention paid to the proper representation of the aforementioned irregularity. Therefore, the research gap identified by the authors is the lack of a coupled neutronic–thermal methodology that can directly incorporate this stochasticity without relying on homogenization or periodic boundary conditions at the micro-scale. Moreover, the proposed methodology allows for a more realistic representation of the temperature distribution of graphite, which is, nevertheless, the main component of the HTGR fuel elements. First, the thermal analyses in OpenFOAM [20] are described with total homogenization of the fuel pebble thermal properties for verification purposes. Then, a distinction between internal TRISO particles and graphite mixture, and an external pure graphite cover was applied. The corresponding neutronic model with random TRISO particles distribution was done in Serpent, and the coupling with the OpenFOAM model was achieved through the use of the Serpent multi-physics interface [21]. Later on, the coupling strategy with discrete power generation distribution corresponding to the TRISO locations is explained, including the methodology for assignment of the OpenFOAM mesh cells to specific materials of the TRISO and graphite mixture in the Serpent model [22]. It was found that the performance of the analysis depends on the OpenFOAM mesh, and the accuracy of the cell’s assessment of materials. Thus, four cases of initial coupled calculations were discussed, for two meshes (one with maximum cell size corresponding to the diameter of a TRISO particle and the other to the kernel) and for two TRISO distributions (original random distribution and with TRISO positions adjusted to the mesh cell centers). Finally, an analysis of the radial discrete power distribution precision is described and the results are thoroughly discussed.

2. Methodology of Coupled Calculations for VHTR Pebble

The Very High Temperature Gas-cooled Reactor is a pebble-bed HTGR concept, whose core consists of numerous graphite pebbles containing TRISO particles. The number of pebbles can vary from tens of thousands (e.g., 27,000 in the HTR-10 [23]) to hundreds of thousands (e.g., 420,000 in HTR-PM [24]). In each pebble, TRISO particles are dispersed in the graphite matrix within the radius of 2.5 cm from the pebble center. The matrix is surrounded by an external pure graphite shell with a thickness of 0.5 cm, thus the total pebble diameter is 6 cm. A simulation system for a single pebble was developed using the OpenFOAM and the Serpent codes. Models constituting the system are based on the earlier work [16], which is used here as a reference. The number of TRISO particles used, both in the reference case and in this study, is 10,000.

2.1. Thermal Model

In thermal calculations, the pebble is divided into two regions. The inner region represents the TRISO and graphite matrix mixture and is hereafter referred to as the fuel region. The external region is the pure graphite layer. The latter has the thermal properties of pure graphite. In the first region, the thermal properties of the mixture were homogenized using the Chiew and Glandt model [25,26], since maintaining a fine representation of TRISO particles would require a very dense mesh, resulting in significant computational resources [17]. To ensure an accurate representation of the power profile (Section 2.3), two meshes were prepared. The criterion for the mesh density was that the TRISO particle could not be inscribed in any mesh cell (i.e., the length of the largest cell does not exceed the particle diameter). For the finer mesh analogical criterion was applied, but with a fuel kernel instead of a TRISO particle. The coarser mesh is referenced to as the TRISO-mesh and has 294,272 cells, and the finer mesh is referenced to as the kernel-mesh and has 1,691,311 cells. The thermal model in OpenFOAM was verified with analytical results for one-dimensional heat transfer in spherical coordinates. Although the simplicity of the approach allows for quick verification of a simplified case, it would not be reliable in a more realistic situation, where the flow of helium should also be considered. For verification, the TRISO-mesh was used, and the dependence of thermal properties on temperature was neglected, with a constant thermal conductivity applied. The verification model is shown in Figure 1, the parameters are listed in Table 1, and the results are presented in Figure 2. In order to maintain consistency with the reference work, for all subsequent calculations presented in this paper, the temperature boundary condition was set to a fixed value of 1073 K, and the total power generated in the pebble was set to 1057 W, unless stated otherwise. A simplification of the uniformity of the boundary temperature was applied for better identification of the temperature changes arising from the power distribution. Taking into account the helium flow would generally lead to an increase in the boundary temperature of the pebble with the direction of the flow, obviously affecting the internal temperature distribution within the pebble. The numerical results were obtained from every mesh cell and sorted by the distance of the cell center from the pebble center. Due to the structure of the spherical mesh (see Section 2.3), cells in the intermediate positions have the most diverse distances from the pebble center. The mesh in the shell region (radius above 2.5 cm) has a more regular structure, so that it can be divided into 6 concentrical layers, thus the numerical results for the shell can be treated as one temperature value per layer. The maximum temperature obtained in the numerical solution is 1222.3 K, while the maximum temperature in the analytical solution is 1222.5 K. Verification of the thermal model confirms its usefulness, especially the distinction between regions with and without power generation.
In subsequent calculations the dependence of material properties on the temperature was applied as presented in Table 2 [15].
The homogenized parameters in the fuel region were calculated with the Chiew and Glandt model as presented in Equations (1)–(3). Subscript i in the latter equation represents TRISO materials, and ϵ i stand for volume fraction of i-th material within a TRISO particle. The parameters for which the equations were applied are thermal conductivity and specific heat. The χ T for each parameters is calculated using the respective properties of U O 2 kernel, buffer layer, PyC, and SiC.
χ f u e l = χ C · 1 + 2 β p f + ( 2 β 3 0.1 β ) p f 2 + 0.05 p f 3 e 4.5 β 1 β p f
β = χ T χ C χ T + 2 χ C
1 χ T = i = 1 ϵ i χ i
Moreover, for comparison with the reference case (Section 3.1), the division between the fuel and the shell region was omitted by further homogenization of thermal properties, according to Equation (4).
1 χ = ϵ f u e l χ f u e l + ϵ s h e l l χ C

2.2. Neutronic Model

The neutronic model was developed using the Serpent code [27] and consists of the graphite pebble with embedded TRISO particles, randomly distributed within the radius of 2.5 cm. The TRISO particles’ dimensions are given in Table 3. The pebble is placed inside a helium cube, whose sides define the boundaries on which the periodic boundary conditions are applied. The multi-physics interface [28] functionality was used, which enables loading the temperature profile directly from the OpenFOAM files. Namely, the unstructured mesh-based interface (type 7) was used for the shell region, and the unstructured mesh-based interface with multiple materials (type 8) was used for the fuel region. Such an approach enables high-precision mapping of spatial phenomena occurring in graphite. However, a limitation is the inability to accurately map the temperature of individual layers of TRISO particles, which may be the subject of further research. In total, 10,000 neutron histories were used in 50 inactive and 200 active cycles. The JEFF-3.1 data library was used with the Target Motion Sampling (TMS) temperature treatment utility of the Serpent code. The porosity of graphite was not considered in this research.

2.3. Power Discretization

The thermal–hydraulic coupling is based on the idea of data exchange between thermal and neutronic models. Therefore, a data exchange interface is required. The approach developed in this work takes advantage of the capabilities provided by the aforementioned Serpent multi-physics interface. Not only is the temperature distribution imported into Serpent [29], but the power distribution is also provided as an output of the Serpent simulation. The essential aspect of this work is the fact that fission occurs only in kernels of TRISO particles, and it was considered by assigning only specific cells in the OpenFOAM model as the heat source. To achieve this, each mesh cell in the fuel region has been assigned a material, depending on its distance to the nearest TRISO particle. For each mesh cell center, distances to all TRISO particle centers were calculated, and the minimum distance was compared to the particle radius. A cell was assigned as a heat source only if the aforementioned distance was not greater than the kernel radius. This approach ensures that heat generation is assigned only to those mesh cells whose centers lie within the physical volume of a fuel kernel, where nuclear fission occurs. The kernel radius (and not the full TRISO radius) is used because fission is confined solely to the kernel. This method provides a discrete and physically justified mapping of the heat source from the neutronic model to the thermal mesh, avoiding the spatial homogenization of power density. Thus, cells whose centers are closest to the centers of TRISO particles have been assigned kernel material, and are referred further as power cells. Only in those cells was the power in the OpenFOAM simulations generated. Moreover, due to the stochastic nature of the Monte-Carlo method applied in the Serpent, power cells were further grouped according to their radial positions into bins. Each bin is characterized by a different value of power density, i.e., the power of each bin is evenly distributed between all power cells in the bin. Moreover, a special “bin 0” is created for all mesh cells that are not assigned as power cells. Bin 0 contains all cells of the mesh that are not occupied by the other bins, completing the entire space. The concept of bins is visualized in Figure 3 with the example of 2 bins in the kernel-mesh.
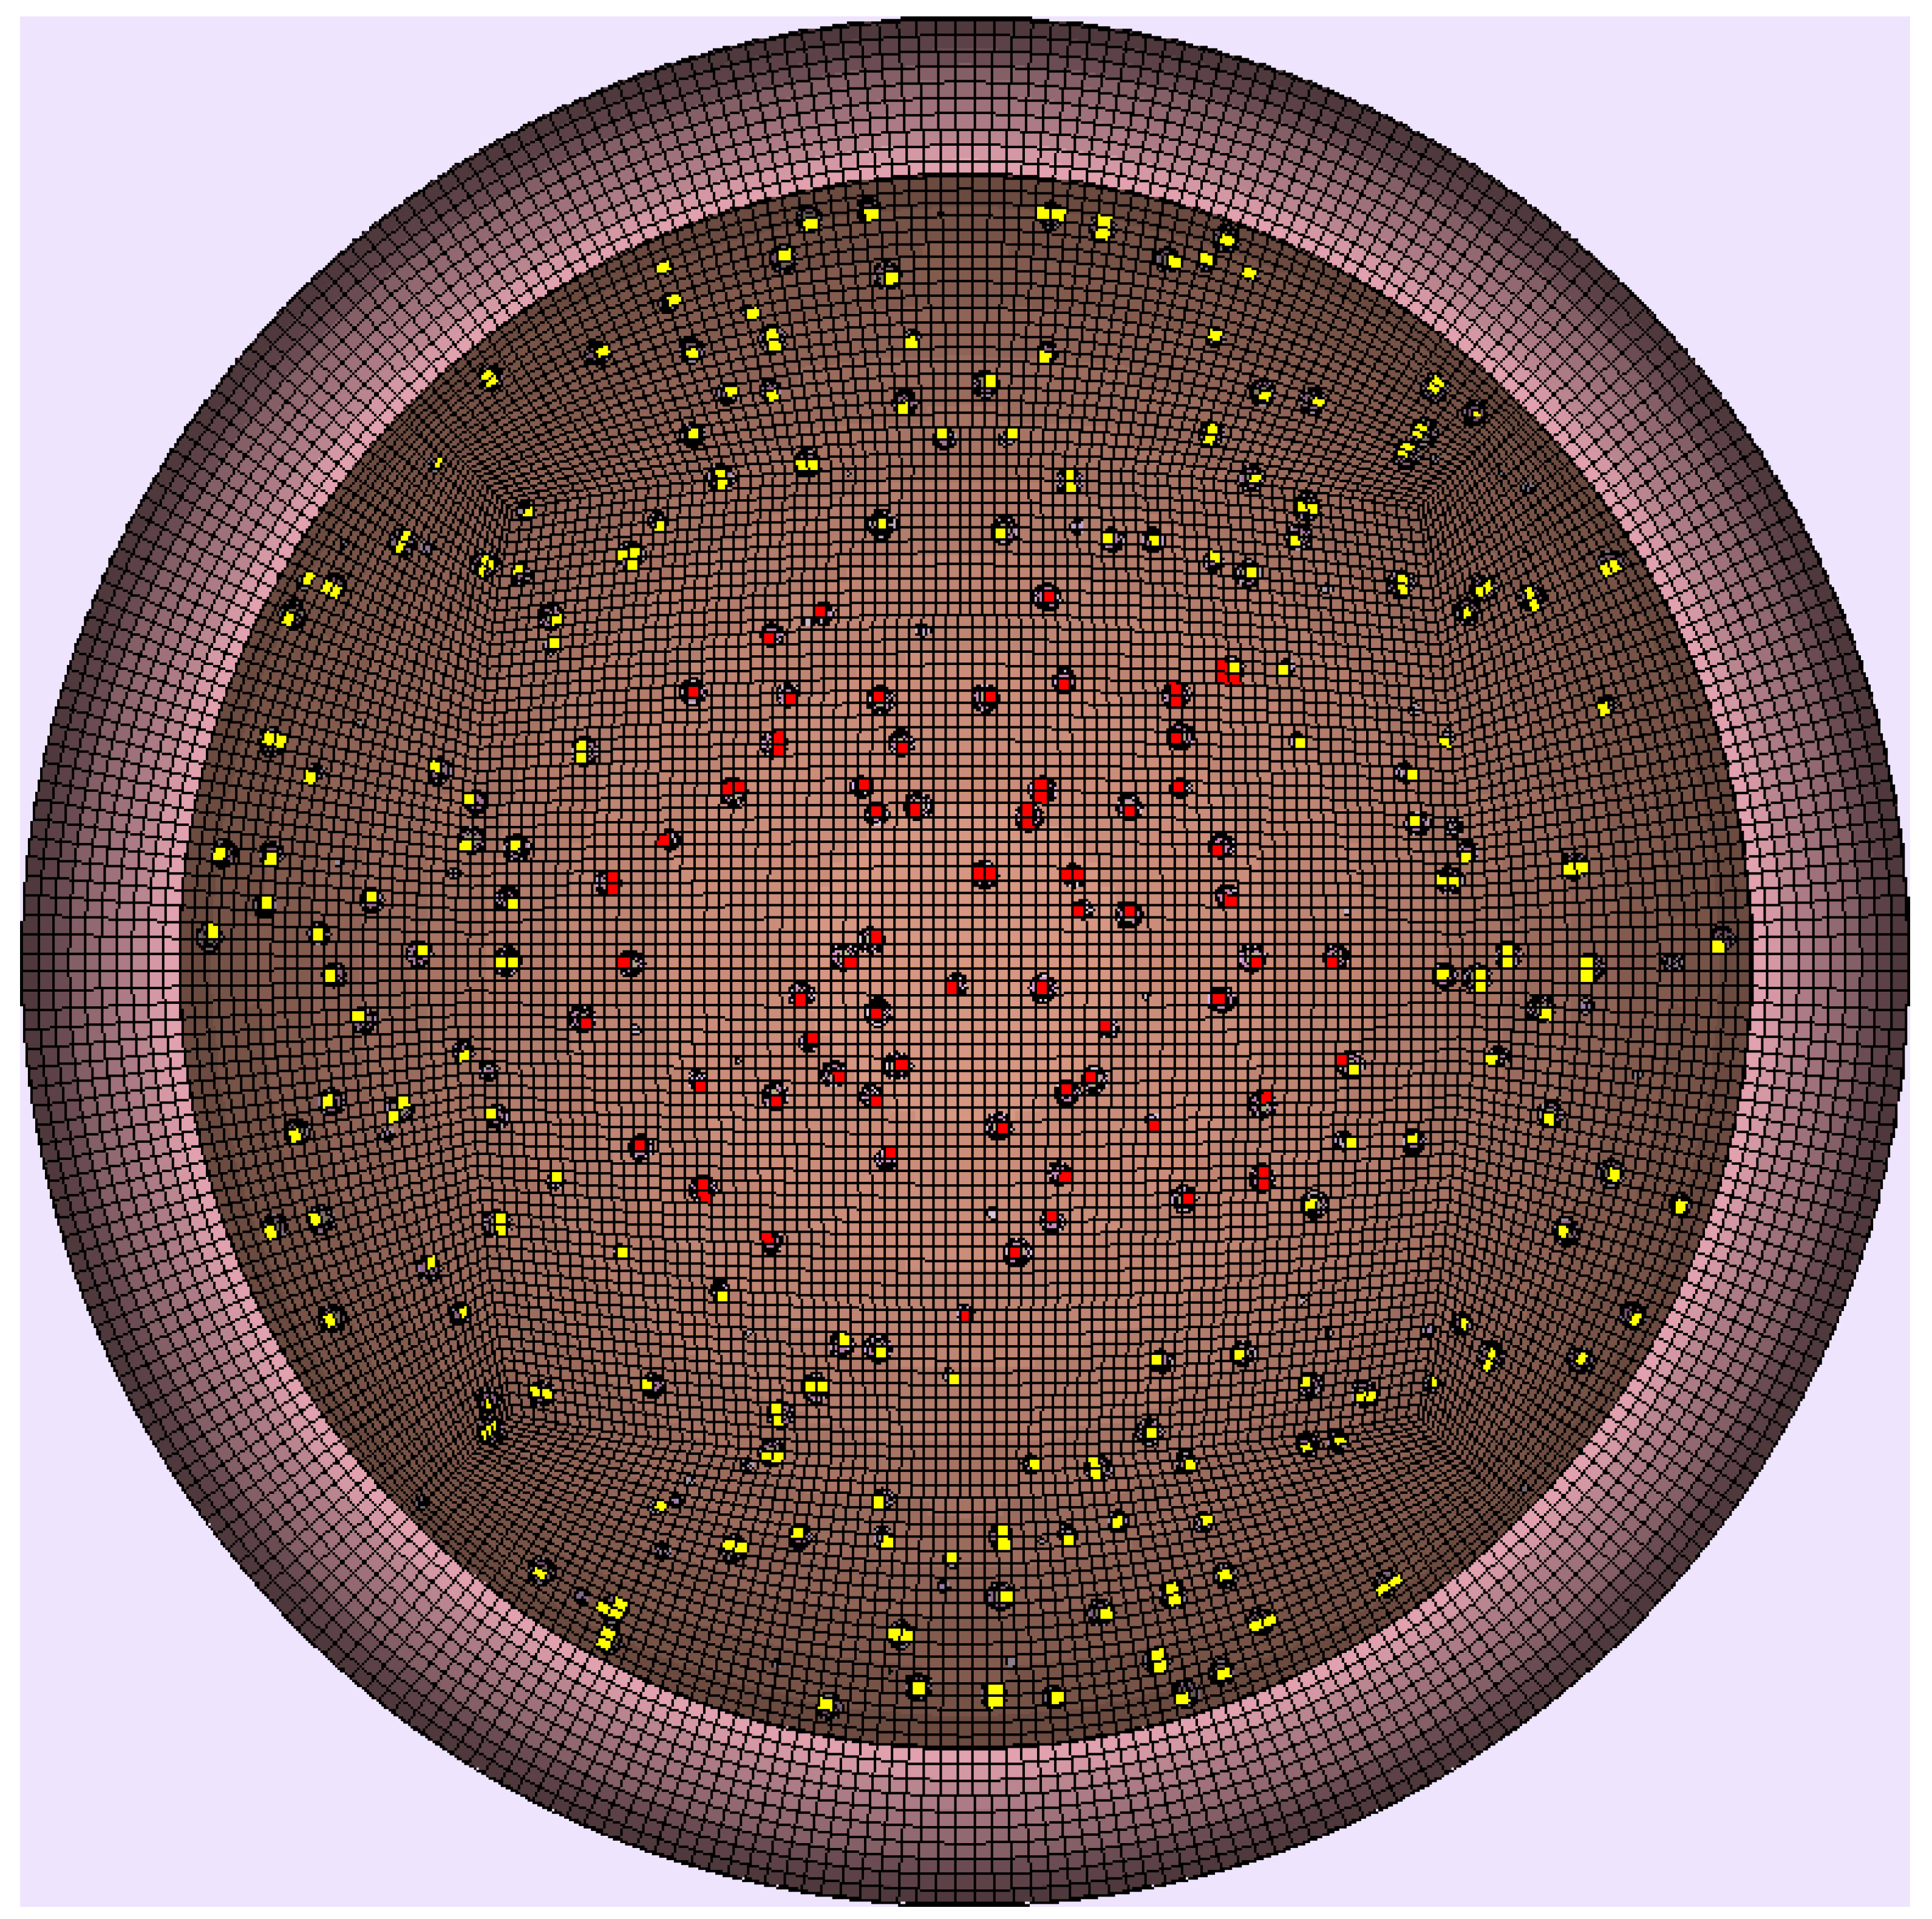
The importance of accurately assigning power cells to the locations of TRISO particles arises from temperature-reactivity feedback phenomena occurring in the fuel and other structures, mostly the moderator. The main phenomenon in the fuel is the Doppler temperature effect, characterized by a temperature-dependent variation in the uranium cross-section for resonant neutron capture. Additionally, due to significant thermalization of neutron energy spectra in HTGRs, the energy of thermalized neutrons depends on the moderator temperature, representing another important effect. However, the proper assignment of power cells is a difficult task since the TRISO particles have a spherical geometry, while the mesh cells are hexahedral; therefore, the accuracy of the power cell assignment is limited. In order to enhance the accuracy of the assignment, two more cases were made. For both the kernel-mesh and TRISO-mesh cases, the initial random TRISO distribution was adjusted by relocating each TRISO particle to the center of the nearest mesh cell, thus creating the kernel-fixed and TRISO-fixed cases, respectively. In both cases, a constraint was imposed such that the maximum distance from the pebble center could not exceed the fuel region radius minus the TRISO radius. The latter is presented in Figure 4. Cases with the initial random TRISO particles distribution are referred further as kernel-random and TRISO-random.
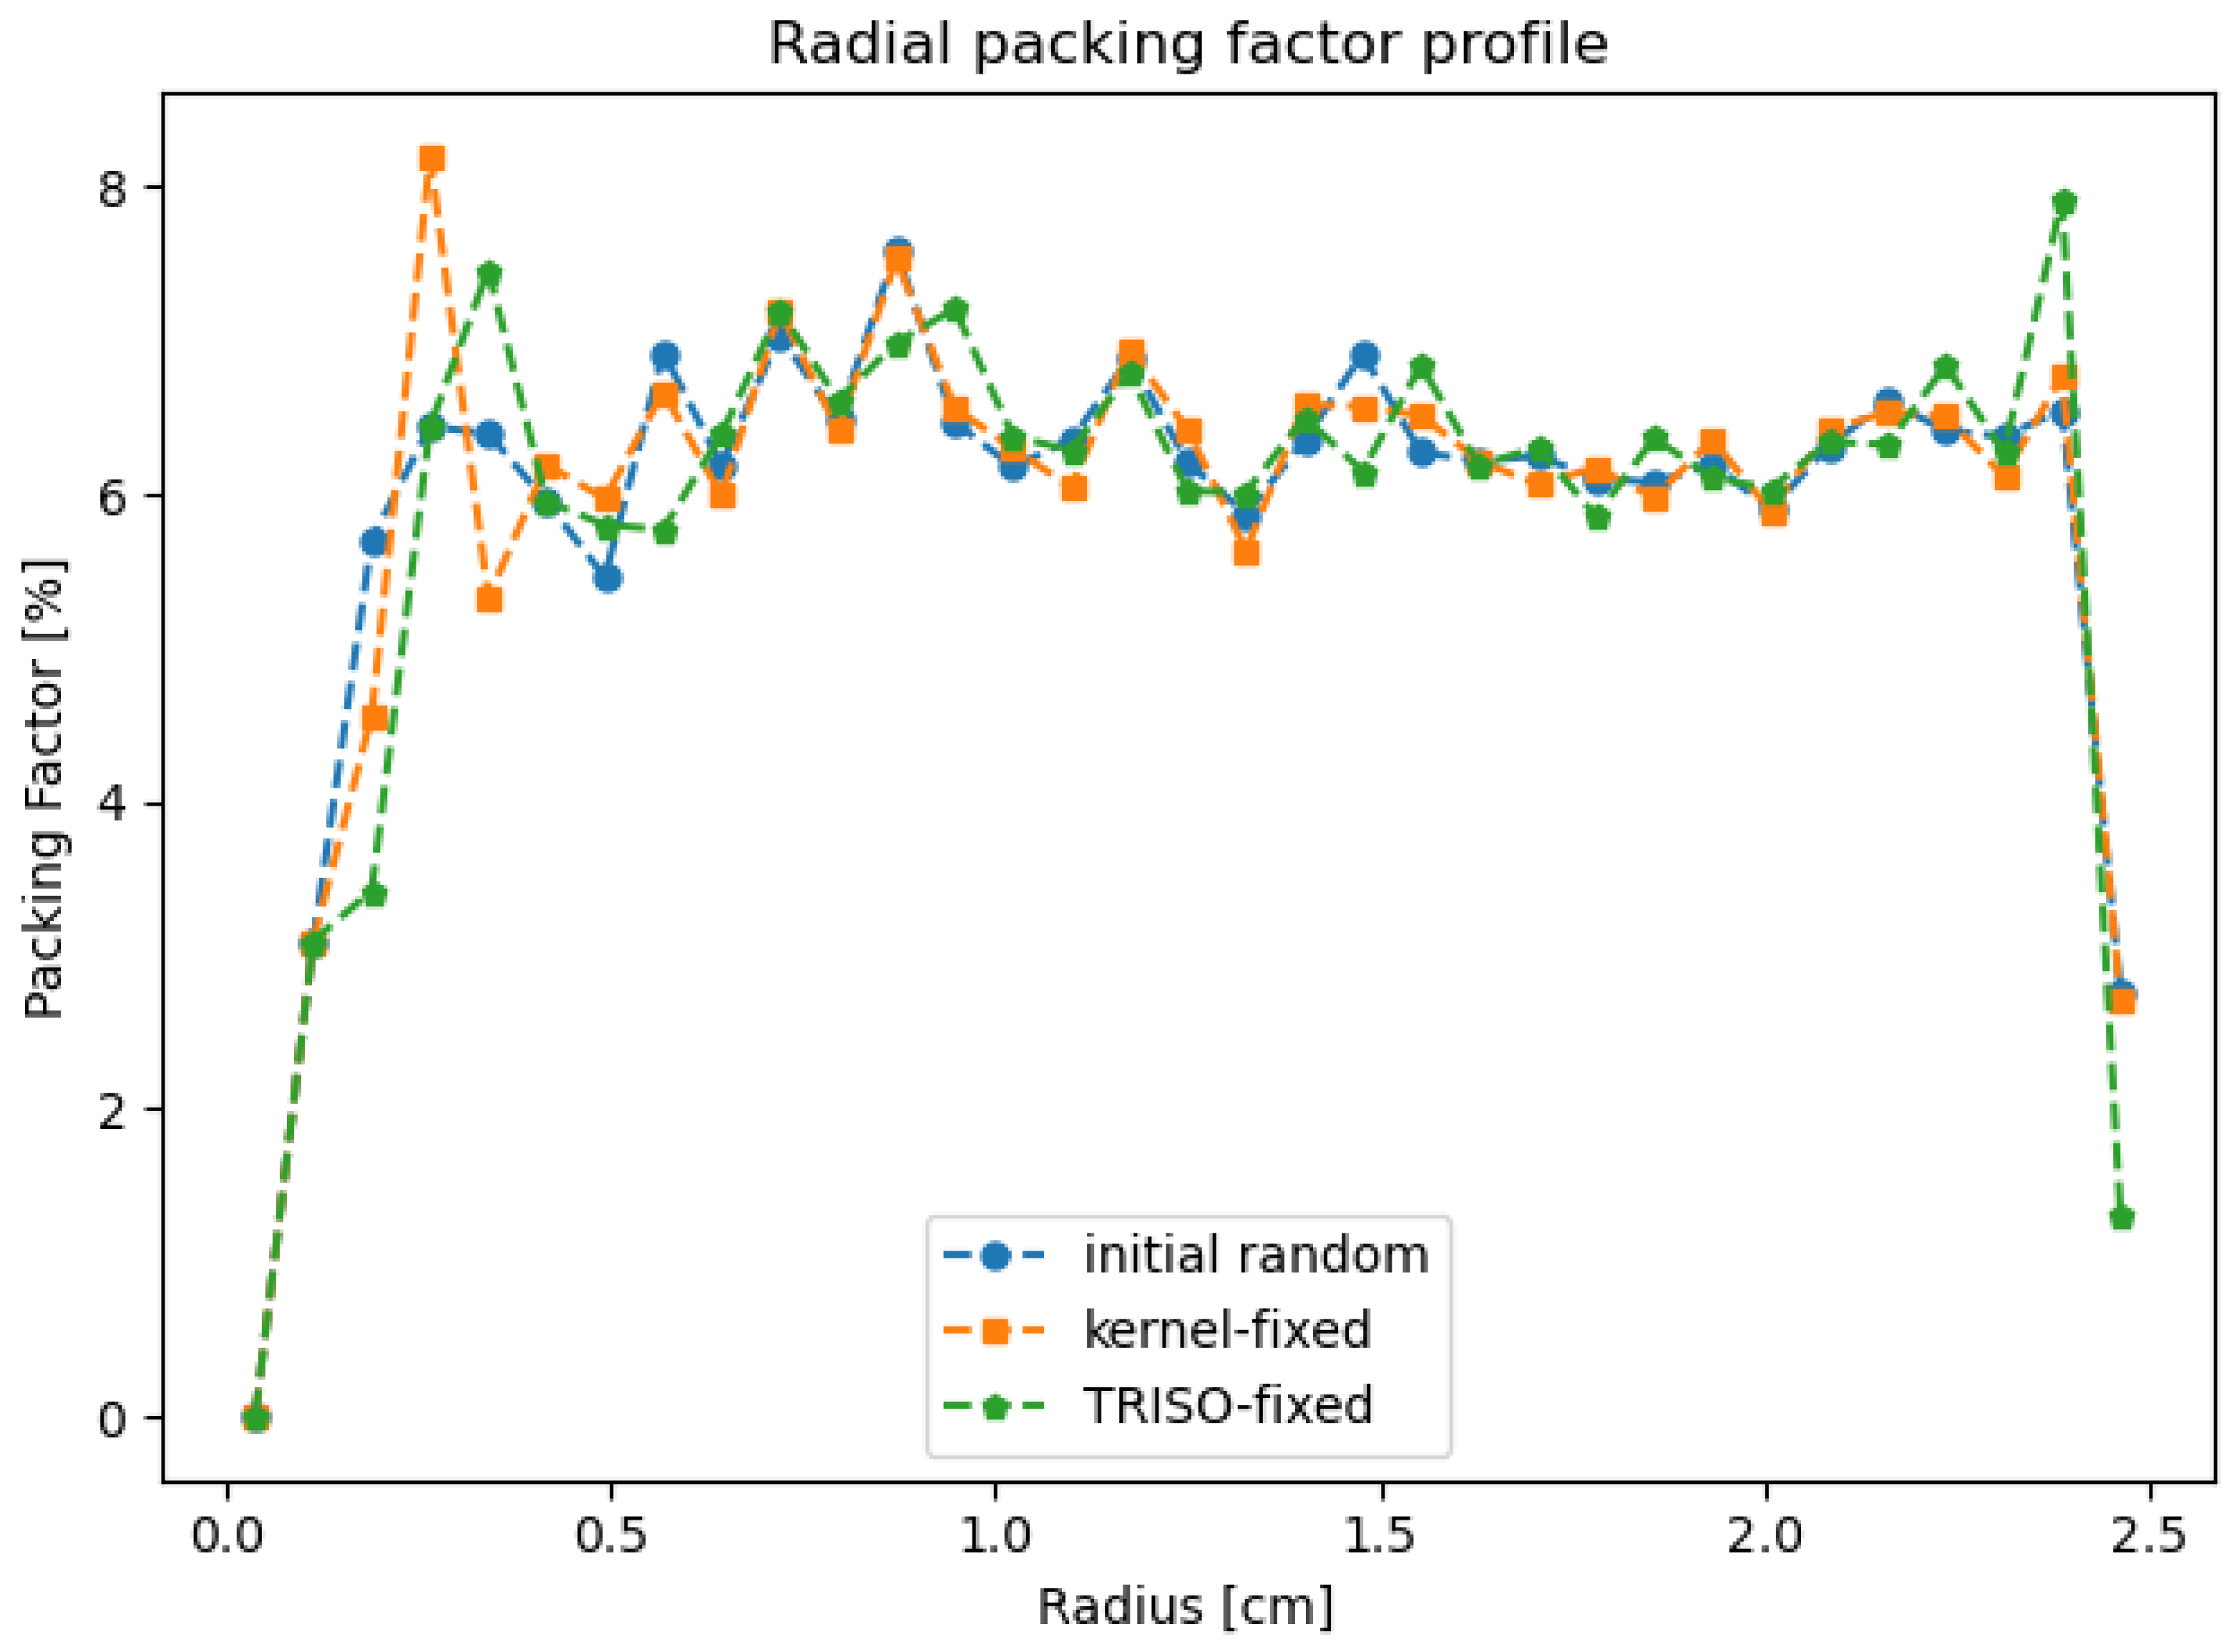
Changing the position of TRISO particles affected their spatial distribution. However, the impact is negligible, as shown in the Figure 5. The average values of packing factor distribution for the initial random, kernel-fixed, and TRISO-fixed configurations are 5.954, 5.952, and 5.913, respectively. The corresponding standard deviations are 1.39, 1.47, and 1.62. The highest deviations can be observed in the central and the outermost locations of the fuel region. The first factor is due to the cubic structure of the mesh, which limits the possible positions of TRISO particles, and this effect becomes even more significant as the distance from the pebble center decreases. At the outermost locations, however, a restriction that TRISO must not cross the fuel region boundary limits possible locations near the boundary, thus favoring the distribution in the penultimate layer of the mesh. The number of TRISO particles at a given distance from the center increases with distance. As a result, the packing factor shows the greatest sensitivity in the inner region of the pebble, where the number of particles is smaller. Nevertheless, the variations in distribution do not lead to significant differences in the overall power profile, and their impact on simulation results is negligible for practical purposes.

2.4. Coupled Calculation System

After the OpenFOAM mesh is generated, the power cells need to be assigned only once, based solely on the relative positions of TRISO particles with respect to the mesh cells. The power bins are power cells grouped according to their distance from the pebble center and, as such, are part of the Serpent model. However, they are also indirectly applied as locations of power sources in the OpenFOAM model. The power bins can be reassigned without the necessity of reassignment of power cells nor having to generate the mesh again, and are not reassigned within a single simulation. The flow chart is presented in Figure 6. Uniform power and temperature distributions were applied as initial conditions for the first iteration of thermal calculations. For cases where only the number of bins varied, prior results were employed as initial conditions. The obtained temperature profile is then updated to the Serpent multi-physics interface. Following neutronic calculations in Serpent, a bin-wise power distribution is produced. An important note is the fact that due to the inevitable inaccuracies of the power profile discretization, a fraction of power is tallied in the “bin 0”, in which no fission is supposed to occur. Thus, during the transfer of the power profile to the OpenFOAM, the power in “bin 0” is set to 0 W, and in other bins, the power has been increased to the initial total power value while maintaining the proportion. Then, new thermal calculations with updated power distribution are performed, and the new temperature profile is compared to the one from previous calculations to check convergence. If the difference between the two temperature profiles do not exceed 0.01 K, then the procedure of coupled calculation is finished. Otherwise, the next iteration starts with updating the new temperature profile to the Serpent multi-physics interface, and new neutronic simulations are performed.

3. Results and Discussion

3.1. Thermal Model with Uniform Power Distribution

The model developed in the OpenFOAM in this work was further verified against results from similar calculations in the reference work [16], for cases without the thermal-neutronic coupling. In the reference case, thermal properties were homogenized in the entire model, without division between the fuel and the shell regions. Calculations in the OpenFOAM were performed with uniform power distribution in the fuel region, for kernel-mesh and TRISO-mesh, with and without homogenizing the fuel and the shell regions according to Equation (4). The results are summarized in Table 4.
A very good agreement was achieved for both the kernel-mesh and TRISO-mesh cases with homogenization, particularly for lower power values. Furthermore, the results show no substantial difference between the two meshes. The homogenization of the fuel and the shell regions results in lower temperatures. Although the resulting differences remain within acceptable limits for most applications, the authors focus on finding the best estimate of the maximum fuel temperature. The higher thermal conductivity of graphite compared to TRISO particle components can justify this difference. The separation of the fuel and shell region makes the effective thermal conductivity in the former lower, resulting in greater heat accumulation. Thus, the division between regions is maintained in further work.

3.2. Coupled Calculations with Power Discretization

First coupled calculations were performed with only one bin (the same power density in all power cells) for four cases mentioned in Section 2.3. Results are presented in Table 5, where volume fraction refers to the ratio of power cells volume to the fuel region, and power fraction is the ratio of the power generation assigned in the power cells to the total power.
The actual volume fraction of UO2 kernels in the fuel region is exactly 1%; thus, a high level of power cell assignment precision was achieved in TRISO-random, kernel-random, and kernel-fixed cases. However, these cases are also characterized by low accuracy of power cell assignment, that is, the space occupied by power cells in thermal calculations does not coincide very well with the space occupied by fissionable material in neutronic calculations. This mismatch arises in particular for random TRISO distributions, where the stochastic placement of particles often causes a noticeable amount of the fissile material to fall outside the predefined power cells. As a result, the fraction of power captured within the power cells may drop below 50%, leading to an underrepresentation of local heat sources. The opposite effect is expected due to power normalization. In the TRISO-random case, which is characterized by low accuracy, the number of power cells is small. Assuming constant power, this would lead to an accumulation of power density. However, in terms of maximum temperature, this appears to be balanced out in the TRISO-fixed case. This case has a greater number of power cells, resulting in a larger power cell volume fraction. The estimated heat flux densities in the TRISO-random and TRISO-fixed cases are 237 k W m 2 K and 281 k W m 2 K , while in kernel-random and kernel-fixed they are 344 k W m 2 K and 377 k W m 2 K . It can be concluded that higher fluxes in kernel cases result from the smaller size of power cells compared to TRISO cases, while higher fluxes in fixed cases compared to random cases are the result of better accuracy of power cell assignment. The number of power cells in the TRISO-fixed corresponds quite well to the actual number of TRISO particles in the model, and the power fraction corresponds to the TRISO packing factor in the fuel zone, which again confirms the accuracy of power cells assignment. Although within the scope of this study the relocation of TRISO particles did not result in a significant change in maximum temperatures, the values obtained were still slightly higher. The accuracy of power-cell assignment therefore remains a potential subject for further research, particularly with respect to the proper representation of TRISO layer temperatures.
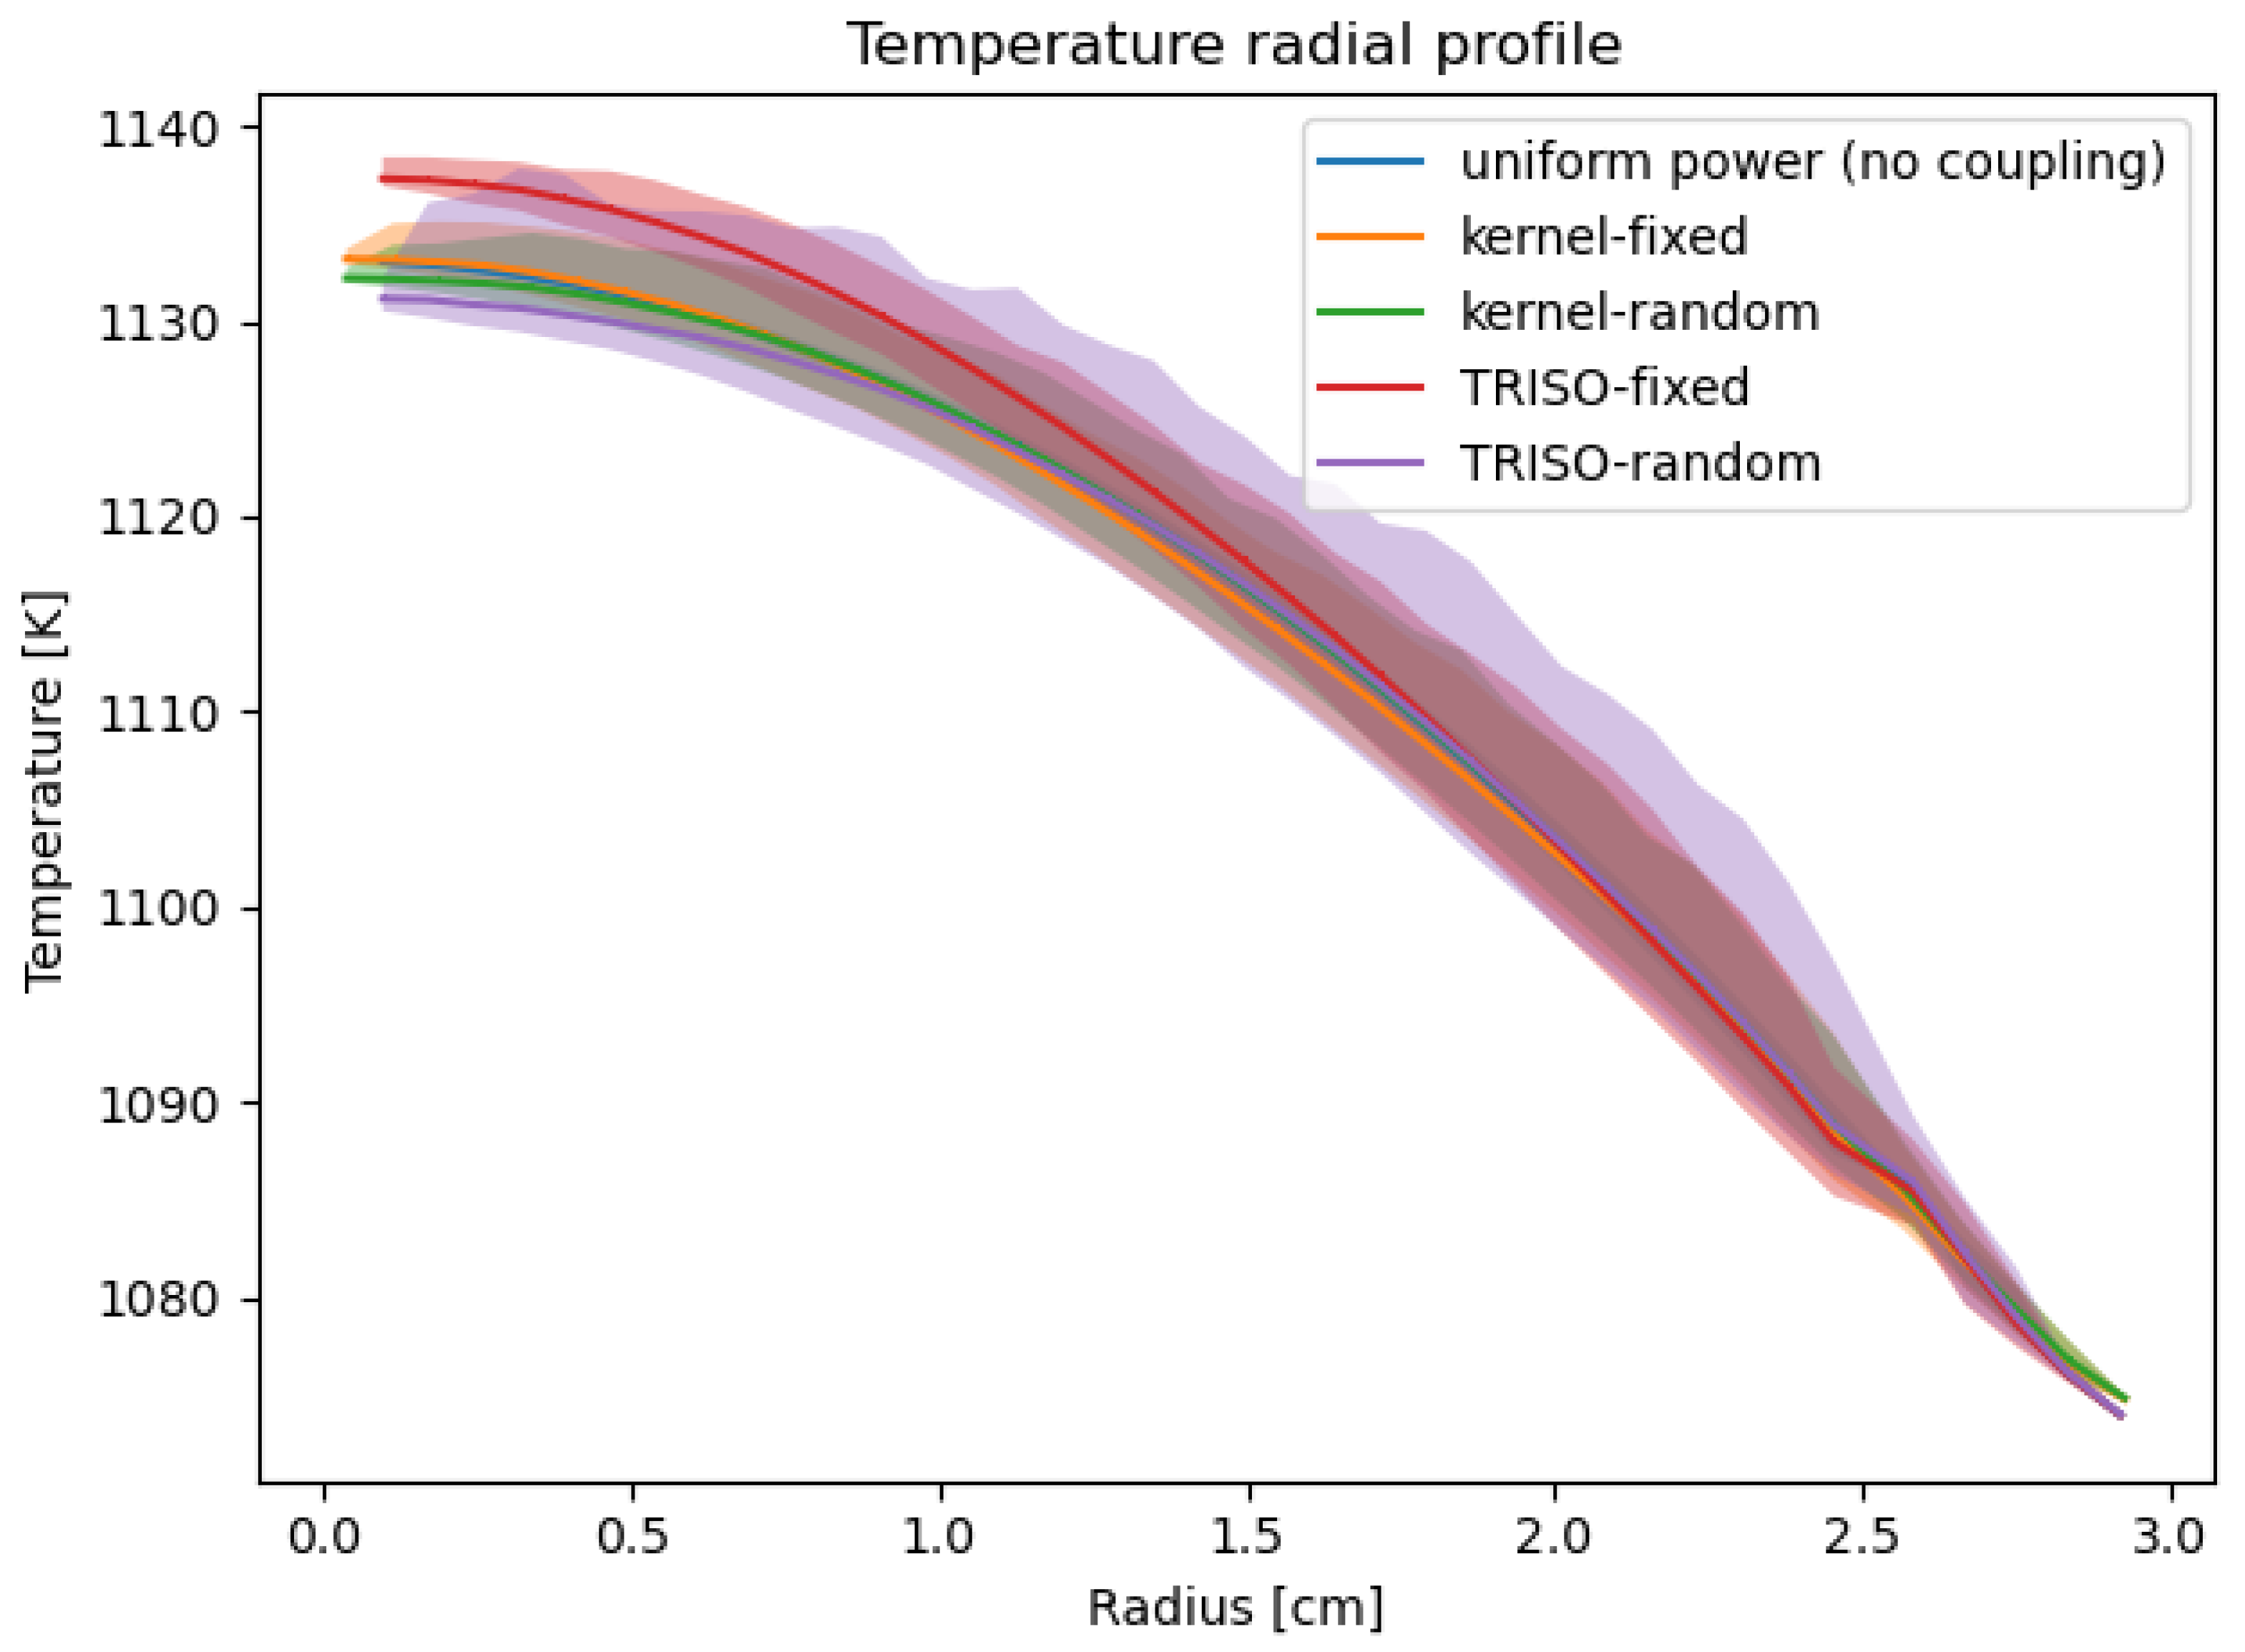
To maintain a possibly conservative approach, the TRISO-fixed case was selected for further calculations. Figure 7 presents temperature profiles obtained from calculations. Even though the maximum temperature for TRISO-random is only slightly lower than for TRISO-fixed, local deviations from the average temperature caused by the smaller number of power cells are noticeable.
It should be noted that with an increasing number of power bins, the volume occupied by each bin decreases, leading to higher uncertainties in power estimation. This effect is particularly significant for the innermost bin, as it contains the smallest volume of fissile material. However, in the case of eight power bins, the uncertainty in the innermost bin did not exceed 1.7%, and for each subsequent bin, the uncertainty gradually decreased, reaching 0.9% in the 8th bin. By contrast, in the case of one power bin, the uncertainty is only 0.12%. Therefore, the average uncertainty per bin can be roughly assessed as 0.9%. This level of uncertainty was considered satisfactory, and thus, the issue was not addressed further in this work.
The impact of the number of bins on the temperature profile was further investigated, and results are presented in Table 6. The iteration histories for the one-bin and six-bin cases are shown in Table 7. It should be noted that the termination criterion was that convergence of the entire temperature distribution, and thus the maximum temperature, could be the same in subsequent iterations. Increasing the number of bins from one to two decreased the maximum temperature by approximately 2 K, and further increasing the number of bins does not change the temperature significantly. In order to assess the influence of power uncertainty on the maximum temperature, thermal analyses were performed in OpenFOAM for one-bin and six-bin cases. The analyses used results coupled with power variations of +/−0.1%, 0.5%, 1%, and 2%. Results are summarized in Table 8. As one can see, the relative deviation of the maximum temperature is roughly less than 10% of the deviation of the power.
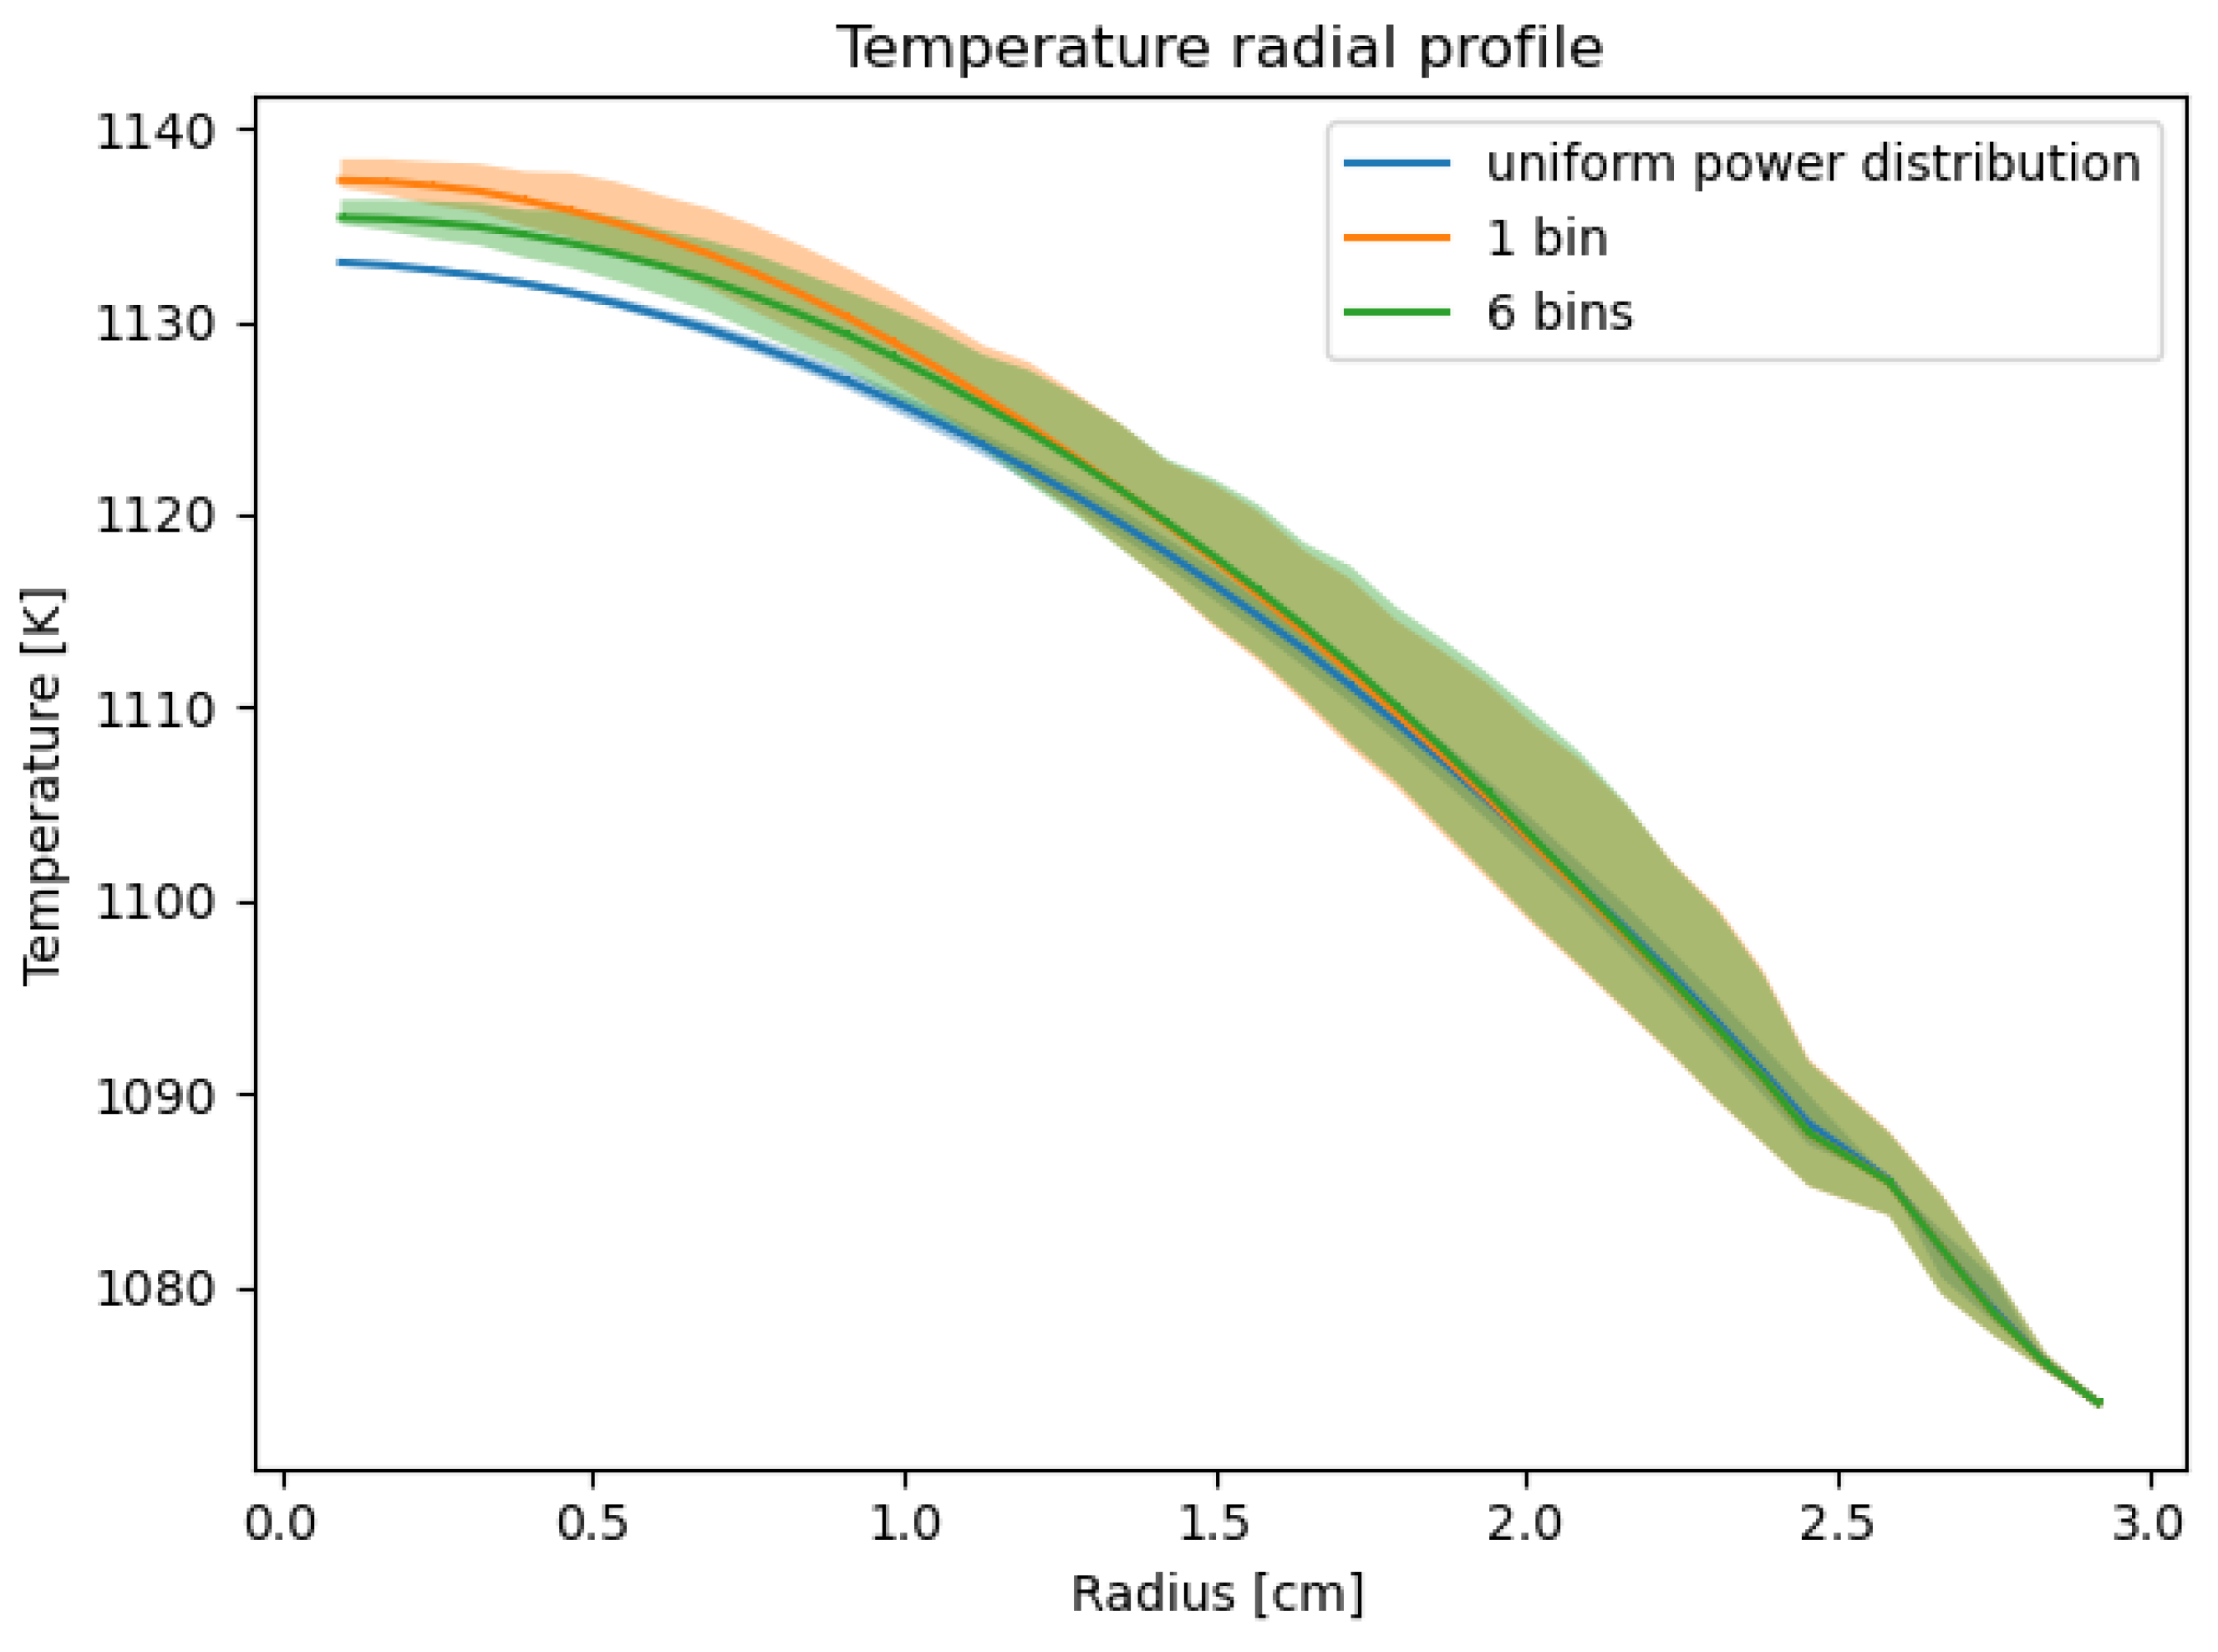
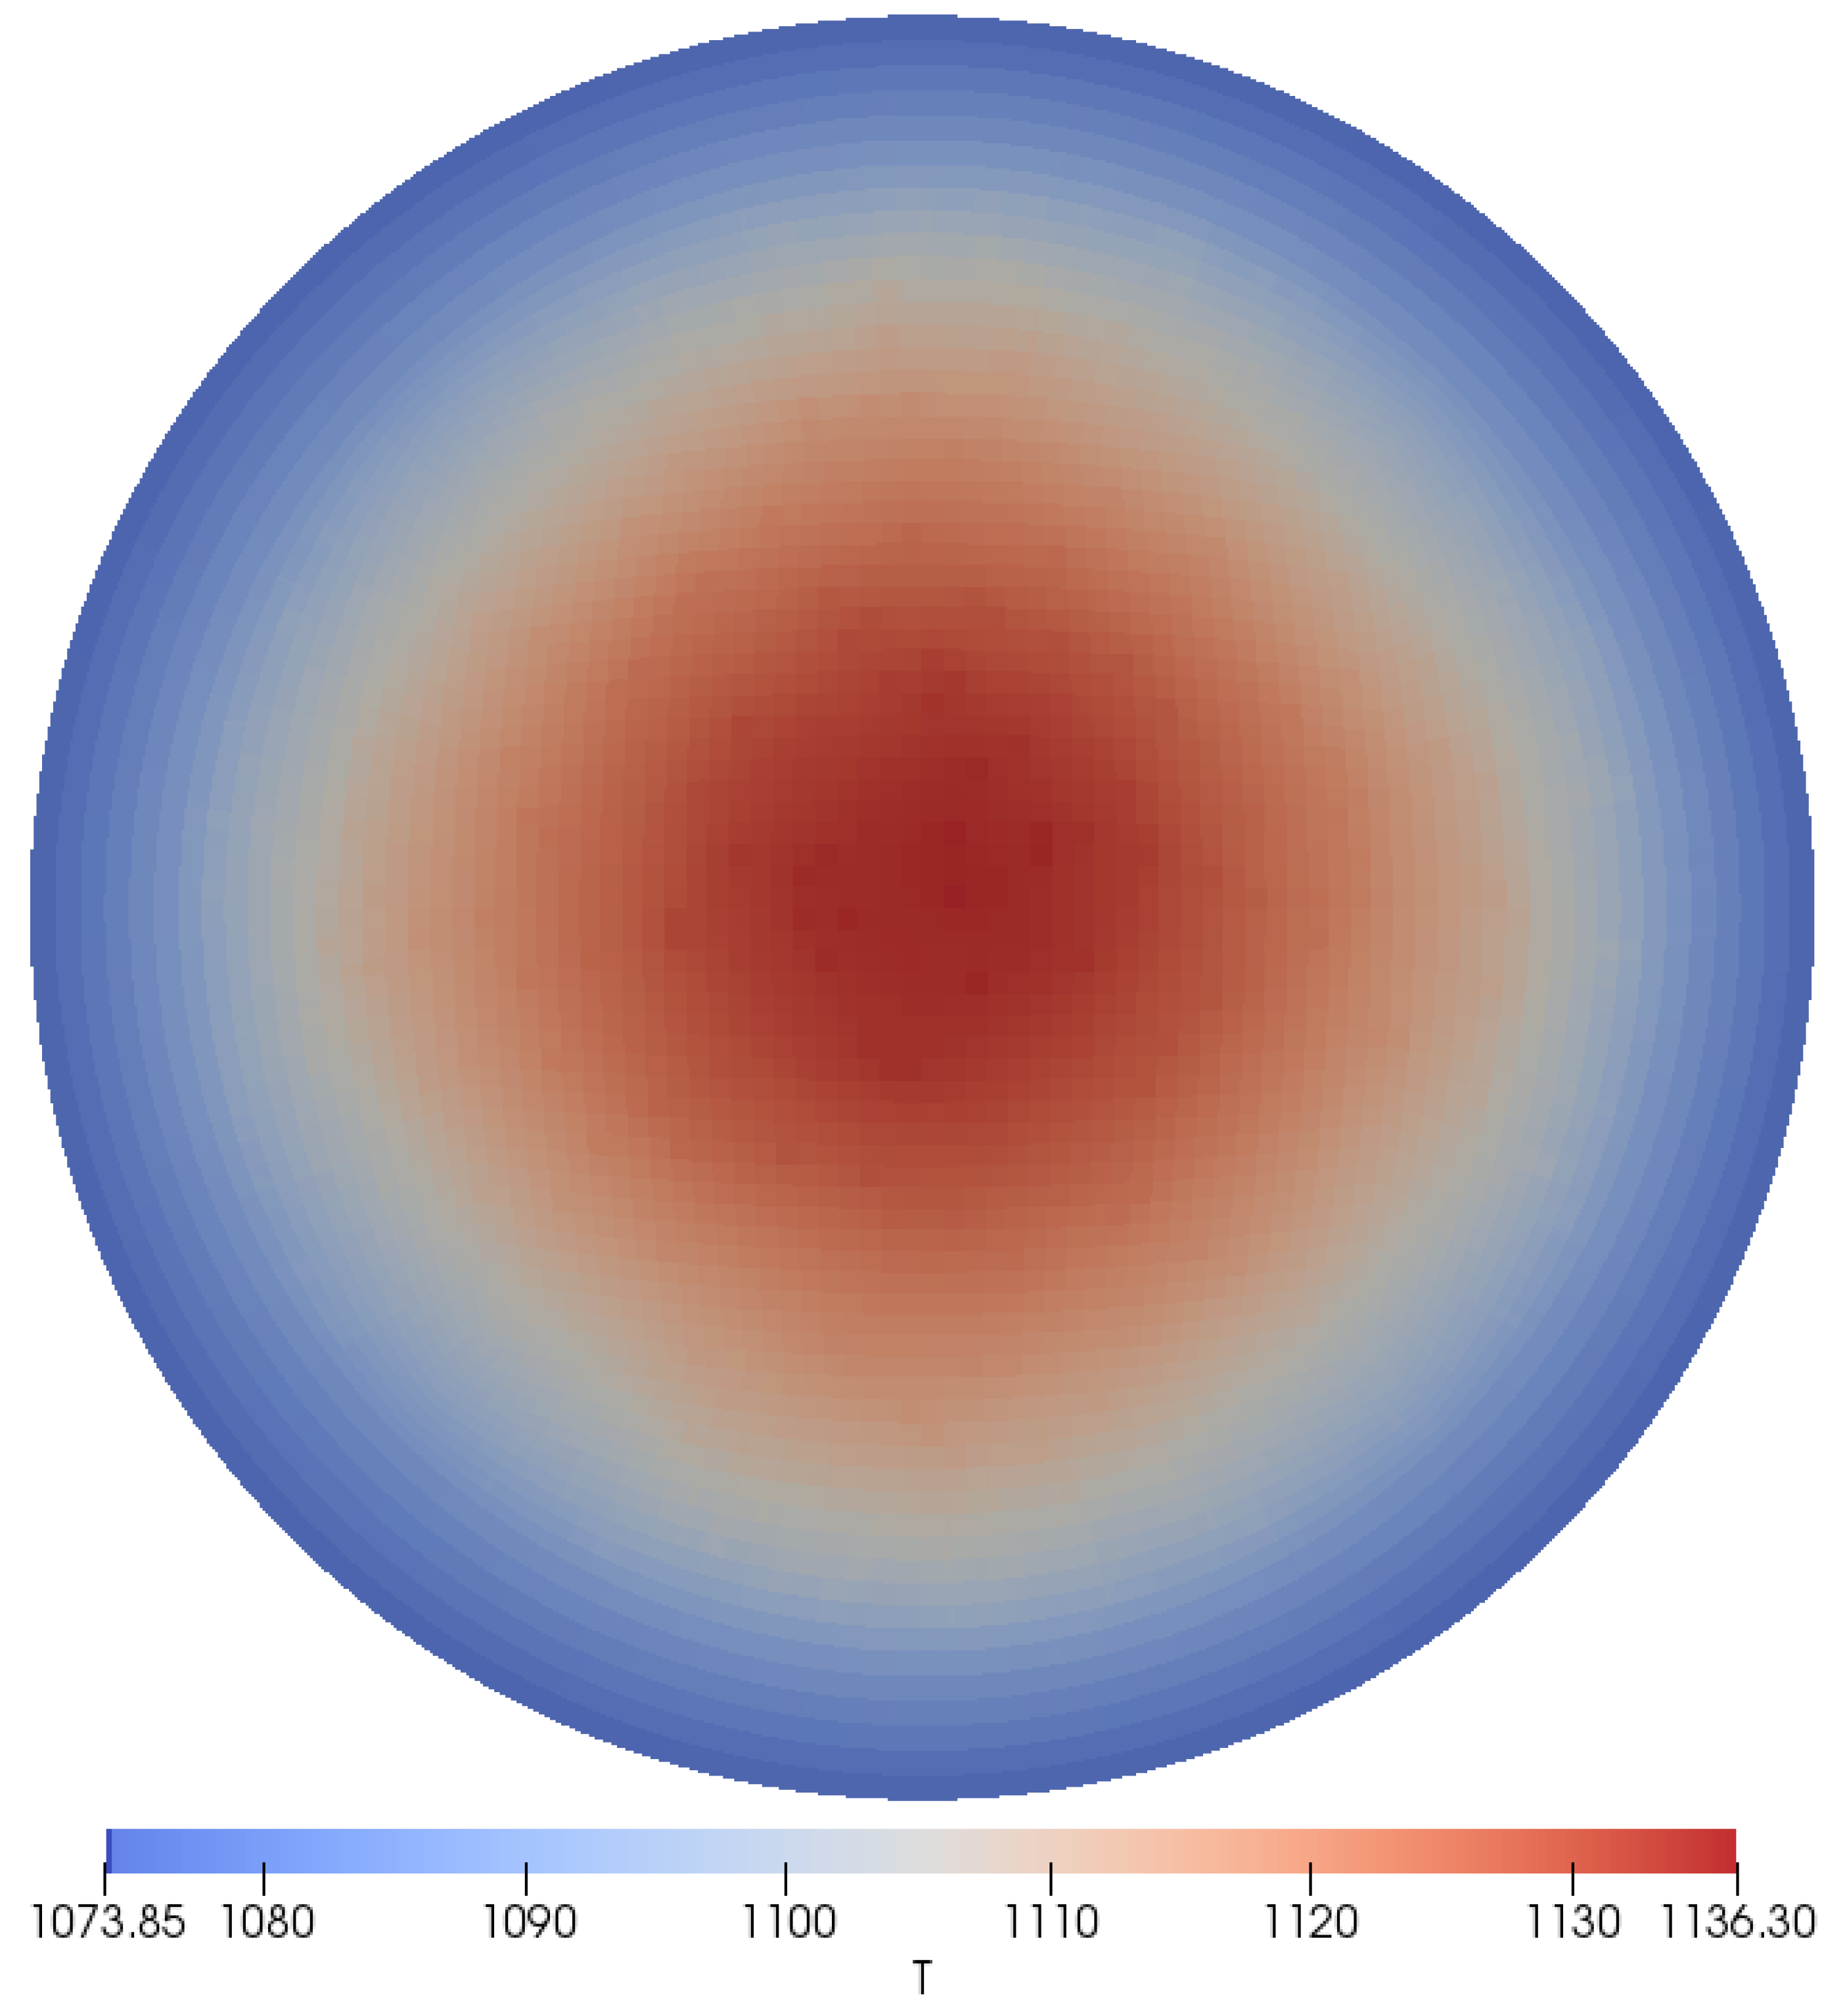
Temperature profiles for selected cases are presented in Figure 8. Figure 9 shows normalized power profiles, which were also divided by the number of mesh cells in radius intervals. The latter division was performed for better clarity since all profiles are in fact very similar to the power factor profile presented in Figure 5, and otherwise are almost indistinguishable. Although the powers differ in the range of approximately 1%, one can observe that the maximum power occurs between a radius of 1.5 cm and 2 cm. The decrease of power in the outermost in and innermost locations is caused by considerably lower packing factor at those places. However, this fact was not taken into account for a single bin, resulting in an increase in power in the hottest location, which is the center of the pebble. With the addition of more bins, on the other hand, an outward shift in power is increasingly evident, which is due to the aforementioned feedback between power and temperature—the increase in power occurs in the location of the lower temperature, which promotes a flattening of the distribution of the latter, which also means a lowering of the maximum temperature. The observed outward power shift is a direct consequence of the neutronic feedback phenomena, primarily the Doppler effect in the fuel and the thermalization effect in the moderator. In the hotter central region of the pebble, the increased thermal motion of uranium nuclei in the TRISO kernels causes a broadening of resonance peaks in the neutron capture cross-section (Doppler broadening). This enhances neutron absorption in U-238, reducing the neutron flux available to cause fission in U-235. Consequently, the fission rate and power generation are suppressed in the high-temperature center. On the other hand, neutrons are moderated more efficiently in cooler regions. Therefore, in the cooler outer shell of the pebble, neutrons reach the thermal energy range more effectively. This leads to a higher probability of fission events occurring in these regions compared to the hotter center. This creates a negative feedback loop: an initial higher temperature in the center leads to a relative reduction in local fission power. This power is then shifted outward to cooler regions, which promotes a flatter temperature distribution and ultimately lowers the peak central temperature. The discretization of power into radial bins allows this self-shielding effect and the resulting power shift to be explicitly captured, which would be averaged out in a homogenized model. Figure 10 presents a spacial temperature distribution cross-section, in which the effect of power discretization can be seen as local temperature peaks.

4. Summary and Conclusions

In this study, a methodology for integrated thermal and neutronic calculations with discrete power generation, using the OpenFOAM and Serpent codes, was developed, tested, and applied to the analysis of spatial self-shielding in a VHTR fuel pebble. At this stage, for better identification of the phenomena resulting from the irregular TRISO distribution, steady-state calculations were performed without consideration of the helium flow around the pebble. In addition, the effect of homogenizing the inner part of the pebble with dispersed TRISO particles and the surrounding pure graphite shell was investigated. In such a case, lower temperatures were obtained than in the case of separation of these parts, but within acceptable limits. However, the issue of estimating the temperature distribution inside TRISO particles was not considered in this paper. The authors intend to expand the current methodology to cover this aspect by using the capabilities of the Serpent multi-physics interface. Another issue that is planned to be covered in future work includes other sources of possible irregularity of power profile, such as the influence of the external helium flow or possible migration of TRISO particles. Power discretization was carried out by tasking power generation in single mesh cells of the thermal model, corresponding in position to TRISO particles from the neutron model. Two different meshes corresponding in maximum cell size to the UO2 kernel and the TRISO particle were tested, as well as the effect of matching TRISO positions to grid cell centers. Both investigated meshes gave similar results, proving that the coarser one is sufficient for further work, but did not contribute significantly to the accuracy of power discretization. Nevertheless, matching TRISO positions to the mesh cells centers vastly improved the aforementioned accuracy up to almost 99%, thus enabling better representation of phenomena occurring in the fuel and moderator. Finally, the impact of the details of the distribution of power density values in the radial direction was analyzed. It was found that separating the two power density values allows one to observe an outward shift of power, which results in a flattening of the temperature distribution. Further division of the power shows this effect more and more clearly; nevertheless, the differences are up to about 1%, which does not translate into significant changes in the temperature distribution. Despite that, in the end, the use of integrated calculations with power discretization yielded maximum temperatures about 5 K higher than with thermal calculations alone, assuming a uniform power distribution. The temperature increase is only 0.45%; therefore, it can be considered statistically not significant within the limits of the presented work.

Author Contributions

Conceptualization, M.G. and J.S.; methodology, M.G.; software, M.G.; validation, M.G.; formal analysis, M.G. and J.S.; investigation, M.G.; resources, M.G.; data curation, M.G.; writing—original draft preparation, M.G.; writing—review and editing, M.G. and J.S.; visualization, M.G.; supervision, J.S.; project administration, M.G. and J.S. All authors have read and agreed to the published version of the manuscript.

Funding

This research received no external funding.

Data Availability Statement

Dataset available on request from the authors.

Acknowledgments

The work was carried out using resources provided by the Świerk Computer Center at the National Centre for Nuclear Research.

Conflicts of Interest

The authors declare no conflicts of interest.

Nomenclature

Greek symbols
ρ density [ k g m 3 ]
λ thermal conductivity [ W m K ]
ϵ volume fraction
χ homogeneous parameters
Latin symbols
qpower density [ W m 3 ]
Qpower [W]
rradius [cm]
C p specific heat, [ J k g · K ]
Ttemperature [K]
p f packing factor
k i n f infinite neutron multiplication factor
Subscripts
ii-th element
fuelfuel region
shellshell region
UO2UO2 fuel kernel
bufferporous carbon buffer
IPyCinner pyrolytic carbon
SiCsilicon carbide
OPyCouter pyrolytic carbon
Cgraphite matrix

References

  1. NEA. High-Temperature Gas-Cooled Reactors and Industrial Heat Applications; OECD Publishing: Paris, France, 2022. [Google Scholar] [CrossRef]
  2. Jia, G.; Zhu, G.; Zou, Y.; Ma, Y.; Dai, Y.; Wu, J.; Tian, J. Economic Analysis of Nuclear Energy Cogeneration: A Comprehensive Review on Integrated Utilization. Energies 2025, 18, 2929. [Google Scholar] [CrossRef]
  3. Advances in High Temperature Gas Cooled Reactor Fuel Technology; Number 1674 in Entity; International Atomic Energy Agency: Vienna, Austria, 2013.
  4. Brown, F.B.; Martin, W.R. Stochastic geometry capability in MCNP5 for the analysis of particle fuel. Ann. Nucl. Energy 2004, 31, 2039–2047. [Google Scholar] [CrossRef]
  5. Rintala, V.; Suikkanen, H.; Leppänen, J.; Kyrki-Rajamäki, R. Modeling of realistic pebble bed reactor geometries using the Serpent Monte Carlo code. Ann. Nucl. Energy 2015, 77, 223–230. [Google Scholar] [CrossRef]
  6. Wang, J.; Lu, G.; Ding, M. Parametric study of effective thermal conductivity for VHTR fuel pebbles based on a neutronic and thermal coupling method. Ann. Nucl. Energy 2023, 181, 109530. [Google Scholar] [CrossRef]
  7. Barrachin, M.; Basini, V.; BU, Ü.C.; Dubourg, R.; Feltus., M.A.; Greneche., D.; Guillermier, P.; Hansen, U.; Hanson, D.; Hunn, J.; et al. High Temperature Gas Cooled Reactor Fuels and Materials; Chapter Manufacture of Spherical Fuels; International Atomic Energy Agency: Vienna, Austria, 2010; pp. 34–38. [Google Scholar]
  8. Mehta, K.S.; Goddard, B.; Wu, Z. Neutronics Analysis on High-Temperature Gas-Cooled Pebble Bed Reactors by Coupling Monte Carlo Method and Discrete Element Method. Energies 2024, 17, 5188. [Google Scholar] [CrossRef]
  9. Górkiewicz, M.; Cetnar, J. Flattening of the Power Distribution in the HTGR Core with Structured Control Rods. Energies 2021, 14. [Google Scholar] [CrossRef]
  10. Robert, Y.; Jantzen, L.; Siaraferas, T.; Fiorina, C.; Fratoni, M. Impact of thermal coupling on a pebble bed reactor equilibrium from hyper-fidelity depletion. Proc. Int. Conf. Nucl. Eng. 2023, 30, 1490. [Google Scholar] [CrossRef]
  11. Pavliotis, G.; Stuart, A. Multiscale Methods: Averaging and Homogenization; Springer: New York, NY, USA, 2008; Volume 53. [Google Scholar] [CrossRef]
  12. Clifford, I.D. A Hybrid Coarse and Fine Mesh Solution Method for Prismatic High Temperature Gas-Cooled Reactor Thermal-Fluid Analysis. Ph.D Thesis, The Pennsylvania State University, University Park, PA, USA, 2013. [Google Scholar]
  13. Novak, A.; Andrs, D.; Shriwise, P.; Fang, J.; Yuan, H.; Shaver, D.; Merzari, E.; Romano, P.; Martineau, R. Coupled Monte Carlo and thermal-fluid modeling of high temperature gas reactors using Cardinal. Ann. Nucl. Energy 2022, 177, 109310. [Google Scholar] [CrossRef]
  14. Novak, A.J.; Carlsen, R.W.; Schunert, S.; Balestra, P.; Reger, D.; Slaybaugh, R.N.; Martineau, R.C. Pronghorn: A Multidimensional Coarse-Mesh Application for Advanced Reactor Thermal Hydraulics. Nucl. Technol. 2021, 207, 1015–1046. [Google Scholar] [CrossRef]
  15. Novak, A. Multiscale Thermal-Hydraulic Methods for Pebble Bed Reactors. Ph.D Thesis, UC Berkeley, Berkeley, CA, USA, 2020. [Google Scholar]
  16. Wang, J.; Li, Z.; Ding, M. Study of the neutronic and thermal coupling effect on VHTR fuel pebble using OpenMC and OpenFOAM. Ann. Nucl. Energy 2023, 183, 109643. [Google Scholar] [CrossRef]
  17. Wang, J.; Wei, B.; Cai, W.; Guo, Z.; Ding, M. A new method of fuel pebble temperature calculation based on neutronic and thermal coupling equivalent model. Ann. Nucl. Energy 2024, 204, 110566. [Google Scholar] [CrossRef]
  18. Yu, D.; Wang, F.; Mei, H.; Cheng, X.; Duan, C. An improved two-temperature method for computing the temperature distributions within a TRISO-coated particle pebble fuel. Nucl. Eng. Technol. 2025, 57, 103515. [Google Scholar] [CrossRef]
  19. Strydom, G. Annual Report 2023; Generation IV International Forum: Paris, France, 2024; Chapter System Summaries; p. 35. [Google Scholar]
  20. OpenFOAM. User Guide Version 10; The OpenFOAM Foundation: London, UK, 2022. [Google Scholar]
  21. Tuominen, R.; Valtavirta, V.; Peltola, J.; Leppänen, J. Coupling Serpent and OpenFOAM for neutronics—CFD multi-physics calculations. In Proceedings of the PHYSOR 2016: Unifying Theory and Experiments in the 21st Century, Sun Valley, ID, USA, 1–5 May 2016; pp. 255–269. [Google Scholar]
  22. Górkiewicz, M. Development of Localized Coupled Neutronic and CFD Calculation for HTR Application. Ph.D Thesis, National Centre for Nuclear Research, Świerk, Poland, 2023. [Google Scholar]
  23. Wu, Z.; Lin, D.; Zhong, D. The design features of the HTR-10. Nucl. Eng. Des. 2002, 218, 25–32. [Google Scholar] [CrossRef]
  24. Zhang, Z.; Wu, Z.; Wang, D.; Xu, Y.; Sun, Y.; Li, F.; Dong, Y. Current status and technical description of Chinese 2 × 250 MW th HTR-PM demonstration plant. Nucl. Eng. Des.-Nucl Eng. Des. 2009, 239, 1212–1219. [Google Scholar] [CrossRef]
  25. Folsom, C.; Xing, C.; Jensen, C.; Ban, H.; Marshall, D.W. Experimental measurement and numerical modeling of the effective thermal conductivity of TRISO fuel compacts. J. Nucl. Mater. 2015, 458, 198–205. [Google Scholar] [CrossRef]
  26. Chiew, Y.C.; Glandt, E.D. Effective conductivity of dispersions: The effect of resistance at the particle surfaces. Chem. Eng. Sci. 1987, 42, 2677–2685. [Google Scholar] [CrossRef]
  27. Leppänen, J.; Pusa, M.; Viitanen, T.; Valtavirta, V.; Kaltiaisenaho, T. The Serpent Monte Carlo code: Status, development and applications in 2013. Ann. Nucl. Energy 2015, 82, 142–150. [Google Scholar] [CrossRef]
  28. Leppänen, J.; Valtavirta, V.; Viitanen, T.; Aufiero, M. Unstructured mesh based multi-physics interface for CFD code coupling in the Serpent 2 Monte Carlo code. In Proceedings of the International Conference on Physics of Reactors, PSYHOR 2014: The Role of Reactor Physics Toward Sustainable Future, Kyoto, Japan, 28 September–3 October 2014; Japan Atomic Energy Agency: Tokai-Mura, Japan, 2015; Volume JAEA-Conf 2014-003. [Google Scholar]
  29. Leppänen, J.; Aufiero, M. Development of an unstructured mesh based geometry model in the Serpent 2 Monte Carlo code. In Proceedings of the Proceedings of the International Conference on Physics of Reactors, PSYHOR 2014: The Role of Reactor Physics Toward Sustainable Future, Kyoto, Japan, 28 September–3 October 2014; Japan Atomic Energy Agency: Tokai-Mura, Japan, 2015; Volume JAEA-Conf 2014-003. [Google Scholar]
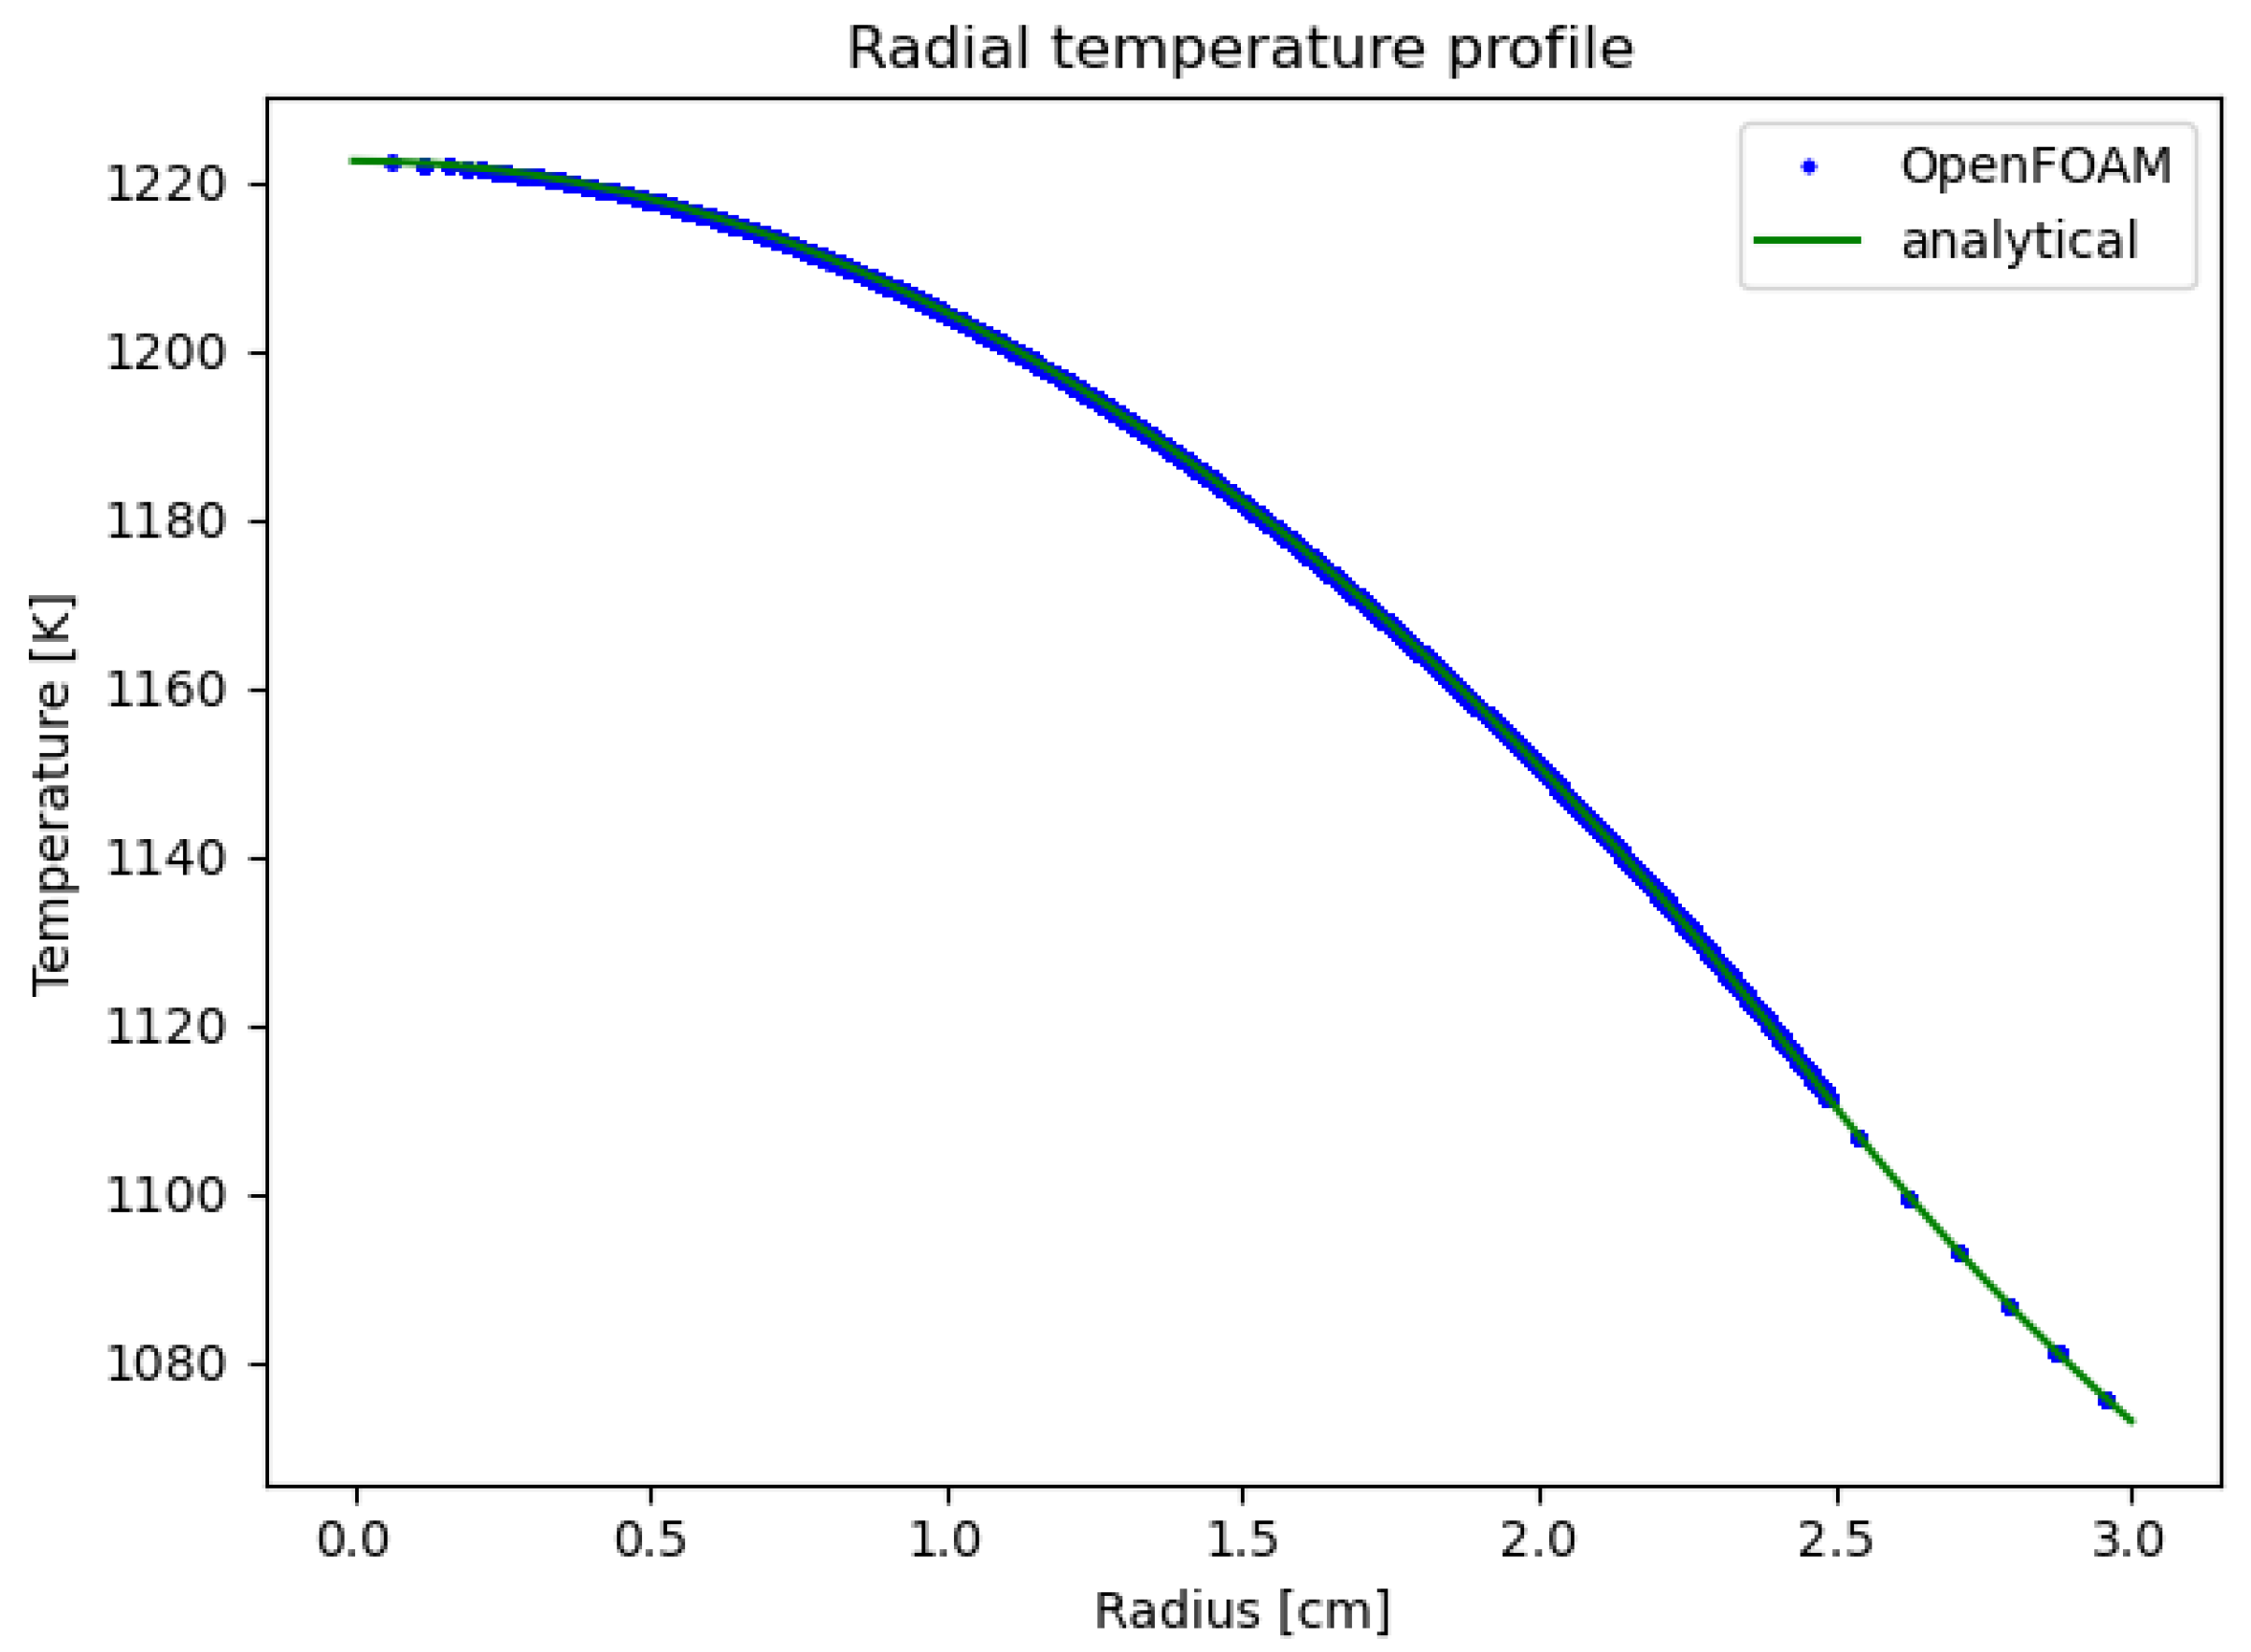
Figure 1. Verification model. The fuel region is purple, and the shell region is green.
Energies 18 05148 g001
Figure 2. The radial temperature profile of simplified numerical solution and analytical solution.
Energies 18 05148 g002
Figure 3. Cross-section of the Serpent model with the kernel-mesh plotted and the power cells of 2 bins marked. The power cells of bin 1 are marked in red and bin 2 in yellow.
Energies 18 05148 g003
Figure 4. Cross-section of the Serpent model with the TRISO-mesh plotted in the TRISO-fixed case.
Energies 18 05148 g004
Figure 5. Radial packing factor profile.
Energies 18 05148 g005
Figure 6. Coupled calculations flow chart.
Energies 18 05148 g006
Figure 7. Temperature profiles for various power cells assignments.
Energies 18 05148 g007
Figure 8. Temperature profiles from calculations with coupling (for one bin and six bins) and without coupling (uniform power distribution).
Energies 18 05148 g008
Figure 9. Normalized power profiles for various number of bins.
Energies 18 05148 g009
Figure 10. Cross-section of spacial temperature distribution obtained from coupled calculations with six bins.
Energies 18 05148 g010
Table 1. Model verification parameters.
Operational ParameterValue
Power density in fuel region [ W m 3 ]1615
Thermal conductivity [ W m K ]15
Boundary temperature [K]1073
Radius of fuel region [cm]2.5
Pebble radius [cm]3
Table 2. Material properties [15].
MaterialProperties
UO2 λ = 100 6.8337 + b 1 T + b 2 T 2 + 0.12783 T e 13485.11144 T
C p = c 1 a 1 2 e a 1 T [ T ( e a 1 T 1 ) ] 2 + 2 c 2 T + c 3 a 2 e a 3 T [ 1 + a 3 ( T 298.15 ) T 2 ]
ρ = 10,970
b 1 = 1.6693 · 10 2 , b 2 = 3.1885 · 10 6
a 1 = 516.11 , a 2 = 8.6144 · 10 5 , a 3 = 1.8815 a 2
c 1 = 78.212 , c 2 = 3.8616 · 10 3 , c 3 = 3.3993 · 10 8
buffer λ = 0.5
C p = 720
ρ = 1000
PyC λ = 4
C p = 720
ρ = 1900
>SiC λ = 1 0.0003 + 1.05 · 10 5 T
C p = 925.65 + 0.3772 T 7.9259 · 10 5 T 2 3.1946 10 7 T 2
ρ = 3216
C λ = 22.0567 l n ( T ) + 194.32788
C p = 4184 ( 0.541 + a 1 T + a 2 T + a 3 T 2 + a 4 T 3 + a 5 T 4
ρ = 1632
a 1 = 2.4267 · 10 6 , a 2 = 90.273 , a 3 = −43,449
a 4 = 1.5931 · 10 7 , a 5 = 1.4369 · 10 9
Table 3. Description of TRISO particles.
MaterialRadius [μm]
UO2250
buffer340
IPyC380
SiC415
OPyC455
Table 4. Results of thermal calculations with uniform power distribution in the fuel region.
Power
[W]
Reference
T [K] [16]
Kernel-Mesh
Homogenized
Kernel-MeshTRISO-Mesh
Homogenized
TRISO-Mesh
Max. T [K] ΔT [%]Max. T [K] ΔT [%] Max. T [K]ΔT [%]Max. T [K]ΔT [%]
5001100.341100.19−0.011101.220.081100.20−0.011101.210.08
8001116.861116.69−0.021118.350.131116.70−0.011118.330.13
10571131.081130.92−0.011133.130.181130.94−0.011133.110.18
14001150.151150.09−0.011153.040.251150.110.001153.000.25
17001166.941167.000.011170.610.311167.030.011170.560.31
20001183.831184.050.021188.330.381184.090.021188.280.38
30001240.681241.920.101248.520.631241.170.041248.440.63
40001298.511301.430.221310.470.921301.520.231310.370.91
50001357.271362.650.401374.281.251362.510.391374.141.24
Table 5. Results of coupled calculations for different cell assignment cases with one bin.
CaseNumber of Power CellsVolume Fraction [%]Power Fraction [%]Max. T [K] k inf +/−
TRISO-random21600.9518.521137.821.742220.00098
TRISO-Fixed10,0274.9098.911138.401.741280.00093
kernel-random13,1401.0047.921134.521.739920.00089
Kernel-fixed13,2640.9475.601135.101.739860.00096
Table 6. Results of coupled calculations for different number of bins.
Number of BinsMax. T [K] k inf +/−
11138.401.741280.00093
21136.101.740650.00092
31136.291.741320.00092
51136.281.740750.00090
61136.301.739290.00090
71136.271.741710.00096
81136.231.740010.00091
Table 7. Iteration history of the selected coupled calculations.
1 bin6 bins
Iteration Max. T [K] k inf +/− Max. T [K] k inf +/−
11133.121.741620.000971136.271.741440.00093
21138.411.742770.000901136.291.742280.00099
31138.411.741300.000981136.331.739690.00084
41138.41.741280.000931136.321.741440.00103
5 1136.291.742170.00090
6 1136.301.739290.00090
Table 8. Influence of power deviation on maximum temperature deviation.
Power Deviation [%]−2−1−0.5−0.1Reference+0.1+0.5+1+2
1-binT[K]1137.091137.711138.091138.341138.41138.441138.711139.041139.71
Δ T [%]−0.115−0.061−0.027−0.005-0.0040.0270.0560.115
6-binsT[K]1135.041135.641135.961136.221136.31136.391136.61136.921137.57
Δ T [%]−0.111−0.058−0.030−0.007-0.0080.0260.0550.112
Disclaimer/Publisher’s Note: The statements, opinions and data contained in all publications are solely those of the individual author(s) and contributor(s) and not of MDPI and/or the editor(s). MDPI and/or the editor(s) disclaim responsibility for any injury to people or property resulting from any ideas, methods, instructions or products referred to in the content.