Article

Transmission of Mechanical Vibrations in an Electric Drive Unit with Scalar Control—Comparative Analysis with Evaluation Based on Experimental Studies

1
Department of Ship Automation, Faculty of Marine Electrical Engineering, Gdynia Maritime University, 81-225 Gdynia, Poland
2
Department of Measurement Science, Electronics and Control, Faculty of Electrical Engineering, Silesian University of Technology, 44-100 Gliwice, Poland
*
Author to whom correspondence should be addressed.
Energies 2025, 18(19), 5140; https://doi.org/10.3390/en18195140
Submission received: 23 August 2025 / Revised: 14 September 2025 / Accepted: 23 September 2025 / Published: 27 September 2025
(This article belongs to the Special Issue Modern Aspects of the Design and Operation of Electric Machines)

Abstract

Vibration monitoring plays a crucial role in assessing the condition and operational safety of electric drive systems. In many industrial applications, scalar control is widely used due to its simplicity and reliability, yet its influence on vibration transmission within interconnected machines remains insufficiently explored. This study addresses the problem of understanding how mechanical vibrations are transmitted between a scalar-controlled induction motor coupled with an AC generator. A comparative experimental investigation was conducted using two different configurations of drive units, incorporating either an induction or a synchronous generator. Vibrations were measured at various operating speeds and analysed using different sensor types to ensure repeatability and reliability of the results. The findings have revealed distinct patterns of vibration transmission between the motor and generator, highlighting the importance of drive system configuration and measurement methodology. A novel approach to data presentation is proposed by normalising vibration levels between machines, offering a clearer interpretation of vibration amplification or damping effects. The results contribute to the development of diagnostic techniques and the optimisation of scalar-controlled drive designs.

1. Introduction

Vibrodiagnostic belongs to a group of diagnostic tests that is currently frequently used and is known as Non-Destructive Testing (NDT). Its utilisation is prevalent in the domains of mechanical structures [1] and complex electromechanical objects [2]. It has been demonstrated that the monitoring of vibrations in devices can lead to the enhancement of production processes and has a substantial impact on the classification of working areas of mechanical structures and electromechanical devices in terms of occupational health and safety [3]. It is required that high-power machines undergo periodic testing to ascertain the vibrations they generate [4]. Such measurements facilitate the planning of potential repairs, thereby avoiding the costly and unexpected production interruptions that can otherwise occur. Furthermore, they provide the ability to react to vibration levels that may exceed the recommended levels and negatively impact the human body [5].
An electric drive unit converts electrical energy into mechanical energy and typically includes a power source, a motor, a generator or driven machine, and associated control and measurement systems [6]. The quality of the power supply and control system directly influences performance. Capacitors and inductors affect voltage and current characteristics: larger elements reduce ripple and harmonics, improving waveform quality, but they also increase cost, weight, and limit dynamic response. Hence, the design of drive units requires balancing electrical and mechanical factors [7]. Mechanical degradation is another critical issue, commonly caused by wear and ageing of torque-transmitting foundation materials (e.g., rubber shock absorbers, chemically hardened washers), settlement of the foundation structure, and deterioration of flexible couplings [8]. These processes increase vibration amplitudes, which can lead to shaft misalignment, changes in the centre of gravity of rotating components, and accelerated bearing wear, ultimately immobilising the drive unit. Failures are often linked to foundation errors [9], especially in maritime and transportation applications where welded sheet-metal foundations are more flexible and vibration-prone than rigid blocks [10]. Couplings also play a key role: flexible types absorb overloads during start-up and limit vibration transfer between machines [11,12,13].
From a broader perspective, the drive unit must be regarded as a complex electromechanical system shaped by design assumptions, operating conditions, and implementation environment. Vibrations are inherent, arising both from non-linear electromagnetic phenomena and from the degradation of foundations, couplings, and bearings [14]. Among the most significant contributors are foundation type (e.g., dynamometer, installation site) and components such as clutches and bearings. Prior studies extensively analyse the effects of material wear, shaft misalignment, and foundation errors on drive dynamics [15], yet relatively little research addresses the quantitative assessment of vibration transmission in drives controlled by scalar algorithms, despite their industrial relevance. Recent works [16,17] highlight advances in machine monitoring and maintenance strategies, propose diagnostic system architectures, and review vibration-based methods, including acquisition, analysis, and interpretation of signals.
The most popular studies are those involving vibration analysis for single electrical machines. Paper [17] details the experimental testing of a single induction motor with deliberately introduced defects (imbalance, misalignment, bearings). The aforementioned paper employs a combination of vibration signal analysis and current analysis, a technique referred to as Motor Current Signature Analysis (MCSA). Paper [18] provides a detailed description of the testing process for various levels of imbalance on a single rotating shaft. The text provides a comprehensive description of measuring vibrations along the shaft axis with precise sampling. Machine learning methodologies, including Convolutional Neural Networks (CNNs) and Random Forests, were employed there to classify imbalances with an accuracy of about 98.6%. Paper [19] presents a methodology based on an auto encoder trained on normal vibration signals from a single machine. The method under discussion is designed to detect anomalies as deviations from the pattern. It has achieved an F1-score of about 99.6%—without manually defined features.
Vibration testing for drive systems, particularly those incorporating electric machines, is not a prevalent practice. Papers [20,21] provide a comprehensive overview of the studies conducted on dynamic vibrations in EV drives, encompassing gear mesh forces, bearing loads, and torsional fluctuations across various speeds. They also offer solutions for enhancing torsional compliance damping. Paper [22] reviews recent articles (covering the last 5–10 years) on the causes of electric motor vibrations and the methods employed for their analysis, including the mechanical component of vibrations. As demonstrated in [22], such research is still relatively rare in the context of drive systems. A review of the literature further reveals contributions concerning sub- and interharmonics [23,24,25], where torque pulsation and vibrations of an induction motor (and DC generator) were analysed under simultaneous voltage subharmonics and asymmetry conditions using both numerical and experimental methods, with permissible values determined in accordance with established standards. Publications [24,25] additionally examine the influence of symmetrical subharmonic and interharmonic components (with frequencies not being integer multiples of the fundamental) on induction motor performance, with [24] presenting a comparison of vibrations and torque pulsations depending on the phase angle of these components. Regarding drive units, an attempt to ascertain vibration levels in a scalar-controlled five-phase induction motor is described in [26], where scenarios including no load, nominal load, and phase faults were analysed in both the time and frequency domains. Overall, despite these contributions, vibration analysis in complete drive systems remains limited, primarily due to the complexity of the subject and restricted access to appropriate laboratory facilities. Most studies concentrate on time- or frequency-domain analysis of single machines, while relatively few investigate how vibrations generated by one machine are transmitted to another within a coupled system, especially under scalar control conditions, which are still widely used in industrial practice.
Despite the existing studies on single machines and limited investigations into coupled systems [20,21,22,23,24,25,26], a comprehensive experimental analysis of vibration transmission in complete electric drive units, particularly under scalar control, remains scarce. This gap highlights the need for methods that quantify how vibrations propagate between coupled components and under varying operating conditions. Addressing this, the present paper experimentally investigates vibration transmission within an electric drive system comprising an induction motor coupled with two types of generators: a cage induction generator and a permanent magnet synchronous generator. A novel approach is introduced that normalizes vibration levels measured on the motor and generator sides, allowing clearer identification of amplification or damping effects and providing a foundation for improved diagnostic techniques and optimized design of scalar-controlled drive systems.
The paper is organized into four sections. Section 2 describes the drive unit under study and the applied vibrodiagnostic testing system, including the detailed methodologies for both vibrodiagnostic and electrical measurements. Section 3 presents the experimental results, covering measurements obtained using two types of accelerometers—triaxial and uniaxial—and including experiments with two different generators. It also provides an overview of vibration analysis methods in electrical systems and introduces the analysis of vibration transmission within the tested drive unit, a method developed and proposed by the authors. Finally, Section 4 provides a brief conclusion summarizing the significant contributions of the work.

2. Materials and Methods

2.1. Description of Drive Unit Under Study

A drive unit comprising two electric machines constitutes a complex electrical–mechanical system. In this system, one machine converts supplied electrical energy into mechanical energy and is called a motor. The second machine is connected to the first by a shaft and gearbox. It utilises the delivered mechanical energy, converting it to electrical energy, and is called a generator. The motor–generator set under test, presented in Figure 1, was driven by a three-phase cage induction motor with an output power of 11 kW. The motor was powered with its speed controlled via a frequency converter.
Generators included a cage induction machine and a permanent-magnet synchronous machine, with the induction machine being heavier. The motor was connected to the generators sequentially using a rigid bellows coupling, chosen to ensure direct torque transfer and nearly complete transmission of motor vibrations. Unlike flexible couplings, which mitigate vibrations and compensate for minor misalignments, the rigid coupling eliminates external damping, allowing accurate study of natural vibration propagation within the drive unit. In practical industrial applications, flexible couplings are typically used, but for this study, the rigid connection was essential to avoid external factors affecting vibration measurements.
In the case of generators, their electrical parameters are irrelevant to the research, as they do not exert any active resistance. These machines are not connected to the electric supply. The resistance to the motor is caused solely by the moment of inertia of the coupled machines.
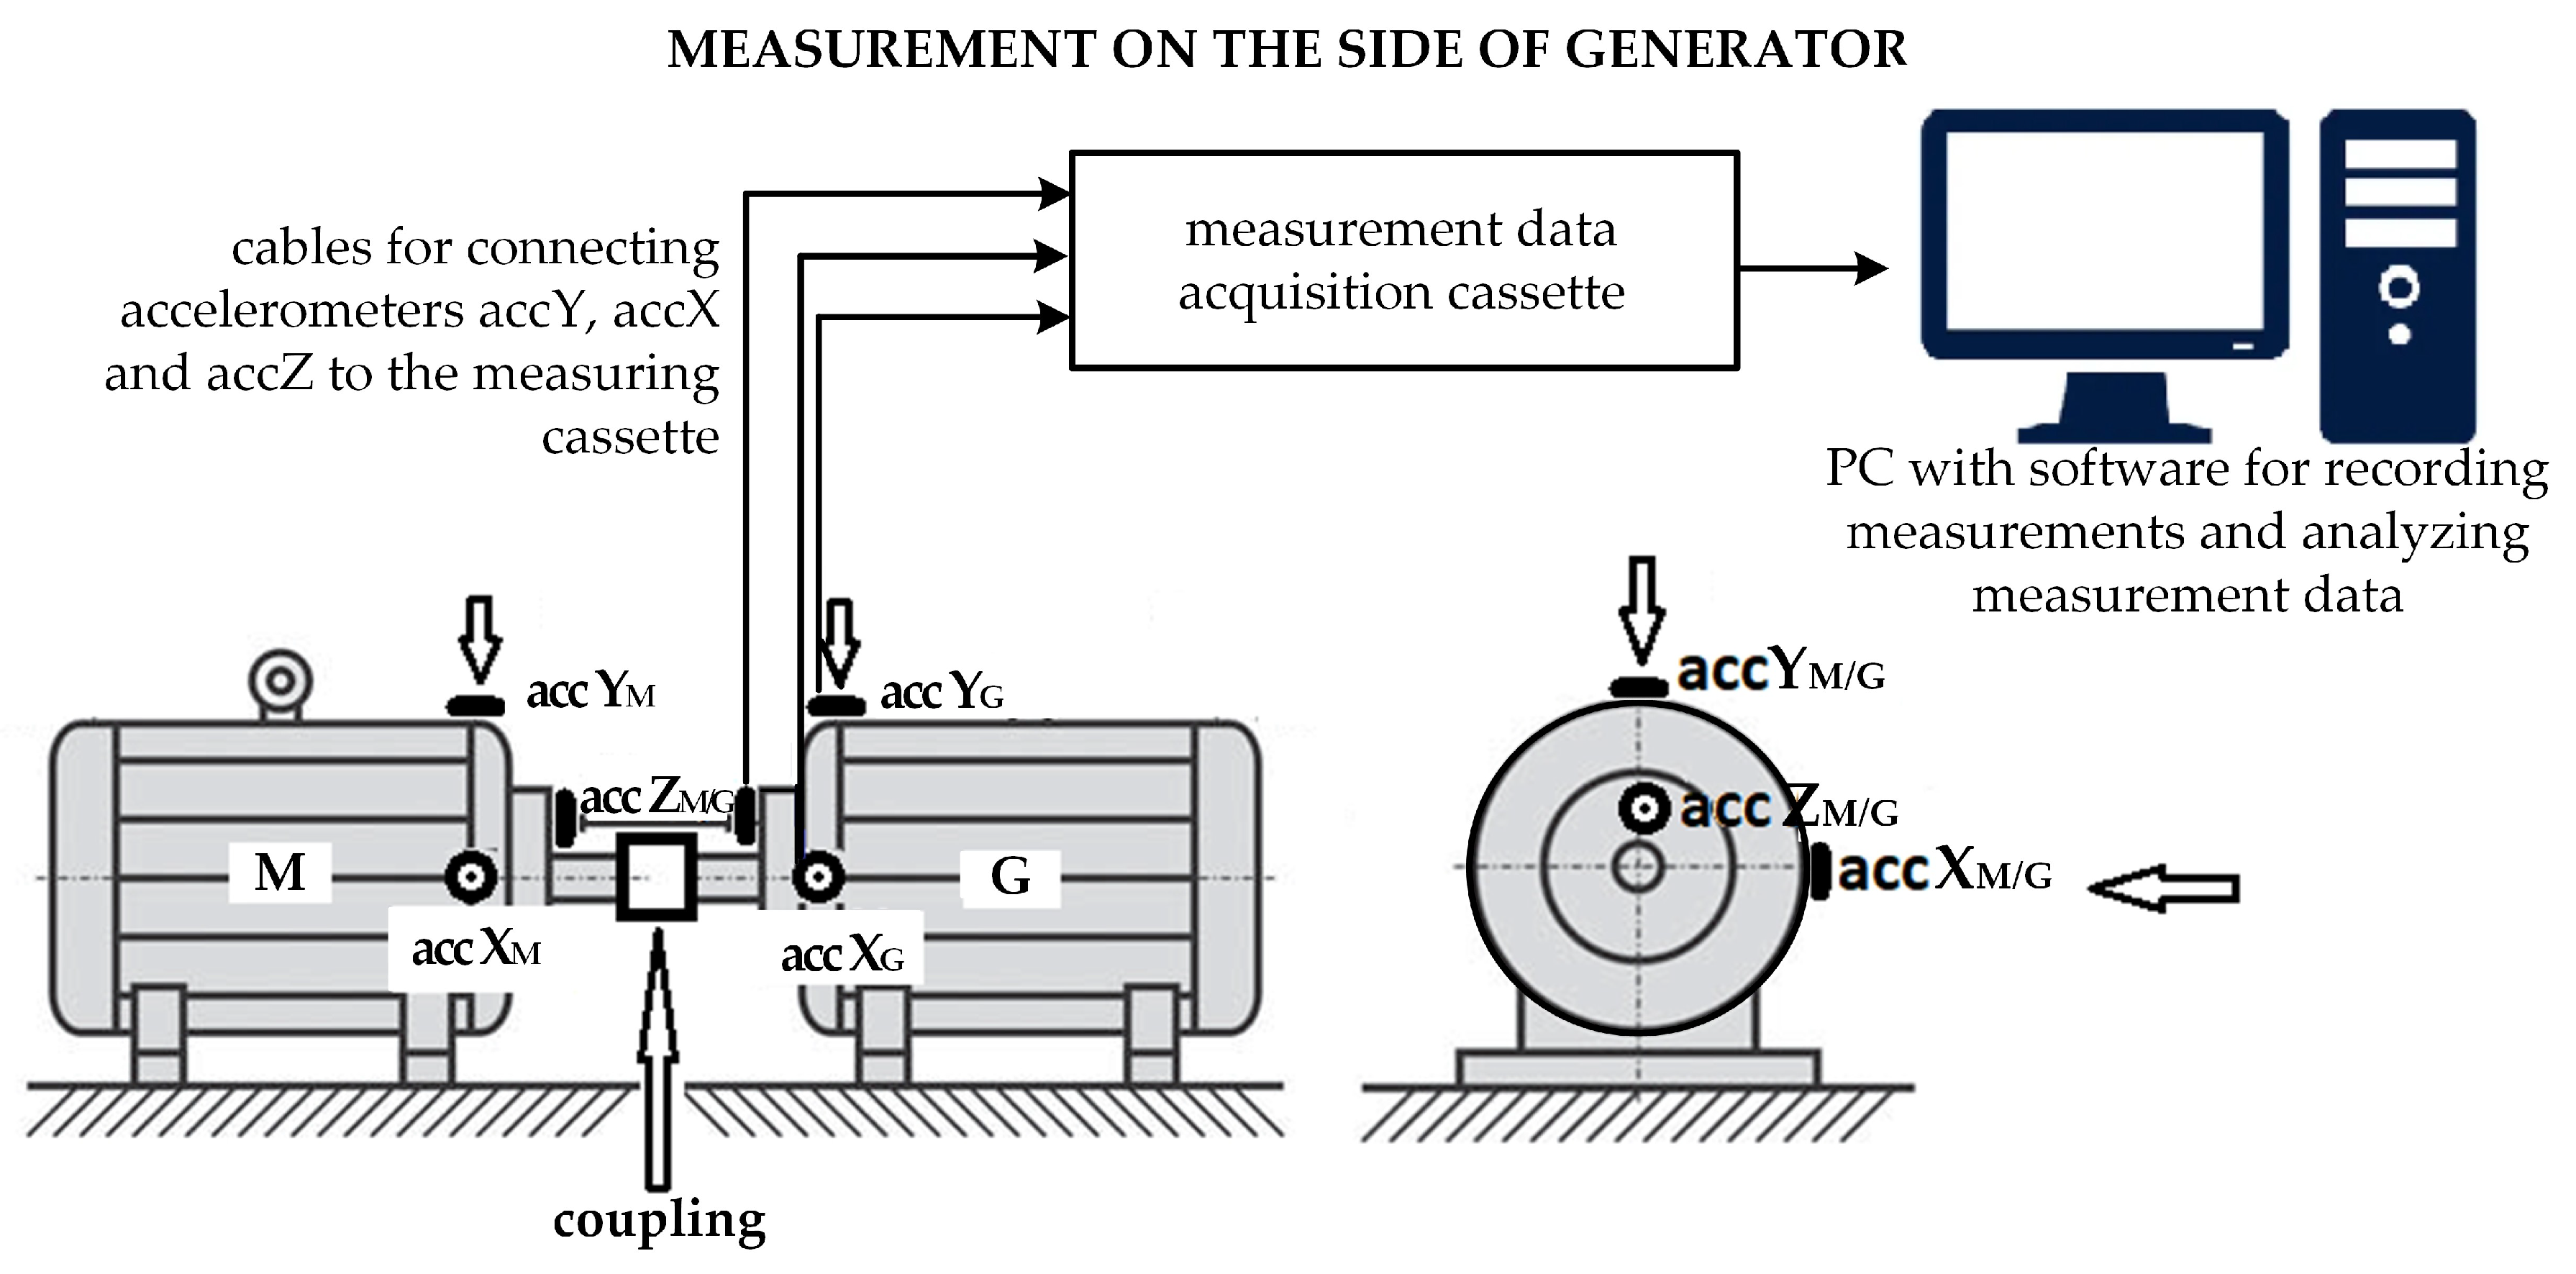
Measurements conducted at the laboratory stand included the motor’s power supply parameters and vibration measurements of both the motor and the generators. An oscilloscope was used for electrical measurements, while vibrations were recorded using a triaxial accelerometer and three uniaxial accelerometers. Table 1 provides detailed information on all devices and components used in the experiment, including names, manufacturers, and models. All measurements and results were processed in the BK Connect application. The case of measurements conducted on the generator side with the usage of uniaxial accelerometers is depicted in Figure 2.

2.2. Description of the Vibrodiagnostic Testing System

Vibrations of both the motor and generators were recorded at five different speeds, with the measurement series conducted sequentially for technical reasons. The measurements were performed in steady-state operation of the drive system, which is standard practice. First, a series of measurements was performed for the motor, followed by the same procedure for the generator. Identical measurement conditions, including machine rotational speed values, were maintained to enable reliable comparison between sensors.
Two types of accelerometers were used: a magnetically mounted triaxial accelerometer, measuring acceleration along three perpendicular axes simultaneously, and three uniaxial accelerometers, each measuring a single axis. Both types cover the same frequency range (0.2–12.6 kHz), but uniaxial sensors are more robust and tolerate higher shock levels. Identical mounting positions and measurement axes were maintained for both sensor types to ensure comparability of results. A stand-alone, four-channel data acquisition module was used to capture the measurements and transfer the data to the BK Connect application for processing. Both the software and the measuring equipment, including sensors, were supplied by Bruel&Kjaer (Nærum, Denmark). Measurements were recorded in 10 s time windows, illustrating vibration acceleration over that period. The recorded data were adjusted to a uniform time window to ensure consistency across measurements and to eliminate interference often present at the beginning and end of recordings.
The exported data were further processed in Excel. Calculation chains were created to analyse the results: one chain calculated the Root Mean Square (RMS) values of vibration over the specified measurement period, while another chain performed Fast Fourier Transform (FFT) analysis to identify dominant vibration frequencies (Figure 3).
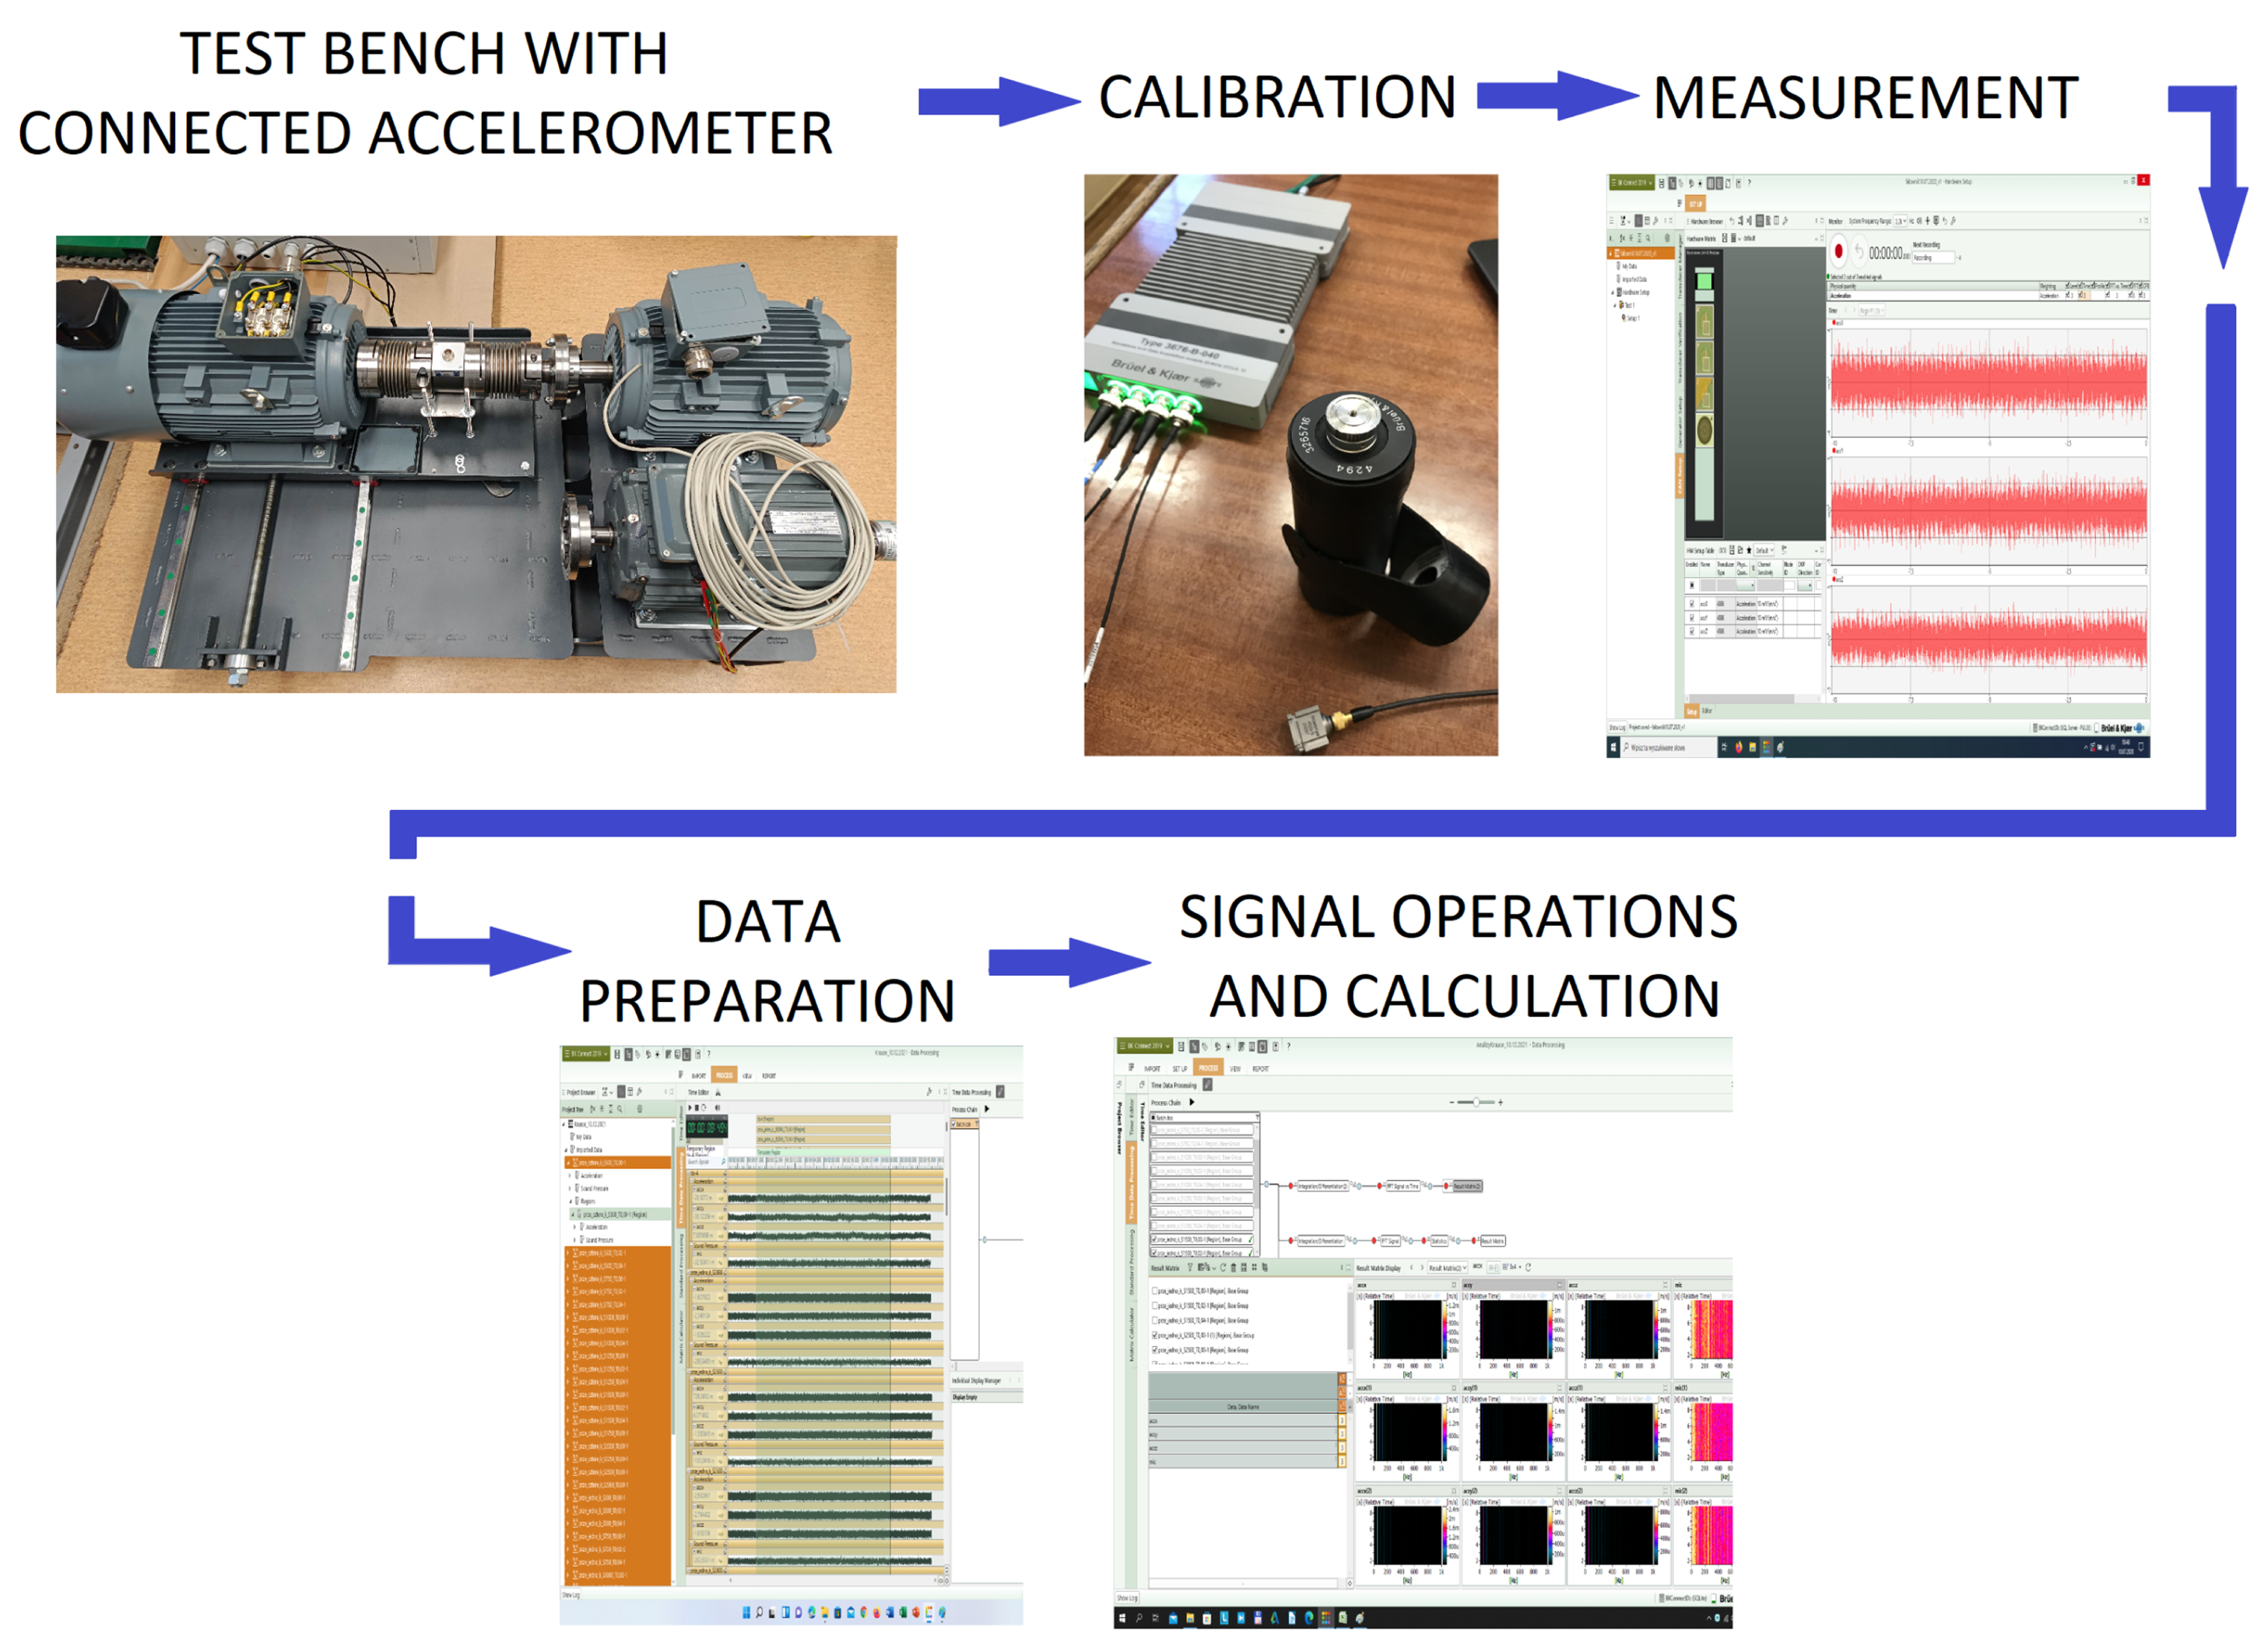
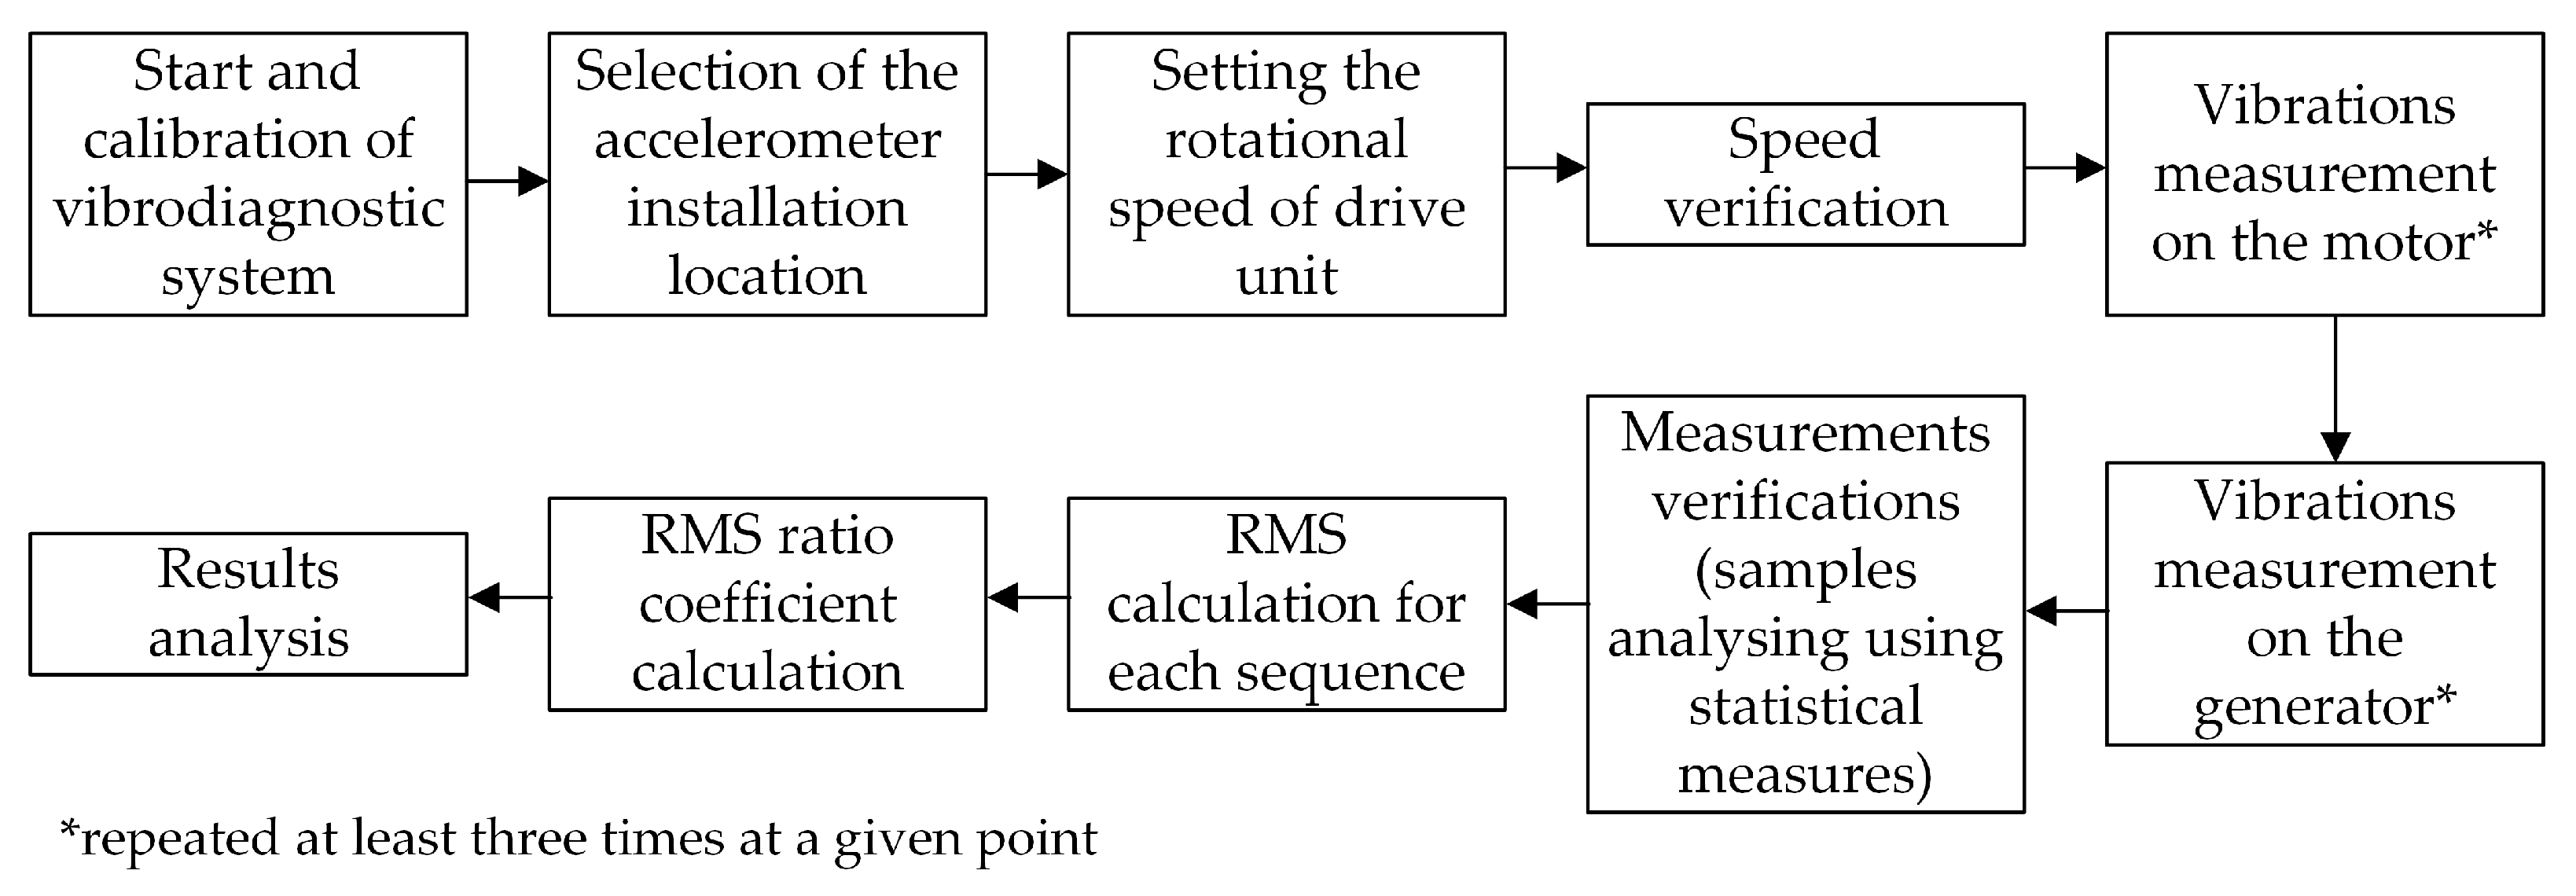
Before final analysis, each measurement was repeated three times to improve accuracy. The data were organized into readable tables, and results were selected based on the ‘Variance Value’ parameter, retaining the measurement with the lowest mean value for each speed. This processed dataset was then used for further analysis, with the full measurement procedure summarized in the flowchart shown in Figure 4.

2.3. Methods of Analysis of Electrical and Vibrodiagnostic Measurements

The method of analysing the electrical and vibrodiagnostic measurements was the same for the unit with a coupled induction machine and a coupled synchronous machine. Both variants followed the same sequence of measurements, which is shown in Table 2. The output frequency of the converter controlling the motor was used to determine the measurement points. Additionally, Table 2 shows the speeds achieved by the unit for a given control frequency. The results obtained are presented in the paper according to the following procedure:
  • Results of electrical measurements;
  • Results of vibration analysis measured in case of induction motor—induction generator drive unit set (measured with triaxial, and then three uniaxial accelerometers);
  • Results of vibration analysis measured in case of induction motor—synchronous generator drive unit set (measured with triaxial, and then three uniaxial accelerometers).
Table 2. Measuring points determined based on the inverter output frequency.
Measurement No.Output Frequency of the Inverter [Hz]Rotational Speed of the Unit [rpm]
110300
220600
330900
4401200
5501500
Vibration analysis was performed in accordance with the recommendations specified in the standards [27,28,29]. The vibration velocity measurement range was up to 1000 Hz. Machine vibration was assessed using the RMS value of vibration velocity, given in millimetres per second (mm/s). Vibration severity was assessed in accordance with ISO standard [28], whereby vibration severity can be classified into one of four zones, as described below:
  • Zone A: Vibrations generally correspond to newly commissioned machines;
  • Zone B: Vibrations can be acceptable for the long-term, unrestricted operation of the machine;
  • Zone C: Vibrations are permissible only for a limited time;
  • Zone D: Vibrations are severe enough to cause damage to the machine.
The boundaries of each assessment zone are given in [27]. For small production electric motors, the corresponding vibration velocity limits are as follows:
  • Zone A: Not greater than 0.71 mm/s;
  • Zone B: Between 0.71 and 1.8 mm/s;
  • Zone C: Between 1.8 and 4.5 mm/s;
  • Zone D: Above 4.5 mm/s.
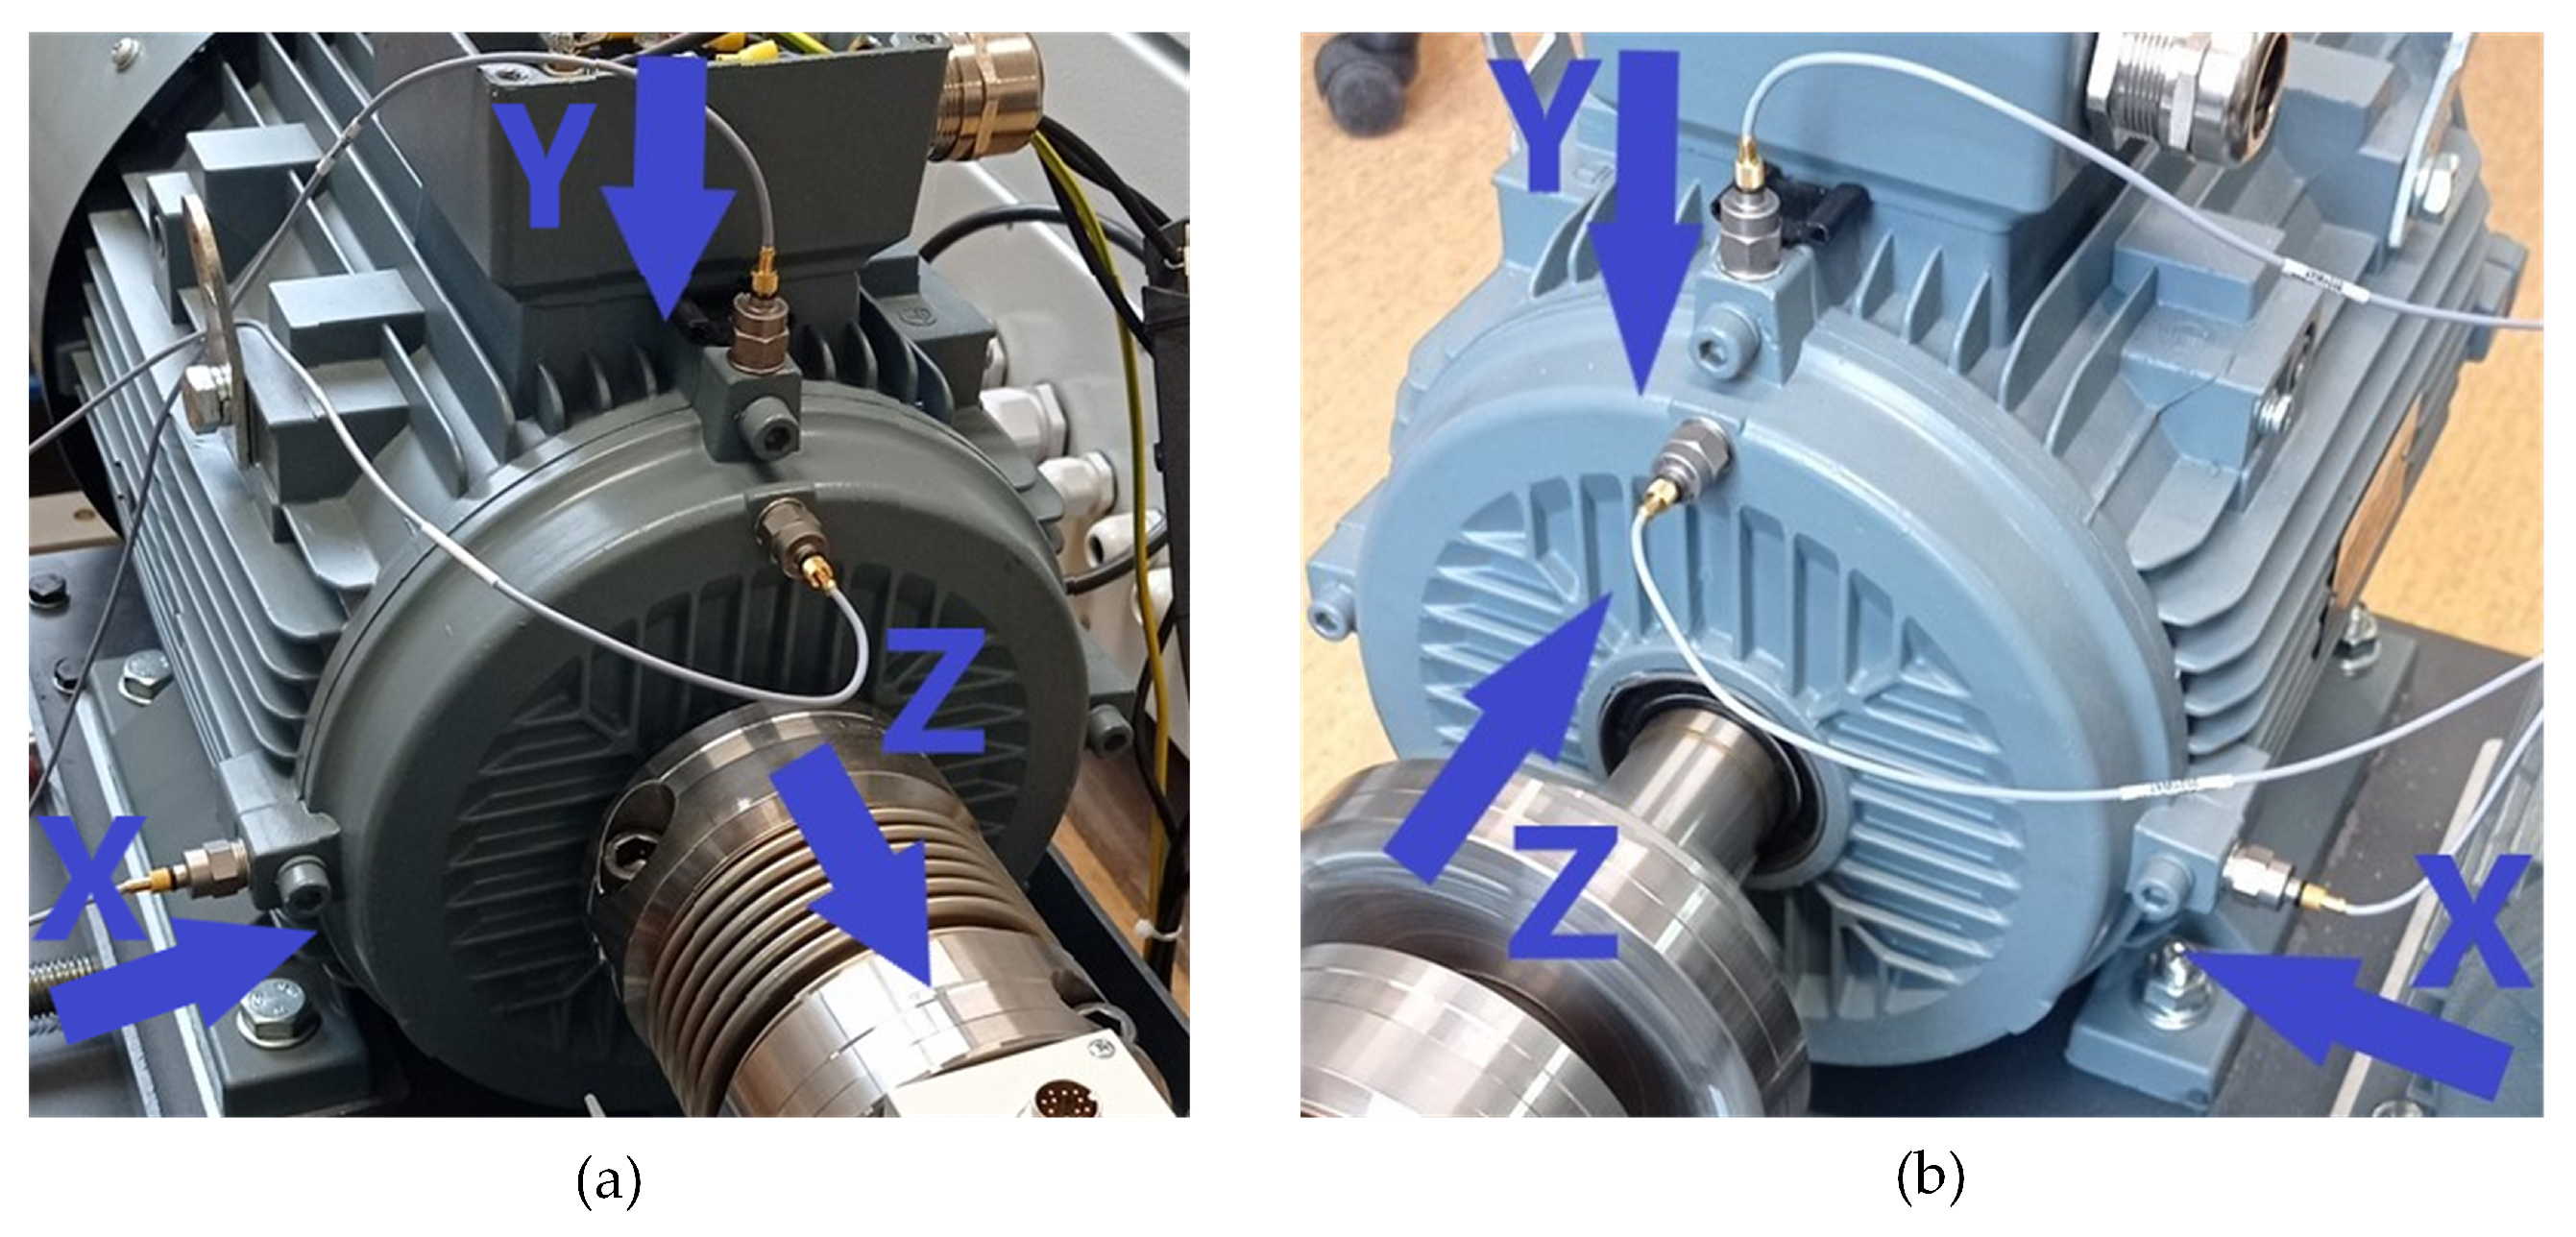
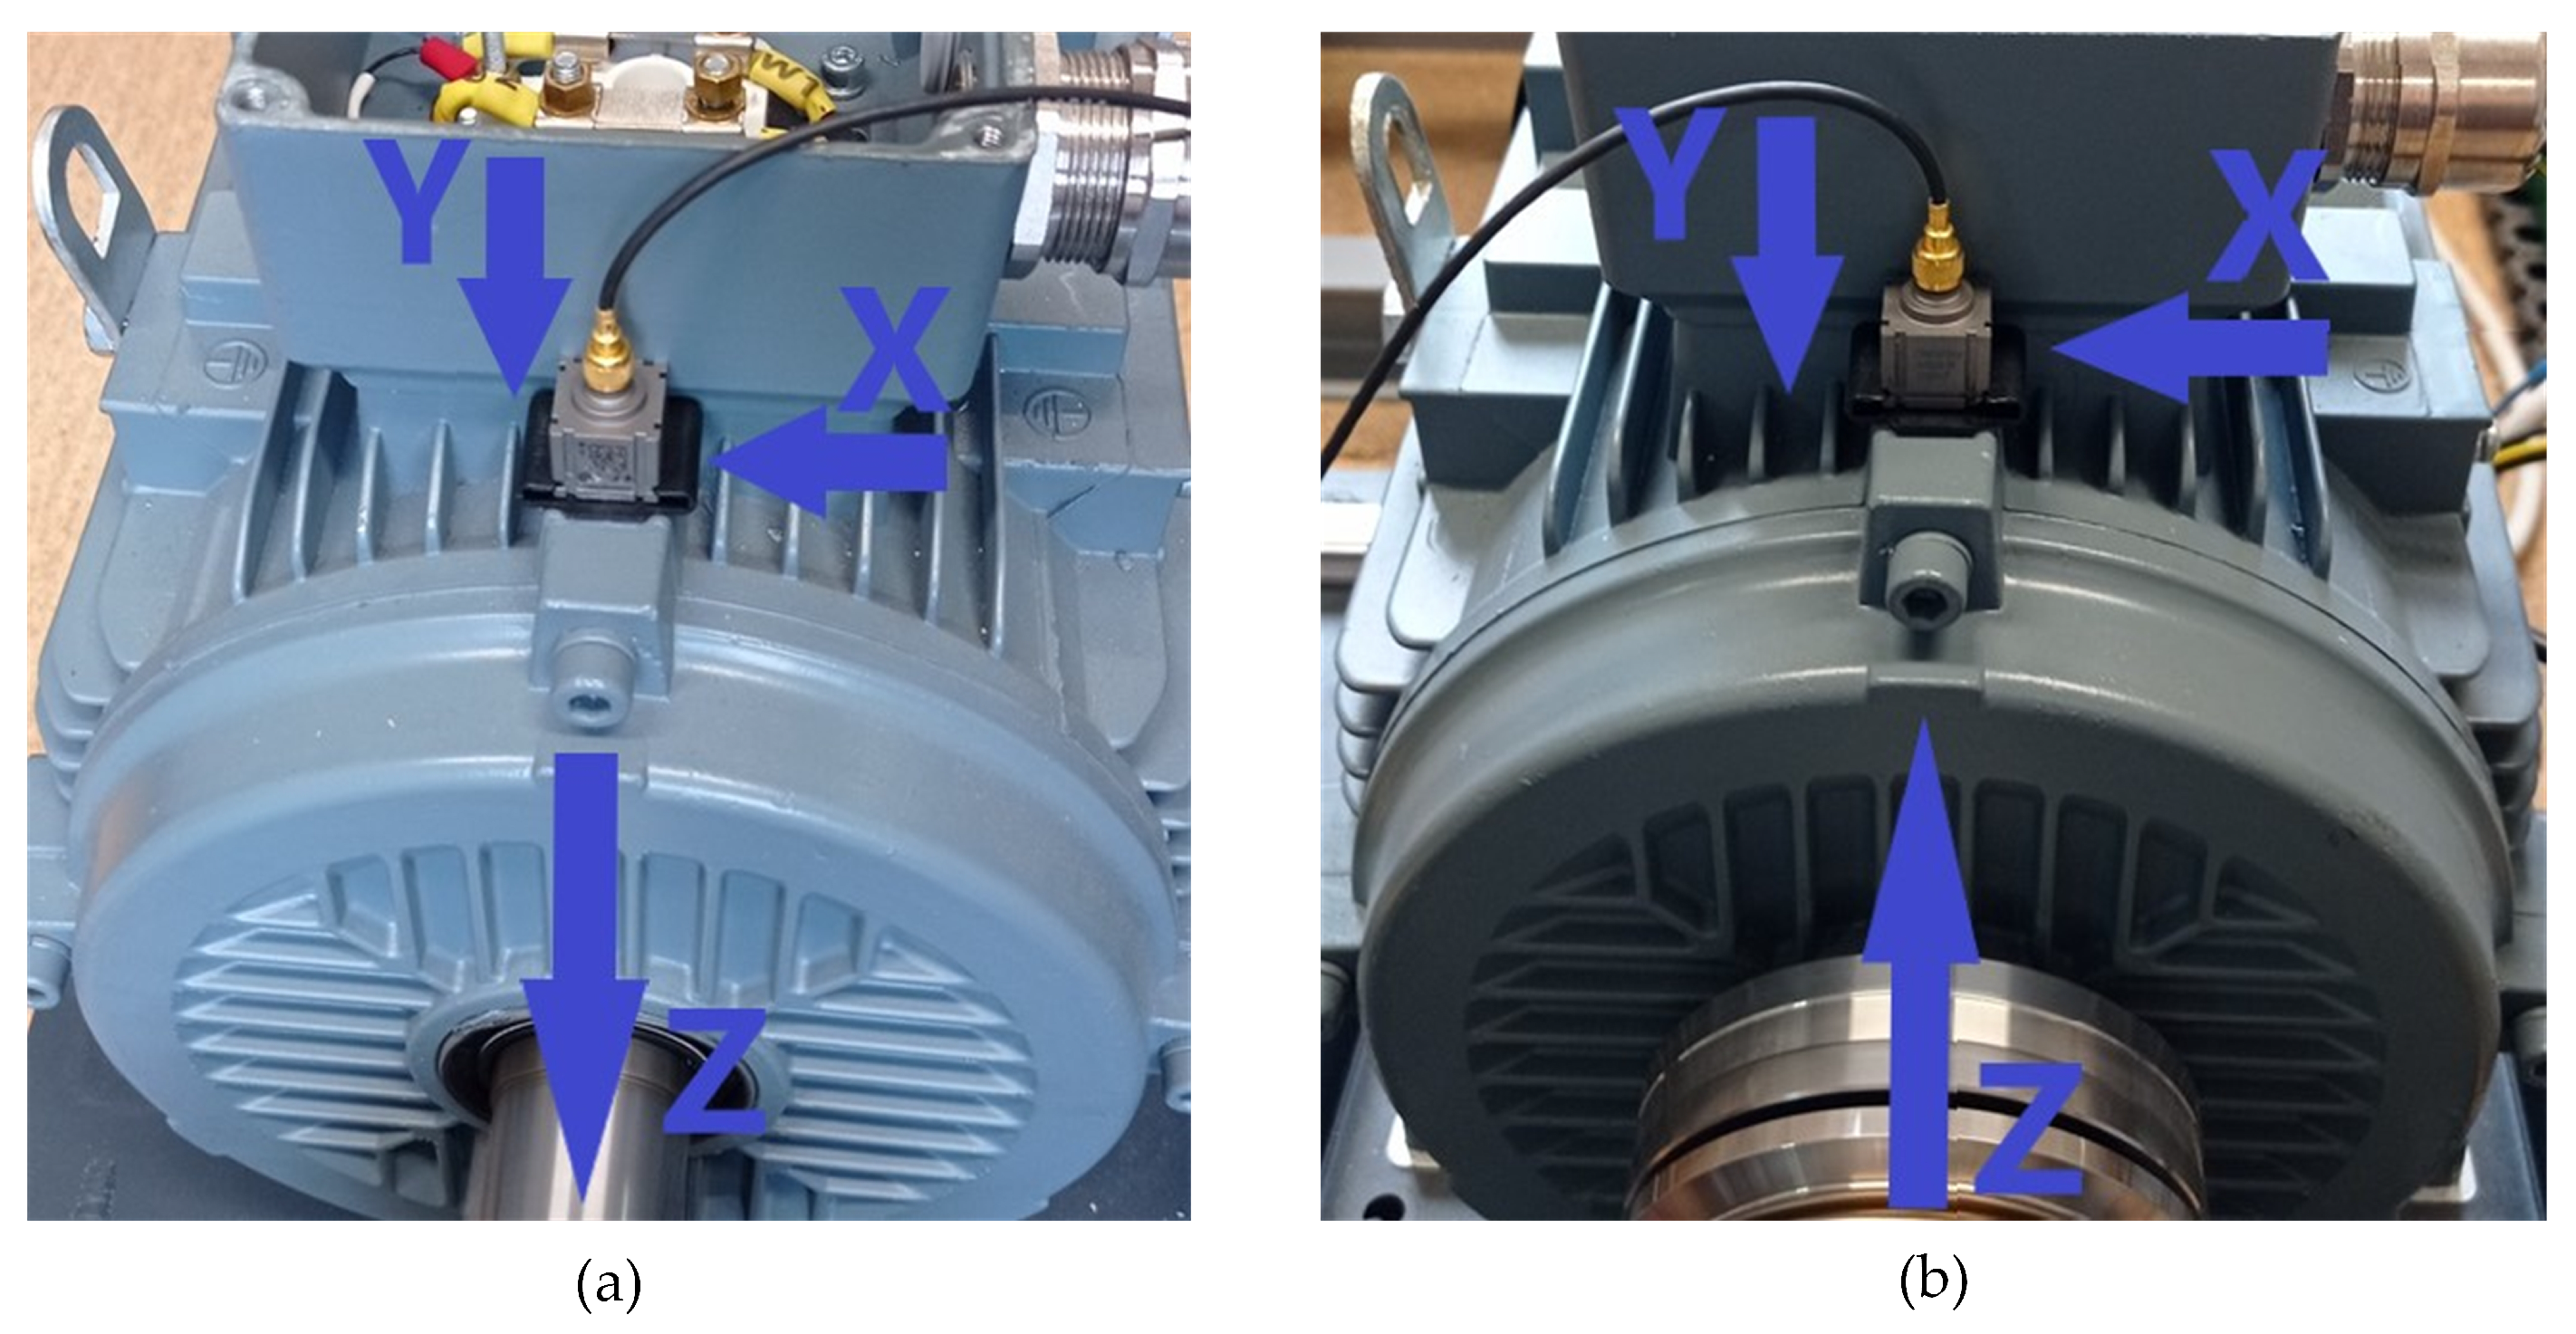
The article focuses on comparing the obtained results of vibration velocity measured with different sensors. During the measurements, the recommendations taken from the mentioned standards were followed. During the analysis, the vibration directions were defined as X, Y, Z. The arrangement of the accelerometers and the assumed vibration directions is shown in Figure 5 for uniaxial, whilst in Figure 6 for triaxial. The measuring axes of both the uniaxial and triaxial accelerometers were kept the same during the tests.
The detailed diagram illustrating the procedure of the performed experiment is presented in Figure 7. The process was performed separately for each of two generators, as well as each type of accelerometer.

3. Experimental Results

Vibrations in a standard drive unit can have both mechanical and electrical origins. The phenomenon of mechanical vibrations in an electric machine is attributable to its design, that is to say, the quality of its components and the manner in which they are mounted and balanced. The degree of fit and wear of moving parts, such as bearings, also have an effect on them. Conversely, electrical vibrations are the consequence of the method by which the electric machine is powered and controlled. Whilst the quality of electric power is the focus of separate scientific research, the resulting conclusions indicate that the supply voltage used to power an electric machine affects the magnetic field generated in the motor. In an ideal scenario, an electric machine would be powered by a multiphase sinusoidal voltage. However, this strategy is currently rare due to the widespread use of power electronic converters for powering and controlling electric machines. The utilisation of frequency converters and inverters in conjunction with established control strategies is attributable to the pervasive adoption of electric drives within both onshore and offshore industrial contexts.
This chapter presents the experimental results achieved for the drive unit described in the Section 2.1. The evaluation of the obtained results has been performed on the basis of both electrical and mechanical measurements. The FFT analyses have been conducted for two arbitrarily selected frequencies equal to 30 Hz and 50 Hz, which correspond to the motor speeds of 900 rpm and 1500 rpm, respectively.

3.1. Analysis of Data Obtained from Electrical Measurements

The converter’s output voltage is characterised by a controlled value and frequency, but also a rectangular shape, which constitutes a significant deviation from a sinusoidal waveform. This phenomenon is characterised by the presence of harmonics, which are defined as multiples of the fundamental harmonic. However, the possibility of interharmonics, of which subharmonics are a special case, should also be considered. It has been demonstrated that the impact of subharmonics on the operation of an electrical machine can be more significant, particularly in the context of vibrations in the drive unit. The impact of power quality on the operation of electrical machines is a subject that has attracted significant research attention. The increasing complexity of power systems, particularly in relation to the powering of electrical machines, also has a detrimental effect on the quality of electricity. This phenomenon is primarily evidenced by the emergence of novel electricity sources, including photovoltaic farms and wind farms, among others.
The present study examined the operation of the drive unit which employed a scalar control (U/f = constant) to regulate the rotational speed of an induction motor. For selected speeds, achieved by varying the voltage frequency and value, vibrations were recorded on both the motor and generator sides. In order to analyse vibrations in such an electrical machine system, it is essential to compare key parameters of the voltages and currents used to power and control the motor.
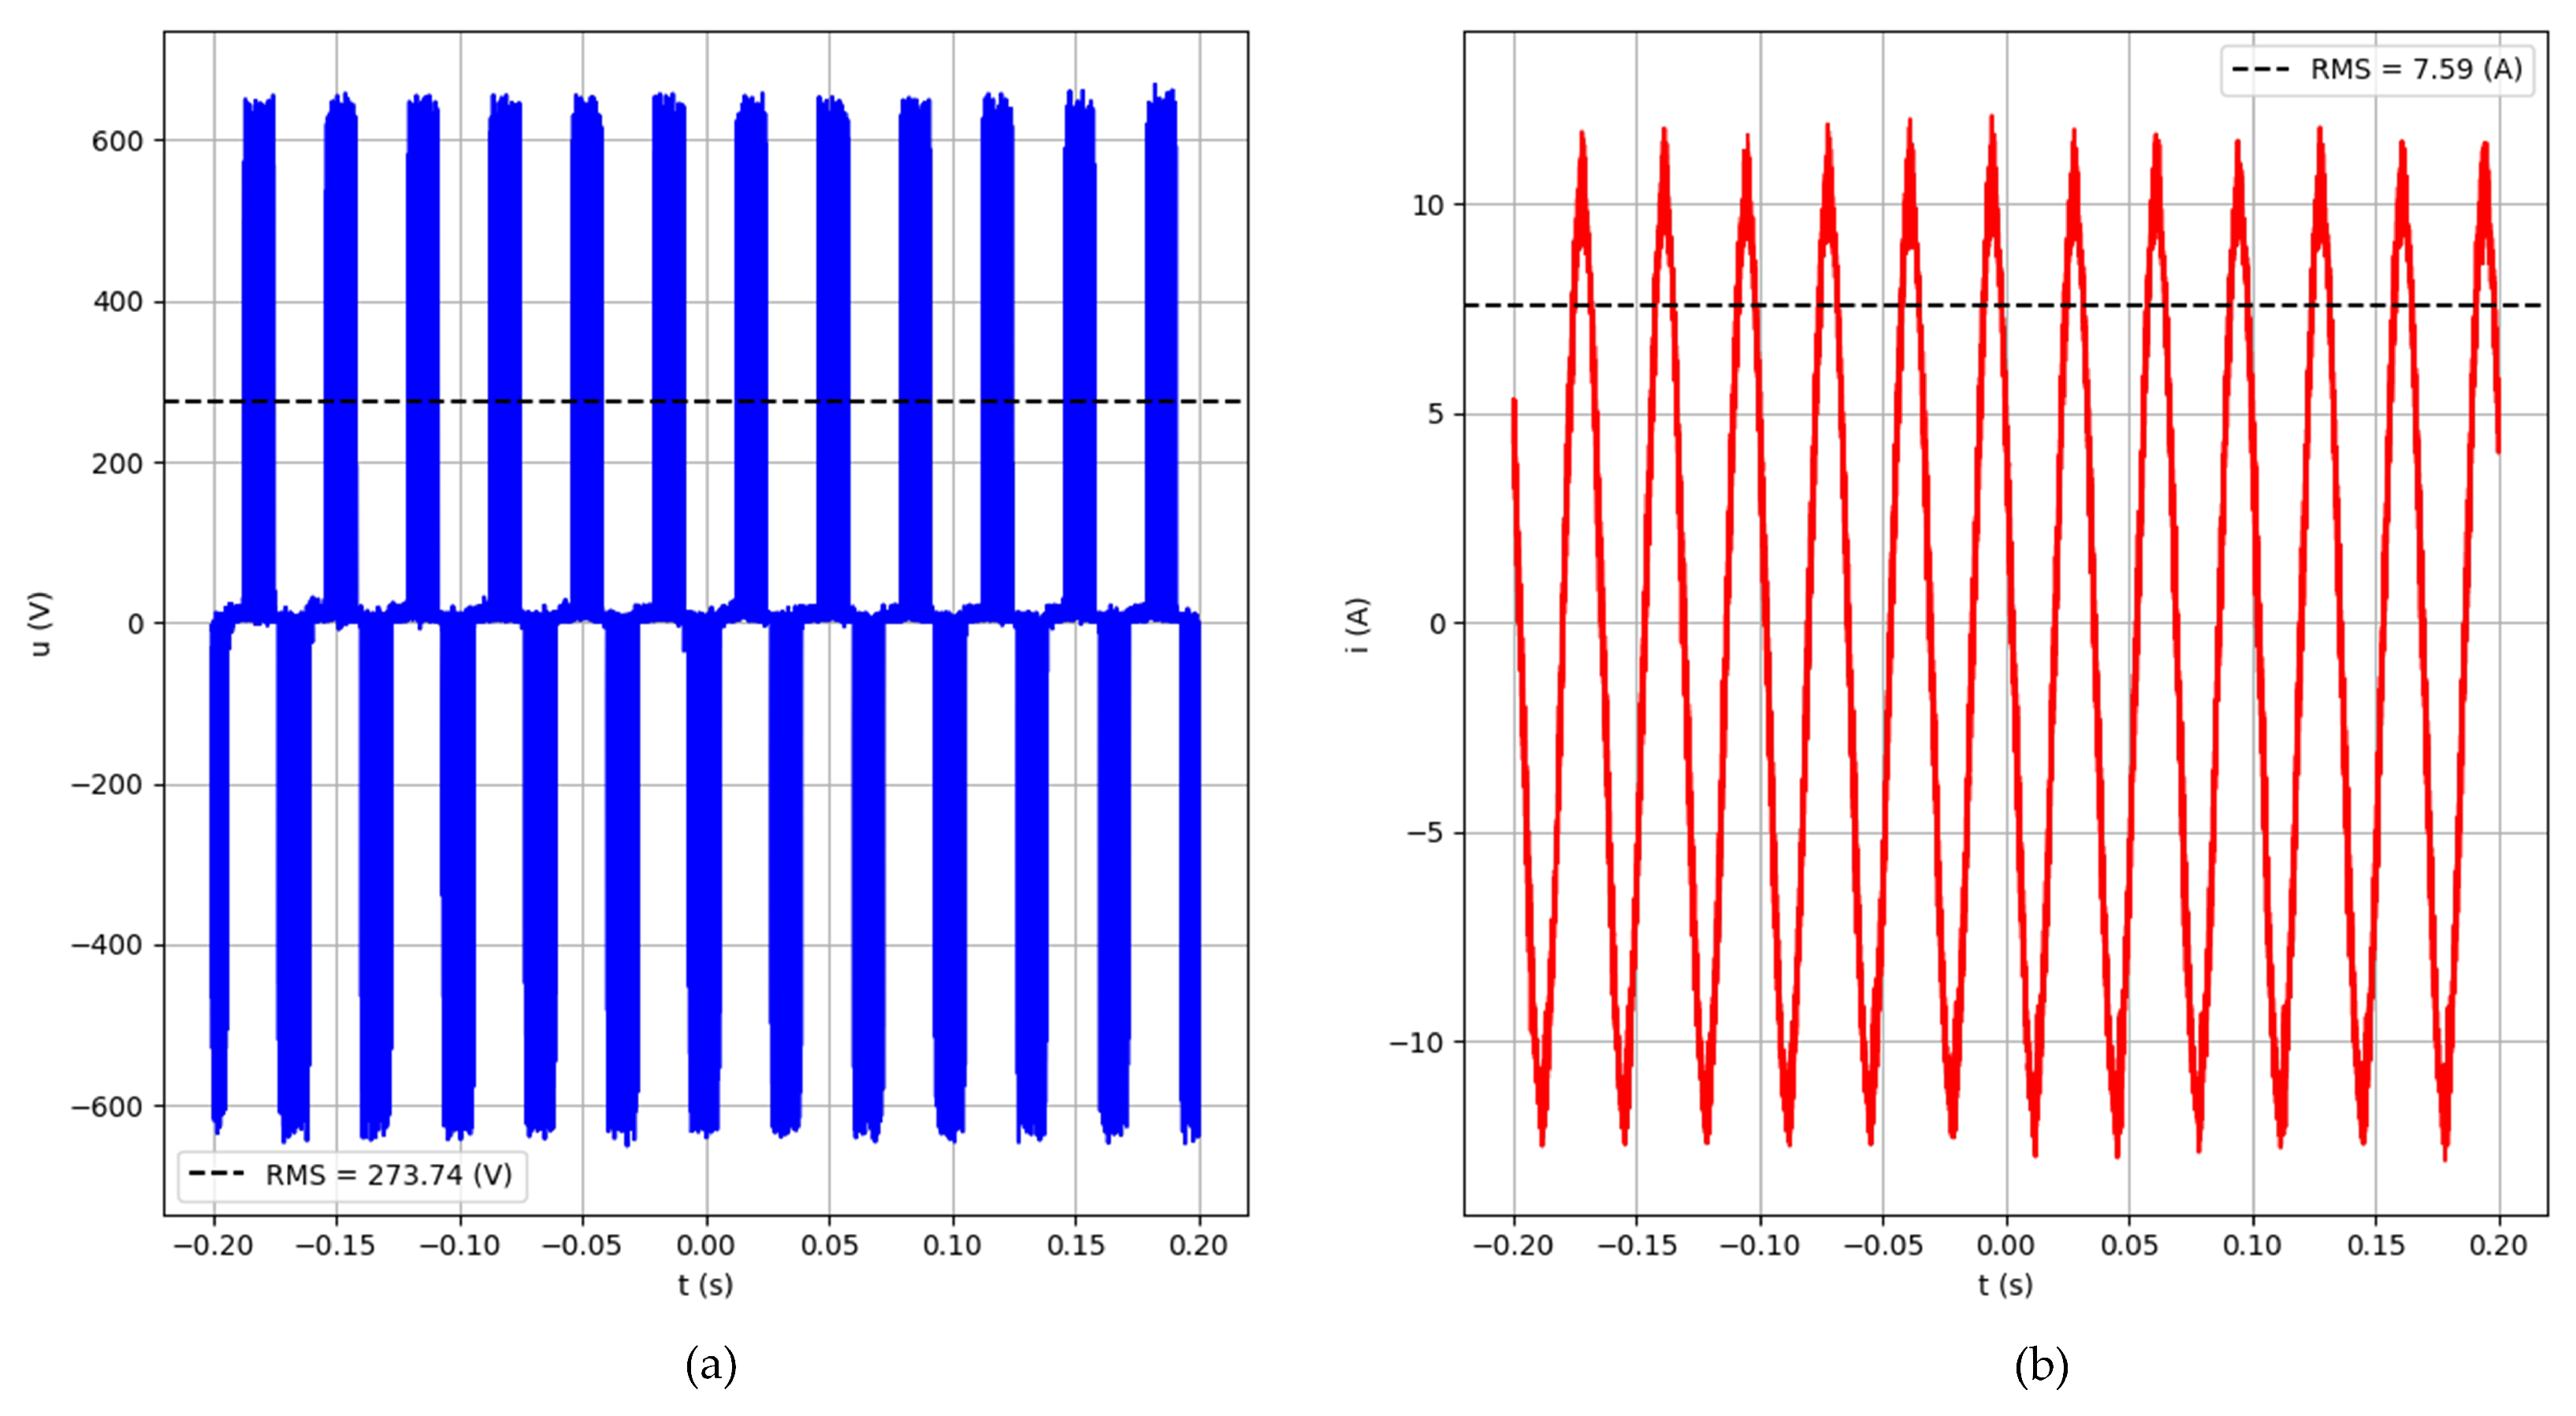
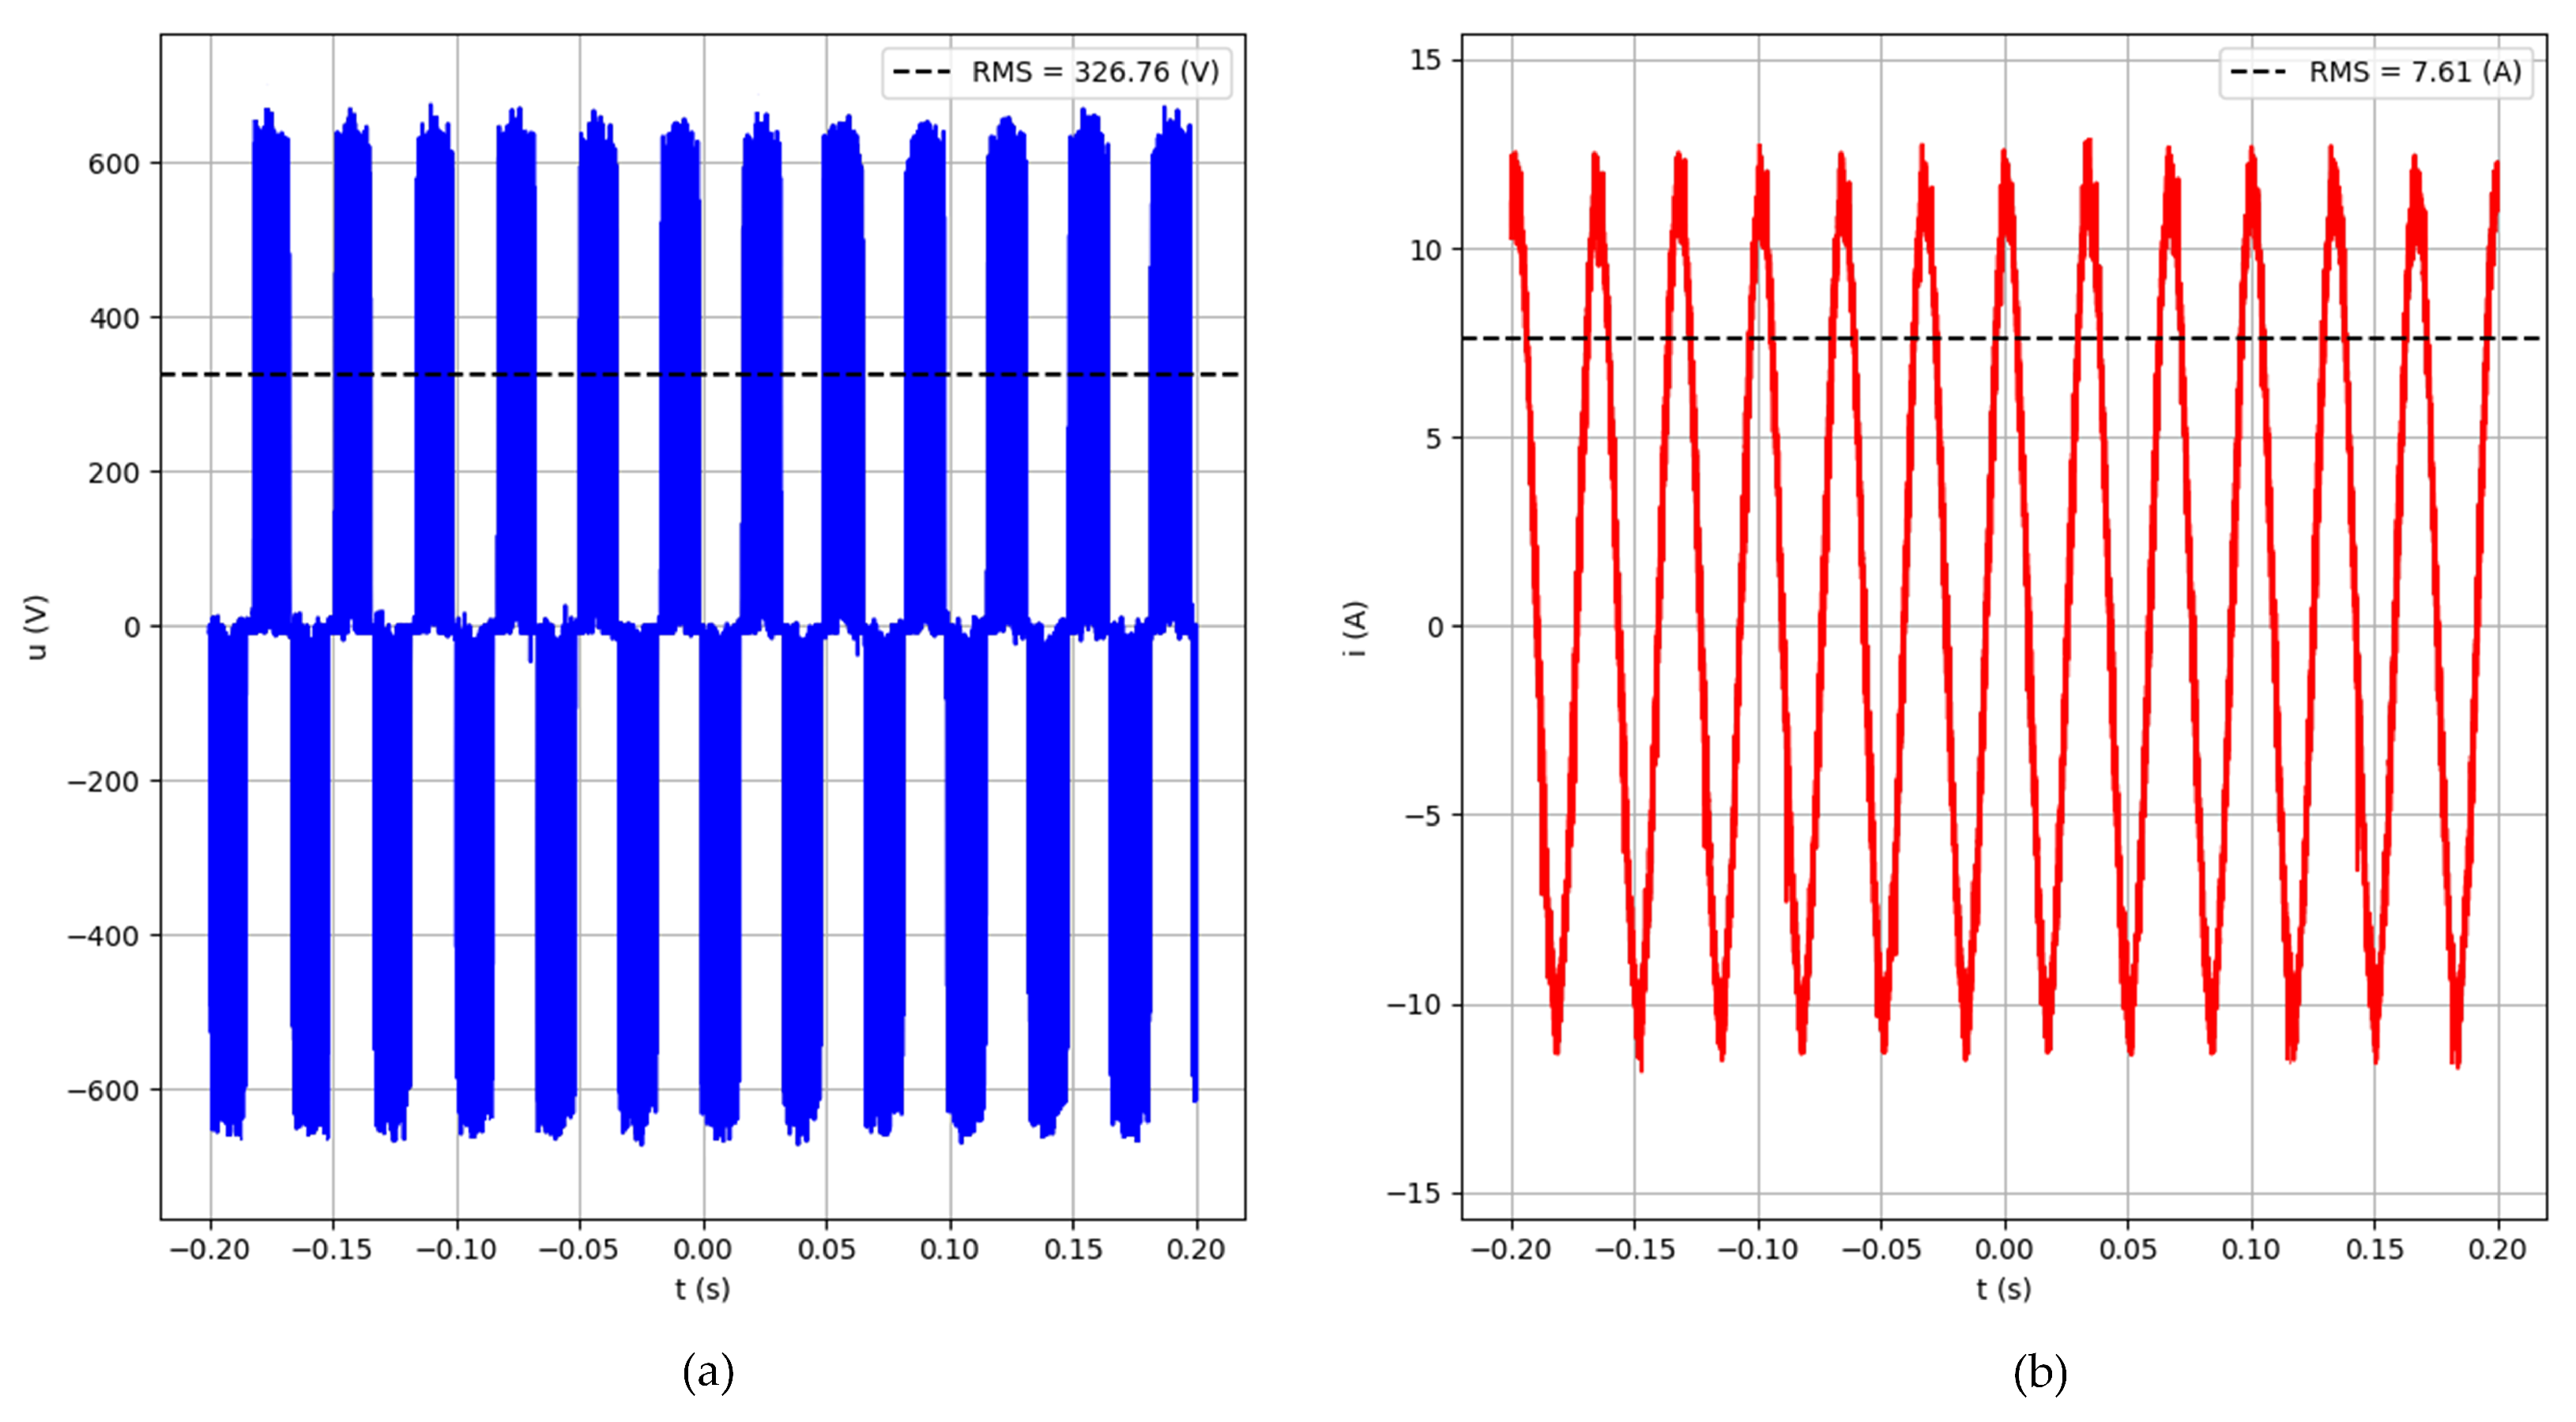
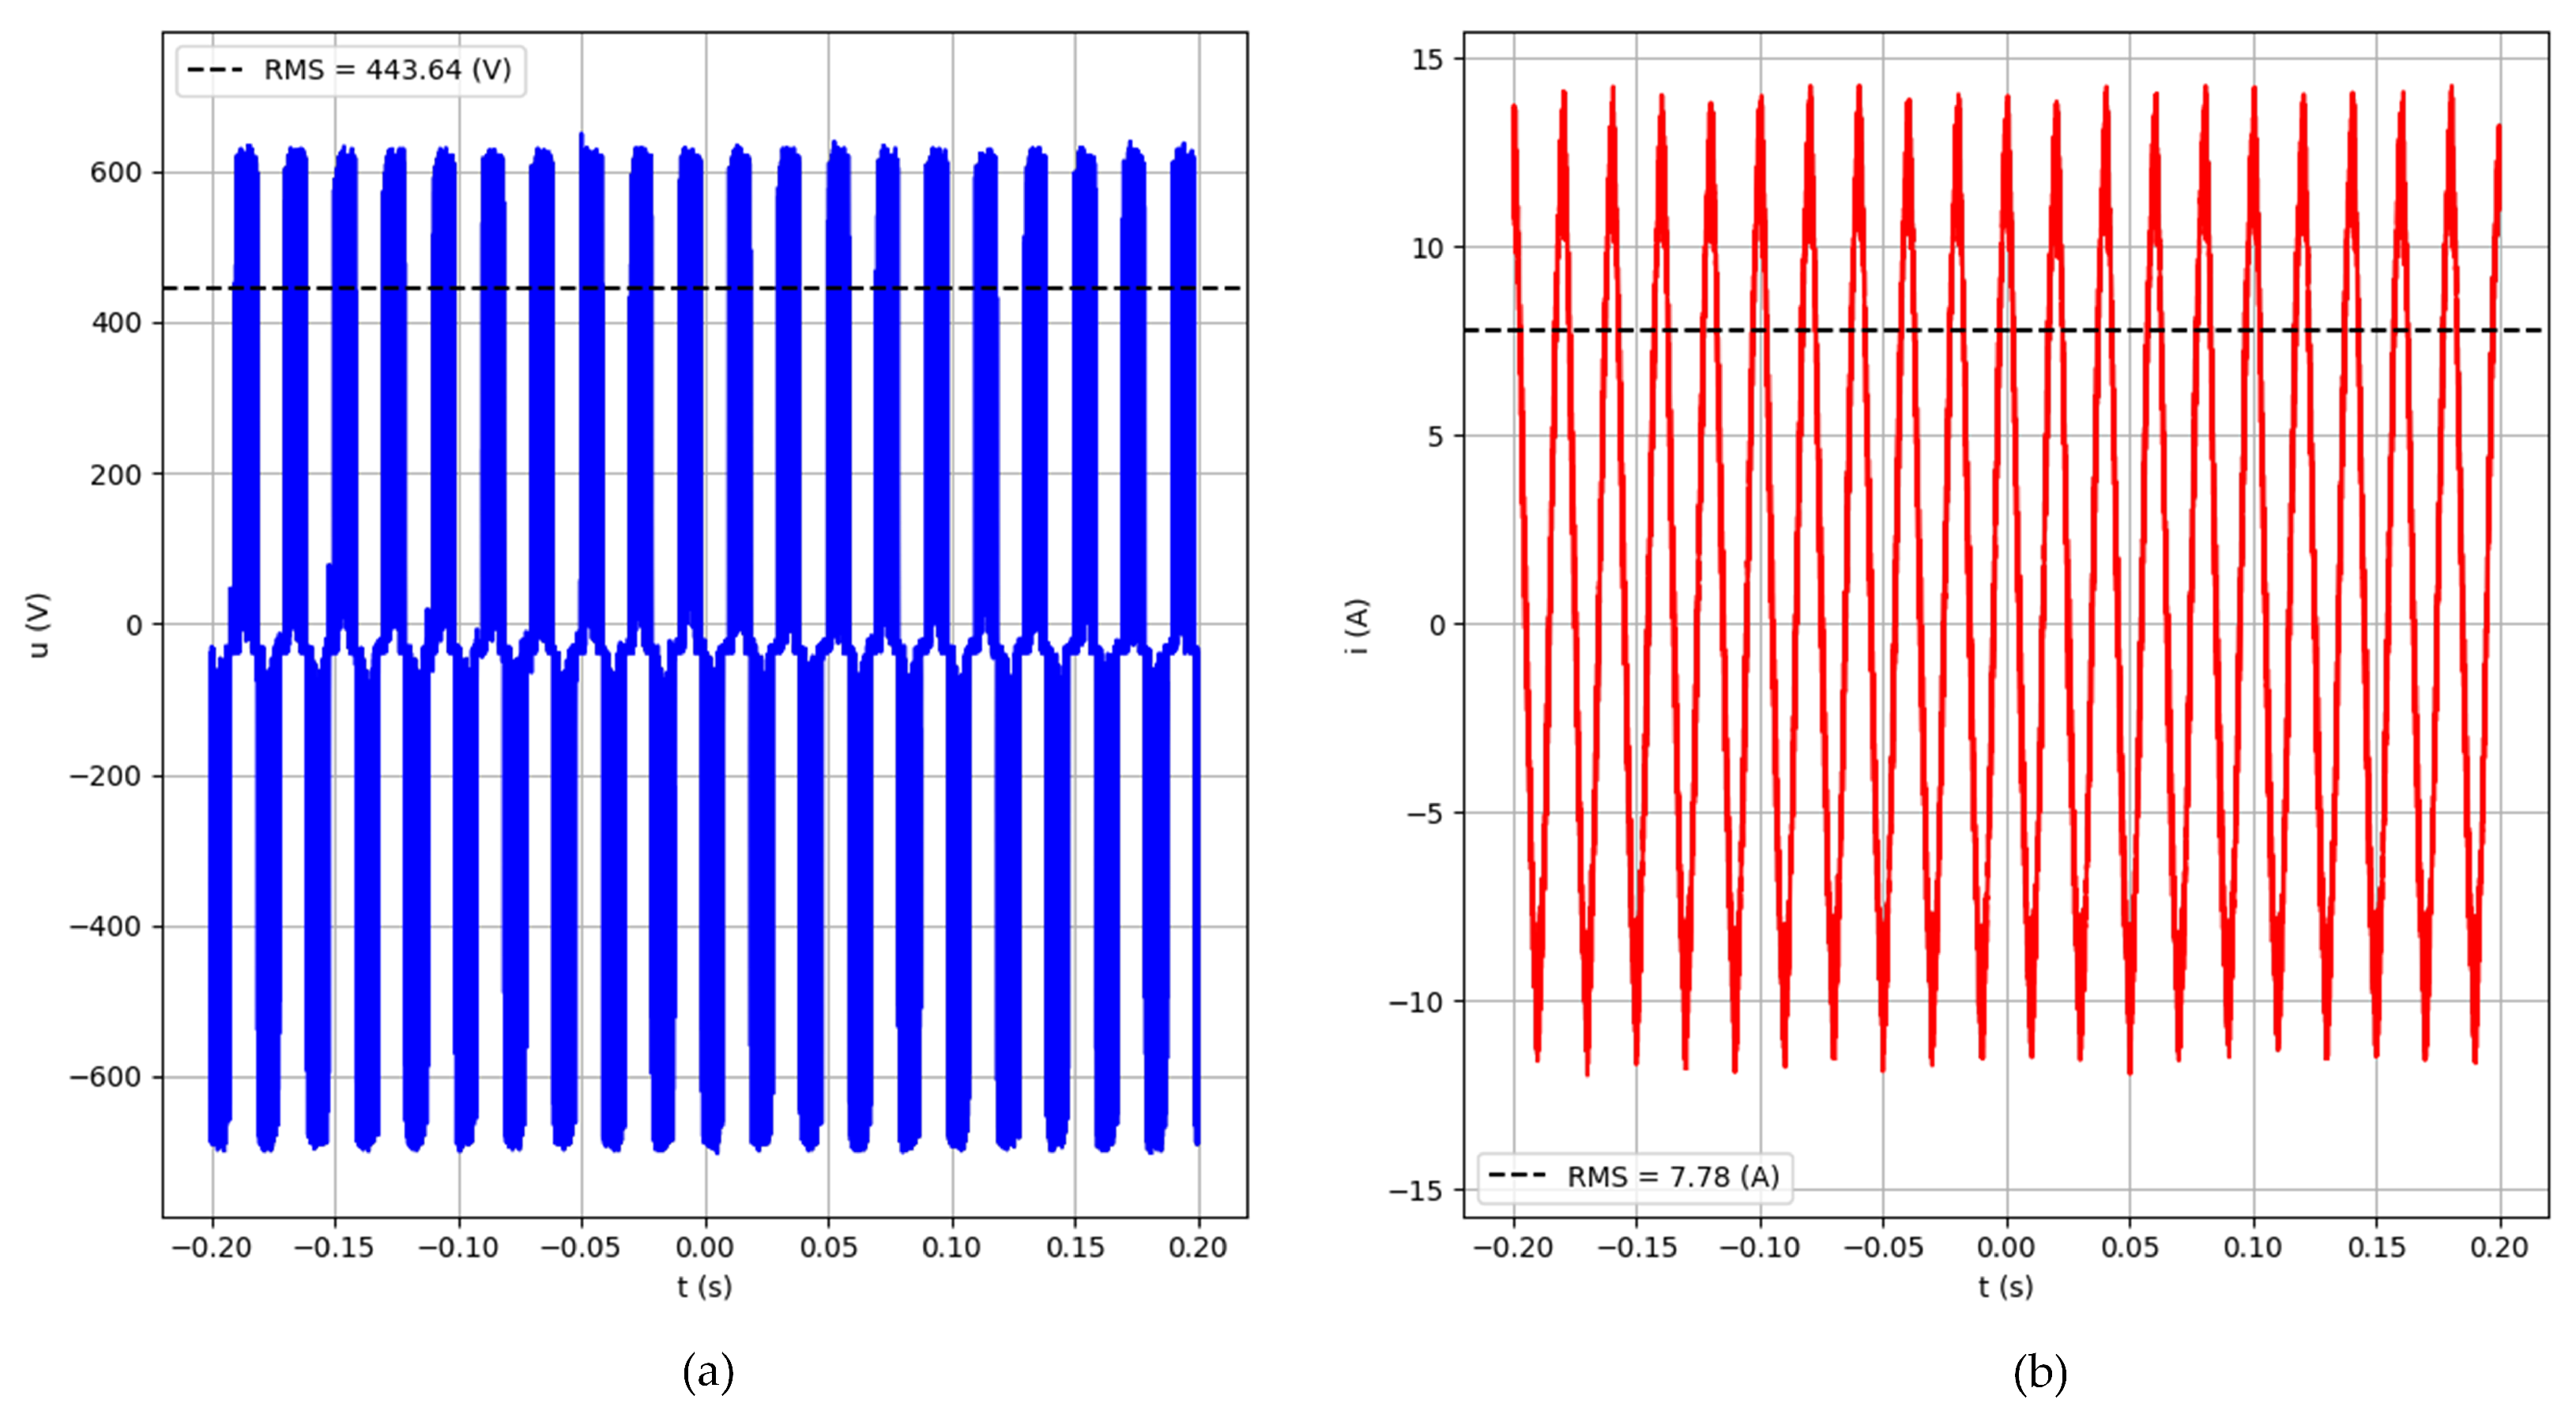
Figure 8 and Figure 9 illustrate sample voltage and current waveforms, respectively, recorded at selected frequencies for a case in which two induction machines functioned as both motor and generator. The waveforms presented herein were obtained at frequencies of 30 Hz and 50 Hz, which resulted in the induction motor rotating at 900 rpm and 1500 rpm, respectively.
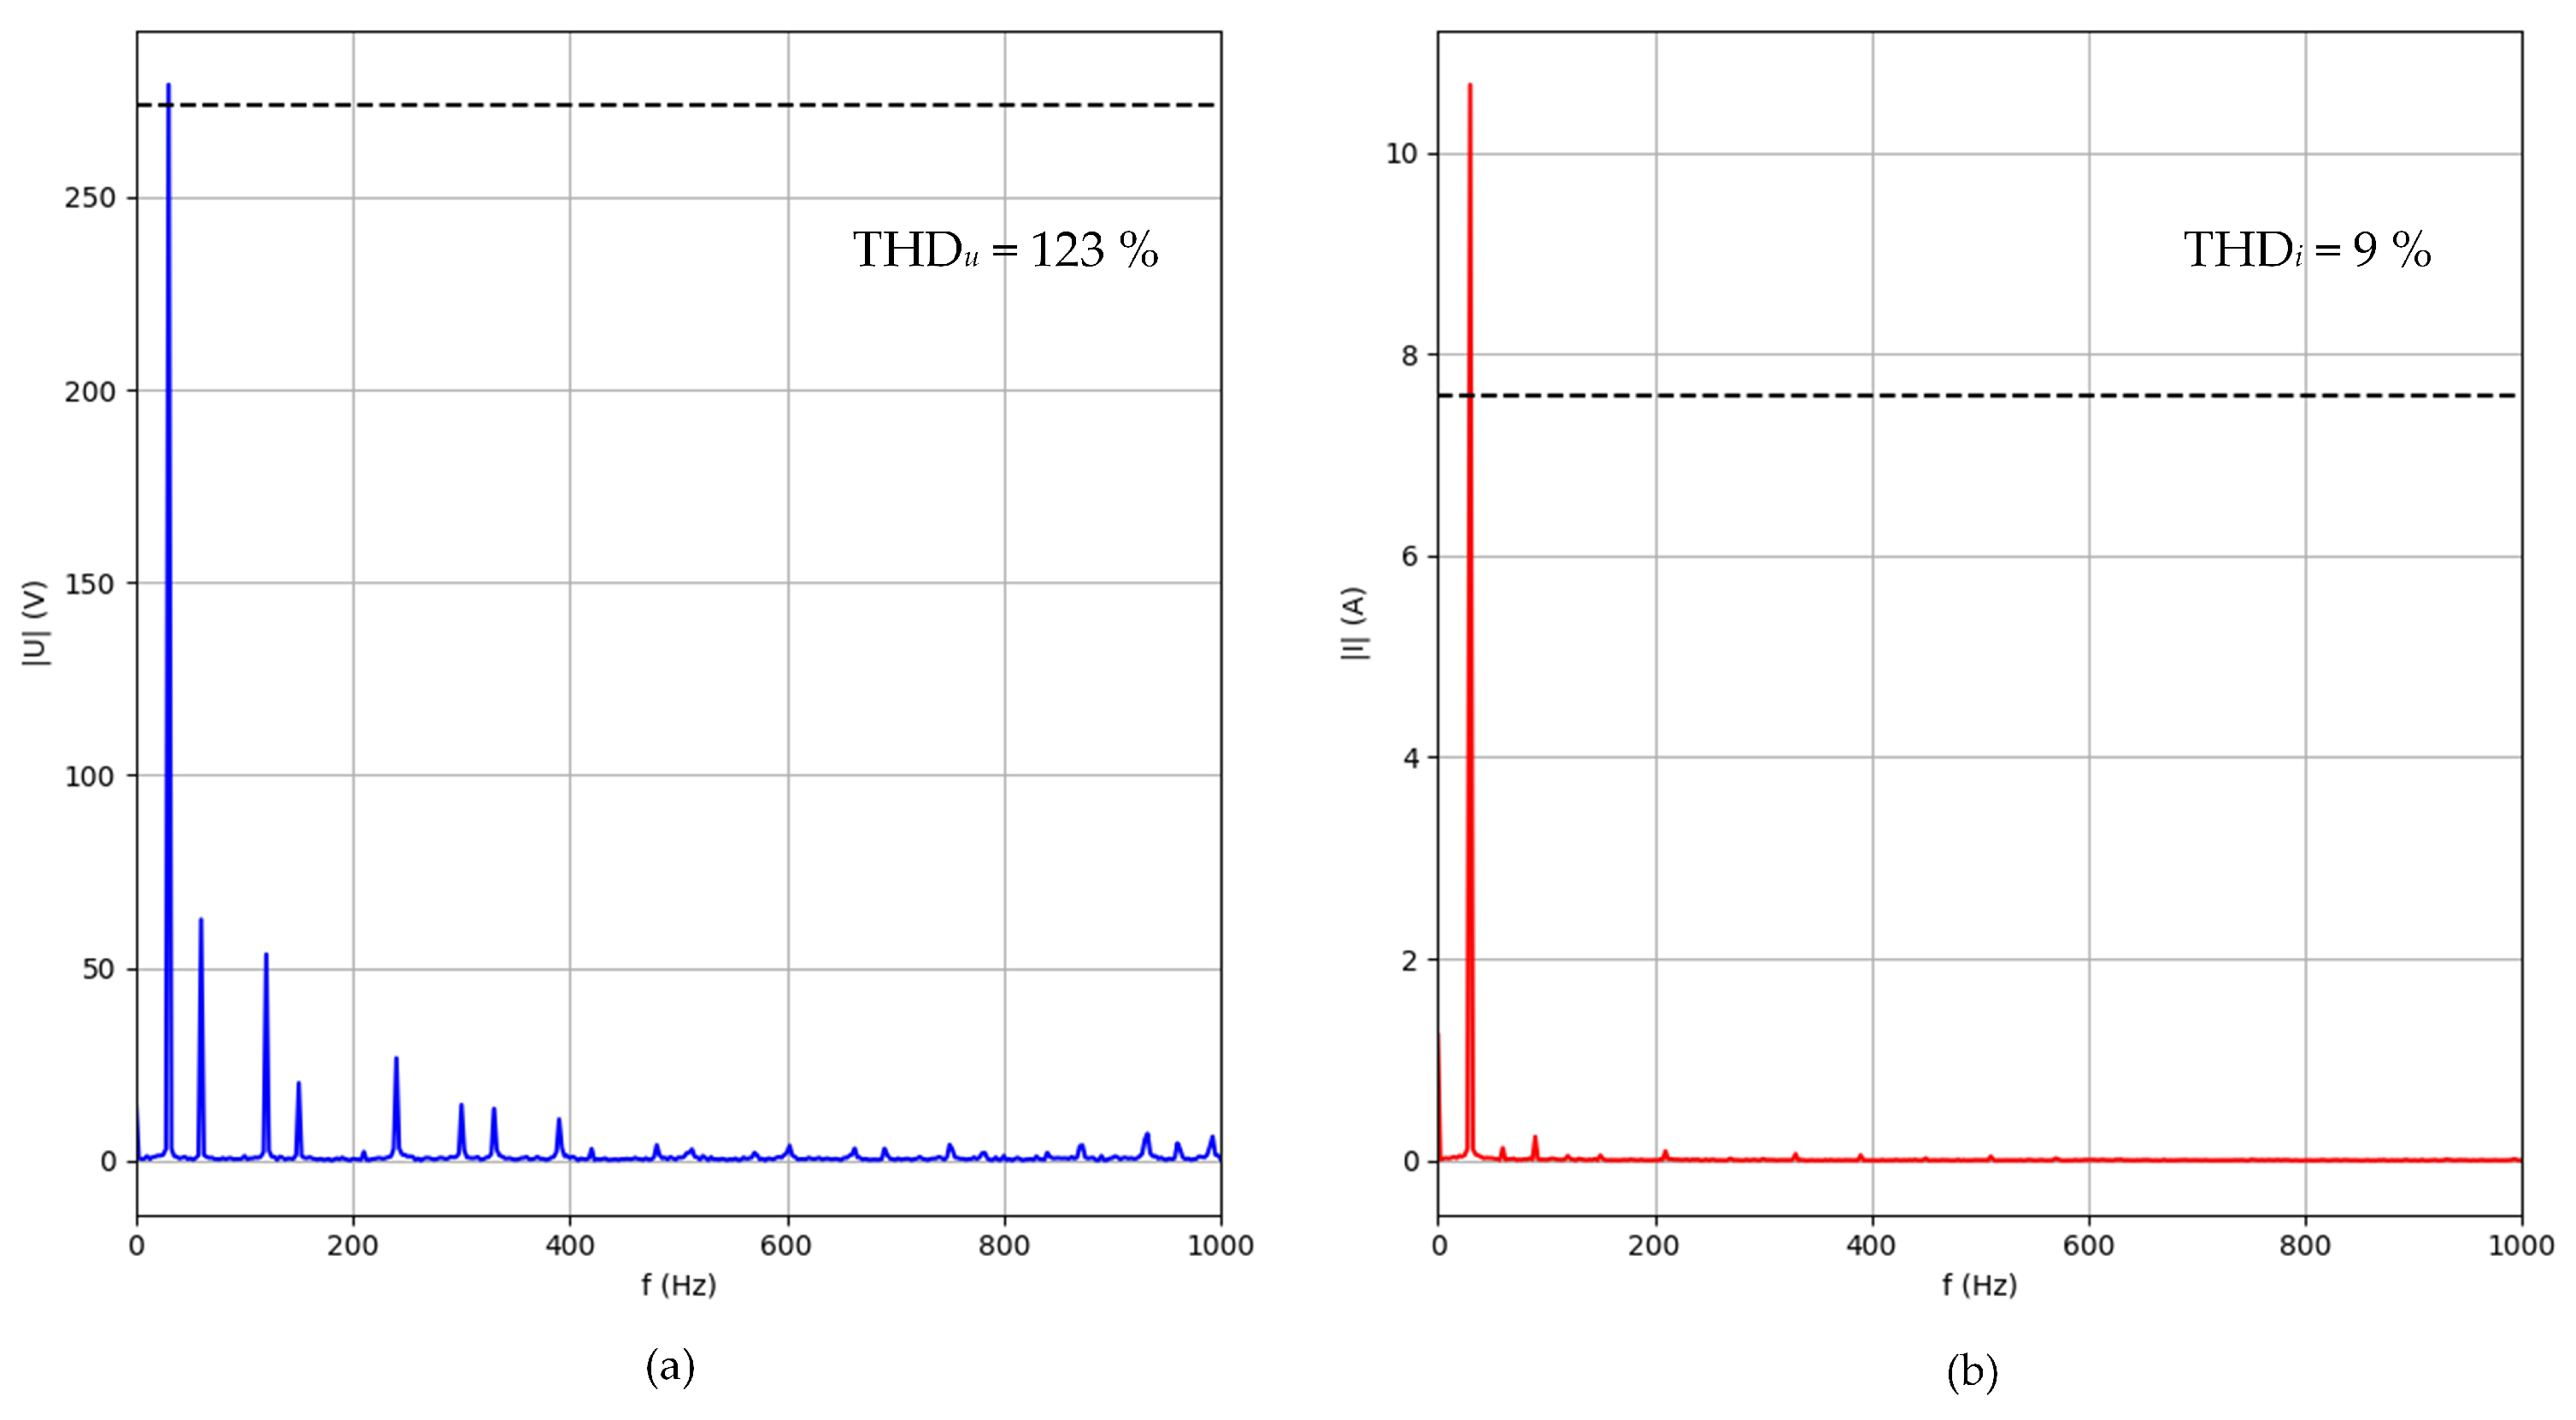
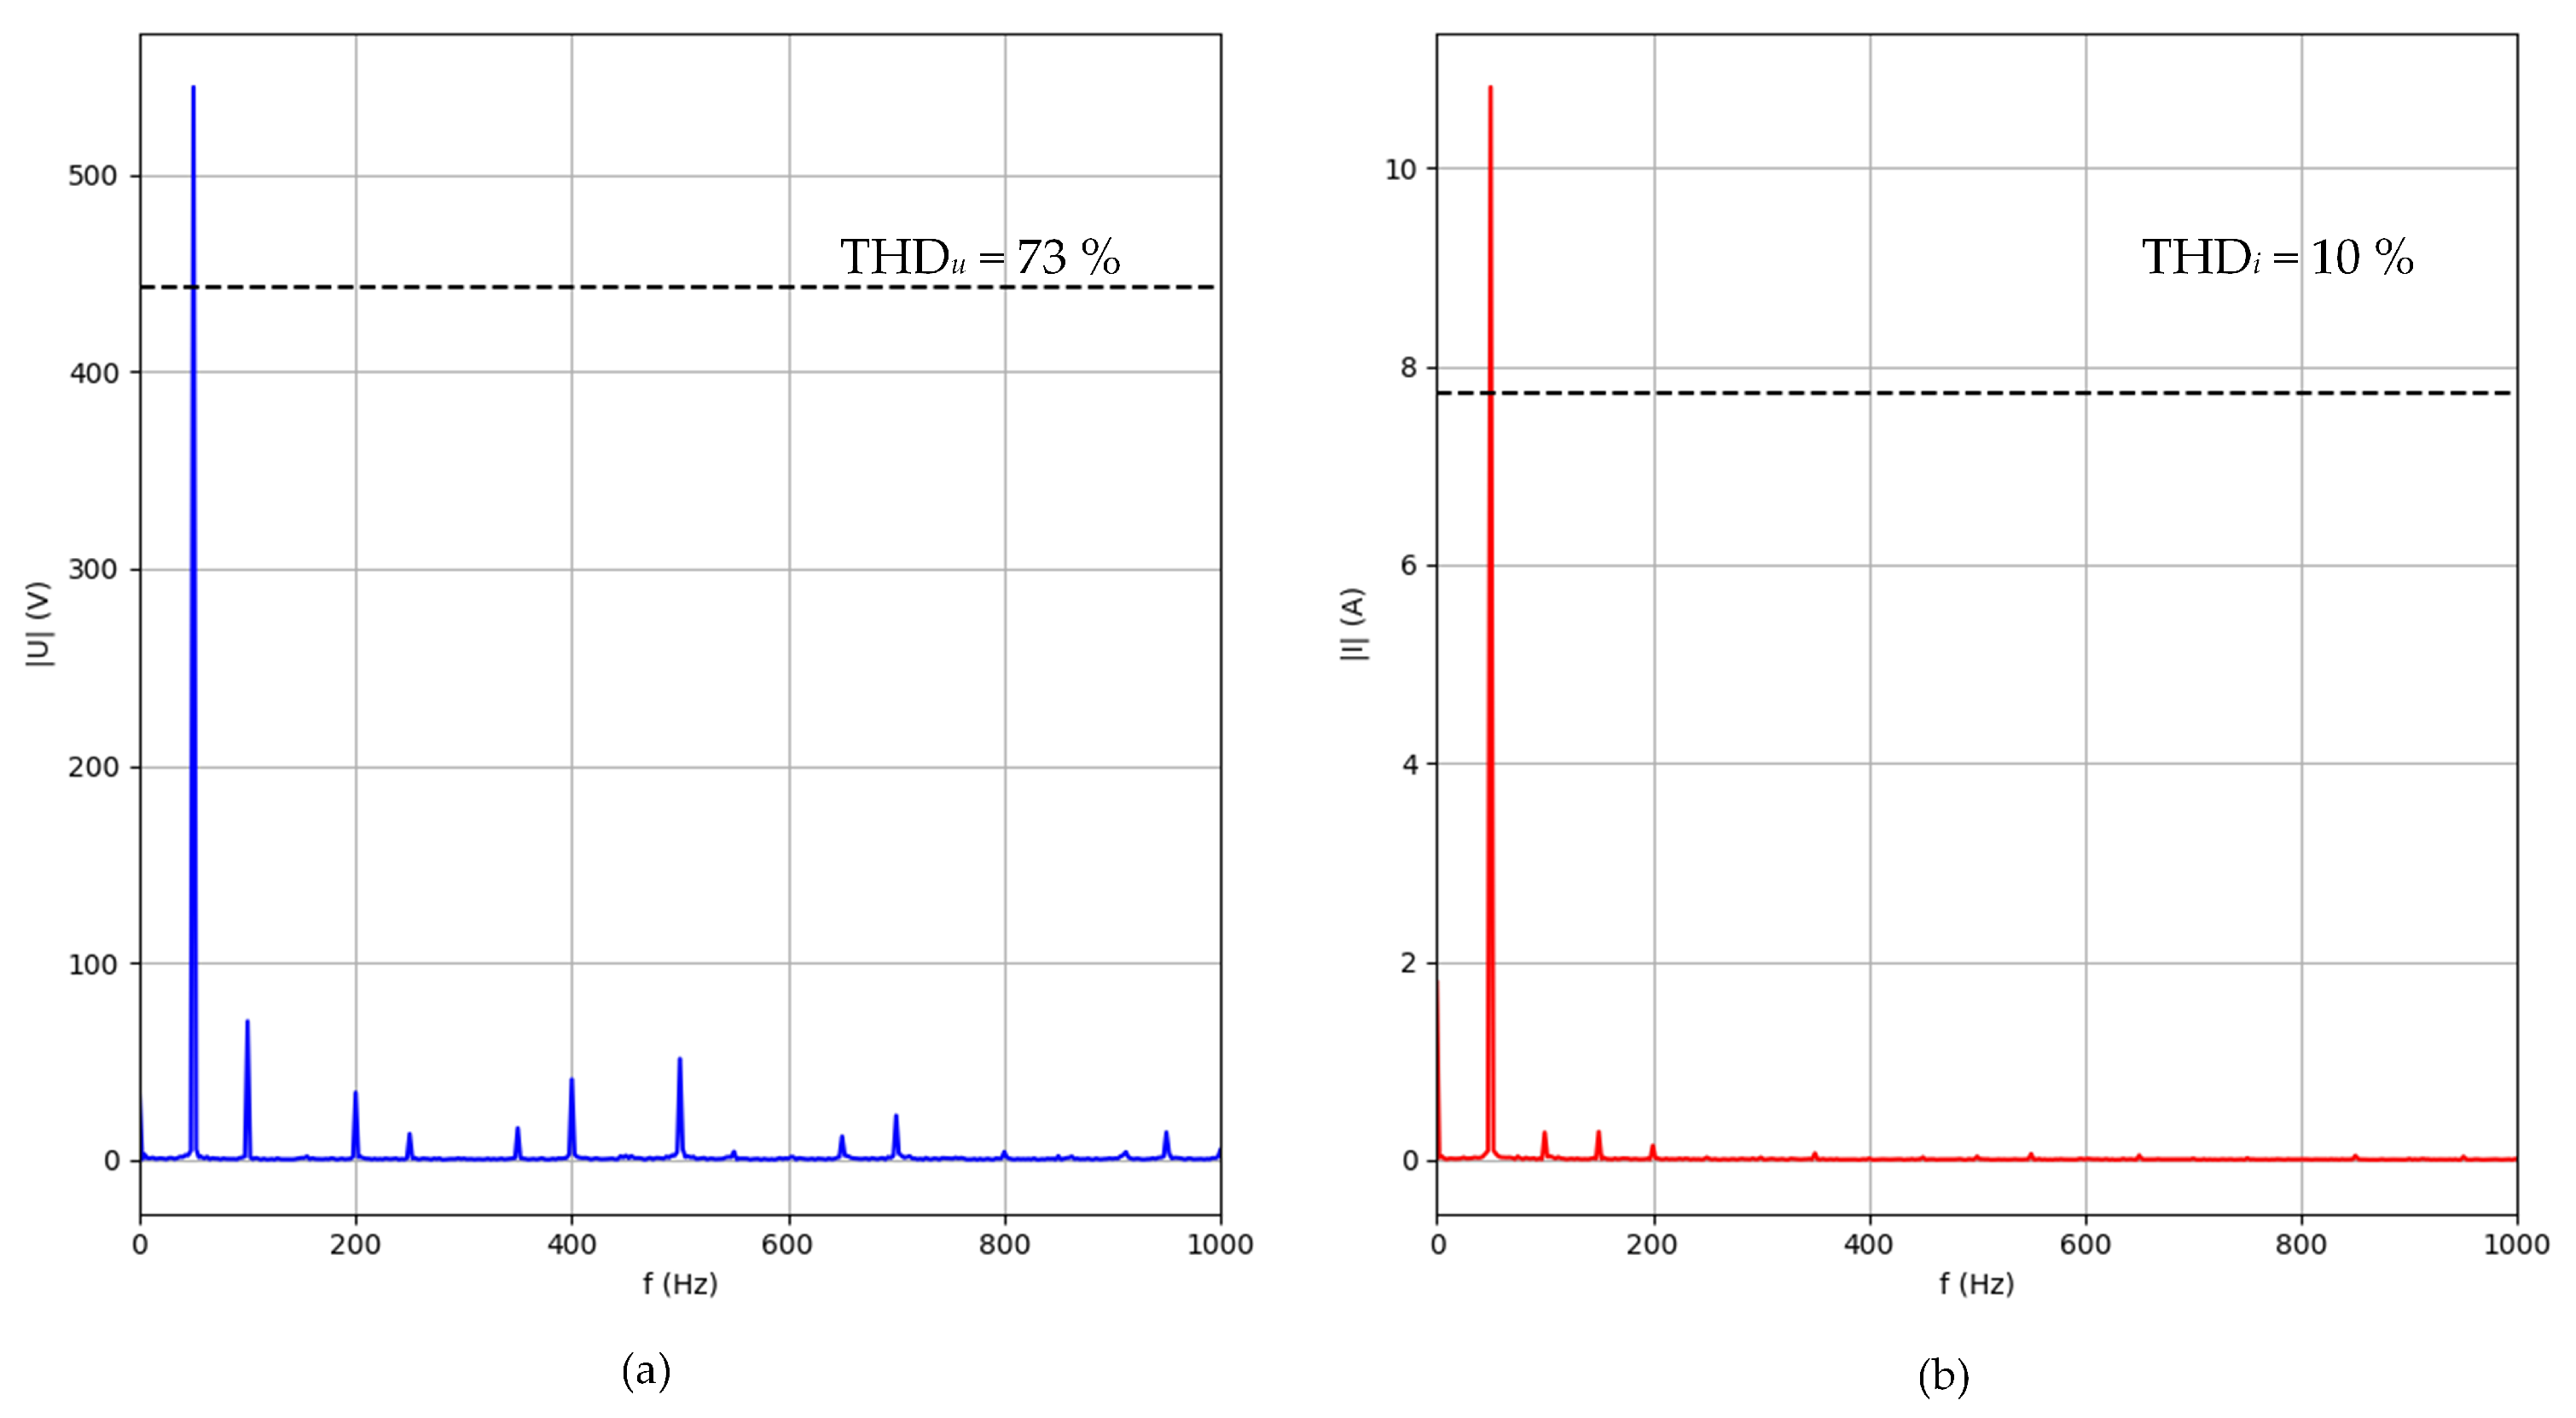
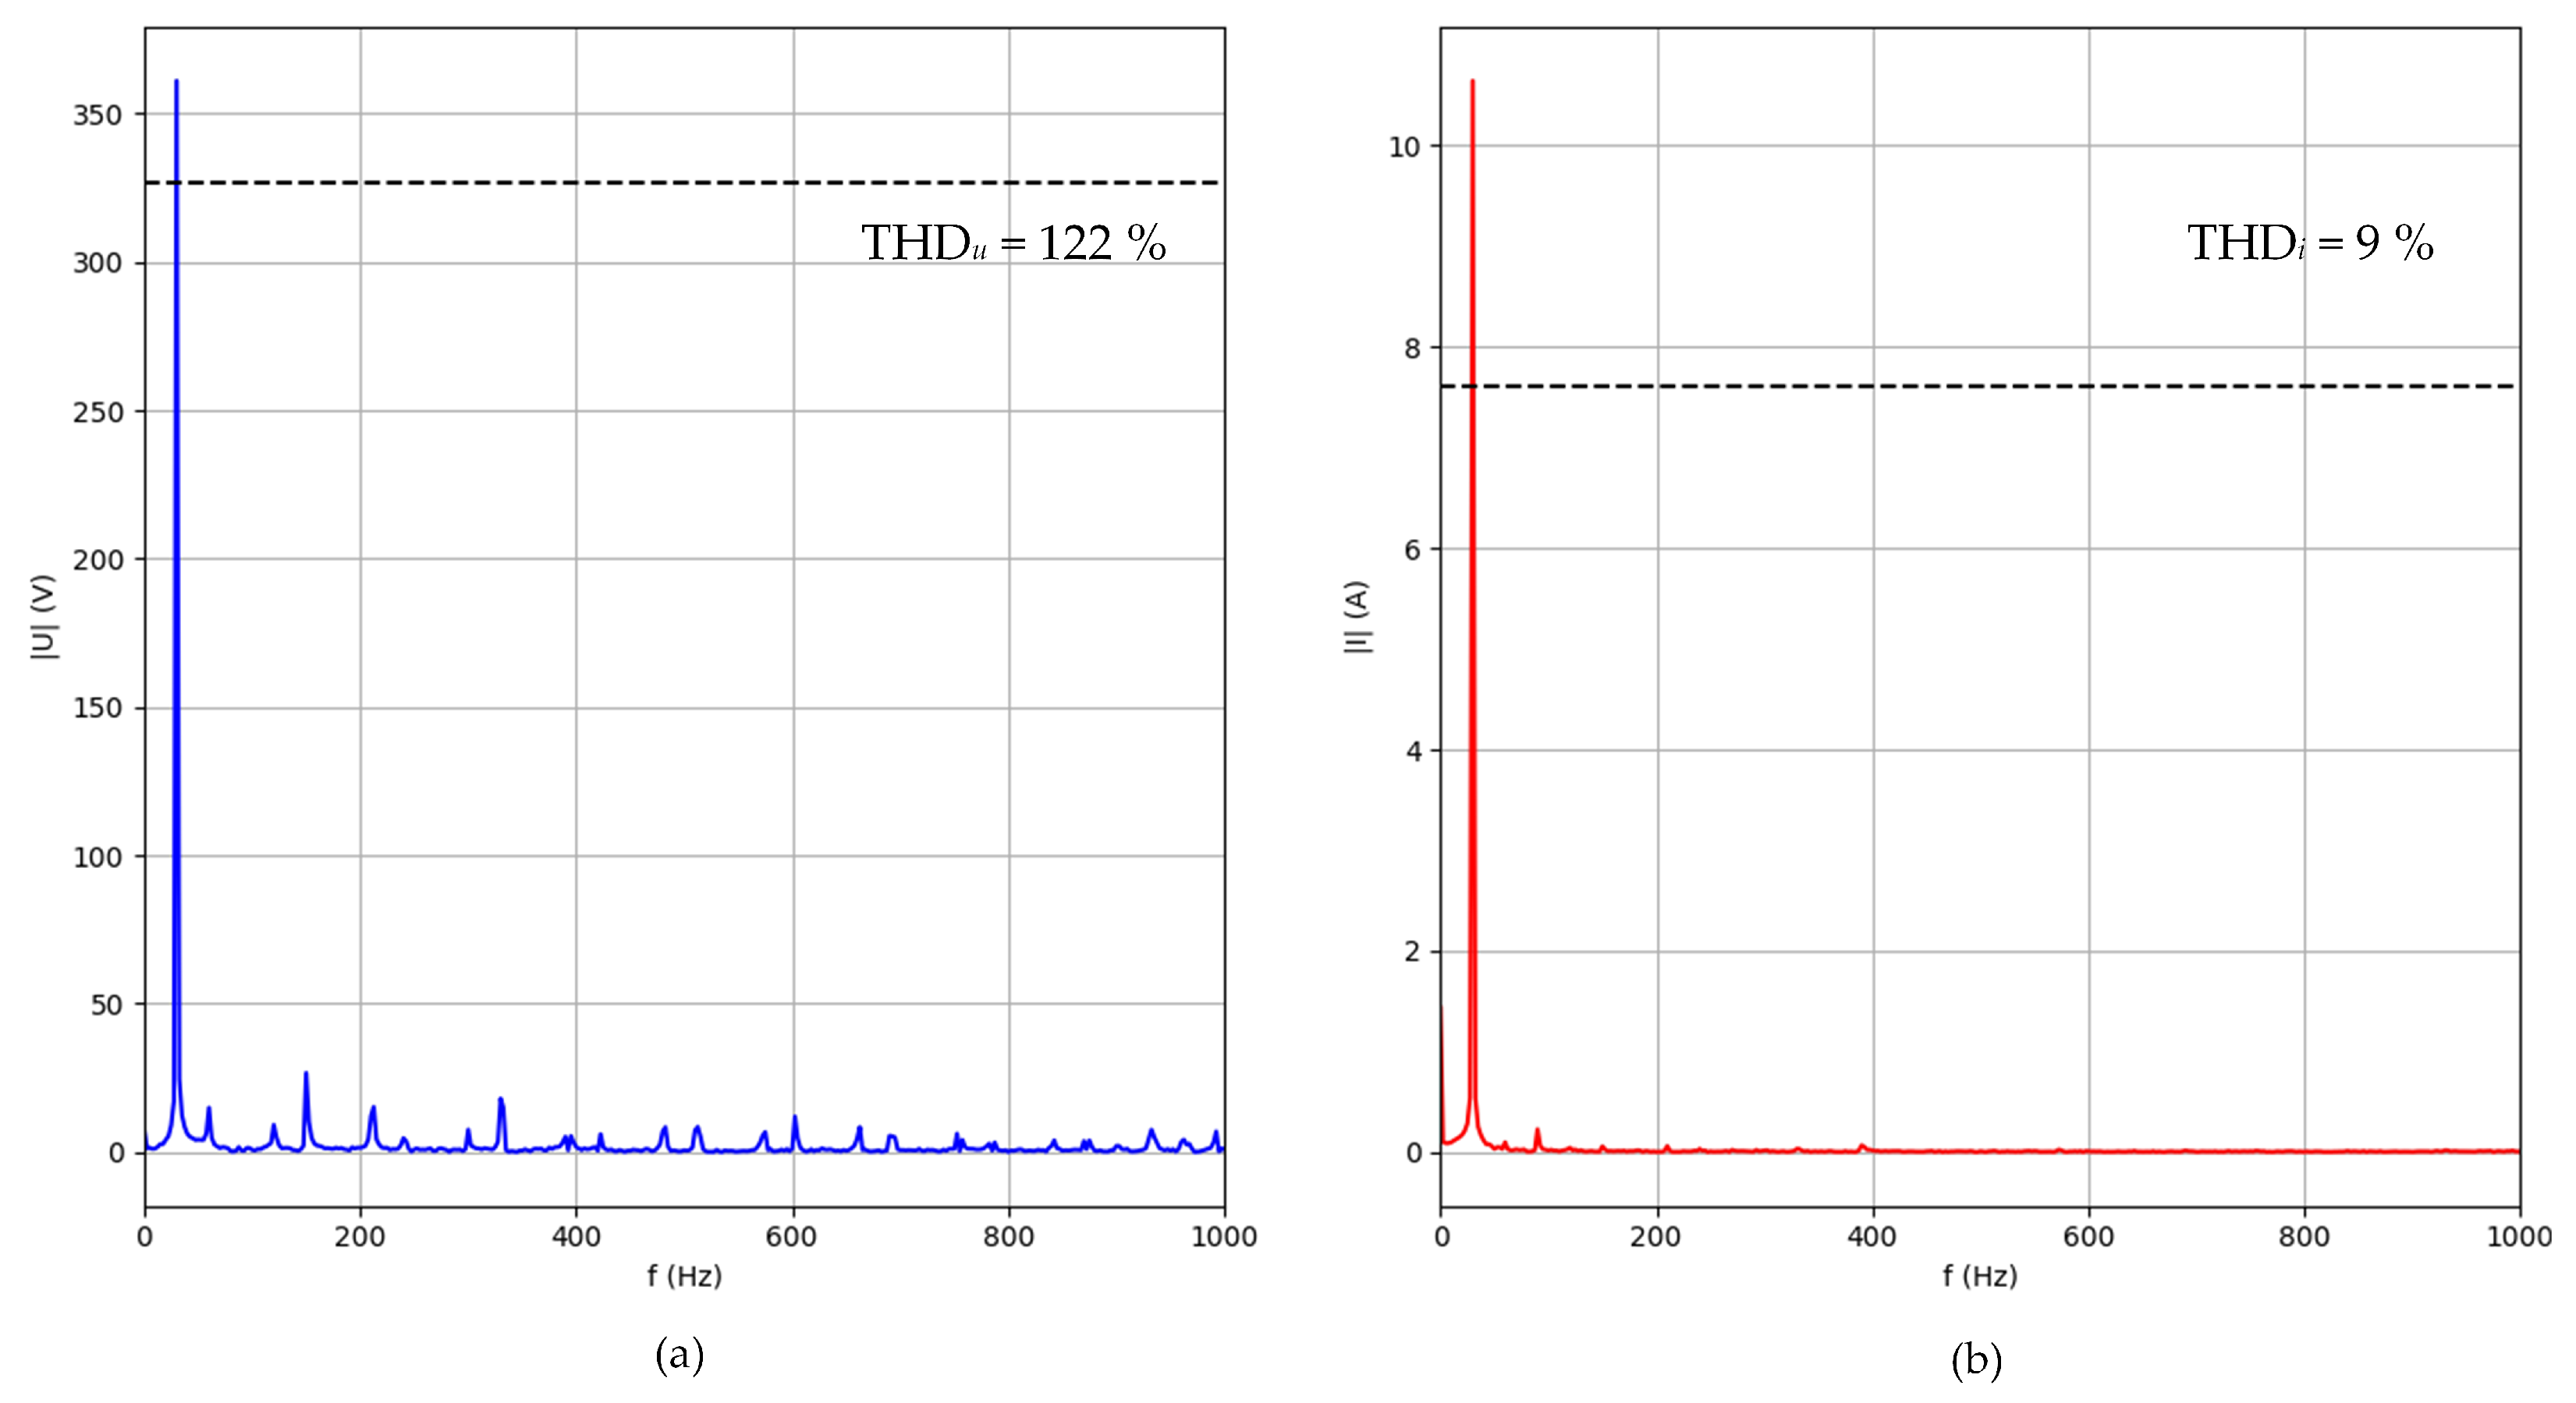
Figure 10 and Figure 11 present the amplitude spectra for the waveforms depicted in Figure 8 and Figure 9, respectively. The spectra were calculated for a band of 1 kHz, a consequence of the fact that, in accordance with the standard for vibriodiagnostic measurements, vibrations are recorded in this band.
The voltage and current waveforms (Figure 12 and Figure 13) and their respective spectra (Figure 14 and Figure 15) are presented for the same frequencies in the scenario where the generator was a synchronous machine.
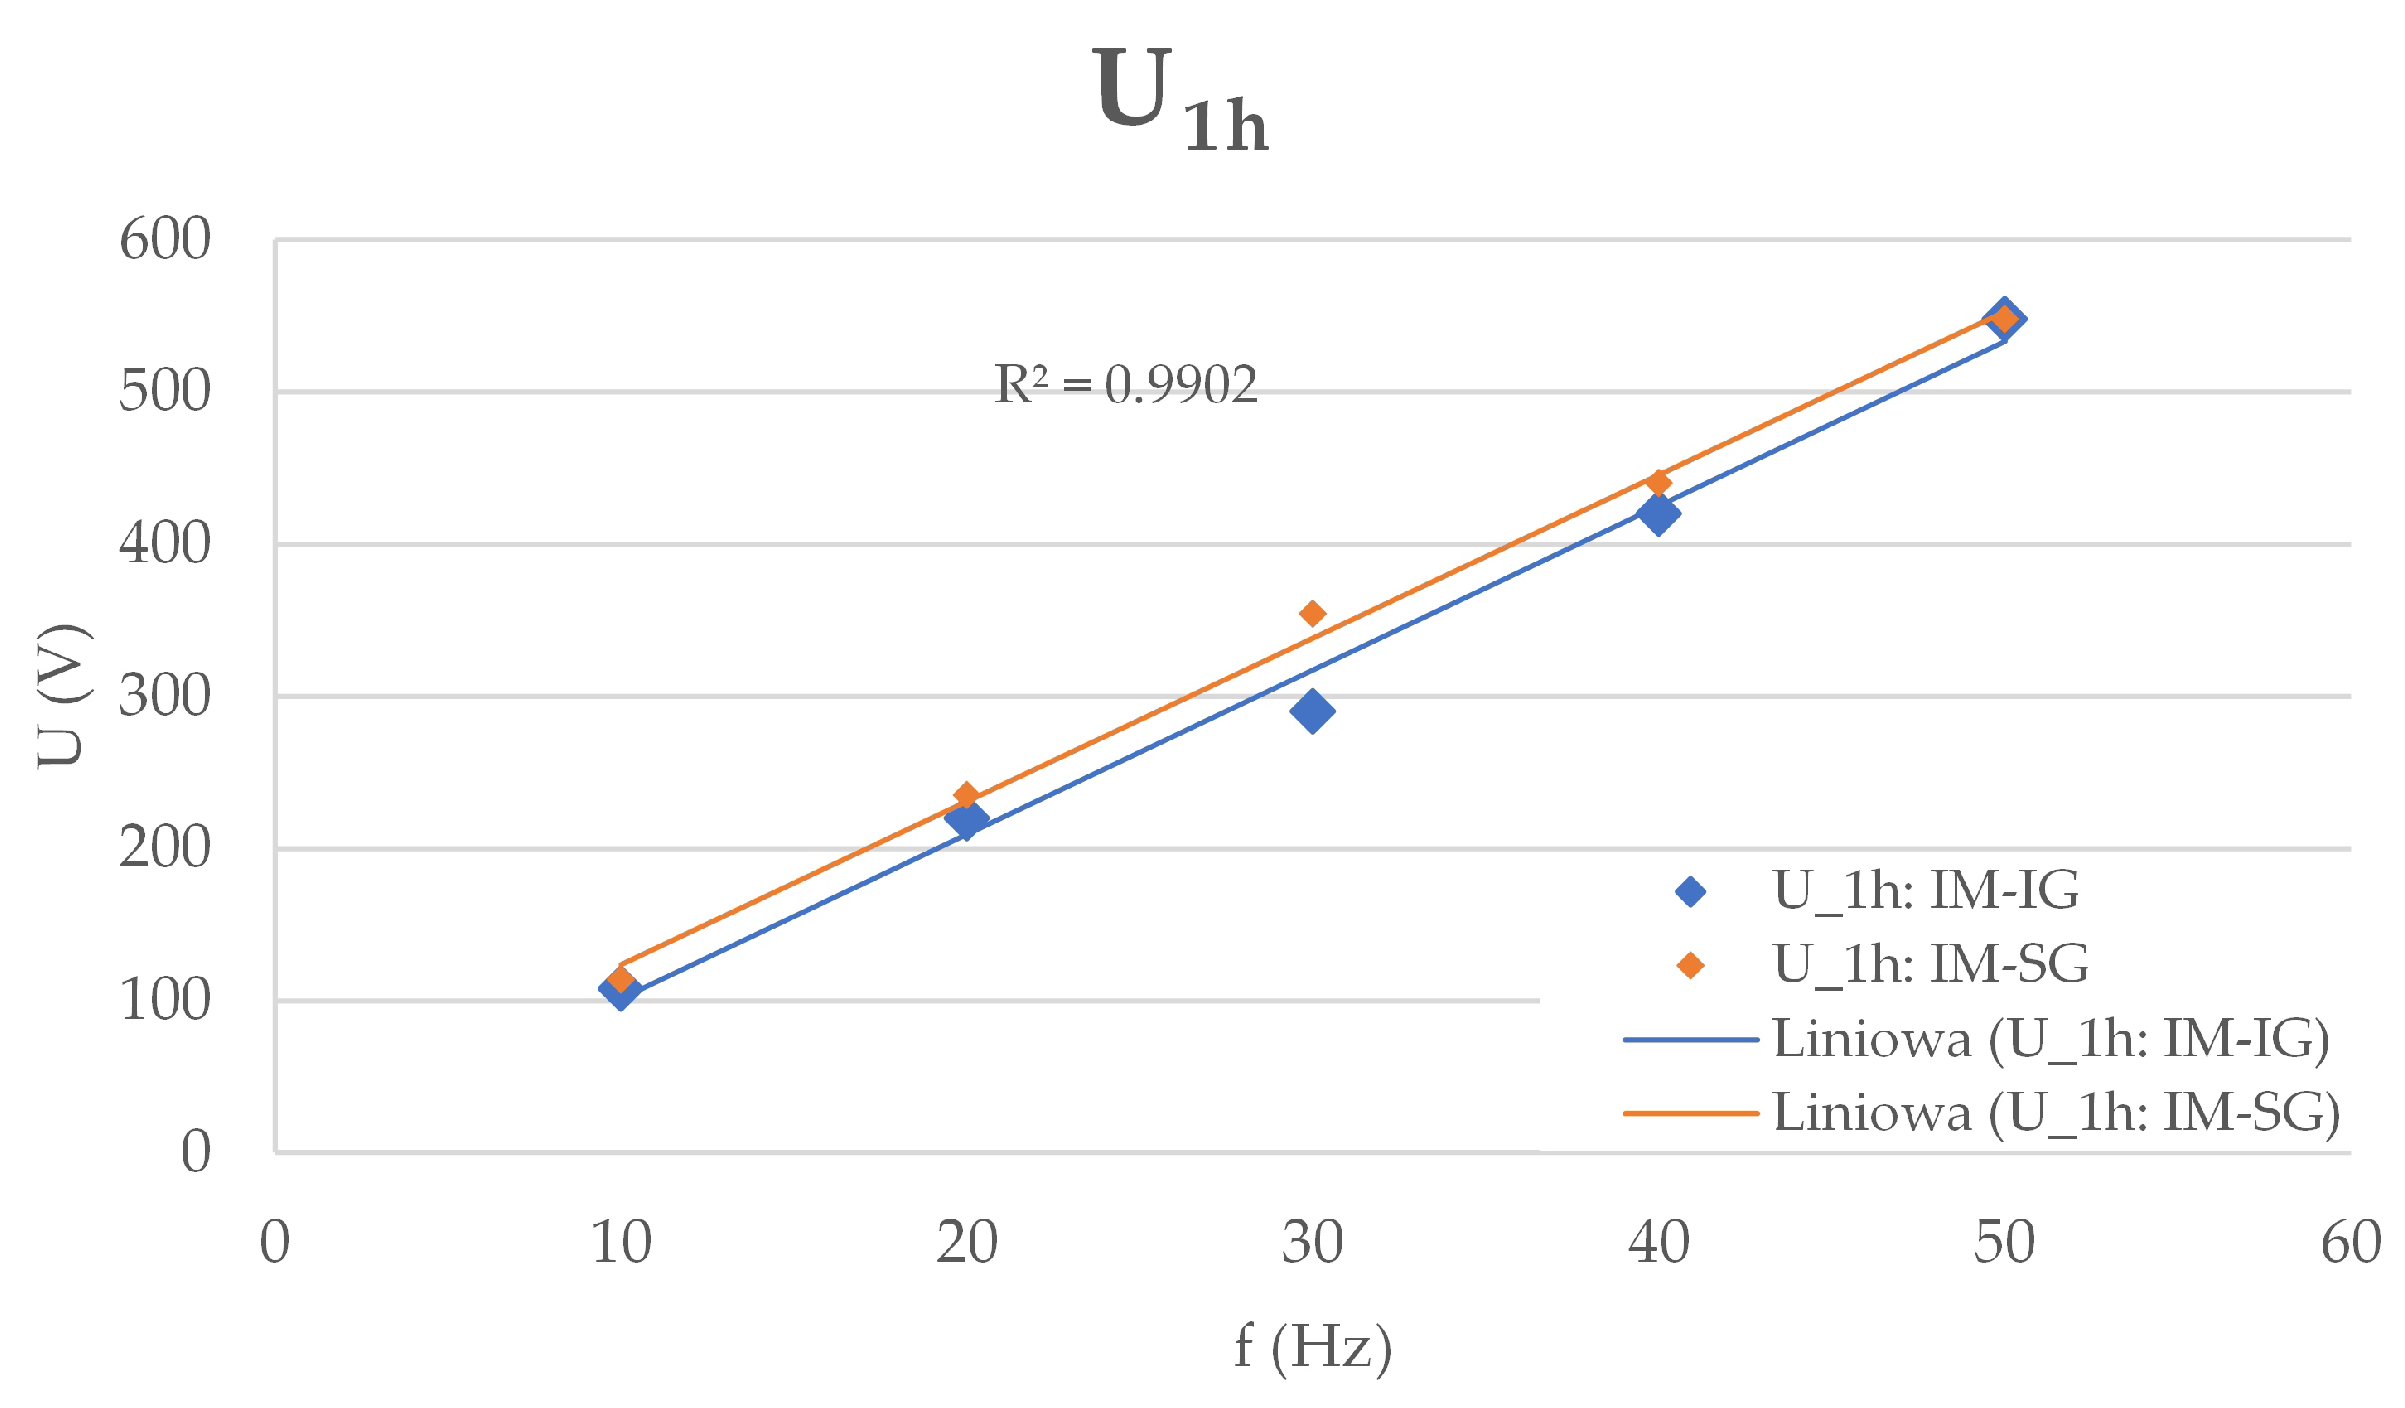
In the subsequent stage of the analysis, a comparison was made of the changes in RMS and Total Harmonic Distortion (THD) values for the selected voltage and current supplying the motor in the tested system. Figure 16 demonstrates the alteration in the value of the fundamental harmonic of supply voltage as a function of supply voltage frequency. The following abbreviations have been placed in the characteristics: the acronyms IM, IG, and SG are used to denote induction motor, induction generator, and synchronous generator, respectively.
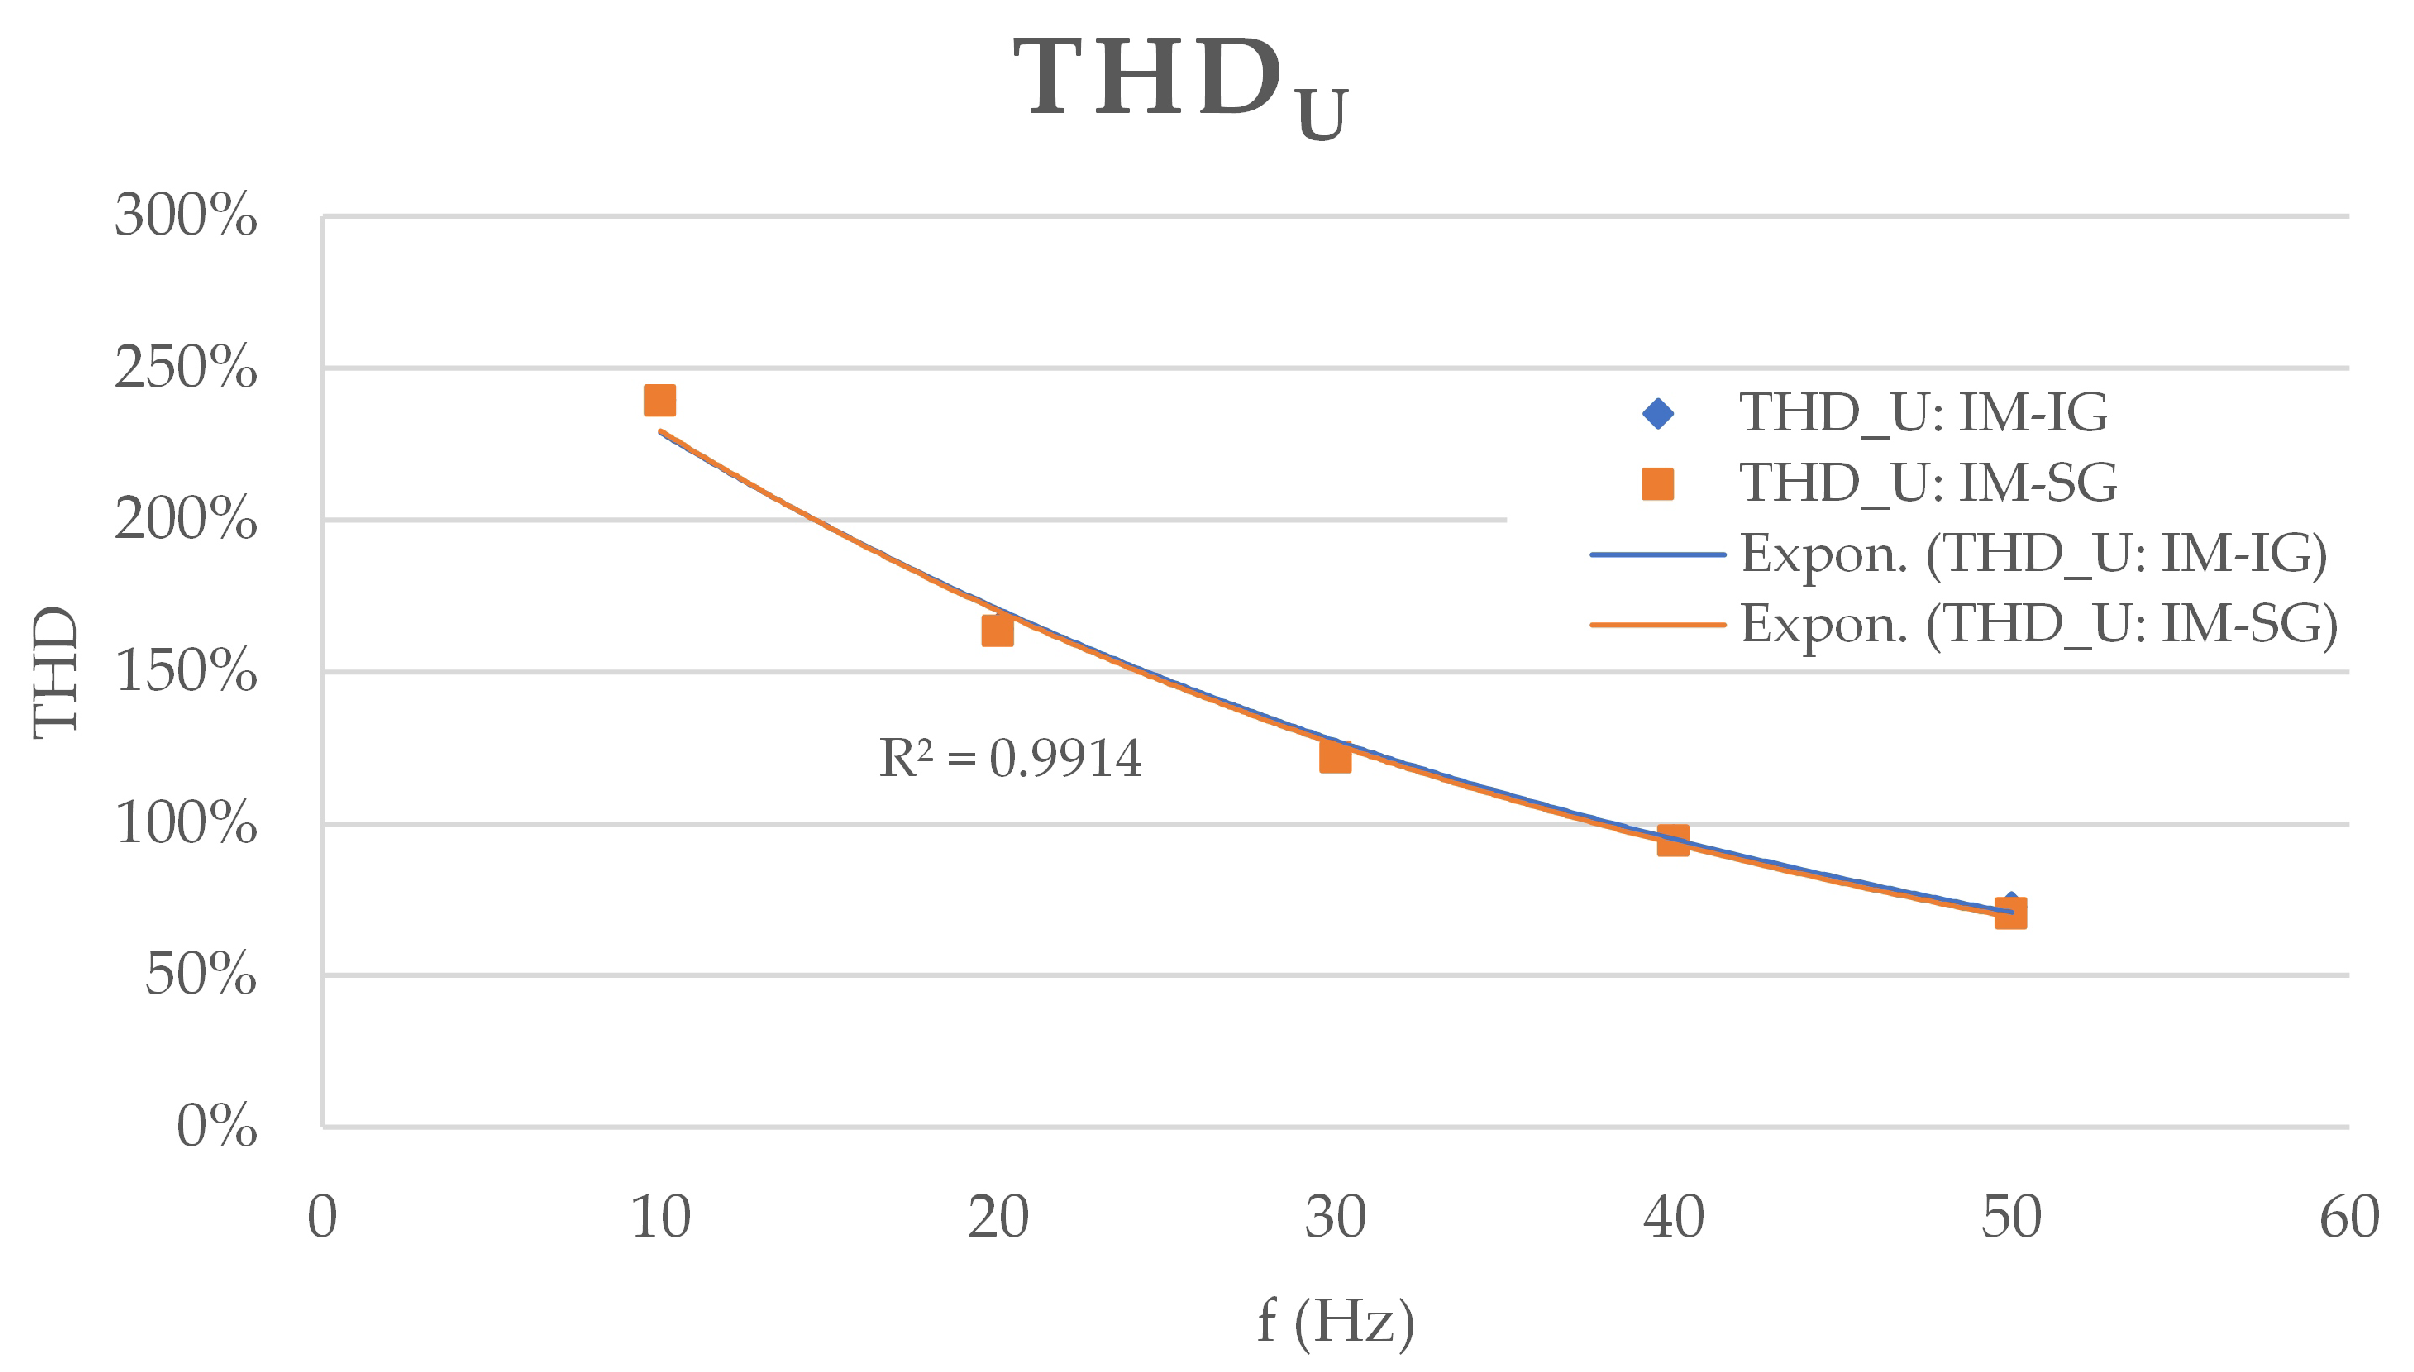
The next characteristic shown in Figure 17 illustrates the changes in content of higher harmonics in the supply voltage expressed as the THD coefficient. The changes are presented as a function of the motor’s supply voltage frequency. The data presented in Figure 16 and Figure 17 are additionally provided with the R2 coefficient, which facilitates the evaluation of the correlation between the trend lines and the measurement points.
These characteristics indicate that the supply voltages have been similar in both scenarios described in the article. This allows us to assume that the operating conditions of the system under induction and synchronous generators were comparable, allowing further comparisons and analyses.
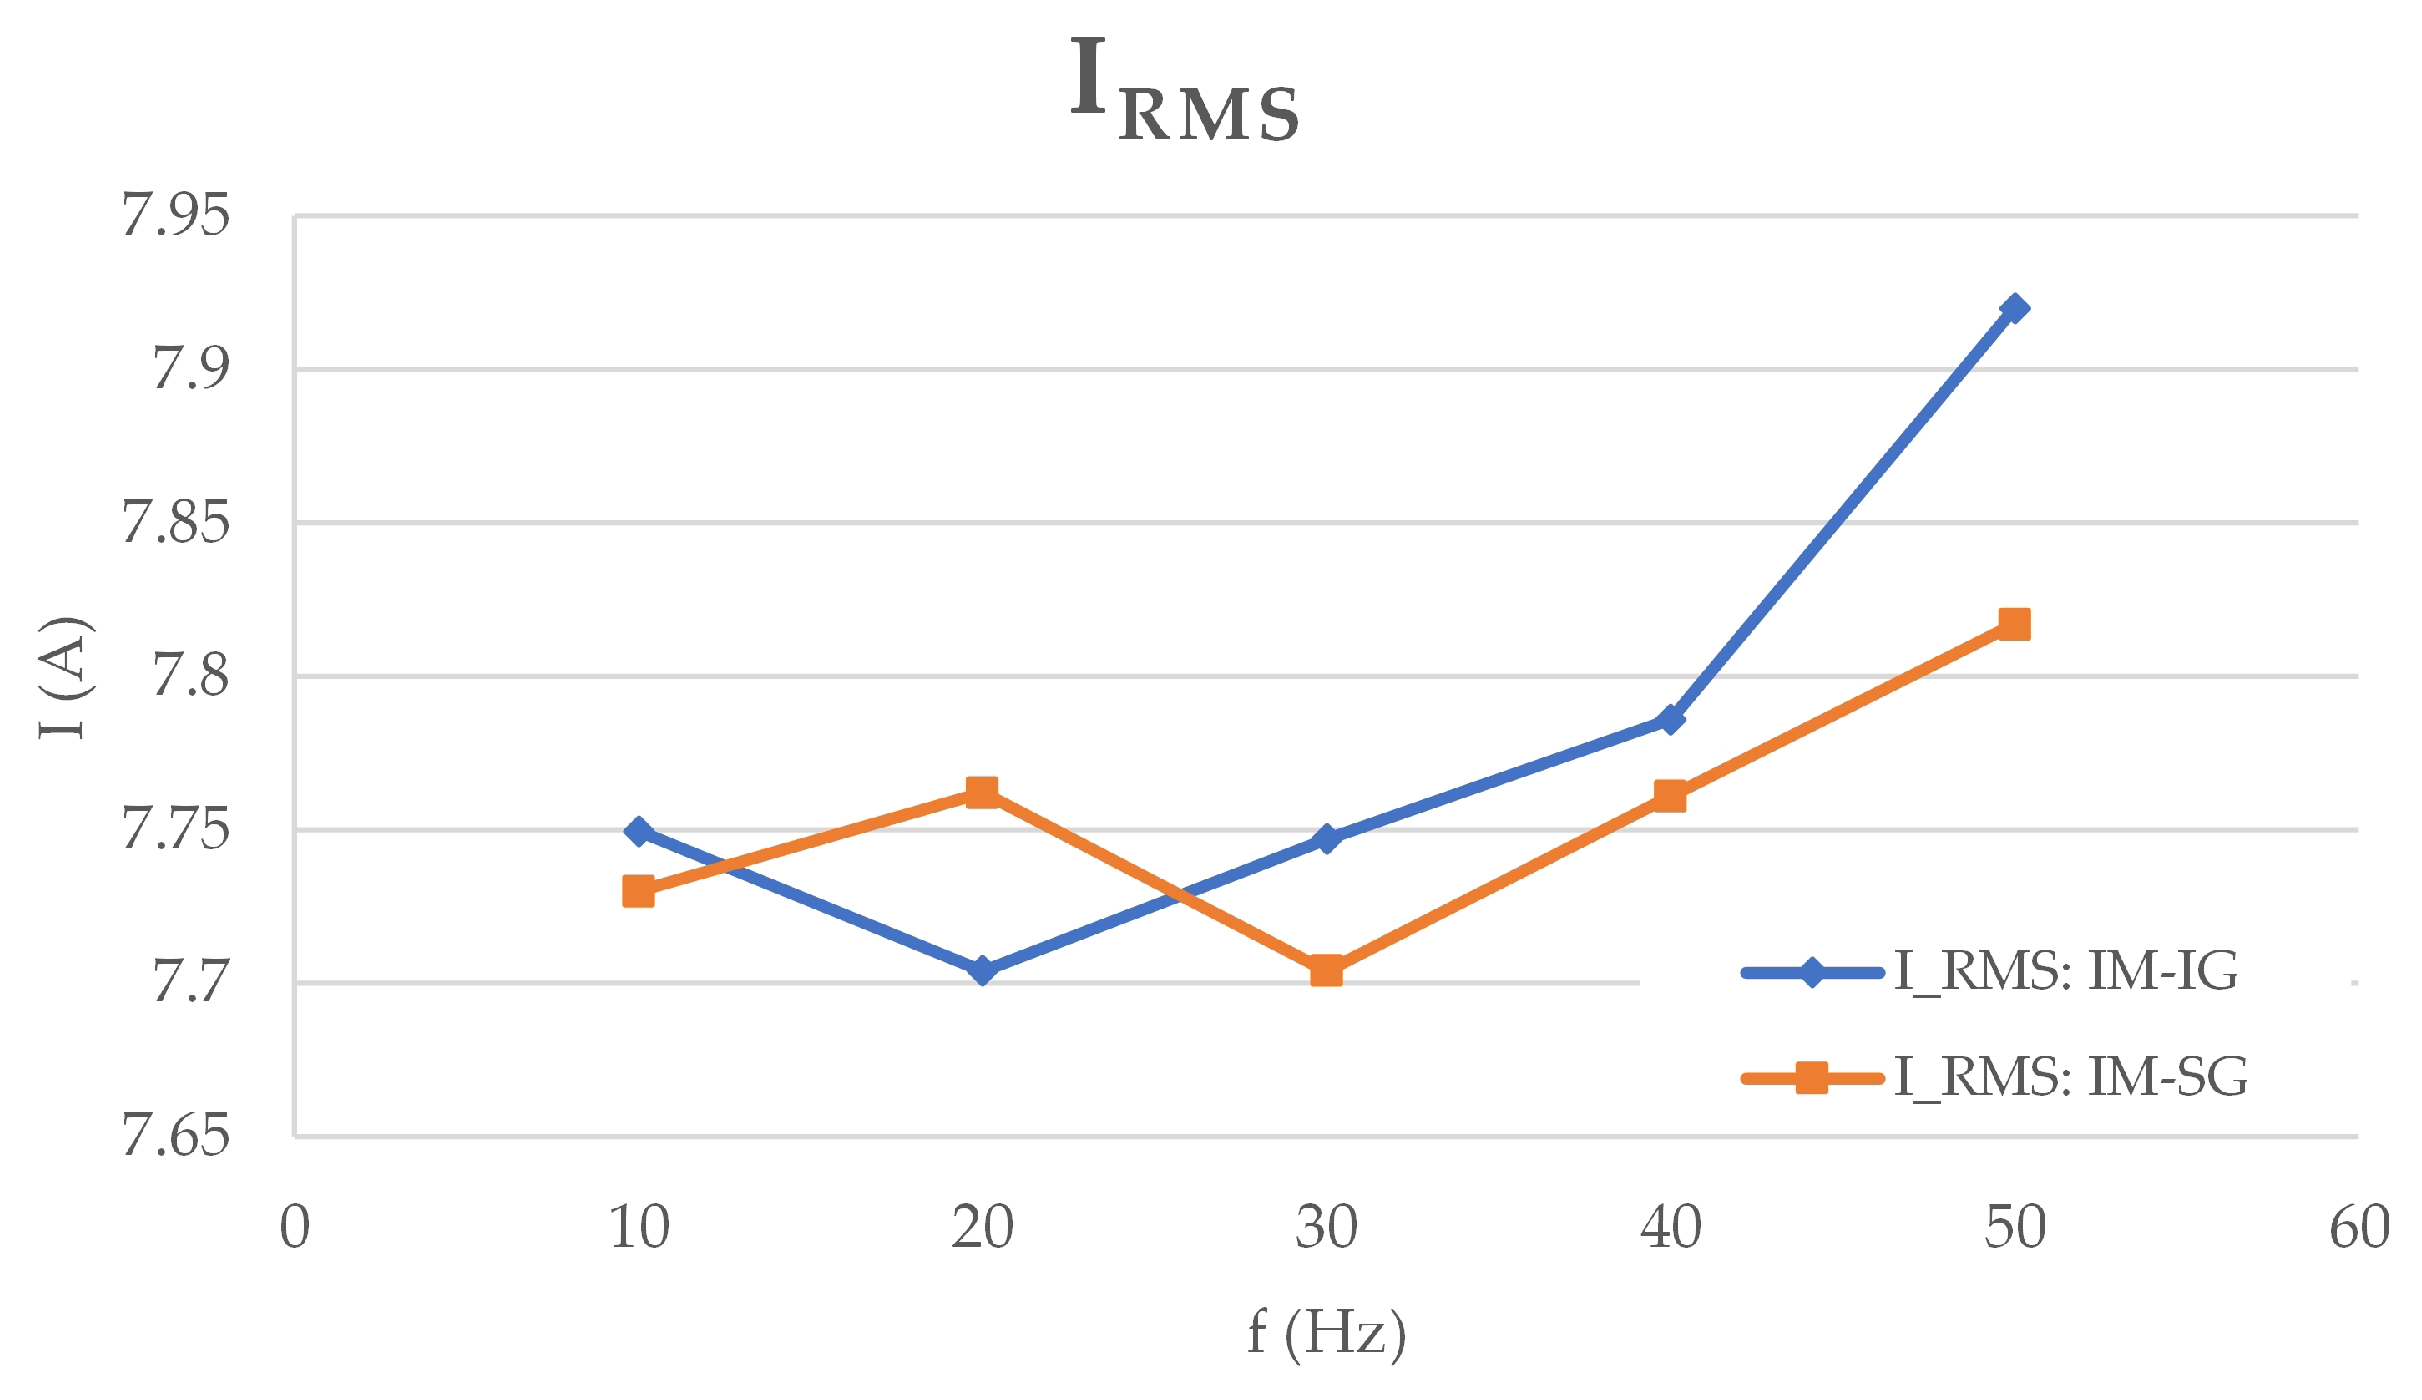
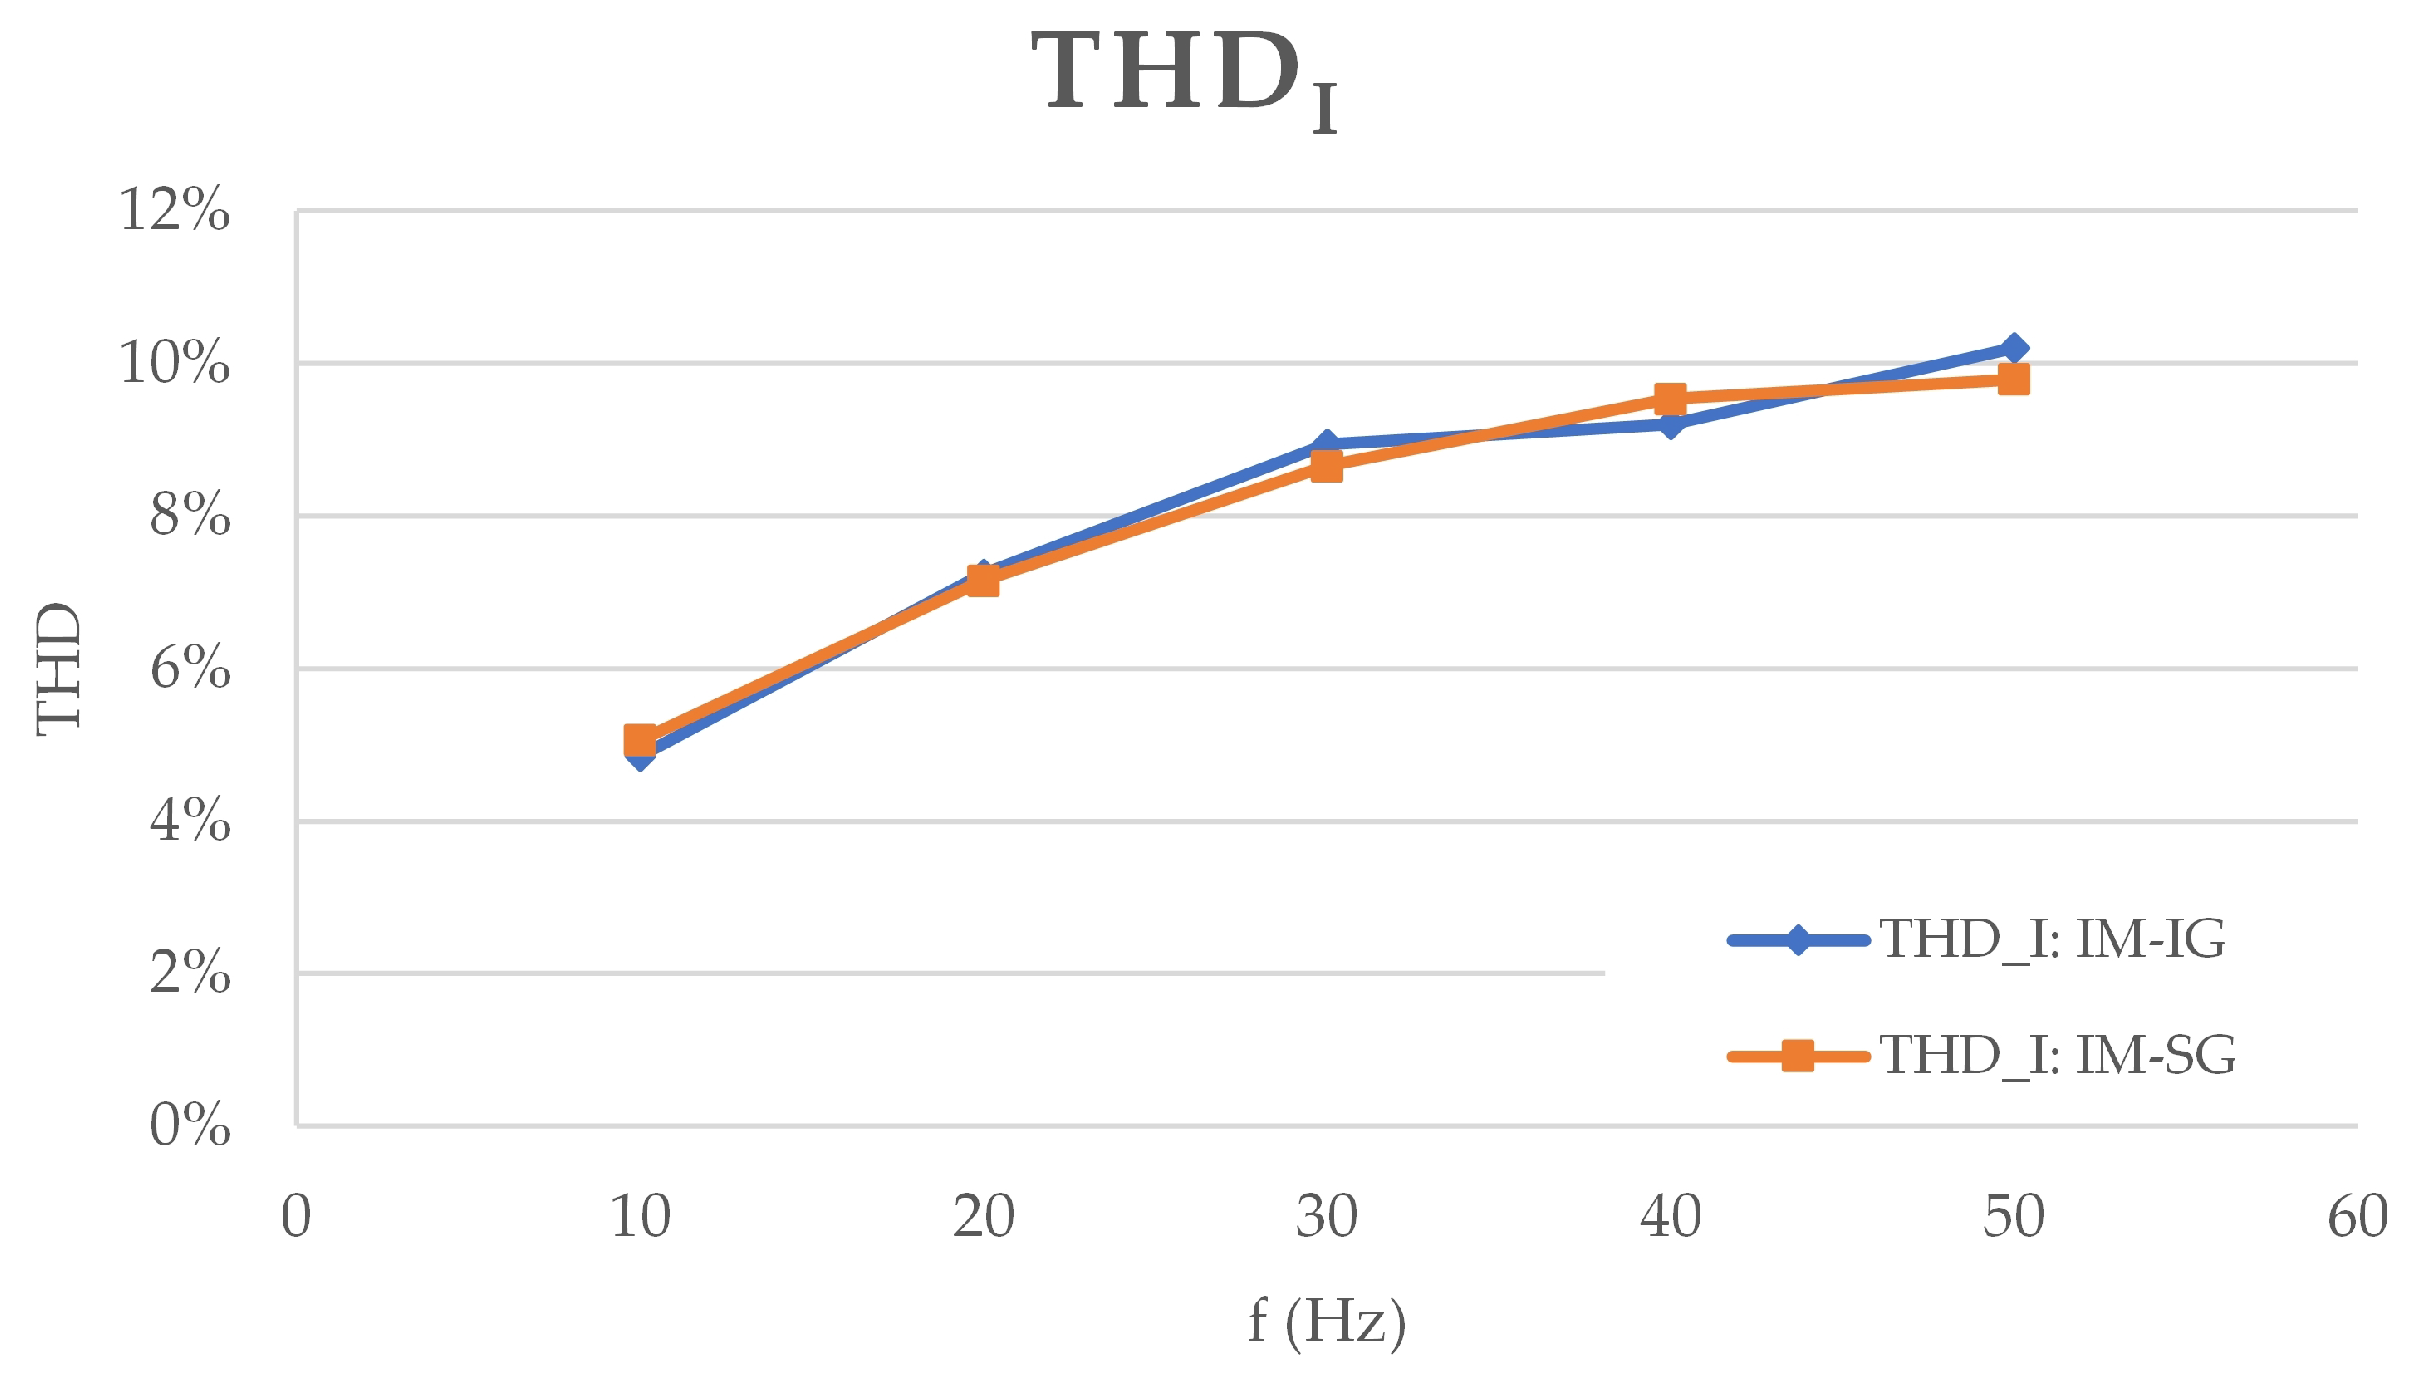
Figure 18 and Figure 19 present characteristics of currents, which typically provide fundamental information about the operation of electrical machines under various states and conditions. Figure 18 shows the RMS current value as a function of frequency, whilst Figure 19 depicts a characteristic of the change in the THDi coefficient as a function of frequency.
As demonstrated in Figure 18, the RMS supply current has varied with frequency. This characteristic demonstrates that, despite the no-load operation of the generators (one is induction and the other synchronous), they have exerted a divergent effect on the operation of the motor and, consequently, on the operation of the entire system.
Measurements of the motor’s power supply parameters in a system with coupled generators have revealed minor distortion. When measured at 900 rpm, the individual harmonics of the current signal has not exceeded 2.1% of the fundamental component. At 1500 rpm, the percentage has not exceeded 2.6%. The total current distortion content, expressed as a THDi coefficient, has been 9% in the former case and 10% in the latter. The THDi values have been determined based on 40 harmonics. The general conclusion that can be drawn at this stage is that as the rotational speed increases, which is a consequence of increasing the supply voltage frequency, the current distortion level increases.
A thorough examination of a select number of parameters and electrical characteristics has revealed that the power supply conditions were virtually identical in both of the systems under consideration. However, it has been also found that the motor’s response to generator changes differed between the two scenarios. The presented RMS and THD current changes as a function of frequency, while having been indicative of correct motor operation, have not provided any insight into the drive’s performance. The forces generated during motor operation are not only a source of torque for the generators but also a source of vibrations, which cannot be fully understood based on voltage and current analysis. The subsequent chapter of this paper will present a vibrodiagnostic analysis conducted on the motor and generator sides.

3.2. Analysis of Data Obtained from Vibration Measurements

Vibration measurements and assessments have been conducted in accordance with the descriptions contained in Section 2.3 and the conditions specified in the standards [27,28]. The process of recording and processing vibration data is a more complex procedure than analogous operations performed for electrical data. In the context of the analysis, the assessment of vibration level for the tested drive unit alone was deemed insufficient by the authors, who regarded the vibration spectra as equally significant. The objective of the study was to make a comparison between the vibration velocity results obtained with different sensors. As part of the vibration recording process for each generator (the induction machine and then the synchronous machine), a triaxial accelerometer and three uniaxial accelerometers were utilised to measure the vibration analysis results. The findings of this analysis are presented herewith.

3.2.1. Analysis of the Drive Unit with an Induction Machine Operating as the Generator

The experimental procedure involved the testing of a set of two induction machines that exhibited comparable parameters and dimensions. The testing process entailed the measurements of vibrations from both the motor and the generator with considered kinds of accelerometers. The results obtained for the triaxial accelerometer are presented in the following figures. The graphical representation of the analysis of the effective value (RMS) vibration distribution for selected rotational speeds on the motor side is demonstrated in Figure 20a, whilst those for the generator side are demonstrated in Figure 20b. The abbreviations appended to the figures denote the following:
  • IM—induction motor;
  • IG—induction generator;
  • SG—synchronous generator;
  • M—measurements on the motor side;
  • G—measurements on the generator side;
  • dir—direction (X, Y, or Z).
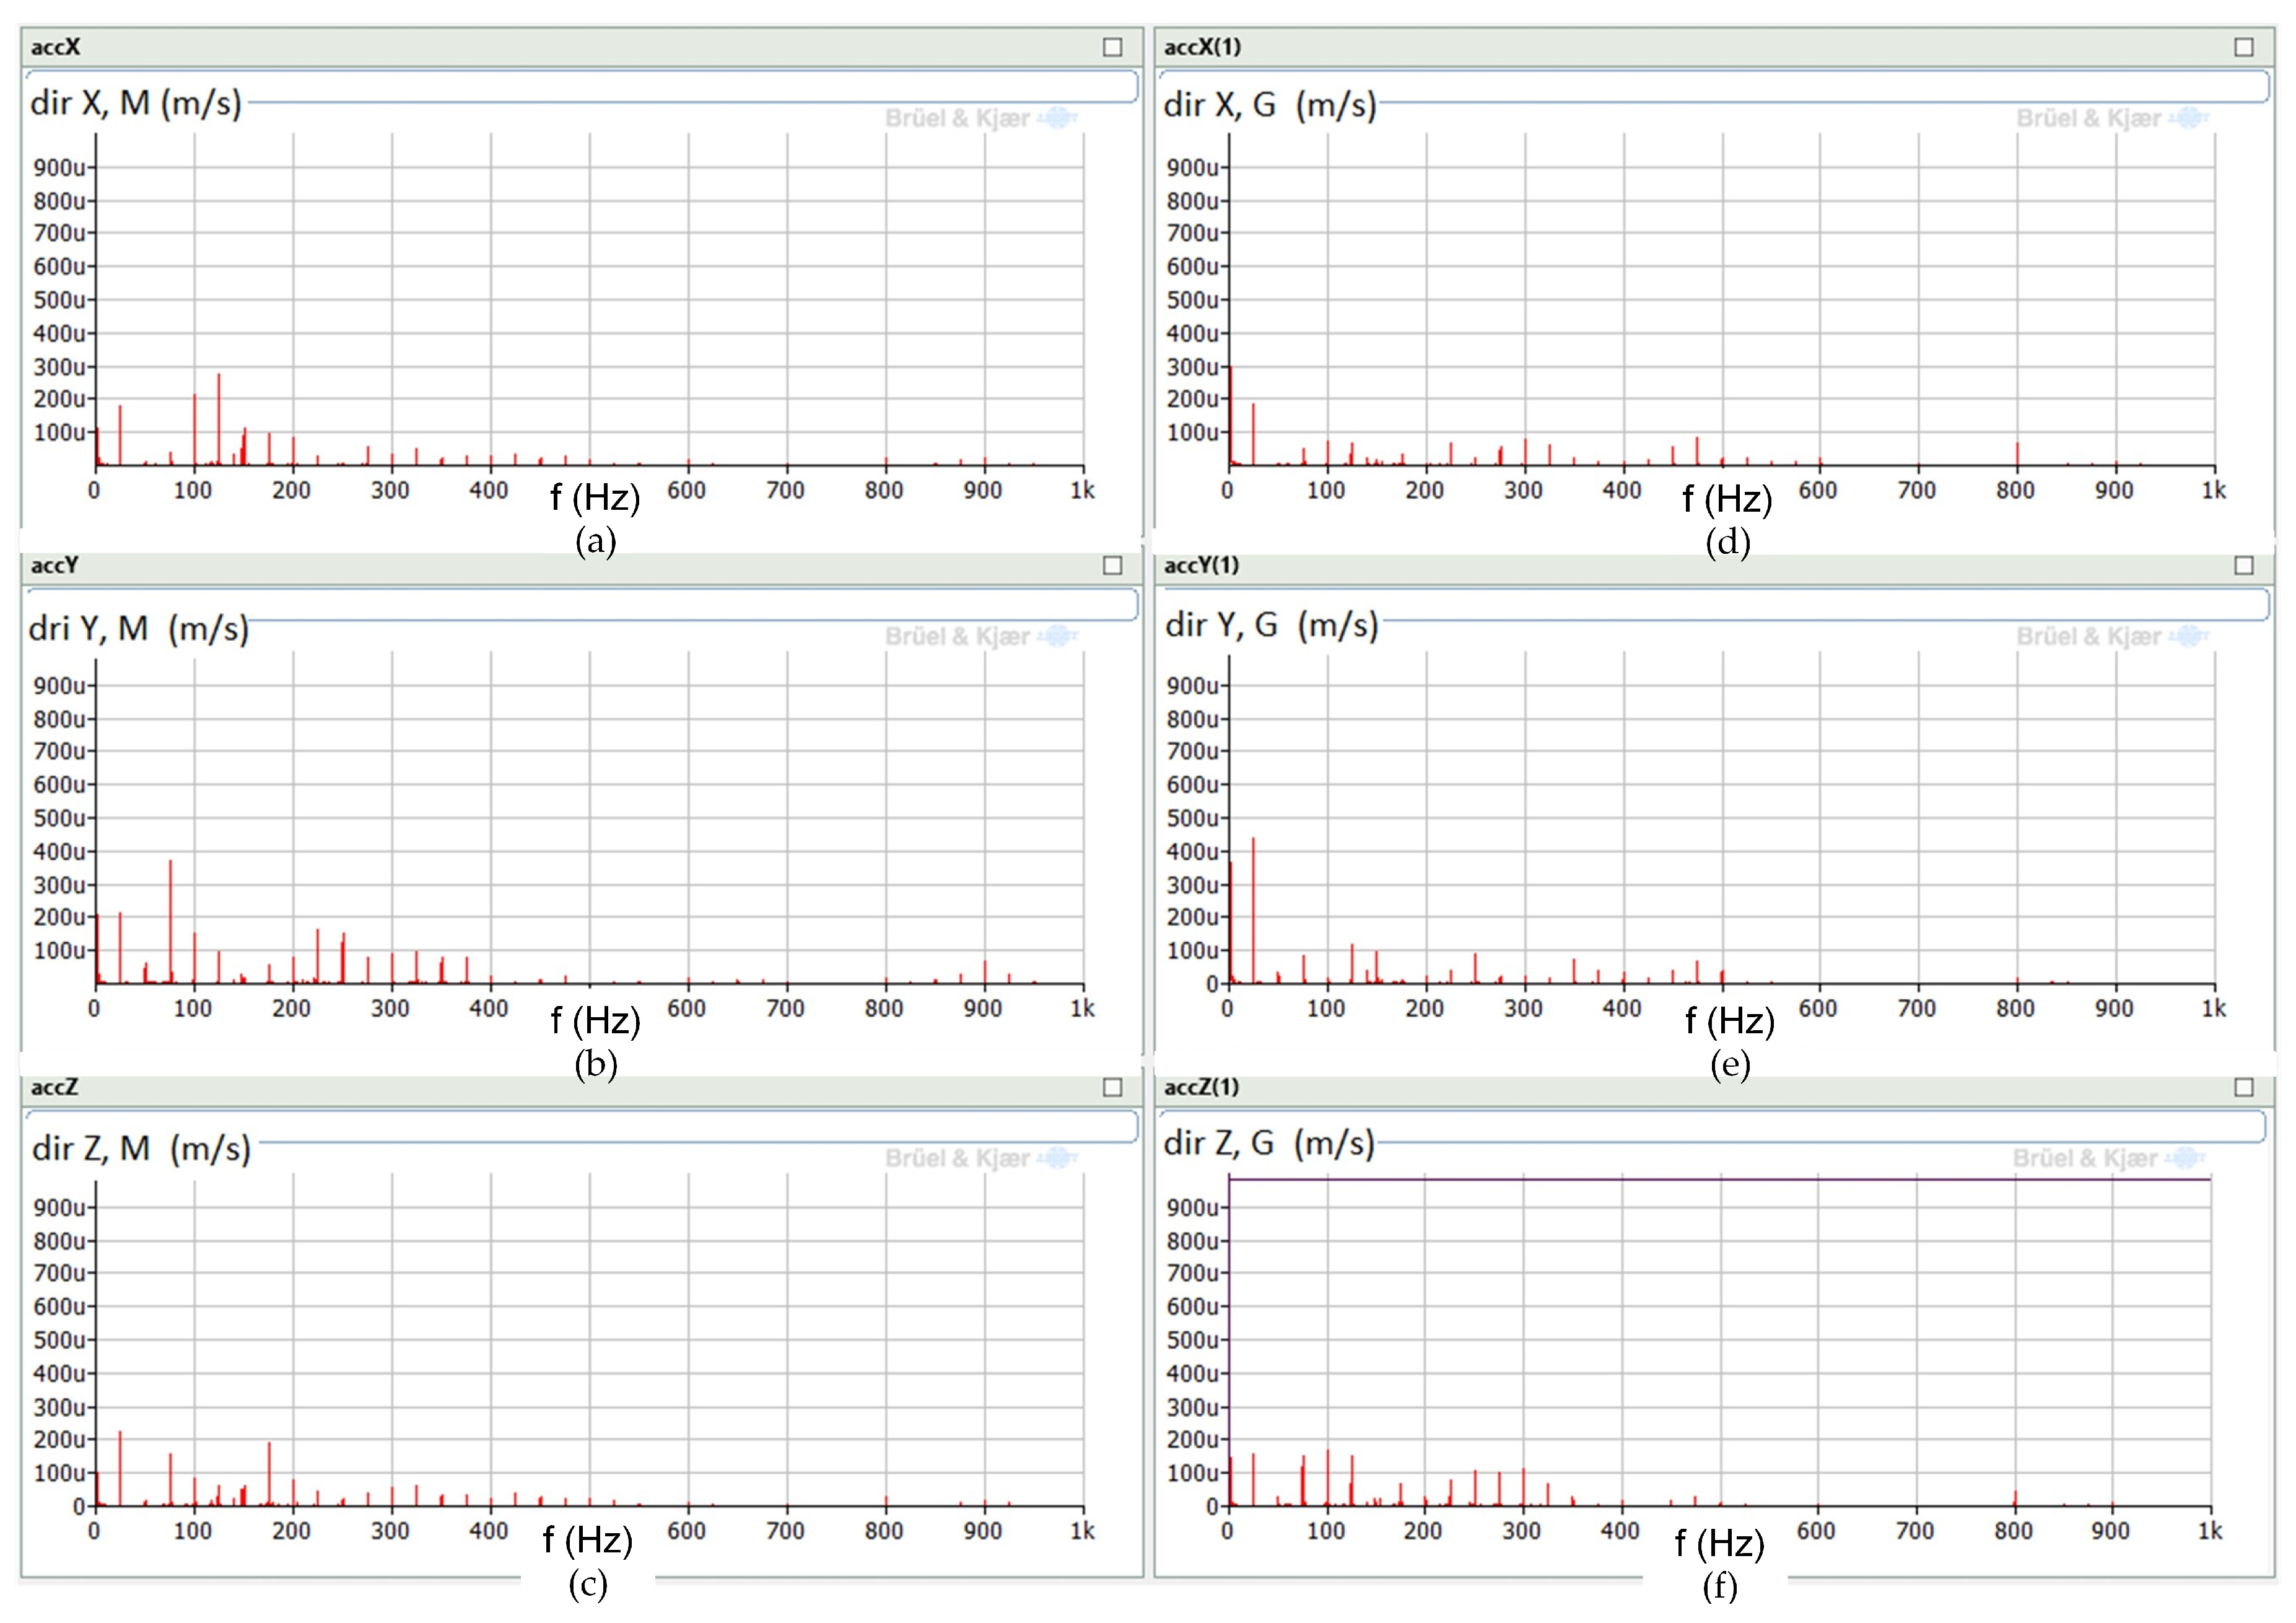
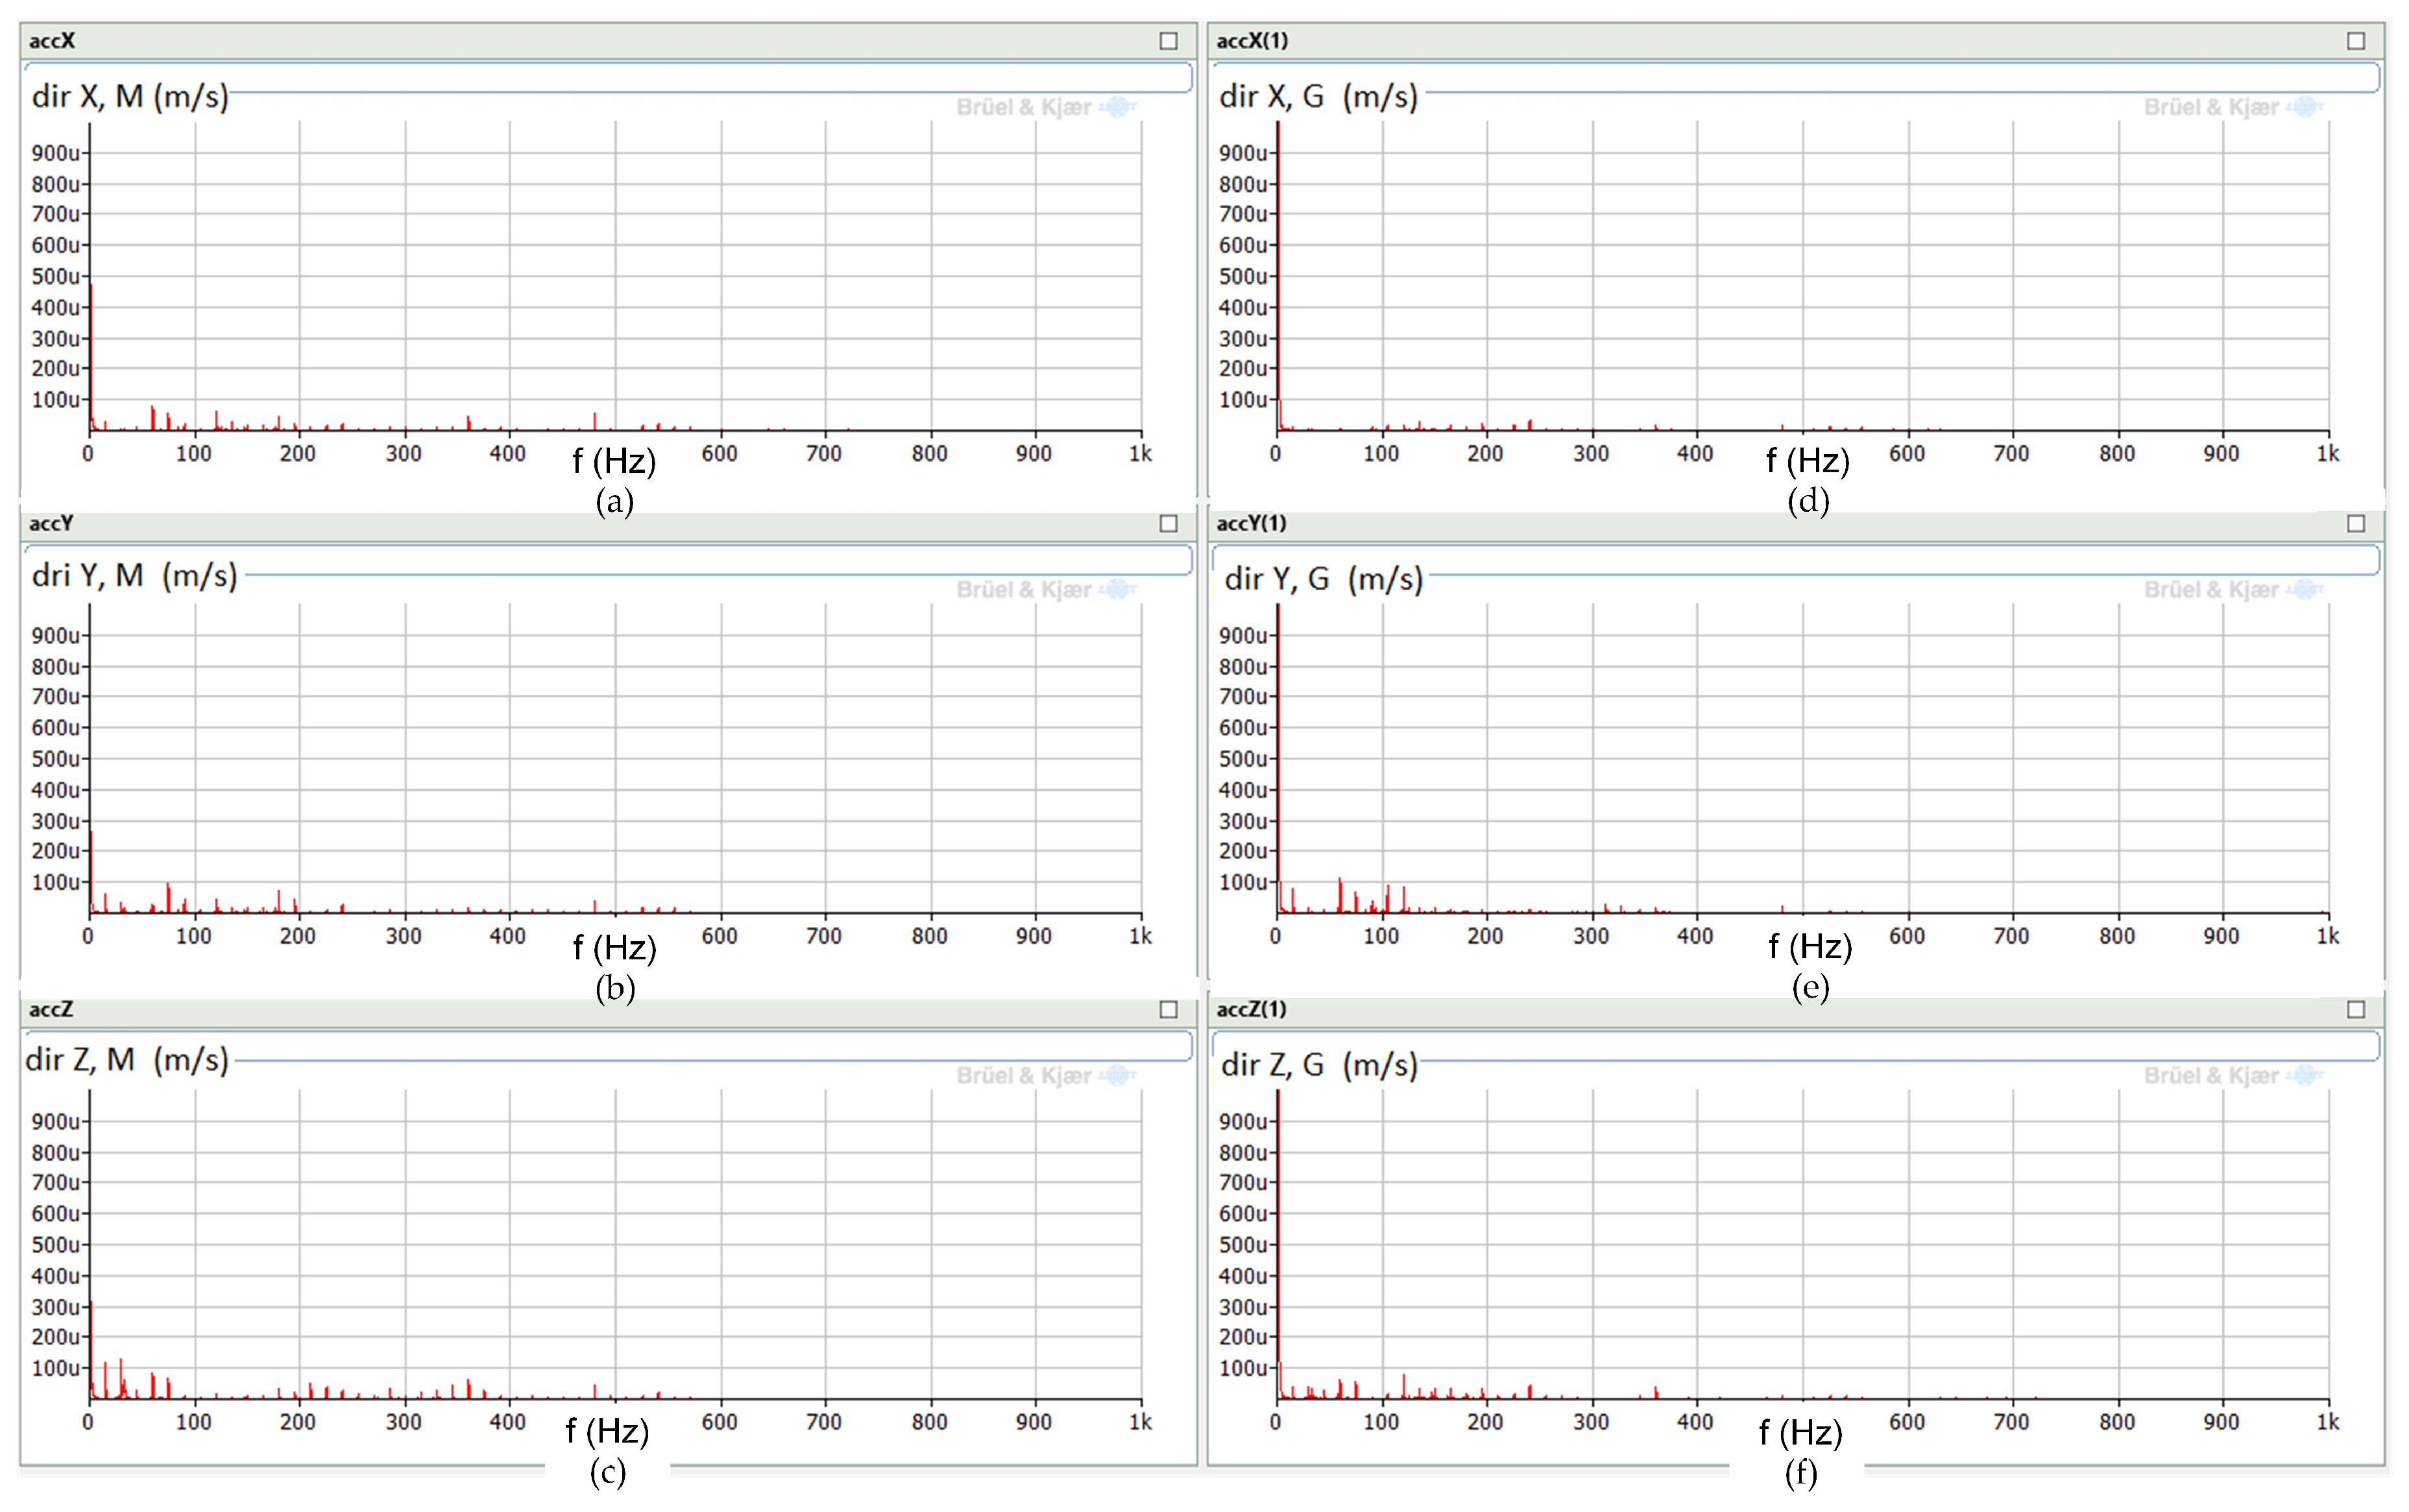
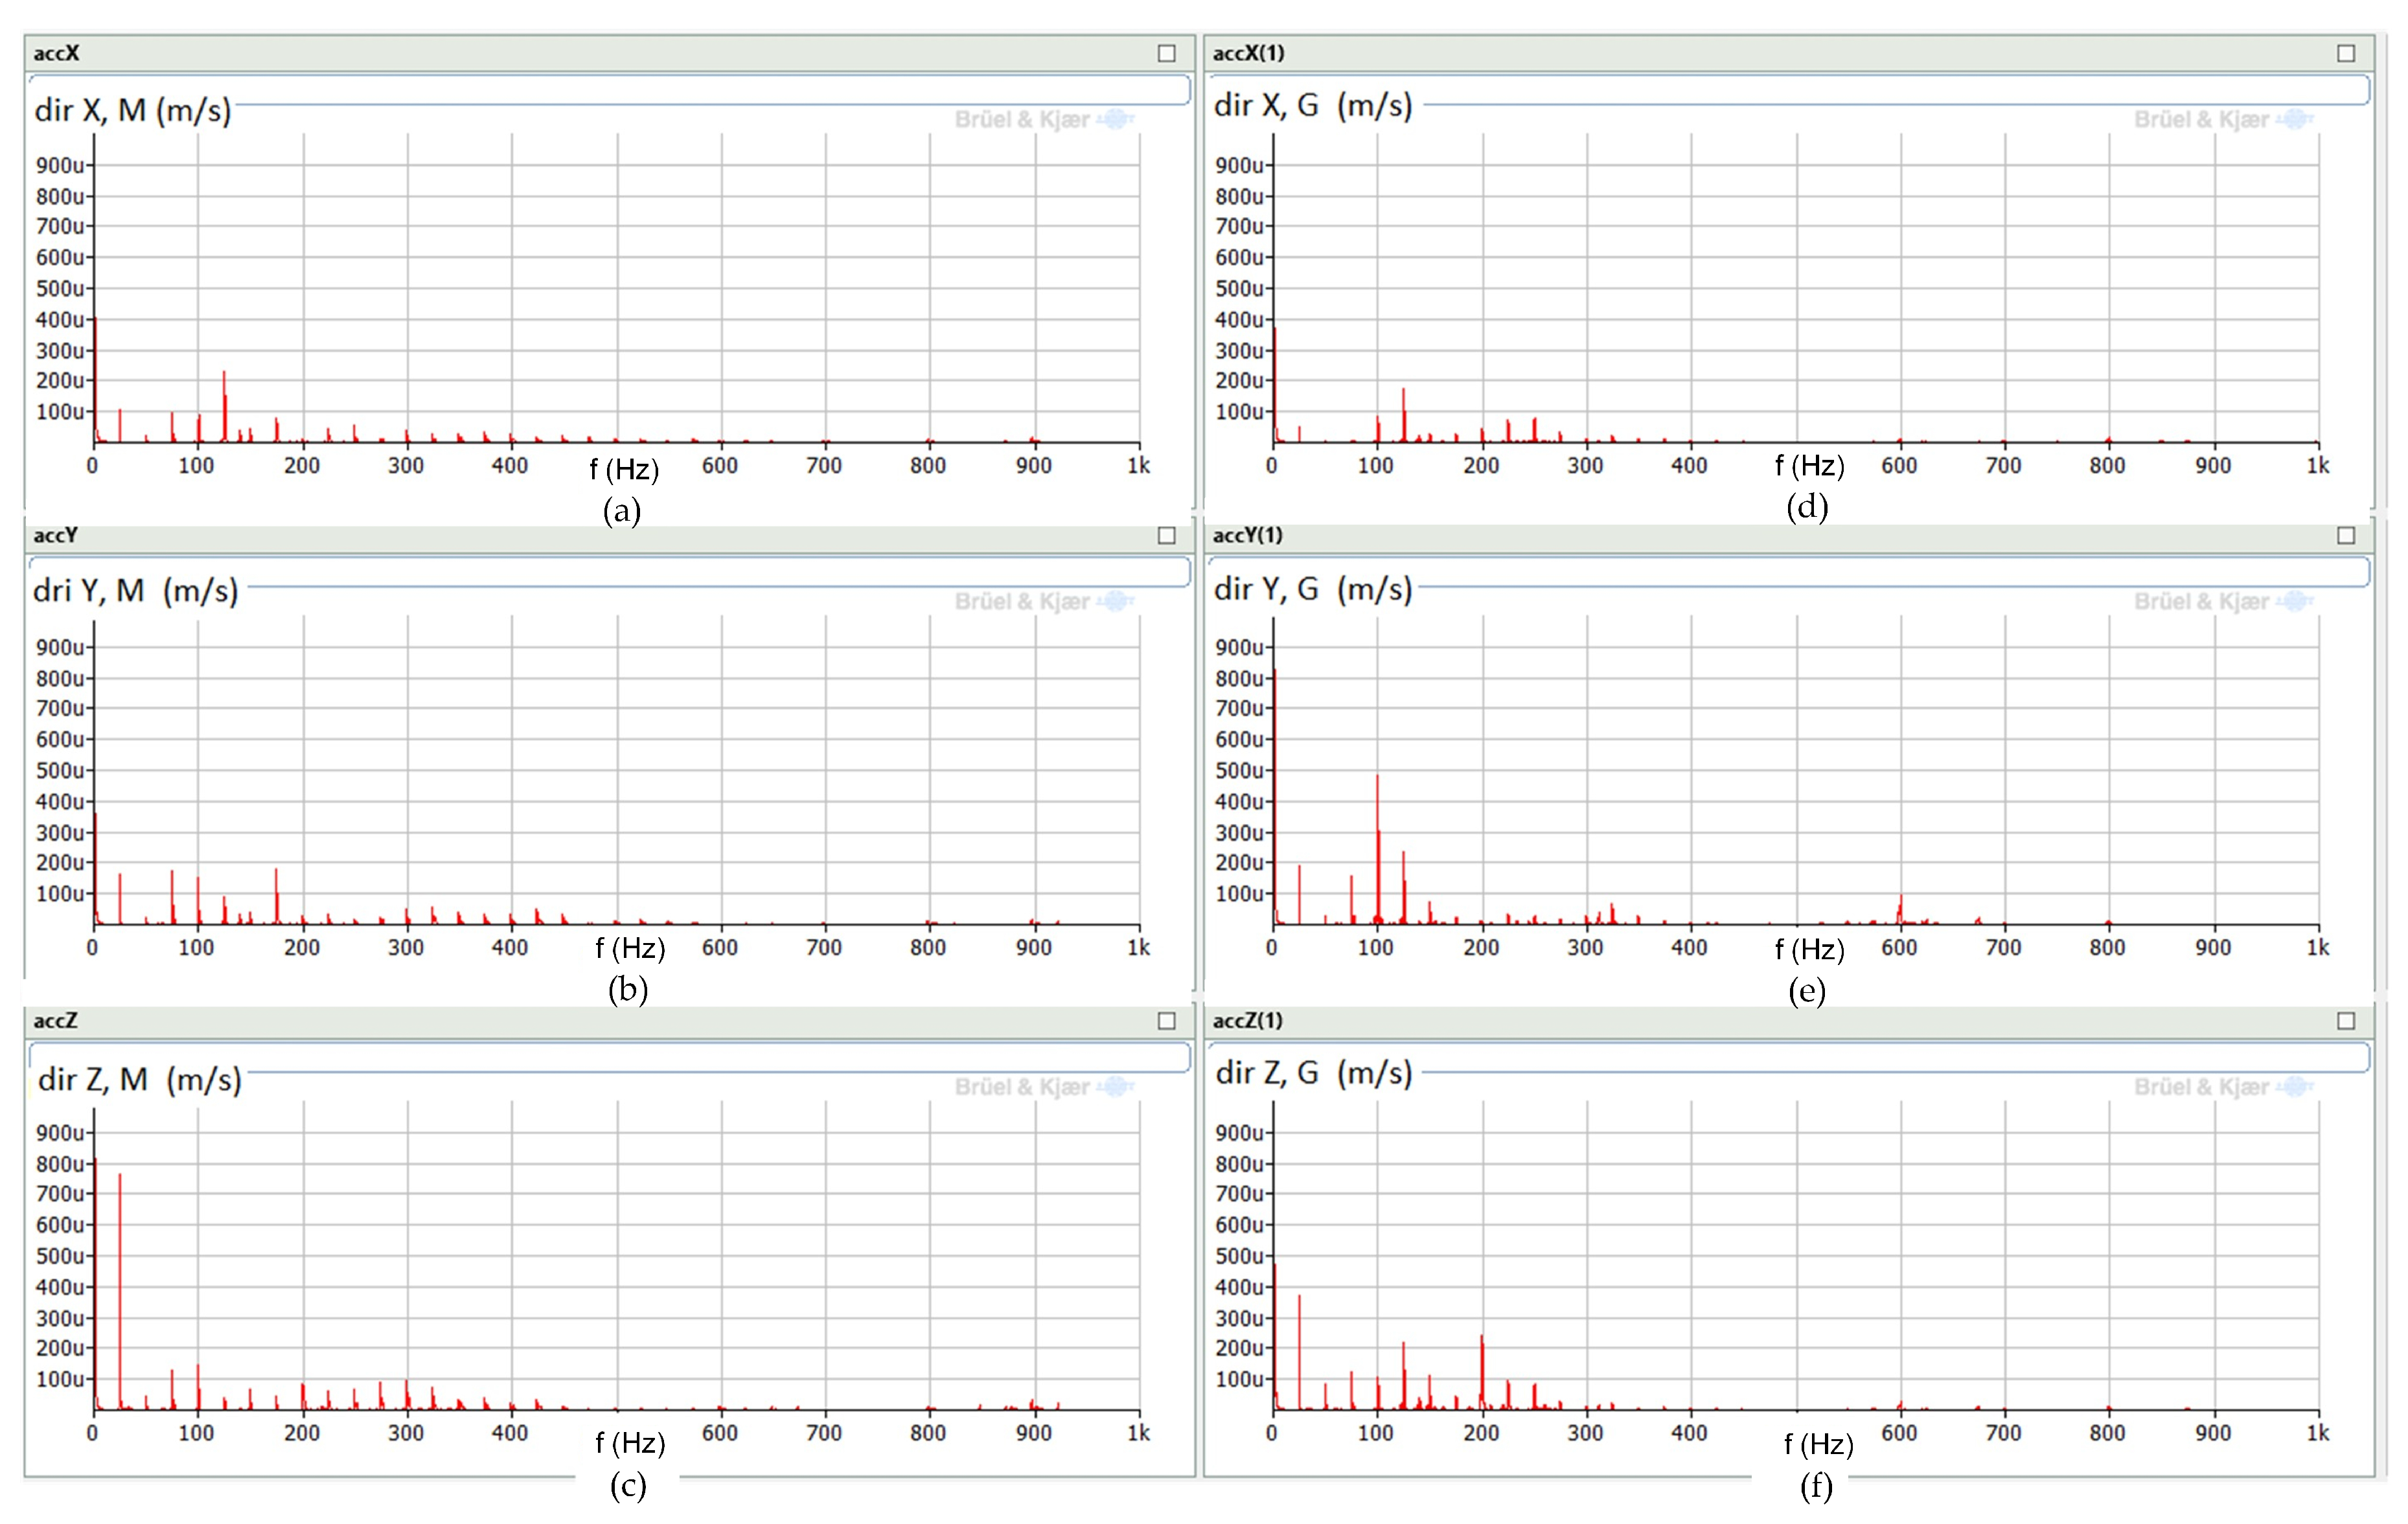
In order to ascertain any potential correlations between the electrical and mechanical measurements, the vibration data have been subjected to analysis using the FFT method as this approach has been employed in the analysis of voltages and currents in Section 3.1. FFT analysis has been performed for vibrations recorded at 900 rpm and 1500 rpm. The results of this analysis for vibrations measured with a triaxial accelerometer are presented in Figure 21 and Figure 22.
Figure 20. Vibration measurement of (a) an induction motor and (b) an induction generator conducted with the use of a triaxial accelerometer.
Energies 18 05140 g020
Figure 21. FFT analysis of vibrations at 900 rpm measured with a triaxial accelerometer: induction motor (a) x-direction, (b) y-direction, (c) z-direction; induction generator (d) x-direction, (e) y-direction, (f) z-direction.
Energies 18 05140 g021
Figure 22. FFT analysis of vibrations at 1500 rpm measured with a triaxial accelerometer: induction motor (a) x-direction, (b) y-direction, (c) z-direction; induction generator (d) x-direction, (e) y-direction, (f) z-direction.
Energies 18 05140 g022
As demonstrated in Figure 20, the vibration levels of the motor and generator are found to be comparable across all speed ranges. In both cases, it can be concluded that as the rotational speed increases, the vibration velocity increases. Upon observation of the measurement axes, it becomes evident that the vibration levels for each axis are comparable in all instances. The FFT analysis presented in Figure 21 and Figure 22 in each case demonstrates high signal complexity. A comparison of the spectra calculated for the motor and generator reveals similarities in the dominant frequency values.
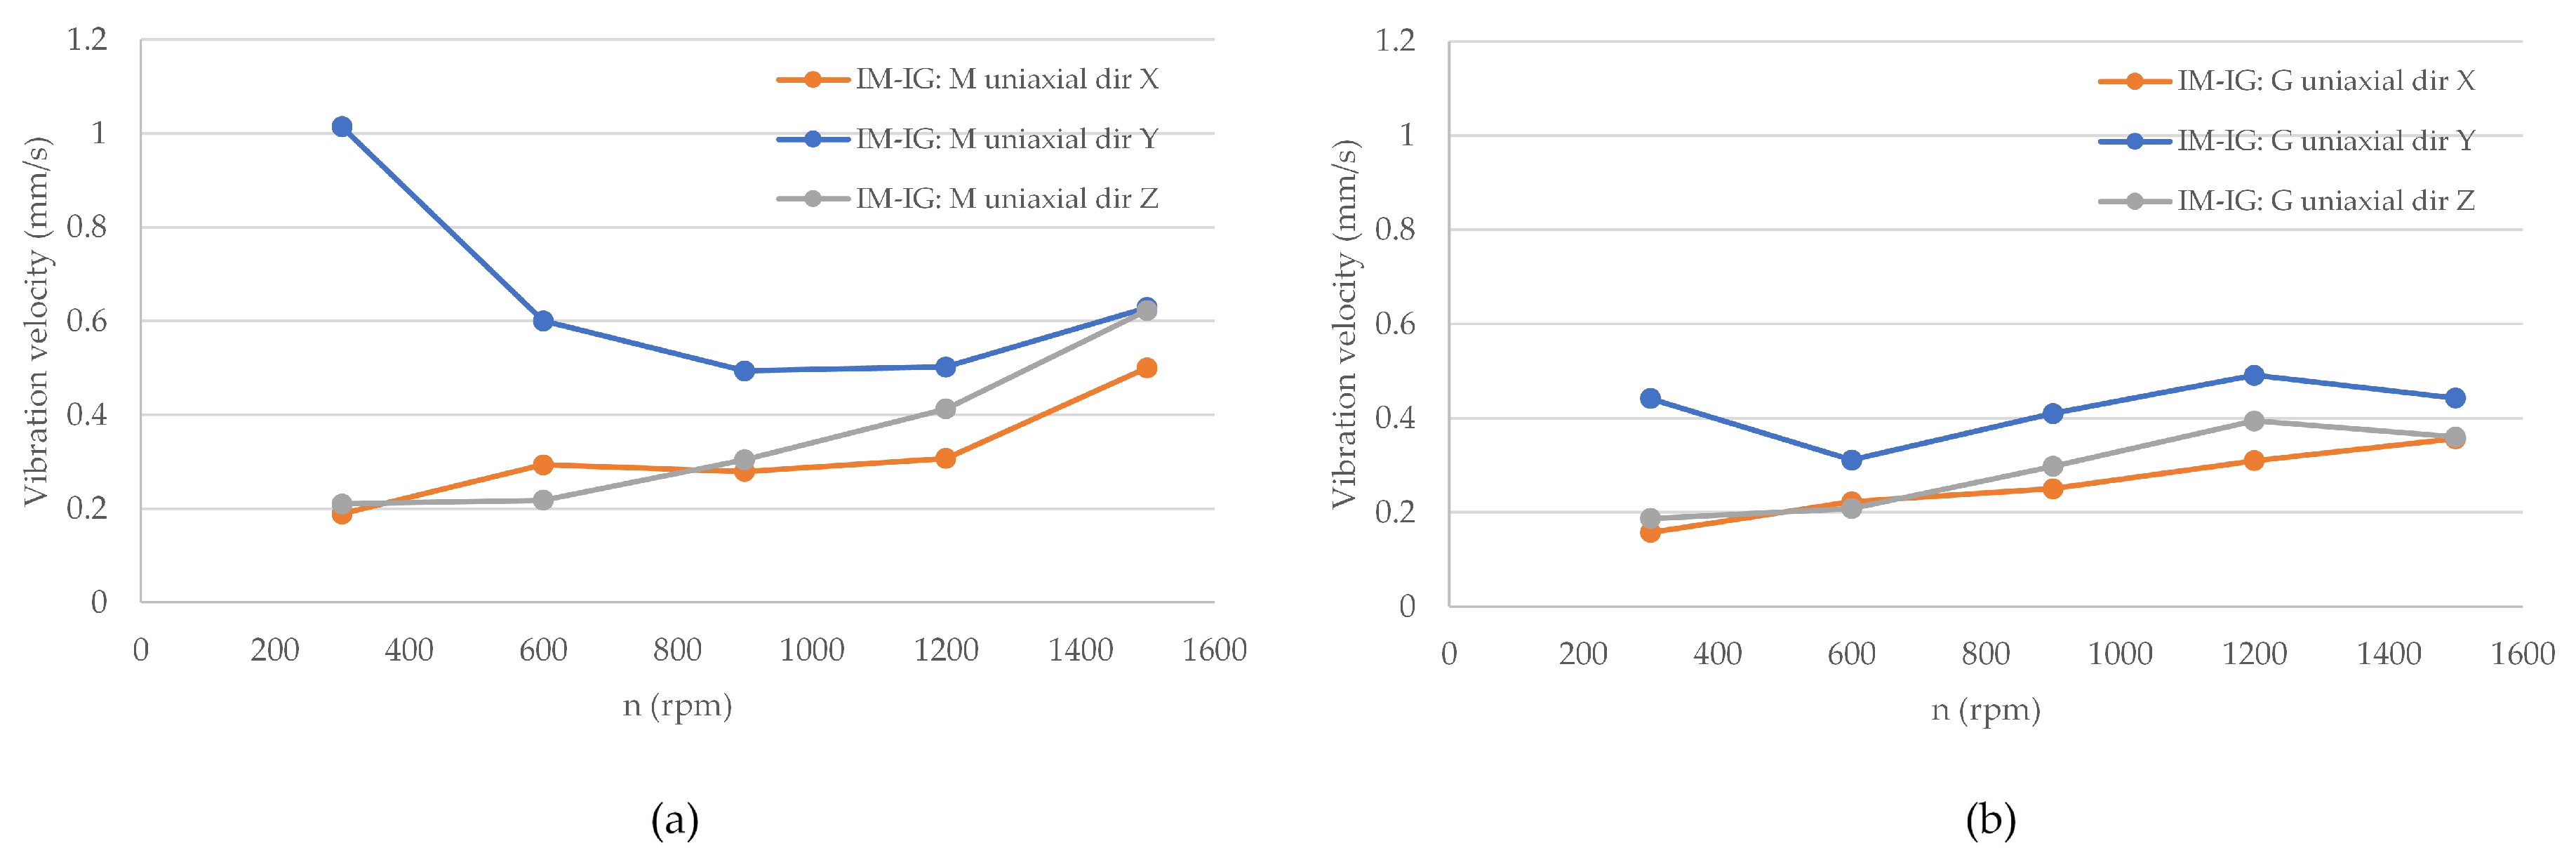
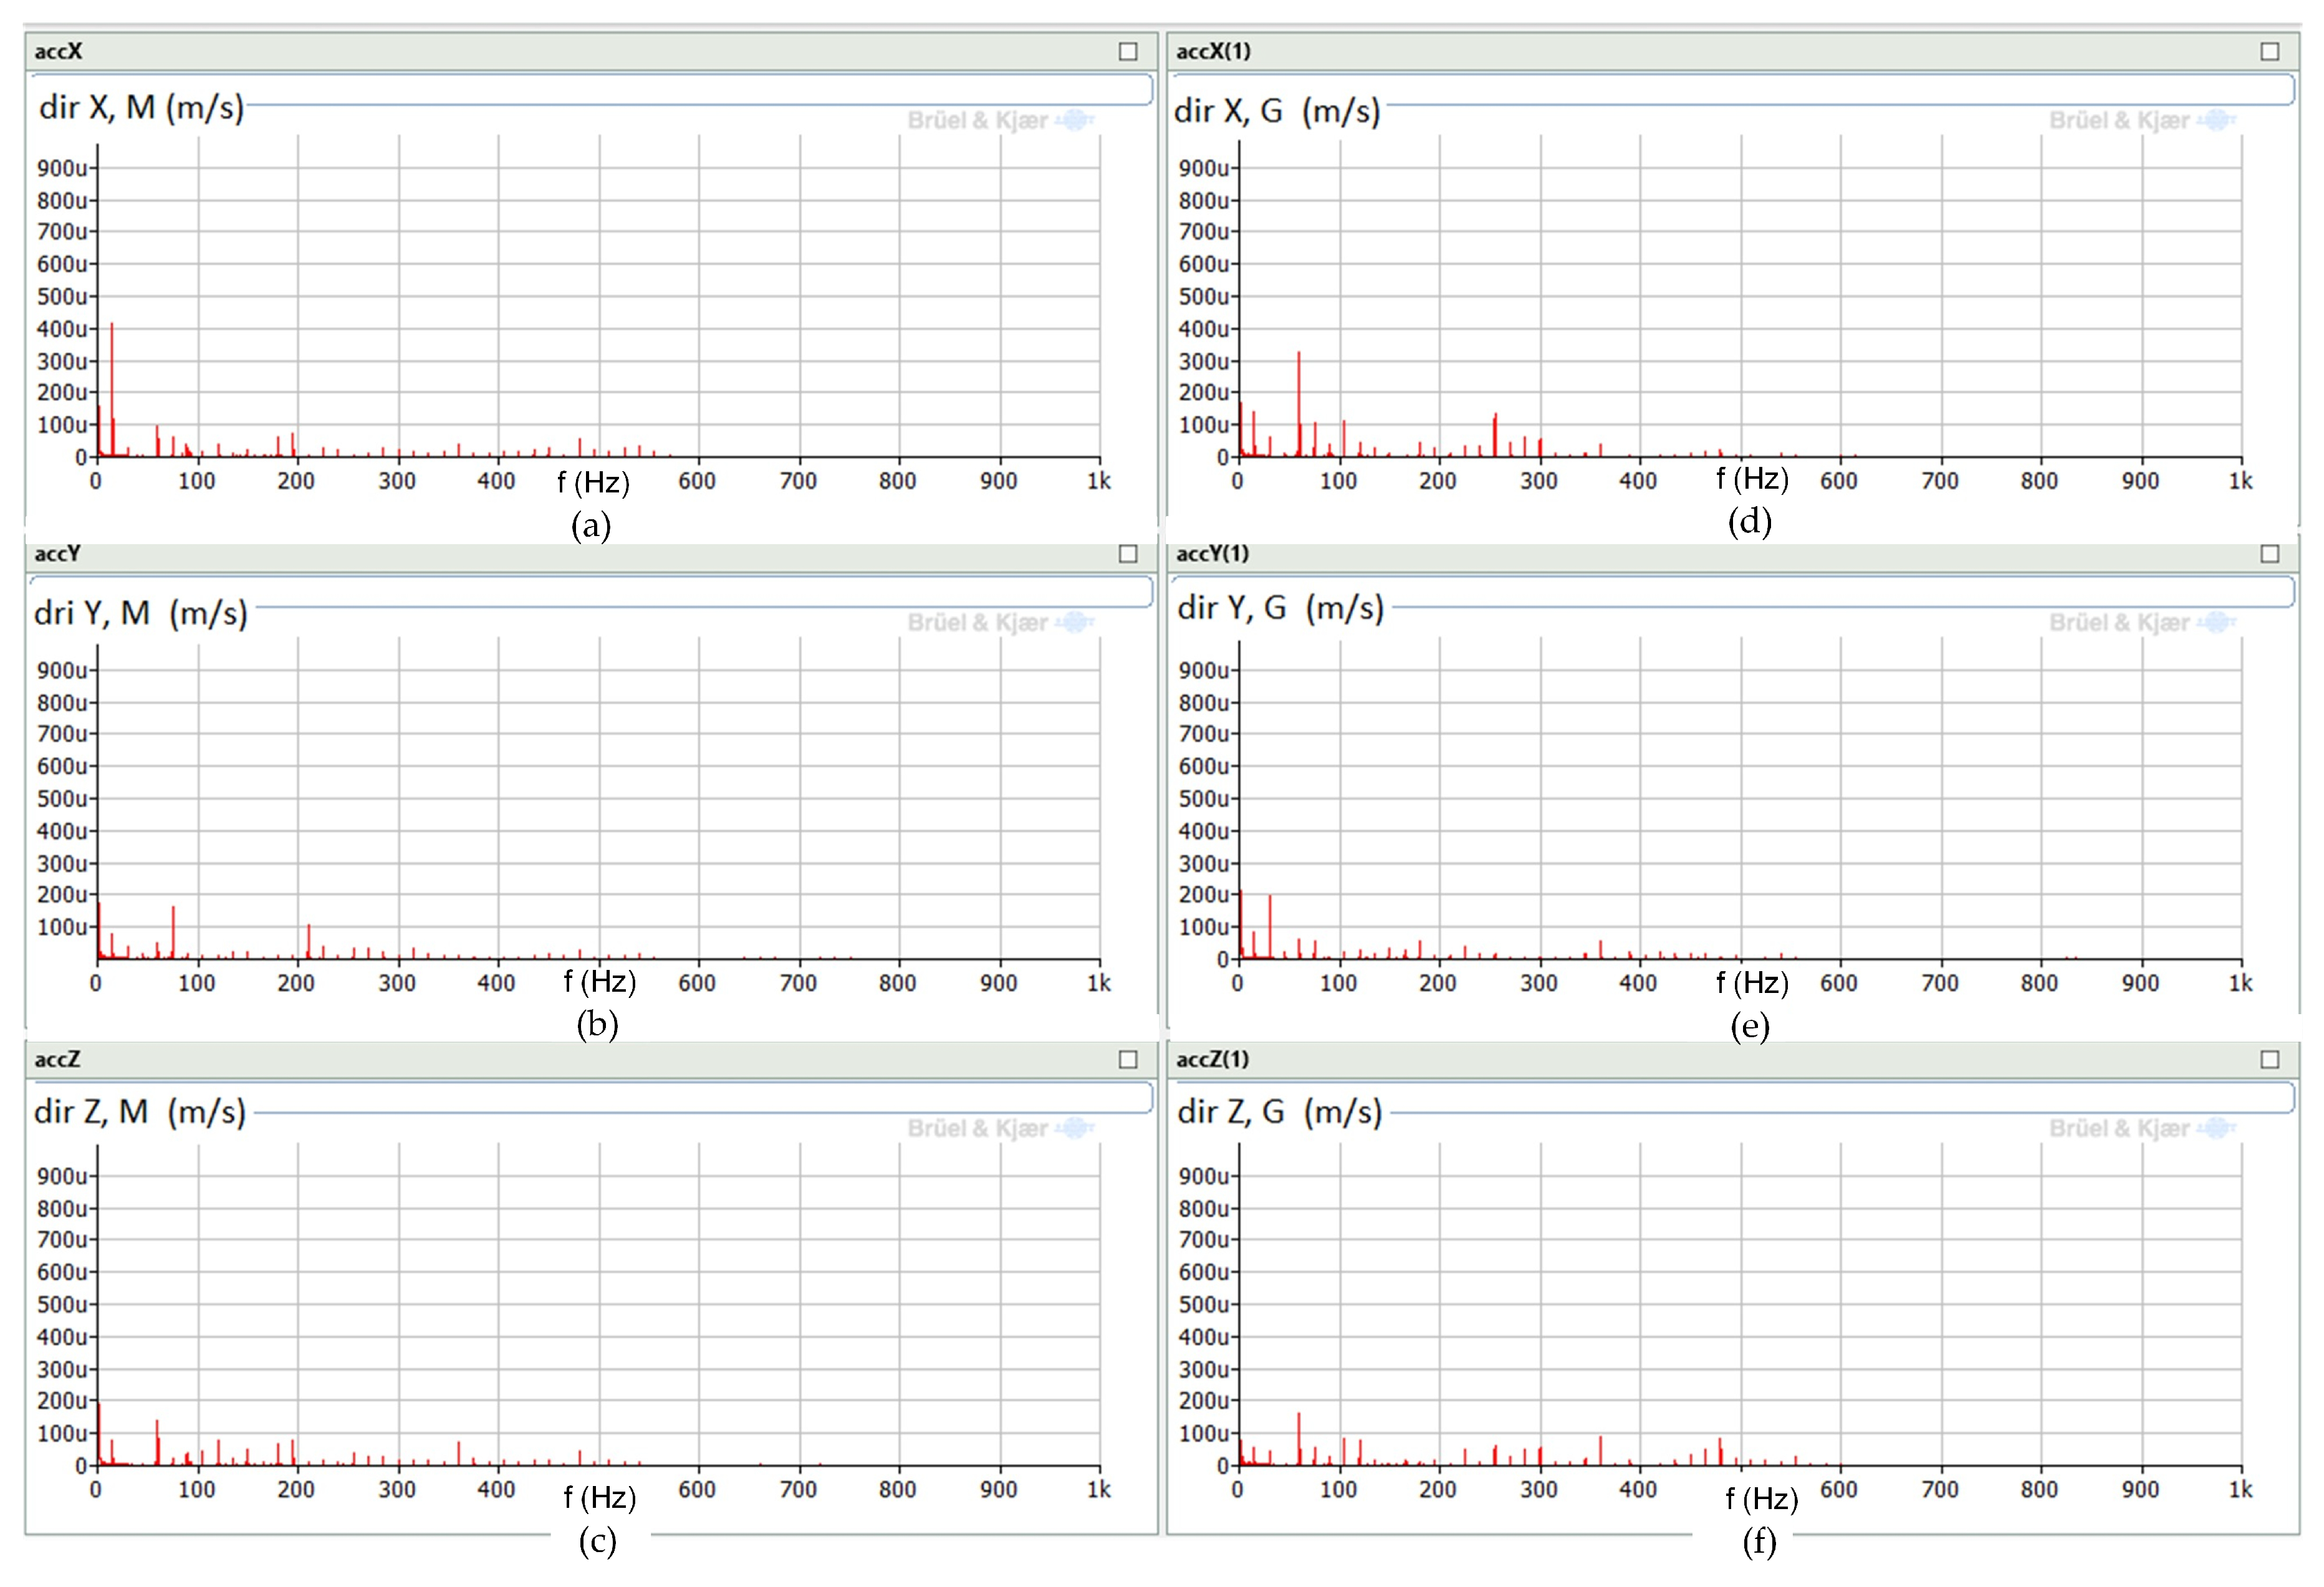
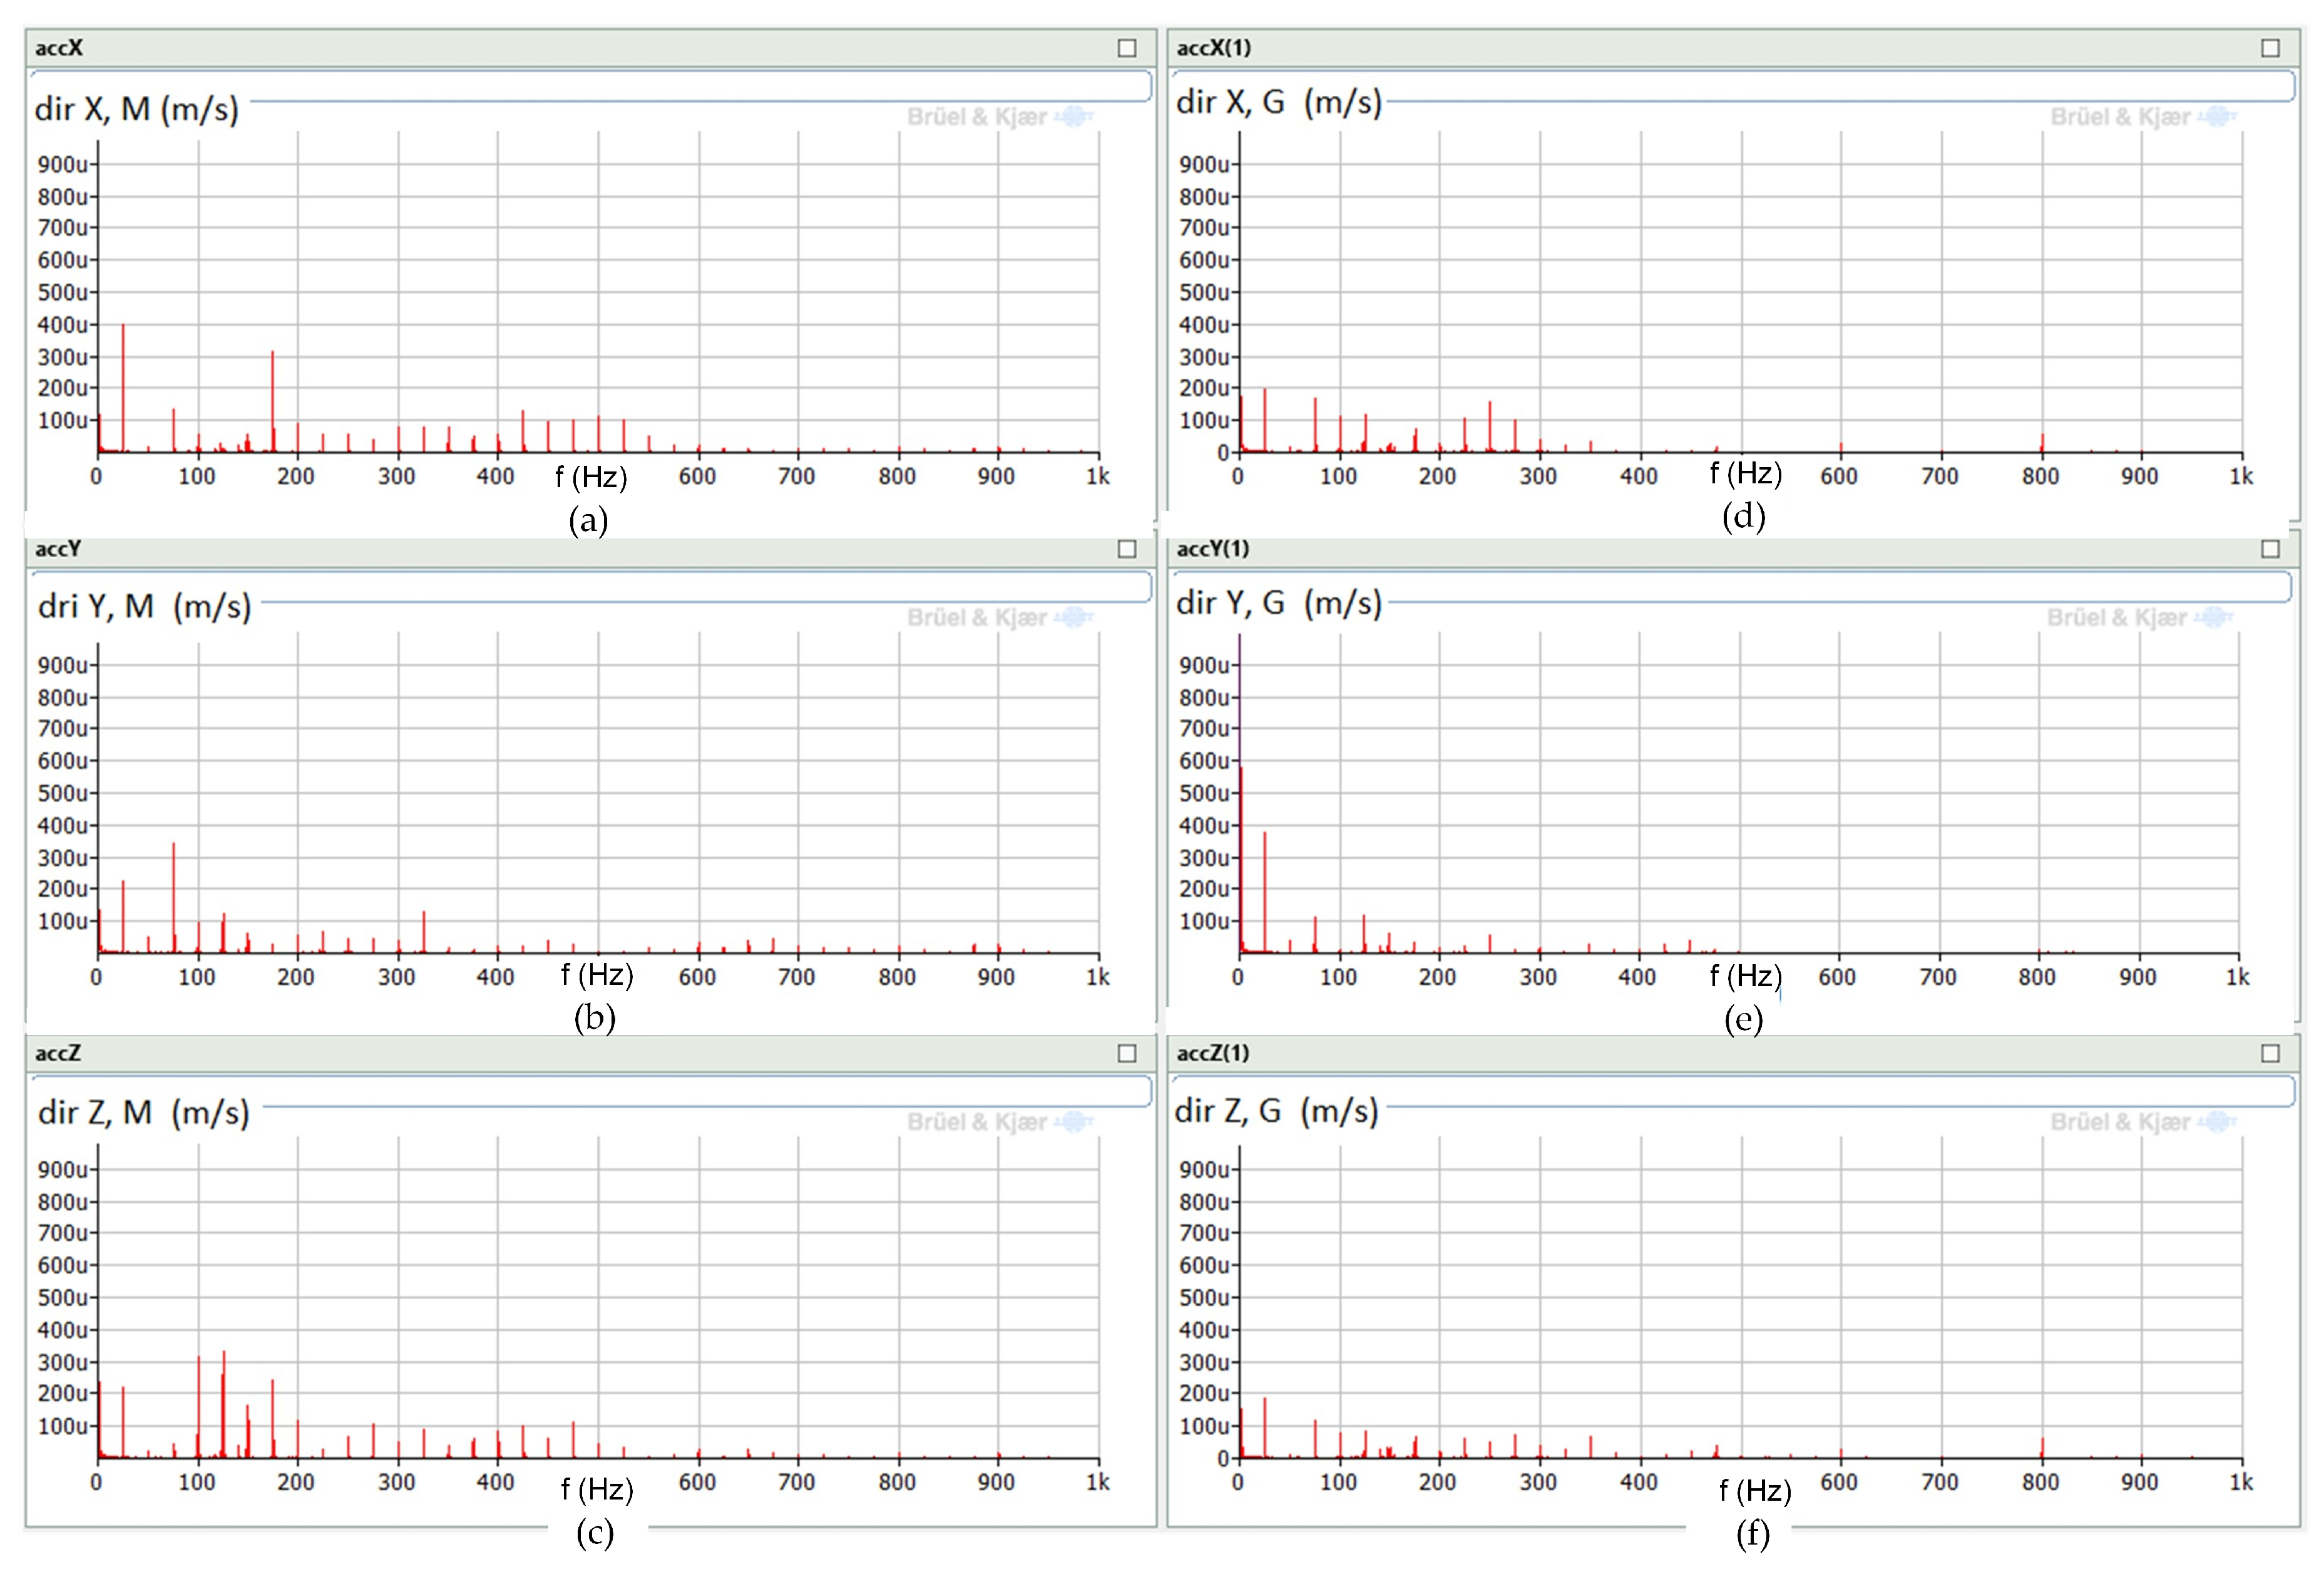
The following Figure 23 presents a summary of the machine vibration speeds for individual frequencies obtained from measurements made with uniaxial accelerometers. The FFT analysis of machine vibrations at speeds of 900 rpm and 1500 rpm are presented in Figure 24 and Figure 25.
The distributions of effective vibration values for data obtained with uniaxial accelerometers are similar. All measurements attain a velocity value of no more than 1 mm/s, thereby rendering this discrepancy negligible and within the acceptable parameters as outlined by the established standard. In the case of the FFT results, they appear to be more complex than those obtained with the triaxial accelerometer—the dominant harmonics achieve higher amplitudes. Notwithstanding, it is imperative to note that the results obtained through the utilisation of both methodologies are indeed comparable, thus facilitating the identification of the dominant harmonics.
The spectra are significantly more complex and distributed differently on the side of the motor loaded by the induction generator at different machine speeds. This was demonstrated by the results obtained using two types of sensor. Comparing the spectra calculated for the driving and loading machines reveals similarities in the dominant frequencies, which vary along the X, Y, and Z axes of the recorded vibrations. The variability of the vibration spectral characteristics is significantly greater than that of the voltage and current spectral characteristics recorded for the tested machine. Voltage and current spectra for the same drive unit configuration (Section 2.1) are easier to characterise and quantify. Therefore, it can be concluded that analysing vibration velocity spectra is much more difficult, and finding an alternative method of assessing vibrations in both machines requires further research. This example also demonstrates that vibrations are transferred from one machine to another, even when the generator is not powered—it passively suffers the same destructive effect.

3.2.2. Analysis of the Drive Unit with a Synchronous Machine Operating as the Generator

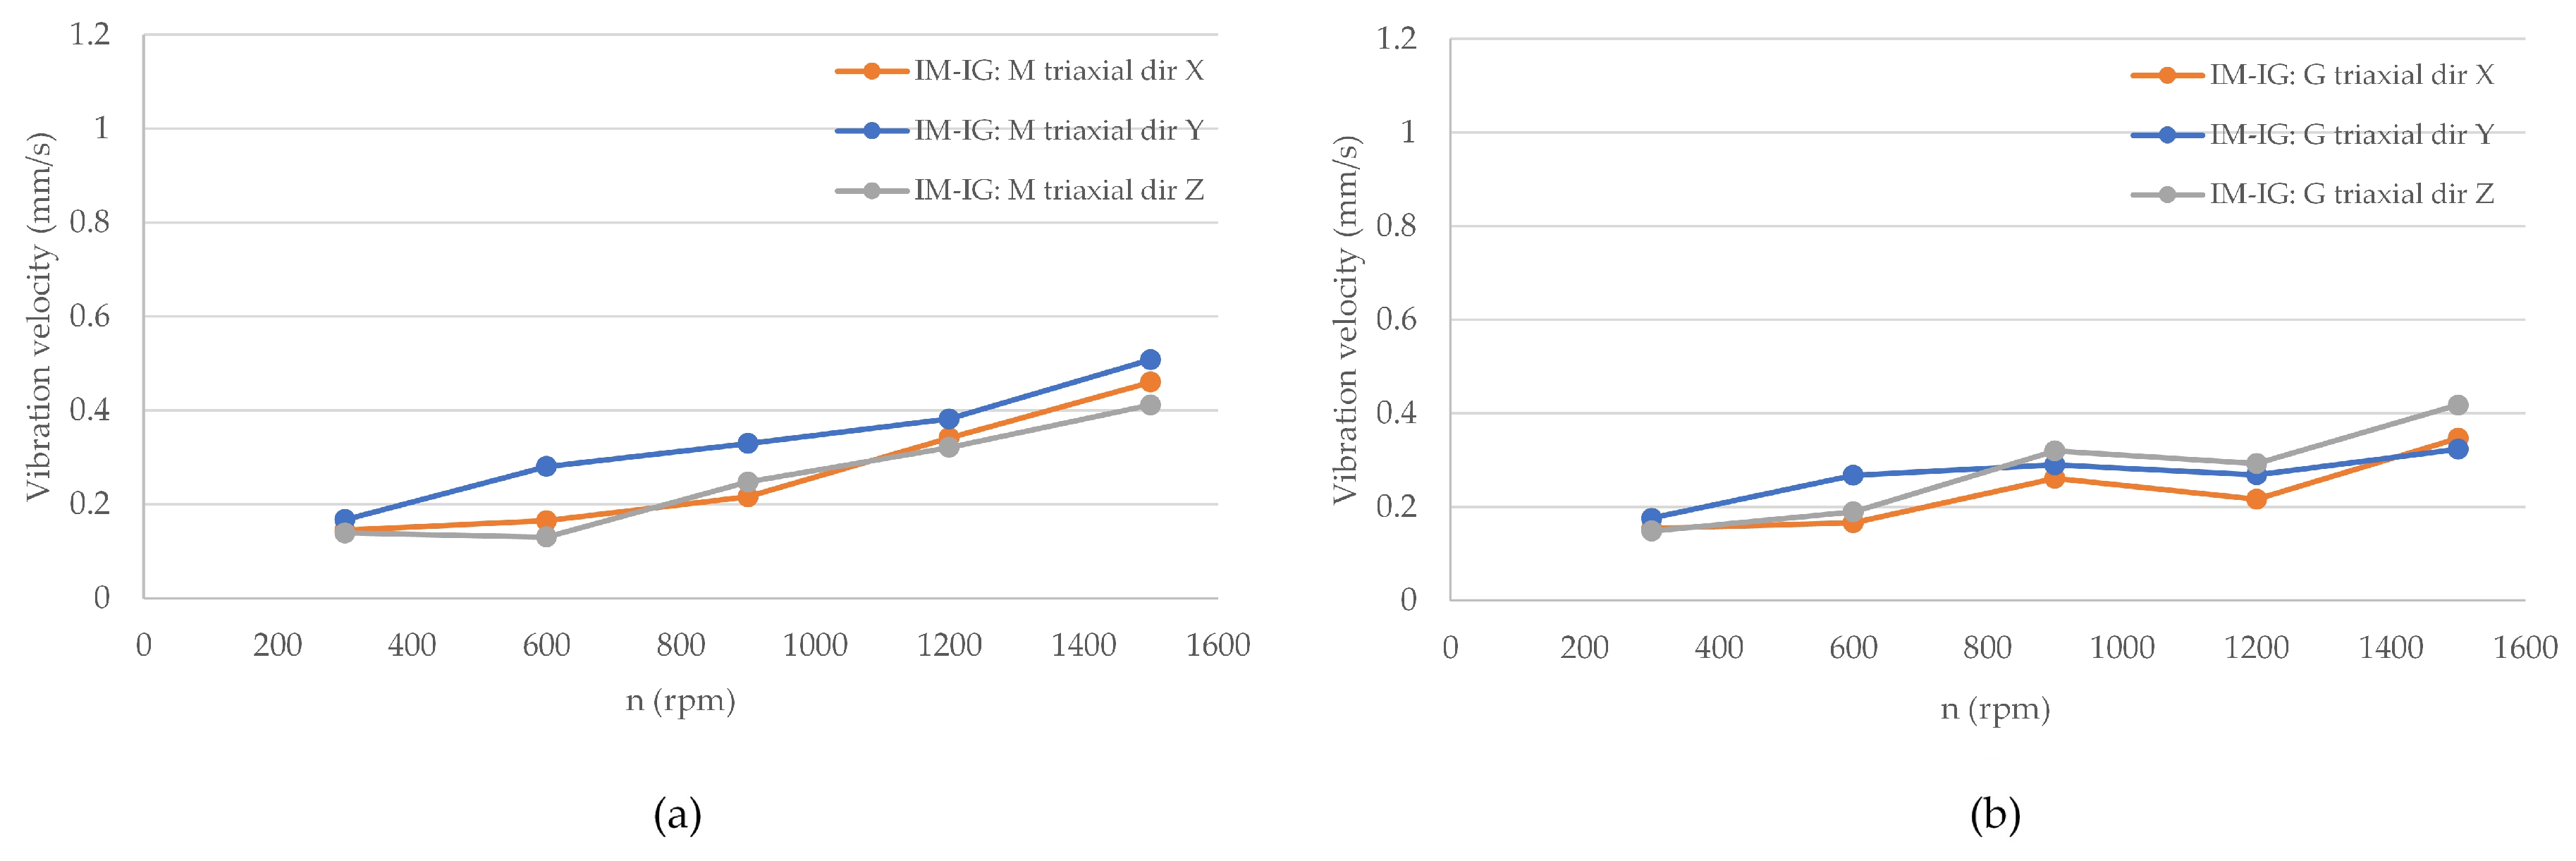
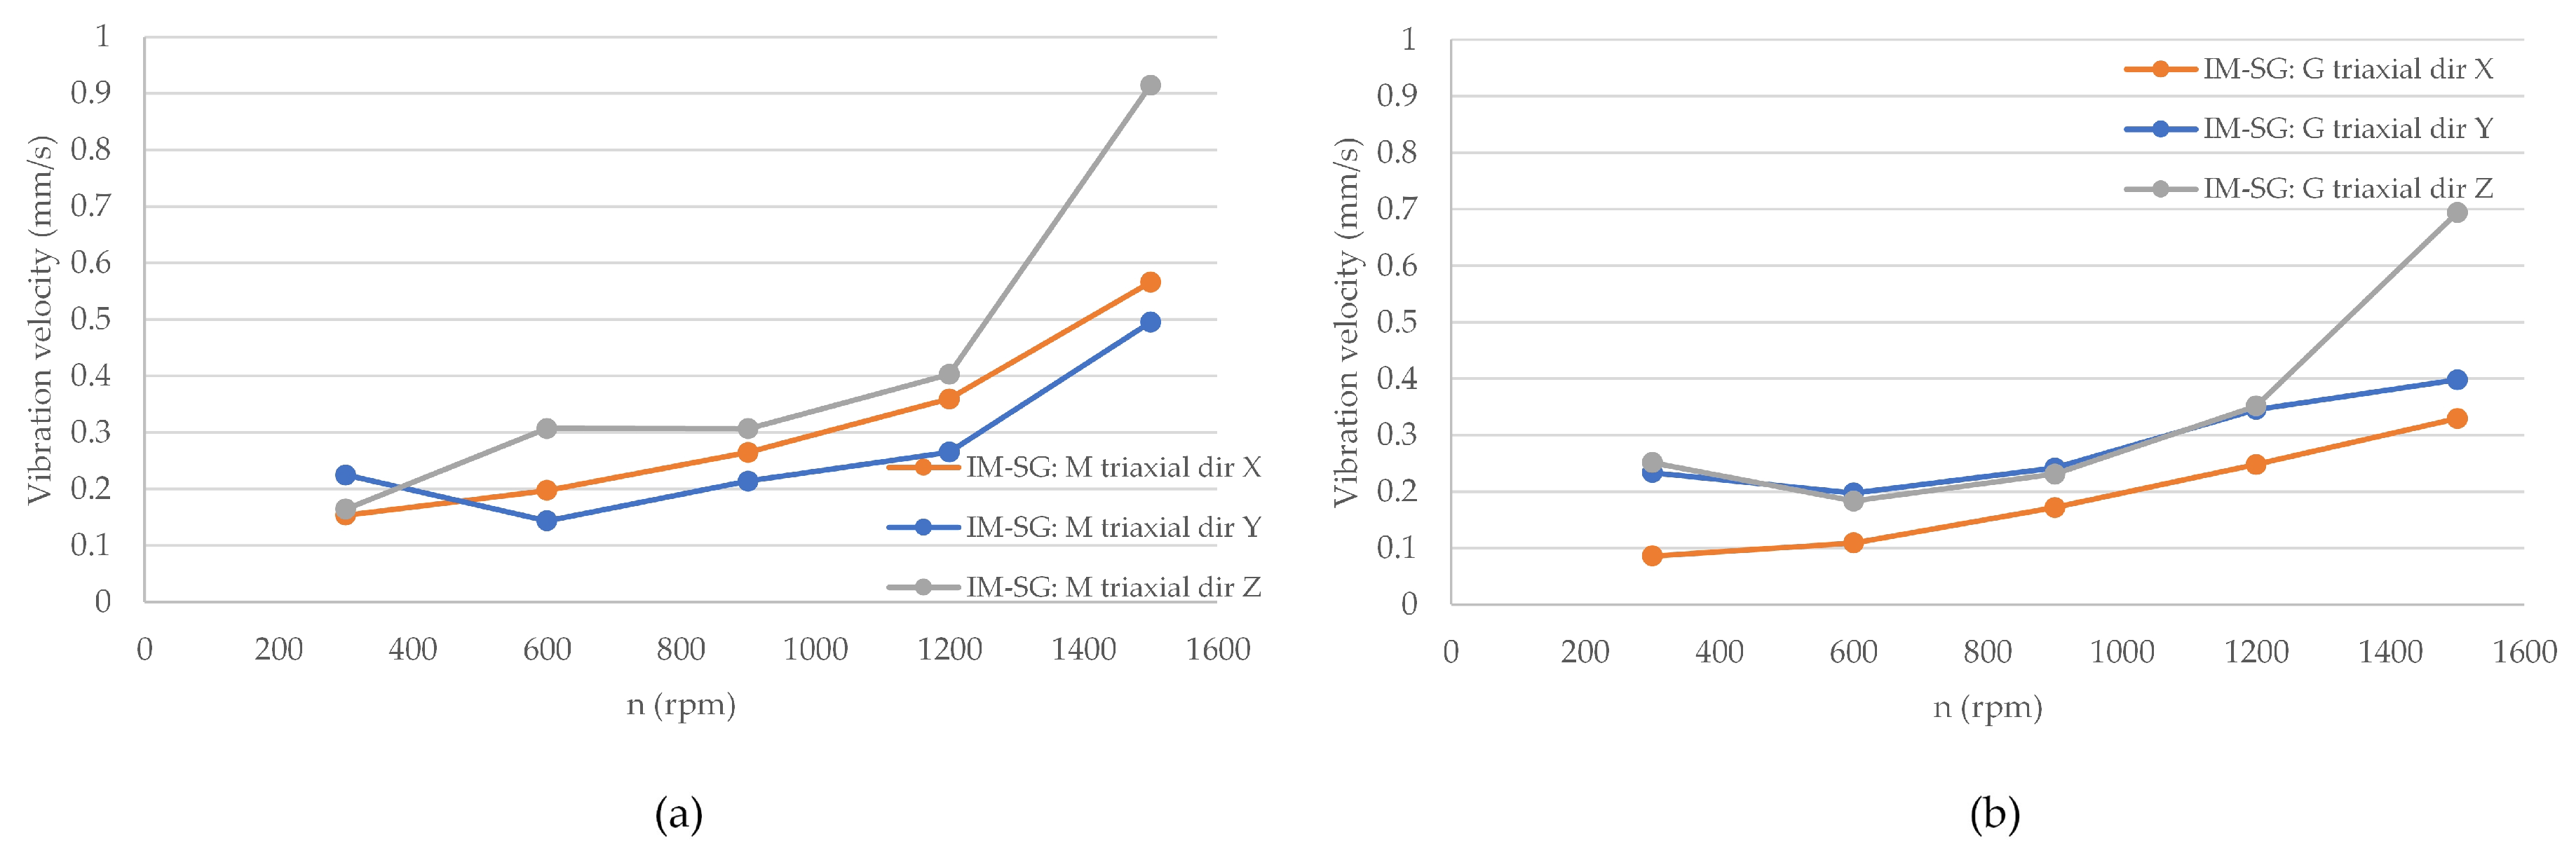
The presented case pertains to a drive unit that incorporates an induction motor and a synchronous generator. The measurement procedure for the unit with a synchronous machine acting as a generator was consistent with the procedure for the induction machine acting as a generator. As illustrated in Figure 26, the vibration velocity is depicted as a function of rotational speed for both the motor and the generator. This figure has been derived from measurements conducted with the utilisation of a triaxial accelerometer. The measurement points remained constant, thus establishing a speed range from 300 to 1500 rpm. Similarly to the previous case, an FFT analysis of the drive unit vibrations has been conducted in order to further expand the analysis of the obtained results. Figure 27 and Figure 28 depict the FFT analysis of the motor and generator vibrations at 900 rpm and 1500 rpm, respectively. The abbreviations placed in the figures are consistent with those explained in Section 3.2.1.
The obtained characteristics (Figure 26) demonstrate that the vibration velocities in the individual axes are characterised by analogous levels. Once again, it has been demonstrated that as the rotational speed increases, the vibration velocity value also rises, although it never exceeds a value greater than 1 mm/s. The FFT analyses (Figure 27 and Figure 28) suggest similar conclusions to those observed for the first configuration of the drive unit.
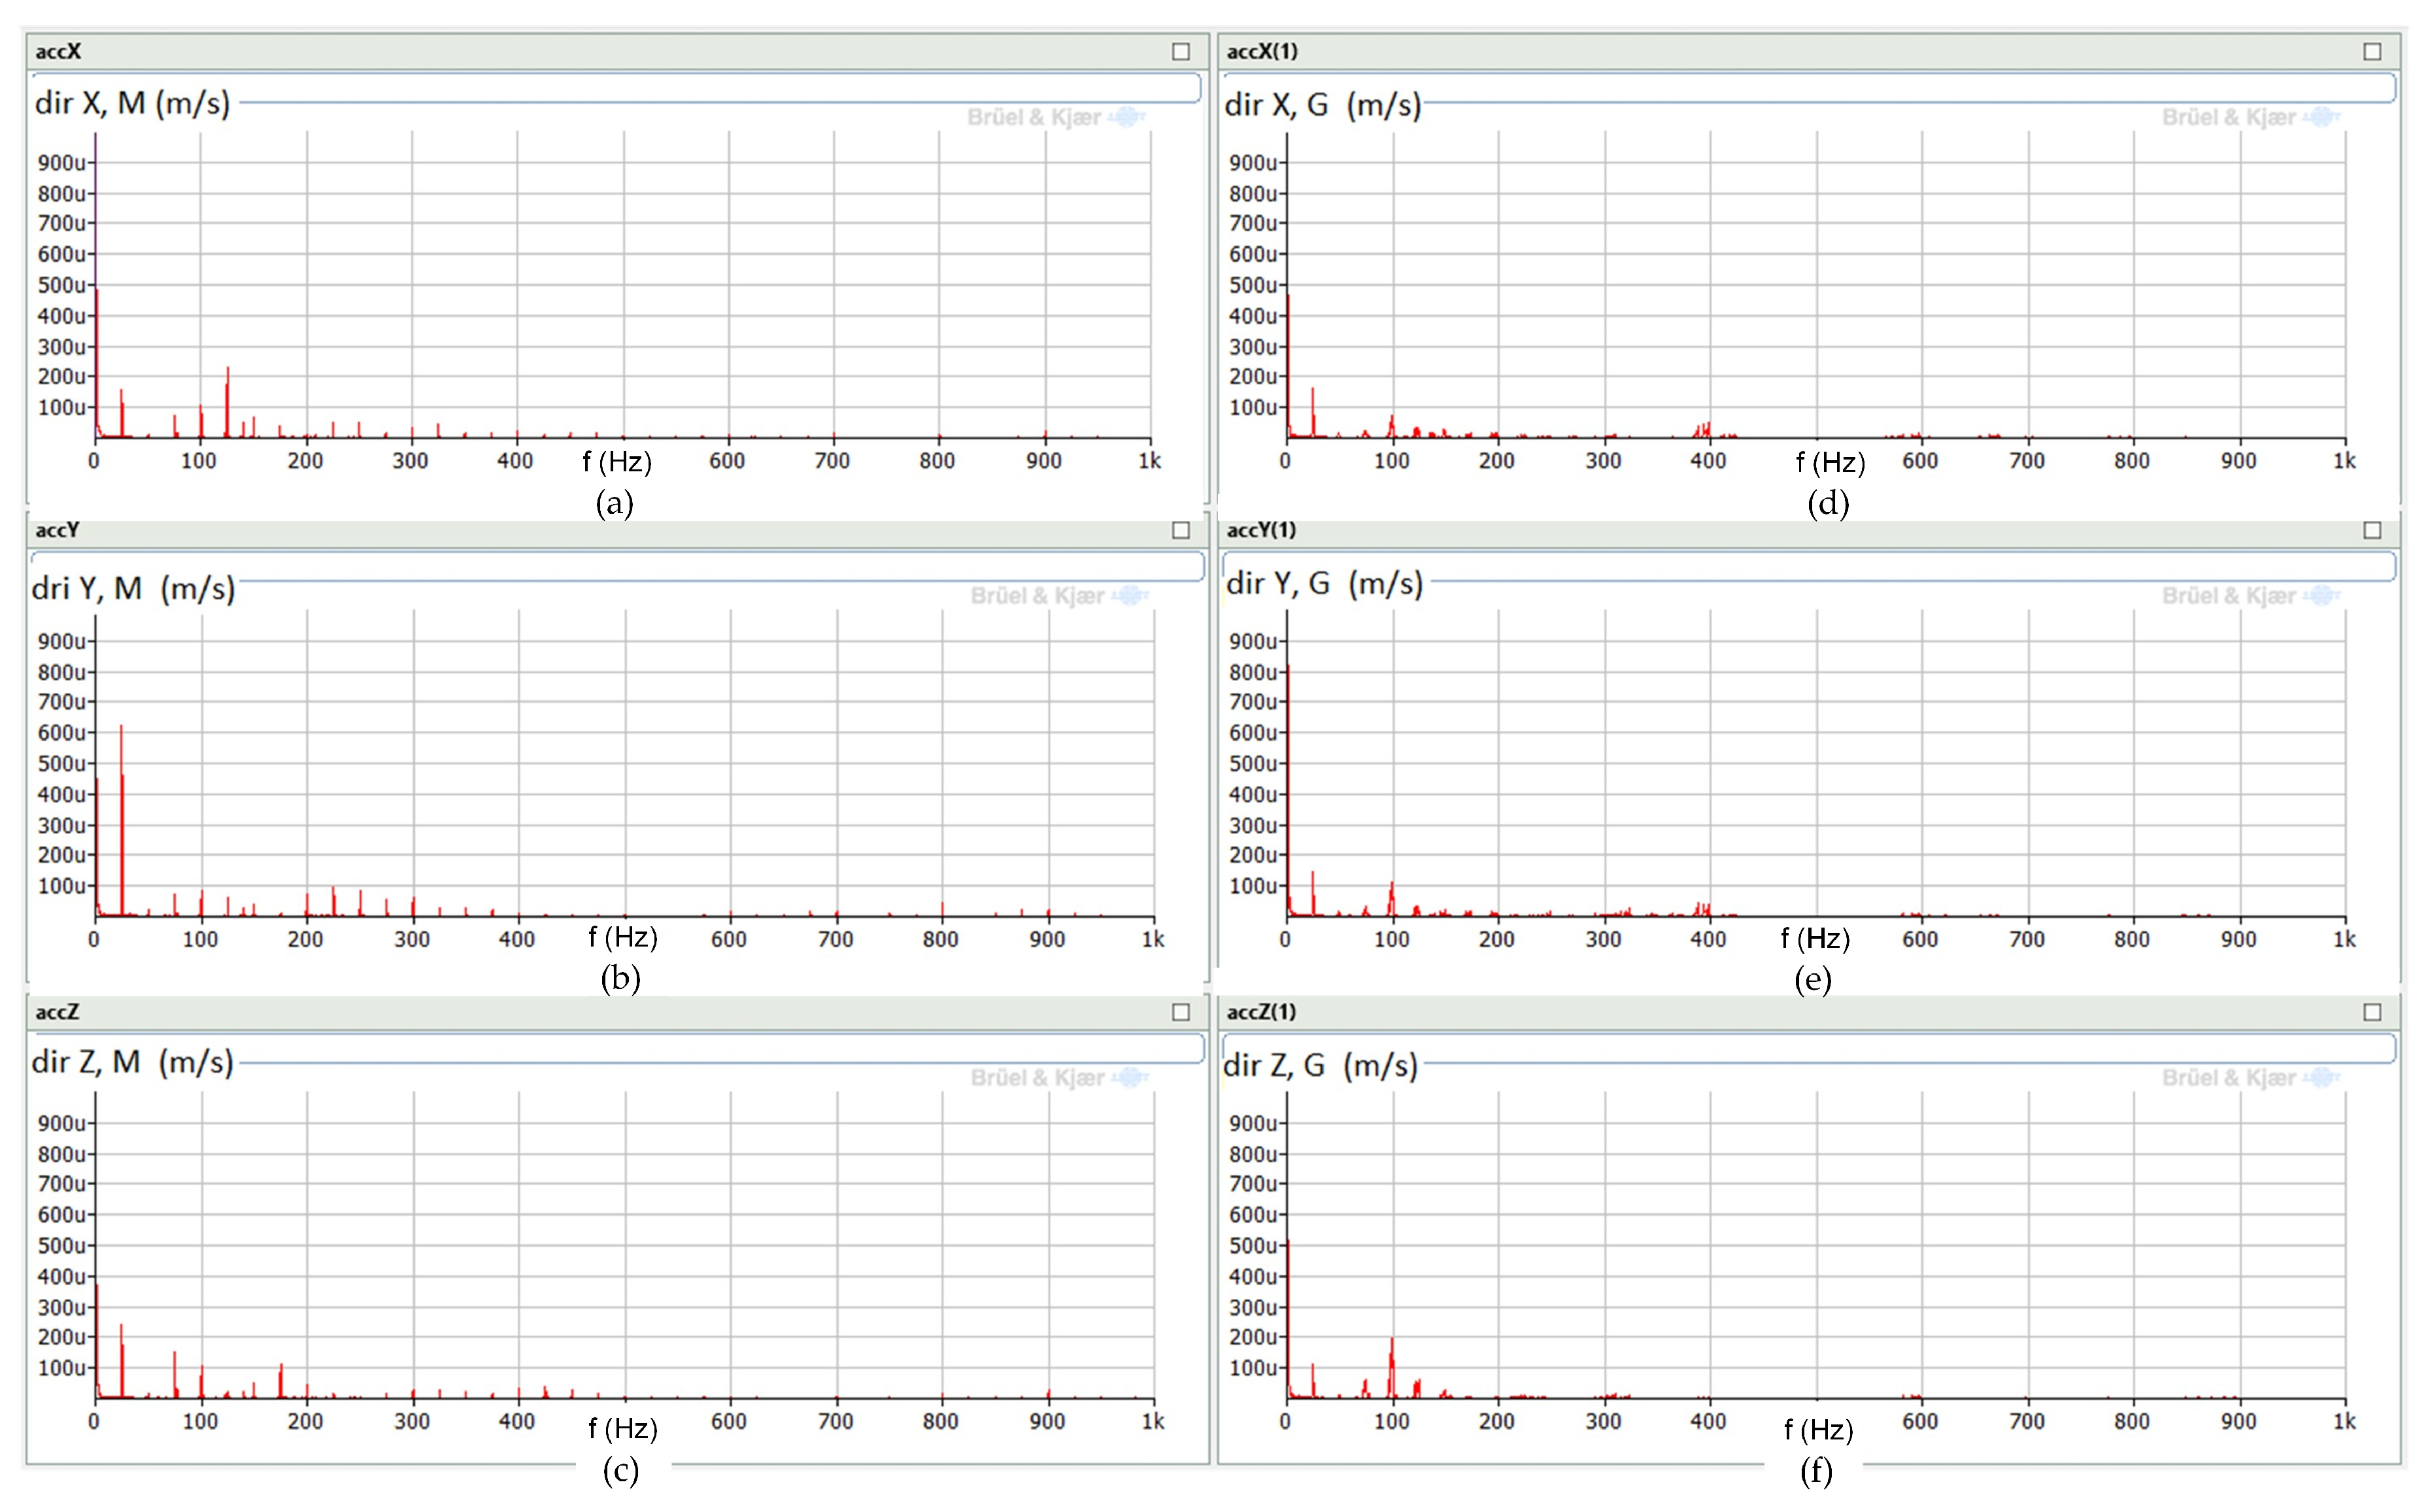
For measurements conducted using uniaxial accelerometers, the same analyses were performed as for triaxial accelerometers. Figure 29 illustrates the distribution of effective vibration values as a function of motor and synchronous generator speed for individual rotational speeds. The FFT analyses of the measured vibrations are presented in Figure 30 and Figure 31.
The measurement results after the change of the generator have demonstrated uniformity with the other measurement series, thus indicating that the change has not caused any deviation. Furthermore, measurements undertaken using uniaxial accelerometers have demonstrated comparable vibration velocities for both the motor and the generator. Vibration velocities obtained with uniaxial accelerometers have not exceeded 1 mm/s. The results for the individual measurement axes are analogous. The FFT analyses once again demonstrate a high degree of similarity with the previous measurement series.
Although the presented results indicate a high degree of similarity, it should be noted that the RMS vibration velocity distributions are characterised by greater dispersion about the XY axis for vibrations measured with uniaxial accelerometers than with triaxial accelerometers. This finding shows that a triaxial accelerometer is a more suitable and accurate measurement tool for vibrations in electrical machines, as it is both compact and more user-friendly than an uniaxial accelerometer. The recording of vibrations in the Y axis with both accelerometers should yield similar results, under the assumption that the accelerometers are equivalent in terms of parameters and weight. However, a clear distinction emerges in the X-axis recording configuration. In the case of a uniaxial accelerometer, the axis does not align with the electrical machine’s mounting axis. Conversely, for a triaxial accelerometer, there is alignment between the axes. The authors also considered an alternative sensor arrangement, but this has yet to be verified through measurement. It should also be noted that the X and Y coordinate system may change if the machine mount is changed. These are topics that should be investigated and verified in further experiments.

3.3. Overview of Vibration Analysis Methods in Electrical Systems

Technological advancements and the convergence of disciplines such as mechanics, electrical engineering, electronics, and automation have enabled the development of increasingly complex systems, including cars, aircraft, and ships. Recent efforts to optimize energy consumption, environmental impact, and user comfort have heightened the focus on noise, vibration, and harshness (NVH).
Transmission Path Analysis (TPA) was developed as a tool for improving NVH performance in interacting subsystems. For instance, a combustion or electric engine in a car, acting as a source of vibration and noise, directly affects the cabin and passengers [30,31,32,33,34,35,36,37]. TPA measures the impact of the noise or vibration generated by the source on the receiver and determines which transmission paths are involved. In essence, the method quantifies the relationship between the input signal generated by the source and the output signal measured at the receiver. Depending on the selected input and output signals, different TPA variants can be applied, ultimately enabling the identification of transmission paths that should be modified to improve system performance.
Classical TPA has been widely used to improve the NVH performance of vehicles, aircraft, and marine systems. However, its limitations—such as high instrumentation requirements, significant time demands, and reliability issues—have motivated researchers to develop faster in situ techniques [30,32,33,38,39,40]. Among these are Operational Path Analysis (OPA) and Operational Path Analysis with External Inputs (OPAX). OPA is the simplest and fastest to implement, but its reliability is difficult to evaluate, particularly when cross-coupling occurs or when all active paths cannot be included in the analysis [30,39,40]. OPAX, developed as an evolution of TPA and OPA, introduces a parametric model to estimate operating loads [33]. This approach provides greater accuracy than methods traditionally used in TPA, such as dynamic stiffness, though it is computationally more expensive than OPA.
The above overview highlights that methods such as TPA, OPA, and OPAX are primarily intended for very complex systems, where extensive in situ measurements are feasible [41]. The authors’ intention, however, is to propose a simpler approach that can be applied in industrial or marine environments by engineers working directly with electrical machines. The vibration problem in electric machines is particularly complex. Even if the machine is built with high-quality mechanical components, properly aligned and mounted on an ideal foundation, vibrations may still arise due to factors such as poor control strategies or interference transmitted through the power supply system, leading to the appearance of subharmonics or interharmonics [24,25].
During the design phase, advanced methods such as the finite element method (FEM) allow modelling of electrical machines from both mechanical and electrical perspectives. However, once machines are integrated into specific applications and combined with other devices into systems, the laboratory-based approach loses effectiveness. While it is possible to optimize a drive unit for a dedicated system, such as a car or boat, typical application conditions of electric machines are often random and cannot always be accurately modelled. Under such conditions, practical compromises are required, and simplified methods for assessing vibration levels and their impact on system components must be developed.
Therefore, vibration analysis of electric machines, often used as drive units, must be tailored to operational needs. For this reason, the authors focused on the possibility of performing quantitative vibration assessment appropriate for electric drive units. The literature describes many methods for identifying modal parameters of dynamic systems, most of which are based on similar mathematical principles but differ in implementation (data reduction, matrix operations, solution of governing equations, etc.). For the purposes of this work, only methods relevant to the proposed approach have been considered.
One of the most important selection criteria is system complexity, often expressed in terms of degrees of freedom (DOF). Methods for single-degree-of-freedom (SDOF) systems are relatively simple, deriving from basic theoretical relationships and requiring little computational effort. They are less accurate than methods for multi-degree-of-freedom (MDOF) systems but remain useful when, near a given natural frequency, the system behaves like an SDOF and the influence of other vibration modes can be neglected. Such methods are typically applied in the frequency domain and include the Logarithmic Decrement Technique (LDT) and the Half Power Method (HPM). In contrast, MDOF systems with high damping or strong mode coupling require more advanced time-domain techniques, such as the Eigensystem Realization Algorithm (ERA), Auto Regressive Moving Average (ARMA), Least Squares Complex Exponential (LSCE), or Random Decrement Technique (RDT).
An electric drive operating within a complex system can often be reduced to an equivalent SDOF representation. In this context, methods such as LDT, potentially with modifications, offer a practical solution. Along with system complexity, data availability also plays a critical role. For vibration analysis, the measurable quantities include acceleration, velocity, and displacement. Applicable standards for electrical machines serve as a reference point, as they define acceptable vibration levels based on machine speed.
Another key issue is the choice of representative parameters. While many mechanical applications rely on vibration amplitude (A) or root mean square (RMS) values, the authors’ method emphasizes RMS. This choice is supported by standards [27,28,29], which recommend RMS values and specify acceptable vibration limits accordingly. RMS values describe the effective signal level and correspond to signal power, which is particularly relevant in energy-based analyses. Moreover, RMS enables consistent monitoring of vibration levels for individual machines as well as for their interactions in transmission studies. The relationship between mean square (MS) and RMS is expressed as:
RMS = MS .
Using RMS does not preclude switching to MS or adapting the proposed approach further if needed.
Taking into account the strengths and weaknesses of existing approaches, the authors propose a normalized index representing the change in vibration between the driving and loading machines:
Δ RMS i = V RMS gen i V RMS motor i ,
where i denotes the effective vibration velocity value determined in the x, y, and z directions.
Interpretation of this indicator is straightforward: if ΔRMSi > 1, vibrations have amplified in the system, while ΔRMSi < 1 indicates damping. Moreover, analysing the indicator across x, y, and z axes provides insight into whether issues stem from the foundation, coupling, or control system. Although identifying specific causes requires further research, this approach allows a useful first step in evaluation. Compared to TPA and its derivatives, the proposed ΔRMS index is less precise and does not enable full decomposition of vibration propagation paths. However, it offers substantial practical advantages: it avoids time-consuming system identification, requires only two measurement points, and involves minimal computation. While less accurate for detailed propagation analysis, ΔRMS is well suited for online monitoring and rapid diagnostics where a relative measure of vibration transmission efficiency is sufficient. We could also consider modifying this relationship and presenting it on a decibel scale, which is a common practice in electrical engineering, electronics, and automation:
Δ RMS i = 20 log V RMS gen i V RMS motor i .

3.4. Analysis of Vibration Transmission Between Machines in the Tested Drive Unit

The majority of studies on vibration in electrical machines are conducted on a single machine or a set of machines. However, these studies do not typically involve a more in-depth analysis of the effects on the generator. They regard the primary function of the generator as to simulate specific operating conditions and to impose a particular effect on the motor. In fact, however, it is usually the other way around, as we tend to operate electrical machines as a unit in order to transfer forces from the machine acting as a motor to the machine acting as a generator and get work. In such a situation, not only are forces transferred, but also the accompanying vibrations.
From the analysis of effective vibration values and vibration amplitude spectra conducted thus far, it has been concluded that, when a drive unit operates in different configurations, effective vibration values and their distribution are the most useful for comparing two machines within a unit. However, spectral analysis is more difficult to interpret because it changes with even small changes in the machine’s operating speed and even more so across different configurations. Therefore, this subsection proposes analysing the characteristics by combining the effective vibration values on the motor and generator sides of the machine.
A variety of methodologies are employed to describe and analyse vibrations in mechanics, depending on the machine’s operating conditions. The works [16,21,22,42] present an overview of methods for the analysis, diagnostics, and monitoring of electrical machines. The aforementioned methodologies employ measurement data in the time or frequency domain. The primary function of these sensors is to compare historical data derived from cyclically recorded vibrations. This data is then utilised to assess the machine’s mechanical condition. Furthermore, mathematical models adapted to methods based on 2D and 3D finite element models are also employed. This approach is typically applied to individual machines or select components, such as discs and housings. Finite element methods are a solution to the challenge of preparing a sufficiently detailed digital model that accounts for rotational motion. In addition to the issue of model accuracy, the capacity to calculate it is also of paramount importance, a process which necessitates substantial investment in appropriate equipment.
The approach delineated in this paper constitutes a preliminary step towards the development of a compact method for analysing two electrical machines operating at a constant speed in an industrial environment. A review of the literature on vibration analysis, diagnosis, and monitoring methods reveals a paucity of research in the area of the effects of vibrations on two electrical machines operating as a drive unit. In this paper, the relationship between vibrations in a given axis between the generator and the motor is expressed as the ratio of the effective value of the loading machine vibration to the effective value of the driving machine vibration.
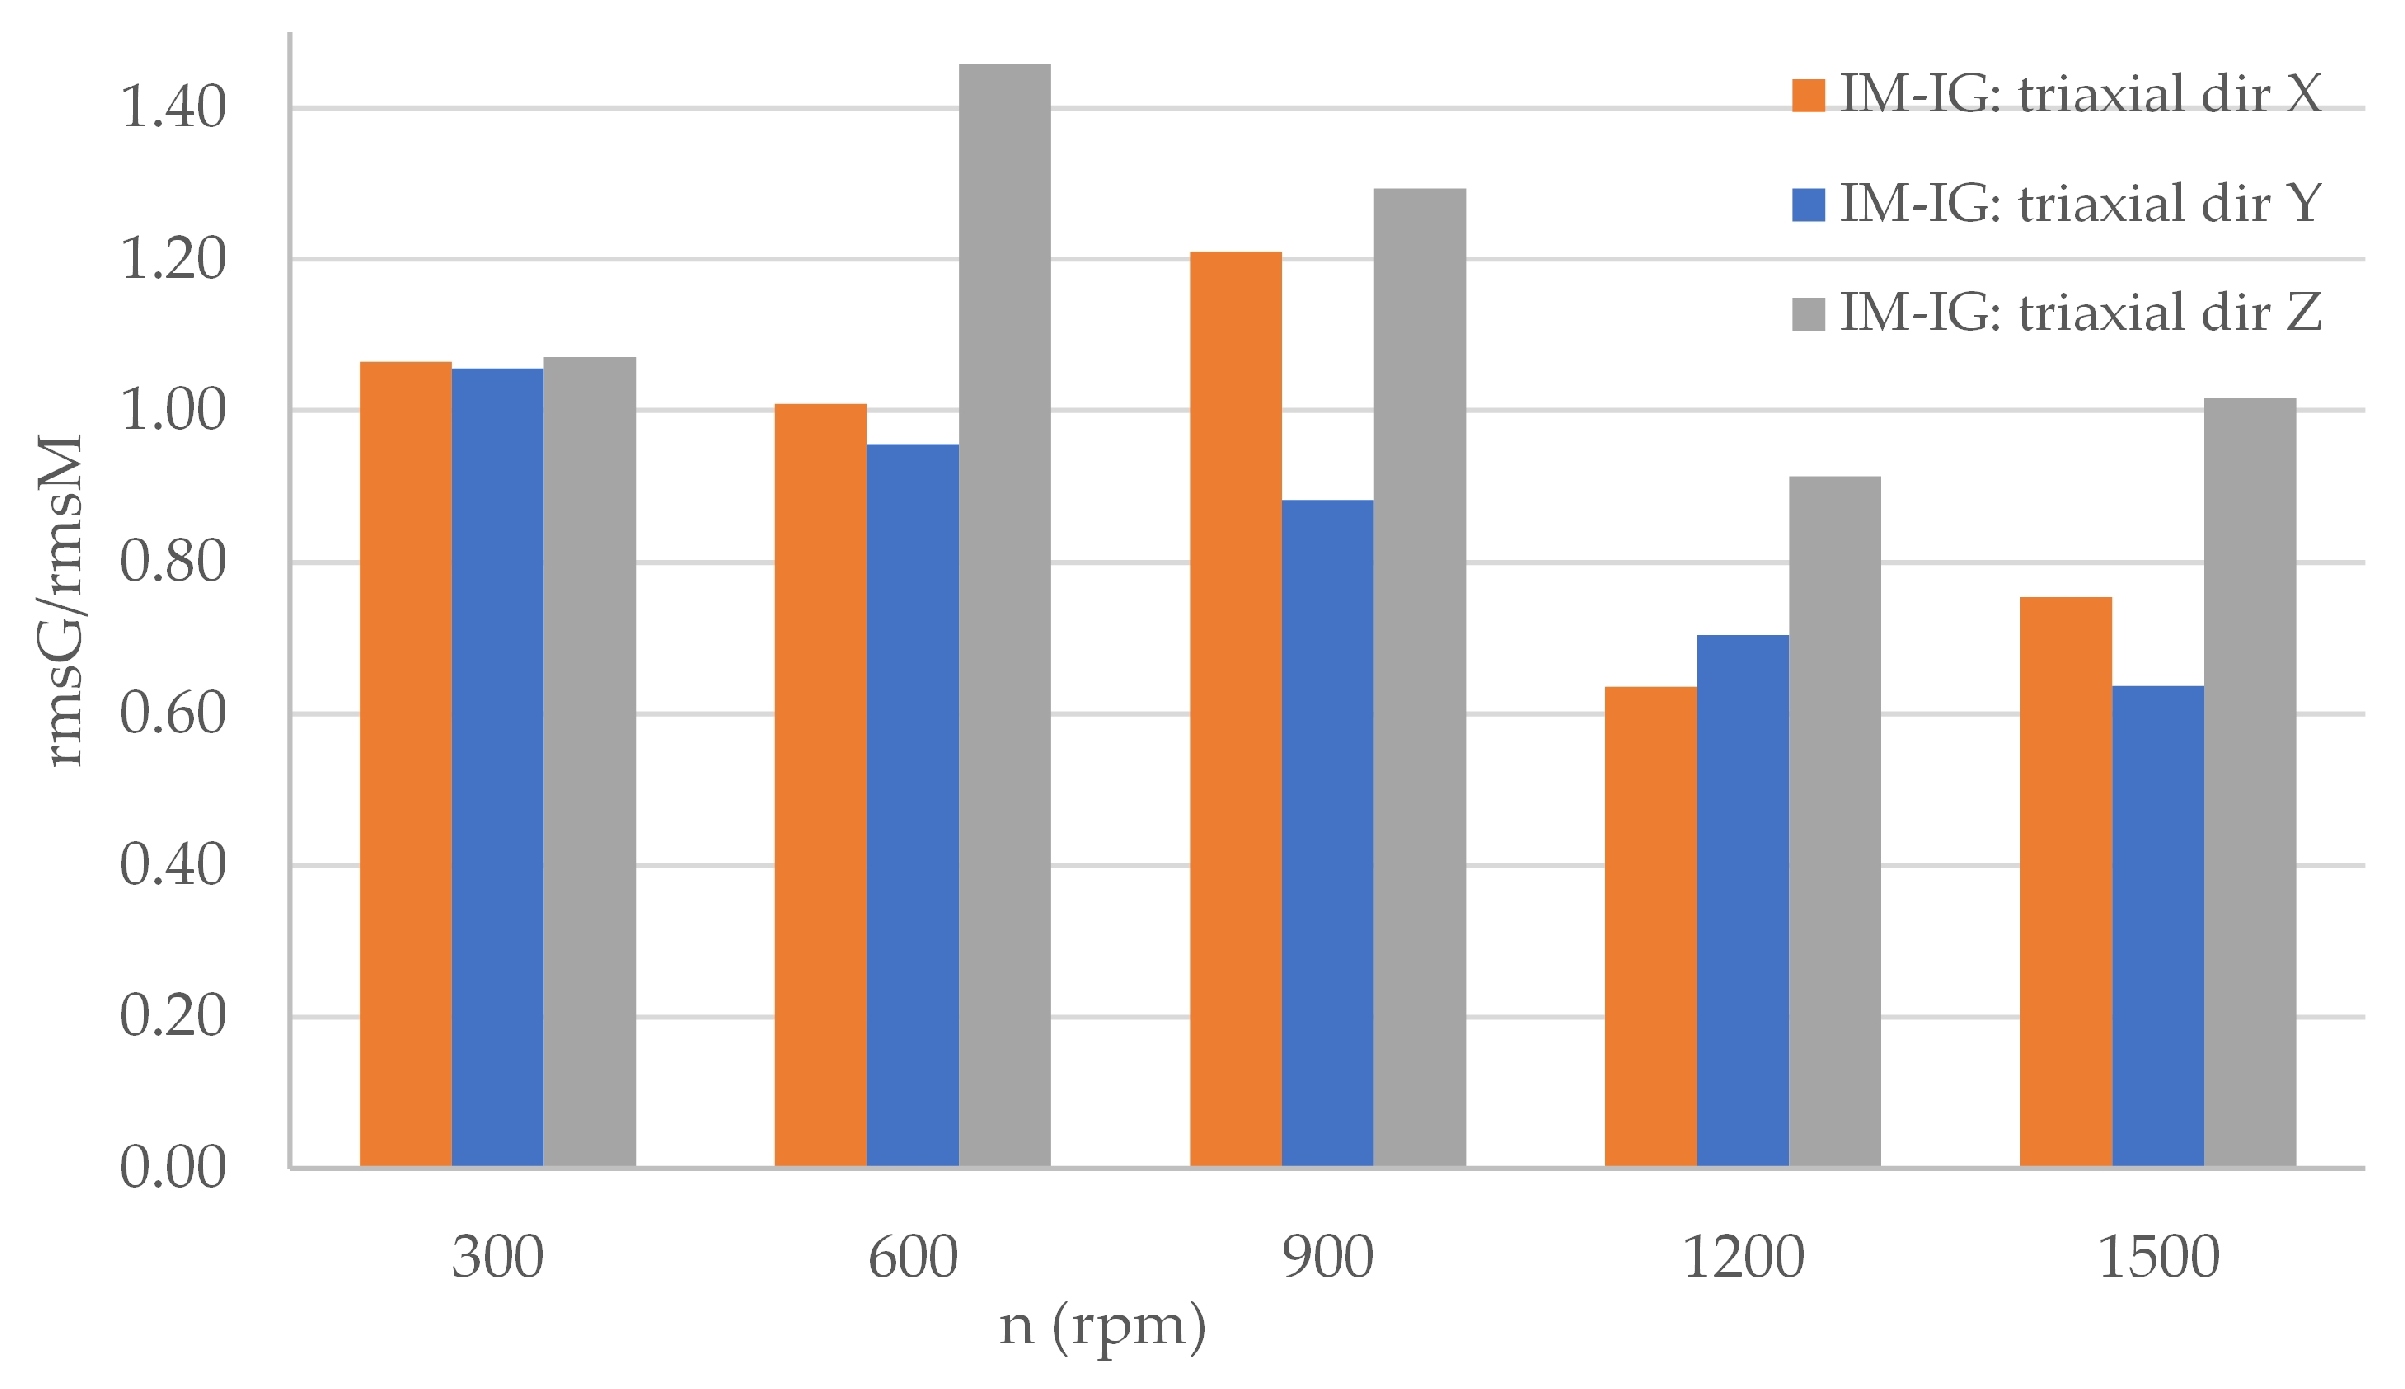
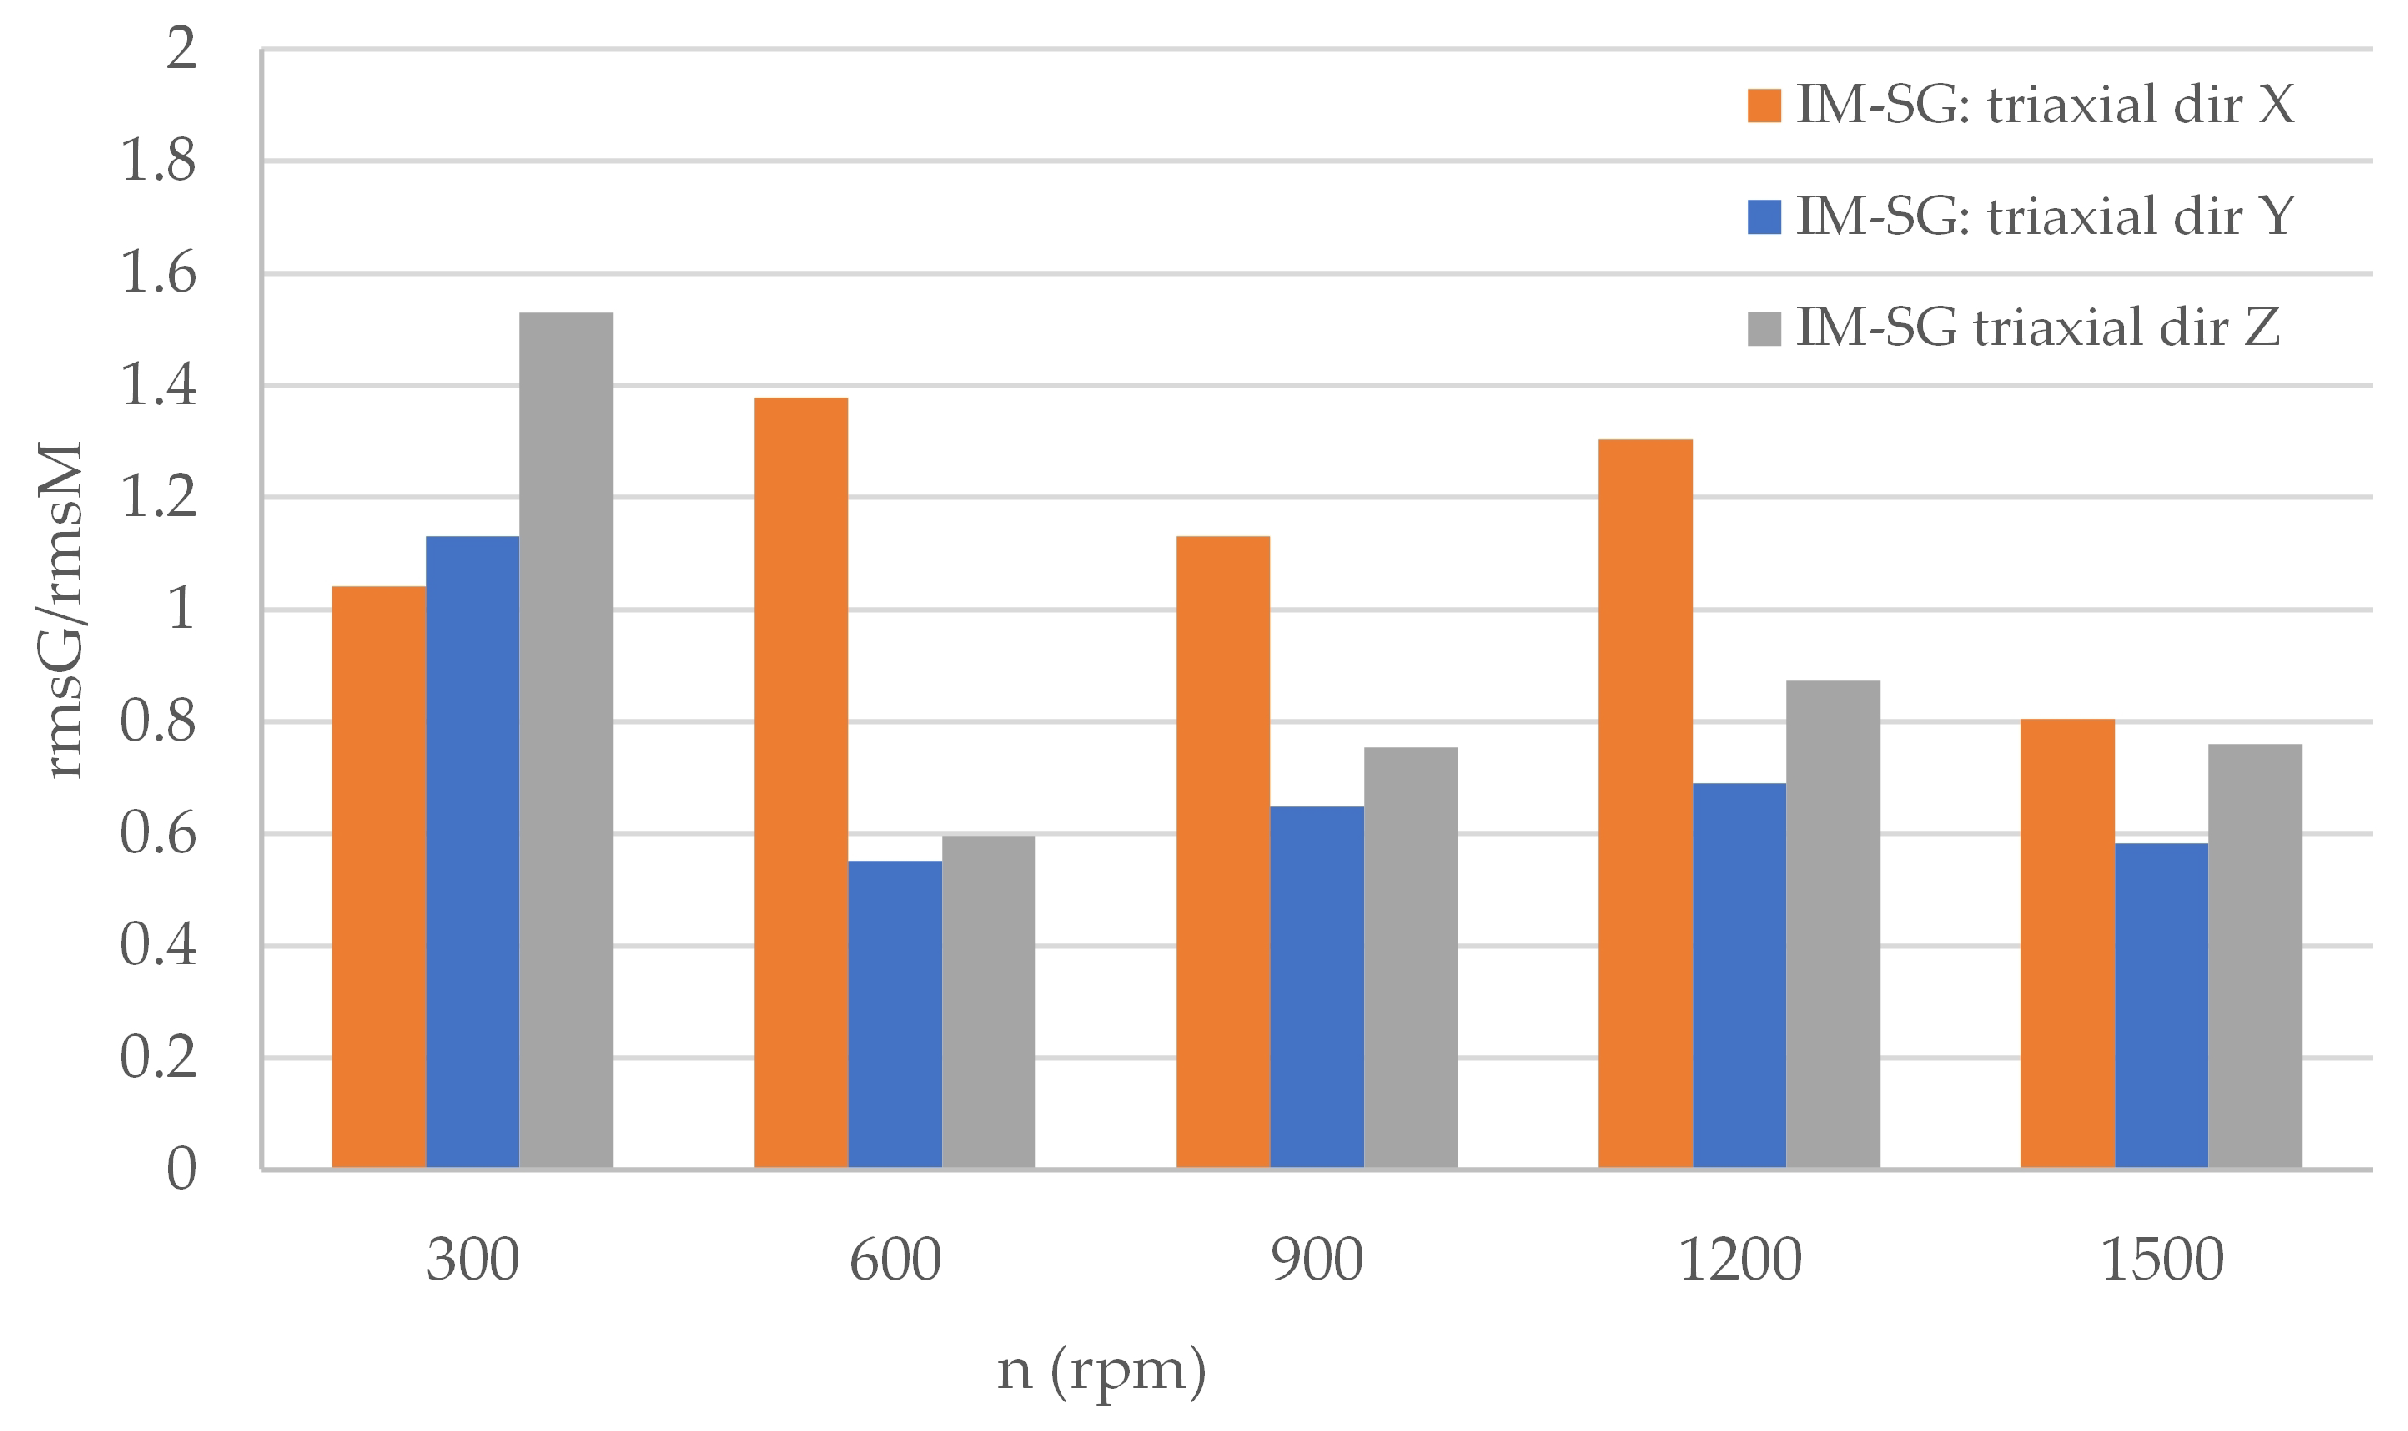
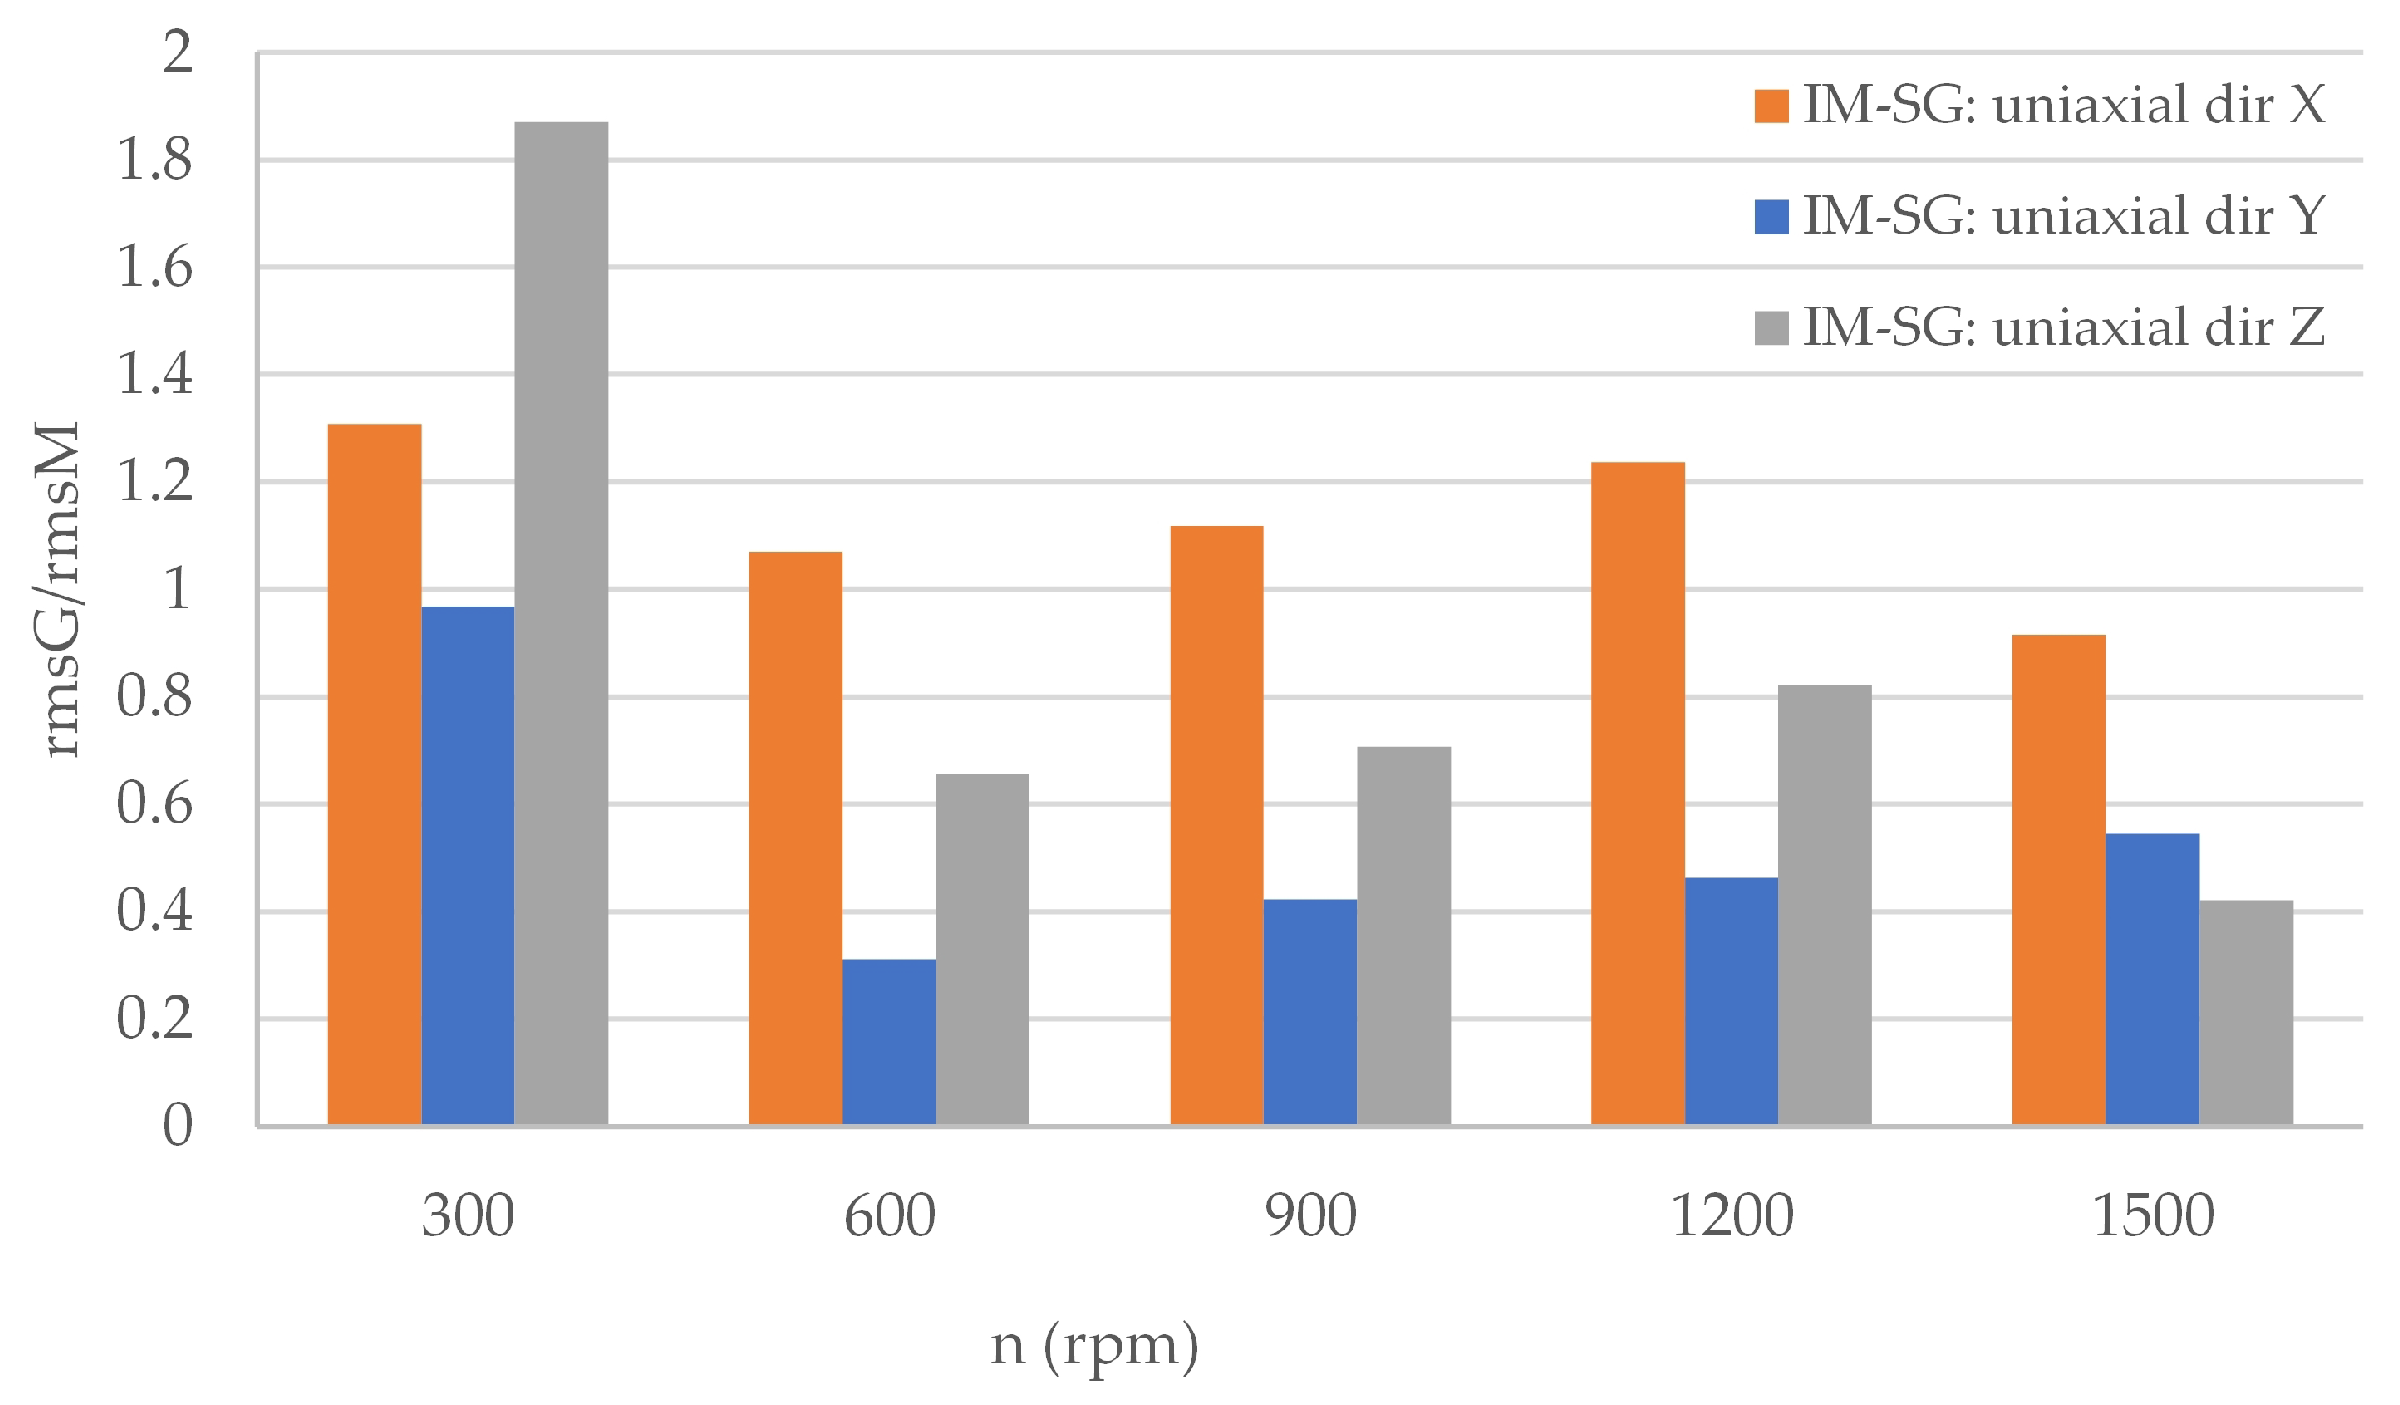
As demonstrated in the preceding figures (Figure 20, Figure 23, Figure 26 and Figure 29), the distributions of effective vibration velocities have been calculated and presented as normalised characteristics. These express the ratios of effective vibration velocities between the generator and the motor. Distributions of this nature have been developed for data obtained using triaxial accelerometers and uniaxial accelerometers. Adopting the previously established sequence, Figure 32 presents the distribution of changes in electrical machine vibrations as a function of frequency for a set of two induction machines, measured in the X, Y, and Z axes, using a triaxial accelerometer. Figure 33 presents a similar comparison but for
The normalized distribution of effective vibration velocity values for electric machines detected by uniaxial accelerometers is between 0.4 and 1.0, with the lowest deviation observed for the X-axis accelerometer, while the distribution obtained for data achieved by a triaxial accelerometer shows variations from 0.6 to 1.4. The profile and trend of changes in the values for such a distribution can be an interesting parameter indicating the interaction of the components of such a system as a whole and their impact on vibration emission. This proposal necessitates further research and testing. Figure 34 and Figure 35 present analogous distributions for a set of electric machines, in the case where the set consists of an induction machine and a synchronous machine with permanent magnets. However, a comparison of the distributions for the set of induction motor and synchronous generator demonstrates a high degree of similarity in the results obtained using triaxial and uniaxial sensors.
The characteristics proposed in this paper, which represent the distributions of the ratios of the effective vibration values of the generator to the effective vibration values of the motor, appear to offer a valuable method for the assessment of vibrations for a given set of electrical machines. In contrast to the effective vibration distributions on the motor and generator sides presented in the preceding Section 3.2, the proposed characteristics with normalized distributions possess the additional advantage of aggregating vibrations recorded on both sides of the drive set onto a single characteristic and indicating their interactions. This includes the vibration tendency that may result from the control method or the quality of the supply voltage.

4. Conclusions

The presented paper depicts the results of vibrations of an induction motor drive unit in two load configurations—one with an induction machine and the other with a permanent magnet synchronous machine. In both cases, the presentation of measurement results commenced with a description of the drive unit’s power supply characteristics. The electrical parameters analysed included voltage and current waveforms obtained at the motor terminals, spectra, and the distributions of RMS and THD values of voltages and currents as a function of frequency. In both configurations, the voltage and current waveforms and their respective spectra demonstrated a high degree of similarity. Each voltage spectrum exhibited significant complexity, evidenced by a substantial number of higher harmonics, whereas the current spectra remained typical despite the characteristics of the supply voltage. The analysis confirms that comparable power supply conditions were achieved for both unit configurations. Ensuring consistent power and control conditions was critical, taking into account the unique characteristics of the dynamometer on which the machines were installed, to achieve the primary objective of the study.
The primary focus of this paper is a comparative analysis of vibrations transmitted within the drive unit between the motor and generator. Given the challenges associated with repeatability in vibration measurements, experimental tests were conducted for two distinct drive unit configurations, with measurements repeated for each configuration using a triaxial accelerometer and three uniaxial accelerometers. A unique laboratory stand was utilised to facilitate repeatable outcomes. The vibration results were analysed in terms of effective vibration values and their amplitude spectra. Vibrations were recorded in steady-state operation at defined rotational speeds for both the motor and generator, where “steady state” is defined as the point at which the motor achieves a constant speed at a given supply voltage frequency.
Analysis of the spectra of electrical and vibration signals indicates an absence of a direct correlation between the voltage and current spectra and the vibration velocity at specific frequencies. The supply voltage affects the rotational speed of the motor, which is the primary source of torsional vibrations. For example, with a supply voltage of 50 Hz and a two-pole induction machine, the rotational speed is determined as:
n = 60 · f u / p ,
where fu denotes the supply voltage frequency, while p the number of pole pairs. The resulting value for n is thus 1500 rpm. The corresponding vibration frequency fv is given by:
f v = n / 60 ,
which in the case under consideration means the fv equal to 25 Hz. The substitution of Equation (4) into Equation (5) enables the determination of the relationship between the vibration frequency and the supply frequency for an induction motor, which is as follows:
f v = f u / p .
Furthermore, it has been determined that the vibration spectrum of the drive machine exhibits substantial variations in the X, Y, and Z axes, contingent on the machine’s rotational speed, irrespective of the load condition. This phenomenon is not observed in the voltage and current spectra that were previously mentioned.
Effective vibration velocity values were identified as the most suitable measure for assessing vibrations between the motor and generator. Analysis confirmed that all measured values remained within the permissible vibration velocity range of 1 mm/s, as defined by relevant standards. Although presenting motor and generator vibration distributions separately provides useful information, it does not directly convey the relationship between the vibrations occurring in both machines.
To address this limitation, the authors proposed a novel method that enables clear identification of trends in vibration changes—whether amplification or damping—at specific speeds within the drive unit. This method is based on the indicator introduced in this paper for the quantitative assessment of vibration transmission, which is expressed as the normalised effective vibration values of the motor relative to those measured for the generator. As a result of this normalization, the indicator provides a simple and practical measure of relative vibration transmission between the motor and generator. While less precise than the classical TPA method and unable to decompose individual propagation paths, it offers significant practical advantages: it does not require extensive sensor networks, time-consuming identification, or complex calculations. The method relies solely on measurements at two points and the computation of the ratio of RMS values. Although less accurate for detailed propagation path analysis, the indicator is highly effective for online monitoring and rapid diagnostics, providing a relative measure of vibration transmission efficiency. Furthermore, the indicator is suitable for implementation under operational conditions of the drive unit, although its efficacy warrants validation through further research.

Author Contributions

Conceptualisation, A.M. and A.B.; methodology, A.M. and A.B.; formal analysis, A.M. and A.B.; investigation, A.M.; writing—original draft preparation, A.M. and A.B.; supervision, A.M. All authors have read and agreed to the published version of the manuscript.

Funding

This research was funded by the research projects No. WE/2025/PI/08 and No. WE/2025/PZ/01, Faculty of Marine Electrical Engineering, Gdynia Maritime University, Poland.

Institutional Review Board Statement

Not applicable.

Informed Consent Statement

Not applicable.

Data Availability Statement

The original contributions presented in this study are included in the paper.

Conflicts of Interest

The authors declare no conflicts of interest.

References

  1. Randall, R. Vibration-Based Condition Monitoring; John Wiley & Sons: Hoboken, NJ, USA, 2011. [Google Scholar]
  2. Tavner, P.J.; Ran, L.; Penman, J.; Sedding, H. Condition Monitoring of Rotating Electrical Machines, 2nd ed.; Institution of Engineering and Technology (IET): Stevenage, UK, 2025. [Google Scholar]
  3. Harris, C.; Piersol, A. Harris’ Shock and Vibration Handbook; McGraw-Hill Handbooks; McGraw-Hill: Columbus, OH, USA, 2002. [Google Scholar]
  4. ISO 10816-3:2009; Mechanical Vibration—Evaluation of Machine Vibration by Measurements on Non-Rotating Parts. ISO: Geneva, Switzerland, 2009.
  5. Griffin, M. Handbook of Human Vibration; Academic Press: Cambridge, MA, USA, 1990. [Google Scholar]
  6. Leonhard, W. Control of Electrical Drives, 3rd ed.; Springer: Berlin/Heidelberg, Germany, 2001. [Google Scholar]
  7. Bose, B. Modern Power Electronics and AC Drives; Eastern Economy Edition; Prentice Hall PTR: Hoboken, NJ, USA, 2002. [Google Scholar]
  8. Rao, J. Vibratory Condition Monitoring of Machines; CRC Press: Boca Raton, FL, USA, 2000. [Google Scholar]
  9. Muszynska, A. Rotordynamics; CRC Press: Boca Raton, FL, USA, 2005. [Google Scholar]
  10. Yasuzawa, Y.; Morooka, A.; Tanimoto, K. Vibration Characteristics of Separated Superstructure of a Ship; Springer: Singapore, 2021; Volume 64, pp. 365–376. [Google Scholar] [CrossRef]
  11. Schmalhorst, J. Machine Elements for Mechanical Engineering; Springer: Berlin/Heidelberg, Germany, 2019. [Google Scholar]
  12. Budynas, R.; Nisbett, K. Shigley’s Mechanical Engineering Design; McGraw-Hill Higher Education—VST E+p: Columbus, OH, USA, 2014. [Google Scholar]
  13. Chen, W.; Gunter, E. Introduction to Dynamics of Rotor-Bearing Systems; Trafford: Bloomington, IN, USA, 2007. [Google Scholar]
  14. Bonnett, A.H.; Soukup, G.C. Cause and analysis of stator and rotor failures in 3-phase squirrel cage induction motors. In Proceedings of the Conference Record of 1991 Annual Pulp and Paper Industry Technical Conference, Montreal, QC, Canada, 3–7 June 1991; pp. 22–42. [Google Scholar]
  15. Lalanne, M.; Ferraris, G. Rotordynamics Prediction in Engineering; Wiley: Hoboken, NJ, USA, 1998. [Google Scholar]
  16. Romanssini, M.; de Aguirre, P.C.C.; Compassi-Severo, L.; Girardi, A.G. A Review on Vibration Monitoring Techniques for Predictive Maintenance of Rotating Machinery. Eng 2023, 4, 1797–1817. [Google Scholar] [CrossRef]
  17. Doorsamy, W. Condition Monitoring of Electric Machines: Modern Frameworks and Data-Driven Methodologies. Machines 2025, 13, 144. [Google Scholar] [CrossRef]
  18. Çalış, H. Vibration and motor current analysis of induction motors to diagnose mechanical faults. J. Meas. Eng. 2014, 2, 190–198. [Google Scholar]
  19. Mey, O.; Neudeck, W.; Schneider, A.; Enge-Rosenblatt, O. Machine Learning-Based Unbalance Detection of a Rotating Shaft Using Vibration Data. arXiv 2020, arXiv:2005.12742. [Google Scholar] [CrossRef]
  20. Ahmad, S.; Styp-Rekowski, K.; Nedelkoski, S.; Kao, O. Autoencoder-based Condition Monitoring and Anomaly Detection Method for Rotating Machines. arXiv 2021, arXiv:2101.11539. [Google Scholar] [CrossRef]
  21. Hua, X.; Gandee, E. Vibration and dynamics analysis of electric vehicle drivetrains. J. Low Freq. Noise Vib. Act. Control 2021, 40, 1241–1251. [Google Scholar] [CrossRef]
  22. Wu, B.; Qiao, M. A Review of the Research Progress of Motor Vibration and Noise. Int. Trans. Electr. Energy Syst. 2022, 2022, 5897198. [Google Scholar] [CrossRef]
  23. Gnaciński, P.; Pepliński, M.; Muc, A.; Hallmann, D. Induction Motors Under Voltage Unbalance Combined with Voltage Subharmonics. Energies 2024, 17, 6324. [Google Scholar] [CrossRef]
  24. Gnaciński, P.; Hallmann, D.; Muc, A.; Klimczak, P.; Pepliński, M. Induction Motor Supplied with Voltage Containing Symmetrical Subharmonics and Interharmonics. Energies 2022, 15, 7712. [Google Scholar] [CrossRef]
  25. Gnaciński, P.; Pepliński, M.; Muc, A.; Hallmann, D.; Klimczak, P. Induction Motors Under Voltage Fluctuations and Power Quality Standards. IEEE Trans. Energy Convers. 2024, 39, 1255–1264. [Google Scholar] [CrossRef]
  26. Muc, A.; Morawiec, M.; Wilczyński, F. Steady-State Vibration Level Measurement of the Five-Phase Induction Machine during Third Harmonic Injection or Open-Phase Faults. Energies 2023, 16, 838. [Google Scholar] [CrossRef]
  27. ISO Standard 10816-1; Mechanical Vibration—Evaluation of Machine Vibration by Measurements on Non-Rotating Parts—Part 1: General Guidelines. ISO: Genova, Switzerland, 1995.
  28. ISO Standard 20816-1; Mechanical Vibration—Measurement and Evaluation of Machine Vibration—Part 1: General Guidelines. ISO: Genova, Switzerland, 2016.
  29. EN 50160, 2010/A2:2019; Voltage Characteristics of Electricity Supplied by Public Distribution Network. CELENEC: Brussels, Belgium, 2019.
  30. de Klerk, D.; Rixen, D. Component transfer path analysis method with compensation for test bench dynamics. Mech. Syst. Signal Process. 2010, 24, 1693–1710. [Google Scholar] [CrossRef]
  31. de Klerk, D.; Ossipov, A. Operational transfer path analysis: Theory, guidelines and tire noise application. Mech. Syst. Signal Process. 2010, 24, 1950–1962. [Google Scholar] [CrossRef]
  32. Gajdatsy, P.; Desmet, W.; Gielen, L.; Janssens, K.; Van der Auweraer, H.; Mas, P. A Novel TPA Method Using Parametric Load Models: Validation on Experimental and Industrial Cases. In Proceedings of the SAE 2009 Noise and Vibration Conference and Exhibition, St. Charles, IL, USA, 19 May 2009; SAE International: Warrendale, PA, USA, 2009. [Google Scholar] [CrossRef]
  33. Janssens, K.; Gajdatsy, P.; Gielen, L.; Mas, P.; Britte, L.; Desmet, W.; Van der Auweraer, H. OPAX: A new transfer path analysis method based on parametric load models. Mech. Syst. Signal Process. 2011, 25, 1321–1338. [Google Scholar] [CrossRef]
  34. Lennström, D.; Johnsson, R.; Ågren, A.; Nykänen, A. The Influence of the Acoustic Transfer Functions on the Estimated Interior Noise from an Electric Rear Axle Drive. SAE Int. J. Passeng.-Cars-Mech. Syst. 2014, 7, 413–422. [Google Scholar] [CrossRef]
  35. Magrans, F.X. Method of Measuring Transmission Paths. J. Sound Vib. 1981, 74, 321–330. [Google Scholar] [CrossRef]
  36. Magrans, F. Definition and Calculation of Transmission Paths Within An S.E.A. Framework. J. Sound Vib. 1993, 165, 277–283. [Google Scholar] [CrossRef]
  37. Padilha, P.; Arruda, J. Comparison of Estimation Techniques for Vibro-Acoustic Transfer Path Analysis. Shock Vib. 2006, 13, 459–467. [Google Scholar] [CrossRef]
  38. De Sitter, G.; Devriendt, C.; Guillaume, P.; Pruyt, E. Operational transfer path analysis. Mech. Syst. Signal Process. 2010, 24, 416–431. [Google Scholar] [CrossRef]
  39. Gajdatsy, P.; Janssens, K.; Desmet, W.; Van der Auweraer, H. Application of the transmissibility concept in transfer path analysis. Mech. Syst. Signal Process. 2010, 24, 1963–1976. [Google Scholar] [CrossRef]
  40. Maia, N.; Silva, J.; Ribeiro, A. Transmissibility concept in multi-degree-of-freedom systems. Mech. Syst. Signal Process. 2001, 15, 129–137. [Google Scholar] [CrossRef]
  41. Diez-Ibarbia, A.; Battarra, M.; Palenzuela, J.; Cervantes, G.; Walsh, S.; De La Cruz, M.; Theodossiades, S.; Gagliardini, L. Comparison between transfer path analysis methods on an electric vehicle. Appl. Acoust. 2017, 118, 83–101. [Google Scholar] [CrossRef]
  42. Mohd Ghazali, M.H.; Rahiman, W. Vibration Analysis for Machine Monitoring and Diagnosis: A Systematic Review. Shock Vib. 2021, 2021, 9469318. [Google Scholar] [CrossRef]
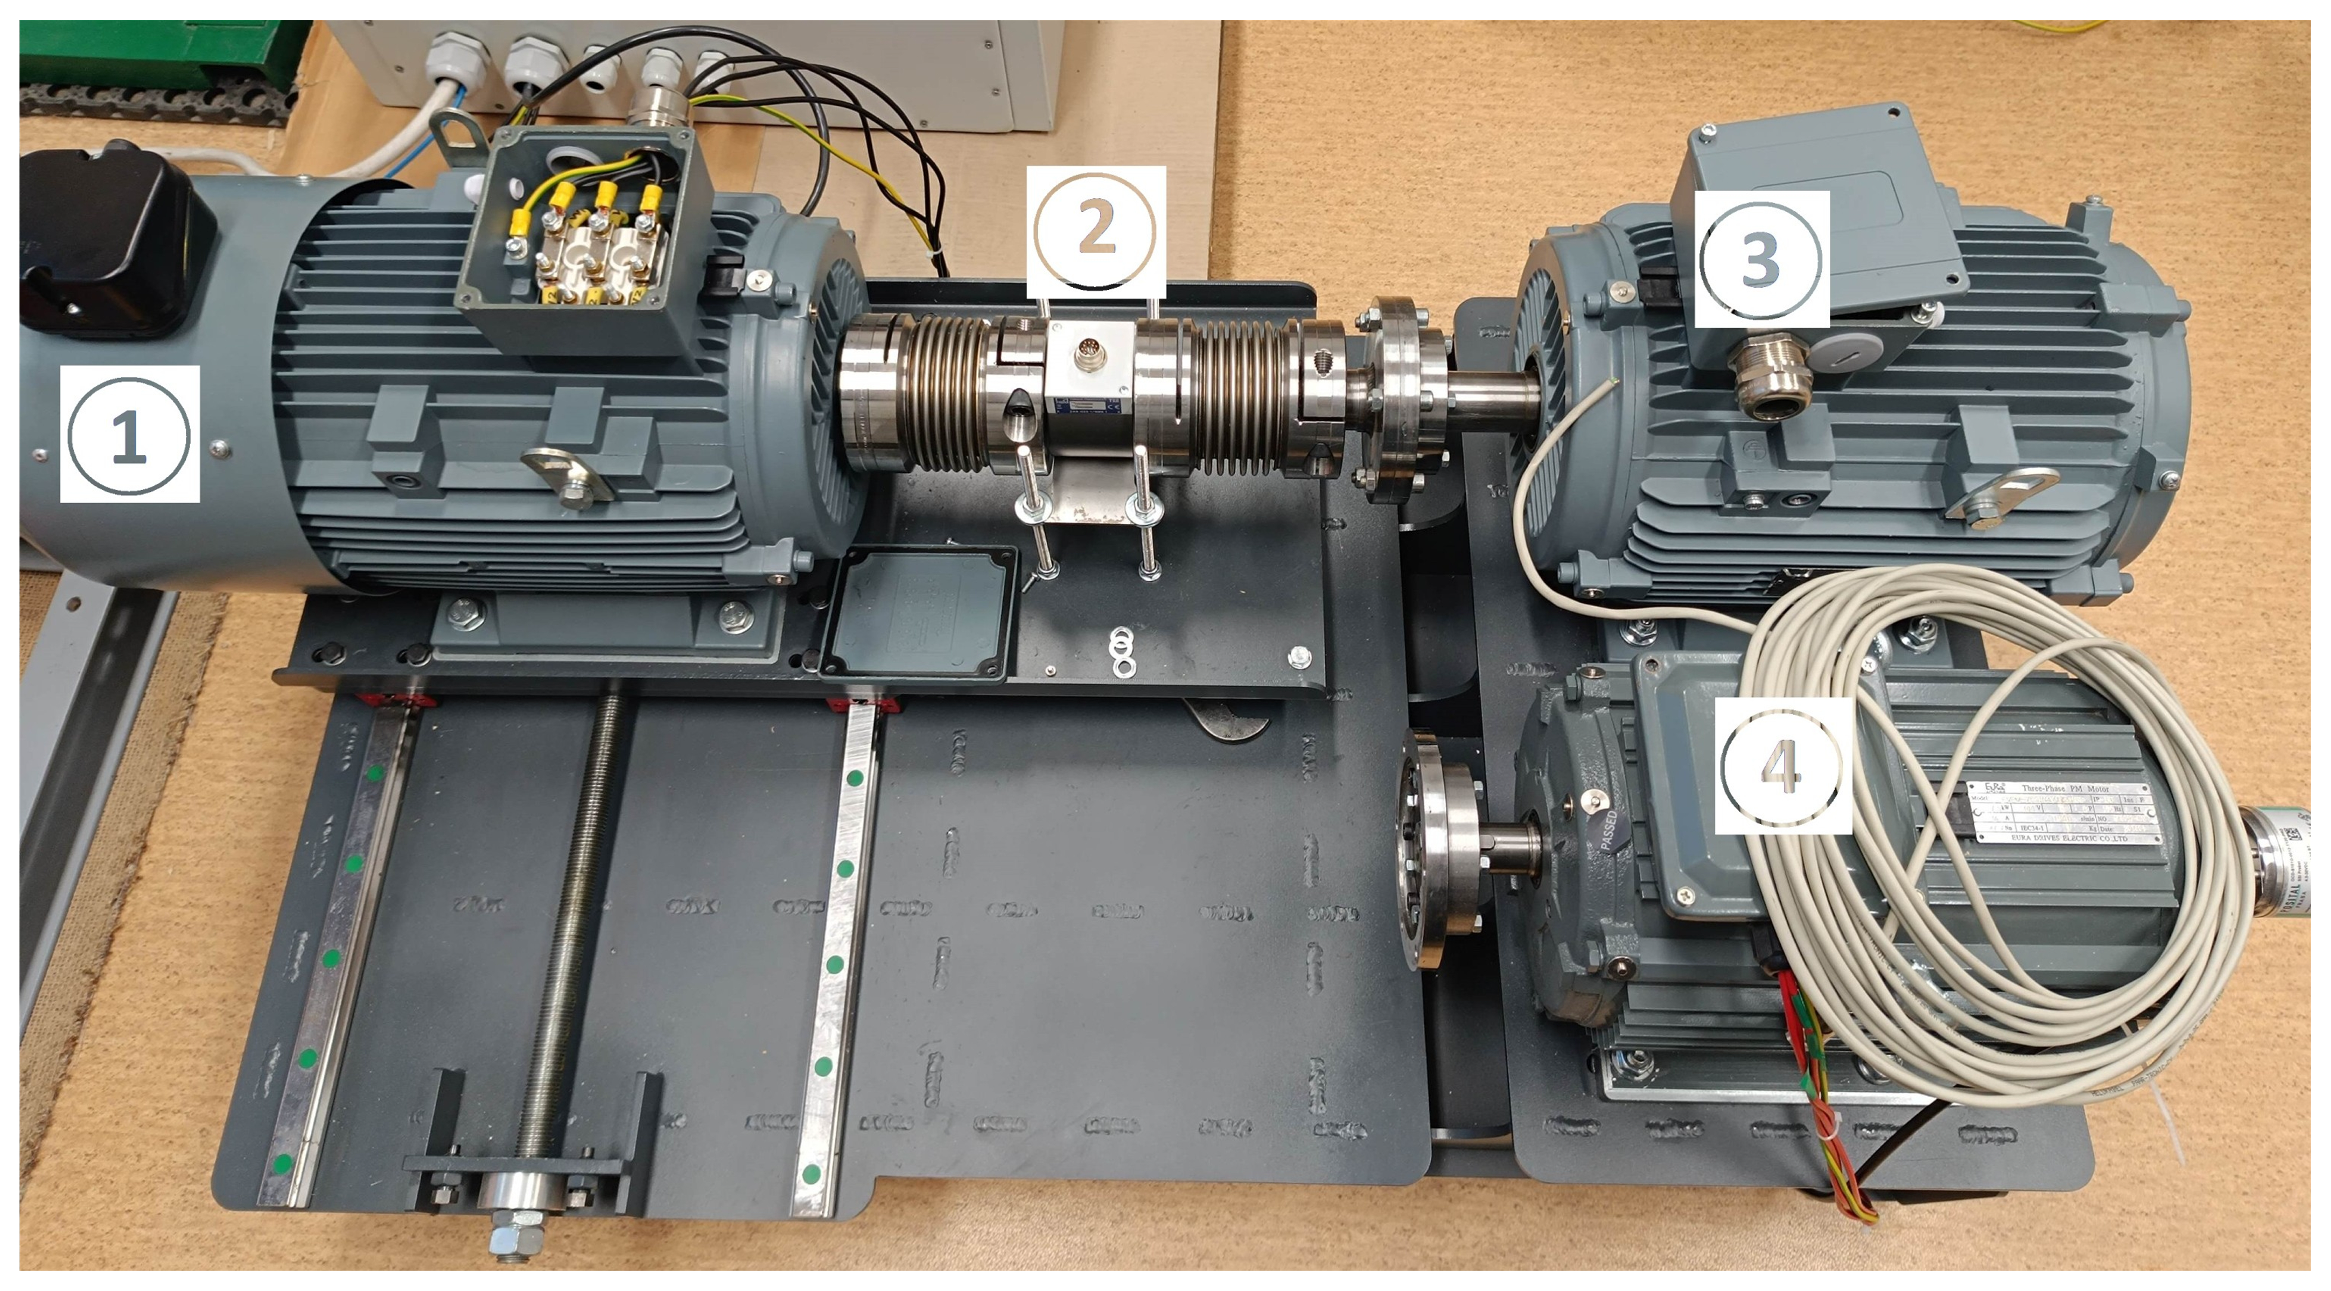
Figure 1. Tested drive unit: 1—induction motor, 2—coupling, 3—induction generator, 4—permanent magnet synchronous generator.
Energies 18 05140 g001
Figure 2. The diagram presenting the measurements performed on the side of generator with the utilization of three uniaxial accelerometers.
Energies 18 05140 g002
Figure 3. Calculation chains for determining the effective vibration value and FFT. (a) Block diagram. (b) Screen from the BK Connect software.
Energies 18 05140 g003
Figure 4. Flowchart of the measurement procedure.
Energies 18 05140 g004
Figure 5. The placement of uniaxial accelerometers with the assumed vibration directions for (a) induction motor; (b) induction generator, in which X, Y, Z denote vibration measurement directions.
Energies 18 05140 g005
Figure 6. The placement of triaxial accelerometers with the assumed vibration directions for (a) induction motor; (b) induction generator, in which X, Y, Z denote vibration measurement directions.
Energies 18 05140 g006
Figure 7. Experiment procedure.
Energies 18 05140 g007
Figure 8. Voltage (a) and current (b) waveforms achieved at the terminals of the motor at a speed of 900 rpm in the case where the generator was an induction machine.
Energies 18 05140 g008
Figure 9. Voltage (a) and current (b) waveforms achieved at the terminals of the motor at a speed of 1500 rpm in the case where generator was an induction machine.
Energies 18 05140 g009
Figure 10. FFT of voltage (a) and current (b) measured at the terminals of an induction motor at 900 rpm in the case where the generator was an induction machine.
Energies 18 05140 g010
Figure 11. FFT of voltage (a) and current (b) measured at the terminals of an induction motor at 1500 rpm in the case where the generator was an induction machine.
Energies 18 05140 g011
Figure 12. Voltage (a) and current (b) waveforms achieved at the terminals of the motor at a speed of 900 rpm in the case where the generator was a synchronous machine.
Energies 18 05140 g012
Figure 13. Voltage (a) and current (b) waveforms achieved at the terminals of the motor at a speed of 1500 rpm in the case where the generator was a synchronous machine.
Energies 18 05140 g013
Figure 14. FFT of voltage (a) and current (b) measured at the terminals of an induction motor at 900 rpm in the case where generator was a synchronous machine.
Energies 18 05140 g014
Figure 15. FFT of voltage (a) and current (b) measured at the terminals of an induction motor at 1500 rpm in the case where generator was a synchronous machine.
Energies 18 05140 g015
Figure 16. Characteristics of changes in the value of fundamental harmonic of supply voltage as a function of frequency.
Energies 18 05140 g016
Figure 17. Characteristics of changes in the THD value of the supply voltage as a function of frequency.
Energies 18 05140 g017
Figure 18. Characteristics of changes in the RMS value of the supply current as a function of frequency.
Energies 18 05140 g018
Figure 19. Characteristics of changes in the THD value of the supply current as a function of frequency.
Energies 18 05140 g019
Figure 23. Vibration measurement of (a) an induction motor and (b) an induction generator conducted with the use of a three uniaxial accelerometers.
Energies 18 05140 g023
Figure 24. FFT analysis of vibrations at 900 rpm measured with an uniaxial accelerometer: induction motor (a) x-direction, (b) y-direction, (c) z-direction; induction generator (d) x-direction, (e) y-direction, (f) z-direction.
Energies 18 05140 g024
Figure 25. FFT analysis of vibrations at 1500 rpm measured with an uniaxial accelerometer: induction motor (a) x-direction, (b) y-direction, (c) z-direction; induction generator (d) x-direction, (e) y-direction, (f) z-direction.
Energies 18 05140 g025
Figure 26. Vibration measurement of (a) an induction motor and (b) a synchronous generator conducted with the use of a triaxial accelerometers.
Energies 18 05140 g026
Figure 27. FFT analysis of vibrations at 900 rpm measured with a triaxial accelerometer: induction motor (a) x-direction, (b) y-direction, (c) z-direction; synchronous generator (d) x-direction, (e) y-direction, (f) z-direction.
Energies 18 05140 g027
Figure 28. FFT analysis of vibrations at 1500 rpm measured with a triaxial accelerometer: induction motor (a) x-direction, (b) y-direction, (c) z-direction; synchronous generator (d) x-direction, (e) y-direction, (f) z-direction.
Energies 18 05140 g028
Figure 29. Vibration measurement of (a) an induction motor and (b) a synchronous generator conducted with the use of a three uniaxial accelerometers.
Energies 18 05140 g029
Figure 30. FFT analysis of vibrations at 900 rpm measured with an uniaxial accelerometer: induction motor (a) x-direction, (b) y-direction, (c) z-direction; synchronous generator (d) x-direction, (e) y-direction, (f) z-direction.
Energies 18 05140 g030
Figure 31. FFT analysis of vibrations at 1500 rpm measured with an uniaxial accelerometer: induction motor (a) x-direction, (b) y-direction, (c) z-direction; synchronous generator (d) x-direction, (e) y-direction, (f) z-direction.
Energies 18 05140 g031
Figure 32. Distribution of the normalized effective value of vibration velocity calculated for a set of two electrical machines (induction motor, induction generator) as a function of frequency in the X, Y, and Z axes for vibrations recorded with a triaxial accelerometer.
Energies 18 05140 g032
Figure 33. Distribution of the normalized effective value of vibration velocity calculated for a set of two electrical machines (induction motor, induction generator) as a function of frequency in the X, Y, and Z axes for vibrations recorded with uniaxial accelerometers.
Energies 18 05140 g033
Figure 34. Distribution of the normalized effective value of vibration velocity calculated for a set of two electrical machines (induction motor, synchronous generator) as a function of frequency in the X, Y, and Z axes for vibrations recorded with a triaxial accelerometer.
Energies 18 05140 g034
Figure 35. Distribution of the normalized effective value of vibration velocity calculated for a set of two electrical machines (induction motor, synchronous generator) as a function of frequency in the X, Y, and Z axes for vibrations recorded with uniaxial accelerometers.
Energies 18 05140 g035
Table 1. Elements of the laboratory stand.
NumberNameManufacturer, Model
1InverterTwerd
2Cage induction motor (11 kW, 50 Hz)MFC Motors: OMT4–132MC–4
3Cage induction generator (7.5 kW, 50 Hz)MFC Motors: OMT4–132M–4
5Permanent magnet synchronous generator (100  Hz)Eura Drives: EVPM–752IN4Y–2D15S
6Bellows coupling-
7OscilloscopeTektronix: MSO 4140
8Voltage probeTektronix: THDP0200
9Current probeTektronix: TCP0030
10Triaxial accelerometerBruel&Kjaer: 4529–B–31297
11Uniaxial accelerometerBruel&Kjaer: 4534–B–33927
12Data acquisition moduleBruel&Kjaer: 3676–B–040
Disclaimer/Publisher’s Note: The statements, opinions and data contained in all publications are solely those of the individual author(s) and contributor(s) and not of MDPI and/or the editor(s). MDPI and/or the editor(s) disclaim responsibility for any injury to people or property resulting from any ideas, methods, instructions or products referred to in the content.