1. Introduction
Environmentally friendly electricity generation methods that do not rely on fossil fuel combustion are increasingly adopted to reduce pollution associated with conventional energy sources. One illustrative example is the use of PV panels, which convert solar energy into electrical energy [
1]. In agriculture, water pumps are commonly used during the summer season for both water storage and irrigation, and the application of PV panels to power such pumps has been investigated in several studies [
2]. Furthermore, PV panels can also supply power to the circulation pumps in the heating systems.
When planning the electrical power supply of a water pump using a PV panel, it is crucial to select a PV panel capable of generating the power required by the pump, considering the climatic conditions and geographical latitude. Solar irradiance varies throughout the day—increasing from morning to noon and decreasing from noon to evening—which directly affects the PV power output [
3,
4]. The maximum power generated by a PV panel varies with solar irradiance levels [
5]. To extract the maximal power, a DC-DC converter is used to provide maximum power point tracking (MPPT) and control the output voltage. Moreover, PV panels may be temporarily shaded by passing clouds, causing the generated power to drop significantly below the required level [
6]. To mitigate this issue, energy storage systems, such as batteries and/or SCs, can be employed to ensure that the pump or other loads receive the required power even during periods of reduced PV power output [
7]. During sunny periods, the maximum PV power output must exceed the power required by the load to enable the charging of energy storage.
Batteries have a high energy density and are capable of supplying energy to electrical consumers over extended periods, making them suitable for times of the day when the power generated by PV panels under prevailing irradiance conditions is insufficient to meet the required demand. Nevertheless, the relatively low power density of the batteries means that rapid discharging can shorten their operational lifespan and increase energy losses. In contrast, SCs are particularly effective at compensating short-term power deficits caused by the transient shading of PV panels from passing clouds due to low losses and a high number of charge/discharge cycles [
8,
9].
The present study focuses on the scenario in which a PV panel is temporarily shaded by a cloud for up to five minutes, significantly reducing the power output and necessitating the activation of HESS discharging. It is assumed that employing a HESS with the combined discharging of SCs and batteries is more effective than using a single type of energy storage device. For instance, batteries may exhibit higher internal resistance, and the inclusion of SCs can help reduce the internal losses of the batteries. SCs operate most efficiently at a high state of charge because as their voltage decreases, the discharge current increases, leading to higher internal losses that can be reduced by involving batteries.
DC microgrid power flow control methods can be categorized into centralized, decentralized, and distributed control strategies. Each of these methods have distinct advantages and drawbacks regarding communication, computation, and control autonomy. A general review of control methods is given in [
10,
11]. The centralized and decentralized control systems include a communication interface, which in some cases should be fast and adds additional expenses, especially in the case of a low power electricity supply system. This is the reason why decentralized control strategies that do not require a communication network or a central controller are more suitable for DC microgrids due to the attractive features of high reliability, strong flexibility, and low system cost [
12]. Droop control is the most widely used decentralized control method for autonomous power sharing among parallel distributed generators, loads, or energy storage elements. Conventional droop control have drawbacks related to DC bus voltage deviation due to the presence of resistances [
13], and the actual parameters of the microgrid forming components vary, thus leading to non-ideal power distribution and circulating currents [
14]. To dynamically schedule the power among energy storage elements characterized by different ramp rates, high-pass filters and low-pass filters are utilized to decouple power demand into high-/low-frequency components [
15]. This allows for a reduction in voltage drop more dynamically, which is a well-suited strategy for pulsating load influence mitigation [
16], but leads to an efficiency decrease due to non-optimal power flow distribution between the battery and SC [
17,
18].
Since the SoC of the battery and SC impacts the voltage, constant droop control implementation can be challenging [
19], and power distribution between the battery and SC will be non-optimal. In previous works, HESS control strategies, primarily focused on the stabilization of DC grid voltage [
20,
21,
22], but did not consider the impact of the SoC change. To distribute the power among the SC and battery, high-pass filters and low-pass filters were used to decouple the power demand into high- and low-frequency components in [
23,
24], but the efficiency was not optimized in that case. In [
25,
26], a modified droop control algorithm for an SC-battery HESS employed in a DC microgrid was proposed to eliminate the frequent cyclic activity and improve the lifetime of the battery, but the energy efficiency and allowed voltage drop was not analyzed in more detail.
Supercapacitor applications in PV off-grid systems have been analyzed in several research articles. In [
27], the authors considered energy storage sizing; in [
28], their analysis investigated the possibility of integrating the SC into the PV panel. In [
29,
30,
31], the authors provide an analysis of the application of HESSs for overall system optimization. In [
32], a review is presented of SC and battery energy storage applications, but only few articles have mentioned the reduction in losses in the supercapacitor, which can be substantial if the number of charge and discharge cycles is high. This demonstrates the research gap that is the focus of this article.
Within the scope of this work, HESS discharge and charge strategies are proposed with the objective of achieving specific proportionality between the SC and the battery powers, thus allowing for certain DC grid voltage deviation. Such an approach does not complicate the implementation of the control system into the real industrial application since the conventional droop controller only needs to be extended with additional mathematical expressions. In the proposed approach, the SC discharge proportionality is controlled in a stepwise manner using droop control. The main feature is that the battery discharge controller operates with a fixed droop coefficient, whereas the SC controller employs a variable droop coefficient that adjusts according to the SC SoC to achieve higher efficiency. Moreover, the control system can be easily improved further to increase the overall system performance by implementing an advanced higher level control system based on fuzzy logic [
33,
34], neural networks [
35,
36], or other more advanced techniques. It is important that control systems do not worsen response time of the converters, thus preventing undesired voltage drops. This article analyzes droop coefficient selection to maintain a stable voltage even during the rapid change in PV generation.
The rest of this article is organized as follows.
Section 2 describes the schematic diagram of a stand-alone PV-powered water pump system with a SC-battery HESS, along with the power flow under HESS charging and discharging modes.
Section 3 is dedicated to the droop-control-based control of HESS discharge, describing the impact of droop coefficients on SC-battery power distribution and DC grid voltage. Simulation results of the SoC-dependent stepwise droop control of the SC discharge proportionality coefficient are also analyzed.
Section 4 is dedicated to the droop control-based control of HESS charging, describing the impact of droop coefficients on SC-battery power distribution and DC grid voltage. Simulation results of the SoC-dependent stepwise droop control of the SC charge proportionality coefficient are also analyzed.
Section 5 describes the impact of the DC grid voltage levels on the droop coefficients.
Section 6 shows the experimental results mainly focusing on transient response performance.
The symbol definitions are summarized in
Table 1.
2. Stand-Alone PV-Powered Water Pump System with Hybrid Energy Storage
A schematic diagram of the stand-alone water pump power supply system is shown in
Figure 1, and the system parameters are listed in
Table 2. The PV panel serves as the primary power source, continuously supplying power to the water pump. The elements of the HESS—the battery and the SC—act as secondary power sources, which are engaged when the PV panel is temporarily shaded, and the solar irradiance is insufficient for the PV panel to generate the required power. Under high solar irradiance conditions, the power generated by the PV panel, whose output is controlled by DC-DC converter implementing the MPPT control algorithm, must exceed the power demand of the water pumping system, thus allowing the HESS to be charged.
When the HESS is fully charged under high solar irradiance conditions and the PV panel is not shaded, the panel operates in voltage control mode (avoiding a high output voltage situation that would be provided by the MPPT algorithm in such cases), generating only the amount of power required by the water pump. Further simulations were performed using MATLAB R2024 software, employing a PV panel converter model operating in MPPT perturb and observe mode as well as bidirectional converter models for the battery and SC, operating in buck and boost modes with the help of PI controllers, as in the example [
37].
The total HESS charging power
is the sum of the SC charging power
and the battery charging power
:
During HESS charging, the power consumed by the water pump
is equal to the difference between the PV panel power
and the HESS charging power
:
The total HESS discharge power
is the sum of the SC discharge power
and the battery discharge power
:
During HESS discharging, the power consumed by the water pump
is equal to the sum of the PV panel power
and the HESS discharge power
:
3. Droop-Control-Based Control of HESS Discharge
The classical discharge-mode control scheme of an SC energy storage converter consists of a voltage controller and a current controller, as shown in
Figure 2.
is the reference value of the DC grid voltage, while
is the measured actual DC grid voltage. The difference between these values constitutes the error that the control system aims to minimize.
denotes the measured current of the converter’s energy storage element side.
If the discharge control schemes for the SC and battery are identical (i.e., the same as in
Figure 2), then in Equation (3),
and
each represent 50% of
. To modify this power distribution, the discharge control scheme can be supplemented with a droop control loop, which subtracts the product of the converter’s grid-side current and a specified droop coefficient from
[
20].
Figure 3 illustrates the SC discharge control scheme with droop coefficient
, while
Figure 4 depicts the battery discharge control scheme with droop coefficient
.
The DC grid voltage that will be maintained by the converter can be expressed by an equation corresponding to the SC discharge control scheme:
Figure 3.
Discharge-mode control scheme with droop control for the SC converter.
Figure 3.
Discharge-mode control scheme with droop control for the SC converter.
Similarly, the DC grid voltage that will be maintained by the converter can be expressed by the equation corresponding to the battery discharge control scheme:
Figure 4.
Discharge-mode control scheme with droop control for the battery converter.
Figure 4.
Discharge-mode control scheme with droop control for the battery converter.
Usually, the transient process is short, therefore, it is possible to assume that the desired DC voltage is controlled precisely and can be calculated by Equations (5) and (6). The HESS discharge power can be expressed as the sum of the SC and battery grid-side currents,
and
, multiplied by the DC voltage
and combined with Equation (5):
The HESS discharge power also can be expressed as the sum of the SC and battery grid currents,
and
, multiplied by the DC grid voltage
of Equation (6):
This enables the regulation of supercapacitor power
and battery power
while ensuring that their sum,
, remains unchanged. The SC discharge proportionality coefficient
determines the share of
contributed by
, and it can be expressed in three ways: based on the discharge powers
and
, using the battery discharge proportionality coefficient
, or based on the discharge currents
and
:
Correspondingly, the battery discharge proportionality coefficient
is given by:
3.1. Impact of Droop Coefficients on SC and Battery Power Distribution During HESS Discharge
The next task is to determine how the numerical values of droop coefficients
and
affect the discharge proportionality coefficients
and
. Assuming that the DC grid wire resistance is negligible, the grid-side voltages of the SC and battery converters can be considered equal due to their parallel connection. Consequently, Equation (5) equals Equation (6), resulting in:
From Equation (11), the equation for
can be derived as follows:
From Equation (11), the equation for
can be derived as follows:
By replacing the current
in Equation (9) with its expression from Equation (13), the SC discharge proportionality coefficient
can be derived in terms of the droop coefficients
and
:
By replacing the current
in Equation (10) with its expression from Equation (12), the battery discharge proportionality coefficient
can be derived:
From the evaluation of Equations (14) and (15) with the selected numerical values of
and
, it can be observed that the storage element with the highest droop coefficient exhibited a lower discharge proportionality and vice versa.
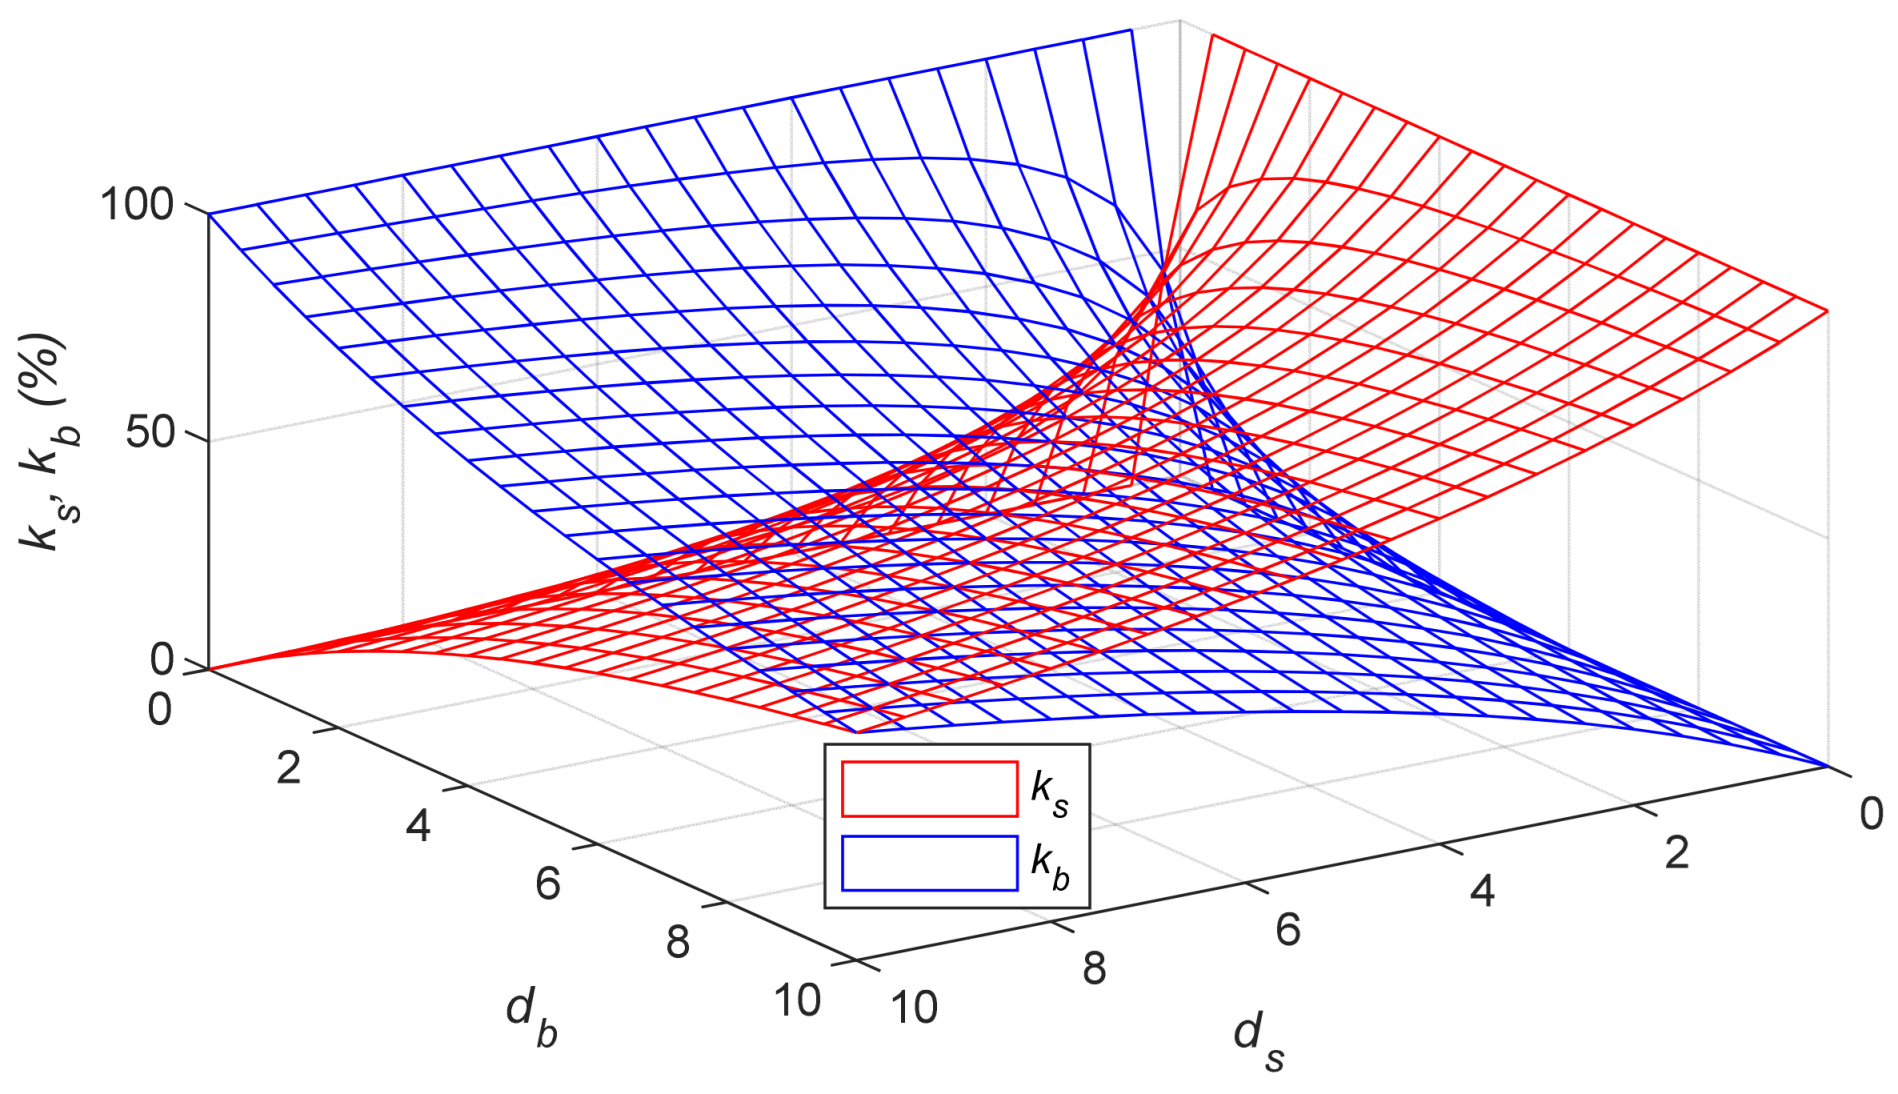
Figure 5 illustrates how
and
vary as
and
range from 0 to 10. When
=
, both
and
are equal to 50%. If
= 0, then
= 100%; if
= 0, then
= 100%.
3.2. Impact of Droop Coefficients on DC Grid Voltage During HESS Discharge
To avoid significant voltage drops in the DC grid, it is generally recommended that the droop coefficients are as low as possible. To determine the impact of the numerical values of
and
on the DC grid voltage
, it is necessary to derive an expression for
as a function of
and
.
can be calculated using Equations (5) and/or (6), where the unknown parameters are
,
, and
, and the known parameters are
,
, and
. To calculate
, it is also necessary to compute
and/or
by first deriving their respective expressions. The first step is to use Equations (7) or (8), assuming that for a known PV panel power, the portion of the load power supplied by HESS (i.e.,
) is also known. Substituting Equation (12) into Equation (7) results in a quadratic equation that can be used to derive a new equation for the current
:
The root of Equation (16) corresponding to the current
is the one with the negative sign in front of the square root:
By calculating
using Equation (17), the voltage
can be determined by Equation (6). An alternative approach is to derive an equation for the current
. Substituting Equation (13) into Equation (8) results in a quadratic equation that can be used to derive a new expression for the current
:
The root of Equation (18) corresponding to the current
is the one with the negative sign in front of the square root:
By calculating
using Equation (19), the voltage
can be determined by Equation (5). Thus,
can be calculated in two ways: using either
or
. Equations (17) and (18) also indicate that the currents
and
reach their maximum values when the expression under the square root becomes zero. The corresponding expressions are:
By replacing the currents
and
in Equations (5) and (6) with Equations (21) and (20), respectively, the minimum possible DC grid voltage can be obtained, which is equal to 50% of the reference voltage:
For the subsequent analyses, it was assumed that the water pump power = 150 W and the DC grid voltage reference value = 50 V. Under shading conditions, the solar irradiance was 100 W/m2 and = 18 W, resulting in = 132 W. The total capacitance of the SC circuit was 22.5 F, with a maximum voltage of 48 V, a minimum voltage of 24 V, and an internal resistance of 0.056 Ω. The internal resistance of the battery was 0.07 Ω.
It should be noted that a lower DC grid voltage leads to an increase in current in order to maintain the required 150 W power for the water pump. Although it was assumed that the water pump is located very close to its power sources, thereby neglecting the DC grid transmission resistance, in cases where this resistance must be considered, higher current levels would result in higher transmission losses. Therefore, minimizing voltage drops is desirable.
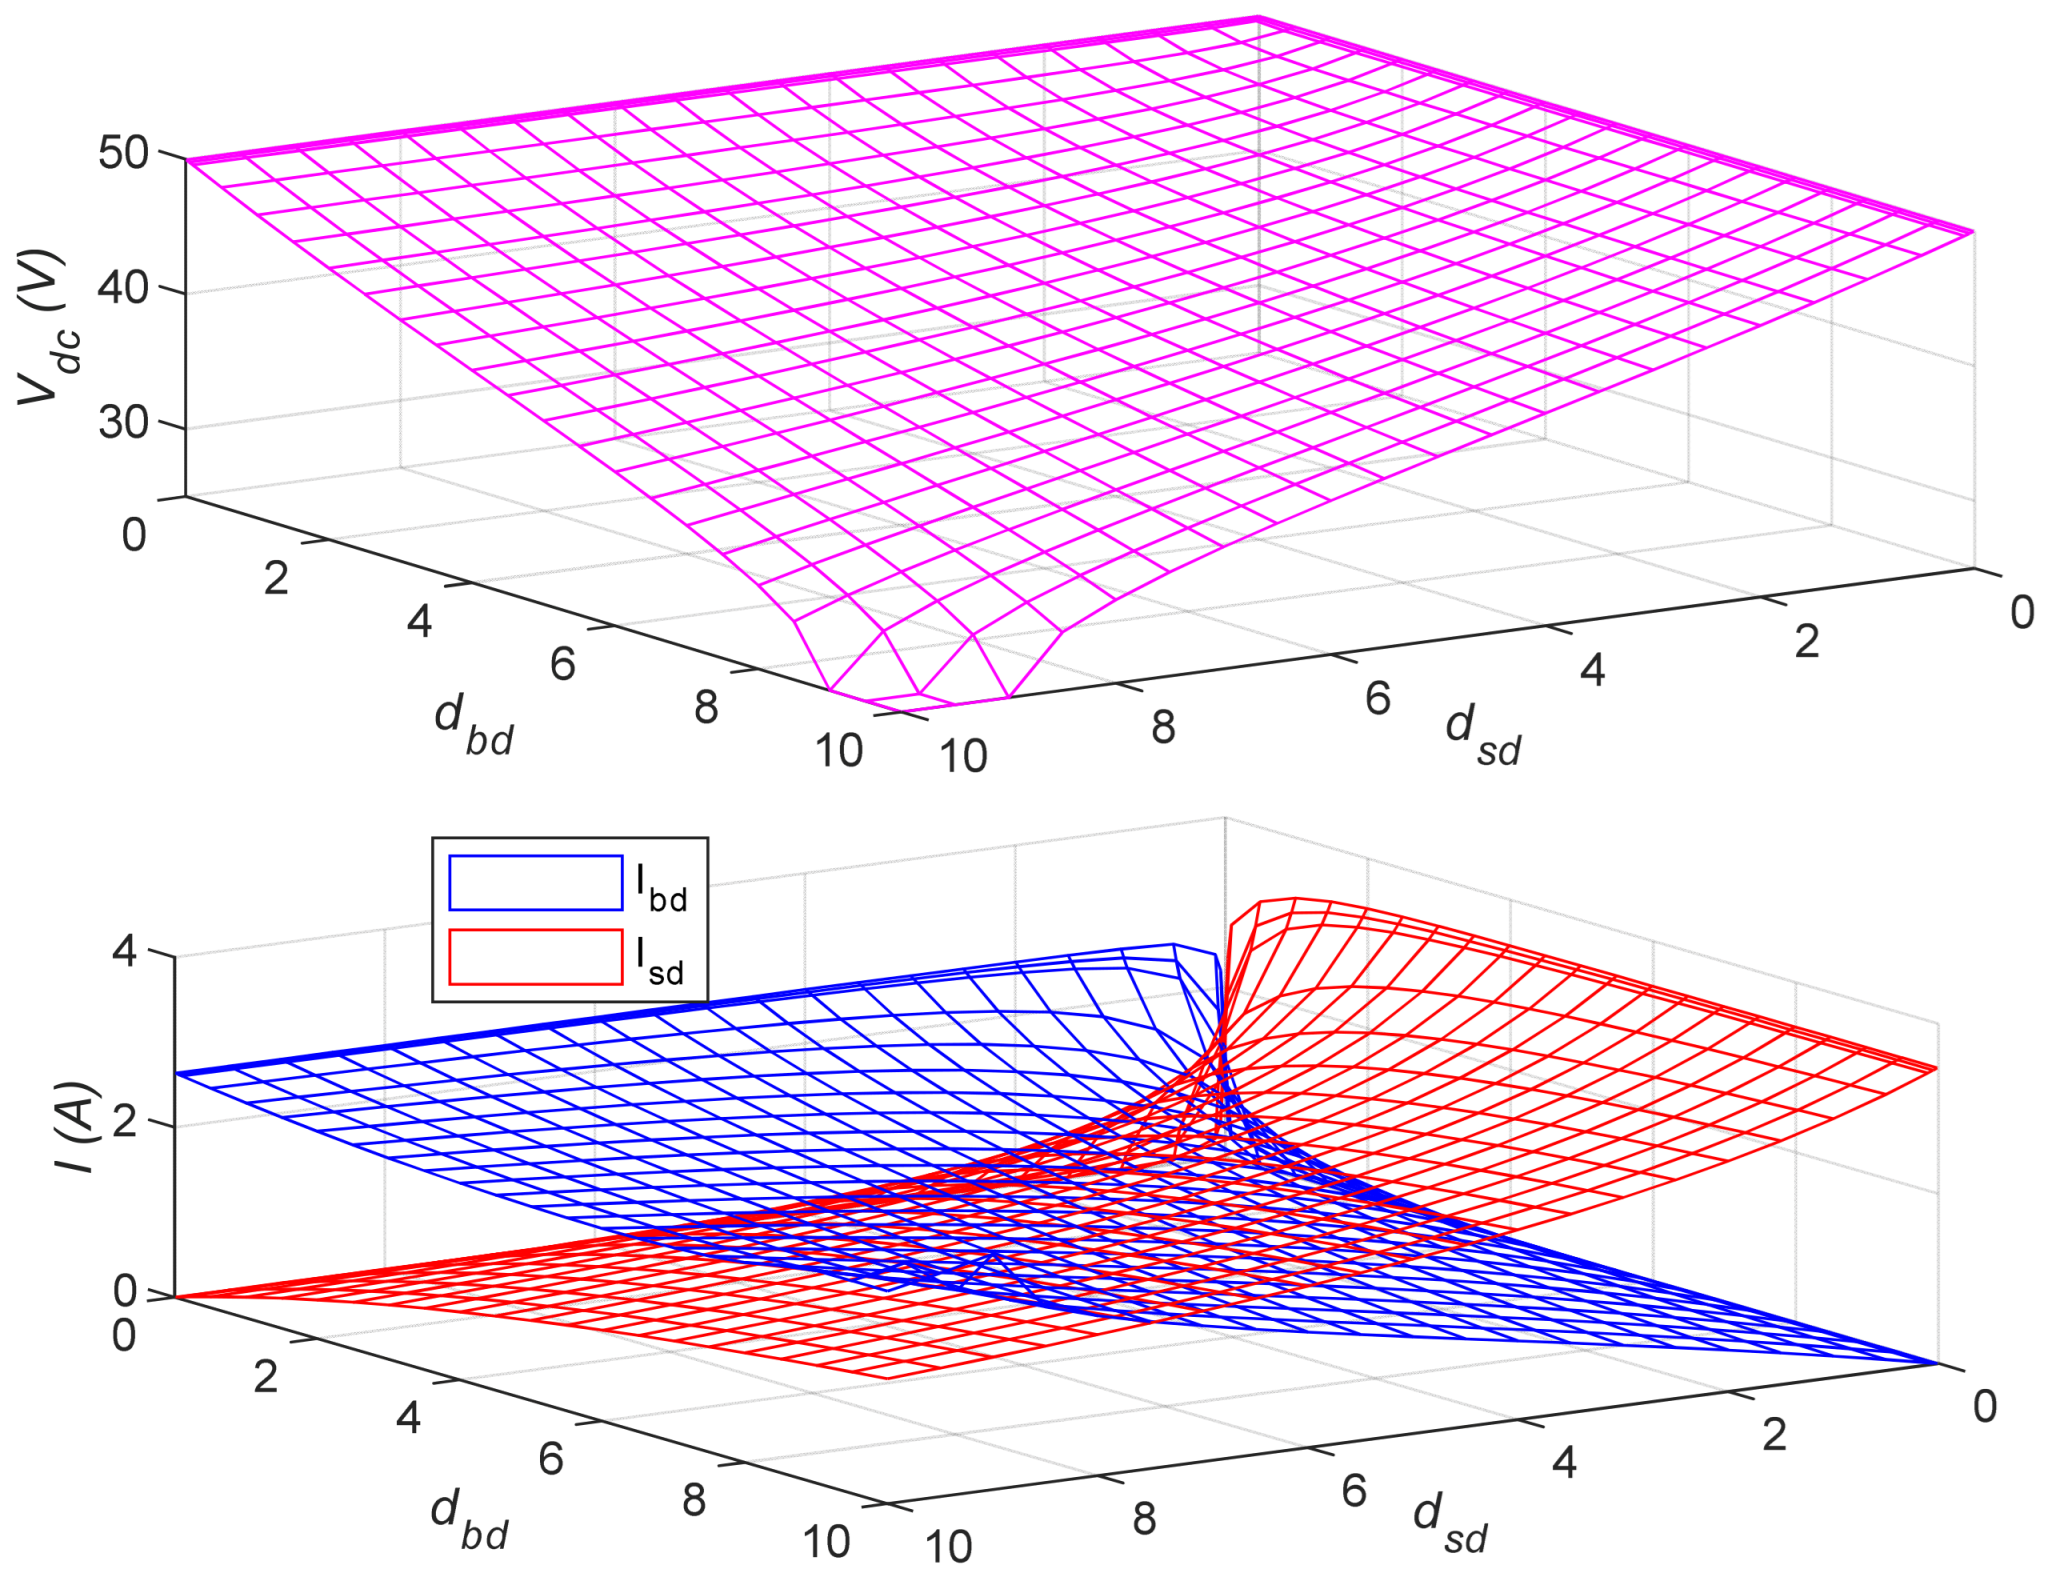
Figure 6 illustrates the variation surface of the DC grid voltage
and the currents
and
as functions of
and
, ranging from 0 to 10. At certain points, the minimum DC grid voltage of 25 V was reached. The surface shows that when both droop coefficients have high numerical values, significant voltage drops occur. Consequently, by regulating the discharge proportionality of the HESS storage elements, an optimal approach may be to select a constant droop coefficient with a low numerical value (e.g., between 0.05 and 2) for one of the elements, because if the droop coefficient of the other element increases to high values,
does not decrease significantly.
3.3. SoC-Dependent Stepwise Droop Control of SC Discharge Proportionality Coefficient
The proposed method calculates the droop coefficient of the SC discharge controller with the objective of achieving a desired SC discharge proportionality coefficient , depending on the SC state of charge (SoC). Due to the specific characteristics of the SC converter, the minimum permissible SoC of the SC was assumed to be 25%, corresponding to 50% of the maximum SC circuit voltage.
It is reasonable to set higher
values at higher SoC, as the resulting discharge current will be lower, leading to reduced SC internal losses. Conversely, at lower SoC levels, where higher discharge currents and consequently increased internal losses are expected, lower
values should be set.
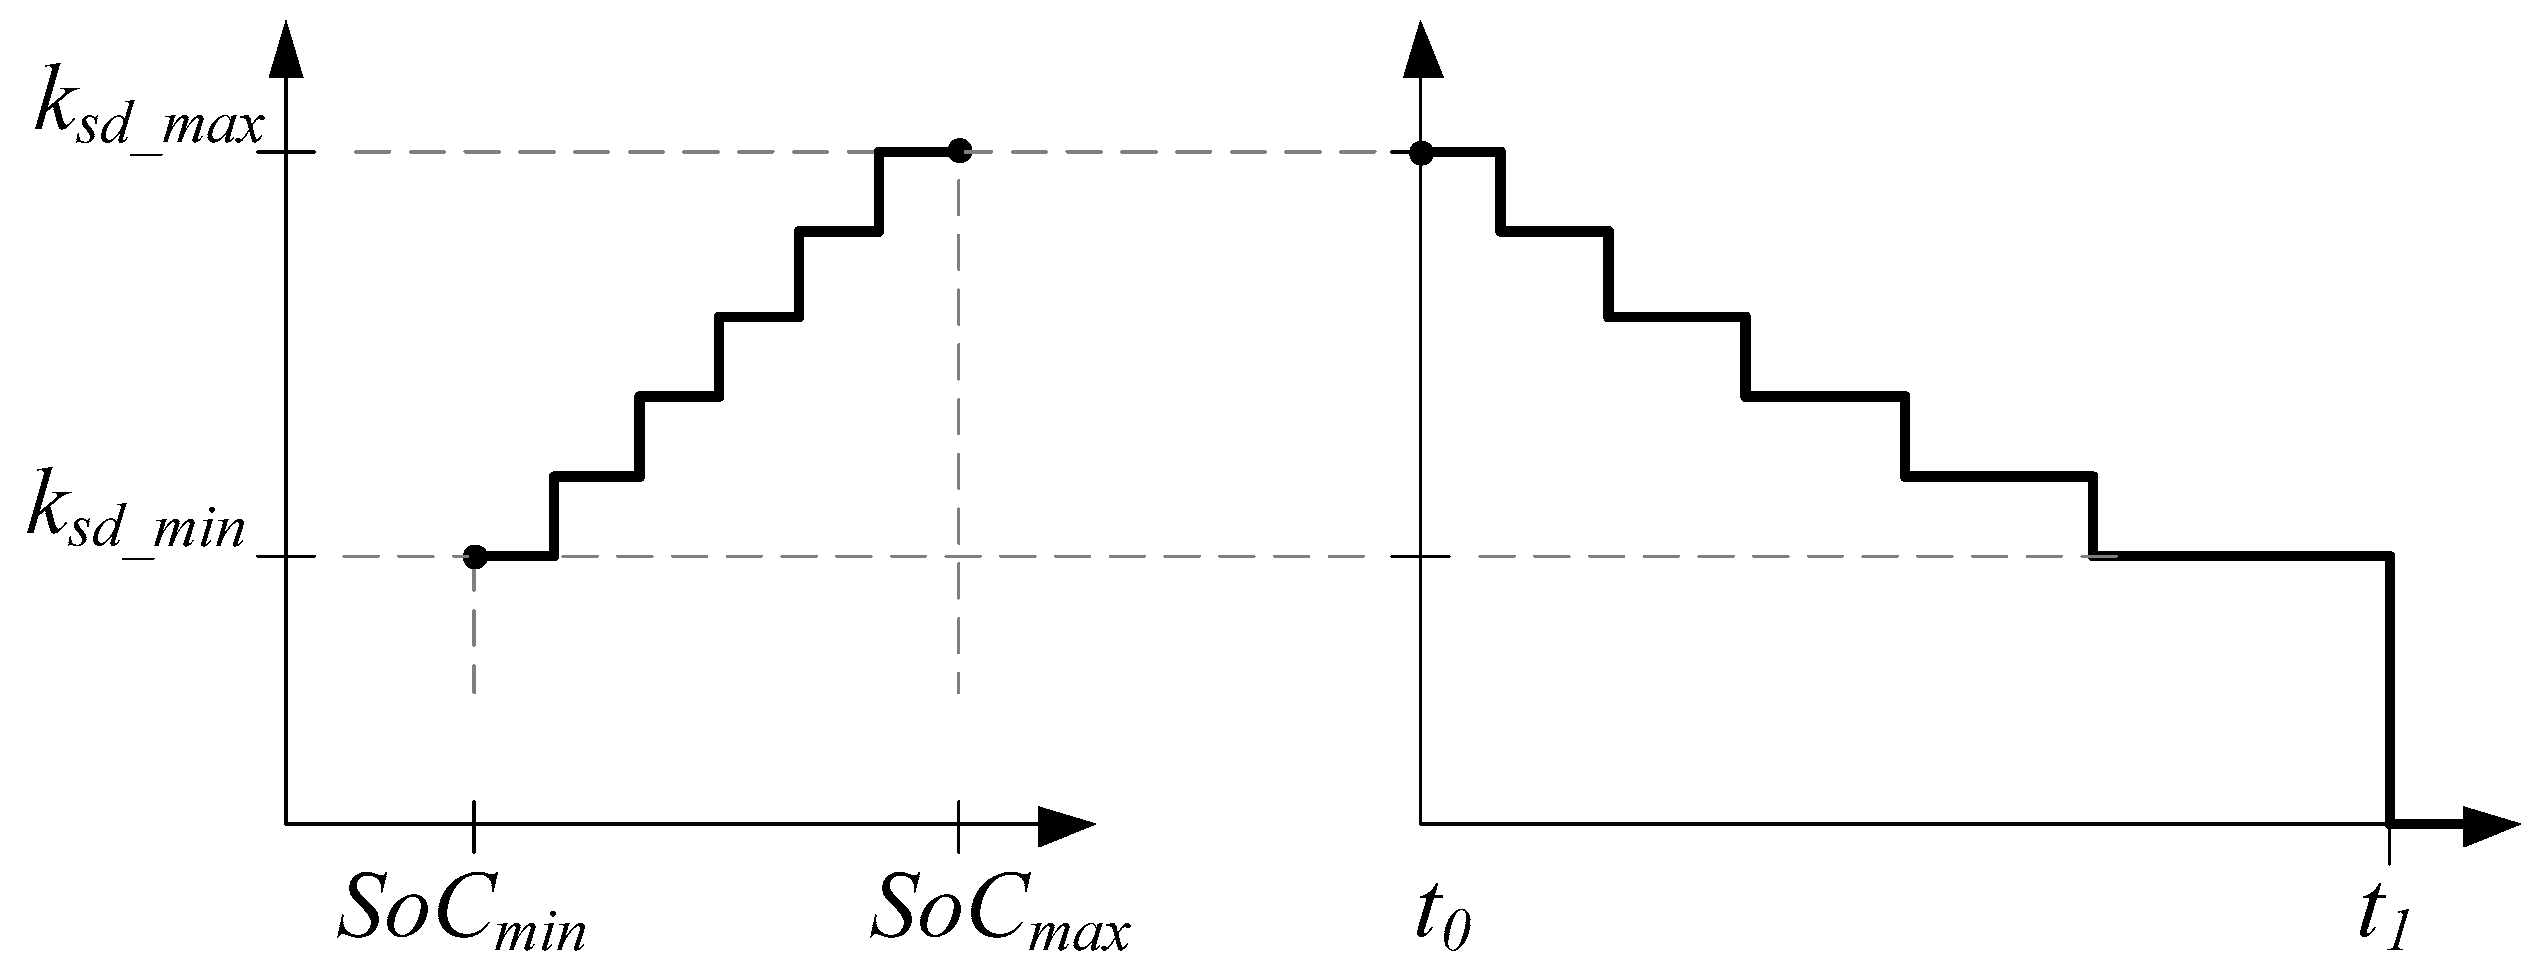
Figure 7 (left) schematically illustrates how
can vary in a stepwise manner depending on the SoC.
Figure 7 (right) schematically illustrates how
changes over time, where
denotes the start of the discharge process, and
represents the moment when the SoC reaches the minimum threshold of 25%, at which the SC discharge is stopped. At high constant values of
, the time required for the SoC to decrease to the level triggering a transition to the subsequent lower
is expected to be shorter, whereas at lower constant
values, this time increases progressively. It is possible to create various stepwise
curves with either more frequent and less frequent step changes as well as with different minimum
values.
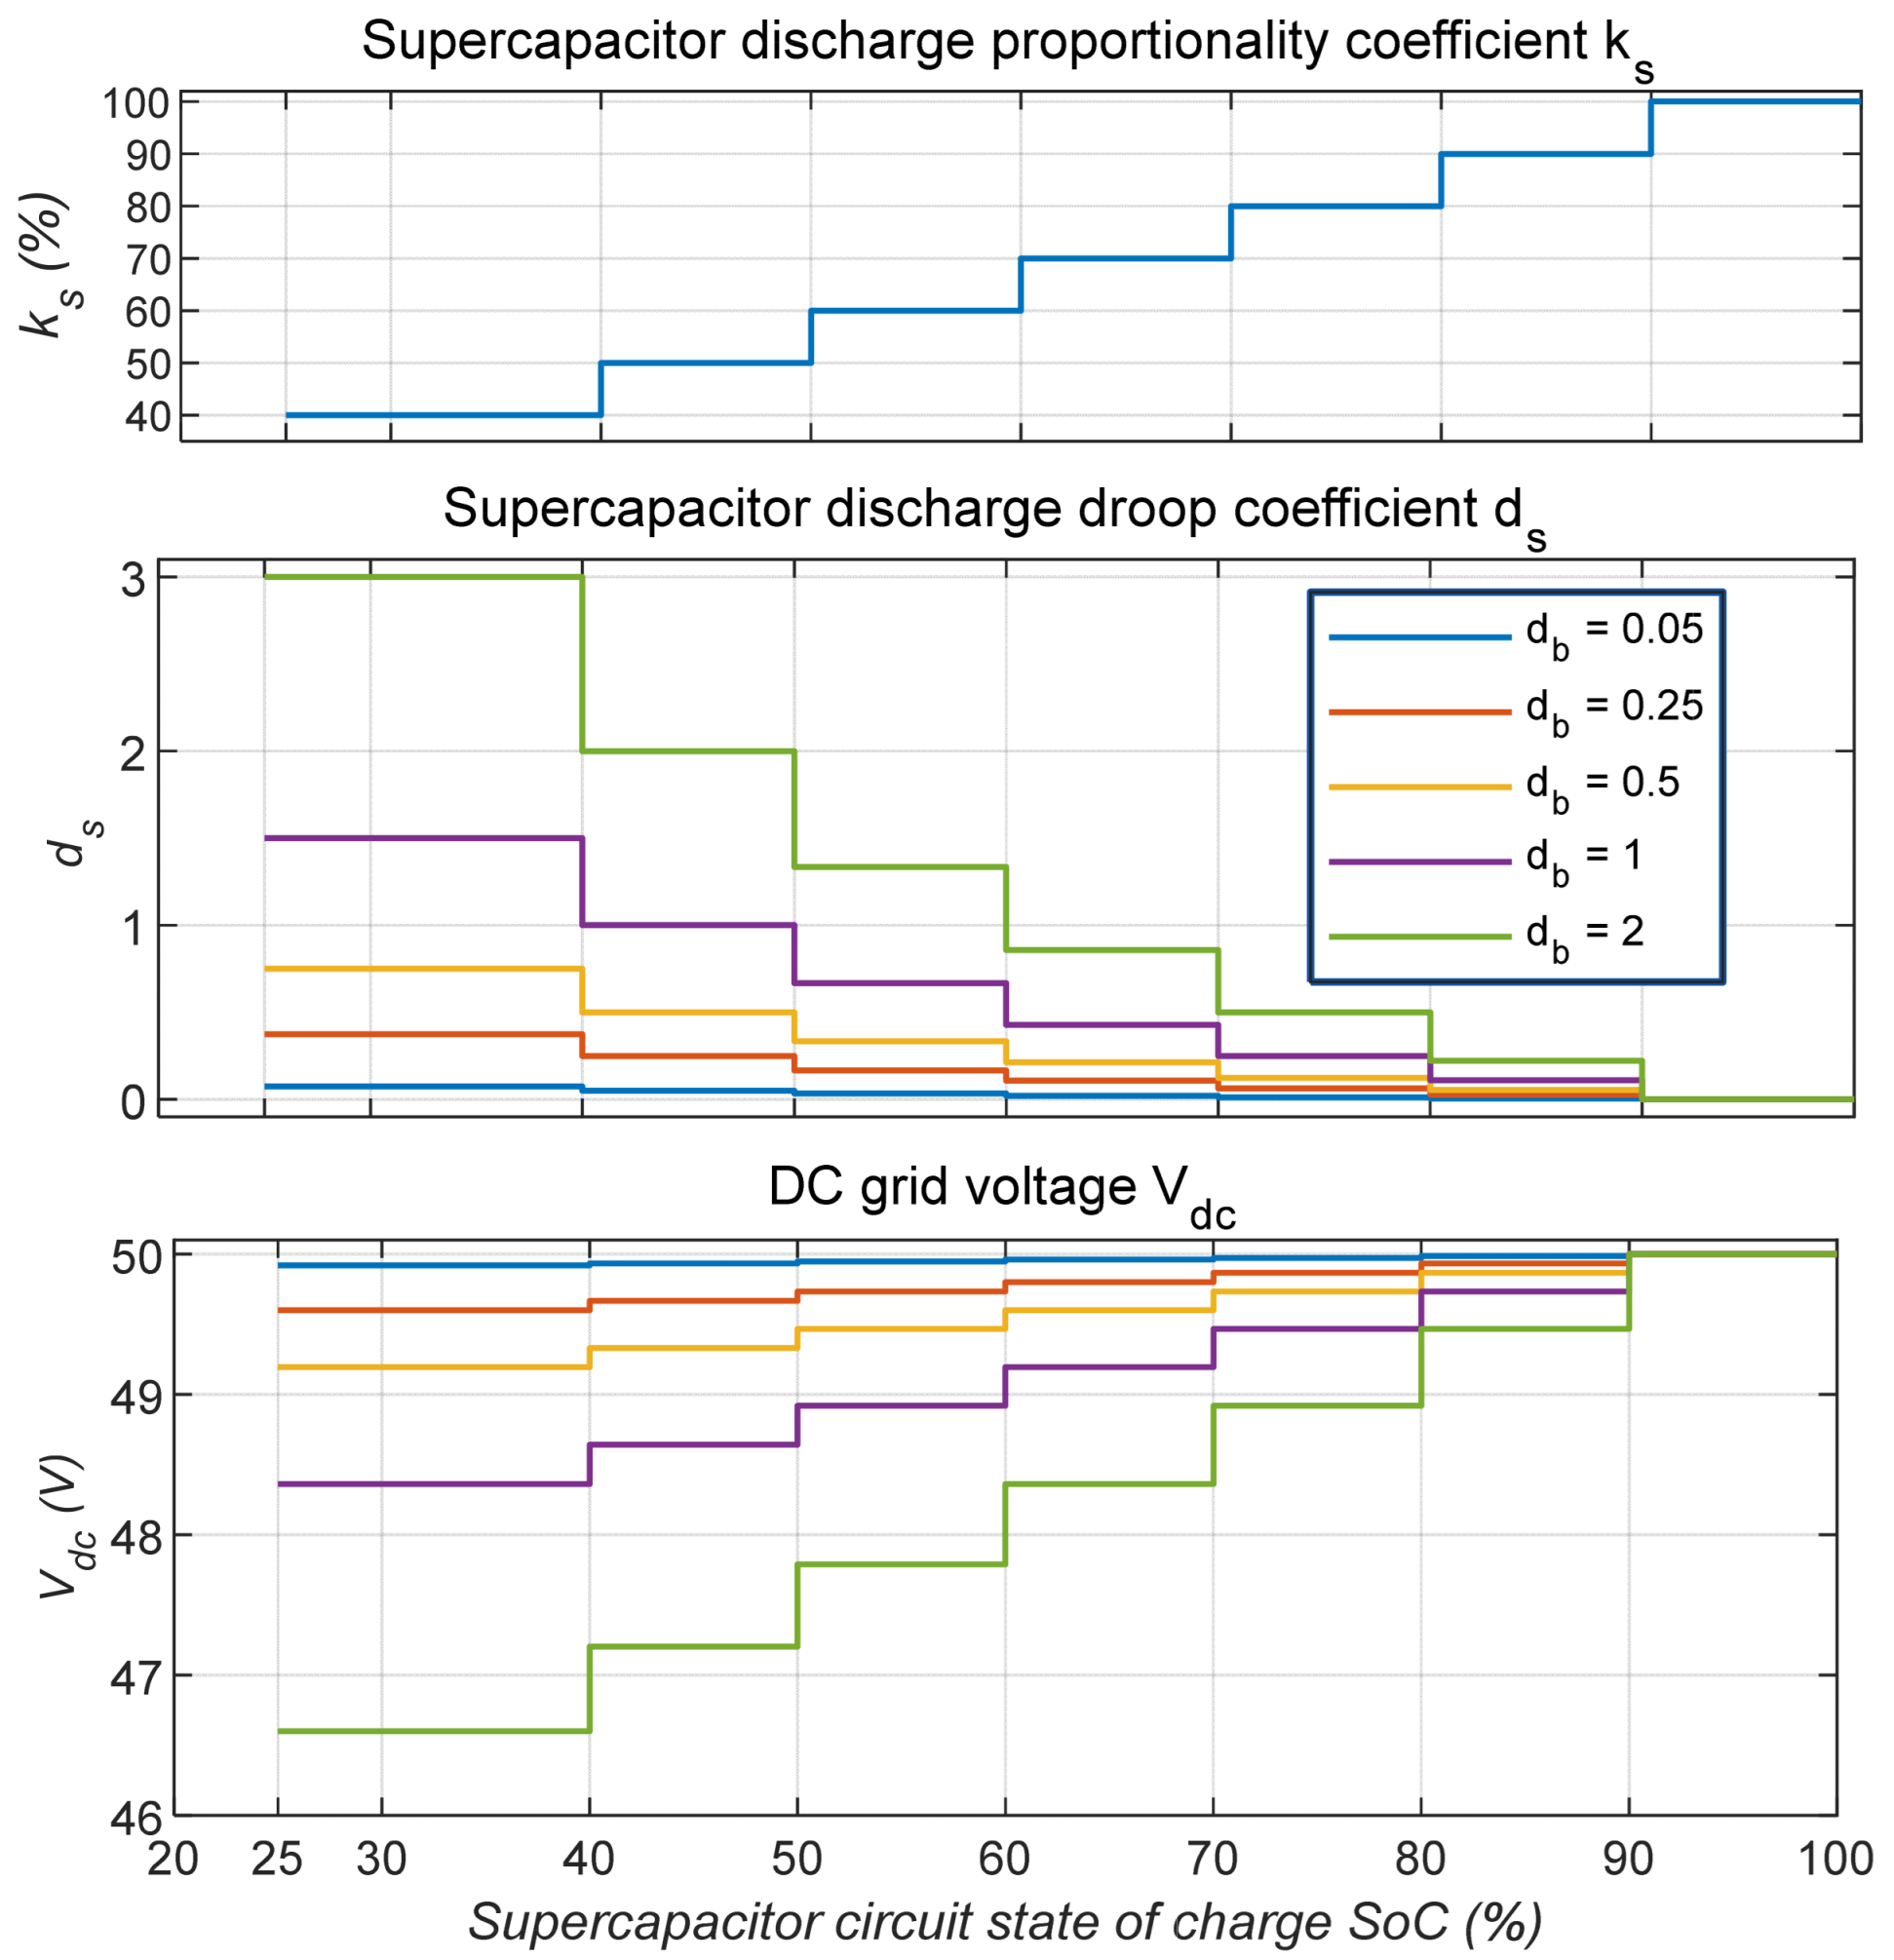
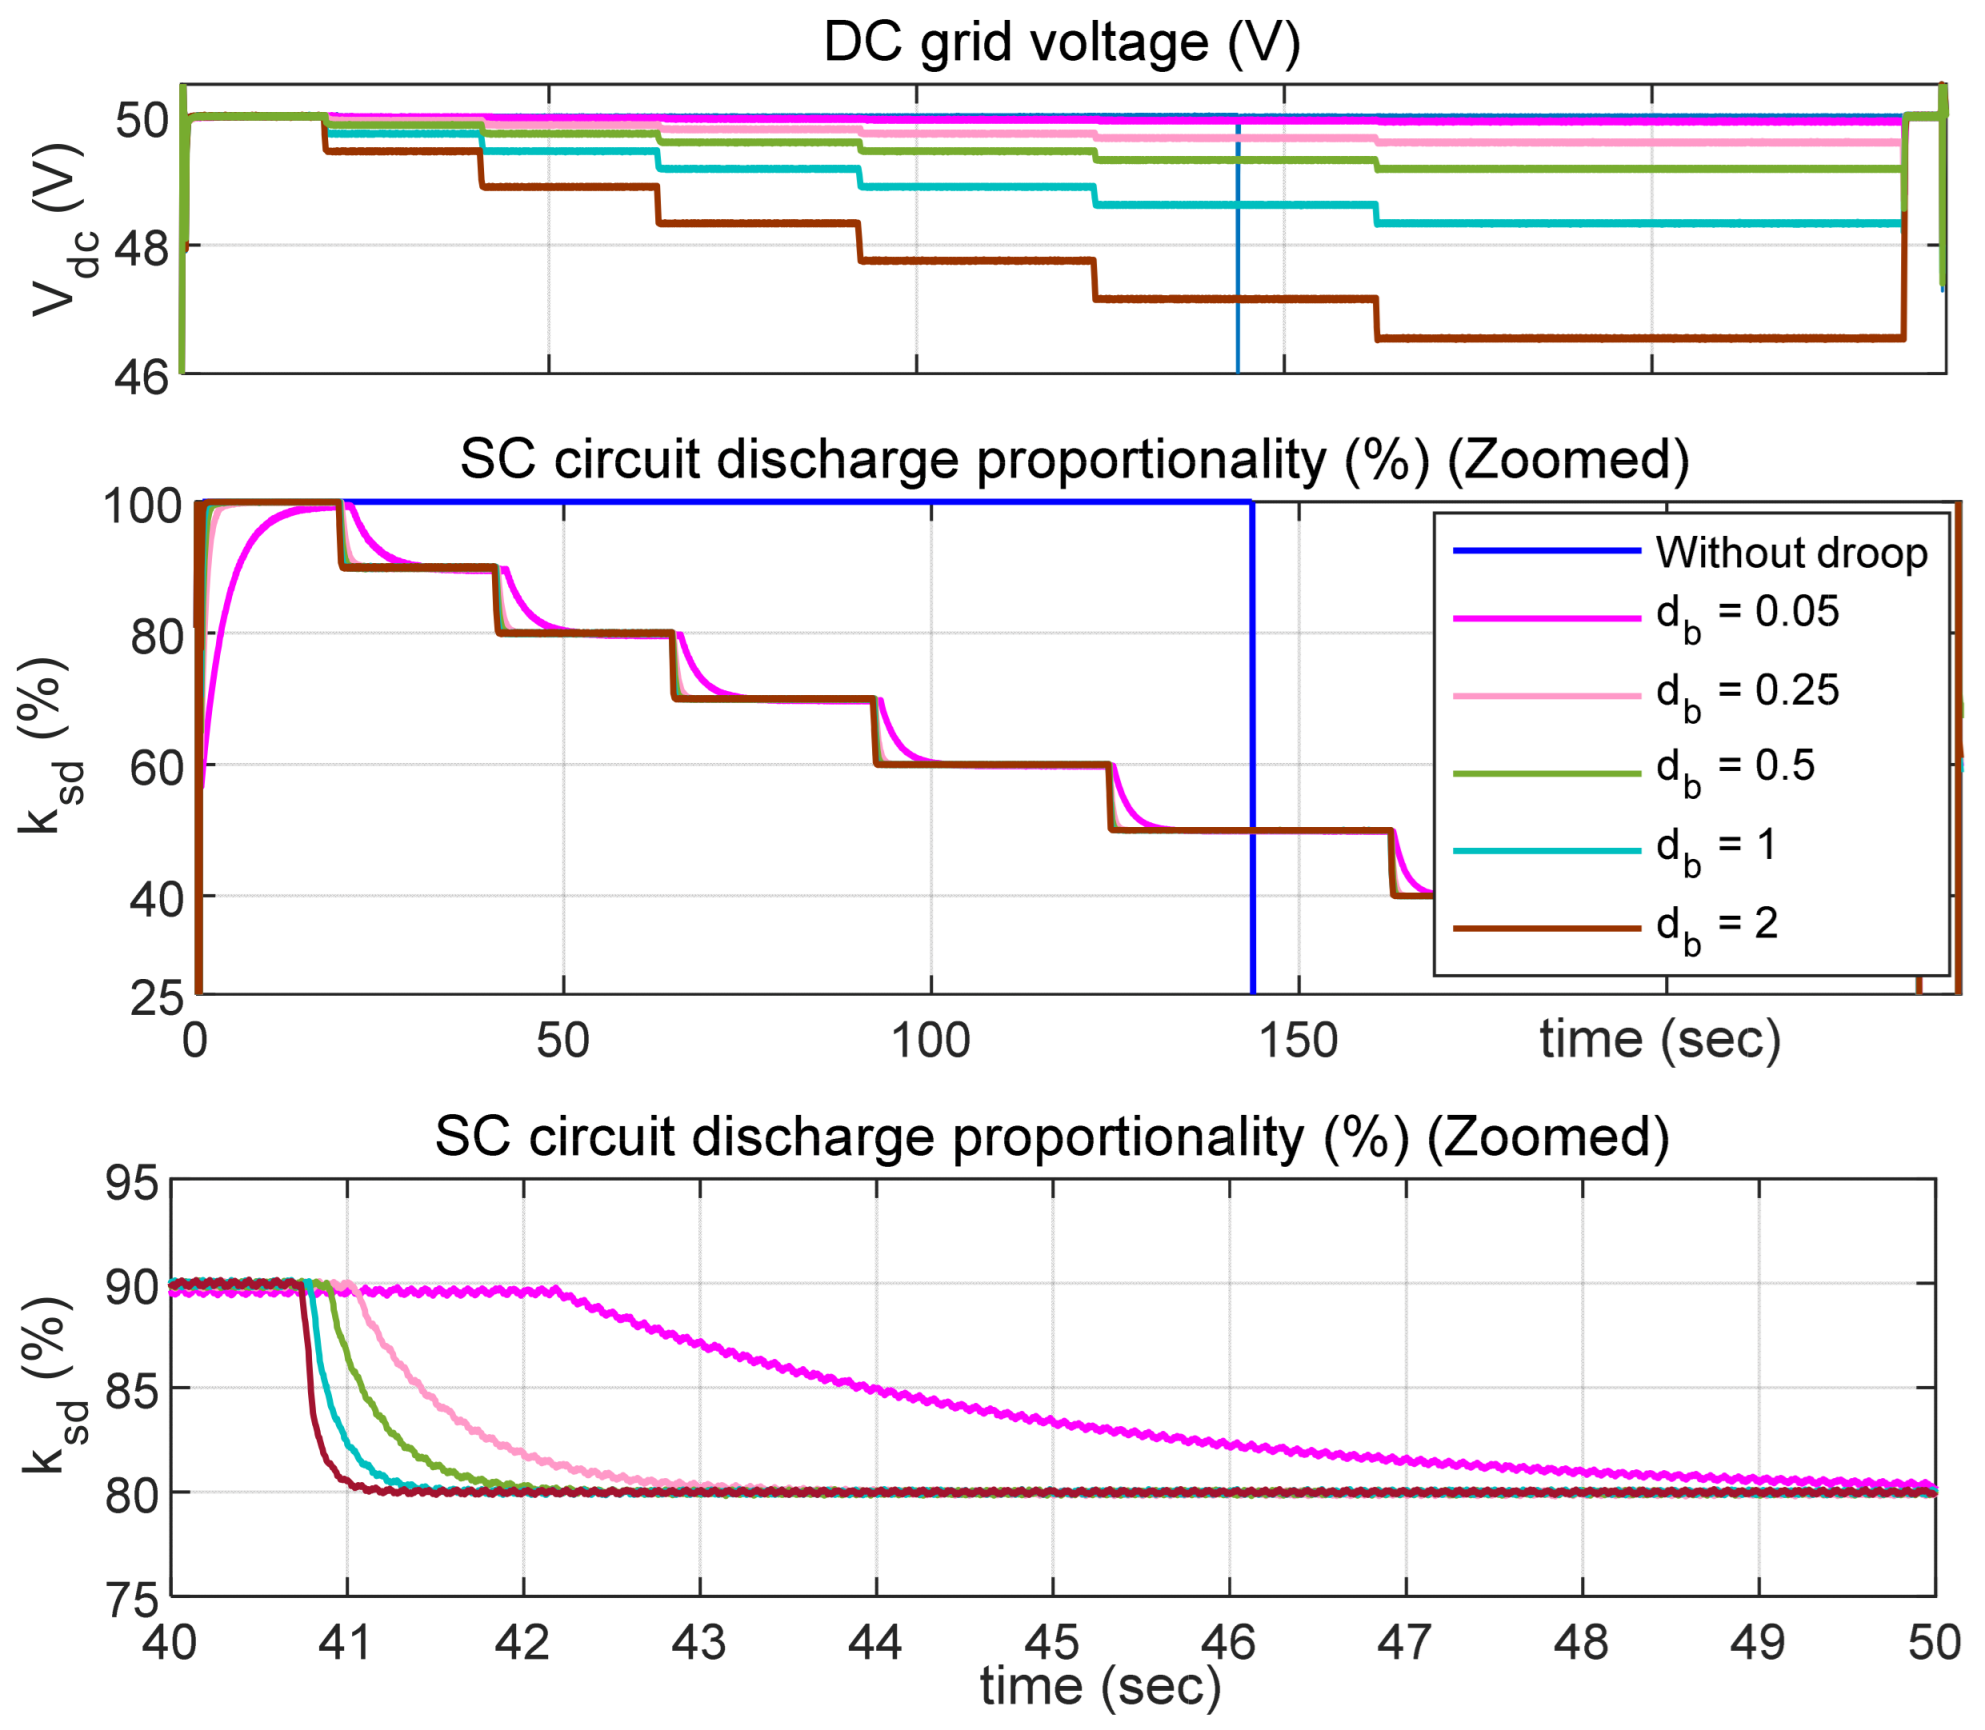
Further simulations were carried out using the stepwise
profile presented in the upper part of
Figure 8 as a function of the SoC, where
= 100% and
= 40%, and
= 25%. The study aimed to investigate whether the numerical value of the constant droop coefficient
of the battery controller had a significant impact on the discharge efficiency of the HESS (i.e., on its internal losses). For this purpose, five simulations were performed using different values of
ranging from 0.05 to 2.
By using the
curve, it was possible to calculate the expected SC droop coefficient
curves as a function of
prior to performing the simulations. The equation for calculating
can be derived from Equation (14), resulting in:
By using Equations (17) and (6), or Equations (18) and (5), the corresponding DC grid voltage curves can also be obtained for the specified values of .
Figure 8.
SC discharge proportionality, droop coefficient, and DC grid voltage variation depending on SC state of charge.
Figure 8.
SC discharge proportionality, droop coefficient, and DC grid voltage variation depending on SC state of charge.
3.4. Simulation Results of HESS Discharge
Simulations were conducted using MATLAB R2024b software to emulate the PV panel shading lasting 4 min (i.e., 240 s), with the initial SC SoC at its maximum value of 100%. In addition to the scenarios presented in
Figure 8, a simulation was performed for the case without droop control, where only the SC circuit discharged at the onset of PV panel shading with
= 100%, and the battery began discharging only after the SC circuit had reached its minimum permissible SoC, with
= 100%.
It was observed that in all cases with constant
values, the SC discharged over nearly equal durations. Therefore,
Figure 9 presents two curves: the blue curve represents the SC SoC for the case without droop control, while the red curve corresponds to all cases with droop control.
It was observed that the constant
values had nearly no impact on the internal losses of the HESS. Therefore,
Figure 10 presents four real-time loss curves (for both the SC and the battery) corresponding to the cases without and with droop control. The battery was initially at its maximum SoC; however, a lower SoC would result in increased losses due to the lower battery voltage.
Figure 11 presents the real-time variation curves of the total losses of the HESS for cases with and without droop control. The final values correspond to the total HESS losses over the entire discharge period. In this case, the implementation of droop control reduced the total losses by approximately 50%.
It was observed that the constant values of
influenced the response time required for the SC and battery powers to stabilize and achieve the desired
, as shown in
Figure 12 and
Figure 13. Very low
values—in the range of hundredths—resulted in longer response times, while the DC grid voltage
remained nearly unaffected. Therefore, an optimal constant value of the droop coefficient
can be considered one that ensures both a short response time and minimal
drops—for example,
= 1, at which
decreases by less than 2 V.
4. Droop-Control Based Regulation of HESS Charging
The classical control scheme of the energy storage converter in charging mode is shown in
Figure 14. This scheme is similar to the discharging mode control scheme (
Figure 2), except that the measured charging current,
, is subtracted from the output signal of the voltage controller.
If the charge control schemes for the SC and battery are identical (i.e., the same as in
Figure 14), then in Equation (1),
and
each represent 50% of
. To modify this power distribution, the charge control schemes can be supplemented with a droop control loop, which adds the product of the converter’s grid-side current and a specified droop coefficient to the reference voltage
[
20].
Figure 15 illustrates the SC charge control scheme with droop coefficient
, while
Figure 16 illustrates the battery charge control scheme with droop coefficient
.
The DC grid voltage that will be maintained by the converter can be expressed by an equation corresponding to the SC discharge control scheme:
The DC grid voltage that will be maintained by the converter can be expressed by the equation corresponding to the battery discharge control scheme:
Similar to the discharge case, the transient process is short, therefore, the desired DC voltage is controlled precisely and can be calculated by Equations (24) and (25). The HESS charge power can be expressed as the sum of the SC and battery grid-side currents,
and
, multiplied by the grid voltage
in Equation (24):
The HESS charge power can be expressed as the sum of the SC and battery grid-side currents,
and
, multiplied by the grid voltage
in Equation (25):
The SC charge proportionality coefficient
determines the share of
contributed by
, and it can be expressed in three ways: based on the charge powers
and
, using the battery charge proportionality coefficient
, or based on the charge currents
and
:
The battery charge proportionality coefficient
can be expressed as:
4.1. Impact of Droop Coefficients on SC and Battery Power Distribution During HESS Charging
During HESS charging, the grid-side voltages of the SC and battery converters can also be considered equal. Therefore, Equation (24) equals Equation (25), resulting in:
From Equation (30), the equations for
and
can be derived as follows:
The derivation procedure for the proportionalities
and
in terms of
and
follows the same approach as described previously for the discharge case. Consequently, equations similar to those derived in the discharging case are obtained:
The surfaces representing the dependence of
and
on
and
are identical to those shown in
Figure 5.
4.2. Impact of Droop Coefficients on DC Grid Voltage During HESS Charging
In the HESS charging mode, the DC grid voltage
is higher than the reference voltage
. Similar to the discharge case, to determine the impact of numerical values of
and
on
, it is necessary to derive an expression for
as a function of
and
.
can be calculated using Equations (24) and/or (25), where the unknown parameters are
,
, and
, while the known parameters are
,
and
. Therefore, to calculate
, it is also necessary to compute
and/or
by first deriving their respective expressions. It is assumed that for a known PV panel power, the portion of power delivered to the HESS (i.e.,
) is also known. Inserting Equation (31) into Equation (26) results in a quadratic equation for deriving a new equation for the current
:
The root of Equation (35) corresponding to the current
is the one with the positive sign in front of the square root:
By calculating
using Equation (36), the voltage
can be determined by Equation (24) but it is also possible to derive an equation for the current
. Inserting Equation (32) into Equation (27) results in a quadratic equation for deriving a new equation for
:
The root of Equation (18) corresponding to the current
is the one with the positive sign in front of the square root:
By examining the expression under the square root in Equation (38), it can be concluded that it is always positive. Therefore, from a mathematical perspective, the coefficients
and
can take any numerical values without restrictions. However, for certain combinations of
and
values, the DC grid voltage
may significantly exceed the reference voltage
. To determine the permissible ranges of
and
, the maximum allowable
must be defined.
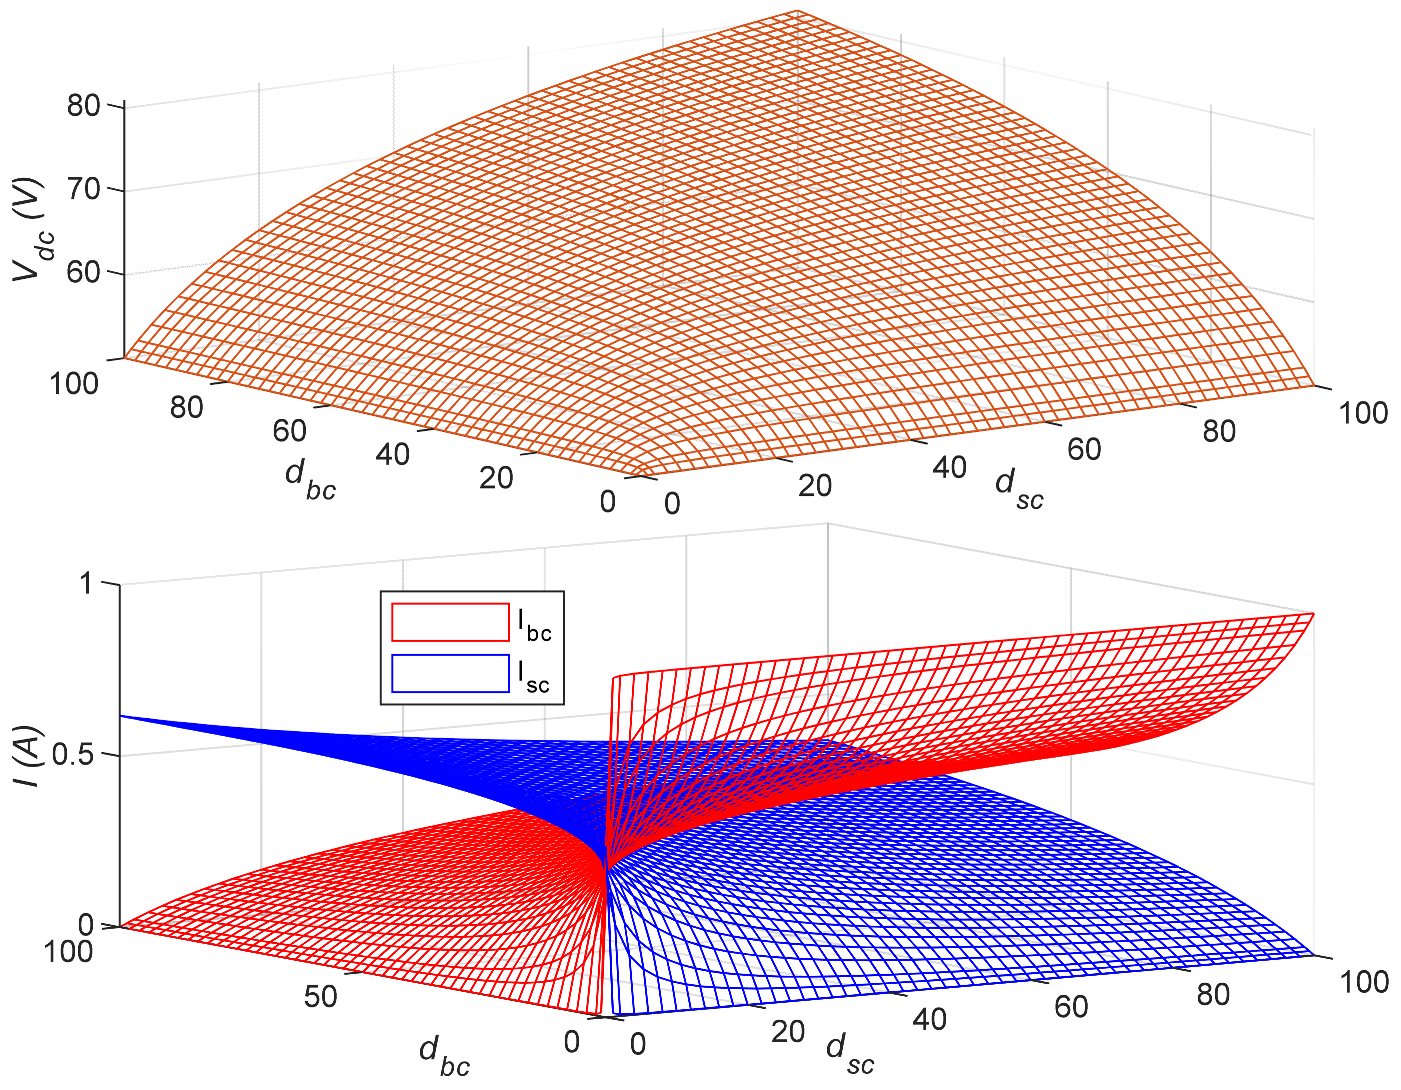
Figure 17 illustrates the variation surface of
,
and
as functions of the values of
and
within the range from 0 to 100.
4.3. HESS Charging Simulation Results
The stepwise regulation of HESS charging proportionality operates according to the same principle as described in
Section 3. The droop coefficient
of the battery charging controller is kept constant, whereas the droop coefficient
of the SC charging controller is calculated based on the desired SC charge proportionality
as follows:
It was previously established that for a given SC discharge proportionality , the values of the droop coefficients have a negligible effect on the internal losses and discharge duration of the HESS. Therefore, it is expected that the same behavior applies to the HESS charging process.
Two simulations were performed to emulate a 7-min HESS charging process using two different constant values of the battery charging controller droop coefficient . In addition, a HESS charging simulation without droop control was carried out, in which only the SC was charged initially, while the battery began charging only after the SC reached its maximum SoC.
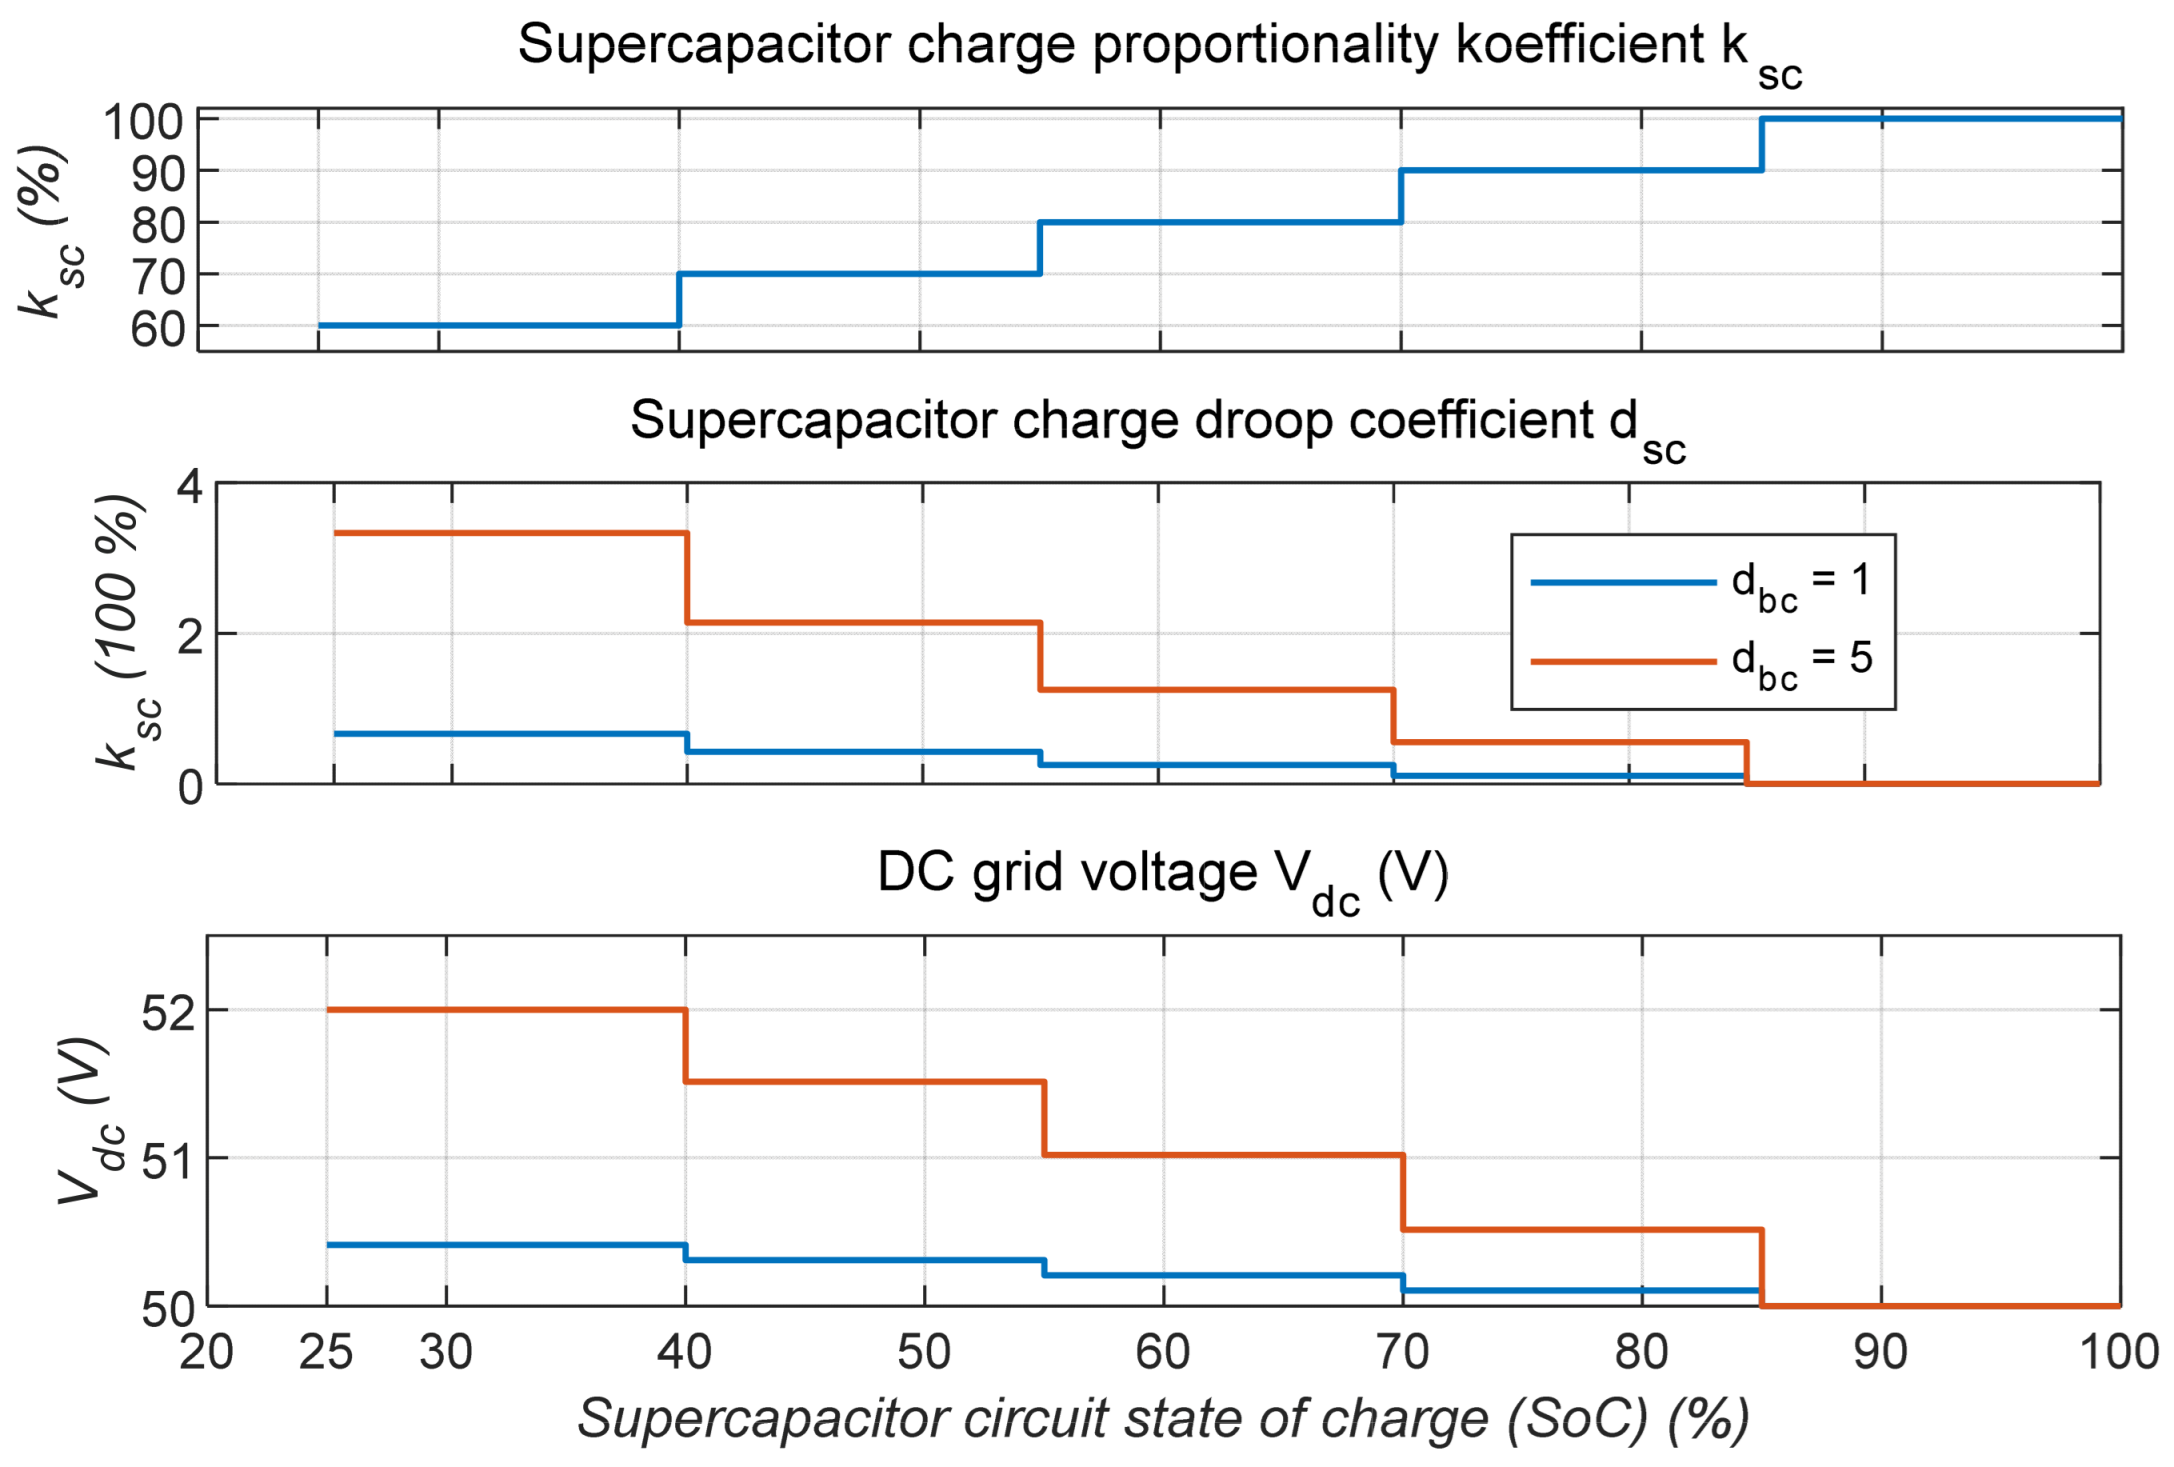
Figure 18 shows the selected stepwise variation of the SC charging intensity
as a function of the SC SoC, where the minimum
was 60%. It also presents the corresponding variation of the SC charging droop coefficient
calculated by Equation (39) and the corresponding variation of the DC grid voltage
calculated by Equation (24) or (25) for cases where the battery charging droop coefficient was set to 1 and 5.
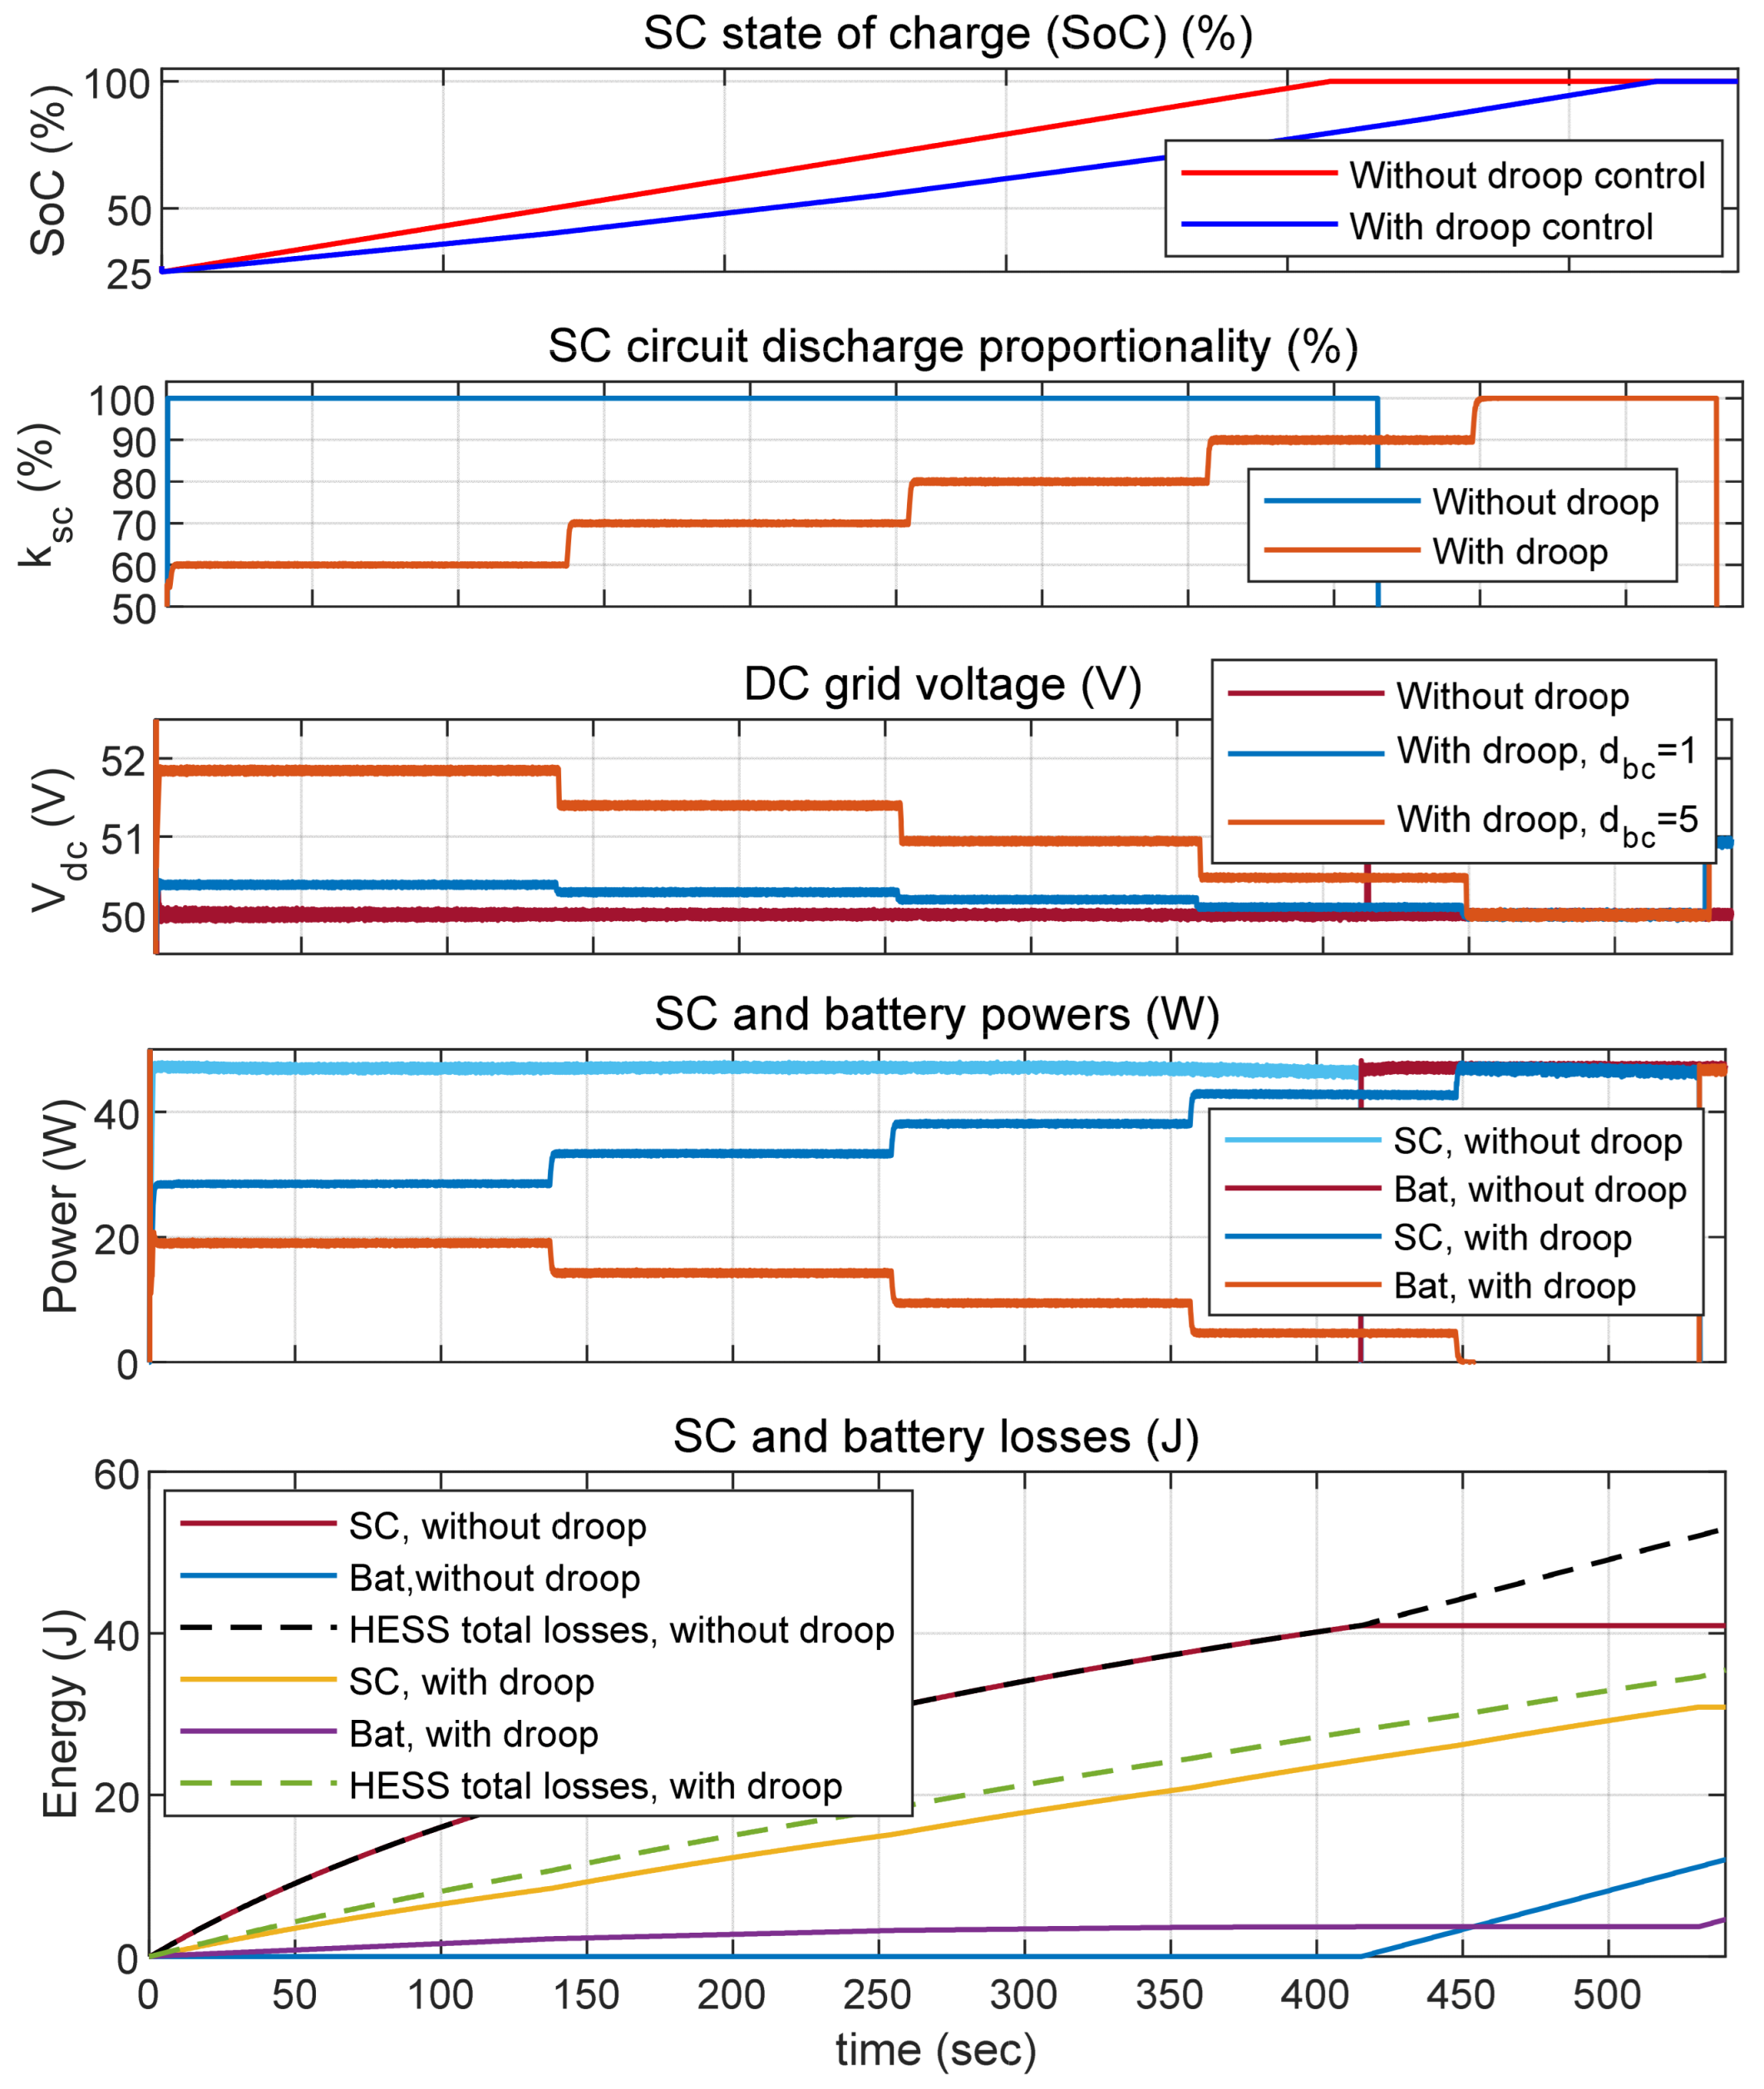
At the beginning of the simulations, the initial SoC of SC was 25%, and
Figure 18 shows the simulation results.
As observed in
Figure 19, the internal losses of the SC were higher than those of the battery, since the initial SoC of the battery was set relatively high. At lower battery SoC levels, the losses would increase due to the reduced battery voltage and higher current.
5. Impact of DC Grid Voltage Levels on Droop Coefficients
The simulation results indicate that implementing droop control to modify the power distribution between the battery and SC during charging and discharging improves the operational efficiency of the HESS due to reduced internal losses. This, in turn, contributes to extending the service lifetime of the HESS. Nevertheless, the extent of the loss reduction depends on the internal resistance and state of charge of the HESS storage elements.
It is possible to select the maximum and minimum values of the DC grid voltage
relative to the reference value
. This can be achieved by calculating
as a function of the battery and SC droop coefficients, as described in
Section 3 and
Section 4, thereby determining the ranges within which the limits of
are not exceeded. The
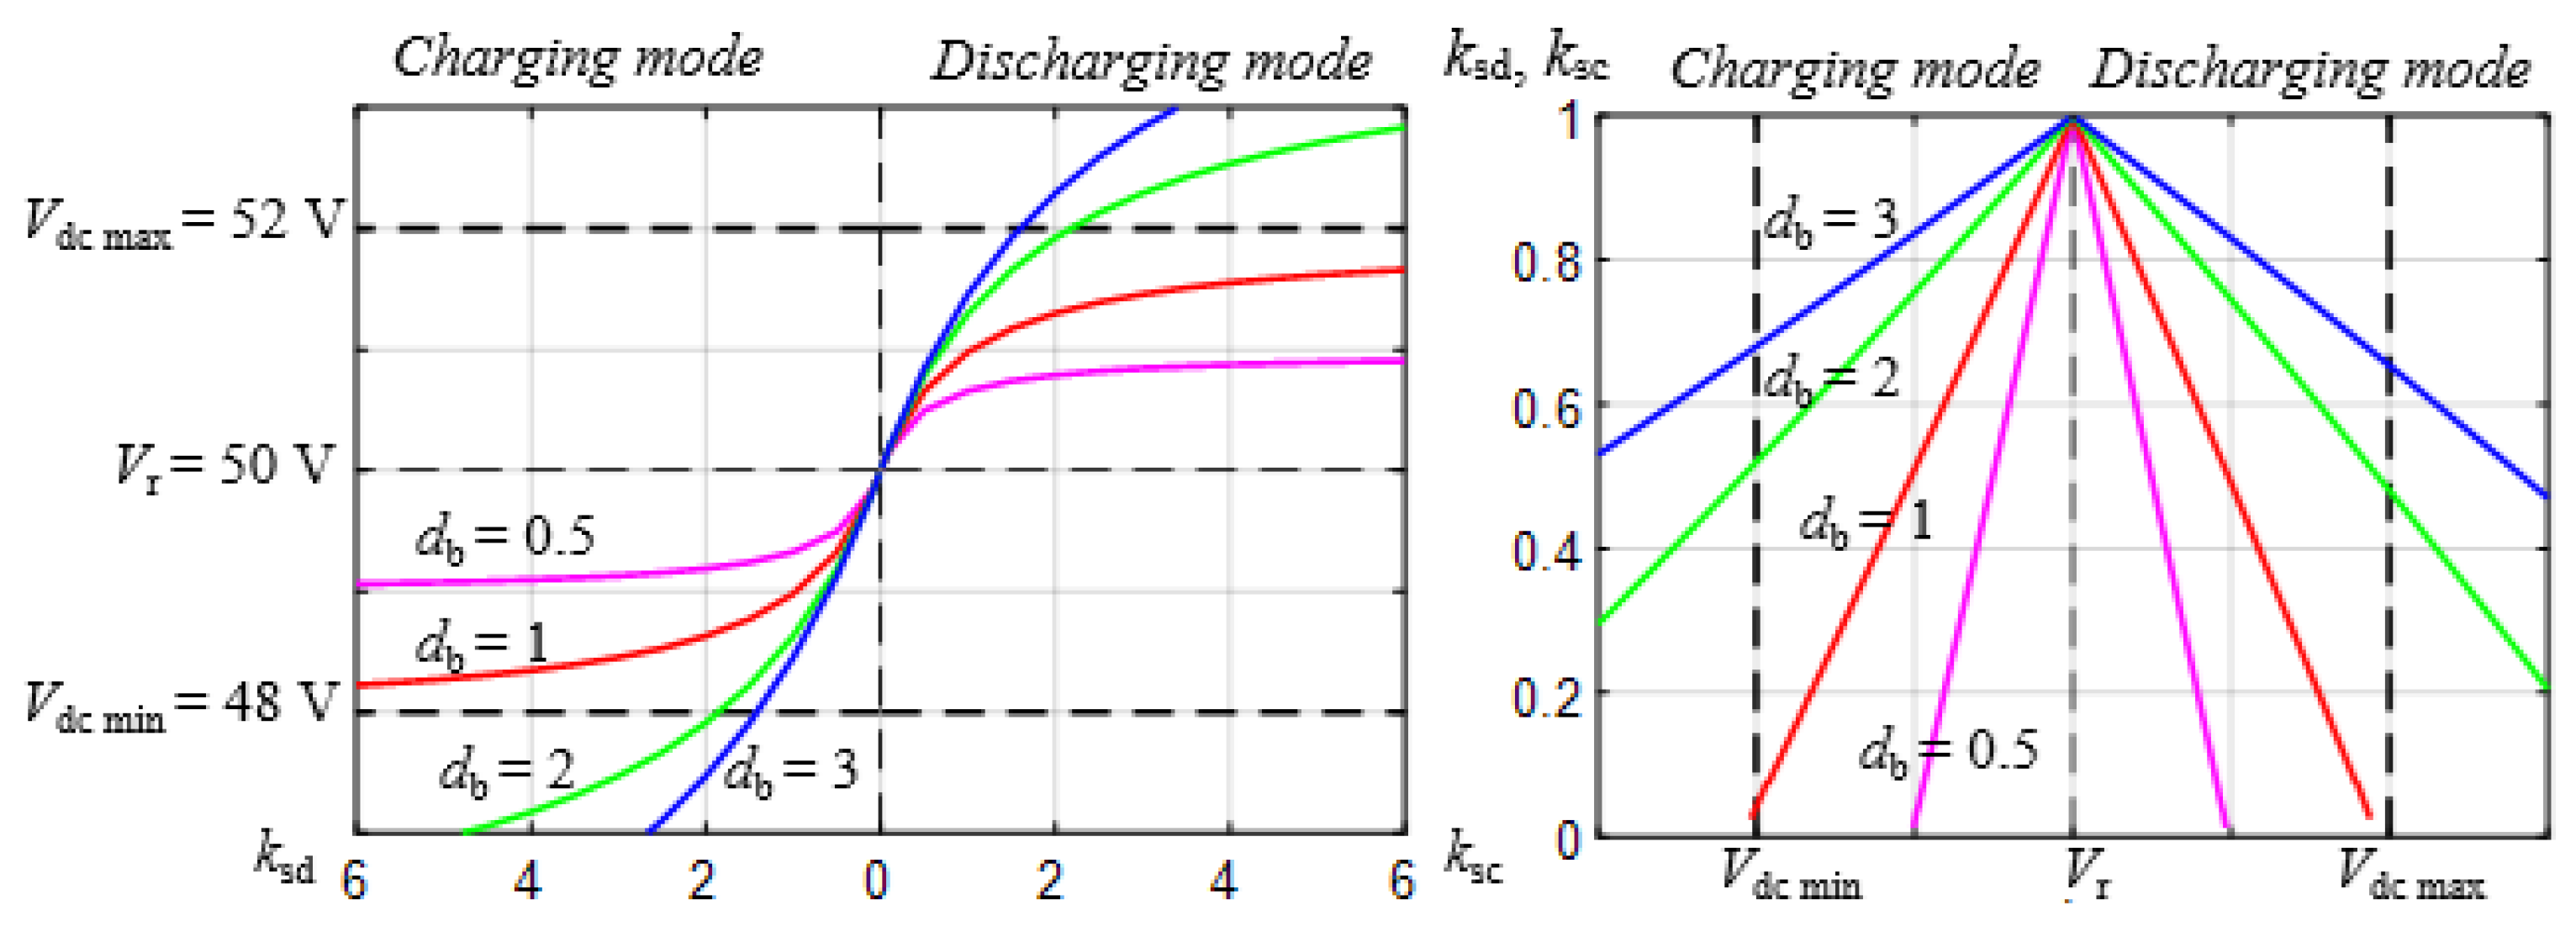
variation curves for different constant values of the battery droop coefficient
in both charging and discharging modes are represented on the left side of
Figure 20, as a function of the SC droop coefficient
in discharging mode and
in charging mode, assuming that the HESS output power is 132 W in the discharging mode and 50 W in the charging mode. It was assumed that the permissible DC grid voltage
variation range was ± 2 V from the 50 V reference voltage. The
limits were reached more quickly at higher HESS power levels and with higher values of
. On the right side of
Figure 20, the changes in SC charging and discharging proportionalities
and
are shown as a function of
for the same constant
values. In this case, the defined
limit range allowed for the determination of the minimum permissible values of
and
.
Figure 21 shows the
variation curves for the case where the HESS output power was 100 W in both discharging and charging modes. In this case, the
curves changed more symmetrically in discharging and charging modes compared with
Figure 20, especially within the
range, which did not significantly deviate from the reference value of 50 V. However, this symmetry gradually decreased as the
deviation increased.
From a practical standpoint, the application of droop control during the charging mode of a HESS, by adjusting the power distribution between the SC and battery, may be less commonly employed. For instance, in the case of the stand-alone water pump power supply system described in this work, it may be crucial to recharge the SC as quickly as possible in order to utilize it during the next shading of the PV panel. In contrast, the implementation of droop control during the discharging mode of the HESS—by modifying the power sharing between the SC and the battery—can be beneficial for improving the overall operational efficiency of the HESS.
6. Experimental Setup and Results
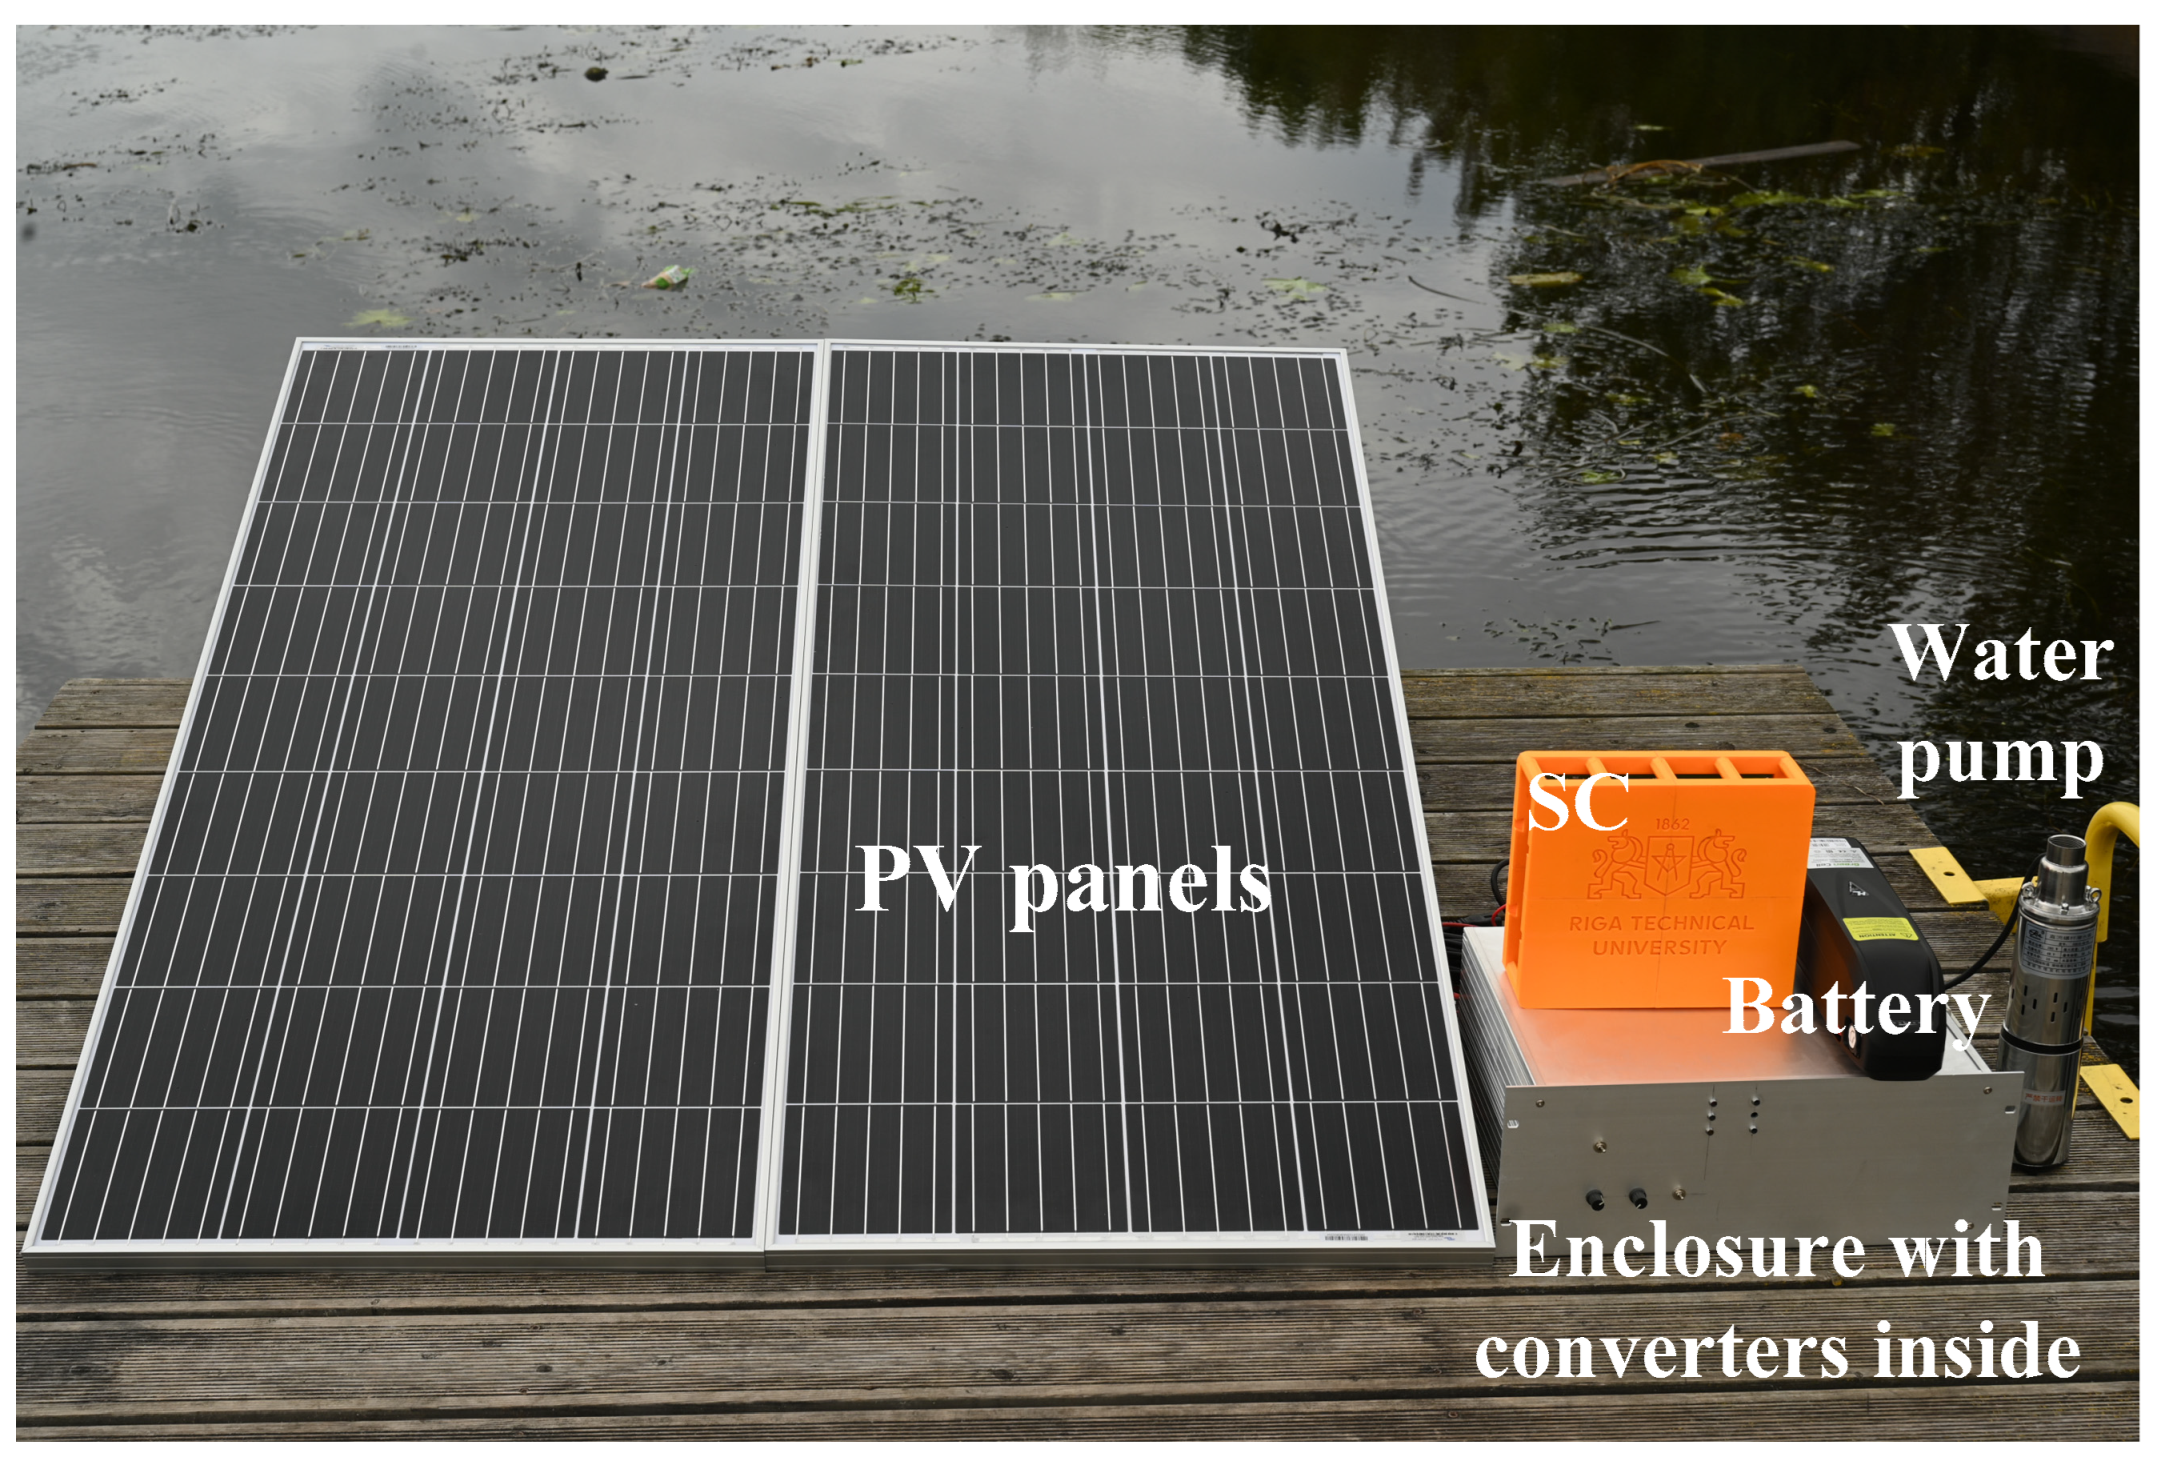
The methods described previously can be used in many applications that are powered from PV panels and where HESSs can be useful. In this case, as an application example, a PV-fed water pump was selected. The capability to provide continuous water flow improves the pump efficiency and lifetime; in some applications such as in solar collectors, providing water flow even in the case of cloud coverage of the PV panel is a must since the collector system has thermal inertia. The experimental setup can be seen in
Figure 22, which consisted of PV panels, electrical water pump, SC, battery, and four power electronic converters placed in the enclosure. Two BlueSolar Monocrystalline 175 W, 12 V PV panels were connected in a series to generate electricity. The Boost converter with perturb and observe MPPT algorithm was used to boost the voltage and control power flow from the PV panel.
The previously described methods can be implemented with any kind of current and voltage controller, which provides the stable operation of the converters. Although the proposed method ensures power distribution between both storages after the transient process in stationary mode, the droop coefficient impacts the reference voltage, making stabilization of the voltage during sudden load changes more difficult, considering that a SC is better suited for a faster transient response. In [
38], the authors proposed using a nonlinear droop coefficient to accelerate the step response. This method has been improved and applied to reduce the voltage drop and transient time. The idea is explained in
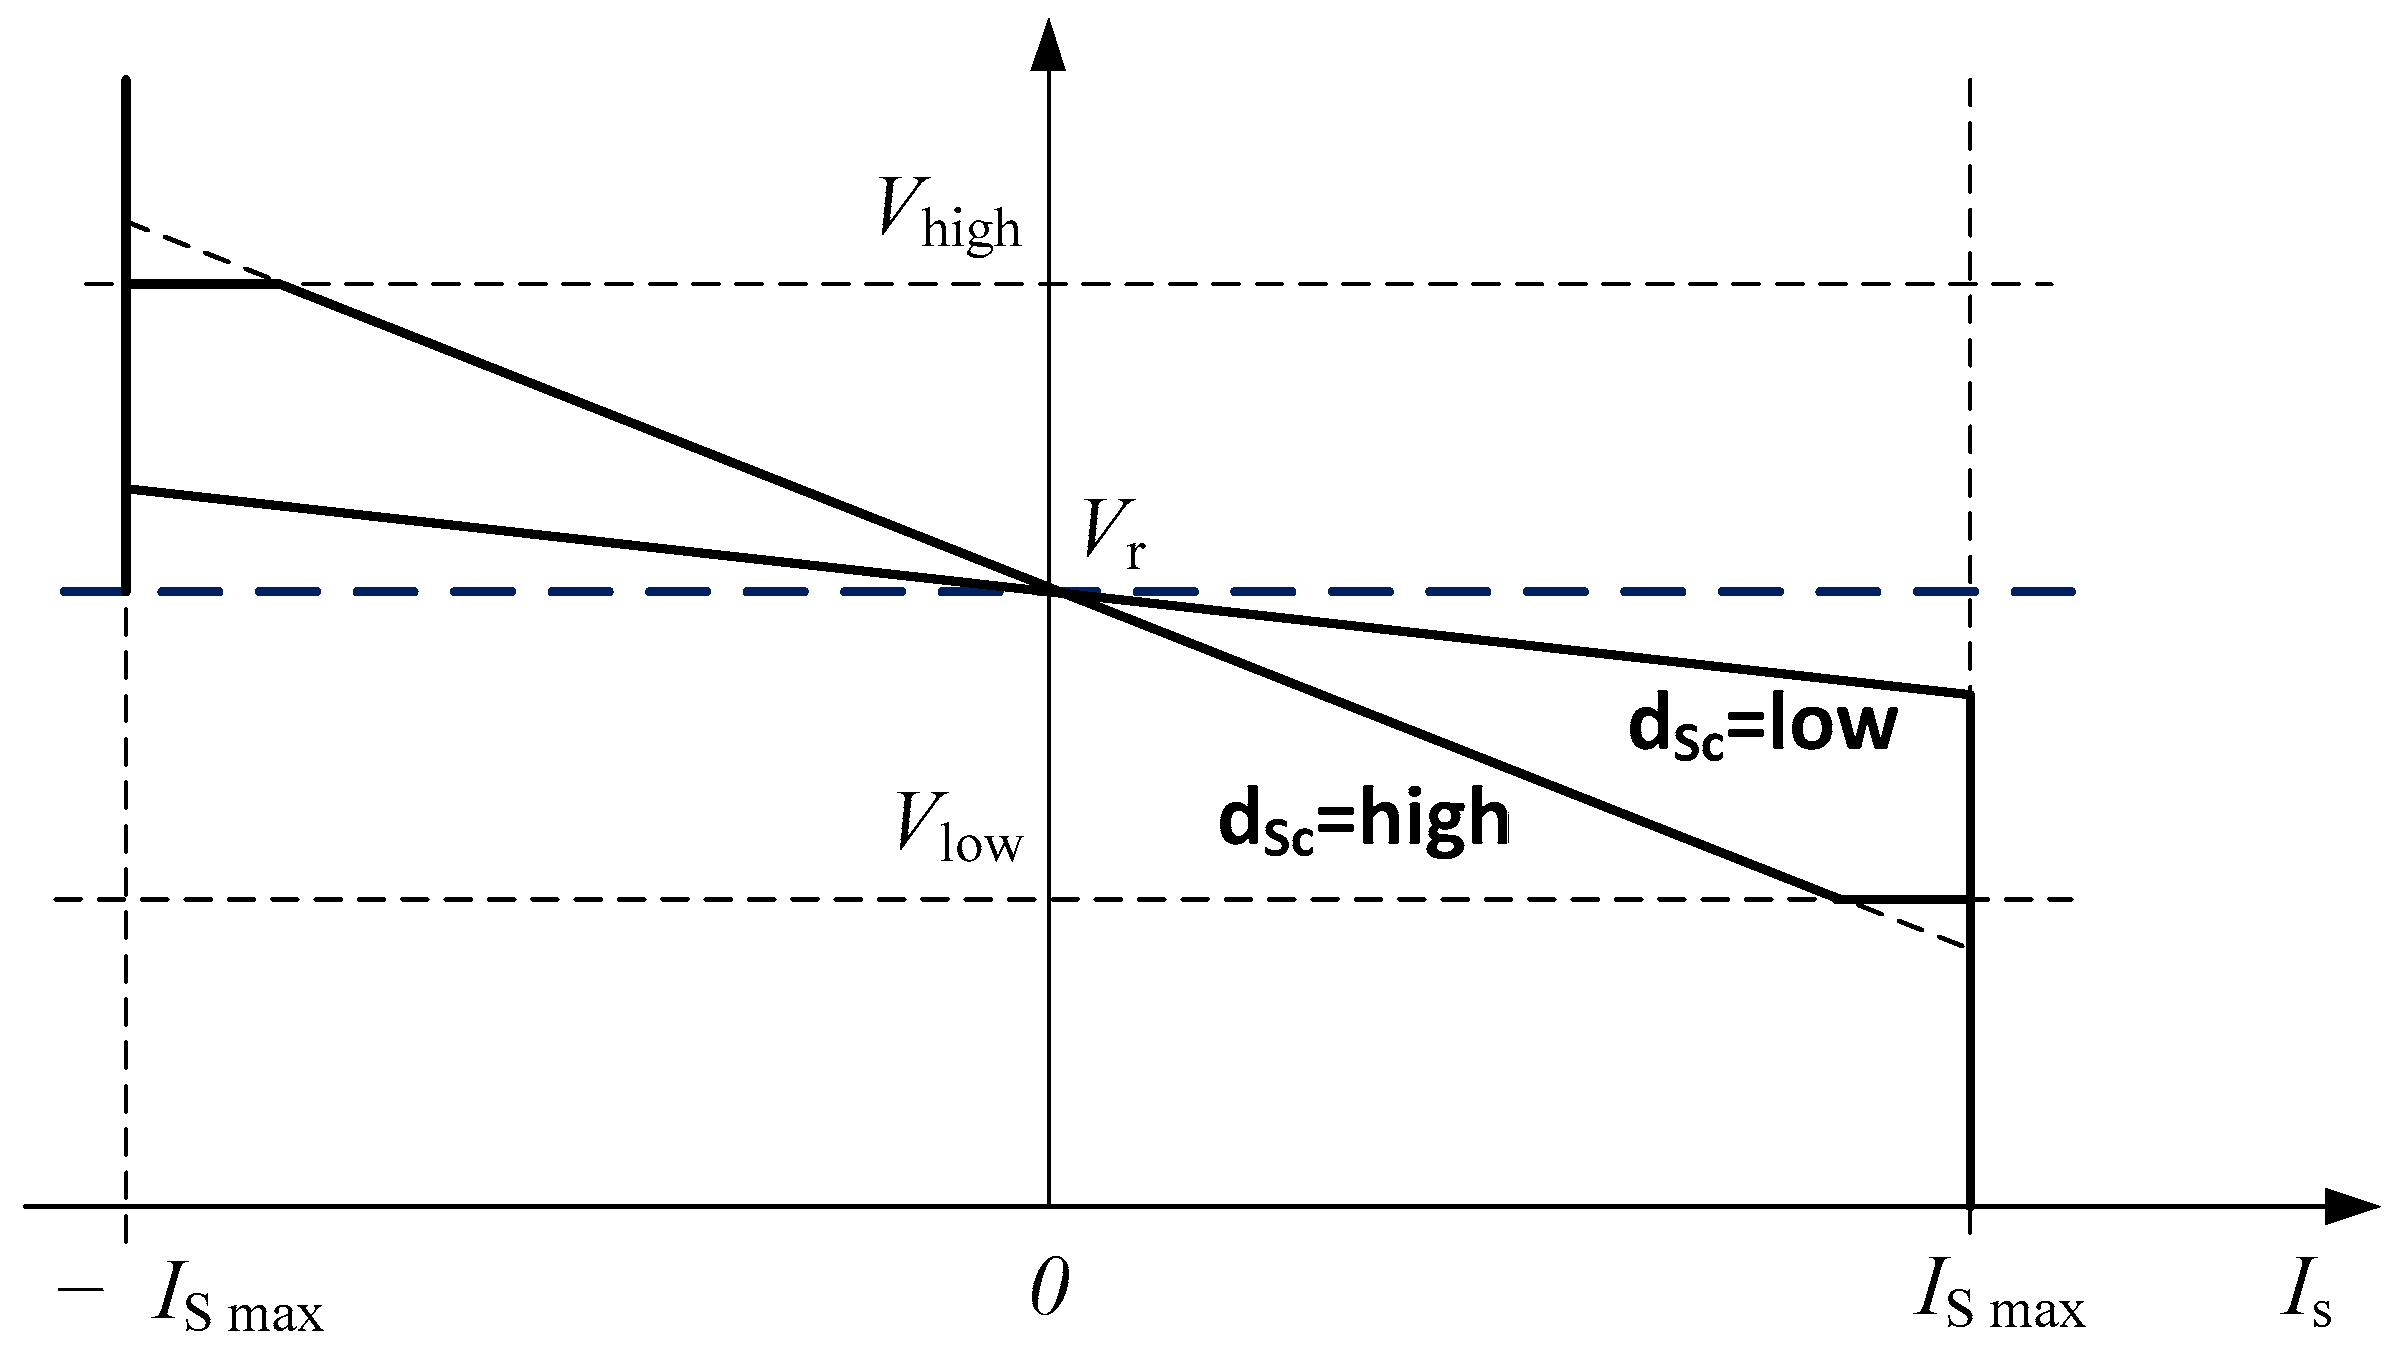
Figure 23 and
Figure 24. When the voltage drop achieves the set minimum value in discharge mode or the maximum value in charge mode, then the voltage reference is limited to this minimal or maximal value. This is not required if the droop coefficient is low, as it is in the case of the high SoC of SC. If the SoC is low, meaning that the supercapacitor is close to the minimum charge level, then a low voltage limiter sets the minimum voltage reference level, which helps boost the voltage faster, thus preventing an undesired voltage drop. This also can be implemented by droop coefficient selection, as described in
Section 5, but it is more complicated to achieve the optimal power distribution between both storages. Such limitations can be easily implemented into a digital control system by adding a limiter, as seen in
Figure 24.
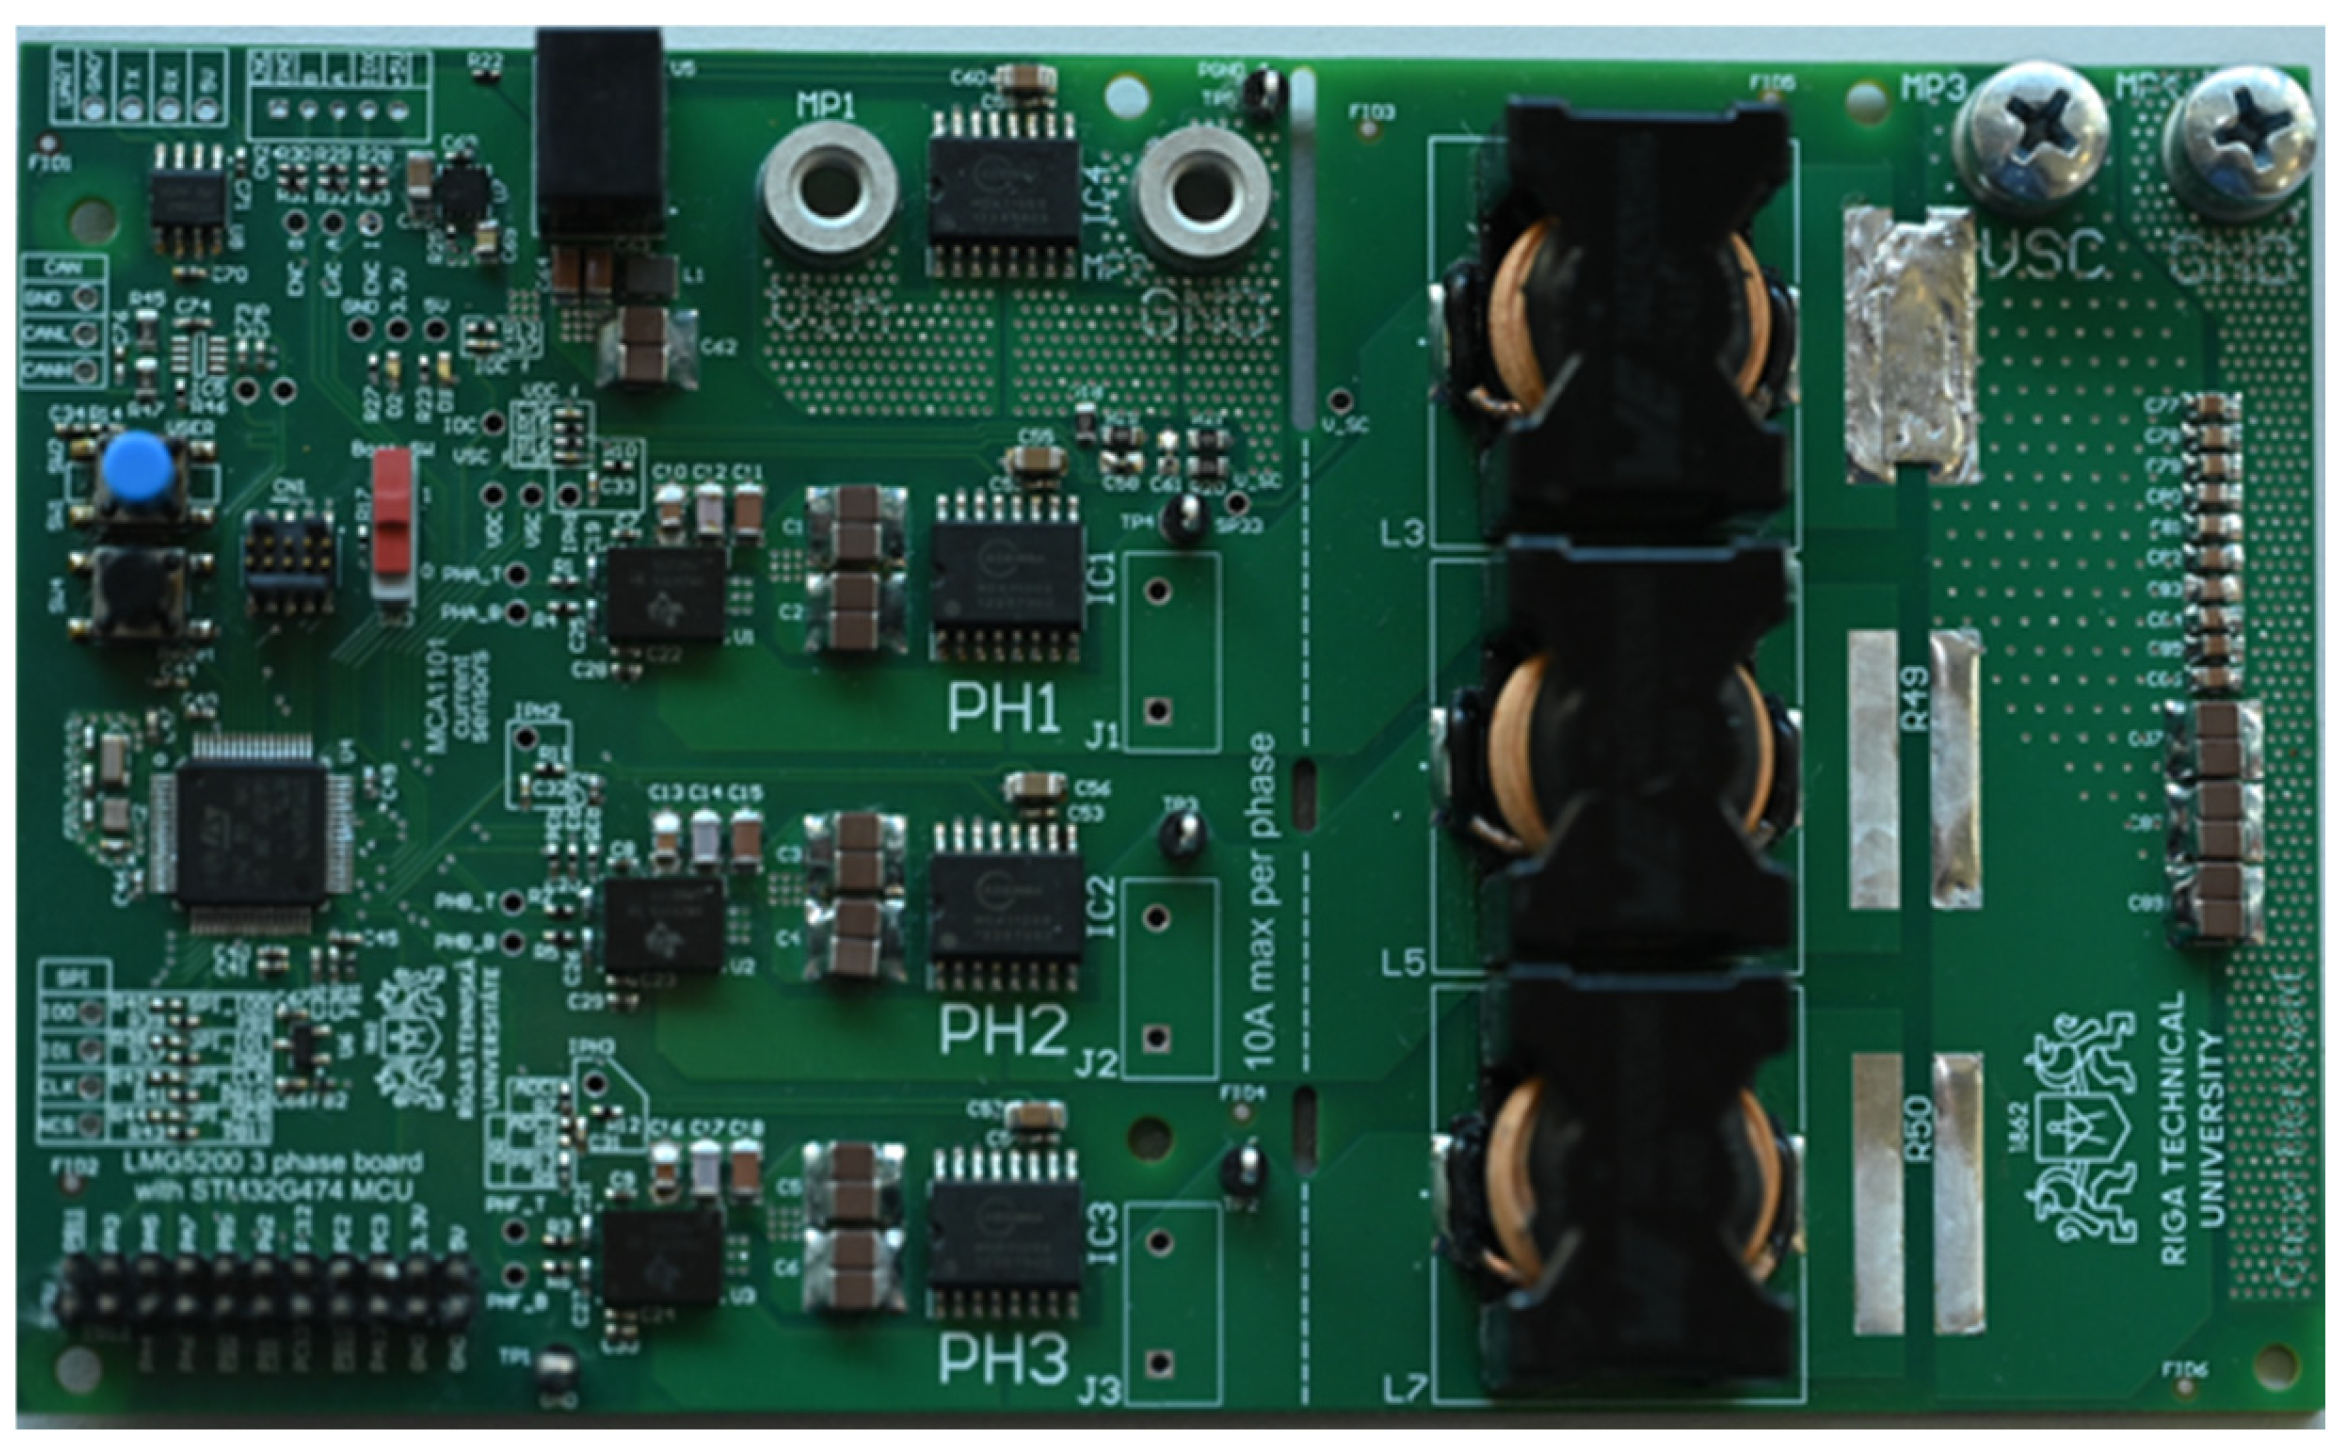
An experimental prototype of a DC-DC converter can be seen in
Figure 25. The converter uses LMG5200MOFT gallium nitride transistors (Texas Instruments, Dallas, TX, USA), and there are three parallel legs that can be activated depending on the requested power level working in interleaving mode. The switching frequency of the converter is 400 kHz. An STM32G474RET6 microcontroller (STMicroelectronics, Geneva, Switzerland) was used for digital control implementation. A Hall effect based current sensor MCA1101-20-3 (Aceinna, Boston, MA, USA) was used for current measurement. As a current controller, the 2P2Z digital controller was designed with the following transfer function in the z plane:
The current control loop calculation was implemented in each switching period and a less than 200 µs transient response time of the current loop was achieved. The 2P2Z controller was designed for outer voltage loop as well with the following transfer function in the z plane:
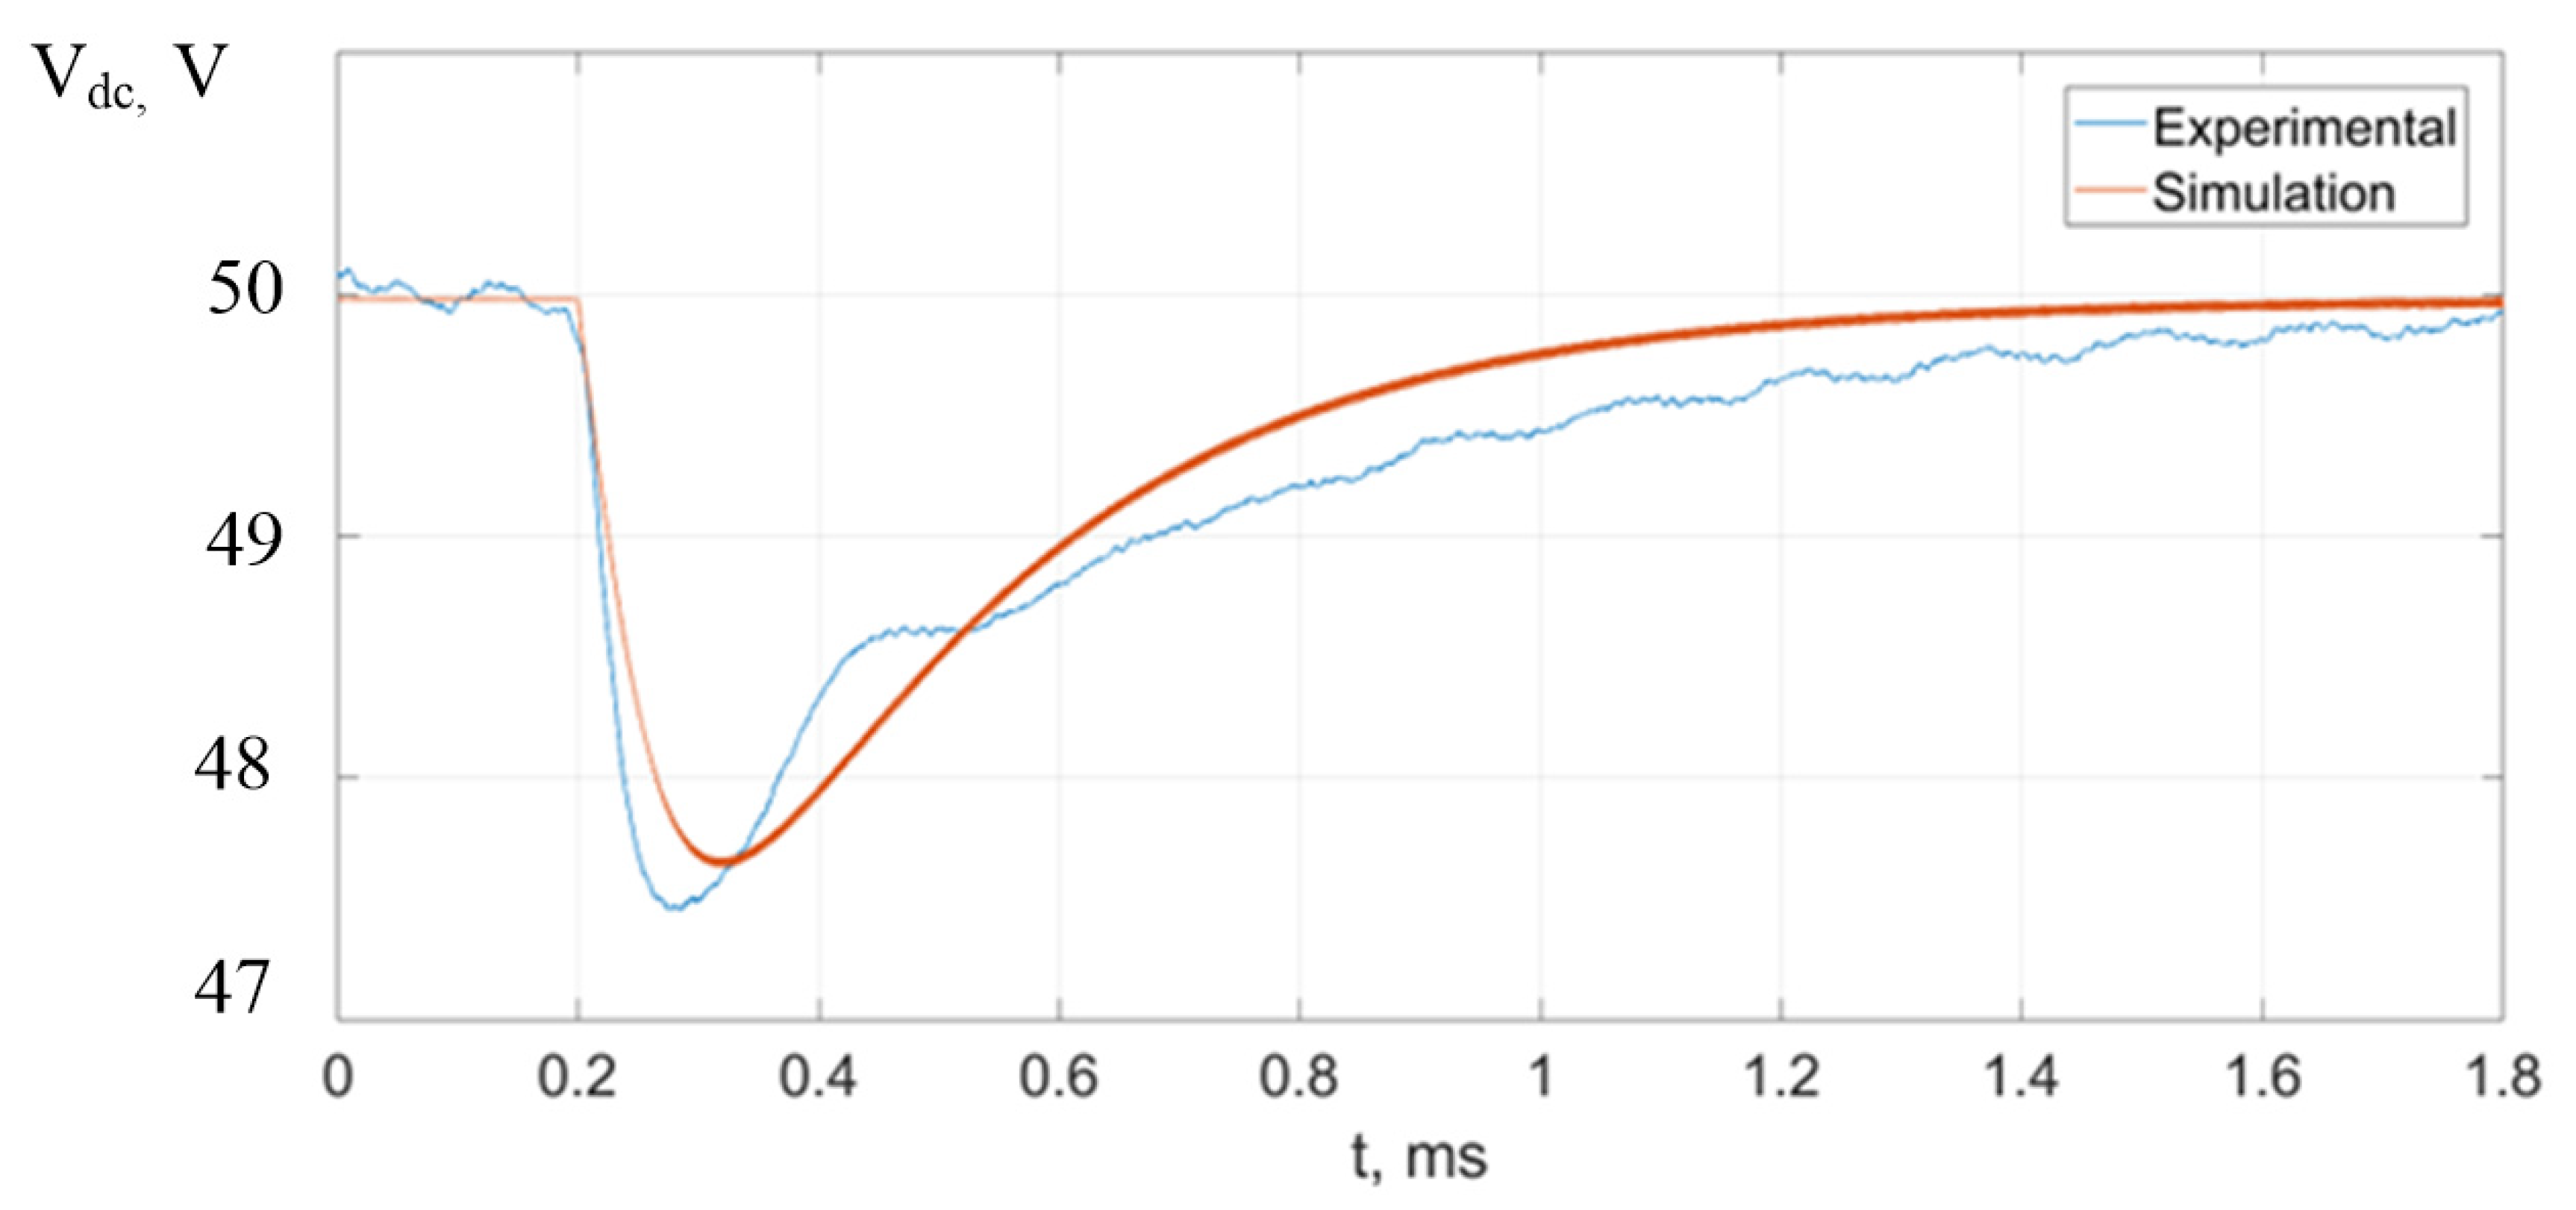
With the developed controllers, experimental results were obtained. Since the proposed method in the paper is easy to implement and the process is slow, there were no significant problems implementing variable droop coefficients, and similar results to the simulations were obtained. The experimental results are devoted to the voltage transient process. A more advanced simulation model with added extra parasitic components was also created in MATLAB Simulink to simulate the transient process. At first, the step response was investigated in the case of a high SoC of the SC, meaning that the droop coefficient
was low and reference voltage was almost equal to 50 V. The results of the sudden reduction in PV generated power is shown in
Figure 26. The transient time was approximately 1.4 ms, and voltage undershoot was around 2.5 V.
Figure 25.
Experimental prototype of the DC-DC converter.
Figure 25.
Experimental prototype of the DC-DC converter.
Figure 26.
Measured step response when the PV generated power is decreased rapidly and the SC has a high SoC.
Figure 26.
Measured step response when the PV generated power is decreased rapidly and the SC has a high SoC.
When the SoC of the SC is low, then it is more complicated to maintain the same voltage undershoot during the transient process. If the droop coefficient of the converter is selected high, then, when approaching the lower voltage value, the limiter starts to act, as shown in
Figure 23 and
Figure 24. Another approach is to select the droop coefficient based on the methodology described in
Section 5. Experimental results are shown in
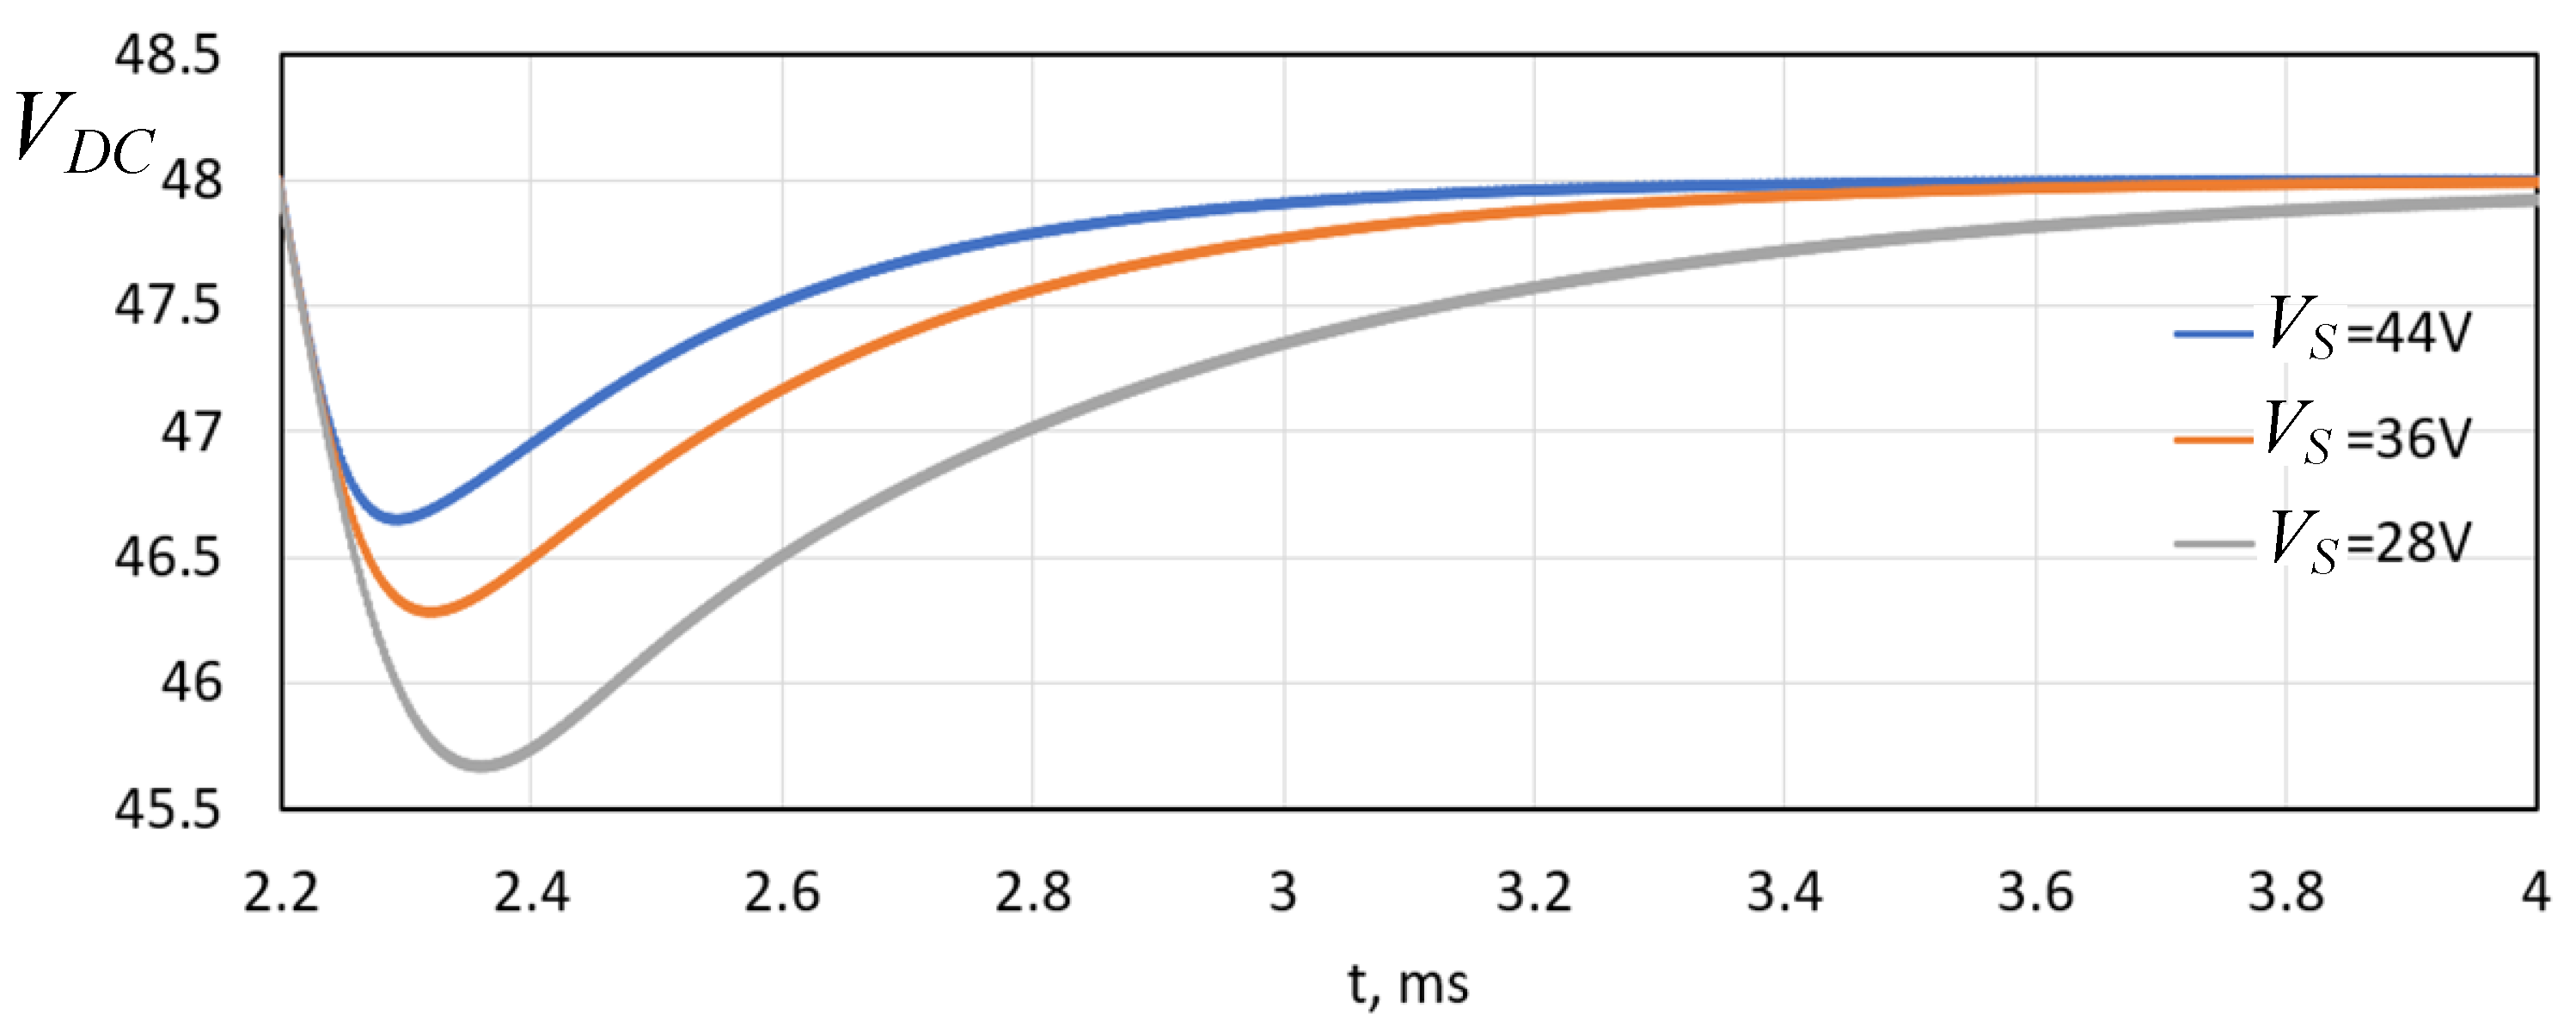
Figure 27 with a
equal to 28 V. In this case, the undershoot voltage achieved 45.7 V, and the response time was more than 2 ms. The increased undershoot was not only due to the reduced voltage reference value, but also due to the supercapacitor voltage influence on the converter transfer function [
39]; the performance can be improved by applying SC voltage dependent adaptive controllers [
40]. The same voltage reference level was set for situations when the SoC of the SC was higher (36 V and 44 V). As shown in
Figure 27, although the reference level was the same, the transient process was much faster.
By analyzing the previously presented results, it can be concluded that the proposed control system does not increase the undershoot and response time compared with other more advanced droop based control systems such as those presented in [
41,
42]. The undershoot is determined by the current and voltage controllers, and as in this case, when a low voltage GaN transistor based converter was used with a 400 kHz switching frequency, the response time was even faster than in the case of a more advanced voltage controller [
40]. The minimum voltage reference level can be adjusted by selecting the corresponding droop coefficient or by using the limiter.
In this article, the proposed method allows for an increase in the energy efficiency of SC energy storage. In the literature, there are not many research papers trying to increase the energy efficiency of the SC itself during the charging and discharging process, as usually the SC is charged first by applying control methods based on the high-pass filter technique [
15] or just to compensate for the voltage drop as fast as possible such as in [
20]. Compared with such approaches, the efficiency improvement is around 50 percent. In the literature, several advanced methods have been proposed for potential efficiency improvement. For example, in [
14], it is claimed that the proposed solution, based on a more advanced droop controller, allowed for an increase in power quality, which is not that important in the case of a small microgrid. Comparing the method proposed in this paper with [
14], its implementation requires much less computational power and does not reduce a step response of the converter. In [
25], they proposed a method to consider the SoC of the battery by changing the droop coefficient to prevent discharge or overcharge, but the energy efficiency improvement was not analyzed by distributing power between storages. The idea presented in [
25] can be added to the proposed method, achieving even higher efficiency improvements. The method proposed in [
29] only reduces the voltage drop and does not consider efficiency improvements. Compared with the control system presented in [
34], the efficiency of the supercapacitor was around one third higher, but the overall performance was better in [
34]; however, the proposed algorithm can be extended with fuzzy logic for improvements in system efficiency, achieving a similar or better performance. In future studies, it would be possible to combine the proposed method with an advanced control method to increase the overall efficiency of the system and to implement an algorithm to prevent discharge of the battery. The given mathematical expressions can be useful to other researchers to extend the application of the method in different applications and propose further improvements.
7. Conclusions
The adaptive droop control strategy proposed in this work effectively regulates power distribution between the battery and the SC in a hybrid energy storage system while allowing for controlled deviations of the DC grid voltage. Compared with the scenario without droop control, in which only the SC initially discharges but the battery engages afterward, the simulations showed that adaptive droop control reduced the internal losses by up to 50%, improving the operational efficiency and potentially extending the service lifetime of the storage system. However, the extent of loss reduction depends on the internal resistance and states of charge and specific types of storage elements, so different combinations of batteries and SCs may lead to varying results. Within the proposed strategy, the battery droop coefficient is kept constant: a lower value reduces the DC grid voltage deviations but prolongs the response time required for power distribution stabilization, whereas a higher value accelerates the response time at the cost of larger voltage deviations. The SC droop coefficient, on the other hand, is dynamically adjusted in a stepwise manner according to its state of charge, ensuring the desired power-sharing proportion during both charging and discharging processes. To limit DC grid voltage fluctuations, it is advisable to keep the battery droop coefficient as low as possible. A method was also developed to calculate the expected DC voltage using the SC and battery droop coefficients, providing a practical way to predict and limit voltage deviations. For the studied 50 V DC grid, the optimal range for the constant droop coefficient was 0.5 and 1, achieving power flow equalization under 1 s with minimal voltage deviations. Experimentally-based transient response analysis showed no influence on the proposed method. The voltage stabilization process occupied less than 4 ms, even at low SoC of the SC. This approach provides flexibility and reliability in managing hybrid energy storage, particularly in PV-fed DC microgrids operating under variable irradiance conditions. The proper selection of droop coefficients enables efficient HESS operation with reduced internal losses, minimal DC voltage deviations, and improved long-term system performance.


