Article

Identification Method for Wideband Oscillation Parameters Caused by Grid-Forming Renewable Energy Sources Based on Multiple Matching Synchrosqueezing Transformation

1
State Grid Hubei Electric Power Research Institute, Wuhan 430077, China
2
Hubei Engineering Research Center of the Construction and Operation Control Technology of New Power Systems, Wuhan 430077, China
3
Hubei Key Laboratory of Regional New Power Systems and Rural Energy System Configuration, Wuhan 430077, China
4
School of Computer Science, South-Central Minzu University, Wuhan 430074, China
5
School of Electronic & Electrical Engineering, Wuhan Textile University, Wuhan 430200, China
*
Author to whom correspondence should be addressed.
Energies 2025, 18(19), 5123; https://doi.org/10.3390/en18195123
Submission received: 1 September 2025 / Revised: 15 September 2025 / Accepted: 19 September 2025 / Published: 26 September 2025
(This article belongs to the Special Issue Grid-Forming Converters in Power Systems)

Abstract

The oscillation problem has emerged as one of the critical challenges confronting emerging power systems, particularly with the increasing penetration of grid-forming renewable energy sources. This trend can lead to the coexistence of multiple oscillation modes across a wide frequency range. To enhance the safety and stability of power systems, this paper proposes a wideband oscillation parameter identification method based on the multiple matching synchrosqueezing transform (MMSST), addressing the limitations of traditional time–frequency analysis techniques in accurately separating and extracting oscillation components during wideband parameter identification. The method first applies MMSST to decompose the measured oscillation signal into a set of intrinsic mode functions (IMFs). Subsequently, the Hilbert transform is applied to each IMF to extract the instantaneous frequency, amplitude, and initial phase, thereby achieving precise parameter identification of the oscillation signal. The validation study results demonstrate that the MMSST algorithm outperforms the empirical mode decomposition (EMD) and variational mode decomposition (VMD) algorithms in accurately extracting individual oscillation components and estimating their dynamic characteristics. Additionally, the proposed method achieves superior performance in terms of both accuracy and robustness when compared to the EMD and VMD algorithms.

1. Introduction

With the increasing proportion of renewable energy generation in emerging power systems, the coexistence of centralized and distributed grid integration methods has significantly increased the complexity of grid structures and operational dynamics [1]. Currently, grid-forming converters are widely adopted due to their flexible frequency and voltage regulation capabilities, as well as their provision of essential grid support services such as inertia and damping, inter alia. However, as grid-forming converter-based renewable energy systems become more prevalent, these converters lack synchronous inertia, and due to the presence of phase-locked loops (PLL), they are susceptible to negative damping effects, making them a primary source of wideband oscillations [2]. At the same time, grid oscillations may also manifest as combinations of multiple oscillation modes. Consequently, wideband oscillation has emerged as a critical security concern in power systems, with impacts spanning multiple dimensions, including equipment safety, grid stability, power quality, monitoring and control, and renewable energy utilization. Therefore, analyzing and identifying the parameters of wideband oscillations is essential for enhancing the safety and stability of emerging power systems [3]. Given the serious threat posed by wideband oscillation events to grid security, effective suppression requires rapid and accurate identification of oscillation parameters to enable early warning and mitigation strategies [4], while providing support for better suppression of oscillations in grid-forming converters [5].
There are various methods for parameter identification in power grid oscillations. The discrete Fourier transform (DFT)-based approach is widely adopted for identifying oscillation parameters due to its computational efficiency and ease of hardware implementation [6,7,8]. However, the DFT is prone to spectral leakage and the fence effect, both of which can degrade the accuracy of parameter detection. To address these limitations, interpolation DFT (IpDFT), windowing techniques, and iterative algorithms have been proposed to enhance the performance of the traditional DFT. In Ref. [9], an IpDFT method was introduced to mitigate spectral leakage and the fence effect, enabling precise estimation of sub-synchronous oscillation parameters within a limited observation window. In Refs. [10,11], an advanced optimization windowing method was developed to suppress spectral leakage, although it requires an observation window longer than 2 s to achieve high-frequency resolution. Despite these improvements through interpolation and windowing, spectral leakage and the fence effect remain challenging and cannot be completely eliminated.
Model-based methods such as the Prony method [12], the recursive least-squares (RLS) method [13], and the estimation of signal parameters via rotational invariance technique (ESPRIT) [14] are also employed for parameter identification. These methods generally perform well when the model order is accurately determined in advance. However, accurately determining the model order beforehand presents significant challenges. Mode decomposition techniques can break down time-domain signals into multiple mode components, showing great potential for wideband oscillation identification across the entire frequency range. Laila et al. [15] proposed combining empirical mode decomposition (EMD) with the Hilbert transform to accurately characterize time-varying, multi-component inter-area oscillations. Compared to other methods for analyzing complex non-stationary oscillations, this approach offers superior time and frequency resolution. Arrieta et al. [16] introduced variational mode decomposition (VMD) for identifying oscillation modes in power systems. VMD performs signal decomposition by separating oscillation signals into mono-component modes and, through the Hilbert transform, provides instantaneous modal characteristics, such as amplitude, frequency, damping, and energy. However, improper prior parameters and noise can interfere with the frequency band decomposition, potentially leading to modal mixing. Filter-based approaches can also serve as mode decomposition techniques for oscillation signal analysis. Du et al. [17] proposed an equal-frequency-band multi-channel low-pass filter bank to decompose sub-synchronous oscillation signals within a specific frequency range. Chen et al. [18] designed a multi-tone FIR filter bank with fixed center frequencies to decompose high-frequency oscillation (HFO) signals. However, key parameters such as the number of channels, channel spacing, and center frequency must be predetermined. Improper settings can result in inaccurate mode decomposition. Although model-based methods offer a more intuitive physical interpretation, they are associated with high computational complexity and face challenges in online rapid monitoring and real-time warning for sub-/super-synchronous oscillations (SSOs).
In the field of power systems, monitoring and parameter identification of wideband oscillations (0.1–300 Hz) are crucial for maintaining system stability. Although traditional time–frequency analysis methods such as the short-time Fourier transform (STFT) and wavelet transform are capable of characterizing local features of non-stationary signals and offer adaptive resolution, their performance is constrained by the uncertainty principle, which limits their ability to achieve optimal time and frequency resolution simultaneously. The Hilbert–Huang transform (HHT), which is based on empirical mode decomposition (EMD), also has limitations, such as endpoint effects and mode mixing, resulting in inaccurate identification of disturbance signals. To improve the frequency resolution of time–frequency analysis, the synchrosqueezing transform (SST) was introduced as a signal reconstruction technique [19]. The core concept of SST is to reallocate the signal’s time–frequency energy along the frequency axis. Thakur et al. [20] proposed an SST method based on STFT, which rearranges STFT coefficients using an instantaneous frequency estimation operator. However, this approach is only effective for weakly modulated non-stationary signals and performs poorly when analyzing strongly modulated signals [21]. While SST enhances the energy concentration of linear time–frequency analysis methods to some extent, it remains inadequate for highly time-varying signals due to the inherent limitations of linear methods, which rely on the inner product between the signal and fixed basis functions to capture local time-varying features. To address the limitations of traditional time–frequency transformation methods in accurately separating and extracting oscillation signals and to enhance SST’s capability in handling strong non-stationary signals, this paper proposes an oscillation signal analysis method based on the multiple matching synchrosqueezing transform (MMSST) algorithm [22]. Using MMSST, we first obtain the time–frequency representation of wideband oscillation signals in power systems. Subsequently, a set of intrinsic mode functions (IMFs) is extracted based on the time–frequency analysis results. Finally, the Hilbert transform is applied to each IMF to obtain its instantaneous frequency and amplitude, enabling accurate identification of wideband oscillation signal parameters. Simulation and experimental results demonstrate that the proposed parameter identification method can effectively detect various types of oscillation signals with high accuracy. The contributions of this paper are summarized as follows:
(1)
An analysis of the mechanism by which the MMSST algorithm enhances the performance of traditional SST algorithms in processing oscillatory signals.
(2)
Extraction of multi-modal components of oscillatory signals to demonstrate the improved accuracy of parameter identification when combined with the Hilbert transform.
(3)
Improvement in the accuracy of wideband oscillation signal parameter estimation in grid-forming converter-based renewable energy systems, thereby supporting more effective suppression of oscillations in grid-forming converters.
The structure of this paper is as follows. Section 2 presents the methodology based on the SST and MMSST algorithms. Section 3 introduces the parameter identification of wideband oscillation signals using the MMSST algorithm. Section 4 verifies the performance of the proposed method using synthetic, simulated, and measured data. The conclusions are drawn in Section 5.

2. Methods

2.1. SST

SST is a reversible algorithm that rearranges rearranging time–frequency coefficients to improve the frequency resolution of signals through post-processing based on linear time–frequency transformation. The SST algorithm discussed in this paper is based on STFT.
The STFT of a signal is expressed as
G t , ω = + x u g u t e j ω u t d u
where x L 2 ( R ) is the analyzed signal and g L 2 ( R ) is a real-valued, even function window. t and u are the time variables, and ω is the frequency variable.
Due to the bandwidth of the window function, the STFT coefficients of a signal are spread around the true signal frequency. The core of the SST algorithm is to rearrange the scattered time–frequency coefficients to the correct positions in the time–frequency matrix. Therefore, SST defines an instantaneous frequency estimation operator, ω ˜ t , ω , as follows:
ω ˜ t , ω = t G t , ω j G t , ω G t , ω 0
where t represents the derivative with respect to t .
SST maps the time–frequency coefficients from t , ω to t , ω ˜ t , ω based on the instantaneous frequency estimation operator, ω ˜ t , ω , and its formula is given as follows:
T t , ξ = G t , ω δ ξ ω ˜ t , ω d ω
where δ ξ ω ˜ t , ω d ω denotes the synchrosqueezing operator and ξ is the frequency variable.
Since the time–frequency coefficients are only rearranged in the frequency direction, SST reconstructs the signal by summing the synchrosqueezing coefficients in the frequency domain as follows:
x ( t ) = 1 2 π g ( 0 ) ξ φ ( t ) d s T t , ξ d ξ
where d s represents the bandwidth of the reconstructed signal, φ t denotes the instantaneous phase, and φ t is the first-order derivative of φ t .
When SST processes multi-component signals, it requires that the frequency bands of each signal component do not overlap, that is
φ k t φ k 1 t > 2 Δ ω
where k 2 , , K and K is the number of modal components in the analyzed signal.
By rearranging the time–frequency coefficients, SST can significantly enhance the energy concentration of the signal’s time–frequency distribution compared to traditional linear time–frequency transformations. For pure fundamental signal components, the instantaneous frequency estimation operator provided by SST is nearly unbiased, resulting in an almost ideal time–frequency representation. Leveraging the high time–frequency resolution and reconfigurability of SST, it can be applied to the analysis of wideband oscillation signals in power systems, enabling the separation of various oscillation components and facilitating accurate parameter identification. However, SST has notable limitations, and it is only effective for analyzing weakly frequency-modulated signals. For oscillation signals that resemble harmonic signals, SST can distinguish them effectively. In contrast, for strongly frequency-modulated oscillation signals such as interharmonic signals, the instantaneous frequency estimation obtained via SST can deviate significantly from the true signal frequency. This results in blurred time–frequency coefficients that cannot be accurately reallocated, thereby failing to improve time–frequency resolution. To overcome these limitations, this paper proposes the MMSST algorithm for oscillatory signal analysis.

2.2. MMSST

The MMSST algorithm is a post-processing method based on STFT which enhances the instantaneous frequency estimation operator used in SST by introducing the matching instantaneous frequency (MIF) estimation operator. At the same time, multiple synchrosqueezing operations are incorporated to improve the accuracy of MIF estimation, thereby enhancing the time–frequency resolution and addressing the limitations of SST in analyzing strongly frequency-modulated oscillation signals.
In MMSST, the group delay estimation operator, t ˜ t , ω , and the chirp rate estimation operator, c ˜ t , ω , are introduced, which are defined as follows:
t ˜ t , ω = t + j ω G t , ω G t , ω
c ˜ t , ω = t ω ˜ t , ω t t ˜ t , ω
where ω represents the derivative with respect to ω .
Combined with the instantaneous frequency estimation operator, ω ˜ t , ω , in Equation (2), a more precise operator, ω ˜ m t , ω , called the MIF estimation operator is defined in MSST as follows:
ω ˜ m t , ω = ω ˜ t , ω + c ˜ t , ω t t ˜ t , ω
Firstly, MMSST replaces the instantaneous frequency estimation operator, ω ˜ t , ω , in SST with an MIF estimation operator, ω ˜ m t , ω , mapping the time–frequency coefficients from t , ω to t , ω ˜ m t , ω . The formula is given as follows:
T m t , ξ = G t , ω δ ξ ω ˜ m t , ω d ω
Then, since the MIF estimation operator is constructed based on linear frequency-modulated signals, it remains biased when applied to strongly frequency-modulated signals. Therefore, multiple synchrosqueezing operations are introduced to iteratively synchrosqueeze the time–frequency coefficients, generating a new time–frequency representation with high-frequency resolution. The formula is given as follows:
T m     [ 2 ] t , η = T m     [ 1 ] t , ω δ η ω ˜ m t , ω d ω T m     [ 3 ] t , η = T m     [ 2 ] t , ω δ η ω ˜ m t , ω d ω                                                                           T m     [ N ] t , η = T m     [ N 1 ] t , ω δ η ω ˜ m t , ω d ω
where T m     [ 1 ] t , ω denotes the MSST result T m t , ξ in Equation (9) and N ( N 2 ) represents the number of iterations in multiple synchrosqueezing operations.
According to Equation (10), the MMSST algorithm performs coefficient rearrangement on the time–frequency representation that has already undergone coefficient rearrangement. However, in practice, MMSST only iterates the MIF estimation operator to obtain a more accurate instantaneous frequency estimation operator. Consider the situation of N = 2 as
T m     [ 2 ] t , η = T m     [ 1 ] t , ω δ η ω ˜ m t , ω d ω                                 = T m t , ξ δ η ω ˜ m t , ξ d ξ                                 = G t , ω δ ξ ω ˜ m t , ω d ω δ η ω ˜ m t , ξ d ξ                                 = G t , ω δ η ω ˜ m t , ω ˜ m t , ω d ω
From Equation (11), it can be seen that when performing a double synchrosqueezing operation, a new instantaneous frequency estimation operator, ω ˜ m     [ 2 ] t , ω = ω ˜ m t , ω ˜ m     [ 1 ] t , ω , is obtained, and ω ˜ m     [ 1 ] t , ω represents the MIF estimation operator, ω ˜ m t , ω . When performing N -fold synchronous synchrosqueezing transformation, the corresponding instantaneous frequency estimation operator becomes ω ˜ m     [ N ] t , ω = ω ˜ m t , ω ˜ m     [ N 1 ] t , ω . Ref. [20] verifies the feasibility of the multiple synchrosqueezing operation. Compared to SST, MMSST significantly improves the accuracy of instantaneous frequency estimation operators and reduces estimation errors. Since MMSST only rearranges the time–frequency coefficients of STFT in the frequency direction and no information is missing, the analyzed signal can be accurately reconstructed by summing the synchrosqueezing coefficients in the frequency domain as follows:
x t = 1 2 π g ( 0 ) ξ φ ( t ) d s T m     [ N ] t , ξ d ξ
Based on the analysis results of MMSST, the oscillation signal can be accurately separated from the time–frequency representation obtained by MMSST through appropriate frequency band division and signal reconstruction through Equation (12). By performing parameter identification on individual frequency components, the various oscillatory components contained within the wideband oscillation signal in a power system can be effectively isolated, enabling accurate parameter identification of the wideband oscillation.

3. Identification Method for Wideband Oscillation Parameters

3.1. Mechanism of Wideband Oscillation Generation

In Figure 1, the voltage source converter-based high-voltage direct current (VSC-HVDC) transmission system is illustrated, with a direct-drive wind farm (DDWF) connected to the power grid through a grid-forming converter [23]. The mechanism of wideband oscillation in VSC-HVDC systems integrated with DDWF involves multi-link dynamic coupling and nonlinear interactions.
When the grid-connected DDWF adopts matching control (e.g., virtual synchronous machine technology), it may exhibit negative damping characteristics under a strong power grid, leading to the risk of sub-synchronous oscillation. The underlying mechanism is analogous to the dynamic behavior described by the rotor motion equation of a synchronous machine. When the system lacks sufficient inertia support, phase mismatch between the power loop and the grid frequency can trigger weakly damped oscillations. In a weak power grid, the PLL dynamic response of the grid-forming controller may induce frequency coupling, where SSO components modulate each other and give rise to wideband oscillations. This asymmetric control structure causes an imbalance between positive and negative sequence impedances in the dq coordinate system, further exacerbating the oscillation risk.
When the DDWF is connected to the power grid through VSC-HVDC, the system exhibits low-frequency (<10 Hz), sub-/super-synchronous-frequency (10–100 Hz), and high-frequency (>100 Hz) multi-band oscillation modes. These oscillation modes are coupled through the DC link: (1) Sub-synchronous oscillation: The current loop interaction between the grid-side converter of the DDWF and the VSC-HVDC output controller triggers resonance at a frequency of 20–40 Hz. (2) High-frequency oscillation: Due to the influence of DC line parameters such as length and capacitance, the switching frequency harmonics of the VSC-HVDC are amplified by the grid-forming controller, resulting in high-frequency instability.

3.2. Parameter Calculation

The oscillation signal is composed of a fundamental wave signal of 50 Hz and various oscillation components, which can be expressed as
x ( t ) = x 0 cos ( 2 π f 0 t + ϕ 0 ) + x sub cos ( 2 π f sub t + ϕ sub ) + x sup cos ( 2 π f sup t + ϕ sup )                               + x h cos ( 2 π f h t + ϕ h )
where f , x , and ϕ represent the frequency, amplitude, and initial phase of each component, respectively. The subscripts “0”, “sub”, “sup”, and “h” represent the fundamental frequency, sub-synchronization, super-synchronization, and high-frequency oscillation components, respectively. Each IMF corresponds to a distinct oscillation component; therefore, the process of extracting and detecting each IMF is equivalent to detecting the corresponding oscillation signal.
To calculate the amplitude, the frequency and initial phase of the k -th component in the oscillation signal, it is only necessary to detect A k , f k , and ϕ k . Once the oscillation modes in time are obtained by MMSST, y k ( t ) is the Hilbert transform of the k-th mode represented by x k ( t ) , given by
y k t = 1 π + x k t t τ d τ
Given a signal y k ( t ) , its complex representation is
Z k t = y k t + j y ^ k t = A k t e i ϕ k t
The instantaneous frequency, f k ; the instantaneous amplitude, A k ; and the initial phase, ϕ k , are respectively estimated as follows:
f k t = d ϕ k t d t
A k t = y 2 k t + y ^ 2 k t
ϕ k t = arctan y ^ k t y k t
It can be observed that, by extracting various IMFs of the oscillation signal using MMSST, the instantaneous amplitude, frequency, and initial phase of each component can be obtained through the Hilbert transform.

3.3. Parameter Identification Method

The analysis process for wideband oscillation signals in power systems based on the MMSST algorithm is illustrated in Figure 2. Firstly, MMSST is employed to decompose the oscillation signal containing multiple frequency components into a set of IMFs. Subsequently, the Hilbert transform is applied to each intrinsic mode component to extract the instantaneous frequency, amplitude, and initial phase of each component. Compared with traditional linear time–frequency transforms, MMSST offers higher frequency resolution and greater energy concentration in time–frequency analysis results, enabling it to effectively handle highly non-stationary signals. Combined with its signal reconstruction capability, MMSST demonstrates strong modal separation performance, thereby enhancing the accuracy of oscillation signal parameter identification.

4. Validation Study

In this section, validation studies were conducted using synthetic data, as well as simulated and real-world system oscillation data, to demonstrate the effectiveness of the proposed method. To evaluate the performance of oscillation signal parameter identification based on the MMSST algorithm introduced in this paper, a comparison was made with the EMD [15] and VMD [16] algorithms. In the VMD algorithm, the manually preset number of modes and the penalty factor are 7 and 2000, respectively. The aforementioned three types of oscillation data were analyzed separately.

4.1. Synthetic Data Analysis

Using Equation (13) as the instantaneous oscillation signal model for generating synthetic PMU data, the simulated PMU data only included fundamental SSO components [24]. We set the fundamental frequency, f 0 , to [49 49.5 49.7 50 50.5 51 51.5] Hz. The remaining parameters of the fundamental SSO components were set as follows: ( x 0 , ϕ 0 ) = ( 100 , π / 3 ) ,   f sub ,   x sub ,   ϕ sub   =   10 ,   0.2 ,   π / 2   , and   f sup ,   x sup ,   ϕ sup   =   90 ,   0.1 ,   π / 4 .
During the verification process, the sampling frequency of the instantaneous data was set to 2 kHz. The DFT was applied to sample the instantaneous data and generate synthetic PMU data with an upload frequency of 100 Hz. In the process of determining oscillation characteristics using the MMSST algorithm, a specific data segment with a duration of 200 ms was selected, which contained 21 synchrophasor data points for analysis. To evaluate the accuracy of the results, the estimation error (EE) was calculated as the maximum relative error, defined as
E E =     max P P ^ P × 100 %
where P and P ^ are the true parameter values and estimated parameter values, respectively.
Parameter identification accuracy is most influenced by f 0 and f sub [25]. Therefore, using the method of controlling variables, we varied f sub at intervals of 1 Hz within the range of [5, 45] Hz and x sub at intervals of 0.01 within the range of [0.05, 1]. After generating PMU data under these conditions, the MMSST algorithm utilized the synthetic PMU data for oscillation signal parameter identification. To mitigate randomness to some extent, each case was recalculated 50 times, and the central tendency was adopted. Additionally, to evaluate the accuracy of the improved algorithm in determining oscillation parameters in noisy environments, zero-mean white Gaussian noise was added into the instantaneous signal model in Equation (13) for analysis, and a noise level of 40 dB was selected for the simulation experiment [26].
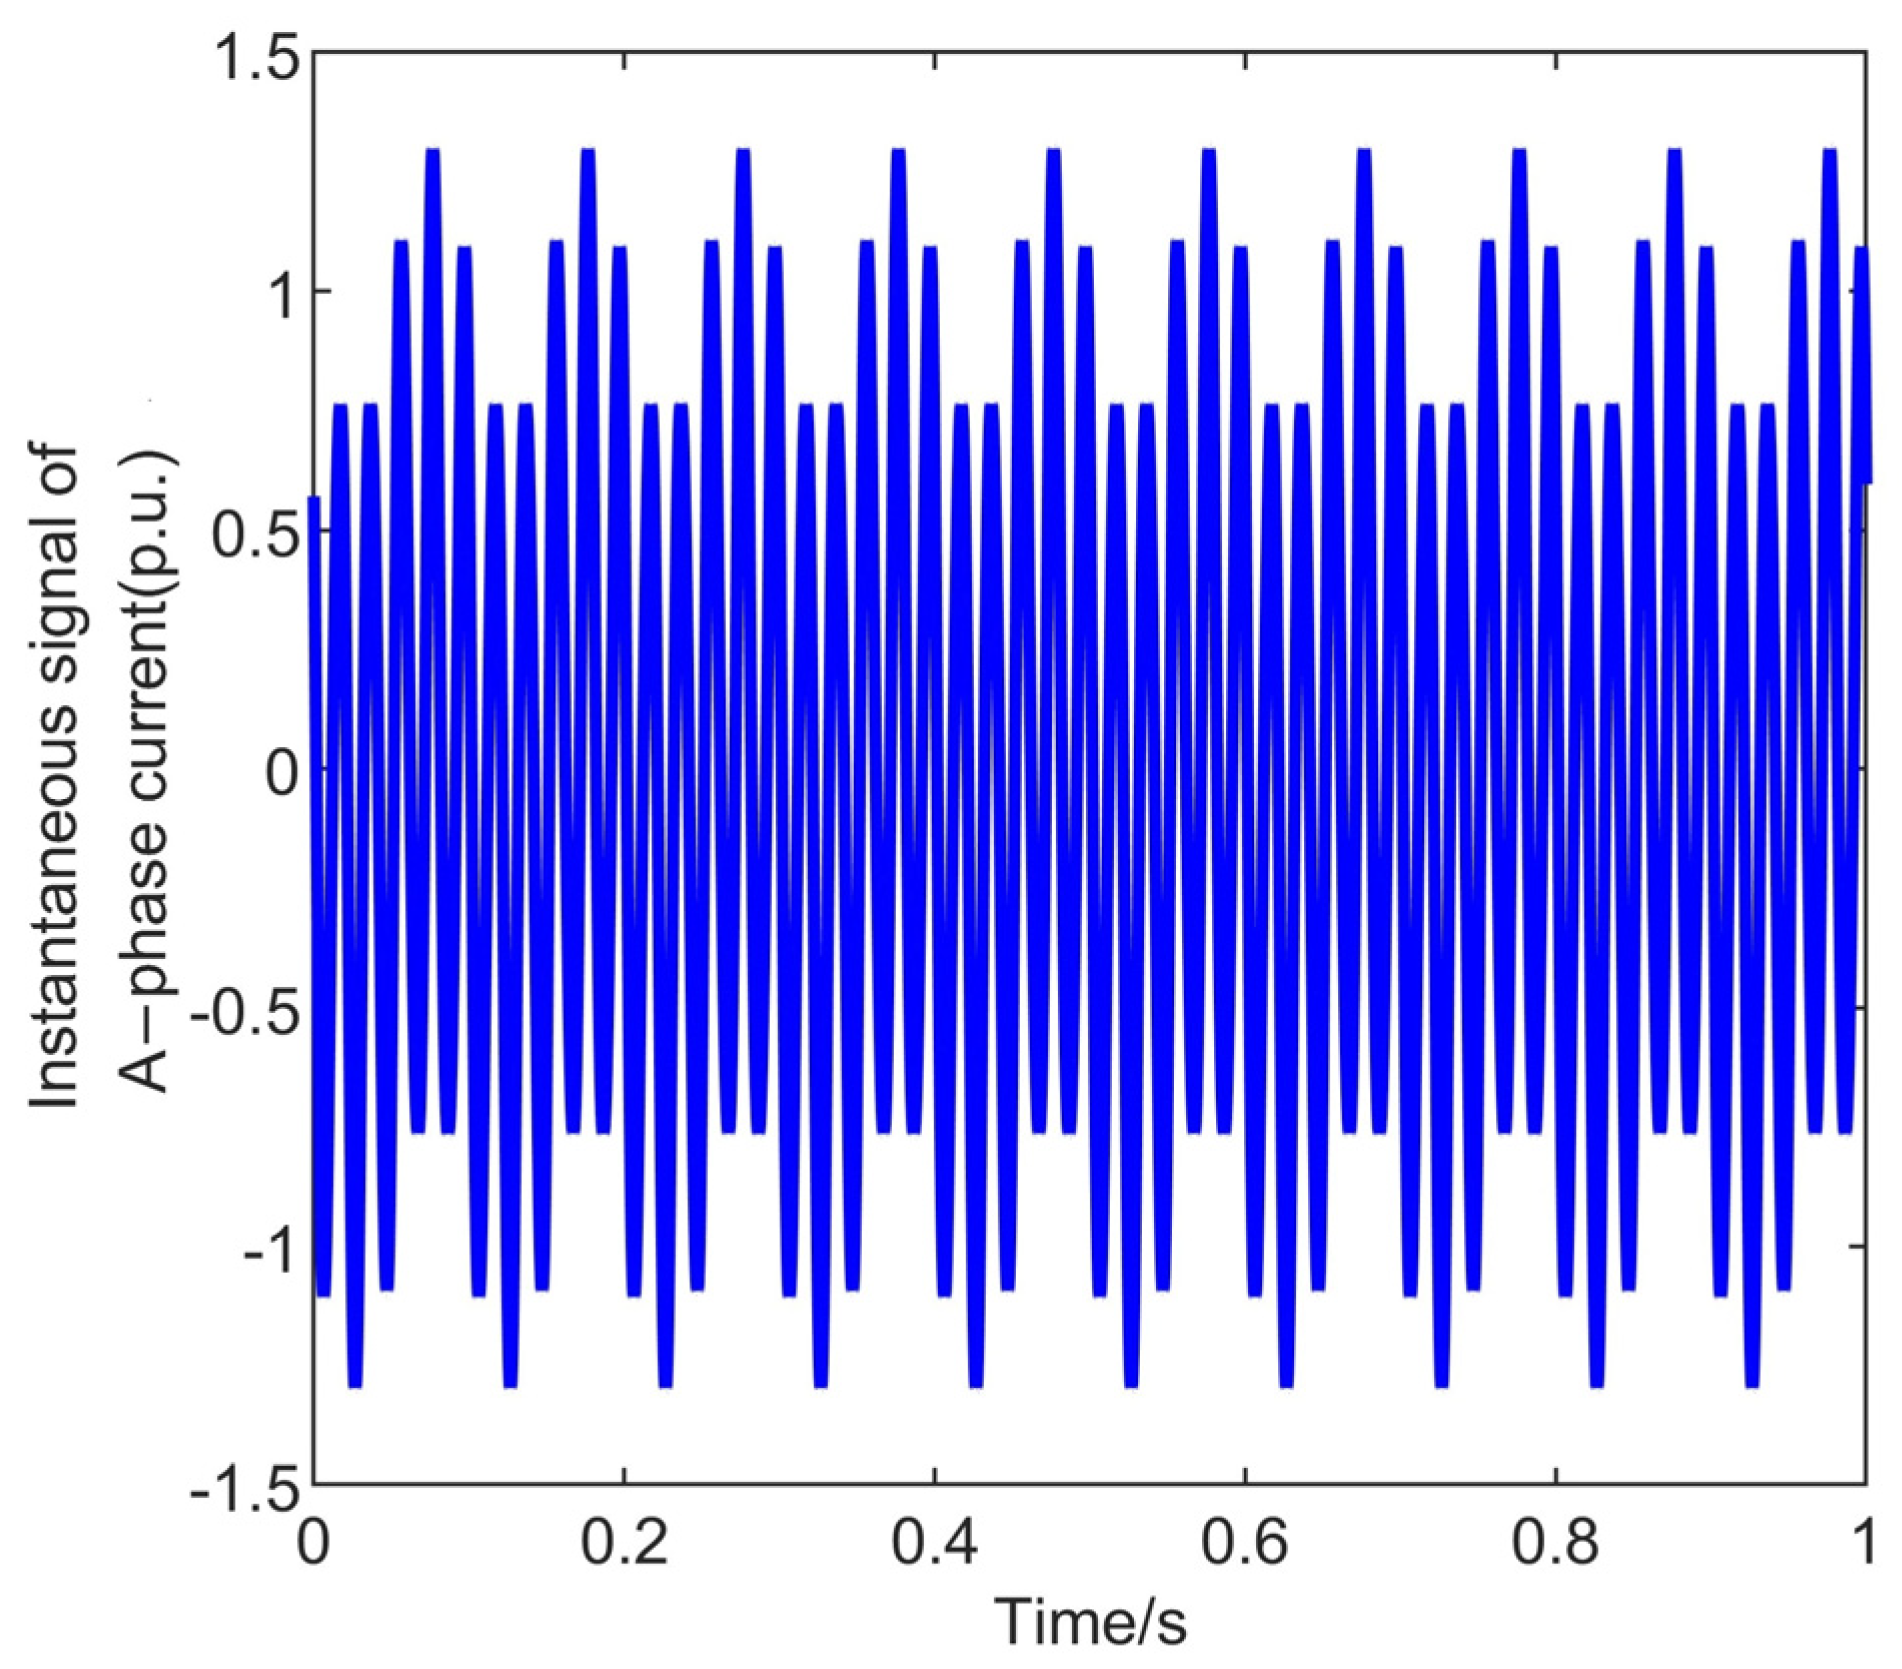
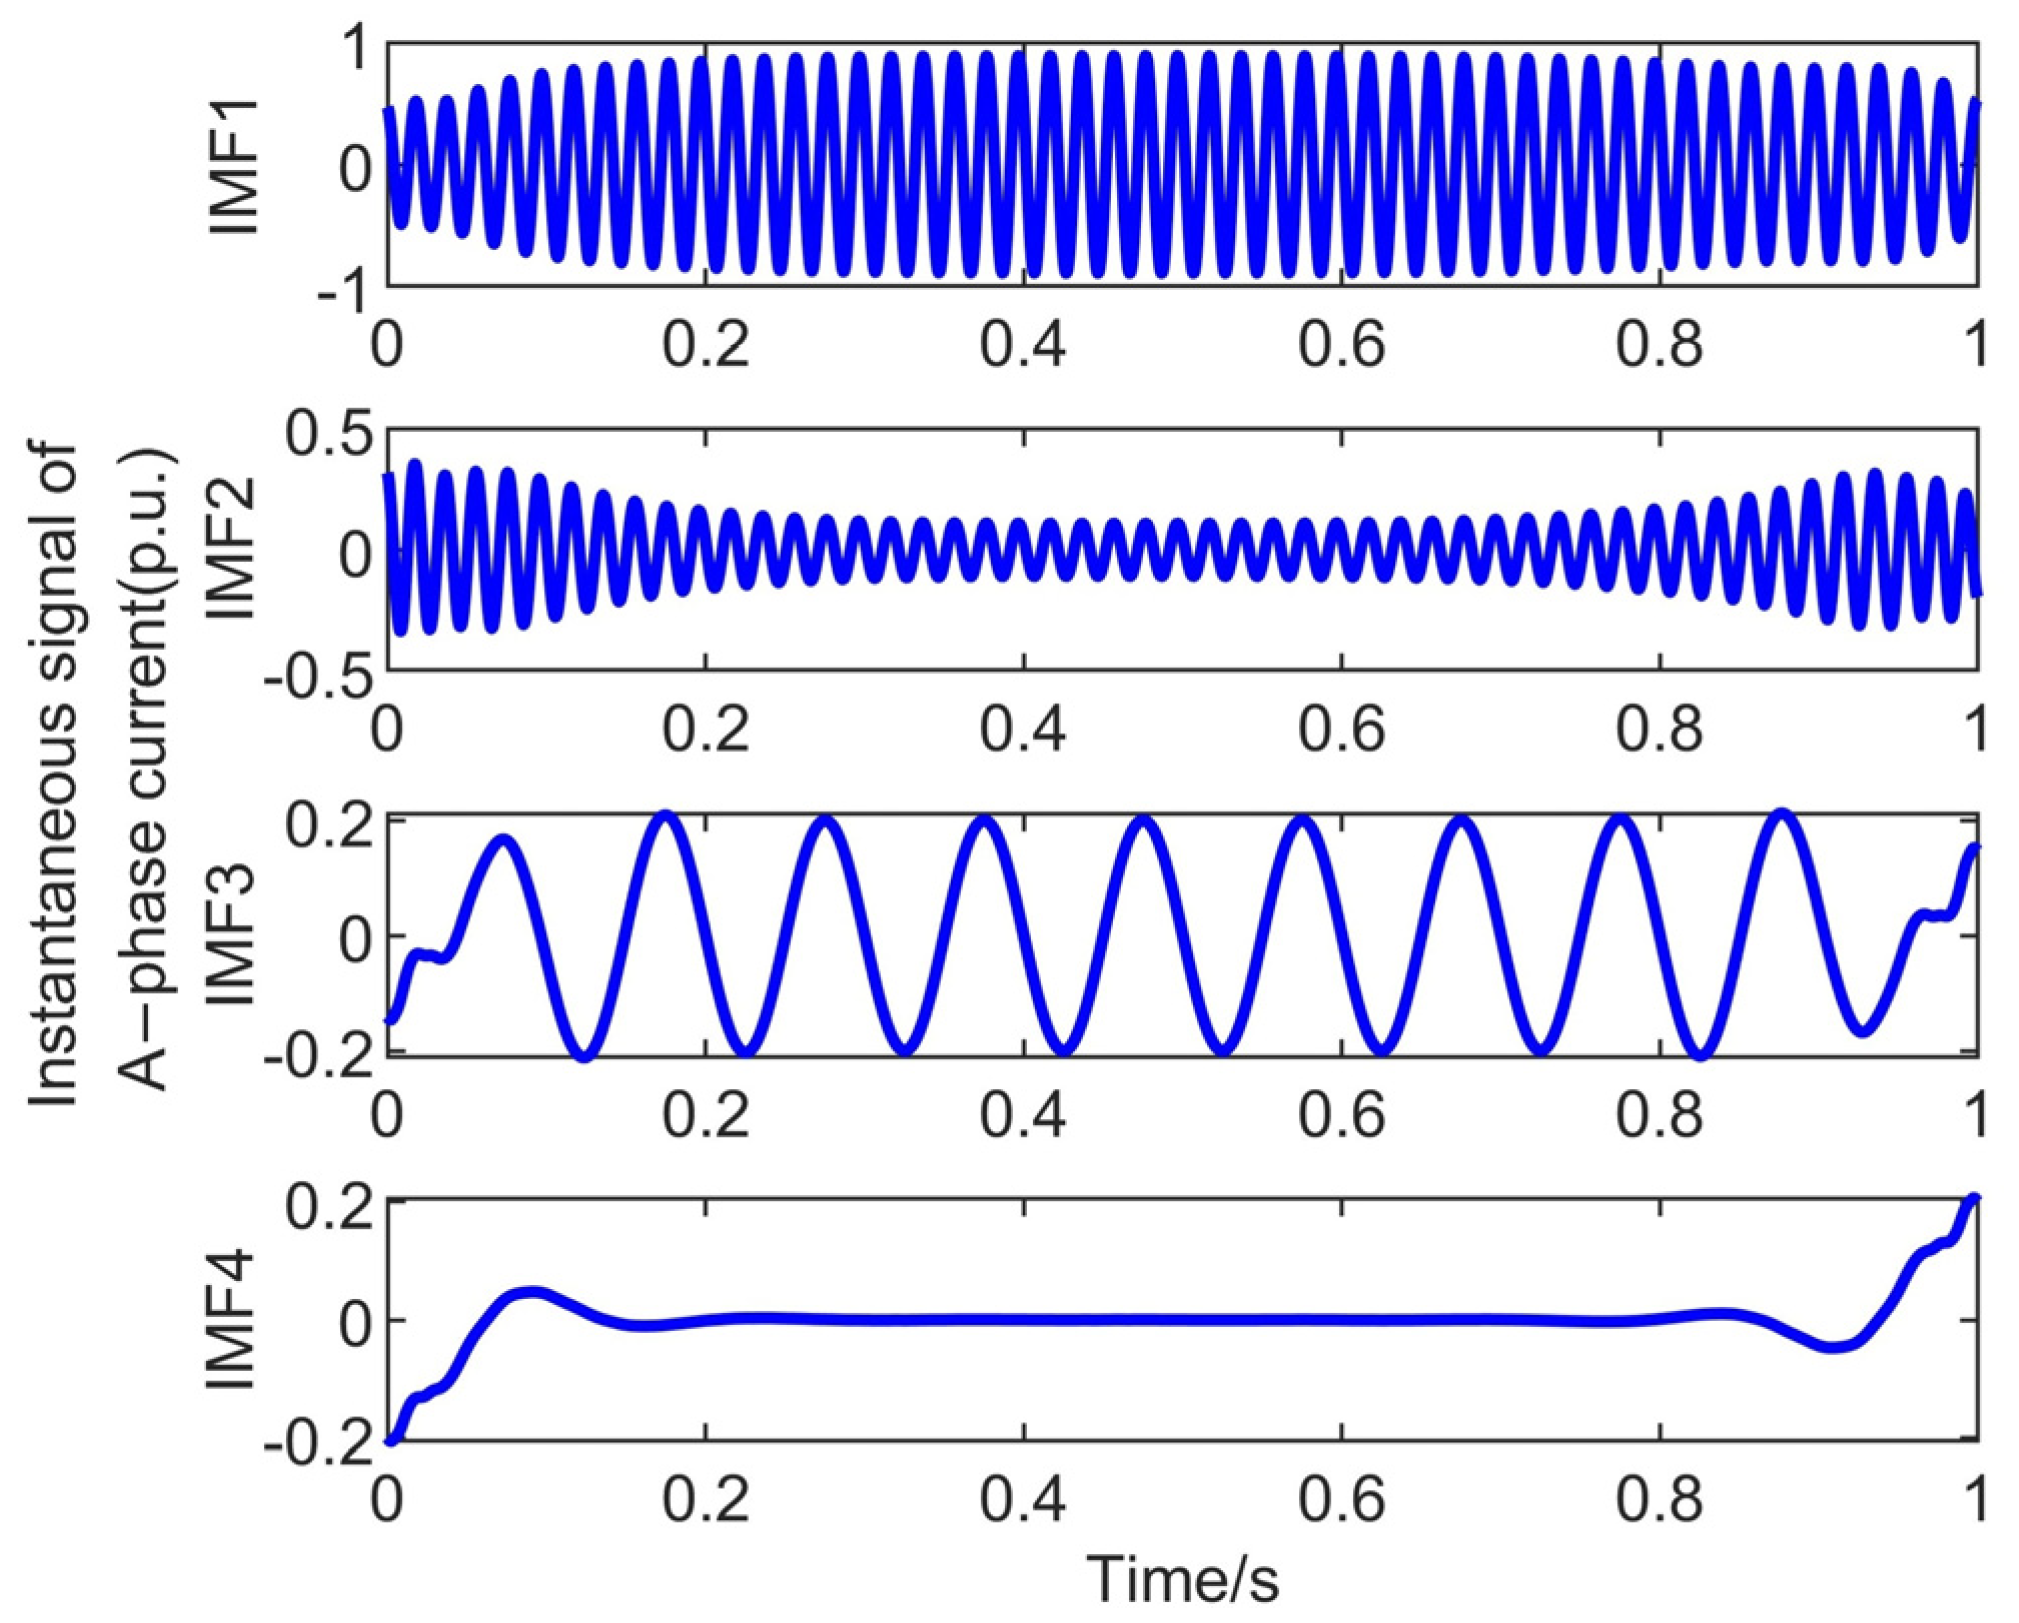
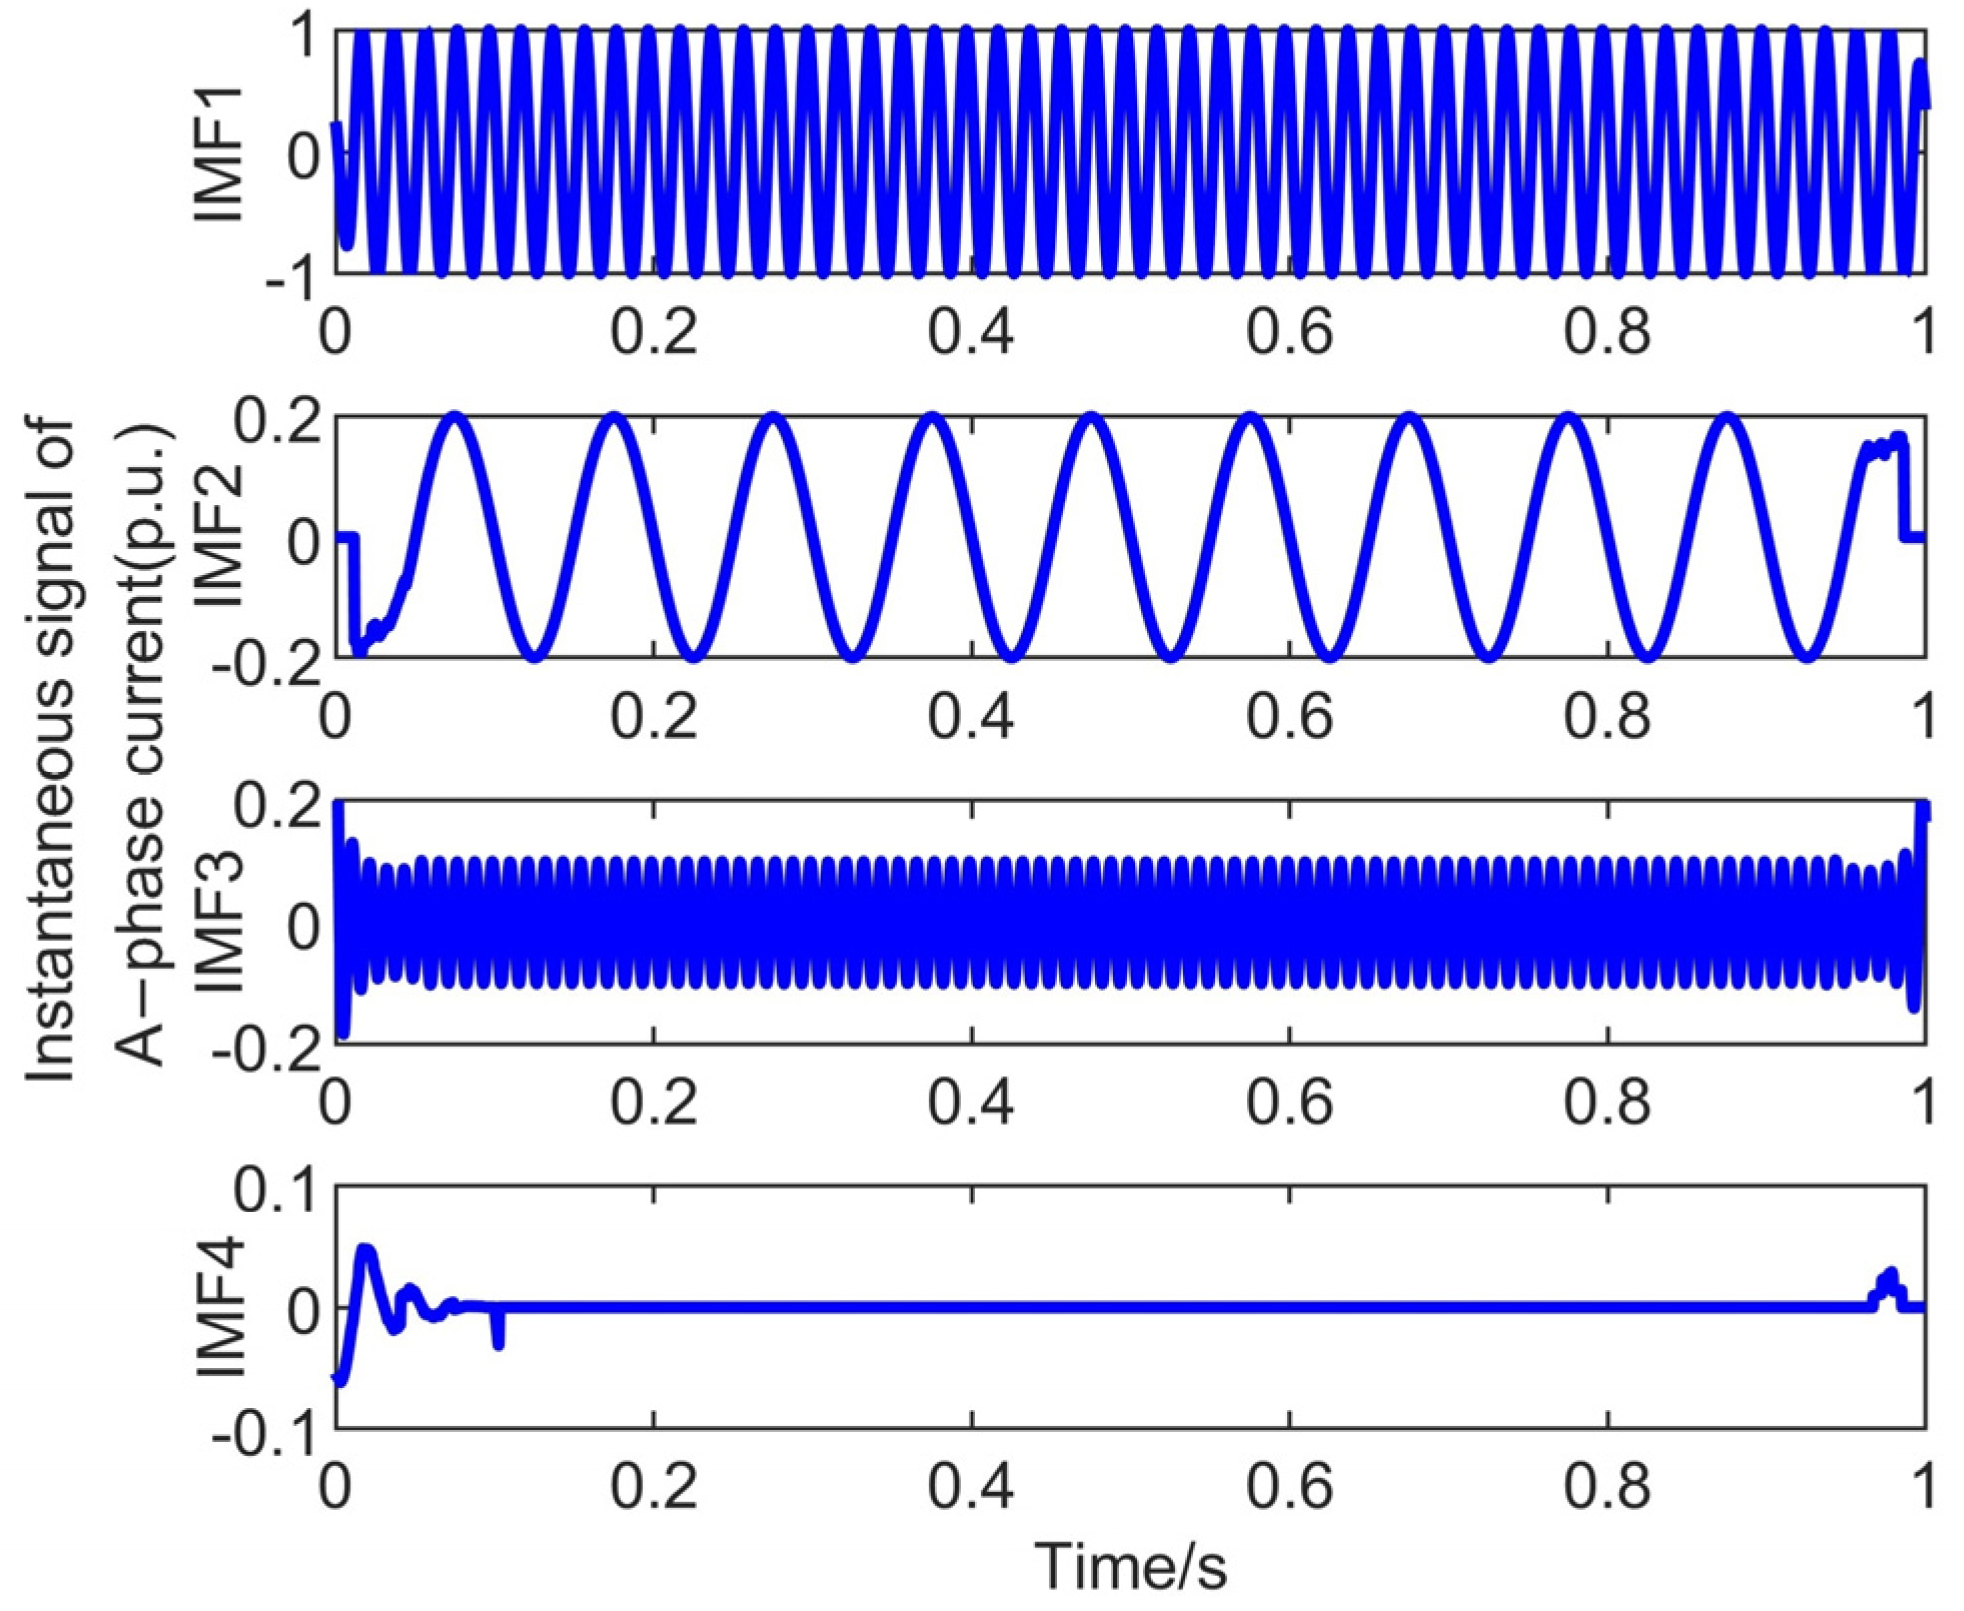
The time-domain waveform of the synthetic signal is shown in Figure 3, which exhibits a time-varying characteristic. Firstly, the EMD, VMD, and MMSST algorithms were applied to the signal separately, and the IMFs obtained via the three methods are presented in Figure 4, Figure 5, and Figure 6, respectively. From the results, it can be observed that the MMSST algorithm can effectively separate various frequency components, demonstrating high-quality decomposition performance. In contrast, the EMD algorithm fails to decompose all oscillation components effectively. Specifically, EMD successfully isolates only the 50 Hz fundamental component, while the other components remain mixed. Although the VMD algorithm is capable of achieving effective modal decomposition, the presence of boundary effects results in relatively significant errors in the waveforms of the IMFs.
The first four IMFs of the analyzed signal obtained by EMD, VMD, and MMSST are presented in Table 1. From the results obtained under ideal conditions, the relative error of the oscillation parameters derived using the MMSST algorithm ranges from 10−13% to 10−11%. Compared with the EMD and VMD algorithms, the MMSST algorithm demonstrates higher accuracy in estimating the relative error of other parameters. Under the noise condition with a signal-to-noise ratio of 40 dB, the identification errors for fundamental parameters in the existing EMD and VMD algorithms remain relatively small. However, the EMD algorithm fails to effectively separate the oscillation frequency components, leading to mode aliasing and the inability to extract the oscillation frequency component parameters. Although the VMD algorithm can effectively decompose oscillation frequency components, it suffers from boundary effects that lead to significant errors in identifying these parameters. Therefore, it can be concluded that the MMSST algorithm is more accurate than the EMD and VMD algorithms in identifying oscillation frequency parameters under ideal and noisy conditions.
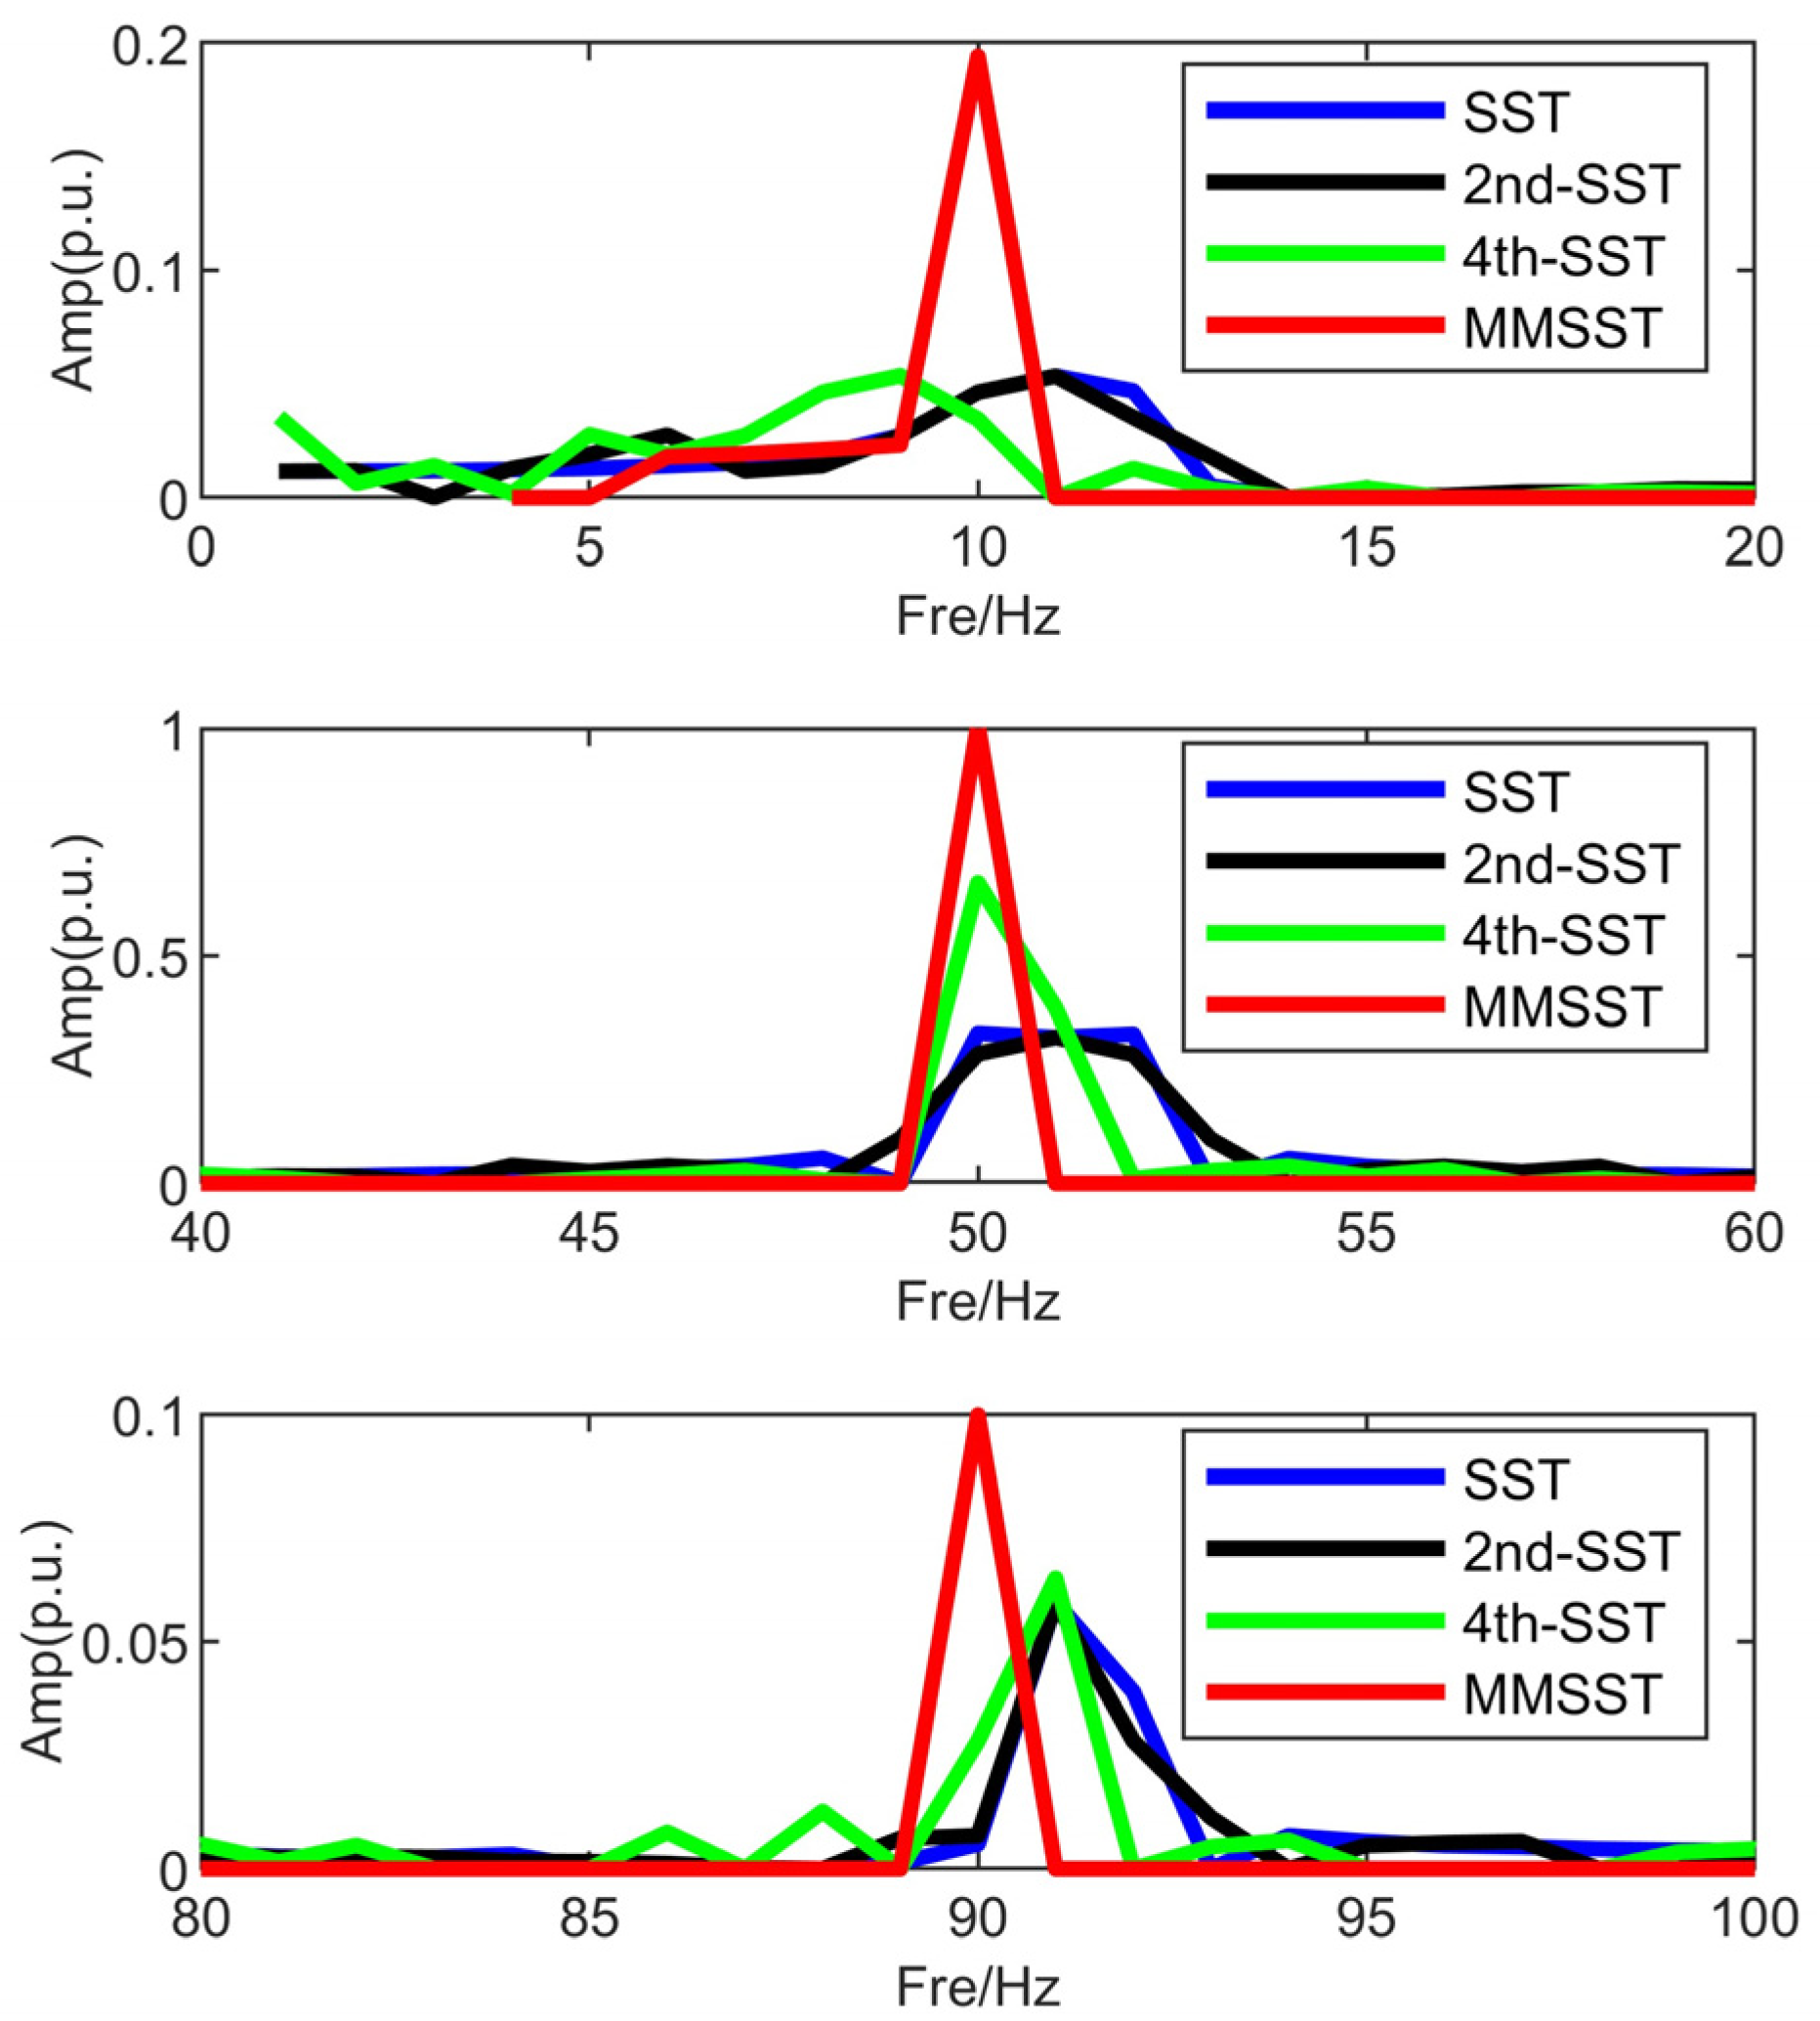
To provide a clearer visualization of the time–frequency energy distribution of the MSST algorithm, we compared it with the traditional SST algorithm, the second-order SST algorithm, and the fourth-order SST algorithm by plotting time–frequency slices at 10 Hz, 50 Hz, and 90 Hz, as shown in Figure 7. It can be observed from the figure that, for the reassignment technique, a higher concentration of time–frequency coefficients results in time–frequency representations with narrower energy distributions and greater amplitude. Due to the superior time–frequency coefficient concentration capability of the MMSST algorithm compared to other reassignment techniques, the corresponding time–frequency slices exhibit the narrowest frequency bandwidth and the highest time–frequency energy.

4.2. Simulation Oscillation Signal Analysis

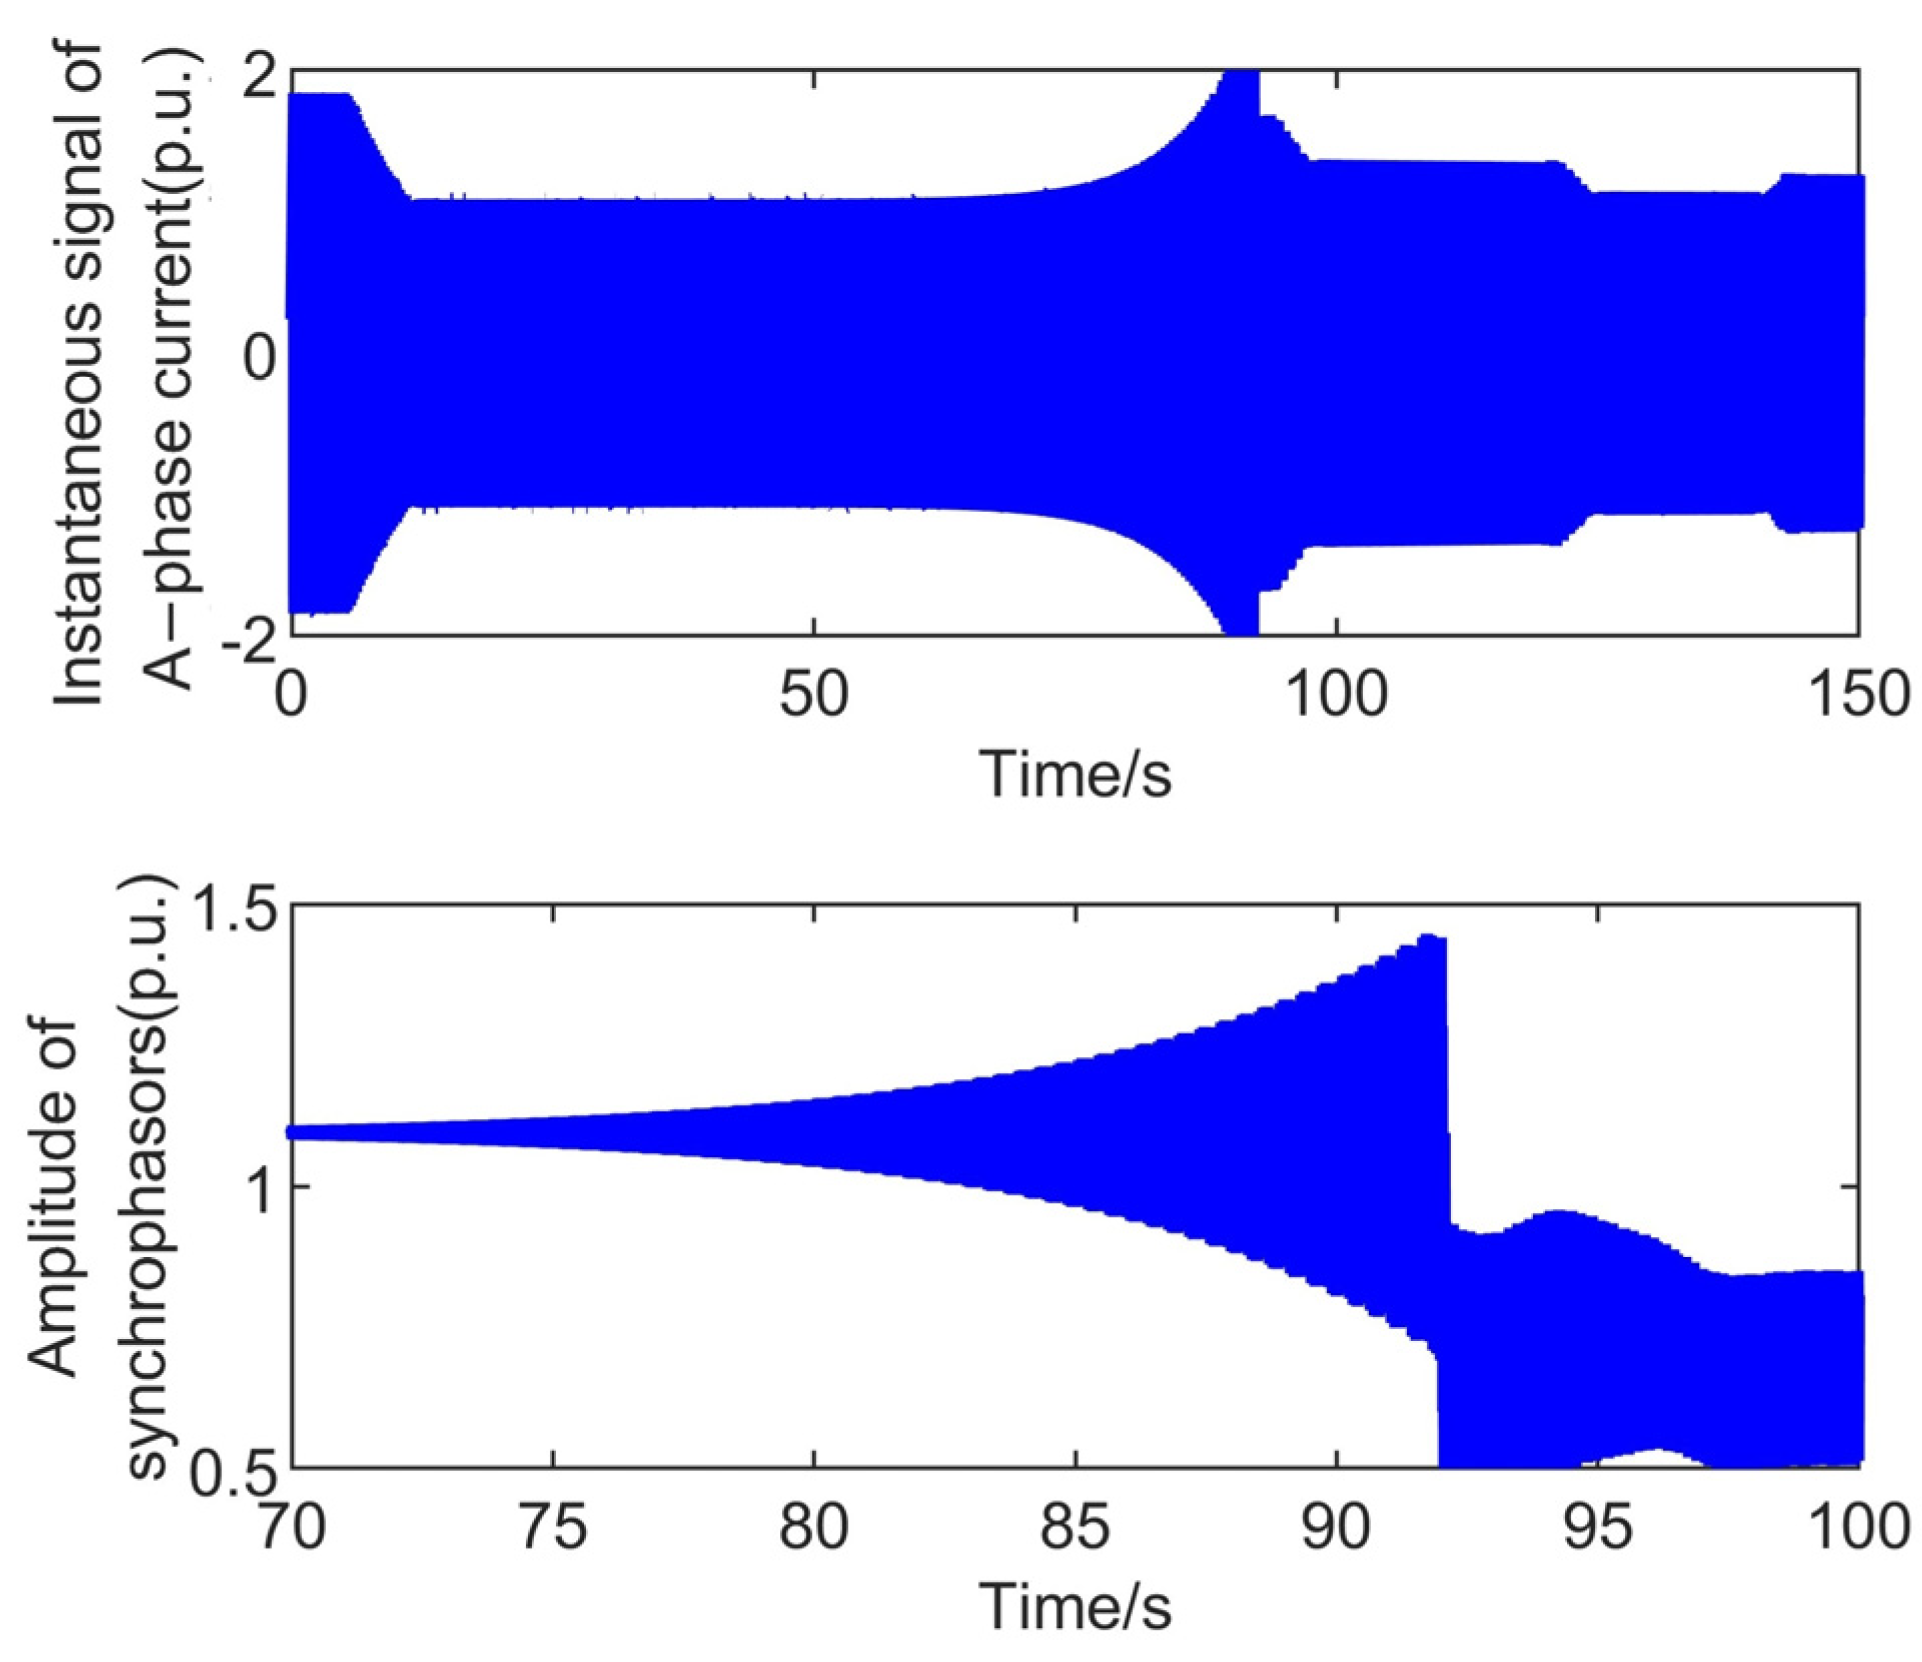
The proposed method was further validated using simulated oscillation signals, where MATLAB was employed to simulate the oscillation model and generate instantaneous current signals. The case study involved a series-compensated power system with doubly fed induction generators (DFIGs) connected to the power grid through grid-forming converters, as illustrated in Figure 8 [27]. The mechanism of sub-synchronous oscillation primarily arises from the dynamic interaction between the power system and the wind turbine control system. The wind turbine with DFIG is connected to a parallel compensator and then integrated into the grid through weak transmission lines. When wind speed decreases, sub-synchronous resonance (SSR) occurs between the DFIG and the parallel compensator. The oscillation mechanism and simulation parameters are consistent with those reported in [26], which includes only SSO components. Therefore, Figure 9 presents the instantaneous signals and corresponding synchronous phasors of the simulated A-phase current and recorded C-phase current of the case with a sampling frequency of 2 kHz.
The proposed method was implemented using a 2s data window. Table 2 lists the SSO parameters of the system in Figure 8 calculated using the EMD, VMD, and MMSST algorithms. For the fundamental component, the identification results based on the EMD, VMD, and MMSST algorithms are very close to the true values. Compared with the EMD and VMD algorithms, the MMSST algorithm can provide more accurate parameter estimates for the fundamental component ( f 0 , x 0 , ϕ 0 ), the sub-synchronous component ( f sub , x sub , ϕ sub ), and the super-synchronous component ( f sup , x sup , ϕ sup ) in these cases. However, the EMD algorithm is unable to effectively separate all intrinsic mode components, resulting in mode aliasing. Although the VMD algorithm demonstrates effectiveness in decomposing oscillatory frequency components, it exhibits relatively significant errors in accurately identifying the corresponding parameters. In contrast, the MMSST algorithm maintains the capability to precisely estimate all parameters, closely aligning with their true values.
The real-time performance of the MMSST algorithm was evaluated using data from the case study. All algorithm evaluation experiments were conducted on a workstation equipped with an Intel Core i7-8650U processor and 24 GB of RAM and running the Windows 10 operating system. When the input data length was set to 2s, the execution time across 100 runs ranged from 1.251795 s to 1.400439 s, with an average of 1.334358 s. These results indicate that the MMSST algorithm holds significant potential for application in real-time monitoring systems within power grids.

4.3. Actual System Signal Analysis

To verify the feasibility of the proposed algorithm, a four-machine two-area actual system model incorporating a 300 MW direct-drive wind farm was constructed using MATLAB R2019a software. The direct-drive wind farm was connected to the power grid through grid-forming converters at bus 11 through a transformer. The wiring diagram is presented in Figure 10, and the specific system parameters used are detailed in [28]. By comprehensively considering SSO and mid-/high-frequency oscillation components, the effectiveness, accuracy, and noise robustness of the proposed method in identifying wideband oscillation parameters were validated, taking into account load fluctuations and random noise interference.
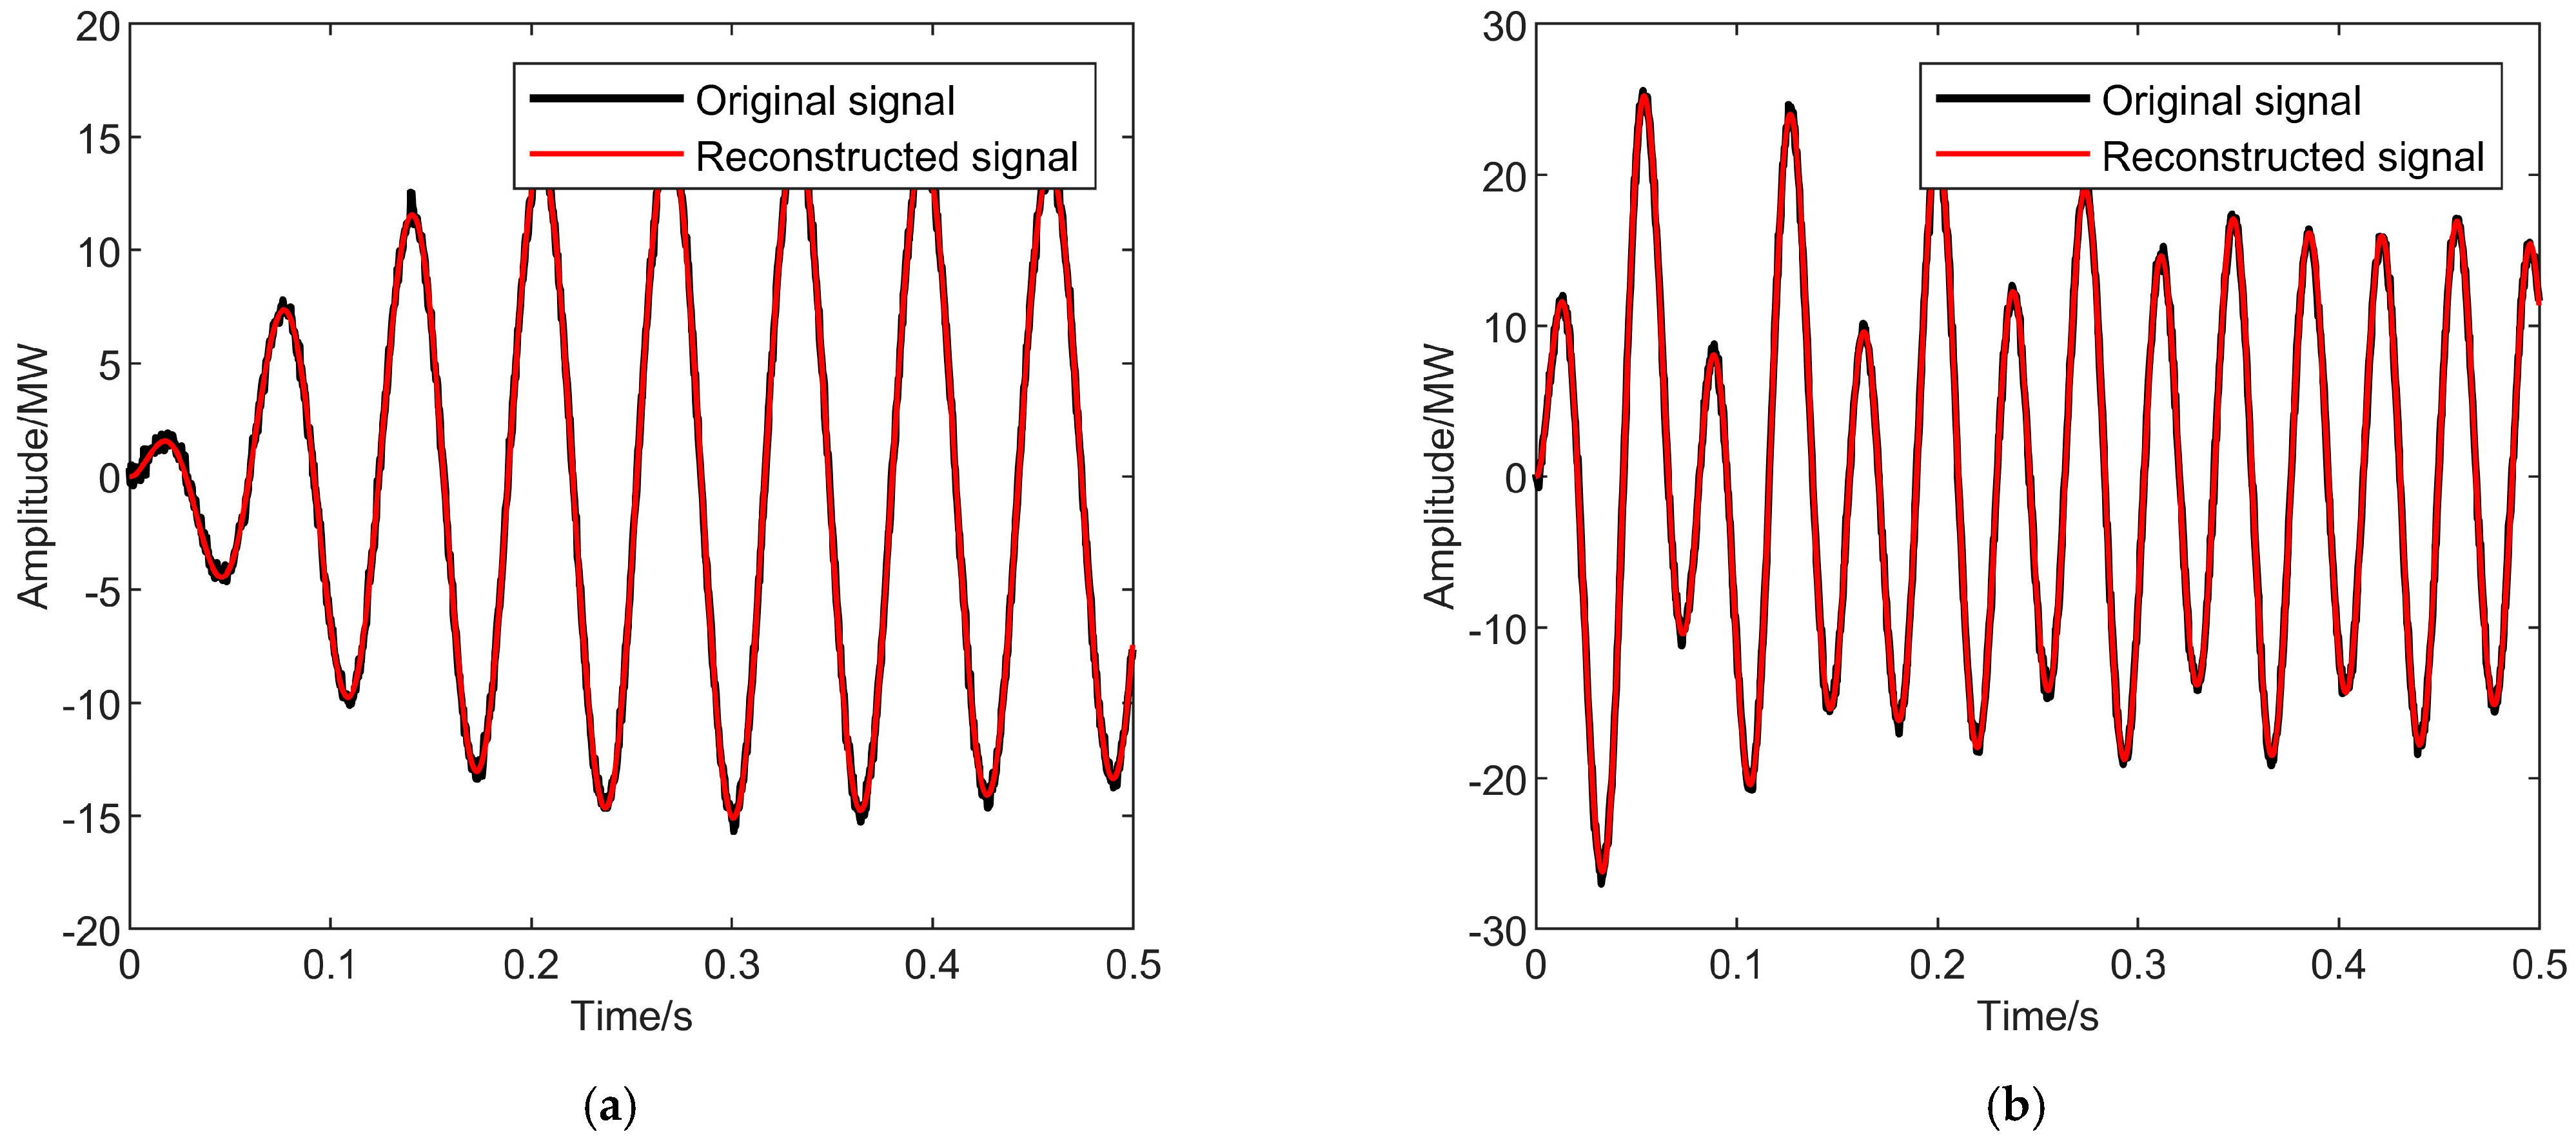
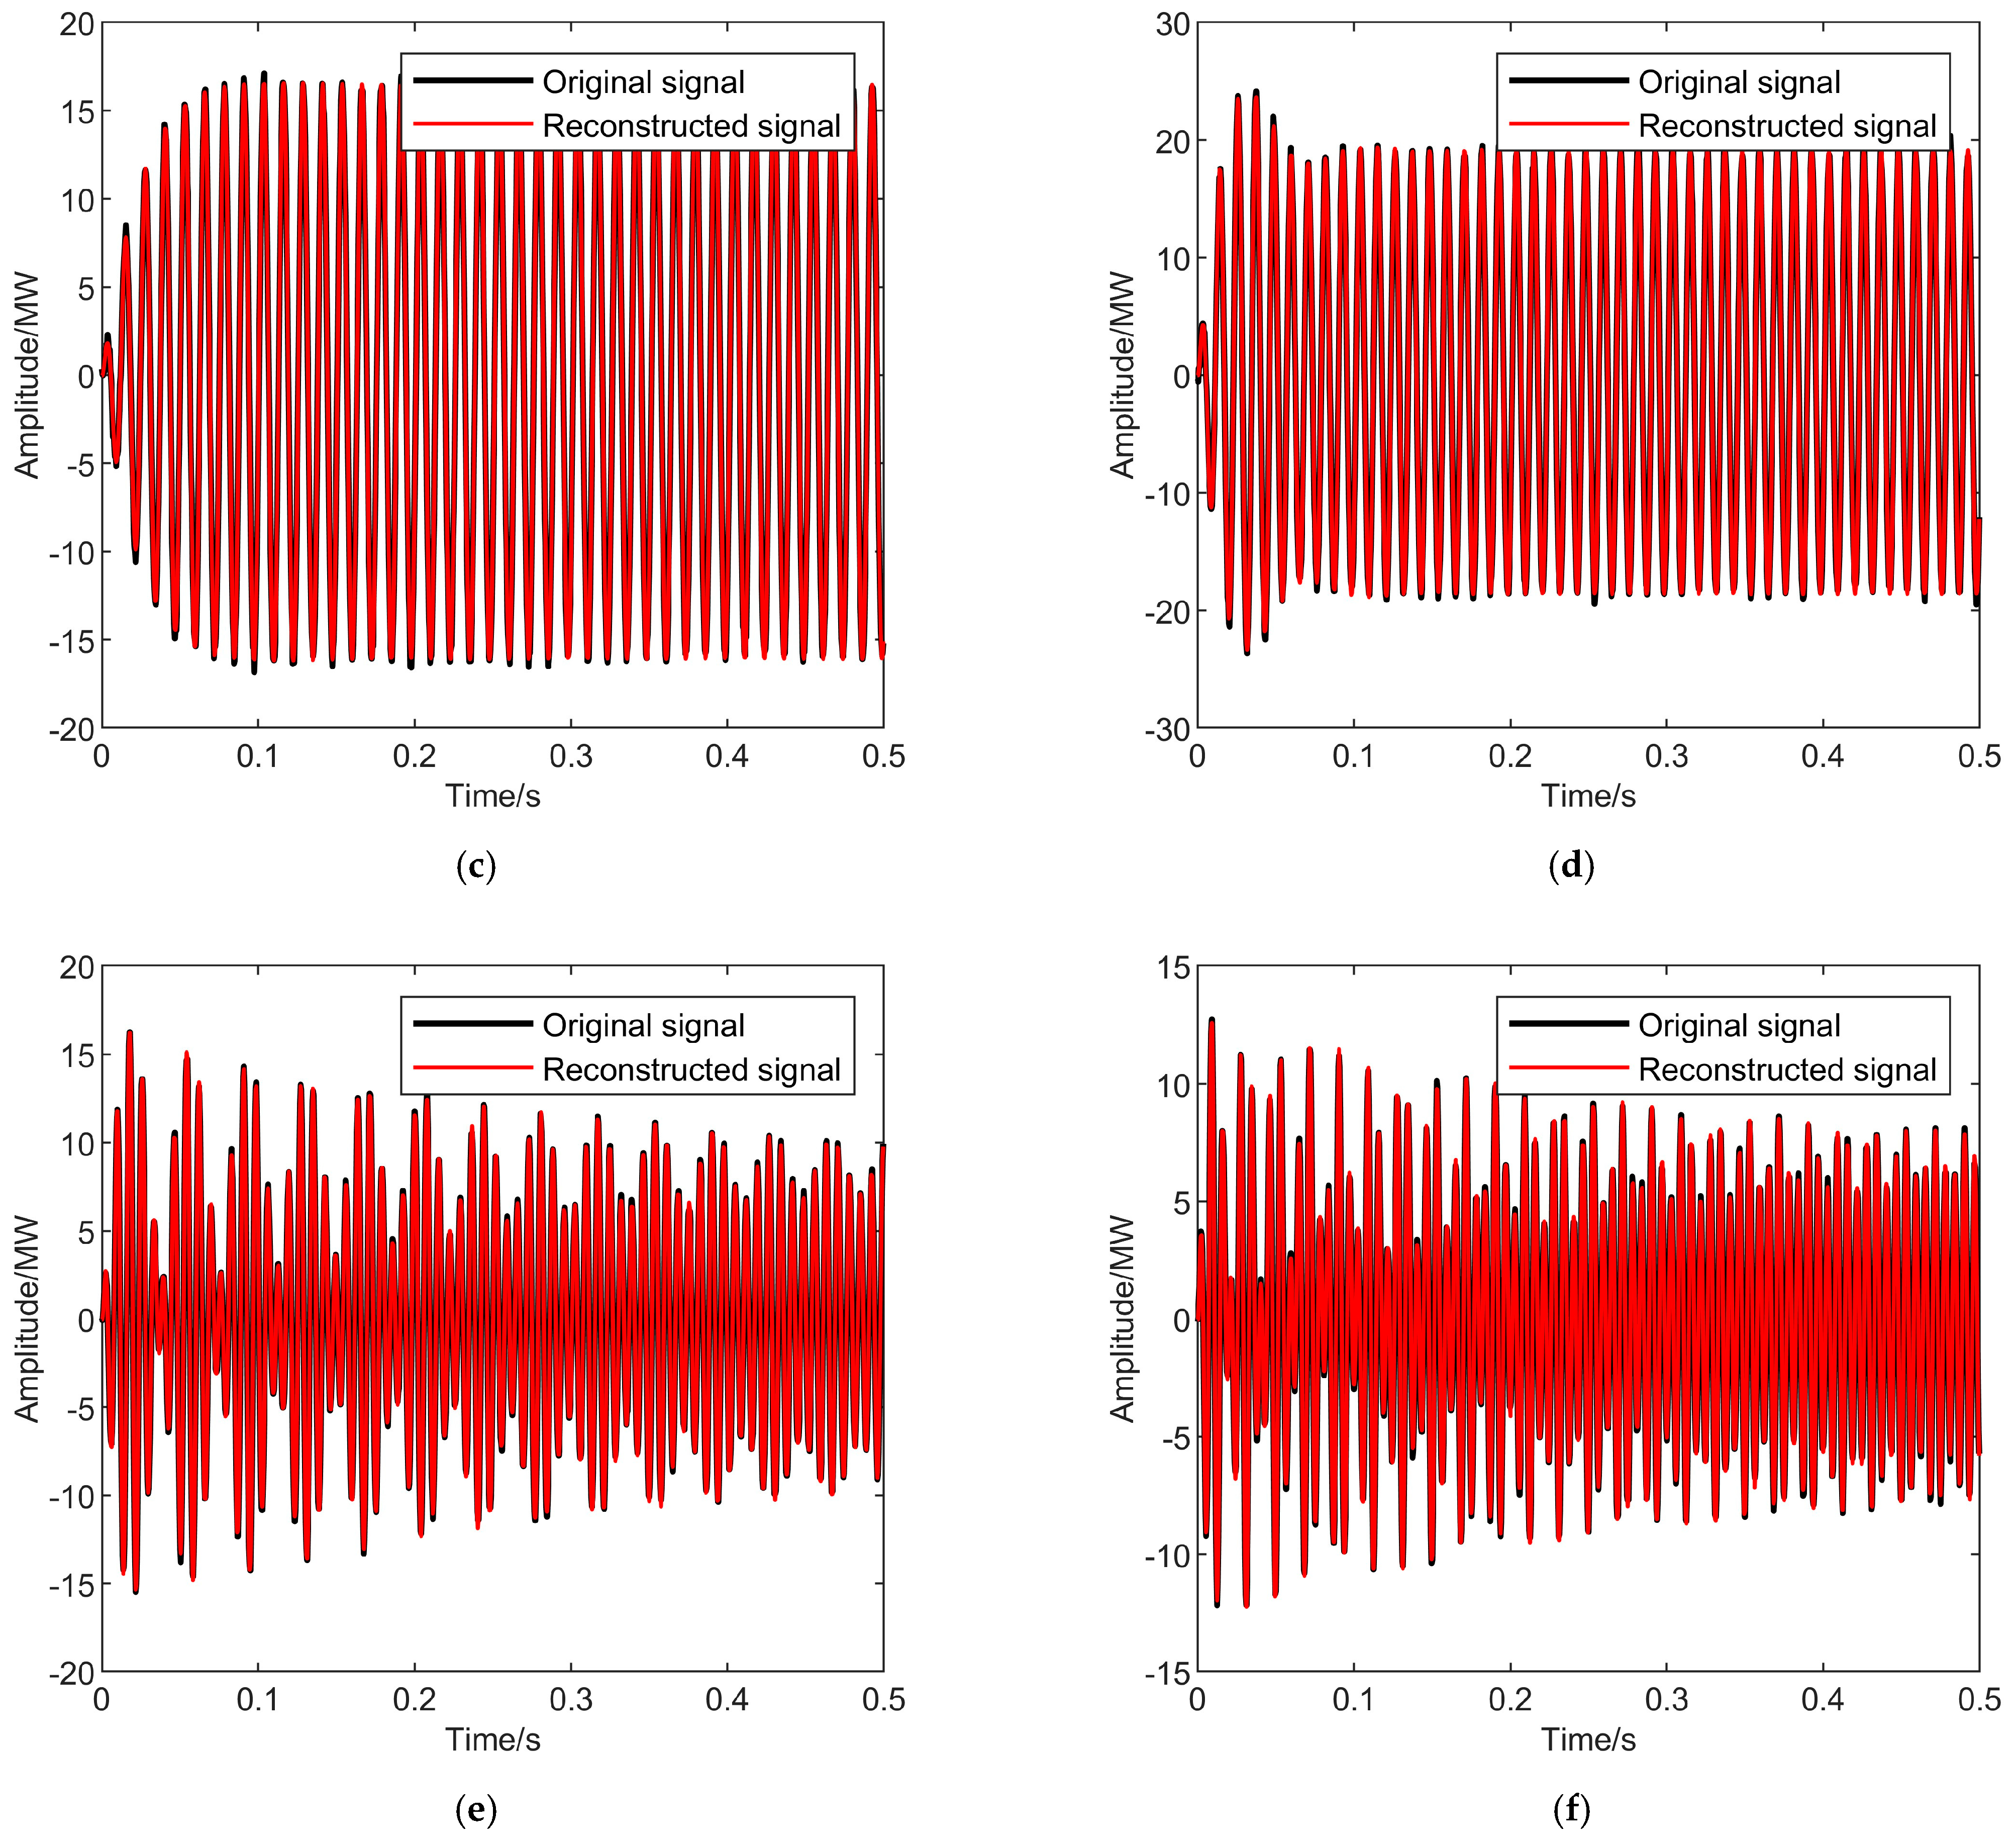
Given that the system generates wideband oscillations encompassing SSO and mid-/high-frequency oscillation components, sinusoidal disturbance signals with varying amplitudes (0.02–1.6 V) and frequencies (10–40 Hz, 70–100 Hz, and 130–160 Hz, with a step size of 0.1 Hz) were applied at the grid-side controller of the direct-drive wind farm. The load level was varied between 90% and 110%, and random noise (45–55 dB) was introduced into the system. By adjusting the control parameters of the wind turbines, various wideband oscillation modes were induced. Two representative wideband oscillation modes were selected for analysis: (1) 16 Hz, 79.7 Hz, and 137.0 Hz; (2) 27.1 Hz, 90.1 Hz, and 160.0 Hz. The active power signal of the wind farm was sampled at a rate of 2400 Hz and subsequently analyzed using the MMSST algorithm to extract oscillation components across different frequency bands. Specifically, sub-synchronous oscillation components were identified at 16 Hz and 27.1 Hz, super-synchronous components were identified at 79.7 Hz and 90.1 Hz, and mid-/high-frequency oscillation components were identified at 137.0 Hz and 160.0 Hz. Oscillation parameters were then calculated and used to reconstruct the corresponding waveforms. By comparing the original waveform with the reconstructed waveform, as shown in Figure 11, the results indicate that the MMSST algorithm can effectively separate various frequency components of oscillating signals and achieve high-precision identification of oscillating component parameters.

5. Conclusions

To enhance the capability of traditional time–frequency transform methods in extracting wideband oscillation signals in power systems, particularly in scenarios where multiple types of oscillations may coexist and span a wide frequency range due to the integration of grid-forming converters into the power grid, this paper proposes a parameter identification method for wideband oscillation signals in power systems based on the MMSST algorithm.
The MMSST algorithm is applied to extract various IMFs from the oscillation signal. The frequency, amplitude, and initial phase of each mode component are then obtained through the Hilbert transform, thereby enabling effective parameter identification of wideband oscillation signals.
The effectiveness of the proposed method has been validated through the analysis of SSOs and mid-/high-frequency oscillations. Compared with the EMD and VMD algorithms, the MMSST algorithm demonstrates superior mode decomposition accuracy, enabling more precise extraction of the fundamental component and various oscillation components without suffering from issues such as mode mixing or signal distortion. Since current power system analysis software is generally run on high-performance computers, the proposed method can be integrated into existing analysis software for the identification of wideband oscillation parameters and oscillation suppression in emerging power systems.

Author Contributions

Conceptualization, M.Z.; Software, P.X. and X.Z.; Validation, P.X. and L.L.; Formal analysis, L.L.; Investigation, Y.S. and M.Z.; Resources, Y.S. and M.Z.; Data curation, Y.S.; Writing—original draft, P.X.; Writing—review & editing, Y.Z. and X.Z.; Visualization, Y.Z.; Supervision, S.H.; Funding acquisition, S.H. All authors have read and agreed to the published version of the manuscript.

Funding

State Grid Hubei Electric Power CO, LTD Science and Technology under Grant 52153224002H; Natural Science Foundation of Hubei Province: 2025AFB741.

Data Availability Statement

The raw data supporting the conclusions of this article will be made available by the authors on request.

Conflicts of Interest

Authors Ping Xiong, Yu Sun, Lie Li, Yifan Zhao and Xiaoqian Zhu was employed by the company State Grid Hubei Electric Power Research Institute. The remaining authors declare that the research was conducted in the absence of any commercial or financial relationships that could be construed as a potential conflict of interest.

References

  1. Perera, U.; Oo, A.M.T.; Zamora, R. Sub synchronous oscillations under high penetration of renewables—A review of existing monitoring and damping methods, challenges, and research prospects. Energies 2022, 15, 8477. [Google Scholar] [CrossRef]
  2. Qiu, L.; Gu, M.; Chen, Z.; Du, Z.; Zhang, L.; Li, W.; Huang, J.; Fang, J. Oscillation suppression of grid-following converters by grid-forming converters with adaptive droop control. Energies 2024, 17, 5230. [Google Scholar] [CrossRef]
  3. Chen, L.; Xie, X.; He, J.; Xu, T.; Xu, D.; Ma, N. Wideband oscillationmonitoring in power systems with high-penetration ofrenewable energy sources and power electronics: A review. Renew. Sustain. Energy Rev. 2023, 175, 113148. [Google Scholar] [CrossRef]
  4. Verma, N.; Kumar, N.; Gupta, S.; Malik, H.; Márquez, F.P.G. Review of sub-synchronous interaction in wind integrated power systems: Classifcation, challenges, and mitigation techniques. Prot. Control Mod. Power Syst. 2023, 8, 17. [Google Scholar] [CrossRef]
  5. Cheng, Y.; Xie, J.; Zeng, C.; Yang, S.; Sun, H.; Qin, L. Comparison study of the wideband oscillation risk of MMC between grid-following and grid-forming control. Energies 2024, 17, 2507. [Google Scholar] [CrossRef]
  6. Carta, A.; Locci, N.; Muscas, C. A PMU for the measurement of synchronized harmonic phasors in three-phase distribution networks. IEEE Trans. Instrum. Meas. 2009, 58, 3723–3730. [Google Scholar] [CrossRef]
  7. Chakir, M.; Kamwa, I.; Le-Huy, H. Extended C37.118.1 PMU algorithms for joint tracking of fundamental and harmonic phasors in stressed power systems and microgrids. IEEE Trans. Power Deliv. 2014, 29, 1465–1480. [Google Scholar] [CrossRef]
  8. Liu, H.; Bi, T.; Xu, S.; Li, J.; Lin, J.; Zhao, Z.; Yang, F.; Ding, H.; Shang, J.; Liu, S. A full-view synchronized measurement system for the renewables, controls, loads, and waveforms of power-electronics-enabled power distribution grids. IEEE Trans. Smart Grid 2022, 13, 3879–3890. [Google Scholar] [CrossRef]
  9. Xie, X.; Zhan, Y.; Liu, H.; Liu, C. Improved synchrophasor measurement to capture sub/super-synchronous dynamics in power systems with renewable generation. IET Renew. Power Gener. 2019, 13, 49–56. [Google Scholar] [CrossRef]
  10. Macii, D.; Petri, D.; Zorat, A. Accuracy analysis and enhancement of DFT-based synchrophasor estimators in off-nominal conditions. IEEE Trans. Instrum. Meas. 2012, 61, 2653–2664. [Google Scholar] [CrossRef]
  11. Sun, B.; Wu, X.; Chen, X.; Zou, Z.; Li, Q.; Ren, B. Parameter estimation of sub-/super-synchronous oscillation based on interpolated all-phase fast Fourier transform with optimized window function. J. Mod. Power Syst. Clean Energy 2024, 12, 1031–1041. [Google Scholar] [CrossRef]
  12. Chen, C.I.; Chang, G.W. Virtual instrumentation and educational platform for time-varying harmonics and inter harmonics detection. IEEE Trans. Ind. Electron. 2010, 57, 3334–3342. [Google Scholar] [CrossRef]
  13. Zhou, N.; Trudnowski, D.J.; Pierre, J.W.; Mittelstadt, W.A. Electromechanical mode online estimation using regularized robust RLS methods. IEEE Trans. Power Syst. 2008, 23, 1670–1680. [Google Scholar] [CrossRef]
  14. Jain, S.K.; Singh, S.N. Exact model order ESPRIT technique for harmonics and interharmonics estimation. IEEE Trans. Instrum. Meas. 2012, 61, 1915–1923. [Google Scholar] [CrossRef]
  15. Laila, D.S.; Messina, A.R.; Pal, B.C. A refned Hilbert–Huang transform with applications to interarea oscillation monitoring. IEEE Trans. Power Syst. 2009, 24, 610–620. [Google Scholar] [CrossRef]
  16. Arrieta Paternina, M.R.; Tripathy, R.K.; Zamora-Mendez, A.; Dotta, D. Identifcation of electromechanical oscillatory modes based on variational mode decomposition. Electr. Power Syst. Res. 2019, 167, 71–85. [Google Scholar] [CrossRef]
  17. Du, D.; Guo, C.; Yang, S.; Peng, Y.; Zhao, C. Fast detection method of medium-high-frequency oscillations based on equal-band multi-channel signal tracking and screening. Proc. CSEE 2023, 43, 7030. [Google Scholar]
  18. Chen, L.; Xie, X.; Song, M.; Li, Y.; Zhang, Y. Estimation of high-frequency oscillation’s magnitude and frequency based on multi-tone FIR filter. IEEE Trans. Power Syst. 2023, 38, 528–536. [Google Scholar] [CrossRef]
  19. Oberlin, T.; Meignen, S.; Perrier, V. Second-order synchrosqueezing transform or invertible reassignment? towards ideal time-frequency representations. IEEE Trans. Signal Process. 2015, 63, 1335–1344. [Google Scholar]
  20. Thakur, G.; Brevdo, E.; Fučkar, N.S.; Wu, H.T. The synchrosqueezing algorithm for time-varying spectral analysis: Robustness properties and new paleoclimate applications. Signal Process. 2013, 93, 1079–1094. [Google Scholar] [CrossRef]
  21. Wang, H.; Long, J.; Deng, C.; Zhou, Y. Robust multisynchrosqueezing transform time frequency technologies with application to fault diagnosis. Int. J. Electr. Power Energy Syst. 2025, 170, 110849. [Google Scholar] [CrossRef]
  22. Liu, Y.; Wen, H.; Ding, Z.; Xu, L.; Chen, H.; Smulko, J. An instantaneous engine speed estimation method using multiple matching synchrosqueezing transform. J. Sens. 2021, 2021, 6650432. [Google Scholar] [CrossRef]
  23. Sun, B.; Wu, X.; Chen, X.; Zhou, J. An identification scheme for wideband oscillation parameters based on AR-EWT and interpolated DFT. IEEE Trans. Instrum. Meas. 2025, 74, 9001512. [Google Scholar] [CrossRef]
  24. Zeng, X.; Chen, G.; Liu, Y.; Zhang, F.; Shi, H. Parameter identification of power grid subsynchronous oscillations based on eigensystem realization algorithm. Energies 2024, 17, 2575. [Google Scholar] [CrossRef]
  25. Zhang, F.; Li, J.; Liu, J.; Gao, W.; He, J. An improved interpolated DFT-based parameter identification for sub-/super-synchronous oscillations with synchrophasors. IEEE Trans. Power Syst. 2023, 38, 1714–1727. [Google Scholar] [CrossRef]
  26. Yang, X.; Zhang, J.; Xie, X.; Xiao, X.; Gao, B.; Wang, Y. Interpolated DFT-based identification of sub-synchronous oscillation parameters using synchrophasor data. IEEE Tran. Smart Grid 2025, 11, 2662–2675. [Google Scholar] [CrossRef]
  27. Wang, L.; Xie, X.; Jiang, Q.; Liu, H.; Li, Y.; Liu, H. Investigation of SSR in practical DFIG-based wind farms connected to a series-compensated power system. IEEE Trans. Power Syst. 2015, 30, 2772–2779. [Google Scholar] [CrossRef]
  28. Cui, H.; Feng, S.; Chen, J.; Ye, Y.; Tang, Y.; Lei, J. Wide-area location method of wide-band oscillations based on autoencoder and long short-term memory network. Autom. Electr. Power Syst. 2022, 46, 194–201. [Google Scholar]
Figure 1. System diagram of a DDWF via VSC-HVDC transmission systems.
Energies 18 05123 g001
Figure 2. The process of wideband oscillation signal analysis.
Energies 18 05123 g002
Figure 3. Time-domain waveform of the oscillation signal.
Energies 18 05123 g003
Figure 4. EMD analysis of the oscillation signal.
Energies 18 05123 g004
Figure 5. VMD analysis of the oscillation signal.
Energies 18 05123 g005
Figure 6. MMSST analysis of the oscillation signal.
Energies 18 05123 g006
Figure 7. The time–frequency slices at 10 Hz, 50 Hz, and 90 Hz using four algorithms.
Energies 18 05123 g007
Figure 8. Equivalent system of the wind farms and series-compensated system.
Energies 18 05123 g008
Figure 9. The instantaneous signal of current and the amplitude of the corresponding synchrophasor sequence in the system of Figure 8.
Energies 18 05123 g009
Figure 10. Wiring diagram of four-machine, two-area actual system model with a direct-drive wind farm. In the figure, numbers 1 through 12 denote the respective busbar designations within the system.
Energies 18 05123 g010
Figure 11. Reconstructed waveforms based on MMSST under different oscillation conditions. (a) Sub-synchronous oscillation waveform generated at a frequency of 16 Hz. (b) Sub-synchronous oscillation waveform generated at a frequency of 27.1 Hz. (c) Super-synchronous oscillation waveform generated at a frequency of 79.7 Hz. (d) Super-synchronous oscillation waveform generated at a frequency of 90.1 Hz. (e) Mid-/high-frequency oscillation waveform generated at a frequency of 137 Hz. (f) Mid-/high-frequency oscillation waveform generated at a frequency of 160 Hz.
Energies 18 05123 g011aEnergies 18 05123 g011b
Table 1. Conducted evaluation of the SSO parameter estimation errors for EMD, VMD, and MMSST algorithms (%).
Test SetSNR (dB)Method f ^ 0 f 0 f 0 x ^ 0 x 0 x 0 ϕ ^ 0 ϕ 0 ϕ 0 f ^ sub f sub f sub x ^ sub x sub x sub ϕ ^ sub ϕ sub ϕ sub f ^ sup f sup f sup x ^ sup x sup x sup ϕ ^ sup ϕ sup ϕ sup
f sub [ 5 , 45 ] EMD10−510−310−3//////
VMD10−410−210−210−210−110−110−410−410−4
MMSST10−710−610−610−510−510−510−510−510−5
40EMD1.02177.10359.0331//////
VMD1.12319.243410.76824.485117.171425.67821.47732.23544.9867
MMSST0.55451.11702.17631.18251.72723.57681.18252.03164.7547
x sub [ 0.05 , 1 ] EMD10−510−310−3//////
VMD10−410−210−210−210−110−110−410−410−4
MMSST10−710−610−610−510−510−510−510−510−5
40EMD0.96556.26788.6312//////
VMD1.16937.44639.37864.057116.884324.87561.36791.81644.2079
MMSST0.47581.09371.7832 1.04651.53152.75441.04651.64503.9623
Table 2. Identified oscillation parameters of the case with comparisons by EMD, VMD, and MMSST algorithms.
ParametersTrue ValueEMDVMDMMSST
f 0 ( Hz ) 50.000050.023750.032250
x 0 ( p . u . ) 1.09561.12051.23721.1092
ϕ 0 ( rad ) −1.4632−3.6316−3.7264−1.4960
f sub ( Hz ) 7.5125/8.34067.6032
x sub ( p . u . ) 0.6926/0.92370.7055
ϕ sub ( rad ) −2.1112/−2.4358−2.1916
f sup ( Hz ) 92.4871/95.356693.4676
x sup ( p . u . ) 0.0275/0.10790.0281
ϕ sup ( rad ) 0.1772/0.14390.1692
Disclaimer/Publisher’s Note: The statements, opinions and data contained in all publications are solely those of the individual author(s) and contributor(s) and not of MDPI and/or the editor(s). MDPI and/or the editor(s) disclaim responsibility for any injury to people or property resulting from any ideas, methods, instructions or products referred to in the content.