Abstract
With the advancement of coal mine electrical equipment toward larger scale, higher complexity, and greater intelligence, traditional temperature rise monitoring methods have revealed critical limitations such as intrusive measurement, low spatial resolution, and delayed response. This study proposes a novel cross-media infrared measurement method combined with temperature rise characteristic analysis to overcome these challenges. First, a cross-media measurement principle is introduced, which uses the enclosure surface temperature as a proxy for the internal heat source temperature, thereby enabling non-invasive internal temperature rise measurement. Second, a non-contact, infrared thermography-based array-sensing measurement approach is adopted, facilitating the transition from traditional single-point temperature measurement to full-field thermal mapping with high spatial resolution. Furthermore, a multi-source data perception method is established by integrating infrared thermography with real-time operating current and ambient temperature, significantly enhancing the comprehensiveness and timeliness of thermal state monitoring. A hybrid prediction model combining Support Vector Regression (SVR) and Random Forest Regression (RFR) is developed, which effectively improves the prediction accuracy of the maximum internal temperature—particularly addressing the issue of weak surface temperature features during low heating stages. The experimental results demonstrate that the proposed method achieves high accuracy and stability across varying operating currents, with a root mean square error of 0.741 °C, a mean absolute error of 0.464 °C, and a mean absolute percentage error of 0.802%. This work provides an effective non-contact solution for real-time temperature rise monitoring and risk prevention in coal mine electrical equipment.
1. Introduction
The intelligent coal mine is the core direction of transformation, upgrading and high-quality development of the coal industry [1]. As the core support system to ensure the stable operation of coal mine energy supply and production system, coal mine electrical equipment has shown a trend of large-scale, complex and intelligent development in recent years [2,3], which puts forward higher requirements for thermal stability and operation reliability of equipment [4,5]. The China’s “14th Five-Year Plan for Mine Safety Production” has clarified the objectives and tasks of strengthening the research on mine safety technology and equipment and improving the intelligence of coal mine electrical equipment and related technologies. The traditional temperature rise measurement methods for coal mine electrical equipment are primarily based on the relevant specifications of GB 3836.1 [6] and GB/T 14048.1 [7]. However, most coal mine electrical equipment uses flameproof enclosures [8], requiring the disassembly of equipment to install sensors for contact measurements. This leads to issues such as sensor interference and limited measurement points. These problems directly affect the level of intelligence in coal mine electrical equipment and the safety of mining operations. Therefore, there is an urgent need to improve the intelligence level of temperature rise measurement methods for coal mine electrical equipment.
At present, traditional temperature rise measurement methods often interfere with equipment structure and operational conditions due to the intrusive nature of thermocouple-based contact measurement, thereby compromising the stability and reliability of the acquired data and even potentially jeopardizing the safe operation of coal mine electrical equipment. Furthermore, single-point measurement fails to capture the complete temperature distribution across the equipment, thus preventing an accurate assessment of the operational status of the device. In addition, the inherent thermal inertia of flameproof enclosures leads to a significant lag between the internal heat source and the surface thermal response, making non-contact measurement particularly challenging. In view of the above problems, scholars at domestic and international levels have carried out a lot of research on temperature rise measurement technology. The research focuses on improving the flexibility of sensor layout and optimizing the layout strategy of measuring points. References [9,10,11] have improved the measurement coverage to a certain extent by increasing the number of temperature measurement points. However, it is still difficult to meet the need for comprehensive temperature rise measurement of equipment. As a non-contact, array-sensing temperature measurement method [12], infrared thermal imaging technology has gradually attracted attention. Jadin et al. [13] provided a method for measuring thermal anomalies in electrical equipment using infrared thermal imaging technology. Based on the infrared array, Wang et al. [14] detected the multi-field temperature distribution at the junction of the switch cabinet busbar and the cable. Due to the flameproof structure of coal mine electrical equipment, infrared thermal imaging cannot directly measure the internal temperature. To break through the enclosure limit, References [15,16,17] used the thermal imager to measure the enclosure temperature without dismantling the equipment and successfully realized the internal fault location. To accurately obtain the specific temperature value inside the device, Anthony et al. [18,19] proposed a method for predicting internal temperature based on the theoretical relationship between the outer surface temperature and the internal temperature of a cylinder. However, this method is applicable only to a single solid medium, where heat transfer primarily relies on thermal conduction within the solid. Its applicability is difficult for complex equipment composed of multiple media. Subsequently, Anthony et al. [20] achieved non-invasive measurement of the core temperature of lithium-ion batteries by spatially and temporally integrating the temperature field measured on the outer surface. However, this method is applicable only to small battery volumes and involves solely solid-phase heat transfer. In references [21,22], the non-invasive measurement of the internal temperature rise in the equipment is realized by empirical fitting and machine learning. However, most of them rely on single variables, making it difficult to accurately reflect the complex thermal field evolution process inside the equipment. Hajialibabaei et al. [23] included parameters that affect heat conduction along with temperature as inputs to the prediction model, improving the prediction accuracy. References [24,25] improved the accuracy of temperature rise prediction by fusing multiple sensor data. However, the single prediction model has a certain lack of adaptability under complex working conditions. Sahu et al. [26] developed three binary hybrid regression models for predictive analysis by cascading two individual models from four basic single machine learning models. They found that the performance of the hybrid models was superior to that of each individual model. Asteris et al. [27] used the predictions from the first model as inputs to train another model, and the resulting hybrid ensemble model improved the prediction accuracy. Zhou et al. [28] improved feature extraction by integrating different models’ feature extraction methods, thereby capturing more important features. Zhao et al. [29] reduced sensitivity to data quality by combining the strengths of different machine learning algorithms. The above scholars optimized the learning process by integrating multiple models, significantly reducing prediction errors. Although the relevant research has made positive progress, the current research on temperature rise prediction is mainly aimed at general electromechanical equipment, and the application research in the coal mine electrical equipment field is still relatively blank.
Therefore, this paper addresses the practical needs of temperature rise monitoring for coal mine electrical equipment by proposing a non-contact temperature measurement method based on cross-media infrared measurement. First, in response to the complex internal structure of the equipment, which involves multiple media and intricate heat transfer paths, a cross-media temperature rise measurement principle is introduced. This principle enables the indirect estimation of the internal heat source temperature through the surface temperature of the enclosure, providing a solid theoretical foundation for non-contact measurement. By analyzing the dynamic temperature response between the equipment enclosure and the internal heat source, the challenges associated with cross-media measurement were identified, including the thermal inertia of the enclosure, heat transfer hysteresis, and the dynamic variability of the maximum temperature point on the enclosure. The advantages of using infrared thermography for measuring the equipment enclosure were also analyzed. Second, building upon infrared temperature measurement, equipment operating current and environmental temperature parameters are introduced to construct a multi-source data perception method, achieving comprehensive perception of the equipment’s thermal state. Based on this, a hybrid prediction model combining Support Vector Regression (SVR) and Random Forest Regression (RFR) is proposed, effectively addressing the issue of low prediction accuracy in the low-temperature range and significantly improving the modeling and prediction accuracy of the internal maximum temperature. This research aims to provide an effective solution for intelligent, non-contact temperature rise monitoring of coal mine electrical equipment, with significant implications for enhancing thermal safety design, structural optimization, operational reliability, and safety monitoring.
2. Method and Principle
To obtain the temperature rise characteristics of coal mine electrical equipment under non-contact, a cross-media infrared temperature rise measurement method for coal mine electrical equipment is proposed, and the temperature rise characteristics of the equipment are analyzed accordingly. The technical route of cross-media infrared measurement and temperature rise characteristic analysis scheme for coal mine electrical equipment is shown in Figure 1.
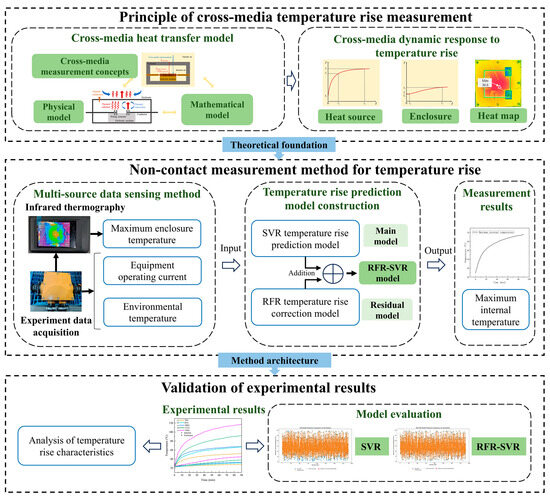
Figure 1.
Technical route of cross-media infrared temperature rise analysis for coal mine electrical equipment.
Firstly, the principle of cross-media temperature rise measurement is proposed, and the cross-media heat transfer model between the equipment enclosure and the internal heat source is constructed to analyze the dynamic response of temperature rise.
Secondly, a cross-media infrared temperature rise measurement method for coal mine electrical equipment is proposed. The infrared thermal image is used to replace the intrusion and contact measurement of thermocouples. A multi-source data sensing method is proposed, and a temperature rise prediction model combining support vector regression and random forest regression is constructed.
Finally, the proposed measurement method is verified by the temperature rise test to realize the measurement and analysis of the temperature rise characteristics of the equipment.
3. Principle of Cross-Media Temperature Rise Measurement
The internal heat transfer path of coal mine electrical equipment covers metal, air, insulation layer and other media, and its heat transfer path is complex and has strong nonlinear characteristics. The cross-media temperature rise measurement is based on the transfer of heat between multiple media, and the temperature of the equipment enclosure is measured to indirectly measure the internal temperature. Aiming at the problem of heat transfer between heat source, dielectric medium, air and enclosure, the principle of cross-media temperature rise measurement is proposed in this paper. The physical model and mathematical model of cross-media heat transfer are constructed around the multi-medium thermal coupling process between heat source and outer surface of enclosure. By analyzing the thermal diffusion mechanism and dynamic response behavior of different media layers, the propagation law of temperature response between media is revealed. This principle provides theoretical support for modeling and predicting the temperature rise characteristics of coal mine electrical equipment and realizing non-contact measurement.
3.1. Cross-Media Heat Transfer Model
In coal mine production, coal mine electrical equipment is divided into various types, including transformers, feed switches, explosion-proof motors, flameproof junction boxes, etc., usually composed of metal enclosures and internal electrical components. The heating conductor is fixed on the dielectric medium and does not directly contact the enclosure. When the current passes through the electrical components, the heat will continue to be generated due to the Joule effect of the conductor. The heat is transferred to the metal enclosure and then emitted to the external environment.
3.1.1. Physical Model
In this paper, the flameproof junction box is selected as the research object. Compared with other equipment, the structure is simple and the heating conductor is single, which is convenient for analyzing its cross-media heat transfer model. The cross-media composition of the flameproof junction box is shown in Table 1, and the heat is transferred to the external environment through a variety of media.

Table 1.
Heat transfer path of flameproof junction box.
The cross-media temperature rise measurement realizes the temperature rise measurement across multiple media by measuring the temperature of the enclosure and combining the temperature rise relationship between the enclosure and the internal heat source, as shown in Figure 2.
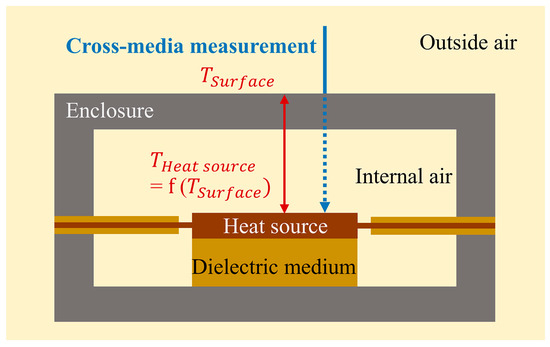
Figure 2.
Cross-media temperature rise measurement diagram.
There are three main modes of heat transfer in the flameproof junction box: thermal conduction, thermal convection, and thermal radiation [30]. The primary forms of heat transfer include: (i) thermal conduction between solids such as the conductor, enclosure, and dielectric medium; (ii) thermal radiation between different components; (iii) convective heat transfer between the air inside the enclosure and the conductor; and (iv) natural convective heat transfer between the enclosure and the external atmosphere. Given the structure of the flameproof junction box, the dielectric medium is ceramic and exhibits low thermal conductivity; accordingly, as the upper enclosure is used for measurement, the influence of heat transfer through the dielectric medium is disregarded. A schematic diagram of the heat transfer mechanisms is shown in Figure 3.
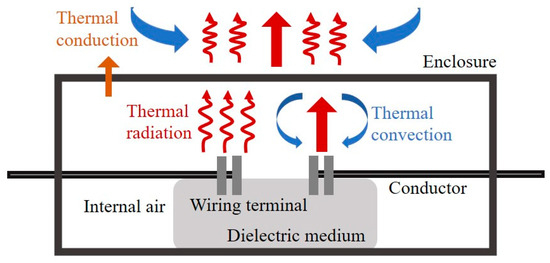
Figure 3.
Schematic diagram of heat transfer forms in the flameproof junction box.
3.1.2. Mathematical Model
During the normal operation of the flameproof junction box, the internal heat sources do not directly contact the enclosure. Therefore, the primary sources of heat transferred to the enclosure are thermal radiation from the heat sources to the inner surface of the enclosure, as well as natural thermal convection and thermal conduction through the internal air. Formula (1) describes the radiative heat transfer from the internal heat source to the enclosure [31].
where is radiation heat flux, ; is the Stefan-Boltzmann constant,; is the effective radiation area of the heat source, ; is the surface temperature of the heat source, ; is the inner surface temperature of the enclosure, ; is the surface emissivity of the heat source; is the emissivity of the inner surface of the enclosure; is the shape factor between surfaces and , reflecting the geometric configuration of the enclosed space.
The small space inside the device results in a small temperature difference and low flow rate of the gas inside the cavity, and the Boussinesq approximation is suitable for the case where the temperature difference in the fluid is small and the density change is weak [32]. Therefore, the Boussinesq approximation is used to deal with the natural convection of the fluid inside the equipment cavity. The governing momentum formula is given in Formula (2). The energy conservation formula [33] for natural convection and conduction in the air is given in Formula (3).
where is the air density, ; is the specific heat capacity of air, ; is the velocity field, ; is pressure, ; is dynamic viscosity, ; is the thermal expansion coefficient, ; and are local temperature and reference temperature, ; is the gravitational acceleration vector, ; and is the air thermal conductivity, .
As the temperature of the enclosure rises, heat is transferred to the surrounding air. Heat transfer on the equipment enclosure follows Fourier’s law, and the equation for the relationship between heat flow density and temperature gradient is shown in Formula (4).
where is the temperature distribution of the enclosure along the thickness direction, and is the thermal conductivity of the enclosure material, .
Under steady-state conditions, the heat transfer process does not vary with time and the temperature distribution depends only on spatial location. The steady state equation is shown in Formula (5).
Under transient conditions, in addition to thermal conductivity and temperature gradients, the effect of heat capacity needs to be considered. The transient equation is shown in Formula (6).
where is the enclosure thickness direction coordinates, ; is the density of the enclosure material, ; is the specific heat capacity of the enclosure material, .
The boundary conditions between the inner surface of the enclosure and the internal air are given in Formula (7).
There are convective heat transfer and radiative heat transfer boundary conditions between the outer surface of the enclosure and the environment as given in Formula (8).
where is the average temperature of the air inside the enclosure, ; is the heat transfer coefficient of the air inside the enclosure, ; is the amount of heat transferred per unit area through the outer surface, ; is the convective heat transfer coefficient between the outer surface of the enclosure and the external environment; is the emissivity of the outer surface of the enclosure; is the temperature of the outer surface of the enclosure, ; is the environmental temperature, .
The cross-media heat transfer model developed in this study elucidates the heat transfer mechanisms from internal heat sources to the enclosure of flameproof junction boxes from a physical perspective, thereby providing a solid theoretical foundation for cross-media temperature rise measurement. Due to the structural complexity of the device and the strong coupling of multiple physical fields, obtaining analytical solutions is infeasible. At the same time, numerical simulations require detailed geometric and material property parameters, leading to high computational costs. Consequently, this study adopts a data-driven approach to achieve efficient and accurate prediction while overcoming the inherent limitations of traditional methods.
3.2. Dynamic Analysis of Cross-Media Temperature Rise
The primary heat source within the flameproof junction box is the current-carrying conductor. As illustrated in Figure 4, the temperature rise process of both the conductor and the enclosure can be characterized by three distinct stages, reflecting the transition from a non-equilibrium state to steady-state conditions.
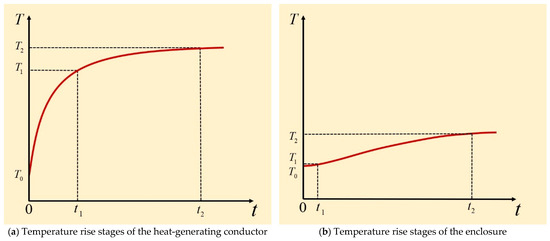
Figure 4.
Heating conductor and enclosure temperature rise stage.
As shown in Figure 4a, the conductor temperature rise initiates with a rapid heating phase (), where the limited heat dissipation capacity due to the small temperature difference between the conductor and ambient environment leads to accelerated heat accumulation and a near-exponential temperature increase. The system then enters a deceleration phase (), during which the growing temperature difference enhances heat dissipation, causing the temperature rise rate to gradually decrease as the system approaches thermal equilibrium. Finally, during the steady-state phase (), the heat generation equals the dissipation, stabilizing the temperature at a constant value T2, governed by the power input, thermal path, and ambient conditions.
In contrast, the enclosure temperature response, depicted in Figure 4b, exhibits delayed behavior due to the combined effects of thermal inertia and thermal transport hysteresis within the enclosure material. During the initial slow heating period (), the temperature increases gradually under limited heat flux. As the internal temperature continues to rise, the enclosure enters an accelerated heating stage (), where increased heat absorption leads to a noticeable increase in the temperature slope. The system eventually reaches a dynamic equilibrium in the steady-state phase (), with the enclosure temperature stabilizing at a plateau value T2, influenced by the heat source intensity, material thermal properties, and external dissipation conditions.
Analysis of the dynamic thermal response between the enclosure and the internal heat source indicates a high consistency in temperature rise trends during the steady-state phase, confirming the feasibility of estimating internal temperature rise from enclosure measurements. However, significant thermal hysteresis is observed during the initial startup period, where the internal temperature increases markedly faster than that of the enclosure, highlighting the effects of thermal inertia and nonlinear heat transfer. These findings demonstrate the limitations of relying solely on enclosure temperature to predict internal thermal behavior, particularly under transient conditions. Therefore, to achieve accurate temperature prediction across all operational phases, it is essential to compensate for these dynamic discrepancies by incorporating multivariable inputs and advanced modeling approaches.
Considering the high emissivity characteristics of painted metal surfaces, the emissivity of the infrared thermal imager was set to 0.93, in accordance with values recommended by ASTM [34] standards. Applying the equipment’s specified rated current of 100 A ensured operation at the rated power. As shown in Figure 5, infrared thermography measurements of the flameproof junction box during the power-on process reveal the dynamic evolution of the surface thermal field over time. At the initial stage of power-on, the overall temperature distribution of the equipment is relatively uniform, with no significant thermal concentration areas observed. As the power-on duration increases, heat generated by the internal source gradually accumulates, resulting in the emergence of an elliptical high-temperature region at the center of the equipment surface. Heat diffuses outward from the center, forming a typical radial thermal diffusion pattern. During this process, the temperature gradient gradually decreases from the center toward the edges, indicating that the spatial extent of the concentrated heat source is expanding. Consequently, the thermal field of the equipment transitions from a locally non-uniform distribution to a globally distributed pattern.

Figure 5.
Evolution of the surface thermal field of the enclosure.
Figure 6 illustrates the variation in the thermal field of the flameproof junction box during operation. The red triangle in Figure 6 indicates the location of the highest temperature point. A comparison between Point 1 in Figure 6a and Point 2 in Figure 6b shows that the location of the maximum enclosure temperature consistently corresponds to the area directly above the primary internal heat-generating component. However, its exact position shifts with changes in the operating state. This phenomenon indicates that the surface thermal field of the enclosure is influenced by the coupling of multiple internal heat sources. When local heat generation increases or the thermal resistance path changes, the distribution of heat is correspondingly redistributed, resulting in the migration of the maximum temperature point.
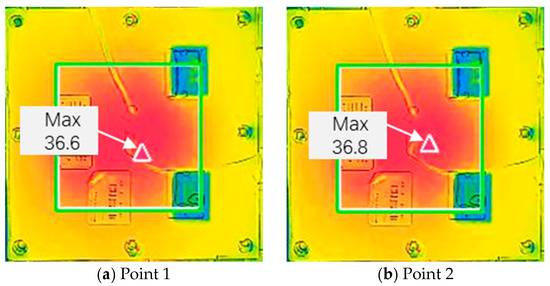
Figure 6.
Variation in the maximum temperature point on the enclosure surface.
4. Cross-Media Infrared Temperature Rise Measurement Method
The non-contact measurement method for temperature rise across media consists of a multi-source data sensing method and a temperature rise prediction model, with the latter serving as the core of the approach. Unlike traditional single-source sensing methods, the multi-source data sensing method captures a more comprehensive set of temperature rise characteristics. Among them, infrared thermography measurement provides full-field thermal information of the equipment, enabling more accurate determination of the maximum enclosure temperature. By incorporating both the equipment operating current and the environmental temperature, the accuracy and generalizability of the temperature rise measurement are significantly improved.
Moreover, the temperature rise prediction is transitioned from a single model to a fusion model, enhancing the system’s capability to respond to complex temperature rise dynamics. In this framework, support vector regression (SVR) is employed as the main model to capture the primary trend, while Random Forest Regression (RFR) acts as the residual model to optimize the prediction by correcting the main trend.
4.1. Multi-Source Data Sensing Method
The multi-source data sensing method measures the surface temperature of the enclosure using an infrared thermal imager, which serves as the core sensing component. Based on the thermal radiation principle between infrared emissivity and surface temperature, the thermal imager captures images of the temperature distribution. After infrared image acquisition is completed, image processing algorithms are applied to extract thermal field features and identify the maximum temperature point on the enclosure, denoted as , which serves as the dominant variable for predicting the overall thermal state of the equipment.
To further improve the accuracy of temperature rise prediction and the model’s adaptability to environmental changes, other key thermal features during equipment operation are collected and analyzed. The equipment operating current and the environmental temperature are introduced as auxiliary feature variables. Together with the maximum enclosure temperature, they form a three-dimensional feature space: maximum enclosure temperature, operating current, and environmental temperature.
Among them, the operating current reflects the internal thermal load level of the equipment, serving as a primary factor affecting internal heat generation; the environmental temperature, as an external boundary condition, directly influences heat dissipation efficiency and plays a regulatory role in enclosure temperature. The interaction of these three factors jointly affects the evolution of the system’s thermal state and drives the change in temperature rise. These variables are combined to construct the feature space for cross-media infrared temperature rise measurement:
This feature vector enhances interpretability and data stability, serving as the input for the temperature rise prediction model.
4.2. Construction of the Temperature Rise Prediction Model
4.2.1. Temperature Rise Prediction Model Based on Support Vector Regression
Support Vector Regression (SVR) constructs a linear regression model in a high-dimensional space, enabling effective handling of complex nonlinear relationships between input and output variables. Therefore, in this study, a multi-input single-output prediction model is established using this method.
The Radial Basis Function is adopted as the kernel function. The model takes the maximum enclosure temperature, environmental temperature, and equipment operating current as inputs, and the maximum internal temperature as the output. The overall modeling framework is illustrated in Figure 7. The training dataset is defined as follows:
where is the input feature of the -th sample group, consisting of the maximum surface temperature of the enclosure, environmental temperature, and operating current; is the corresponding maximum internal temperature of the equipment.
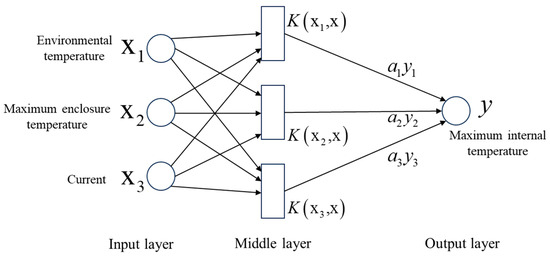
Figure 7.
Modeling structure of the SVR-based temperature rise prediction.
4.2.2. Temperature Rise Prediction Model Based on SVR–RFR Fusion
In the temperature rise experiments, SVR model exhibits two distinct adaptive behaviors when processing temperature rise data. During the slow-rise phase, SVR demonstrates strong nonlinear fitting capability and accurately captures temperature variation trends, achieving high prediction accuracy. However, during the rapid temperature rise phase, the hysteresis in the enclosure temperature response and the relatively weak external features make it difficult for the SVR model to capture the complex dynamic nonlinear characteristics, resulting in relatively large prediction errors, with the root mean square error (RMSE) reaching 3.667 °C and the mean absolute error (MAE) exceeding 1.616 °C in this specific stage.
To solve this problem, a RFR-SVR temperature rise prediction model based on SVR and RFR is proposed. The overall structure of the model is illustrated in Figure 8.

Figure 8.
Overall structure of the temperature rise prediction model.
The RFR-SVR model first uses SVR to learn the main trend relationship between the input features and the internal temperature. After obtaining the model’s prediction results, the residual is calculated as follows:
where is the actual temperature value, and is the predicted value of the SVR model.
The residual indicates that SVR is unable to effectively model local complex structures and dynamic nonlinear features. Then, the residual information is learned through RFR to construct a residual model. The fitting process of RFR for the residual can be expressed as follows:
where represents the prediction of the SVR residual by the RFR model, and represents the prediction of the residual by the -th regression tree in the forest, and is the number of trees in the random forest.
The final prediction result consists of two parts, as shown in Formula (13): the sum of the main model prediction and the residual model prediction.
where represents the final predicted value of the RFR-SVR model.
4.3. Model Performance Evaluation Method
To quantitatively evaluate the accuracy of model predictions compared to the true values, this study adopts four evaluation metrics: Root Mean Square Error (RMSE), Mean Absolute Error (MAE), Mean Absolute Percentage Error (MAPE), and the coefficient of determination (R2).
The equipment’s internal temperature values in the dataset are termed the true values. The RMSE is the average magnitude of the deviation between the predicted value and the true value, which reflects the actual size of the model error. The MAE represents the average absolute difference between predicted and true values, indicating the average deviation magnitude The MAPE is the average level to measure relative error. The coefficient of determination (R2) indicates the proportion of variance in the true values that can be explained by the model predictions. Its value ranges from 0 to 1, with values closer to 1 indicating better model performance. The calculation formulas are shown in Formulas (14)–(17).
5. Experiment
5.1. Temperature Rise Test and Dataset Construction
5.1.1. Experimental Platform and Protocol
The accuracy of surface temperature measurement via infrared thermography critically influences the reliability of predicting the internal temperature of equipment. To ensure measurement precision, the HIKMICRO TK20 infrared thermal imager was calibrated and validated through controlled experiments. Key measurement parameters were strictly configured according to the actual environmental conditions: ambient temperature was set to 23.1 °C, relative humidity to 60.7%, measurement distance to 0.9 m, and emissivity to 0.93 based on the painted surface coating material. Calibrated type-K thermocouples with an accuracy of 0.5 °C were mounted at specified locations on the equipment enclosure, while the thermal imager simultaneously captured temperature readings at the same points. As shown in Figure 9, the comparative results of temperature rise measurements indicate a peak deviation of 0.5 °C between the infrared thermal imager and the thermocouple readings, which meets the accuracy requirements for engineering applications.
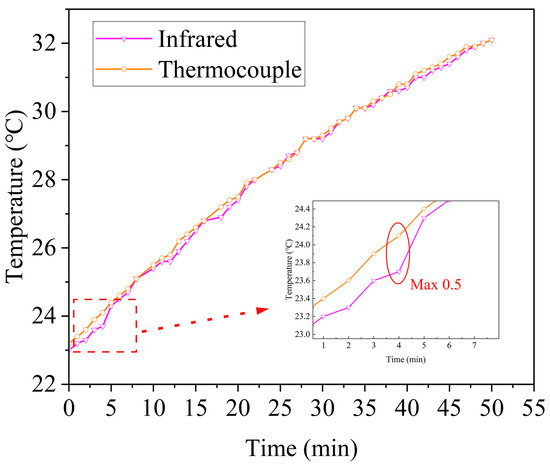
Figure 9.
Validation results of the infrared thermal imager.
The temperature rise test platform is shown in Figure 10. A flameproof junction box with a rated current of 100 A was selected as the test object, and 35 mm2 copper conductors were used for electrical connections. Infrared thermal imaging was used to locate high-temperature points inside the equipment. As shown in Figure 10a, the positions of the wiring terminals, input wires, and output wires were selected as temperature measurement points. The junction box was powered under a series of different current conditions (70 A, 85 A, 100 A, 115 A, 130 A) for testing.
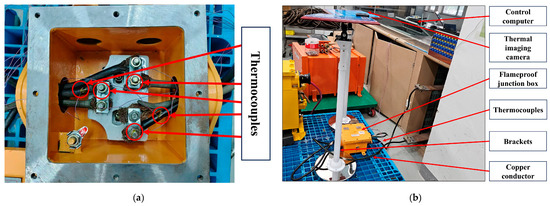
Figure 10.
The temperature rise test platform. (a) Thermocouple arrangement of traditional temperature rise test. (b) Experimental considerations field.
During the experiments, an infrared thermal imager was used to continuously monitor the surface temperature of the junction box enclosure in real time. Meanwhile, thermocouple sensors were installed at key internal locations of the equipment to collect internal temperature rise data, and environmental temperature sensors were arranged around the test platform to synchronously acquire environmental parameters.
To ensure the temporal consistency of the multi-source temperature data, the sampling frequency of all sensors was uniformly set, thereby ensuring the temporal alignment and comparability of the temperature rise data across different sensing channels.
5.1.2. Experimental Results and Analysis
As shown in the experimental results in Figure 11, colors (a), (b), (c), (d), and (e) represent the temperature rise curves under current levels of 70 A, 85 A, 100 A, 115 A, and 130 A, respectively.
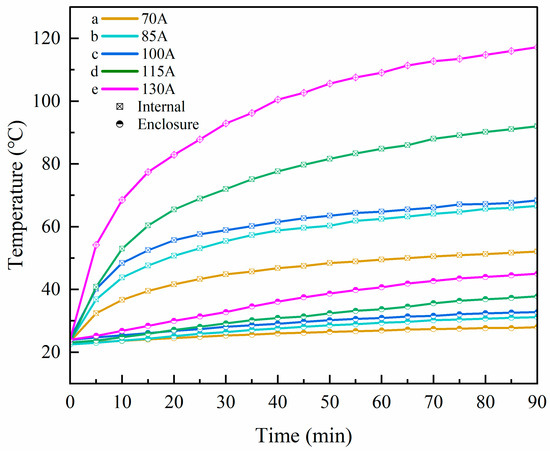
Figure 11.
Temperature rise curves under different current conditions.
Figure 11 presents comparative curves of the maximum enclosure temperature and maximum internal temperature over time under five different current conditions. Overall, under all test currents, both the enclosure and internal temperatures exhibit a synchronous rising trend. The internal temperature consistently exceeds the enclosure temperature, indicating that the primary heat source is concentrated within the internal conductor, and heat is transferred to the enclosure via thermal conduction paths.
As the current increases from 70 A to 130 A, both the internal and enclosure temperature curves shift upward, demonstrating a clear positive correlation between current intensity and temperature rise amplitude. In the early stage of each curve, a rapid temperature increase is observed, followed by a gradual stabilization, which is characteristic of the transition from transient to steady-state heat transfer.
Particularly during the initial power-on phase, the heat generated by the internal heat source has not yet fully transferred to the enclosure, and the system remains in a non-steady-state heat transfer condition. The internal temperature responds more rapidly to the heat source, while the enclosure temperature exhibits a noticeable thermal lag effect. As the power-on process continues, the temperature distribution stabilizes, and the system gradually transitions into a steady-state heat transfer phase, where the heat flux and temperature gradient become constant, and the enclosure temperature curve flattens.
The experimental results demonstrate the typical thermal inertia characteristics of coal mine electrical equipment. As part of the thermal conduction path, the enclosure acts as a “thermal delay layer” during heat transfer, with its temperature rise response consistently lagging behind the internal temperature.
5.1.3. Dataset Construction
For the training and prediction of the temperature rise prediction model, the temperature rise data obtained from the experiments were used as the dataset. During training, 80% of the data was randomly selected as the training set, while the remaining 20% was used as the testing set.
To enhance the generalization capability of the regression model and mitigate potential overfitting due to limited variability in input features, data augmentation was implemented through feature perturbation. Considering that environmental temperature and operating current naturally exhibit fluctuations in real-world operating conditions, Gaussian noise with a mean of 0 and a standard deviation (std) of 1 was added to these two features to simulate their variation.
In contrast, the maximum enclosure temperature, which is strongly correlated with the target variable—the maximum internal temperature—was treated as key information and thus not subjected to perturbation.
To evaluate the effectiveness of data augmentation, the model’s input data was subjected to different magnitudes of perturbation before and after augmentation. The impact was assessed by analyzing the RMSE and the distribution of prediction errors.
5.2. Temperature Rise Prediction Model Training and Evaluation
5.2.1. Effectiveness of Data Augmentation
As shown in the line chart in Figure 12, which compares the robustness of the model before and after data augmentation, the RMSE varies with the standard deviation of input perturbation ranging from 0 to 2. The results indicate that the RMSE of the model without data augmentation increases significantly by more than 20 °C under input noise, whereas the model with data augmentation is far less affected, with RMSE remaining below 5 °C, demonstrating strong robustness against noise.
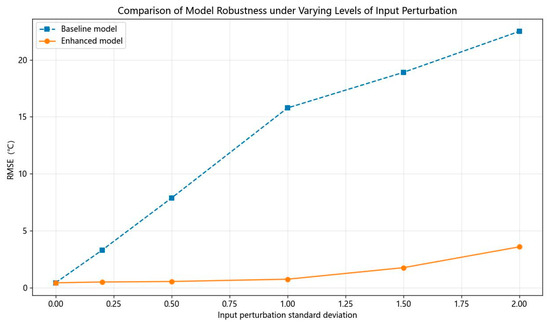
Figure 12.
Comparison of model robustness before and after data augmentation under varying input perturbation.
Figure 13 presents box plots illustrating the prediction error distributions under varying levels of input perturbation. The line within each box represents the median of the data. The median of the enhanced model remains consistently close to 0 °C across all conditions. In contrast, while the baseline model exhibits a median error near 0 °C when no perturbation is applied, its median increases to approximately 2.1 °C, 4.4 °C, and 6.0 °C at standard deviation levels of 0.5, 1.0, and 1.5, respectively. As the standard deviation of the perturbation increases, the model trained without data augmentation shows a higher median, a broader range of concentrated prediction errors, and a considerable number of extreme outliers. On the other hand, the model trained with data augmentation maintains a median error close to 0 °C and a tightly clustered error distribution, even under high noise levels.
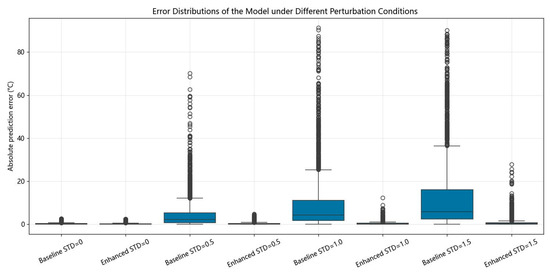
Figure 13.
Prediction error distribution before and after data augmentation.
These results demonstrate that data augmentation significantly enhances the anti-interference capability and practical applicability of the prediction model in engineering scenarios.
5.2.2. Model Evaluation
The evaluation results of the SVR model and the RFR-SVR temperature rise prediction model are shown in Table 2.

Table 2.
Comparison of model evaluation indexes.
The SVR model has a cross-validation average R2 = 0.989, and a test set R2 = 0.989. The standard deviation of R2 for both cross-validation and the test set is 0, excluding the risk of overfitting. The MAPE is 2.719%, the RMSE is 2.848 °C, and the MAE is 1.351 °C. The RMSE exceeds the MAE by more than 1.4 °C, indicating the presence of some samples with large errors. This suggests that the generalization capability of the SVR model is relatively poor. As shown in Figure 14, the temperature prediction comparison of the SVR model on the test set shows a significant discrepancy between the predicted and actual values when the maximum internal temperature is below 40 °C. This phenomenon is consistent with the analysis of the enclosure’s temperature rise dynamic response. Due to thermal inertia, during the first stage of the slow temperature rise, the enclosure’s temperature change is small, while the internal temperature change is large. The complex nonlinear relationship between the enclosure and internal temperature rise makes it difficult for the SVR model to learn effectively.
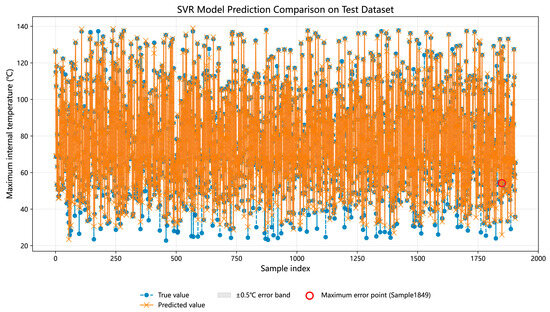
Figure 14.
Comparison of training and testing results of the SVR temperature rise prediction model.
Although the SVR model shows high R2 values in cross-validation and can fit the overall data trend well, it exhibits significant bias for some samples, especially in the low-temperature range, where the prediction error increases sharply. Therefore, the RFR-SVR model, which integrates RFR and SVR, was constructed. By incorporating the strong nonlinear feature learning mechanism of RFR, the model reduces local errors and optimizes overall prediction performance.
As shown in Table 2, the RFR-SVR model has a cross-validation average R2 = 0.999 and a test set R2 = 0.999, with an R2 standard deviation of 0 for both cross-validation and the test set, thus excluding the risk of overfitting. The MAPE is 0.802%, the RMSE is 0.741 °C, and the MAE is 0.464 °C. The small difference between the RMSE and MAE indicates the absence of large error samples. As shown in Figure 15, the temperature prediction comparison of the RFR-SVR model on the test set demonstrates that the RFR-SVR model significantly outperforms the SVR model, especially addressing the issue of high temperature prediction error in the low-temperature range seen in the SVR model.
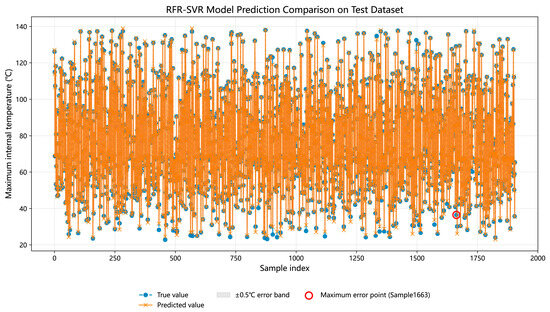
Figure 15.
Comparison of training and testing results of the RFR-SVR temperature rise prediction model.
To further validate the error distribution of the models, a comparative analysis was conducted on the prediction error distribution histograms, residual distribution plots, and cumulative distribution function (CDF) plots of the two models on the test set.
As shown in Figure 16, the model prediction error distribution histogram, in Figure 16a, the prediction errors of the SVR model are mainly concentrated within the ±5 °C range, with an average error of 0.238 °C. However, the distribution shows a significant right skew, with multiple samples having errors greater than 10 °C. Figure 16b shows the prediction error distribution of the RFR-SVR model. Compared to Figure 16a, the error distribution of the RFR-SVR model is more concentrated near zero, mainly within the ±2 °C range. The number of extreme error samples is significantly reduced, and the average error is −0.016 °C. This indicates that the RFR-SVR model effectively reduces the prediction errors while maintaining its ability to fit the main trend, with a more compact and balanced error distribution, demonstrating greater overall stability.
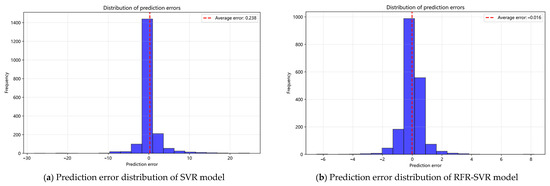
Figure 16.
Distribution histogram of model prediction errors.
As shown in Figure 17, the model prediction residual distributions are presented. In Figure 17a, the residuals of the SVR model fluctuate within ±10 °C for most samples, However, notable outliers are observed, with some residuals exceeding 20 °C, indicating a fitting bias for certain data points. In contrast, Figure 17b shows the residual distribution of the RFR-SVR model, which is more concentrated. Most residuals fall within the ±2 °C range, which is much narrower than that of the SVR model. Although a few large error points remain, none exceed 10 °C, and the number of extreme residuals is significantly reduced, demonstrating improved robustness and overall prediction stability.

Figure 17.
Distribution plot of model prediction residuals.
Figure 18 shows the CDF of the prediction errors for the SVR and RFR-SVR models. In Figure 18a, the CDF value for the SVR model at the 1 °C threshold is 69.5%, indicating that approximately 70% of the predicted samples have an error below 1 °C. However, a considerable proportion of samples still exhibit large prediction errors. In contrast, Figure 18b shows that the CDF value for the RFR-SVR model at the 1 °C threshold reaches 90.3%, indicating that most samples have errors within 1 °C. These results demonstrate that the RFR-SVR model achieves better prediction accuracy and overall stability compared to the SVR model.
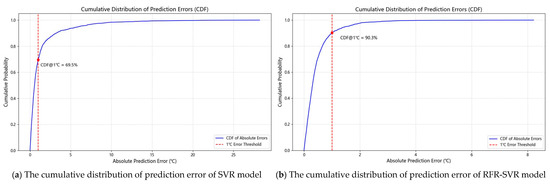
Figure 18.
Cumulative distribution plot of model prediction errors.
In summary, the RFR-SVR model, the core module of the cross-media infrared temperature rise measurement method, demonstrates superior performance in temperature prediction compared to the SVR model. While maintaining high fitting accuracy, the model effectively converges the error distribution range, with the prediction errors mainly concentrated within ±2 °C, and the probability of extreme errors significantly reduced. The residual plot shows more minor error fluctuations and a more uniform distribution structure. The CDF indicates that more than 90% of the samples have a prediction error below 1 °C, a significant improvement over the 69.5% achieved by the traditional SVR model, verifying the model’s robustness and generalization ability. Therefore, the RFR-SVR model is more suitable for temperature rise prediction scenarios under complex conditions.
To evaluate the prediction residuals of the RFR–SVR model, distribution diagnostics were performed on the prediction residuals from the test set. As shown in Figure 19, the normal-overlaid residual histogram (Figure 19a) reveals that errors are tightly clustered around zero with a sharper peak than the Gaussian reference, indicating a leptokurtic distribution. The quantile–quantile (Q–Q) plot (Figure 19b) closely follows the reference line across the central quantiles, demonstrating near-normality in the central region, while systematic S-shaped deviations are observed in both tails. This combination of a sharp central peak and tail deviations is consistent with a mixture of operating regimes: the majority of samples correspond to low-noise steady states, while a small number of extreme or transient conditions produce heavier tails and mild skewness. Such behavior is typical in engineering datasets and has a negligible impact on the overall model performance.
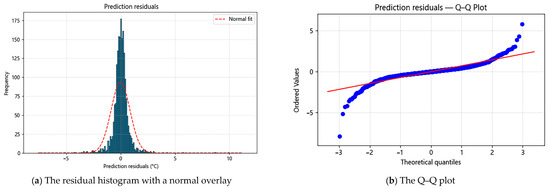
Figure 19.
Distributional diagnostics of the test-set residuals for the RFR–SVR model.
5.2.3. Uncertainty Propagation Analysis
To validate the data augmentation scheme involving mutually independent perturbations applied to ambient temperature and operating current, and to quantify the impact of input fluctuations on the predicted value , an approximate uncertainty propagation analysis was conducted using the first-order delta method. Local sensitivity coefficients were computed via symmetric finite differences, from which the combined standard uncertainty was derived as follows:
Analysis of the test set yields a median combined standard uncertainty of . Using a conventional coverage factor of k = 2 (corresponding to approximately 95% coverage), the expanded uncertainty is . Although this expanded uncertainty is greater than the RFR-SVR model’s RMSE, it remains entirely acceptable for engineering applications such as temperature rise monitoring of coal mine electrical equipment.
The cross-media infrared temperature rise measurement method proposed in this paper is very feasible for the temperature rise testing of electrical equipment in coal mines, providing theoretical support for intelligent and efficient temperature rise measurement.
6. Conclusions
- (1)
- This study establishes an integrated framework for temperature rise monitoring in coal mine electrical equipment, incorporating multi-source sensing, non-contact measurement, and hybrid machine learning-based prediction. The proposed cross-media infrared method achieves high accuracy under varying current conditions, with an RMSE of 0.741 °C, MAE of 0.464 °C, and MAPE of 0.802%, while 90.3% of prediction errors lie within ±1 °C, demonstrating strong suitability for continuous and reliable monitoring.
- (2)
- A novel cross-media measurement principle is introduced, which utilizes the enclosure surface temperature to infer internal heat source temperature through explicit modeling of multi-medium heat transfer mechanisms. This approach provides a physical and theoretical foundation for non-contact, data-driven temperature estimation in complex electrical equipment.
- (3)
- A multi-source data perception method is proposed, and a hybrid temperature rise prediction model integrating Support Vector Regression (SVR) and Random Forest Regression (RFR) is established. The combination of the multi-source sensing approach and the hybrid prediction model effectively overcomes the thermal hysteresis of the enclosure and the low accuracy of traditional modeling in the low-temperature range, significantly improving the prediction accuracy of the maximum internal temperature rise.
- (4)
- The proposed methodology offers a practical and powerful tool for temperature rise assessment in coal mine settings, enabling enhanced thermal management and contributing to safer design, operational reliability, and intelligent safety-focused mining operations.
- (5)
- Experimental results confirm the feasibility and effectiveness of the proposed infrared-based non-contact monitoring approach. While this study has preliminarily examined uncertainty propagation under data augmentation conditions, a more comprehensive uncertainty quantification framework that incorporates model uncertainty, sensor measurement errors, and environmental variability will be established in future research. Further efforts will also focus on enhancing data processing efficiency and developing dynamic trend prediction models to enable real-time early warning and proactive safety management.
Author Contributions
Conceptualization, X.X.; Data curation, E.Z. and F.C.; Formal analysis, Q.M. and Y.T.; Funding acquisition, H.Z. and X.X.; Investigation, Q.M. and Y.T.; Methodology, X.X., H.Z. and F.C.; Project administration, X.X. and H.Z.; Supervision, X.X. and Q.M.; Validation, Y.T. and F.C.; Visualization, J.Y. and E.Z.; Writing—original draft, J.Y.; Writing—review and editing, X.X. All authors have read and agreed to the published version of the manuscript.
Funding
The funding was supported by National Key Research Development Program Young Scientists Project of China, 2022YFF0605300, and Shaanxi Provincial Department of Education serves local special—industrialization cultivation project, 23JC048.
Data Availability Statement
The datasets generated during and analyzed during the current study are not publicly available due to the data being part of ongoing research but are available from the corresponding author on reasonable request. Correspondence and requests for materials should be addressed to J.Y.
Conflicts of Interest
Author H.Z. and F.C. were employed by the company CCTEG Shenyang Research Institute. Author Y.T. was employed by the company CCTEG Intelligent Storage Technology Co., Ltd. The remaining authors declare that the research was conducted in the absence of any commercial or financial relationships that could be construed as a potential conflict of interest.
References
- Wang, G.; Ren, H.; Fu, J. Challenge and path of high-quality development of coal mine intelligent construction. Coal Sci. Technol. 2025, 53, 1–18. [Google Scholar]
- Yuan, Z.; Jiang, Q.; Pang, Z. Application status and development thinking of intelligent mining technology and equipment in coal mines in China. Coal Sci. Technol. 2024, 52, 188–197. [Google Scholar]
- Siddiqui, M.A.H.; Akhtar, S.; Chattopadhyaya, S.; Sharma, S.; Kumar, A.; Abbas, M. 611 Universal Drilling Machine Reliability Modeling and Performance Evaluation in Subterranean Coal Mines. Rock Mech. Rock Eng. 2024, 57, 3559–3575. [Google Scholar] [CrossRef]
- Wang, G. New technological progress of coal mine intelligence and its problems. Coal Sci. Technol. 2022, 50, 1–27. [Google Scholar]
- Cao, X.; Duan, Y.; Wang, G.; Zhao, J.; Ren, H.; Zhao, F.; Yang, X.; Zhang, X.; Fan, H.; Xue, X. Research review on life-cycle health management and intelligent maintenance of coal mining equipment. J. China Coal Soc. 2025, 50, 694–714. [Google Scholar]
- GB/T 3836.1-2021; Explosive Atmospheres-Part 1: Equipment-General Requirements. Standards Press of China: Beijing, China, 2021.
- GB/T 14048.1-2023; Low-Voltage Switchgear and Controlgear-Part 1: General Rules. Standards Press of China: Beijing, China, 2023.
- Krause, T.; Bewersdorff, J.; Markus, D. Investigations of static and dynamic stresses of flameproof enclosures. J. Loss Prev. Process Ind. 2017, 49, 775–784. [Google Scholar] [CrossRef]
- Xia, H.; Guan, Y.; Yu, Z.; Cai, S.; Wang, X.; Peng, Z.; Gao, S.; Huang, Z. Temperature rise test and analysis of high current switchgear in distribution system. J. Eng. 2019, 2019, 754–757. [Google Scholar] [CrossRef]
- Zhang, H.; Li, Z.; Zhao, X.; Tu, Q. Mechanism of Temperature Rise of Coal Mine Explosion-proof Electrical Apparatus and Design of Inspection Device. Coal Technol. 2022, 41, 190–192. [Google Scholar]
- Xu, Y.; Shen, H.Z.; Wan, L.; Lu, B. Automatic Measurement and Control System of Temperature Rise Test for the Power Electronic Transformers. Appl. Mech. Mater. 2015, 734, 935–940. [Google Scholar] [CrossRef]
- Hou, F.; Zhang, Y.; Zhou, Y.; Zhang, M.; Lv, B.; Wu, J. Review on infrared imaging technology. Sustainability 2022, 14, 11161. [Google Scholar] [CrossRef]
- Jadin, S.; Taib, S. Recent progress in diagnosing the reliability of electrical equipment by using infrared thermography. Infrared Phys. Technol. 2012, 55, 236–245. [Google Scholar] [CrossRef]
- Wang, Z.; Miao, X.; Zhang, Z.; Zhuang, S. Multi-point area array temperature measurement and abnormal temperature rise identification method for switchgear busbar. J. Fuzhou Univ. 2023, 51, 790–797. [Google Scholar]
- Sebok, M.; Gutten, M. Thermovision Diagnostics of Electrical Machines. J. Int. Sci. Publ. Mater. Methods Technol. Online 2020, 14, 124–130. [Google Scholar]
- Dit Leksir, Y.L.; Mansour, M.; Moussaoui, A. Localization of thermal anomalies in electrical equipment using Infrared Thermography and support vector machine. Infrared Phys. Technol. 2018, 89, 120–128. [Google Scholar] [CrossRef]
- Chen, S.; Liu, Y.; Yan, Y.; Qian, Q.; Deng, J.; Jiang, X. Inversion and Localization of Turn-to-turn Short-circuit Faults in 10 kV Oil-immersed Transformers. High Volt. Eng. 2023, 49, 1870–1881. [Google Scholar]
- Anthony, D.; Sarkar, D.; Jain, A. Contactless, non-intrusive core temperature measurement of a solid body in steady-state. Int. J. Heat Mass Transf. 2016, 101, 779–788. [Google Scholar] [CrossRef]
- Anthony, D.; Sarkar, D.; Jain, A. Non-invasive, transient determination of the core temperature of a heat-generating solid body. Sci. Rep. 2016, 6, 35886. [Google Scholar] [CrossRef] [PubMed]
- Anthony, D.; Wong, D.; Wetz, D.; Jain, A. Non-invasive measurement of internal temperature of a cylindrical Li-ion cell during high-rate discharge. Int. J. Heat Mass Transf. 2017, 111, 223–231. [Google Scholar] [CrossRef]
- Fjeld, E.; Rondeel, W.G.; Attar, E.; Singh, S. Estimate the temperature rise of medium voltage metal enclosed switchgear by simplified heat transfer calculations. IEEE Trans. Power Deliv. 2020, 36, 853–860. [Google Scholar] [CrossRef]
- Li, Q.; Cong, H.; Xing, J.; Qi, B.; Li, C. On-line temperature monitoring of the GIS contacts based on infrared sensing technology. J. Electr. Eng. Technol. 2014, 9, 1385–1393. [Google Scholar] [CrossRef]
- Hajialibabaei, M.; Saghir, M.Z. Experimental Study on Heat Transfer Performance of FKS-TPMS Heat Sink Designs and Time Series Prediction. Energies 2025, 18, 3459. [Google Scholar] [CrossRef]
- Nasir, V.; Kooshkbaghi, M.; Cool, J.; Sassani, F. Cutting tool temperature monitoring in circular sawing: Measurement and multi-sensor feature fusion-based prediction. Int. J. Adv. Manuf. Technol. 2021, 112, 2413–2424. [Google Scholar] [CrossRef]
- Wang, J.; Ou, J.; Fan, Y.; Cai, L.; Zhou, M. Online monitoring of electrical equipment condition based on infrared image temperature data visualization. IEEJ Trans. Electr. Electron. Eng. 2022, 17, 583–591. [Google Scholar] [CrossRef]
- Sahu, N.; Azad, C.; Kumar, U. Construction of hybrid models based on cascade technique using basic machine learning models: An application as photocurrent density predictor of the photoelectrode in PEC cell. Mater. Today Commun. 2024, 41, 110643. [Google Scholar] [CrossRef]
- Asteris, P.G.; Skentou, A.D.; Bardhan, A.; Samui, P.; Pilakoutas, K. Predicting concrete compressive strength using hybrid ensembling of surrogate machine learning models. Cem. Concr. Res. 2021, 145, 106449. [Google Scholar] [CrossRef]
- Zhou, Q.; Guo, Y.; Xu, K.; Chai, B.; Li, G.; Wang, K.; Dong, Y. Research on the prediction algorithm of aero engine lubricating oil consumption based on multi-feature information fusion. Appl. Intell. 2024, 54, 11845–11875. [Google Scholar] [CrossRef]
- Zhao, M.; Fan, Y.; Ge, J.; Hao, X.; Wu, C.; Ma, X.; Du, S. Hybrid Prediction Model of Burn-Through Point Temperature with Color Temperature Information from Cross-Sectional Frame at Discharge End. Energies 2025, 18, 3595. [Google Scholar] [CrossRef]
- Bedkowski, M.; Smolka, J.; Banasiak, K.; Bulinski, Z.; Nowak, A.J.; Tomanek, T.; Wajda, A. Coupled numerical modelling of power loss generation in busbar system of low-voltage switchgear. Int. J. Therm. Sci. 2014, 82, 122–129. [Google Scholar] [CrossRef]
- Szulborski, M.; Łapczyński, S.; Kolimas, Ł. Thermal analysis of heat distribution in busbars during rated current flow in low-voltage industrial switchgear. Energies 2021, 14, 2427. [Google Scholar] [CrossRef]
- Song, S.; Guo, X. Boussinesq Approximation and Numerical Simulation of Natural Convection in a Closed Square Cavity. Chin. Q. Mech. 2012, 33, 60–67. [Google Scholar]
- Yang, F.; Hu, X.; Wang, P. Study on Temperature Rise Calculation and Reduced-Order Model of Oil-Immersed Transformer with Field-Circuit Coupling. Trans. China Electrotech. Soc. 2025, 40, 4071–4084. [Google Scholar]
- ASTM E1933-14 (2022); Standard Practice for Measuring and Compensating for Emissivity Using Infrared Imaging Radiometers. ASTM International: West Conshohocken, PA, USA, 2022.
Disclaimer/Publisher’s Note: The statements, opinions and data contained in all publications are solely those of the individual author(s) and contributor(s) and not of MDPI and/or the editor(s). MDPI and/or the editor(s) disclaim responsibility for any injury to people or property resulting from any ideas, methods, instructions or products referred to in the content. |
© 2025 by the authors. Licensee MDPI, Basel, Switzerland. This article is an open access article distributed under the terms and conditions of the Creative Commons Attribution (CC BY) license (https://creativecommons.org/licenses/by/4.0/).