Abstract
Progressive climate change and the increasing concentration of carbon dioxide in the atmosphere represent one of the most serious challenges facing modern energy systems. At the same time, the global overproduction of plastics, particularly polyethylene terephthalate (PET), places a significant burden on the natural environment and waste management infrastructure. Electrochemical reactors offer a promising solution by enabling the simultaneous conversion of CO2 and EG into valuable products such as carbon monoxide and glycolic acid, using electricity derived from renewable energy sources. Carbon monoxide can be further processed into high-energy synthetic fuels, such as propanol, while glycolic acid holds substantial importance in the pharmaceutical and plastics industries. An economic analysis was conducted to estimate the capital expenditures required for an electrochemical reactor and to assess the investment’s profitability based on the net present value (NPV) indicator. In addition, a Life Cycle Assessment (LCA) was carried out to evaluate the environmental impact of the proposed technology, with particular attention to its carbon footprint. The results indicate that the profitability of the system strongly depends on the market price and purity of glycolic acid, as well as on access to low-cost renewable electricity. The LCA confirms a significantly lower carbon footprint compared to conventional CO production, though further technological advancements are required for industrial deployment.
1. Introduction
The increase in greenhouse gas concentrations, particularly carbon dioxide, is contributing to progressive climate change worldwide. Carbon dioxide accounts for approximately 70% of total emissions and reducing it is one of the most important challenges of the 21st century [1,2]. In 2024, total emissions related to the energy sector increased by 0.8%, reaching an all-time high of 37.6 Gt CO2. The concentration of CO2 in the atmosphere was 422.5 ppm, 3 ppm higher than in 2023. The biggest impact on the global increase in carbon dioxide emissions is the rising emissions of natural gas [3,4,5]. Figure 1 shows global CO2 emissions from energy and industry and their change between 1900 and 2024. In 1900, CO2 emissions amounted to approximately 2.0 Gt CO2, and a hundred years later, they had risen to 24.6 Gt CO2. Over the last 24 years, there has been a dramatic increase of almost twofold.
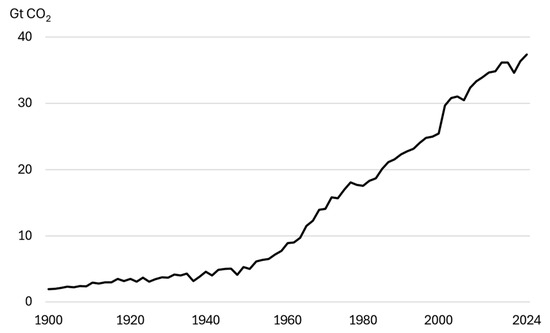
Figure 1.
Global CO2 emissions from energy and industrial processes between 1900 and 2024 [3].
Reducing carbon dioxide emissions has become one of the most important challenges facing the world and society in the 21st century. Many national, international, and EU documents and agreements have been drawn up to reduce greenhouse gas emissions. The most important of these include the Kyoto Protocol, which was adopted in 1997 [6,7]. It was the first international agreement obliging developed countries to reduce greenhouse gas emissions by an average of 5% compared to 1990 levels. This provision was in force during the first accounting period from 2008 to 2012. Another important step towards reducing greenhouse gases was the signing of the Paris Agreement in 2015 during the UN Climate Change Conference (COP21) [8,9]. The agreement came into force on 4 November 2016, when it was ratified by 55 countries responsible for at least 55% of global greenhouse gas emissions. Its most important goal is to keep the average global temperature rise well below 2 °C above pre-industrial levels and to strive to limit the temperature rise to 1.5 °C, which is considered an even more ambitious climate goal [10]. In response to global climate challenges, the European Union presented the European Green Deal in 2019 [11,12]. This plan aims to transform the European economy, energy, transport, and industry towards greater sustainability. Its goal is to achieve climate neutrality by 2050. As part of this initiative, the Fit for 55 legislative package was adopted in 2021, which aims to reduce greenhouse gas emissions by at least 55% by 2030 compared to 1990 levels [13,14]. One of the key elements of the EU strategy is to support carbon capture and utilization technologies, which is why the CCS Directive (2009/29/EC) was introduced in 2009. The directive on the geological storage of CO2 establishes a regulatory framework for the safe capture, transport, storage, and utilization of carbon dioxide in the European Union [15].
Direct Air Capture (DAC), Carbon Capture and Storage (CCS), and Carbon Capture and Utilization (CCU) technologies are key elements of global efforts to mitigate climate change. The aim of these technologies is not only to reduce greenhouse gas emissions into the atmosphere but also to convert carbon dioxide into products with positive value [16,17,18]. These technologies are designed to capture carbon dioxide directly from emission sources such as industrial plants and power stations. The captured carbon dioxide can be stored or used in further processes, e.g., to support oil extraction or to produce various chemicals such as carbon monoxide (CO) [19].
The electrochemical conversion of carbon dioxide to carbon monoxide is one of the most promising methods for converting CO2 into products with high utility value [20,21]. The resulting carbon monoxide can be used to produce synthetic fuels such as methanol, ethanol, and propanol. It is also used in industrial chemistry to produce aldehydes or carboxylic acids, as well as in pharmaceuticals. Additionally, these processes can be integrated with renewable energy sources, which increases their sustainability.
The authors of the study [22] presented an innovative approach to photoelectrochemical CO2 reduction, in which a concentrated photovoltaic cell was integrated with a zero-gap reactor with heat management. By using the anode stream for heat transfer, a synergistic effect was achieved, improving the efficiency of the process on both sides of the system. For the first time, sunlight concentration of up to 450 suns was used, which allowed a partial CO production current of 4 A and a current density of 150 mA cm−2 to be achieved, with a CO production selectivity of over 90%. Under optimal conditions, the solar-to-CO conversion efficiency was 17%, and the total solar-to-fuel efficiency reached 19%. This work represents the first demonstration of CO2 reduction under high light concentration conditions, opening up prospects for efficient and scalable solar fuel production.
In publication [23], the authors analyzed a device for reducing carbon dioxide by integrating a photovoltaic module with an electrochemical cell. A device was developed that combines a dye-sensitized solar module (based on a mesoporous titanium dioxide photoanode) with an electrochemical cell equipped with a copper–tin cathode, where a common platinum electrode acts as the cathode for the photovoltaic module and the anode for the electrochemical reactor. The system achieved a stable current of 3.6 mA under continuous exposure to sunlight, producing 80 mmol of carbon monoxide per day with a solar-to-fuel conversion efficiency of 0.97%. The results demonstrate the effective integration of both systems and the possibility of continuous solar fuel production.
As with carbon dioxide emissions, the problem of excessive production and insufficient management of plastics, particularly polyethylene terephthalate (PET), poses a major environmental challenge. Due to their properties, low price, light weight, and durability, plastics have become an integral part of the modern economy and everyday life [24,25]. The increasing amount of plastic waste is linked to the use of short-lived products, including packaging and single-use items. Approximately 40% of global plastic production goes to the packaging sector, which is the largest market for its use. Single-use plastics are also very important in healthcare, including as personal protective equipment, syringes, prostheses and implants, or sterile packaging [24], [26]. Despite a growing awareness of recycling, only a small proportion of the plastics produced are recycled, which means that a large proportion of them end up in the natural environment.
In 2022, global plastic production amounted to 400.3 Mt, of which 6.2% was PET [27]. There are several methods for disposing of PET waste: mechanical and chemical recycling, as well as incineration and landfilling of this waste. Mechanical methods include, among others, processing and melting PET bottles to produce new plastic bottles [28,29]. Chemical recycling, unlike mechanical recycling, allows the structure of PET to be changed by breaking it down into its original chemical compounds, which allows them to be used to produce new materials. This is known as upcycling, which enables the production of products with a higher utility value than the original material. Although it is still in the early stages of development, this method is very promising in the context of recycling.
The authors of publication [30] presented the process of complete conversion of PET waste into PGA polyglycolic through the stepwise conversion of ethylene glycol (EG) into glycolic acid in an electrochemical process. The catalyst used was a AuPd alloy, which allowed for very high glycolic acid (GA) selectivity of approximately 94% and process stability reaching 1000 h at a current density above 1 A/cm2. The authors also demonstrated the possibility of practical application by converting raw EG isolated from PET bottles into GA in a reactor of their own design, with simultaneous hydrogen production. The resulting glycolic acid was further converted to PGA by polymerization. A preliminary techno-economic analysis showed a potential profit of 5475.6 USD/t of product, which highlights the high profitability and environmental significance of the proposed technology.
In publication [31], the authors analyzed different pathways for upcycling PET into valuable chemicals, particularly ethylene glycol. The study focused on two main routes to produce ethylene glycol: alkaline hydrolysis and hydrogenolysis. Although both pathways are technically feasible, they result in substantial environmental impacts, primarily due to high greenhouse gas (GHG) emissions, which offset the potential benefits of PET upcycling. According to [31], the global warming potential (GWP) associated with the alkaline hydrolysis of PET is 74.59 kg CO2-eq per kg of PET upcycled. In contrast, hydrogenolysis shows a substantially lower GWP of 5.78 kg CO2-eq per kg of PET upcycled, also yielding 0.3 kg of ethylene glycol. Despite the differences in climate impact, both methods exhibit low ethylene glycol yields (0.3 kg per kg of PET) and are currently not viable for supplying the required feedstock to a system such as the PV-EC reactor. Additionally, the upcycling routes considered in the paper are still at the pilot scale, lacking commercial application. As a result, this study adopts the conventional production of ethylene glycol as a more practical alternative.
In the future, once PET upcycling technologies reach a higher Technology Readiness Level (TRL) and lower impacts, they will be included in the Life Cycle Assessment (LCA) framework to provide a more comprehensive assessment of their environmental impacts and potential benefits.
A novelty of the presented research is the combination of economic analysis and Life Cycle Assessment for an innovative photoelectrochemical reactor that enables the simultaneous conversion of carbon dioxide and ethylene glycol into valuable chemical products. Unlike previous work, which has focused mainly on technological and process aspects, this publication presents a quantitative assessment of the investment’s profitability using the NPV indicator and a carbon footprint analysis based on a mathematical model. The research is the first step towards the implementation of a tandem of two reactors (electrochemical and photoelectrochemical), which, powered by renewable energy sources, will produce propanol from CO2 and convert EG into glycolic acid.
2. Methodology
The economic analysis was carried out in accordance with the previously adopted calculation methodology. An integrated Life Cycle Assessment approach was employed to quantify the baseline climate change impact and follows the International Organization for Standardization (ISO) 14,040 and ISO 14,044 standards [32,33]. The LCA framework was aligned with the economic analysis model, ensuring consistency across system boundaries and input parameters. The methodology used for the LCA is defined in the Supporting Material.
The net present value (NPV) represents the sum of cash flows discounted individually for each year over the entire analysis period, based on a known discount rate:
where
- —cash flow in year t, ;
- —weighted average cost of capital, ;
- —subsequent year of the investment project, starting from the beginning of construction (t = 0), ;
- —project duration.
Net cash flows in year t:
where
- —investment cost, ;
- —revenues from sales, ;
- —costs ;
- —decommissioning, .
Assuming that the investment is made in year 0 and that decommissioning occurs in the year following the end of operation ,
The investment cost can be defined as the product of the unit investment cost and the installed power of the reactor:
where
- —unit investment cost, ;
- —power of the installation, ;
- —cost of equity capital, ;
- —cost of loan, .
Weighted average cost of capital can be expressed as
where
- —loan interest rate, ;
- —cost of equity capital, ;
- —income tax (flat), .
The cost of equity capital is given by
where
- —risk-free interest rate, ;
- —risk factor, ;
- —market return rate, .
Revenues from sales represent the sum of revenues from glycolic acid and carbon monoxide sales:
where
- —revenue from glycolic acid sales, ;
- —revenue from carbon monoxide sales, ;
The revenue from glycolic acid sales can be expressed as the product of the glycolic acid price, the glycolic acid mass flow rate, and the reactor operating time:
where
- —price of glycolic acid, ;
- —mass flow rate of glycolic acid, ;
- —reactor operating time per year, .
The revenue from carbon monoxide sales can be expressed as the product of the carbon monoxide price, the carbon monoxide mass flow rate, and the reactor operating time:
where
- —price of carbon monoxide, ;
- —mass flow rate of carbon monoxide, .
Total costs are the sum of operating costs and income tax, and can be expressed by the following equation:
where
- —operating costs, ;
- —income tax, .
Operating costs can be defined as the sum of fixed and variable costs minus depreciation:
where
- —fixed costs, ;
- —variable costs, ;
- —depreciation, .
Fixed costs are the sum of operation and maintenance costs and depreciation:
where
- —operation and maintenance costs, .
Operating and maintenance costs are calculated as the product of the unit operating cost and the power of the PV-EC installation:
where
- —unit operating and maintenance costs, .
Variable costs represent the sum of the costs of all substrates required in the analyzed reactor:
where
- —cost of purchasing carbon dioxide, ;
- —cost of purchasing ethylene glycol, ;
- —cost of purchasing electrical energy, ;
The cost of carbon dioxide is calculated as the product of the carbon dioxide price, its mass flow rate, and the reactor operating time:
where
- —price of carbon dioxide, ;
- —mass flow rate of carbon dioxide, .
The cost of ethylene glycol is calculated as the product of the ethylene glycol price, its mass flow rate, and the reactor operating time:
where
- —price of ethylene glycol, ;
The cost of electrical energy is calculated as the product of the electricity price, reactor power, and reactor operating time:
where
- —electricity price, .
3. Scheme and Assumptions
Figure 2 shows a schematic of the analyzed electrochemical reactor, PV-EC. In this reactor, ethylene glycol and carbon dioxide are converted into value-added products such as glycolic acid and carbon monoxide. The reactor has an output power of 20 kW, and the electricity supplied to the reactor comes from renewable energy sources (RESs). The cathode catalyst is based on zinc modified with silver nanoparticles (Zn-Ag), which improves the selectivity toward CO production, while the anode catalyst is based on palladium supported on a nickel–cobalt alloy (Pd/NiCo) and enables the selective oxidation of ethylene glycol to glycolic acid. The cathode operates in the gas phase and does not include a catholyte compartment. In the modeling, carbonation reactions between CO2 and OH− ions were not considered due to their limited impact on the overall balance. The Faraday efficiency of glycolic acid formation is 90%, while the Faraday efficiency of carbon monoxide production reaches 95%. Equations (18)–(23) show the reactions occurring at the anode and cathode and summed across the reactor, and the main assumptions for the economic analysis are presented in Table 1. Table 2 presents the results of this analysis.
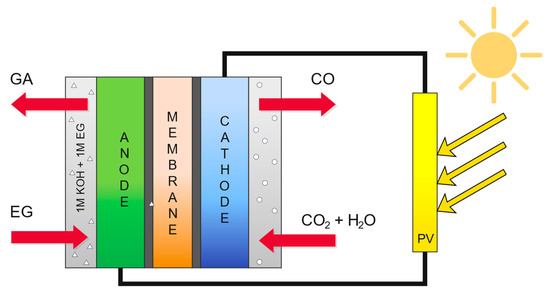
Figure 2.
Scheme of the electrochemical reactor.

Table 1.
Main assumptions for the economic analysis.

Table 2.
Results of calculations related to the weighted average cost of capital.
Anode reactions:
Cathode reactions:
Summary reaction:
To calculate the discount rate, the risk-free rate was determined based on quarterly data from the Energy Regulatory Office [39]. Throughout the entire period under review, the risk-free rate increases, reaching a value in the second quarter of 2025. The average value of the risk-free rate from 2023 to 2025 is 3.99%. Figure 3 shows the quarterly change in the value of the risk-free rate from 2023 to 2025.
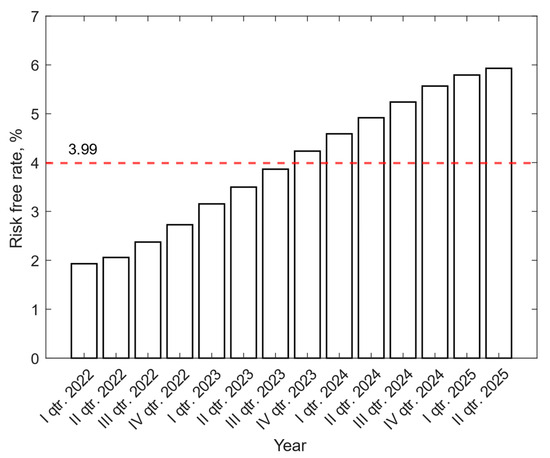
Figure 3.
Quarterly change in the value of the risk-free rate from 2023 to 2025 [39].
The market’s rate of return was also determined from archival data for the past 12 months [40]. The average value was used to calculate the weighted average cost of capital, and the data for the past few months are shown in Figure 4. During the analyzed period from 20 June 2024 to 20 June 2025, the value of the risk return took a negative value most of the time, which indicates the unprofitability of the investment.
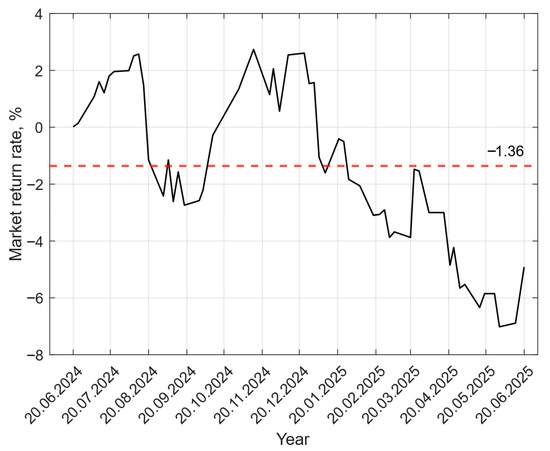
Figure 4.
Change in the rate of return in the past 12 months [40].
For the LCA, a cradle-to-gate approach is used to define the impacts of the system, considering all the processes from the extraction of raw materials until the delivery of the products. All input and output data were derived from the economic analysis and subsequently normalized to a functional unit of 1 kg of carbon monoxide. Since the PV-EC system produces two primary products (carbon monoxide and glycolic acid), an economic allocation method was employed to distribute the impacts: 15.70% of the impacts were attributed to CO and 84.30% to glycolic acid (see Supplementary Material). Accordingly, only 15.70% of the total environmental burdens are allocated to the CO production system. Figure 5 shows the system boundary and functional unit considered for the production of CO from the PV-EC system.
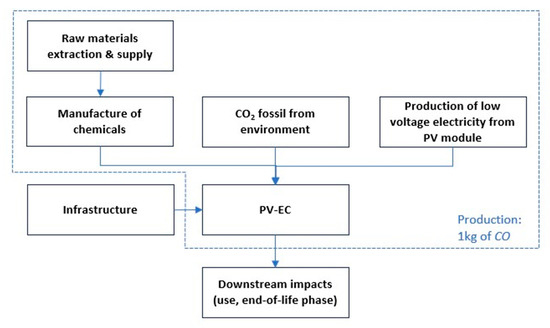
Figure 5.
System boundary and functional unit considered for the production of CO from the PV-EC system.
4. Results and Discussion
4.1. Economic Results
Based on the methodology presented in Section 3, the first step was to determine the break-even investment cost. This cost was calculated using Equation (3), assuming that NPV = 0. After rearranging, the equation takes the following form:
Break-even investment cost is understood as the maximum cost of capital that we can afford to make the analyzed installation profitable. For the assumptions in Table 1, the break-even capital cost is 119.59 kEUR. After determining the break-even capital expenditures, a sensitivity analysis was carried out to evaluate the impact of selected parameters on the break-even investment cost. Standard deviations of 5%, 10%, and 15% were determined for each of the selected random variables. The exception was reactor operating time, for which the maximum standard deviation is 9.5% due to the limitation associated with the maximum operating time, which is 8760 h per year. Table 3 shows the expected values and standard deviations of selected random variables, and Figure 6 shows the results of the sensitivity analysis of these random variables for the break-even investment cost.

Table 3.
Expected values and standard deviations of selected random variables.
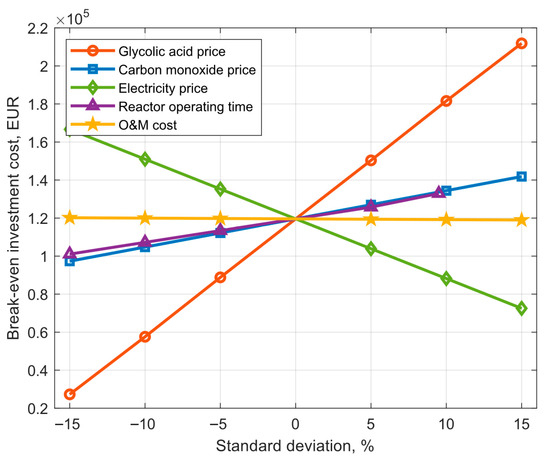
Figure 6.
Break-even investment cost for different standard deviations.
The conducted analysis indicates that the glycolic acid price and electricity price exert the most significant influence on the break-even capital expenditures. The standard deviation for the price of glycolic acid equal to 5% creates a difference between the lower and upper limits of the break-even investment cost equal to 61.53 kEUR. In comparison of operating and maintenance costs and the same standard deviation, the difference is only 392.23 EUR. A standard deviation of 15% for the price of glycolic acid increased the break-even investment cost to 211.88 kEUR, which is 92.3 kEUR more than for the reference variant.
Due to such a large impact of the price of glycolic acid on the break-even investment cost, it was decided to extend the analysis to include the impact of the percentage concentration of the glycolic acid on its price and then the impact of this price, depending on the concentration, on the break-even investment cost.
Price data for glycolic acid for concentrations of 70%, 90%, and 99% are based on the publication [38], and then the price was estimated for lower concentrations using a polynomial function. The impact of the concentration of glycolic acid on its price and the impact of this price on the break-even investment cost are presented in Figure 7. For a concentration of 99% and a glycolic acid price of 1.67 EUR/kg, the break-even investment cost is 301.79 kEUR, which is 182.21 kEUR more than for the reference variant, and a glycolic acid price of 1.29 EUR/kg was adopted for a glycolic acid concentration of 70%. The production of glycolic acid below a concentration equal to 50% is unprofitable for the investment operation due to the fact that the break-even investment cost is less than zero.
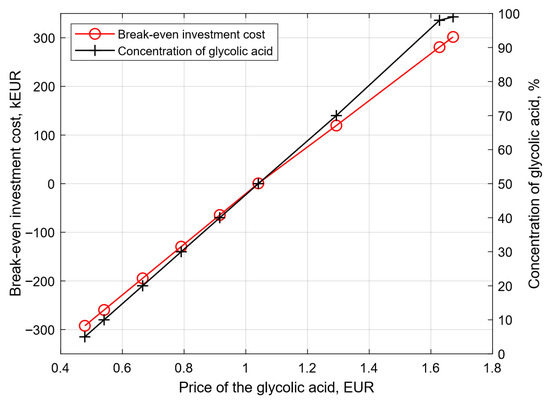
Figure 7.
Impact of the concentration of glycolic acid for its price and impact of this price to break-even investment cost.
In the next step, the impact of the investment cost on the net present value was examined. The value of the investment cost was changed from 10 kEUR to 140 kEUR for a glycolic acid price of 1.29 EUR/kg. Figure 8 shows the course of net present value changes for different values of investment cost. For the baseline assumptions and for NPV = 0 kEUR, the investment cost is 119.59 kEUR. For the same assumptions, decreasing the investment cost, NPV increases, which indicates increasing profitability of the investment. For an investment cost of 50 kEUR, the NPV is more than 80 kEUR. On the other hand, when the value of the investment cost exceeds the investment cost for NPV = 0 kEUR, the investment is not profitable, and the expenses are greater than the income.
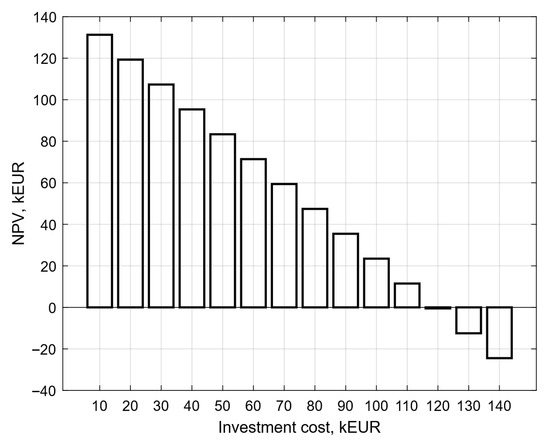
Figure 8.
Course of net present value changes for different values of investment cost.
Based on the sensitivity analysis shown in Figure 4, it can be seen that the second parameter that has the greatest impact on the change in the limiting capital expenditures is electricity. Figure 9 shows the impact of the price of electricity on the break-even investment cost. Electricity prices ranged from EUR 0.05/kWh to EUR 0.35/kWh. The base value of the electricity price is EUR 0.2/kWh [41,42]. As electricity prices decline, the break-even investment cost increases. For an electricity price of 0.05 EUR/kWh, the break-even investment cost is approximately 350 kEUR. When the electricity price exceeds 0.28 EUR/kWh, the break-even investment cost takes on a negative value, which means that the investment does not bring profits. This relationship occurs because lower electricity prices reduce operating costs, which allows investors to spend more on investment costs while still maintaining the profitability of the project.
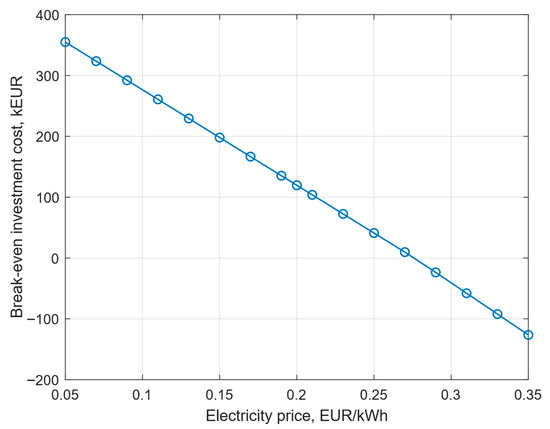
Figure 9.
The impact of electricity prices on the break-even investment cost.
4.2. Life Cycle Assessment Results
A cradle-to-gate Life Cycle Assessment was carried out to evaluate the environmental performance of the proposed PV-EC system. The impact of climate change was investigated for two scenarios: (i) the PV-EC system powered by photovoltaic electricity and (ii) the same system powered by the average European market electricity. Both were compared to a conventional CO production route using synthesis gas derived from fossil sources through adsorption. The global warming potential (GWP) results are expressed in kg CO2-equivalents per kg of CO, based on the Environmental Footprint (EF) 3.1 impact assessment method. Figure 10 shows a comparison of the global warming potential of the system considered.
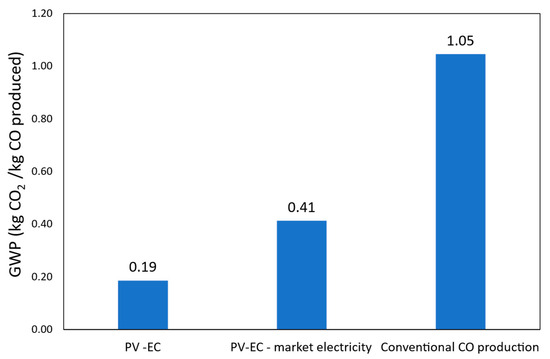
Figure 10.
Comparison of the global warming potential of the system considered.
The findings show that the PV-EC system has better environmental performance than the traditional method of producing CO. The PV-EC system powered by photovoltaic energy achieves the lowest carbon footprint, with a net GWP of 0.19 kg CO2-eq. It is followed by the PV-EC system powered by average market electricity, which has a net GWP of 0.41 kg CO2-eq. On the other hand, the conventional CO production process results in a significantly higher GWP of 1.05 kg CO2-eq. These results demonstrate that the PV-EC system offers a reduction in climate change impact of 82% when powered by PV electricity and 61% when connected to the grid, compared to the conventional reference system.
A detailed breakdown of the environmental contributions for each scenario is presented in Figure 11 and Figure 12 to understand where the impacts are coming from. A 5% cut-off criterion is applied in this analysis to include all processes that contribute at least this percentage to the overall environmental impact.
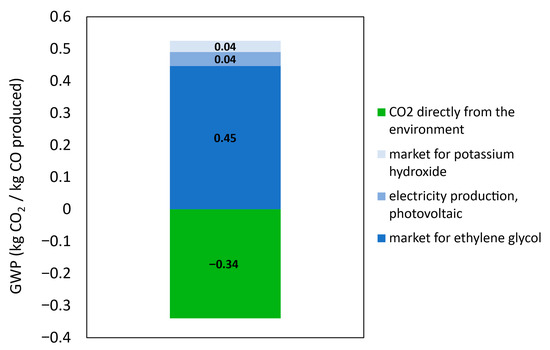
Figure 11.
Contribution tree of the PV-EC system.
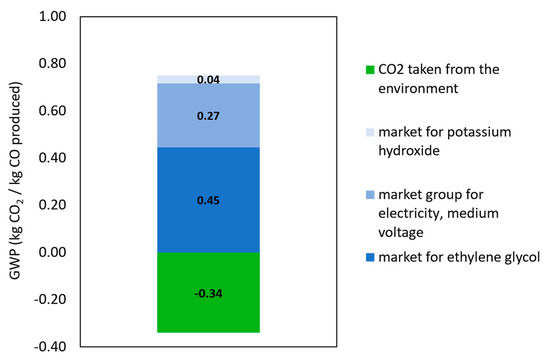
Figure 12.
Contribution tree of the PV-EC system with market electricity supply.
Given the high supply requirements to produce glycolic acid, a closer look at the contributing processes within the PV-EC system shows that the upstream production of ethylene glycol is the main source of emissions. The ethylene glycol input is primarily responsible for the overall environmental burden in both system configurations. Ethylene glycol specifically contributes approximately 0.45 kg CO2-eq to the total in the PV-powered scenario, with photovoltaic electricity generation coming in second at 0.04 kg CO2-eq. Importantly, using CO2 as a feedstock adds a substantial negative emissions factor: the uptake of atmospheric CO2 results in an environmental credit of −0.34 kg CO2-eq, which plays a vital role in offsetting the impacts of other system inputs.
The market electricity scenario exhibits a similar pattern, while the GWP associated with electricity rises significantly to 0.27 kg CO2-eq due to the carbon intensity of the average energy mix. This again underscores the importance of decarbonizing input chemicals, as improvements in electricity sourcing alone are insufficient to fully optimize the system’s environmental performance.
Another major advantage of the PV-EC strategy is its potential to utilize CO2 from the atmosphere. Therefore, the system offers a substantial GWP credit, effectively reducing the net environmental burden of the final product. This environmental benefit becomes even more amplified when renewable electricity is used, further reinforcing the synergistic value of combining renewable energy with CO2 conversion technologies.
5. Perspective
The economic and environmental analyses of the electrochemical reactor for the conversion of CO2 to CO and ethylene glycol to glycolic acid are only the first stage of a comprehensive analysis of the tandem reactors (electrochemical and photoelectrochemical), which will be powered by renewable energy sources. The tandem reactors will simultaneously convert CO2 into propanol and ethylene glycol into glycolic acid, allowing harmful substances to be transformed back into products with high utility value. The research is being conducted as part of the Horizon project—PHOENIX (Photo-electro Integrated Next-Generation Energy technologies) project. In subsequent studies, it is planned to extend the model to integrate both reactors, which will allow the potential of the technology to be verified under conditions close to real-life and the benefits of the interaction between CO2 conversion and EG. Another important direction for further work will be a detailed analysis of scenarios for the use of renewable energy to power the system and a comparison of the results obtained with alternative technologies for reducing emissions. The goal is to determine the role of the proposed technology in the energy transition and the circular economy, as well as to identify paths for its commercialization.
6. Conclusions
The economic analysis showed that the key parameter determining the profitability of investing in an electrochemical reactor for the simultaneous conversion of carbon dioxide and EG is the selling price of glycolic acid. This means that the stability of the glycolic acid market is a critical factor for the development of this technology. The analysis also showed that the concentration of glycolic acid directly translates into its price and, consequently, into the value of marginal investment costs.
The second most important factor affecting the investment cost is the price of electricity. Project profitability is achievable only with access to low-cost electricity, preferably from renewable sources. An analysis of the impact of investment costs on net present value confirmed that as capital expenditure decreases, the profitability of the project increases significantly. However, once the threshold of 119 kEUR corresponding to NPV = 0 is exceeded, the investment becomes unprofitable.
The economic analysis allowed us to identify the parameters that have the greatest economic impact on the proposed installation, and the stability of these parameters in the future will determine the commercialization potential of the technology. The results obtained emphasize the need for further research on the optimization of the processes involved and the integration of the system with renewable energy sources, which will reduce the investment’s sensitivity to energy price volatility and increase its economic attractiveness.
The LCA confirms that the PV-EC system represents a significantly less carbon-intensive alternative to conventional CO production. Even at the current levels of technological advancement, the electrochemical conversion technologies already offer a more sustainable pathway compared to fossil-based methods. Nevertheless, widespread industry application is currently hindered by relatively low Technology Readiness Levels (TRLs) and the need for further technological advancements to enable scalability and integration into industrial systems. The findings also point to important opportunities for future improvement, particularly in the substitution of fossil-derived ethylene glycol with recycled alternatives. As PET upcycling technologies advance and achieve higher TRLs, the integration of ethylene glycol produced from waste streams could also further improve the sustainability of the PV-EC system, further establishing it within a circular, low-carbon chemical industry.
The discrepancies between the NPV and LCA results stem from the different objectives and methods of the two analyses. NPV indicates that the key economic factors are the price of glycolic acid and electricity, while LCA shows that the largest environmental footprint comes from ethylene glycol. This means that the parameters that most influence the economic result do not coincide with those that determine the environmental impact. From a commercialization perspective, the technology requires cost reduction and stabilization of the GA market, while from an environmental perspective, it requires replacing EG with recycled PET or a renewable equivalent.
Supplementary Materials
The following supporting information can be downloaded at https://www.mdpi.com/article/10.3390/en18195125/s1. Suplementary materials for LCA analysis: Figure S1: System boundary considered for the PV-EC system with the Europe market electricity supply. Figure S2: System boundary considered for the conventional production of CO. Figure S3. PV-EC mass balance to produce CO. Tables S1 and S2: Inputs and outputs of the PV-EC system. Table S3: Economic allocation of the PV-EC system. Tables S4 and S5: Inputs and outputs of the PV-EC system that uses electricity from the market in Europe. Tables S6 and S7: Inputs and outputs of the conventional production of CO. Table S8. Environmental impact results from the EF v.3.1 to produce 1 kg of CO under three scenarios: PV-EC (photovoltaic electricity), PV-EC (market electricity), and conventional synthesis from syngas.
Author Contributions
Conceptualization, B.O., K.J. and A.A.; methodology, B.O., K.J., B.M. and A.A.; software, B.O., A.A. and N.K.; validation, N.K., B.M. and A.A.; formal analysis, B.O., A.A. and K.J.; investigation, B.O. and K.J.; resources, B.O., A.A. and B.M.; data curation, B.O. and A.A.; writing—original draft preparation, B.O. and A.A.; writing—review and editing, B.O., A.A., N.K., B.M. and K.J.; visualization, B.O., A.A. and N.K.; supervision, K.J. and B.M. All authors have read and agreed to the published version of the manuscript.
Funding
The PHOENIX project received funding from the European Union’s Horizon Europe research and innovation program under grant agreement No. 101172764. Views and opinions expressed are however those of the author(s) only and do not necessarily reflect those of the European Union. Neither the European Union nor the granting authority can be held responsible for them. This work received funding from the Swiss State Secretariat for Education, Research and Innovation (SERI). Scientific work financed as part of statutory research at the Silesian University of Technology.
Data Availability Statement
All data are contained within the article.
Conflicts of Interest
The authors declare no conflicts of interest.
Abbreviations
The following abbreviations are used in this manuscript:
| CCU | Carbon Capture and Utilization |
| CCS | Carbon Capture and Storage |
| CO | Carbon Monoxide |
| CO2 | Carbon Dioxide |
| DAC | Direct Air Capture |
| EG | Ethylene Glycol |
| EU | European Union |
| GA | Glycolic Acid |
| GHG | Greenhouse Gases |
| GWP | Global Warming Potential |
| LCA | Life Cycle Assessment |
| NPV | Net Present Value |
| PET | Polyethylene Terephthalate |
| PGA | Polyglycolic |
| RES | Renewable Energy Sources |
| TRL | Technology Readiness Level |
References
- GHG Emissions of All World Countries—Publications Office of the EU. Available online: https://op.europa.eu/en/publication-detail/-/publication/0cde0e23-5057-11ee-9220-01aa75ed71a1/language-en (accessed on 18 August 2025).
- Ritchie, H.; Roser, M. CO2 Emissions. Our World Data 2020, 2, 189–205. [Google Scholar] [CrossRef]
- CO2 Emissions—Global Energy Review 2025—Analysis—IEA. Available online: https://www.iea.org/reports/global-energy-review-2025/co2-emissions (accessed on 18 August 2025).
- Rahman, M.M.; Alam, K.; Velayutham, E. Reduction of CO2 Emissions: The Role of Renewable Energy, Technological Innovation and Export Quality. Energy Rep. 2022, 8, 2793–2805. [Google Scholar] [CrossRef]
- Deng, Z.; Zhu, B.; Davis, S.J.; Ciais, P.; Guan, D.; Gong, P.; Liu, Z. Global Carbon Emissions and Decarbonization in 2024: Climate Chronicles. Nat. Rev. Earth Environ. 2025, 6, 231–233. [Google Scholar] [CrossRef]
- What Is the Kyoto Protocol?|UNFCCC. Available online: https://unfccc.int/kyoto_protocol (accessed on 18 August 2025).
- The Kyoto Protocol—European Commission. Available online: https://climate.ec.europa.eu/eu-action/international-action-climate-change/kyoto-protocol_en (accessed on 18 August 2025).
- The Paris Agreement|United Nations. Available online: https://www.un.org/en/climatechange/paris-agreement (accessed on 18 August 2025).
- The Paris Agreement|UNFCCC. Available online: https://unfccc.int/process-and-meetings/the-paris-agreement (accessed on 18 August 2025).
- Kuh, K.F. The Law of Climate Change Mitigation: An Overview. Encycl. Anthr. 2018, 1–5, 505–510. [Google Scholar] [CrossRef]
- The European Green Deal—European Commission. Available online: https://commission.europa.eu/strategy-and-policy/priorities-2019-2024/european-green-deal_en (accessed on 18 August 2025).
- European Green Deal—Consilium. Available online: https://www.consilium.europa.eu/en/policies/european-green-deal/ (accessed on 18 August 2025).
- Delivering the European Green Deal—European Commission. Available online: https://commission.europa.eu/strategy-and-policy/priorities-2019-2024/european-green-deal/delivering-european-green-deal_en (accessed on 18 August 2025).
- Fit for 55—Consilium. Available online: https://www.consilium.europa.eu/en/policies/fit-for-55/ (accessed on 18 August 2025).
- EU CCS Directive—CO2 Storage Rules for CCS & Carbon Removal. Available online: https://tracker.carbongap.org/policy/eu-ccs-directive/ (accessed on 18 August 2025).
- Hanson, E.; Nwakile, C.; Hammed, V.O. Carbon Capture, Utilization, and Storage (CCUS) Technologies: Evaluating the Effectiveness of Advanced CCUS Solutions for Reducing CO2 Emissions. Results Surf. Interfaces 2025, 18, 100381. [Google Scholar] [CrossRef]
- Niesporek, K.; Wiciak, G.; Kotowicz, J.; Baszczeńska, O. Effect of Humidity on the Energy and CO2 Separation Characteristics of Membranes in Direct Air Capture Technology. Energies 2025, 18, 3422. [Google Scholar] [CrossRef]
- Kotowicz, J.; Niesporek, K.; Baszczeńska, O. Advancements and Challenges in Direct Air Capture Technologies: Energy Intensity, Novel Methods, Economics, and Location Strategies. Energies 2025, 18, 496. [Google Scholar] [CrossRef]
- Peres, C.B.; Resende, P.M.R.; Nunes, L.J.R.; de Morais, L.C. Advances in Carbon Capture and Use (CCU) Technologies: A Comprehensive Review and CO2 Mitigation Potential Analysis. Clean Technol. 2022, 4, 1193–1207. [Google Scholar] [CrossRef]
- Liu, Z.; Qian, J.; Zhang, G.; Zhang, B.; He, Y. Electrochemical CO2-to-CO Conversion: A Comprehensive Review of Recent Developments and Emerging Trends. Sep. Purif. Technol. 2024, 330, 125177. [Google Scholar] [CrossRef]
- Sajna, M.S.; Zavahir, S.; Popelka, A.; Kasak, P.; Al-Sharshani, A.; Onwusogh, U.; Wang, M.; Park, H.; Han, D.S. Electrochemical System Design for CO2 Conversion: A Comprehensive Review. J. Environ. Chem. Eng. 2023, 11, 110467. [Google Scholar] [CrossRef]
- Boutin, E.; Patel, M.; Kecsenovity, E.; Suter, S.; Janáky, C.; Haussener, S. Photo-Electrochemical Conversion of CO2 Under Concentrated Sunlight Enables Combination of High Reaction Rate and Efficiency. Adv. Energy Mater. 2022, 12, 2200585. [Google Scholar] [CrossRef]
- Sacco, A.; Speranza, R.; Savino, U.; Zeng, J.; Farkhondehfal, M.A.; Lamberti, A.; Chiodoni, A.; Pirri, C.F. An Integrated Device for the Solar-Driven Electrochemical Conversion of CO2 to CO. ACS Sustain. Chem. Eng. 2020, 8, 7563–7568. [Google Scholar] [CrossRef]
- Dokl, M.; Copot, A.; Krajnc, D.; Fan, Y.V.; Vujanović, A.; Aviso, K.B.; Tan, R.R.; Kravanja, Z.; Čuček, L. Global Projections of Plastic Use, End-of-Life Fate and Potential Changes in Consumption, Reduction, Recycling and Replacement with Bioplastics to 2050. Sustain. Prod. Consum. 2024, 51, 498–518. [Google Scholar] [CrossRef]
- Kusumocahyo, S.P.; Ambani, S.K.; Kusumadewi, S.; Sutanto, H.; Widiputri, D.I.; Kartawiria, I.S. Utilization of Used Polyethylene Terephthalate (PET) Bottles for the Development of Ultrafiltration Membrane. J. Environ. Chem. Eng. 2020, 8, 104381. [Google Scholar] [CrossRef]
- North, E.J.; Halden, R.U. Plastics and Environmental Health: The Road Ahead. Rev. Environ. Health 2013, 28, 1–8. [Google Scholar] [CrossRef] [PubMed]
- Plastics—The Fast Facts 2023. Plastics Europe. Available online: https://plasticseurope.org/knowledge-hub/plastics-the-fast-facts-2023/ (accessed on 18 August 2025).
- Ren, T.; Zhan, H.; Xu, H.; Chen, L.; Shen, W.; Xu, Y.; Zhao, D.; Shao, Y.; Wang, Y. Recycling and High-Value Utilization of Polyethylene Terephthalate Wastes: A Review. Environ. Res. 2024, 249, 118428. [Google Scholar] [CrossRef] [PubMed]
- Electrochemical CO2 Reduction in Modern Energy as a Method of Production of Propanol and Other Alternative Fuels|Rynek-Energii.Pl. Available online: https://rynek-energii.pl/pl/node/4744 (accessed on 18 August 2025).
- Yan, Y.; Fu, Y.; Yang, J.; Shi, Q.; Wang, Z.; Zhang, Z.; Zhou, H.; Li, Z.; Shao, M.; Yan, Y.; et al. Electrocatalytic Upcycling of Polyethylene Terephthalate Waste to Biodegradable Polymer Coupled with Hydrogen Production at Ampere-Level Current Density. CCS Chem. 2025, 1–15. [Google Scholar] [CrossRef]
- Iturrondobeitia, M.; Alonso, L.; Lizundia, E. Prospective Life Cycle Assessment of Poly (Ethylene Terephthalate) Upcycling via Chemoselective Depolymerization. Resour. Conserv. Recycl. 2023, 198, 107182. [Google Scholar] [CrossRef]
- ISO 14040:2006; Environmental Management—Life Cycle Assessment—Principles and Framework. ISO: Geneva, Switzerland, 2006. Available online: https://www.iso.org/standard/37456.html (accessed on 1 September 2025).
- ISO 14044:2006; Environmental Management—Life Cycle Assessment—Requirements and Guidelines. ISO: Geneva, Switzerland, 2006. Available online: https://www.iso.org/standard/38498.html (accessed on 1 September 2025).
- Mapping the Cost of Carbon Capture and Storage in Europe—Clean Air Task Force. Available online: https://www.catf.us/2023/02/mapping-cost-carbon-capture-storage-europe/ (accessed on 18 August 2025).
- Ethylene Glycol Price Index—Businessanalytiq. Available online: https://businessanalytiq.com/procurementanalytics/index/ethylene-glycol-price-index/ (accessed on 18 August 2025).
- Cena Energii Elektrycznej 2025. Ile Kosztuje 1 Kwh (Tauron, PGE, Enea). Available online: https://corab.pl/aktualnosci/ile-kosztuje-1-kwh-energii-elektrycznej-w-2025-roku-z-czego-wynika-cena (accessed on 18 August 2025).
- Kumar, B.; Muchharla, B.; Dikshit, M.; Dongare, S.; Kumar, K.; Gurkan, B.; Spurgeon, J.M. Electrochemical CO2 Conversion Commercialization Pathways: A Concise Review on Experimental Frontiers and Technoeconomic Analysis. Environ. Sci. Technol. Lett. 2024, 11, 1161–1174. [Google Scholar] [CrossRef] [PubMed]
- Zhou, X.; Zha, M.; Cao, J.; Yan, H.; Feng, X.; Chen, D.; Yang, C. Glycolic Acid Production from Ethylene Glycol via Sustainable Biomass Energy: Integrated Conceptual Process Design and Comparative Techno-Economic-Society-Environment Analysis. ACS Sustain. Chem. Eng. 2021, 9, 10948–10962. [Google Scholar] [CrossRef]
- Stopa Wolna Od Ryzyka—Urząd Regulacji Energetyki. Available online: https://www.ure.gov.pl/pl/biznes/taryfy-zalozenia/stopa-wolna-od-ryzyka/7860,Stopa-wolna-od-ryzyka.html (accessed on 18 August 2025).
- Średnie Stopy Zwrotu Spółek GPW z Podziałem Na Branże—BiznesRadar.Pl. Available online: https://www.biznesradar.pl/branze/ (accessed on 18 August 2025).
- Mrożenie Cen Energii w 2025 Roku. Available online: https://www.gkpge.pl/grupa-pge/dla-mediow/komunikaty-prasowe/korporacyjne/mrozenie-cen-energii-w-2025-roku (accessed on 18 August 2025).
- Kursy Walut—Tabela A|Narodowy Bank Polski—Internetowy Serwis Informacyjny. Available online: https://nbp.pl/statystyka-i-sprawozdawczosc/kursy/tabela-a/ (accessed on 18 August 2025).
Disclaimer/Publisher’s Note: The statements, opinions and data contained in all publications are solely those of the individual author(s) and contributor(s) and not of MDPI and/or the editor(s). MDPI and/or the editor(s) disclaim responsibility for any injury to people or property resulting from any ideas, methods, instructions or products referred to in the content. |
© 2025 by the authors. Licensee MDPI, Basel, Switzerland. This article is an open access article distributed under the terms and conditions of the Creative Commons Attribution (CC BY) license (https://creativecommons.org/licenses/by/4.0/).