Article

Mechanism Analysis of Wide-Band Oscillation Amplification for Long-Distance AC Transmission Lines

1
School of Electrical and Power Engineering, Hohai University, Nanjing 210098, China
2
China Electric Power Research Institute, NARI, Road No.8, Nanjing 210003, China
3
Research Institute, State Grid Shandong Electric Power Co., Ltd., Jinan 250003, China
*
Author to whom correspondence should be addressed.
Energies 2025, 18(19), 5106; https://doi.org/10.3390/en18195106
Submission received: 18 August 2025 / Revised: 15 September 2025 / Accepted: 23 September 2025 / Published: 25 September 2025

Abstract

The increasing integration of renewable energy has led to power systems characterized by a high penetration of renewable energy sources (RES) and power electronic devices (PEDs). However, wide-band oscillation phenomena caused by RES grid integration have emerged and propagated through transmission networks. Notably, large-scale renewable energy bases located in remote areas are typically connected to the main grid via long-distance AC transmission lines. These lines exhibit an inter-harmonic amplification effect, which may exacerbate the propagation and amplification of wide-band oscillations, posing significant risks to bulk power-grid stability. This paper establishes impedance models of long-distance AC transmission lines and asynchronous motors under wide-band oscillation frequencies, and derives equivalent line parameters mathematically to reveal the oscillation amplification problem of long-distance renewable energy oscillation transmission through AC transmission lines. A transfer coefficient is defined to quantify inter-harmonic current amplification. A single-machine-load model is developed in MATLAB/Simulink to validate the proposed model. Furthermore, the influence of line parameters on oscillation amplification is analyzed, and a suppression strategy is proposed. This study provides valuable insights for the parameter design of long-distance transmission lines in renewable energy integration scenarios, as it helps mitigate potential inter-harmonic amplification risks by reducing the peak values of the transfer coefficient.

1. Introduction

The rapid deployment of large-scale renewable energy integration and long-distance transmission infrastructure has intensified dynamic interactions between power electronic converters and grid components [1]. These interactions frequently induce wide-band oscillations (e.g., sub/super-synchronous frequencies) in renewable energy systems, which propagate through transmission networks as inter-harmonic currents [2]. In recent years, sub/super-synchronous inter-harmonic components have been found on the grid side in several sub-synchronous oscillation accidents worldwide [3,4]. The propagation of these inter-harmonic voltage and current components on the grid side may cause a series of problems, such as torsional vibration of thermal power units, which brings new challenges to the safe and stable operation of bulk power grids. Previous studies have shown that the rapid development of power electronics and the surge of nonlinear loads have brought a large number of harmonic sources to the power system [5,6], and made the propagation process of harmonics more complicated [7].
The power system is a whole formed by connecting different voltage levels. Harmonics not only spread widely in the power grid through transmission lines, but also produce harmonic amplification on transmission lines [8]. Similarly, large-scale renewable energy is often connected to the grid through long-distance transmission lines. The inter-harmonic current generated by the grid-connected oscillation of renewable energy is also amplified by long-distance AC transmission lines, which is similar to the amplification of harmonics, thus causing the propagation amplification of wide-band oscillation. The generation mechanism and main characteristics are not clear and need to be further studied.
At present, the research works on power-grid harmonics mainly focus on harmonic detection, harmonic source location, and harmonic suppression [9,10,11]. However, the influence of harmonic propagation and amplification on power system security also poses a challenge.
Regarding the transmission characteristics of harmonic amplification, reference [12] revealed the transmission characteristics of harmonic voltage in dual-winding transformers, and proposed that the harmonic transmission capacity of transformers is closely related to the load, and each harmonic propagates linearly in light-load or no-load transformers. In [13], the harmonic transmission characteristics of half-wavelength transmission lines are studied, and it is found that the voltage distortion rate at both ends of the line changes linearly with the increase in the number of harmonics. Reference [14] studied resonance and harmonic transmission problems in a new continuous cable traction power supply system (CCTPSS), and revealed that the quantity of resonance points is positively correlated with its power supply distance for CCTPSS, and whether the harmonic in the transmission line will be amplified is mainly determined by impedance outside the port.
Regarding the influencing factors of harmonic amplification, the harmonic amplification problems of power systems are usually caused by the parasitic inductance and shunt capacitance along transmission lines. In [15], a harmonic resonance quantitative evaluation technique for sensitivity analysis under uncertain conditions was proposed to reveal the influence area of harmonic resonance at different buses and the corresponding amplification severity. Reference [16] proposed a time-domain method combining a Kalman filter and convolution inversion to obtain a harmonic amplification coefficient, then discussed the harmonic amplification characteristics of cable lines. Reference [17] studied the harmonic amplification characteristics of DC transmission lines, and the results show that the equivalent impedance of the converter station is closely related to the amplitude of the harmonic current. In [18], the characteristics of harmonic transmission and amplification in cable lines and transformers were analyzed qualitatively and quantitatively. The results show that when the cable-to-ground capacitance is matched with the inductive reactance parameters of the system, the harmonics generated by nonlinear loads can cause resonance and result in significant harmonic amplification when injected into the system.
Existing research has primarily focused on harmonic amplification at traditional harmonic frequencies in power grids, whereas this study extends the investigation to wide-band inter-harmonic amplification phenomena in long-distance AC transmission systems. The energy endowment of different regions in China is quite different, and the load center and economic center are located in the eastern coastal areas, which need to build a regional interconnected power grid, and the power is delivered through long-distance lines [19,20]. The typical scenario of long-distance transmission for grid-connected renewable energy is shown in Figure 1. If an oscillation accident occurs in the system, the risk of inter-harmonics amplification will be increased after propagation through long-distance transmission lines. When a small inter-harmonic current is generated on the generator side, a large inter-harmonic current may be generated on the user-load side through long-distance transmission lines, which has a serious impact on the normal operation of the load.
In response to the scenario of long-distance new energy grid connection in China, in order to reveal the possible problem of oscillation amplification, this paper studies the amplification mechanism of the inter-harmonic current of renewable energy grid-connected wide-band oscillation through long-distance transmission lines, which is organized as follows. Firstly, a novel impedance model of long-distance AC transmission lines and the impedance model of asynchronous motor are established under wide-band oscillation frequencies in Section 2, incorporating distributed parameters and wave propagation effects. Then, in Section 3, the transmission coefficient is defined to quantify the amplification ratio of inter-harmonic currents between line terminals. This metric provides a systematic framework for evaluating oscillation propagation risks. In addition, a single-machine with a constant impedance load model is built based on the MATLAB 2023b platform to verify the accuracy of the established inter-harmonics model for long-distance transmission line inter-harmonic amplification across sub/super-synchronous to high-frequency ranges. In Section 4, the influence mechanism of long-distance transmission line parameters and load parameters on inter-harmonic current amplification is analyzed, along with the sensitivity of the influence of parameter changes on the amplification coefficient and oscillation frequency. Then, a practical suppression measure for the amplification of renewable energy grid-connected oscillation through long-distance transmission lines is proposed, offering engineering feasibility for real-world applications. Finally, Section 5 draws a conclusion.

2. Establishment of Long-Distance AC Transmission Line and Asynchronous Motor Model

2.1. Long-Distance AC Transmission Line Model

When power is delivered through long-distance AC transmission lines, the line length relative to the wavelength cannot be ignored, which makes the lumped parameter model of transmission line no longer applicable, and it is necessary to consider the influences of distributed parameters [21,22,23].
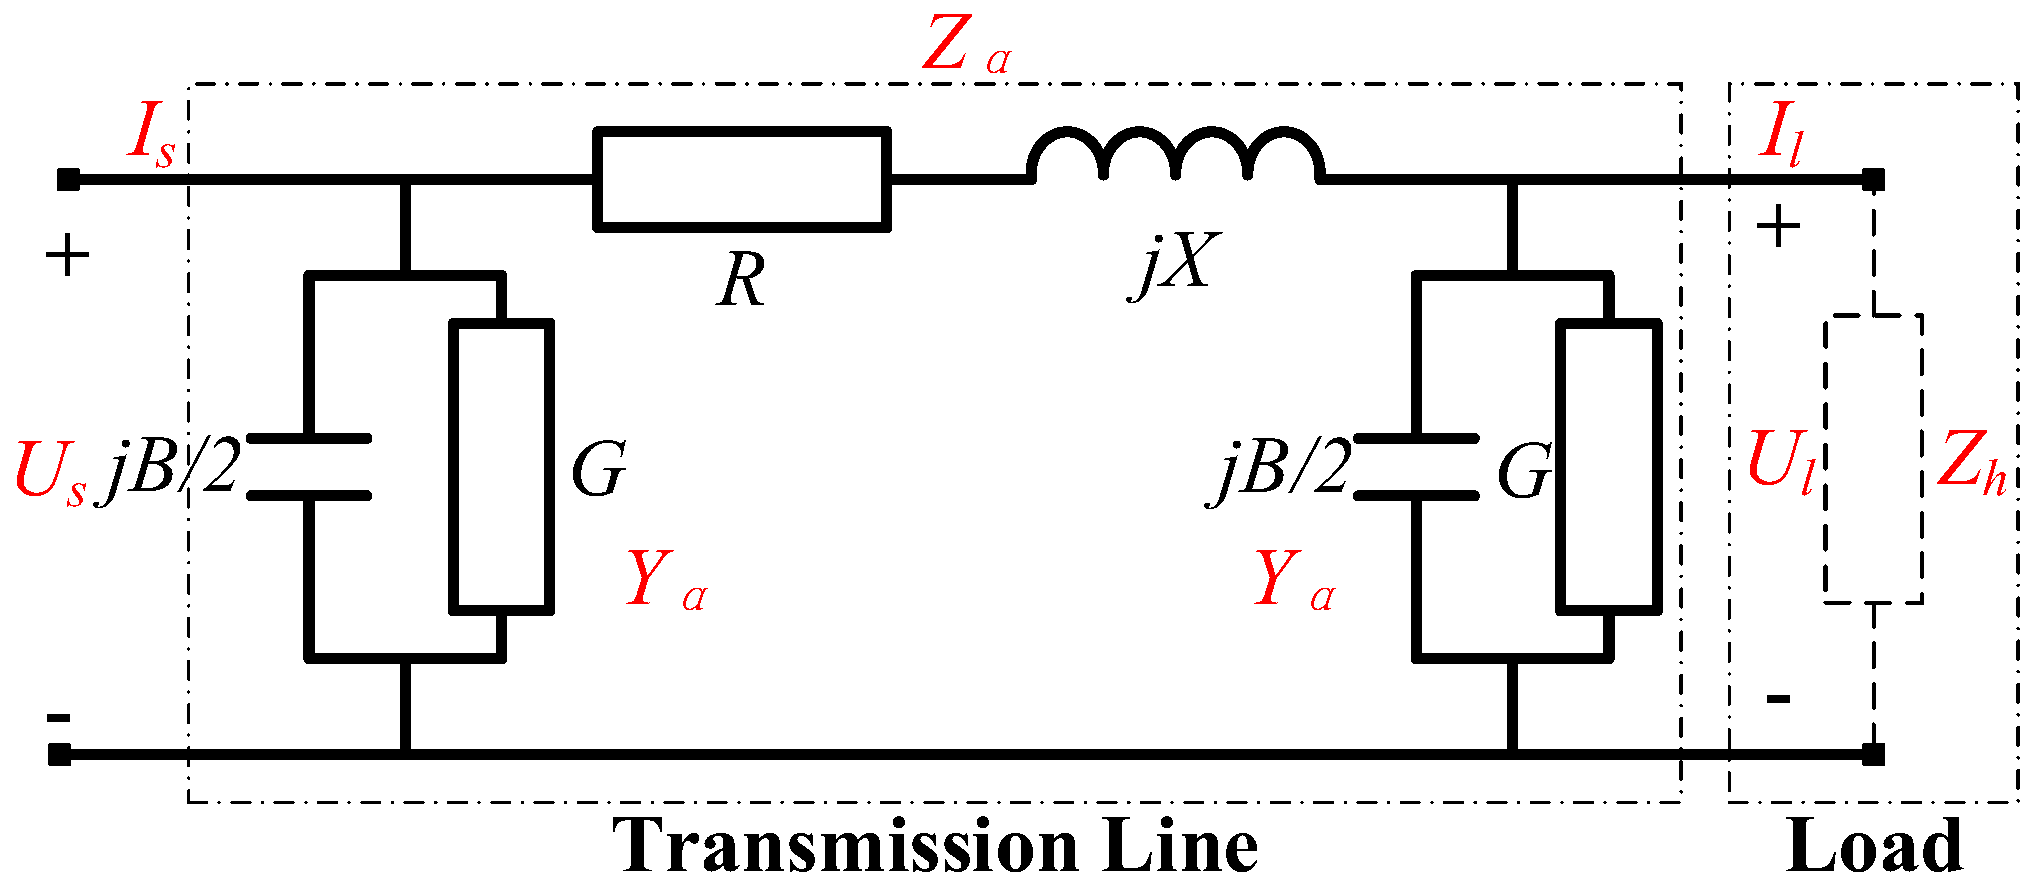
In the transient analysis involving the wave process, in order to simplify the simulation calculation, the π-type equivalent model can be used to calculate the inter-harmonics power flow of long-distance transmission lines [24]. The two-port circuit diagram of the π-type equivalent model is shown in Figure 2.
The port equation of the two-port network corresponding to Figure 2 is as follows:
I s I l = 1 / Z α + Y α 1 / Z α 1 / Z α 1 / Z α + Y α U s U l
where I s , I l are the inflow current at the head of the line and the outflow current at the end of the line; U s , U l are the voltages at both ends of the line; Z α , Y α are line impedance and line-to-ground admittance.
For the distributed parameter model of transmission lines, there is the following formula [25]:
I s t = 1 Z U s 1 + h 2 1 + h Z U l t τ h I l h t τ + 1 h 2 1 + h Z U s t τ h I s h t τ I l t = 1 Z U l 1 + h 2 1 + h Z U s t τ h I s h t τ + 1 h 2 1 + h Z U l t τ h I l h t τ
where the line structure parameter h = l / c r d / 4 l / c + r d / 4 , line delay τ = d l c , impedance Z = l c + r 4 ; I s h , and I l h are the transferred current at the head and end of the line; r , l , c are the resistance, inductance, and capacitance of the transmission line per kilometer, respectively.
According to the Euler formula, (2) can be further expressed as follows:
I s I l = 1 Z U s U l 1 + h Z 1 e j ω τ + 1 h 2 h 2 1 + h 2 h 2 e j ω τ + 1 h 2 h 1 h 2 1 + h 2 1 + h 2 h 1 + h 2 e j ω τ 1 + h 2 e j ω τ 1 + h 2 h 1 + h 2 + e j ω τ + 1 h 2 h 1 h 2 U s U l
where ω is the oscillation frequency.
By combining (1) and (3), the equivalent π-type line parameters Z α and Y α of long-distance AC transmission lines are derived as follows:
1 Z α = 1 + h Z 2 1 + h e j ω τ 2 e j ω τ + 1 h h 2 1 + h h 2 Y α = 1 Z 1 + h Z h 1 h 2 1 + h 2 + 4 e j ω τ 2 e j ω τ + 1 h h 2 1 + h h 2
Taking a 110 km transmission line, for example, the transmission line parameters are as follows: r = 0 . 0529   Ω / km , l = 0 . 0014   H / km , c = 8 . 7749 × 10 3 μ F / km . The impedance and phase characteristics of the π-type equivalent circuit are shown in Figure 3a and Figure 3b, respectively, which correspond to Z α . And the admittance and phase characteristics are shown in Figure 4a and Figure 4b, respectively, which correspond to Y α . The distance of the transmission line mainly influences the period of these curves, and the longer the transmission line, the shorter the period of these curves.

2.2. Asynchronous Motor Model

The load-side impedance model is the inter-harmonic equivalent model of the receiving-end grid’s component network. Asynchronous motors constitute a significant portion of industrial loads and represent the most critical dynamic component within the load.
The derivation of electromagnetic transient models for asynchronous motors has been extensively discussed in the literature, primarily summarized by the voltage Equation (5) and the flux linkage Equation (6). This paper derives the equivalent impedance of asynchronous motor loads at inter-harmonic frequencies:
u d s = R s i d s + d ψ d s d t ω s ψ q s u q s = R s i q s + d ψ q s d t + ω s ψ d s u d r = R r i d r + d ψ d r d t ω s ω r ψ q r u q r = R r i q r + d ψ q r d t + ω s ω r ψ d r
where u d s , u q s , u d r , and u q r denote the voltage of the stator d-axis, stator q-axis, rotor d-axis, and rotor q-axis of the asynchronous motor, respectively. R s and R r denote the resistance of the stator winding and rotor winding. ψ d s , ψ q s , ψ d r , and ψ q r denote the flux linkage of the stator d-axis, stator q-axis, rotor d-axis, and rotor q-axis, respectively. i d s , i q s , i d r , and i q r denote the current of the stator d-axis, stator q-axis, rotor d-axis, and rotor q-axis, respectively. ω s , ω r denote the electrical angular velocity of the stator and rotor, respectively. For asynchronous motors, u d r = 0 , u q r = 0 :
ψ d s = L s σ i d s + L s r i d s + i d r ψ q s = L s σ i q s + L s r i q s + i q r ψ d r = L r σ i d r + L s r i d s + i d r ψ q r = L r σ i q r + L s r i q s + i q r
where L s σ , L r σ , L s r denote the stator inductance, rotor inductance, and mutual inductance, respectively.
In cases where ω s and ω r are constant, the fundamental frequency component and the inter-harmonic frequency component in the sub-synchronous/super-synchronous oscillation can be decoupled. Therefore, the equivalent impedance of the asynchronous motor under a single inter-harmonic frequency component can be derived separately. Meanwhile, when the current of the inter-harmonic frequency component remains three-phase symmetrical, the instantaneous value of the stator side current can be formulated as follows:
i d s = I s s cos ω s s t + α i q s = I s s cos ω s s t + α + π / 2
where I s s denotes the amplitude of the stator side inter-harmonic current, ω s s denotes the angular frequency of the stator side inter-harmonic component, and α denotes the initial phase of the stator side inter-harmonic current.
Combining (6) and (7), the equation between the rotor direct-axis current and the stator direct-axis current can be formulated as follows:
i d r = ω s s L s r I s s R r 2 + ω s s 2 L r 2 ω s s L r cos ω s s t + α + ω s s L s r I s s R r 2 + ω s s 2 L r 2 R r sin ω s s t + α = ω s s L s r I s s / R r 2 + ω s s 2 L r 2 1 / 2 cos ω s s t + α + arctan R r / ω s s L r
Considering the reactance ω s s L r in the motor is far greater than the resistance R r , we can ignore the resistance, and (8) can be formulated as follows:
i d r = L s r L r I s s cos ω s s t + α = L s r L r i d s
Likely, the equation between the rotor q-axis current and the stator q-axis current can be formulated as follows:
i q r = L s r L r i q s
Combining (5), (9), and (10), we can calculate the stator side voltage as follows:
u d s = R s I s s cos ω s s t + α + ω s s ω s L s L r L s r 2 L r I s s sin ω s s t + α
The equivalent impedance of an asynchronous motor can be formulated as follows:
z m = u d s i d s = R s + j ω s ω s s L s L r L s r 2 L r
In order to verify the accuracy of the equivalent impedance calculation method of the asynchronous motor proposed in this section, this paper builds an electromagnetic transient model of the asynchronous motor in Simulink for verification. A 10–19 Hz sub-synchronous oscillation source is set at the port of the asynchronous motor, and the step interval is 1 Hz. A total of ten groups are measured to obtain the equivalent impedance. The response and equivalent admittance of the asynchronous motor under different inter-harmonic frequency components are studied.
(1)
ω s and ω r remain constant.
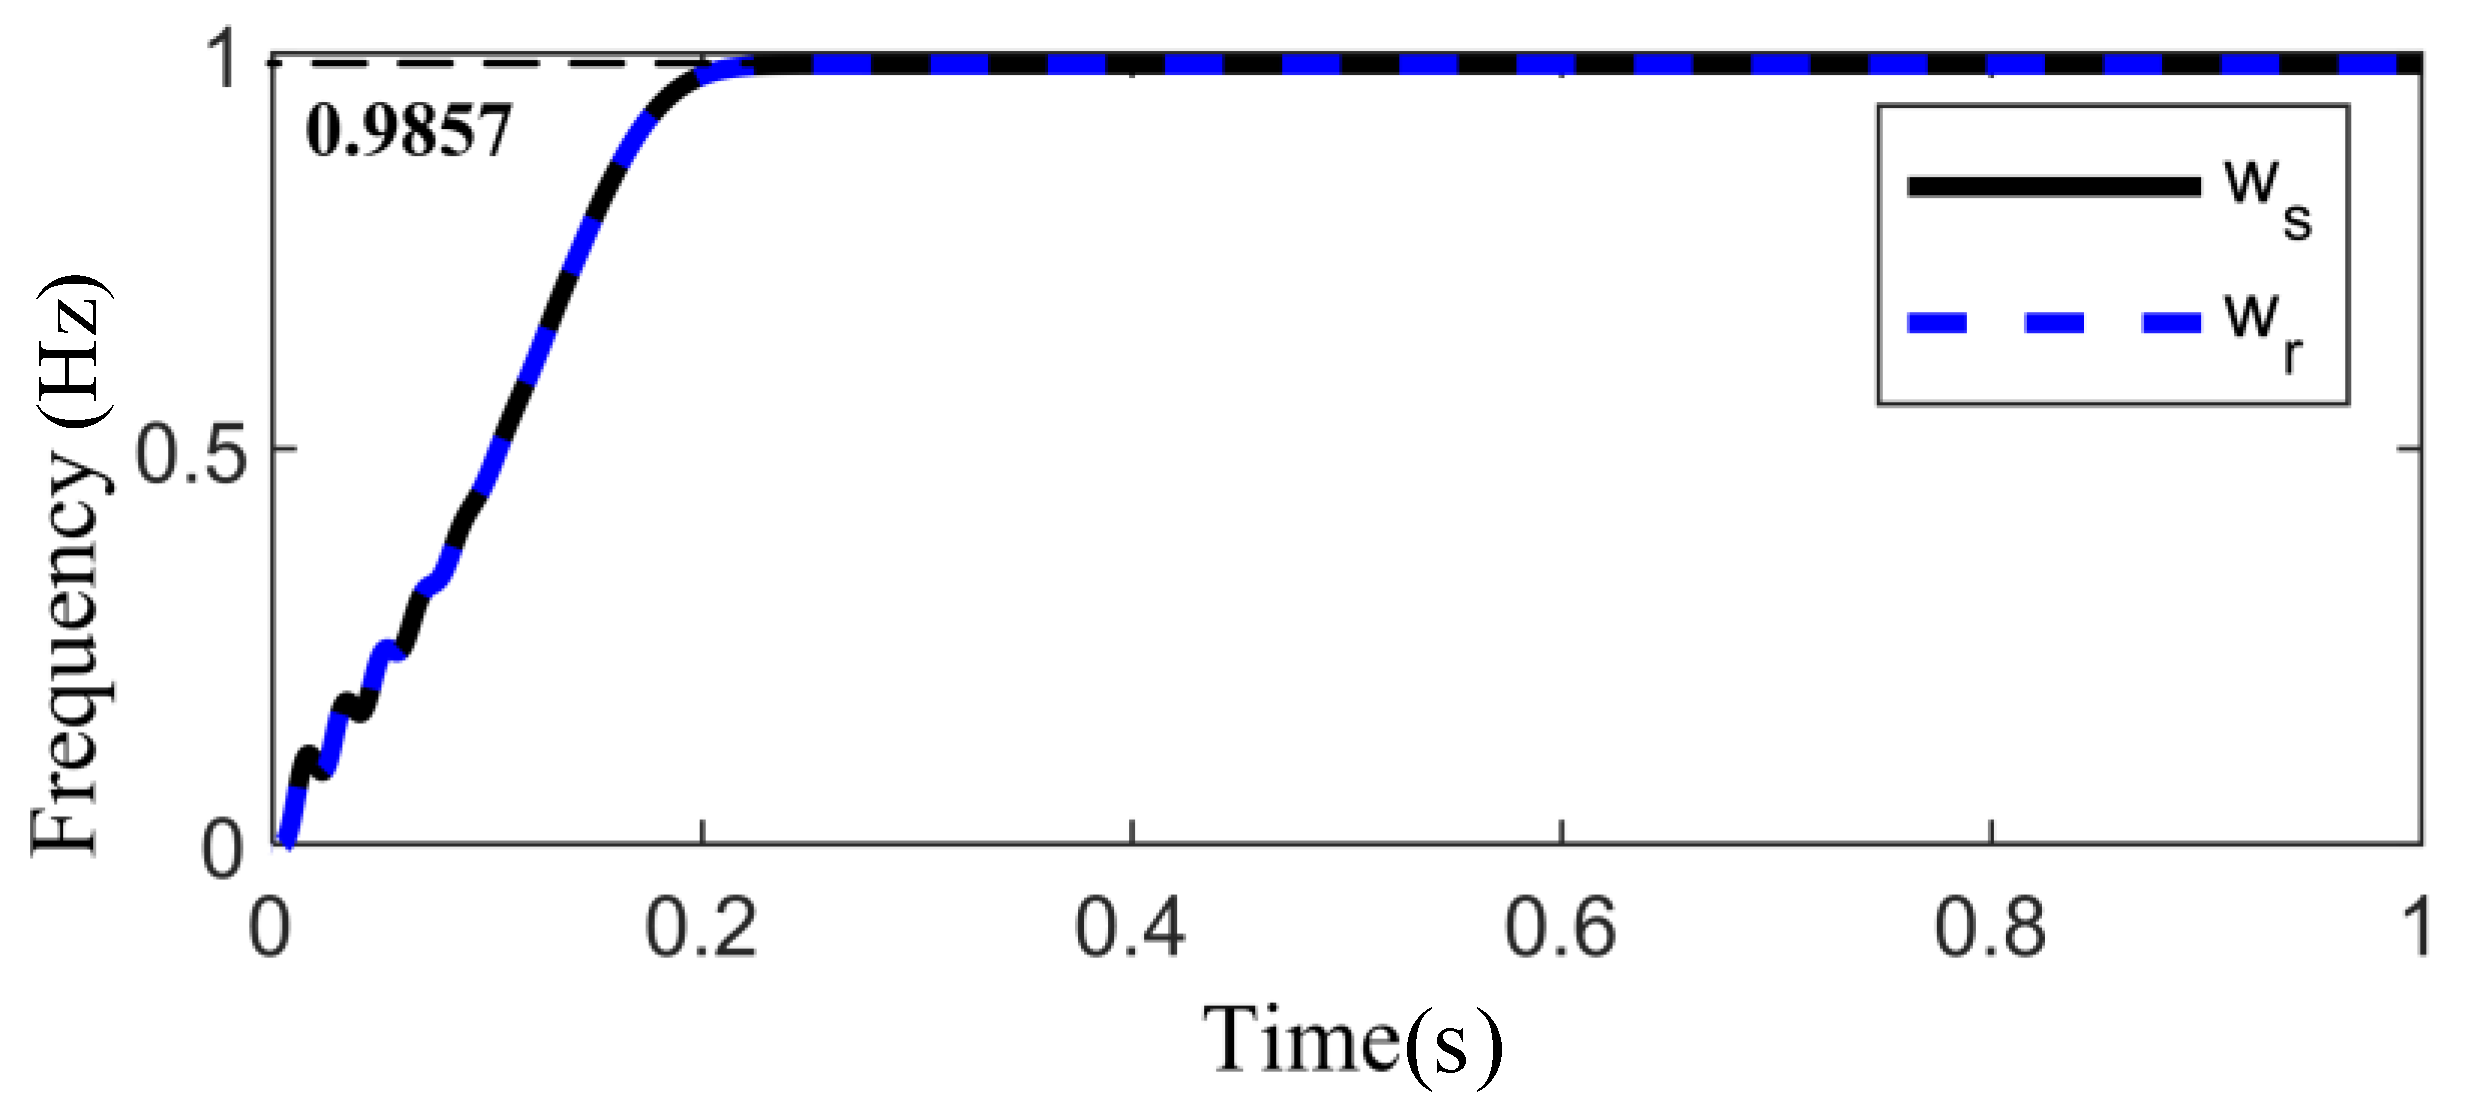
As shown in Figure 5, under the influence of the current of the inter-harmonic frequency component of the asynchronous motor, there is a small disturbance in the frequency at the initial stage. However, after 0.25 s, the frequency of the asynchronous motor begins to stabilize, ω s = 0.9857 p.u.
It is verified that, in the case of a small disturbance current at the inter-harmonic frequency, the frequency of the asynchronous motor can still remain constant, and ω s = ω r at this moment.
(2)
The current of the inter-harmonic frequency component remains three-phase symmetrical.
As shown in Figure 6, under the excitation of the inter-harmonic component current, the current of the asynchronous motor can maintain three-phase symmetry, and the amplitudes of the straight-axis and cross-axis currents remain consistent, with the q-axis leading the d-axis by 90° in phase. The setting of (7) is correct.
After the Park transformation, the current containing three symmetrical inter-harmonic components is transformed into the inter-harmonic component and the direct current component complementary to the d-q axis. If the direct current component is ignored, the inter-harmonic component current represented by (9) can be obtained.
(3)
Impedance model verification of the asynchronous motor.
The equivalent impedance of the asynchronous motor under the corresponding inter-harmonic frequency is calculated by (12) and compared with the equivalent impedance of the asynchronous motor obtained from the simulation results. The results are shown in Figure 7. The asynchronous motor-load model derived in this subsection is in line with the actual situation.

3. Mechanism Analysis of Inter-Harmonic Amplification Characteristics

The transfer coefficient k is defined to describe the inter-harmonic current amplification characteristics of long-distance transmission lines, and its value is equal to the ratio of the end current of the line I l to the head current of the line I s , as shown in (13):
k = I l I s
The larger the value of k , the more severe the inter-harmonic current amplification phenomenon is, and the greater the threat to the normal operation of the power system.
In this paper, when considering the oscillation problem of renewable energy grid connection, because its oscillation amplitude is relatively small, it is still within the allowable range of linearization. Therefore, all derivation and analysis are based on the premise of a linear system. When facing strong nonlinear scenarios, there may be frequency coupling, resulting in energy transfer between modes, and the frequency domain analysis method will fail; that is, the amplification coefficient formula derived in this paper will be inaccurate.
Combining (1) and (13), the transfer coefficient formula under the single-machine with a constant impedance load system can be further expressed as (14), which is then compared with the simulation results:
k = I l I s = 1 1 + Y α Z α + 2 Y α Z h + Y α 2 Z α Z h
where Z h is the load impedance at the end of the line.
In multi-machine systems, the load impedance model is the inter-harmonic equivalent model of the receiving-end grid’s component network, and Z h can be expressed as follows:
Z h m u l t i = ( k = 1 N 1 Z h , k ) 1
where Z h , k is the impedance of the k-th device (e.g., inverter or synchronous generator).
This aggregation enables the single-machine model to represent multi-machine scenarios by setting Z h s i n g l e = Z h m u l t i . Equation (15) assumes devices operate with compatible control objectives (e.g., all in grid-following mode). If devices have conflicting controls, such as grid-forming and grid-following, their impedances cannot be directly paralleled. An aggregation method for such cases is derived in [26].
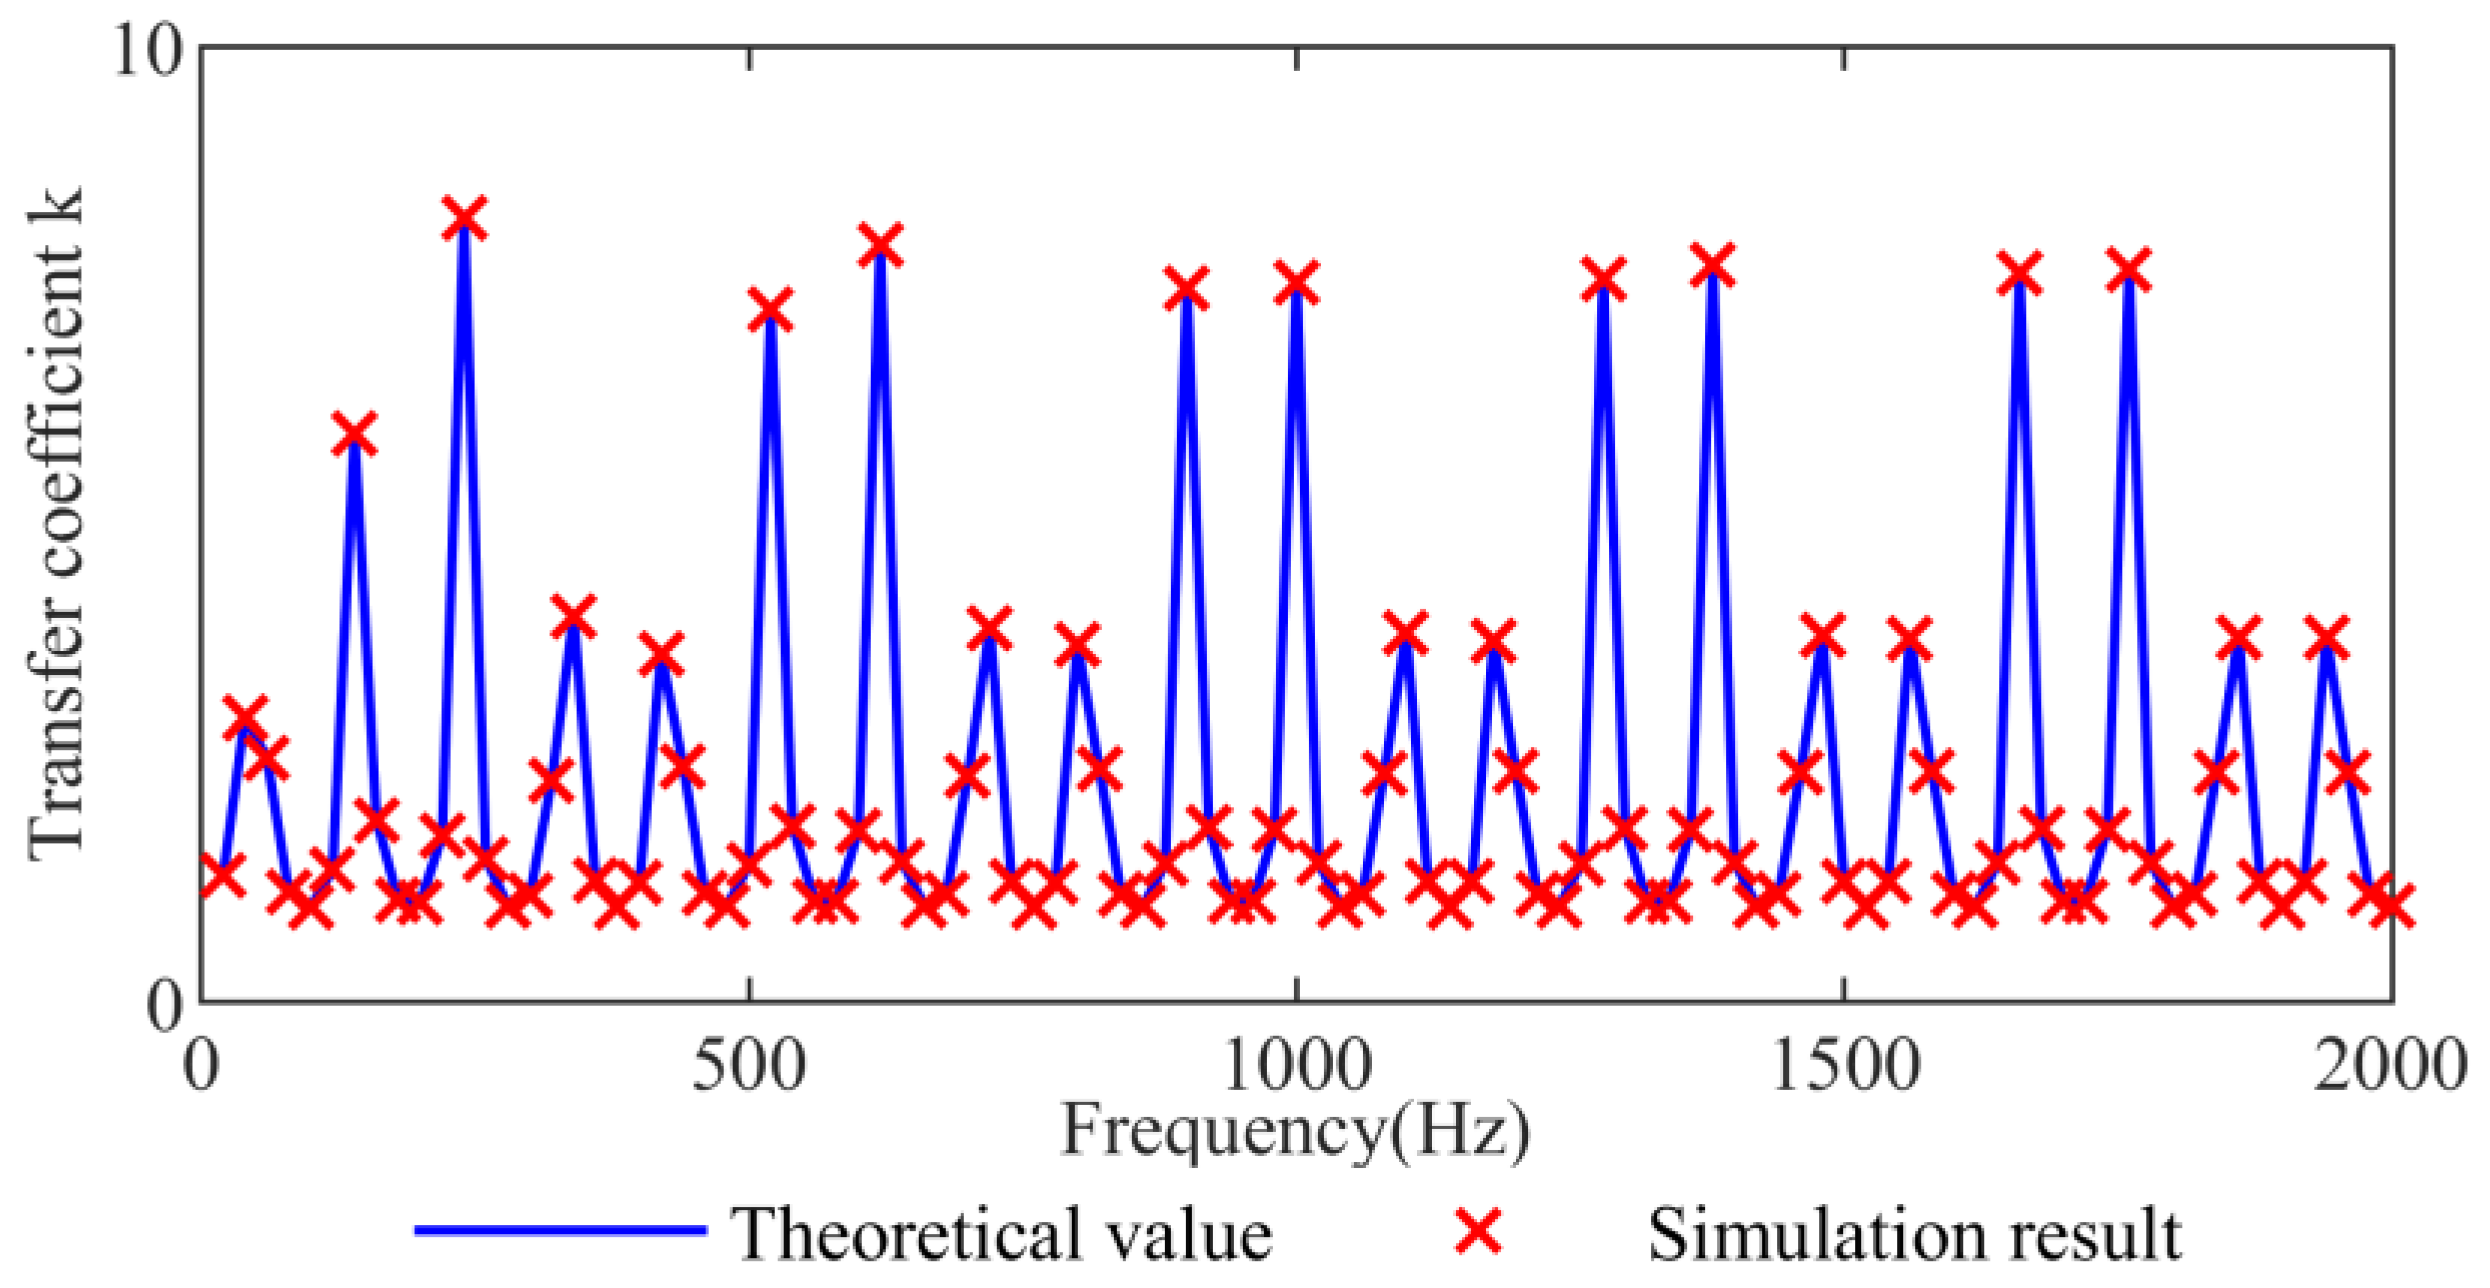
The comparison results of the inter-harmonic amplification characteristics in the frequency domain are shown in Figure 8. It can be observed that when the frequency of the injected oscillation current of the head-end unit is a non-fundamental frequency, the transfer coefficient k > 1 at some frequencies, and there is an inter-harmonic current amplification phenomenon.
To validate the inter-harmonic amplification phenomenon of the transmission line in the time domain, injecting the oscillation current into the head-end unit, respectively, which covers low, sub/super-synchronous, and medium-high frequency. Then, compare the current magnitudes at the two ends of the line. As shown in Figure 9, there are inter-harmonic amplification phenomena at a wide frequency range from low frequency to high frequency in Figure 9a, Figure 9b, and Figure 9c, respectively.
For the purpose of studying the propagation characteristics of inter-harmonics along long-distance transmission lines more conveniently, (14) is simplified by omitting the load at the end of the line, which means Z h = 0 , in which case, we studied the propagation characteristics of long-distance transmission lines when the end of the line is grounded. The case that Z h 0 is also analyzed in the following content. When Z h = 0 , (14) can be simplified as k = I l / I s = 1 / ( 1 + Y α Z α ) , and we can come to the conclusion that the main parameter affecting the transfer coefficient is Y α Z α .
According to (4), the parameter Y α Z α can be calculated as follows:
Y α Z α = a cos ω τ + i b sin ω τ + c
where a = 2 1 + h 2 / 1 + h 2 , b = 2 1 h 2 / 1 + h 2 , c = 2 1 + h 2 / 1 + h 2 .
The trajectory of the parameter Y α Z α in (16) can be mathematically interpreted as an ellipse located on the x-axis. The problem of obtaining the maximum value of the transfer coefficient k can be converted into the minimum value of the distance from the node (−1, 0) to the ellipse; that is, the ellipse and the circle with (−1, 0) as the center are inscribed. Combining the elliptic equation and the circular equation, the frequency of extreme value and the corresponding extreme value of the transfer coefficient k can be calculated as follows:
f = ± arccos ( x / a ) 2 π τ + N τ k max = 1 r = b 2 a 2 a 2 c + 1 2 + c + 1 2 + b 2 b 2 a 2
where f is the frequency of the extreme value of the transfer coefficient; k max is the corresponding extreme value of the transfer coefficient; N is a natural number; x = a 2 ( c + 1 ) / ( b 2 a 2 ) .
According to (17), the accuracy of the frequency of extreme value and the corresponding extreme value calculation of the inter-harmonic amplification model can be verified, respectively.
The parameters of a 1000 km transmission line are given as follows: resistance 6.29 × 10⁻² Ω/km, capacitance 8.57 × 10⁻⁹ F/km, inductance 1.61 × 10⁻³ H/km; then, verify the accuracy of the frequency of the extreme value of inter-harmonics amplification.
Then, verify the accuracy of the extreme value of inter-harmonics amplification when transmission lines’ resistance and capacitance are set to 5.29 × 10⁻² Ω/km and 8.77 × 10⁻⁹ F/km, and inductance is set to 1.40 × 10⁻³ H, 2.80 × 10⁻³ H, 4.20 × 10⁻³ H, 5.60 × 10⁻³ H, 7.00 × 10⁻³ H, 8.40 × 10⁻³ H, 9.80 × 10⁻³ H, 11.20 × 10⁻³ H per kilometer, respectively.
As shown by the data comparison in Table 1 and Table 2 below, (17) is accurate.
During the design of long-distance transmission line parameters, Equation (17) can be referenced to avoid resonant frequencies and minimize the magnitude of the transfer coefficient, thereby reducing the impact of inter-harmonic amplification on system stability.

4. Influencing Factors and Suppression Measures of Inter-Harmonic Amplification Characteristics

4.1. Analysis of Influencing Factors

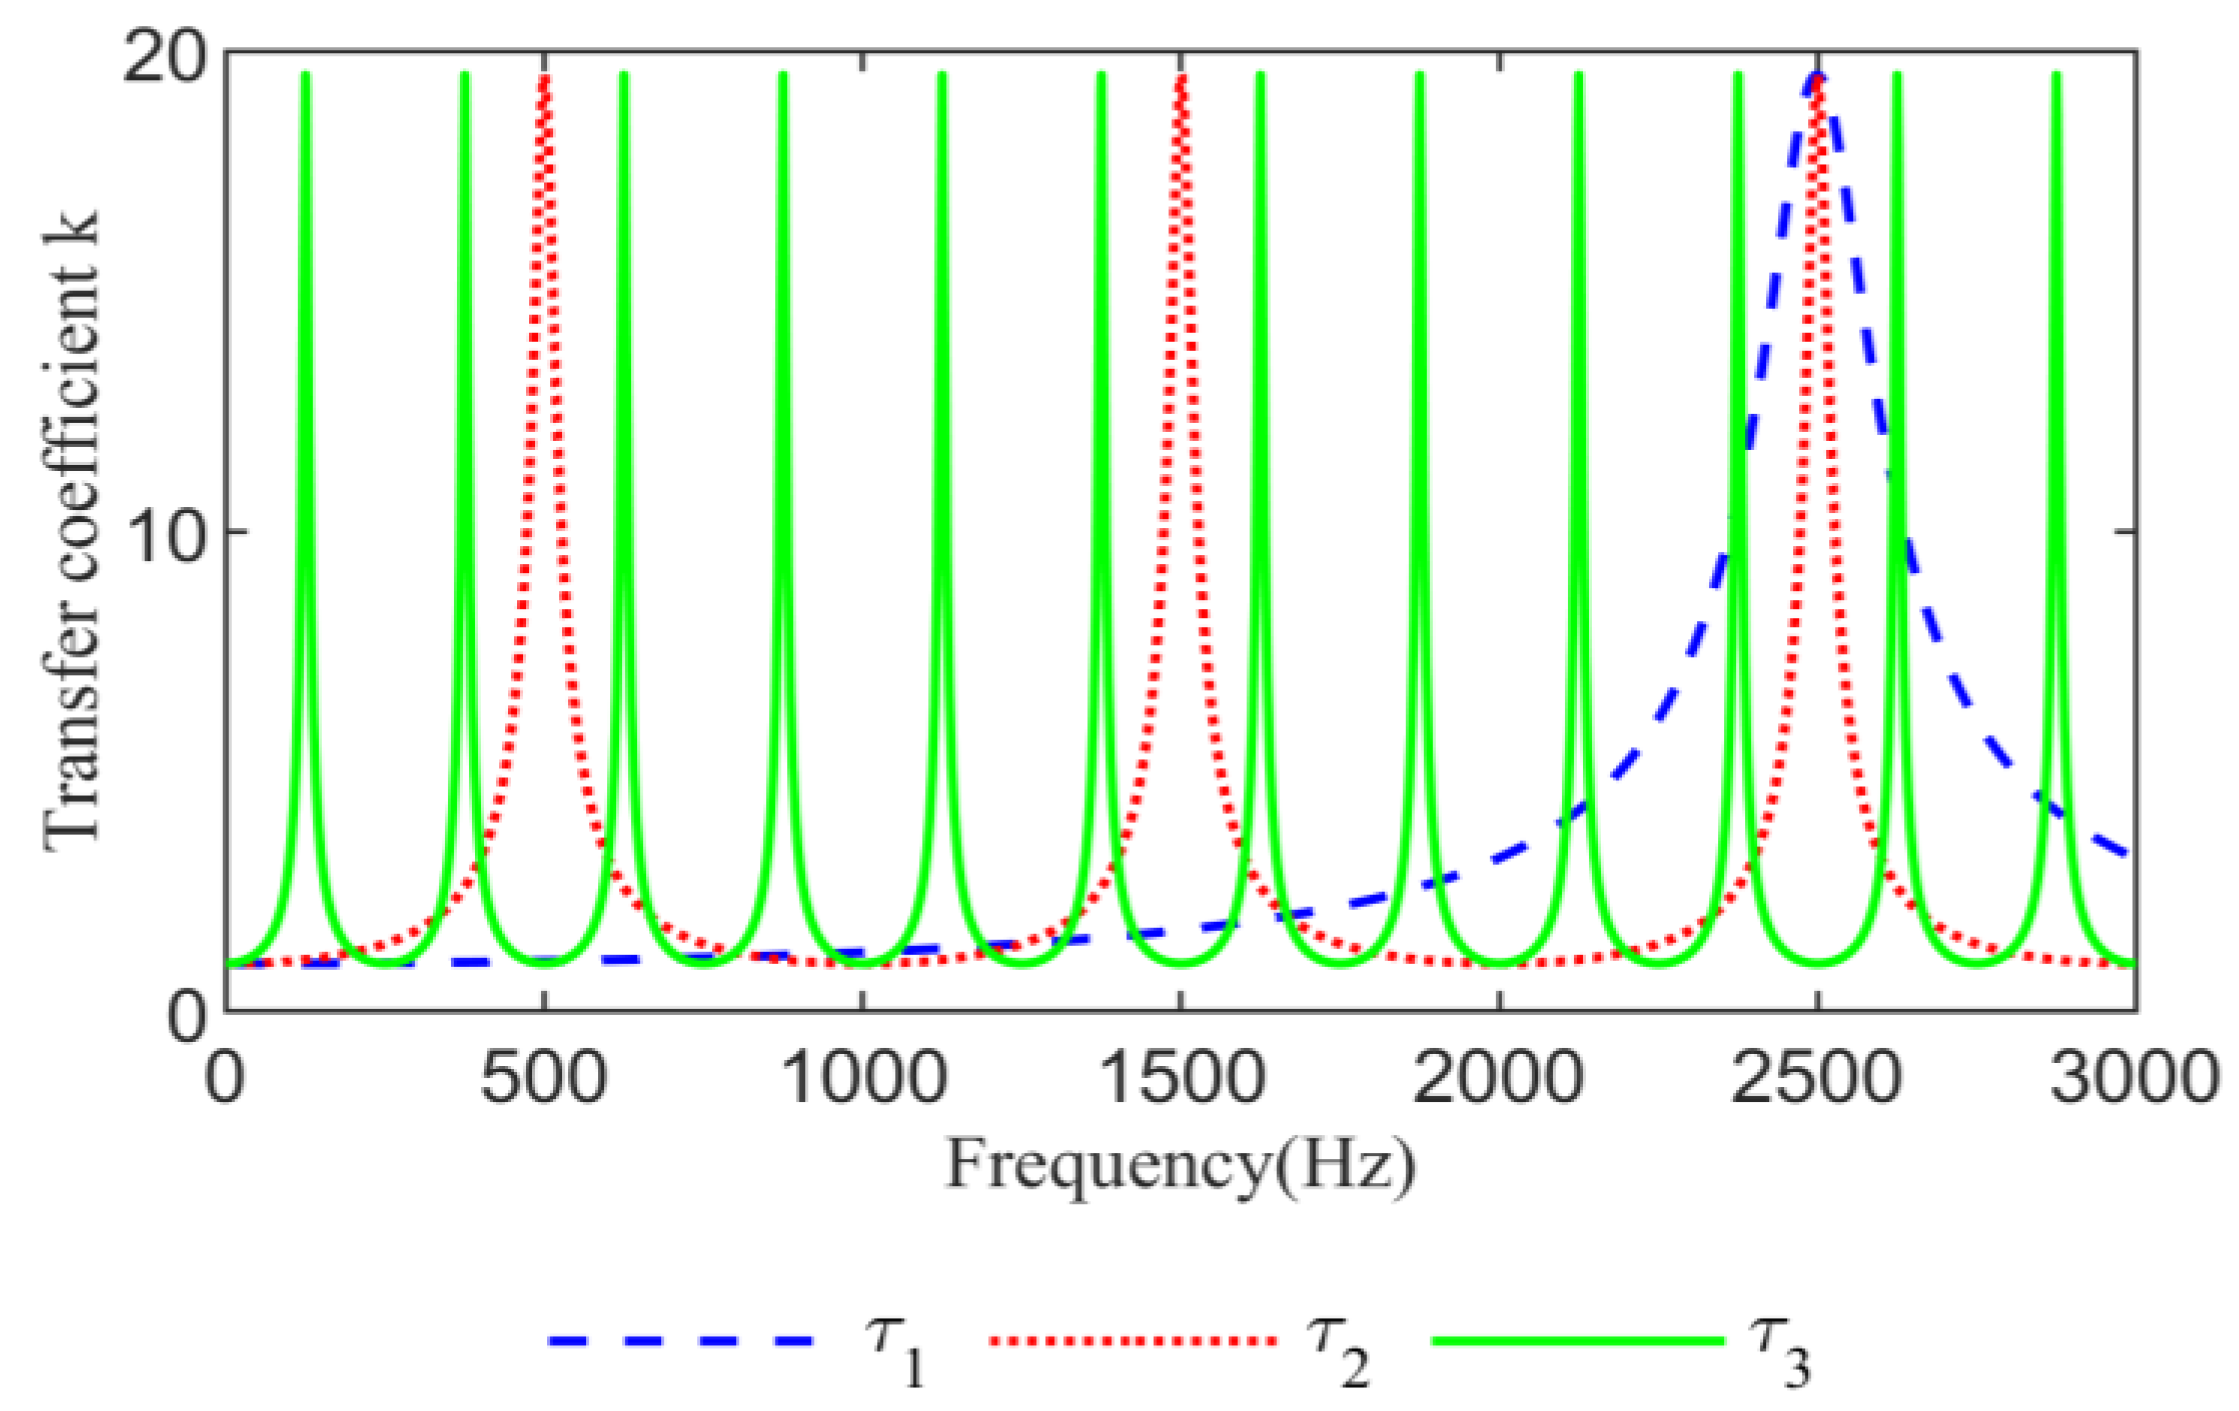
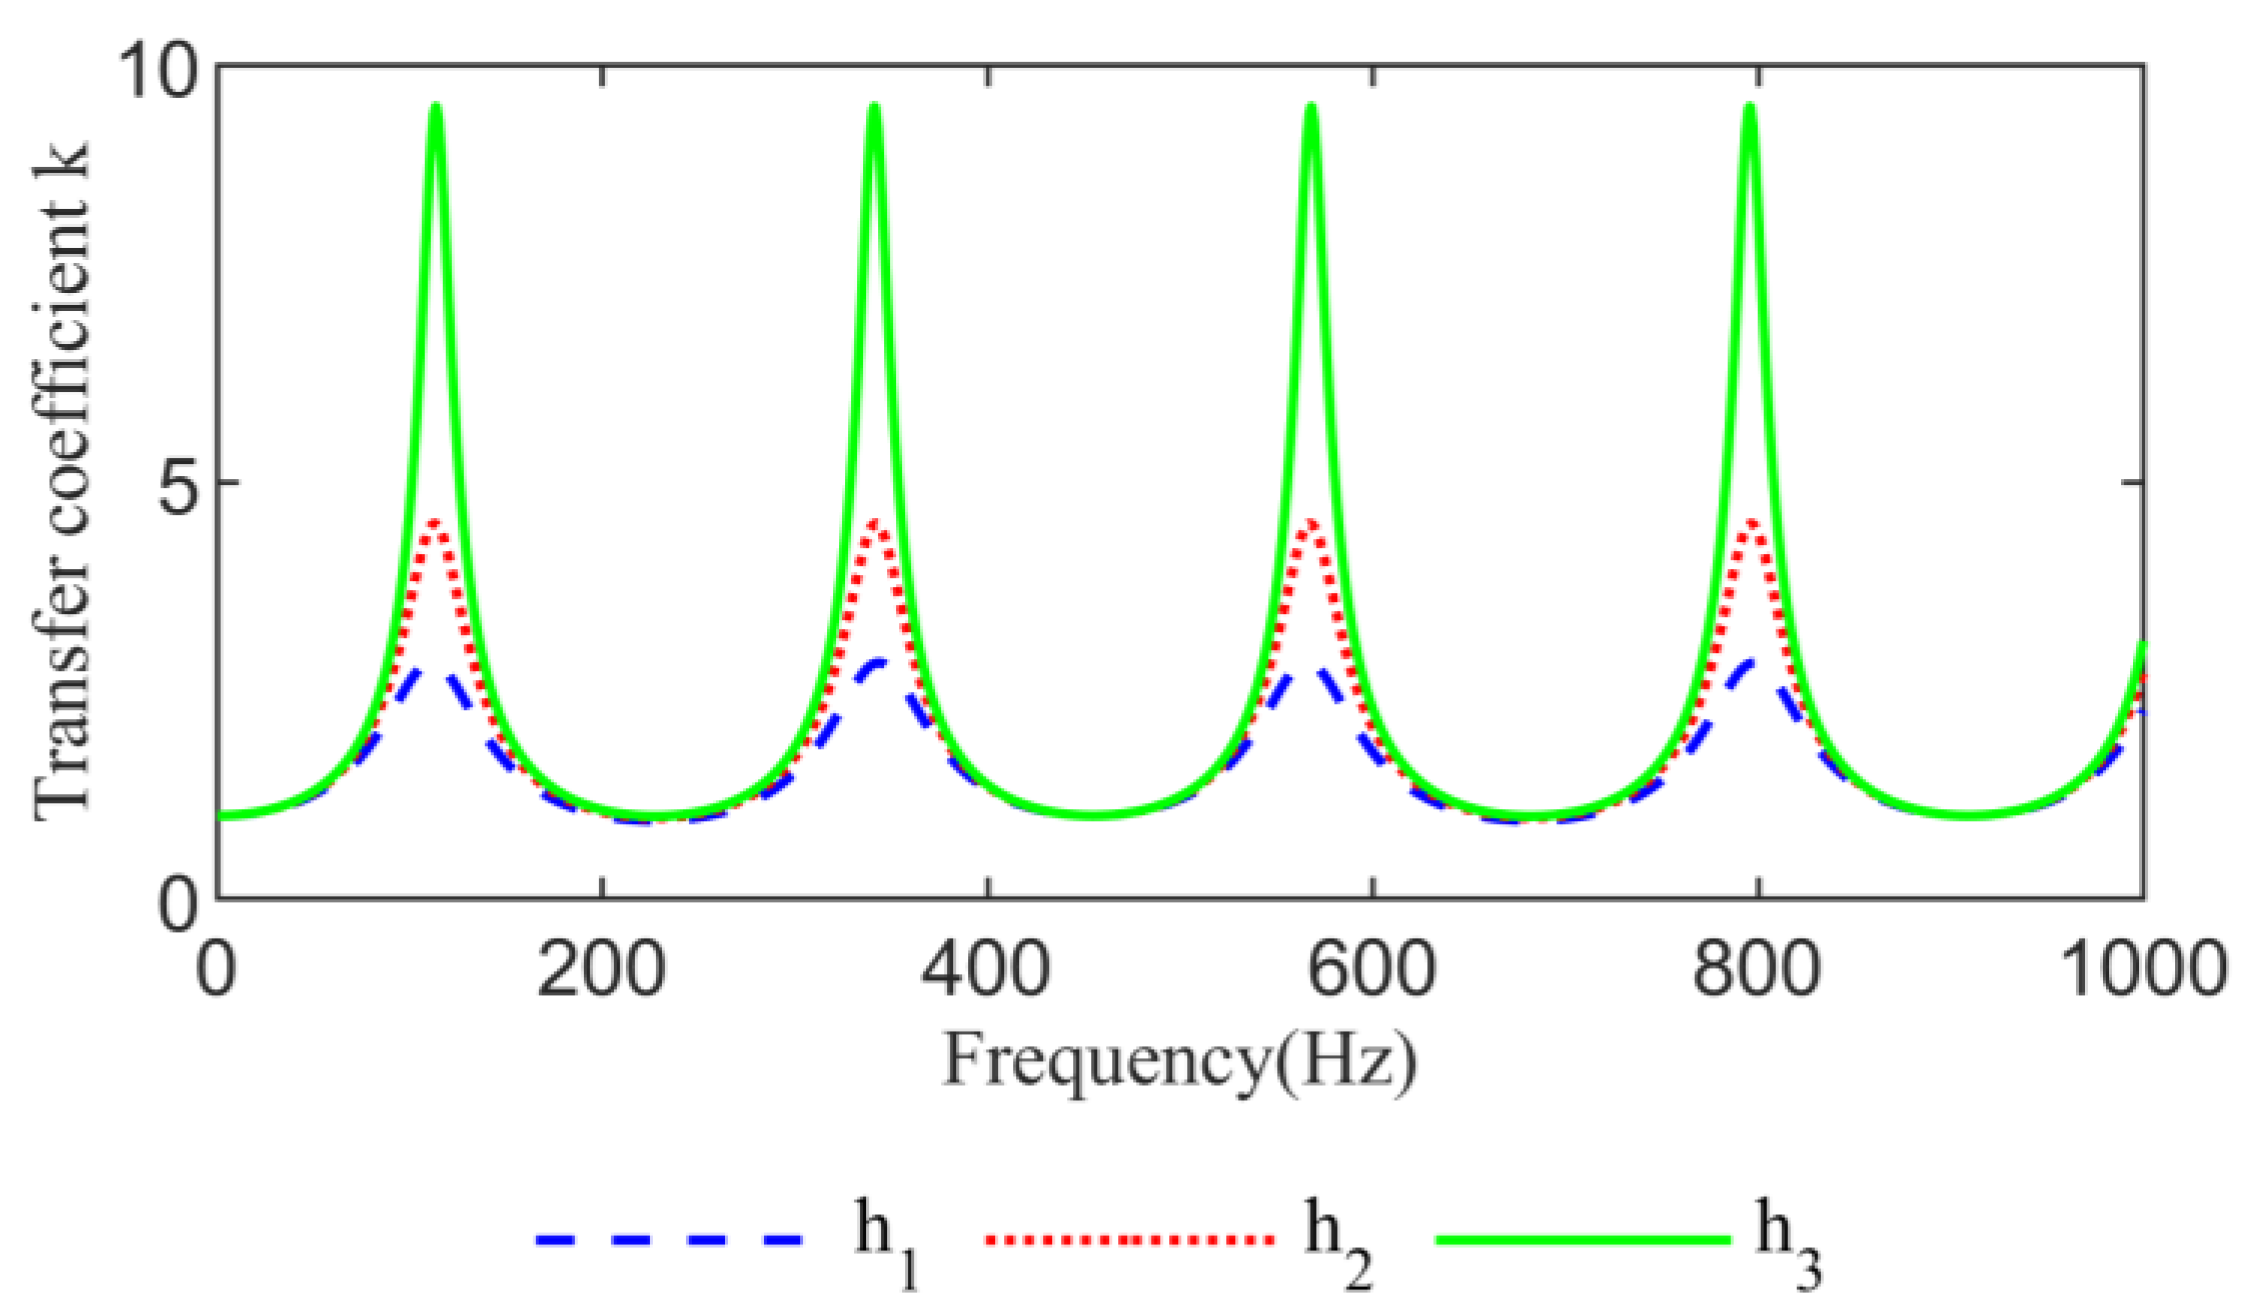
It can be seen from (16) that the inter-harmonic amplification transfer coefficient is directly related to the delay τ and structural parameters h of long-distance transmission lines.
In Figure 10, the relationship among the delays of the transmission lines is τ 1 < τ 2 < τ 3 , which mainly affects the frequency of the extreme value of the inter-harmonic amplification transfer coefficient. The smaller τ is, the higher the frequency of the first inter-harmonic amplification phenomenon occurs, and the larger the frequency interval between adjacent extreme values, which reflects the suppression effect on inter-harmonic amplification.
In Figure 11, the relationship among structural parameters of the transmission lines is h 1 < h 2 < h 3 , which mainly affects the extreme value of the inter-harmonic amplification transfer coefficient. The smaller h is, the smaller the corresponding transfer coefficient is, which reflects the suppression effect on inter-harmonic amplification.
The delay τ and structural parameters h are related to the distance d of the long-distance transmission line, the resistance r , inductance l , and capacitance c of per kilometer of the line.
In detail, the delay τ is proportional to line distance d , inductance l , and capacitance c . The structural parameter h is proportional to the inductance l , and inversely proportional to the resistance r , capacitance c , and line distance d .
Firstly, taking line distance d as an example, consider the influence of d , l , and c on delay τ , which in turn influences the frequency of extreme value of inter-harmonic amplification.
As shown in Figure 12, when d is 500 km, 750 km, 1000 km, and 1250 km, respectively, as the distance d becomes larger, the frequency of the first extreme value becomes lower, and the frequency interval between adjacent extreme values becomes smaller.
Secondly, set different values for parameters d , r , l , and c of long-distance transmission lines, respectively, and then consider their influences on the extreme value of inter-harmonics amplification.
As evidenced in Figure 13, the proportional relationships between the inter-harmonic amplification extreme values and various parameters are consistent with (6). As shown in Figure 13a,c,d, when the resistance of the transmission line increases, the extreme value of the transfer coefficient tends to decrease, as does the capacitance and line distance. While the inductance and the extreme value show a proportional trend in Figure 13b.

4.2. Sensitivity Analysis

The mathematical model established in this paper is highly dependent on the accurate identification of transmission line parameters, while these parameters may change due to environmental factors, equipment aging, or measurement errors. The following shows the sensitivity of the established transfer coefficient amplification model to changes in line and load parameters.
The sensitivity calculation of the transfer coefficient to each parameter can be formulated as follows:
k Z α = Y α ( 1 + Y α Z h ) ( 1 + Y α Z α + 2 Y α Z h + Y α 2 Z α Z h ) 2
k Y α = Z α + 2 Z h + 2 Y α Z α Z h ( 1 + Y α Z α + 2 Y α Z h + Y α 2 Z α Z h ) 2
k Z h = 2 Y α + Y α 2 Z α ( 1 + Y α Z α + 2 Y α Z h + Y α 2 Z α Z h ) 2
Then, the normalized sensitivity S k X = X k k X for each parameter:
S k Z α = Y α Z α ( 1 + Y α Z h ) 1 + Y α Z α + 2 Y α Z h + Y α 2 Z α Z h
S k Y α = Y α ( Z α + 2 Z h + 2 Y α Z α Z h ) 1 + Y α Z α + 2 Y α Z h + Y α 2 Z α Z h
S k Z h = Z h ( 2 Y α + Y α 2 Z α ) 1 + Y α Z α + 2 Y α Z h + Y α 2 Z α Z h
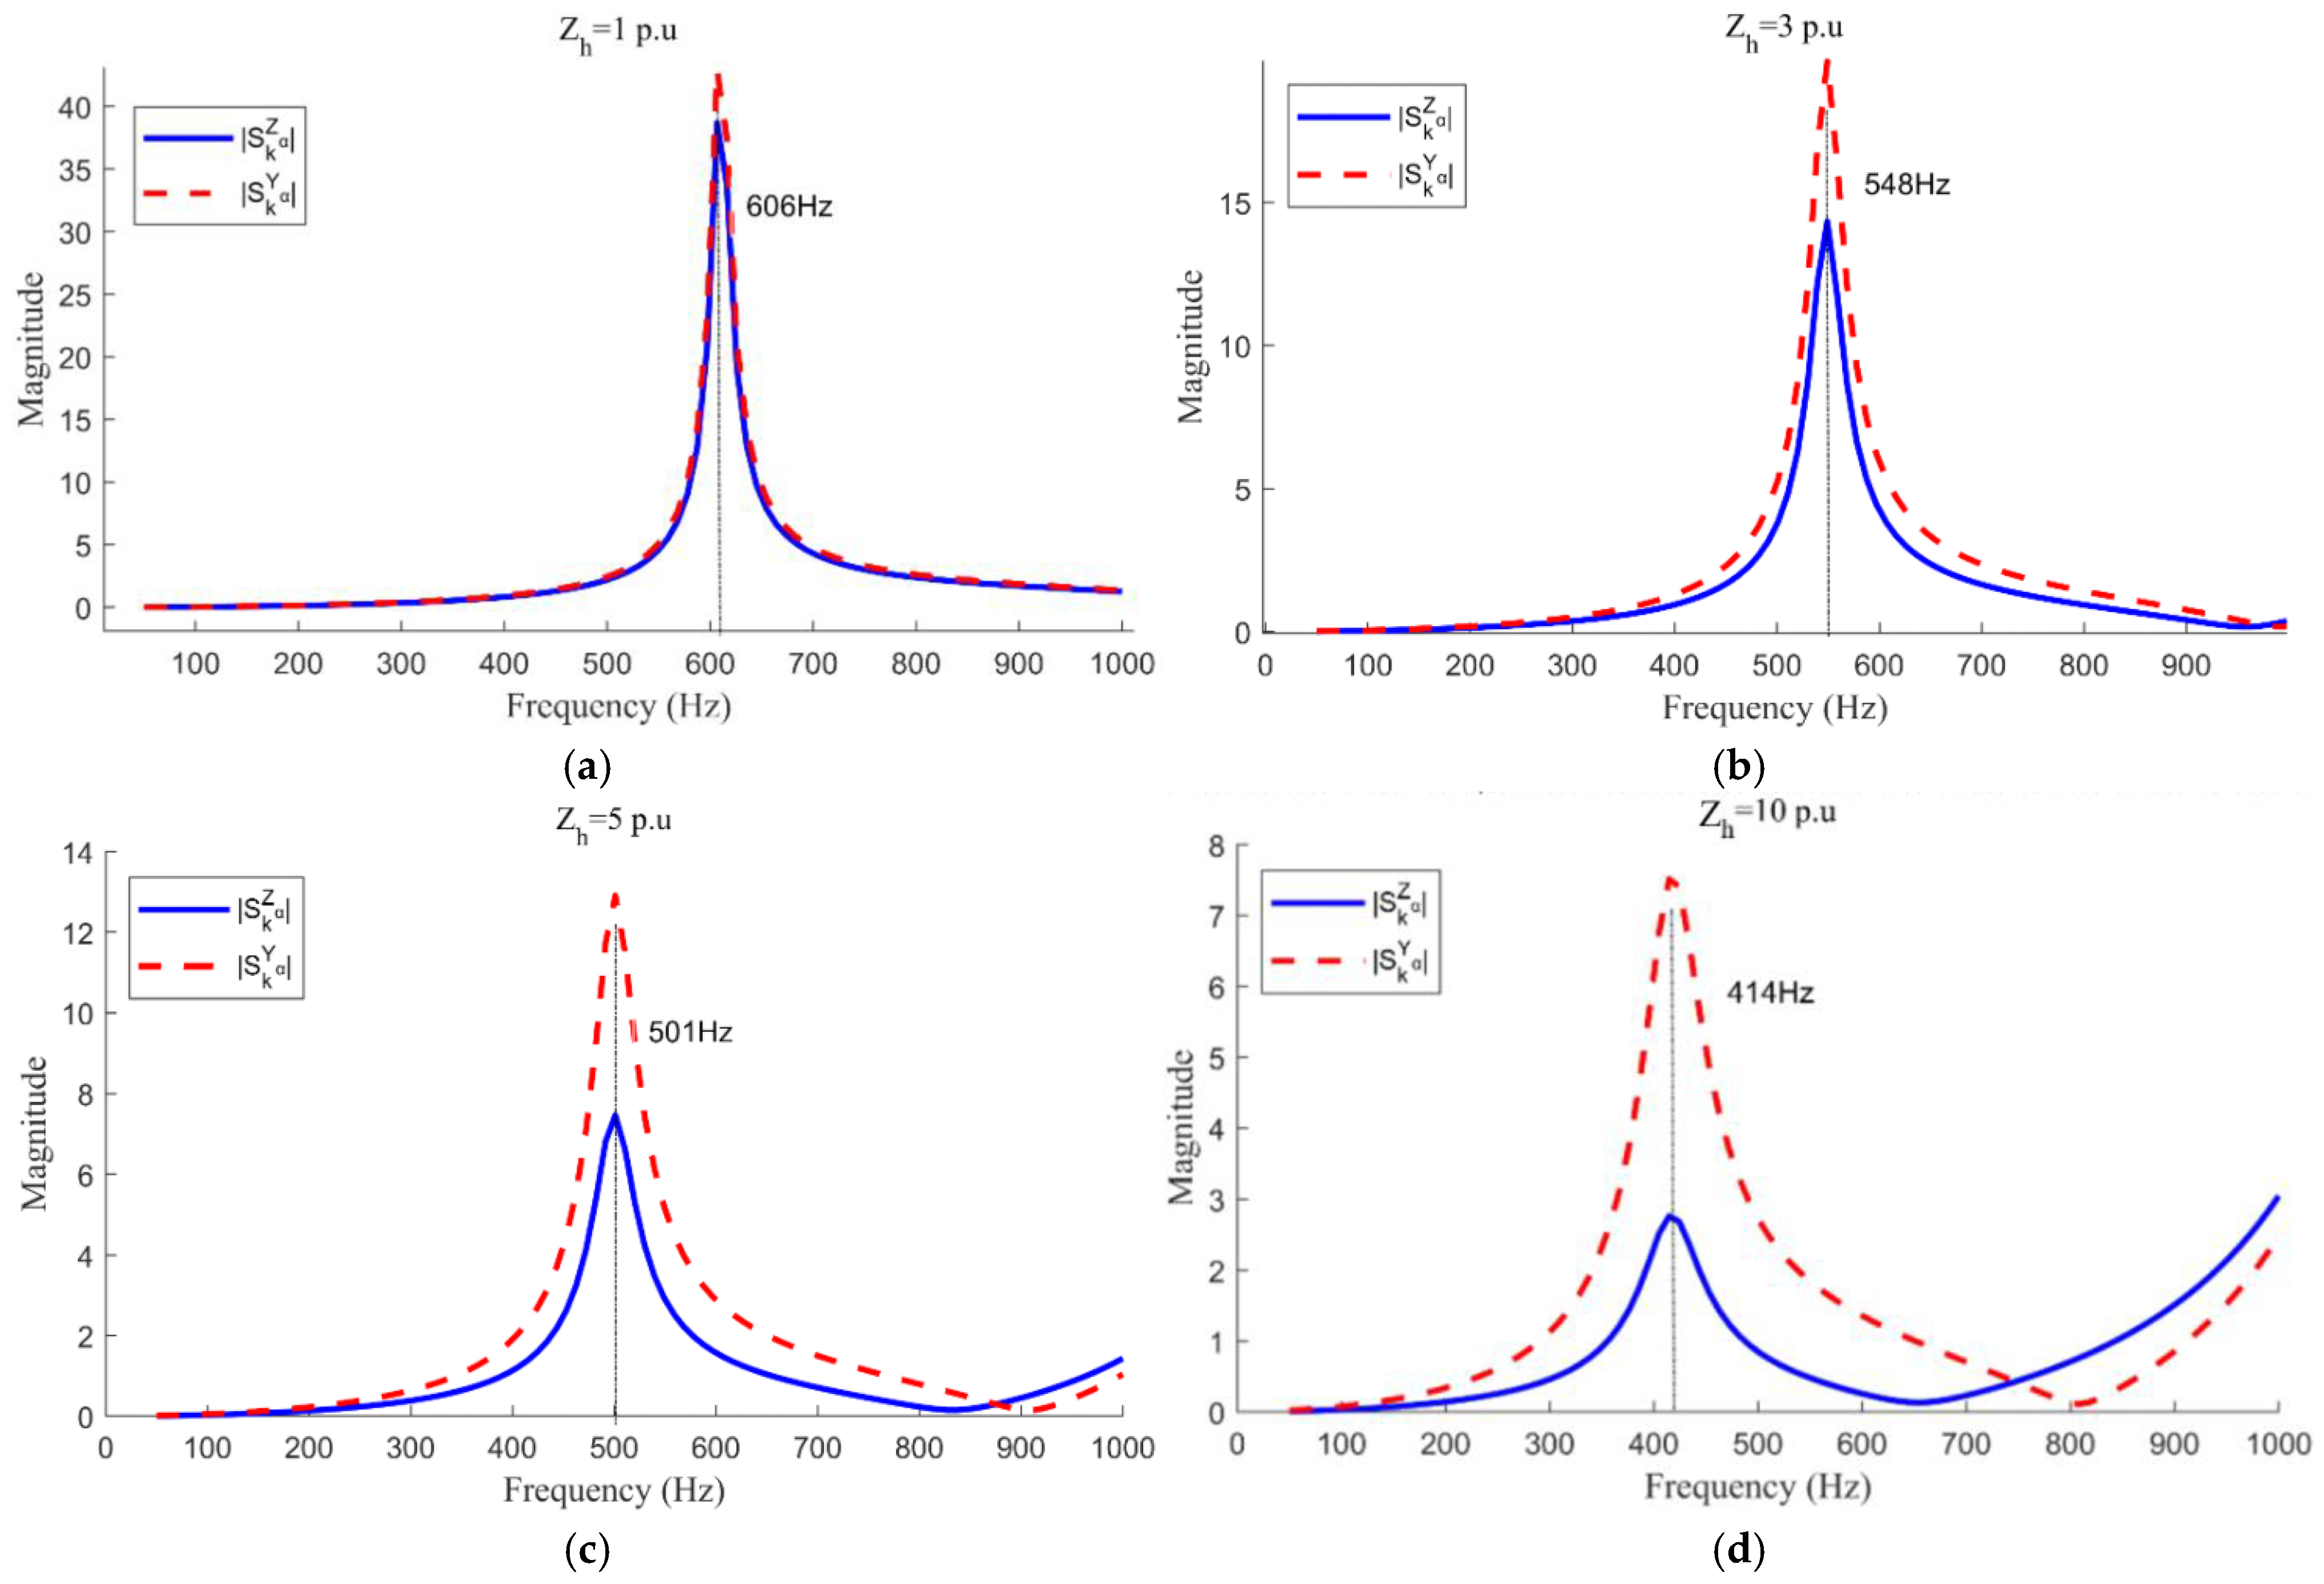
The parameters are given in Appendix A, and the normalized sensitivity of the transfer coefficient is obtained by setting the changing load impedance, as shown in Figure 14.
It can be seen from the Figure 14 that the line parameters and load impedance changes will lead to different oscillation frequencies of oscillation amplification, which is also consistent with the phenomenon of oscillation amplification in the process of new energy grid-connected transmission through long-distance AC transmission lines.

4.3. Suppression Measures

From the analysis of the influence factors of inter-harmonic amplification in subsection A, it can be seen that the inter-harmonic current amplification phenomenon of long-distance transmission lines is closely related to the parameters of long-distance transmission lines. In order to minimize its impact on the safe operation of the power grid and improve the power quality and stability, the transmission line is required to have a smaller inductance and larger resistance. However, transmission line parameters are limited by actual engineering conditions, and it is necessary to transmit certain active power to the receiving end and reduce the network loss as much as possible. Therefore, when studying the suppression measures of inter-harmonic amplification, we need to start from a strategy other than changing transmission line parameters.
This subsection considers changing the load Z h at the end of the line to achieve the purpose of suppressing inter-harmonic amplification. In engineering practice, this is commonly achieved by connecting RLC components in series or parallel on the load side. Diverging from prior studies focused on line parameter optimization, this work proposes a load-side impedance adjustment strategy. By strategically increasing capacitive components and reducing resistive/inductive elements, the transfer coefficient k is effectively suppressed without altering transmission line infrastructure, aligning with practical grid operation constraints.
According to (14), when Z h = 0 , which means ignoring the load at the end of the line, the extreme value problem of the transmission coefficient k can be converted into the minimum value problem of the distance from the node (−1, 0) to the ellipse, and the center of the ellipse is (c, 0).
If considering the load at the end of the line, the center of the above ellipse is offset relative to (c, 0), and the offset is 2 Y α Z h + Y α 2 Z α Z h , in which condition the extreme value is still the minimum value of the distance from the node (−1, 0) to the ellipse.
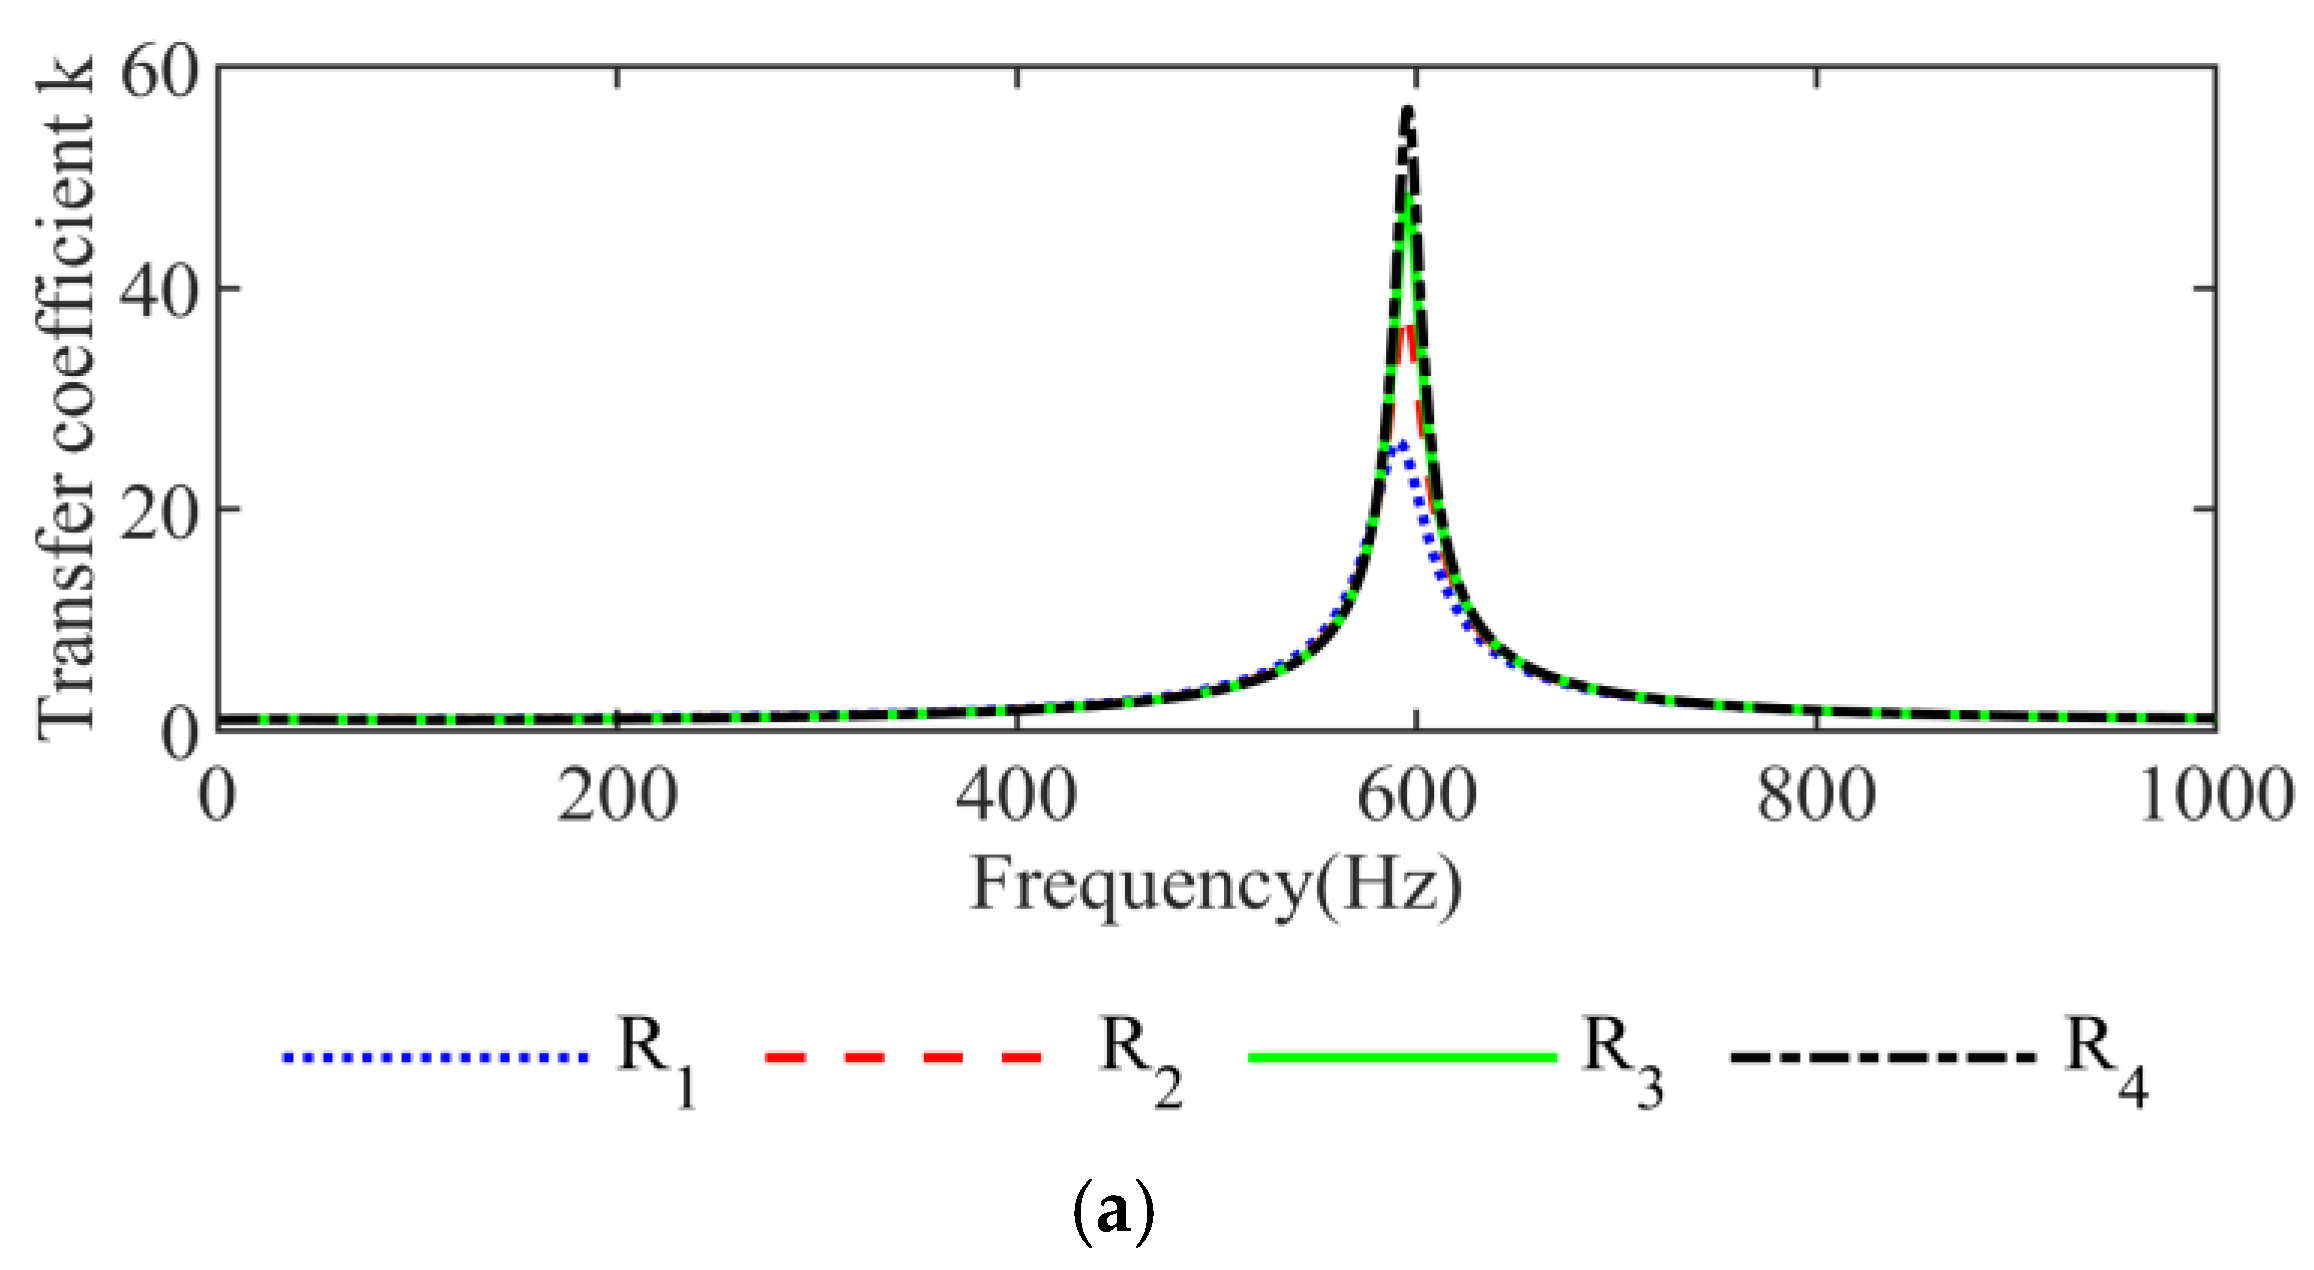
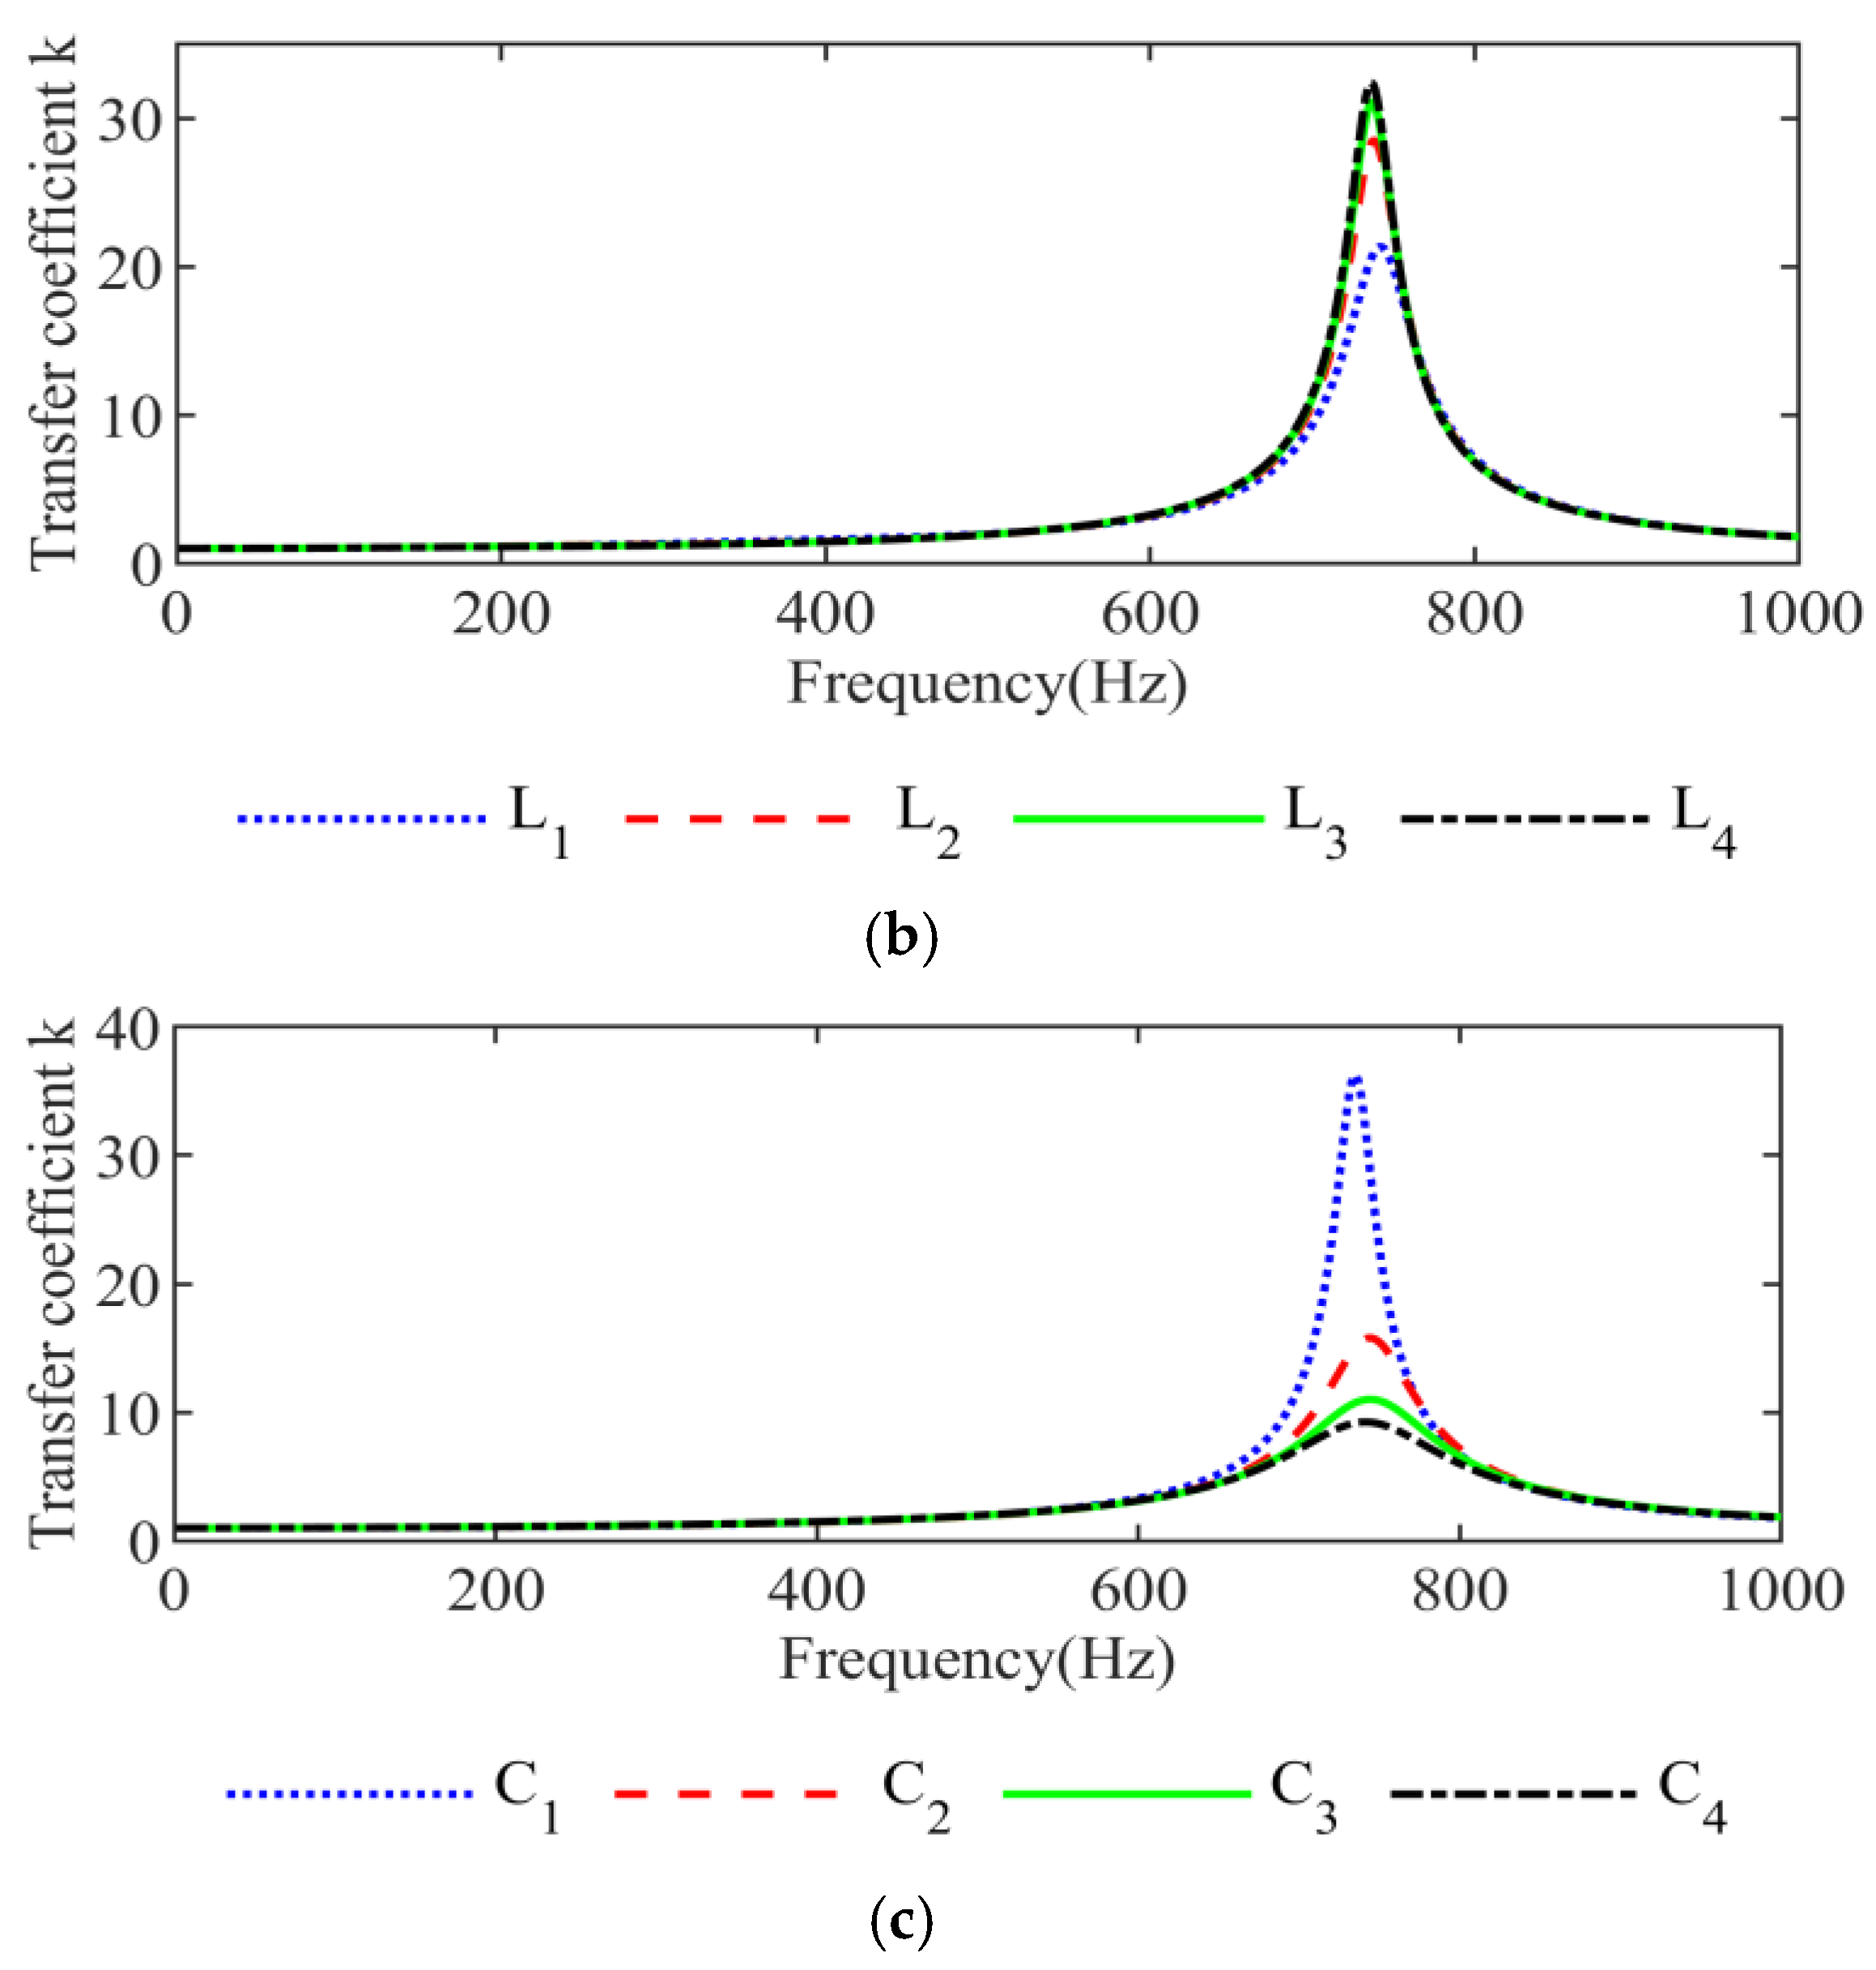
The constant impedance load is used in the single-machine with load model. During simulation, the resistance, inductance, and capacitance of the constant impedance load are changed, respectively, in order to observe the variation law of the transfer coefficient k to find a feasible measure to suppress the inter-harmonic amplification.
InFigure 15, the relationships among load parameters are R 1 < R 2 < R 3 < R 4 , L 1 < L 2 < L 3 < L 4 , C 1 < C 2 < C 3 < C 4 . It can be seen that the resistance and inductance in the load impedance at the end of the line are proportional to the inter-harmonic amplification transfer coefficient k in Figure 15a,b, and the capacitance is inversely proportional to the transfer coefficient k in Figure 15c, which is consistent with the suppression effect of changing the impedance parameters of long-distance transmission lines on inter-harmonic amplification in Section 4.1. Therefore, it can be considered to input capacitance and remove resistance and inductance on the load side to suppress the inter-harmonic amplification phenomenon that may exist during the transmission of energy through long-distance transmission lines under renewable-energy integration scenarios.

5. Conclusions

The wide-band oscillation of renewable-energy grid connection will cause the inter-harmonic current to propagate on the grid side, and the transmission of inter-harmonic current in the grid is affected by factors such as load and line parameters. The inter-harmonic amplification phenomenon generated during the transmission process will cause the wide-band oscillation to propagate and amplify through long-distance AC transmission lines, which will seriously affect the safe and stable operation of bulk power grids.
The novelty of this paper lies in correlating the resonant characteristics with the wideband oscillation amplification mechanism, which has not been fully studied in the existing literature. In this paper, the derived mathematical relationships between line parameters elucidate the coupling effects of distributed parameters on wide-band oscillation propagation. The proposed suppression strategy, leveraging load impedance adjustment, circumvents the constraints of fixed line parameters in actual grids, offering an efficient and practical method for real-world engineering applications. Simulation results confirm that capacitive compensation at the load side significantly reduces the transfer coefficient k, thereby enhancing grid stability. The main limitation of this paper lies in the fact that the adopted model does not fully account for the impact of actual load characteristics, and the conclusions require further validation through practical long-distance AC system measurements in future research.

Author Contributions

Conceptualization, N.L.; formal analysis, N.L. and B.J.; methodology, B.J.; project administration, Y.L. and C.F.; software, N.L. and B.J.; supervision, C.F. and Y.Y.; validation, Y.L., X.Y. and Y.Y.; writing—original draft, N.L.; writing—review and editing, N.L., C.F., X.Y. and Y.Y. All authors have read and agreed to the published version of the manuscript.

Funding

This work was supported by the State Grid Corporation of China under Grant 5108-202416047A-1-1-ZN: Research and application of local real-time monitoring and alarm technology for wide frequency oscillation in new power system.

Data Availability Statement

The data that support the findings of this study are available from the corresponding author upon reasonable request.

Conflicts of Interest

Author Chen Fan was employed by the NARI, Author Yudun Li was employed by the State Grid Shandong Electric Power Co., Ltd. The remaining authors declare that the research was conducted in the absence of any commercial or financial relationships that could be construed as a potential conflict of interest.

Appendix A

Table A1 provides interpretations for the symbols and parameters involved in this paper. The order of symbols and parameters corresponds to the order in their interpretations.
Table A1. Interpretations for the symbols and parameters involved in this paper.
Symbols and ParametersInterpretations
I s and I l The inflow current and outflow current of a two-port transmission line
U s and U l The input and output terminal voltages of a two-port transmission line
Z α and Y α The line impedance and line-to-ground admittance of a two-port transmission line
Z h The load impedance of a two-port transmission line
h The line structure parameter of a long-distance transmission line
τ The line delay of a long-distance transmission line
Z The impedance of a long-distance transmission line
I s h and I l h The transferred current at the head and end of a long-distance transmission line
r , l and c The resistance, inductance, and capacitance of a long-distance transmission line per kilometer
u d s and u q s The voltage of the stator d-axis and stator q-axis of an asynchronous motor
u d r and u q r The voltage of the rotor d-axis and rotor q-axis of an asynchronous motor
R s and R r The resistance of the stator winding and rotor winding of an asynchronous motor
ψ d s and ψ q s The flux linkage of the stator d-axis and stator q-axis of an asynchronous motor
ψ d r and ψ q r The flux linkage of the rotor d-axis and rotor q-axis of an asynchronous motor
i d s and i q s The current of the stator d-axis and stator q-axis of an asynchronous motor
i d r and i q r The current of the rotor d-axis and rotor q-axis of an asynchronous motor
ω s and ω r The electrical angular velocity of the stator and rotor of an asynchronous motor
L s σ , L r σ and L s r The stator inductance, rotor inductance, and mutual inductance of an asynchronous motor
I s s The amplitude of the stator side inter-harmonic current of an asynchronous motor
ω s s The angular frequency of the stator side inter-harmonic component of an asynchronous motor
α The initial phase of the stator side inter-harmonic current of an asynchronous motor
z m The equivalent impedance of an asynchronous motor
k The transfer coefficient
Z h m u l t i The load impedance of multi-machine systems
f The frequency of the extreme value of the transfer coefficient
k max The extreme value of the transfer coefficient
S k Z α , S k Y α and S k Z h The normalized sensitivity for Z α , Y α , and Z h
The parameters required for Figure 14 are provided in Table A2.
Table A2. The parameters required for Figure 14.
ParametersValue
f 150 (Hz)
Z b a s e 5 + j3 ( Ω )
Z α 0.1 + j0.5 ( Ω )
Y α 0.3846 − j1.9231 ( Ω )
Z h 5 + j3 ( Ω )
d 110 (km)
l 0.0014 (H/km)
r 0.0529 ( Ω /km)
c 8.7749 × 10 9 (S/km)
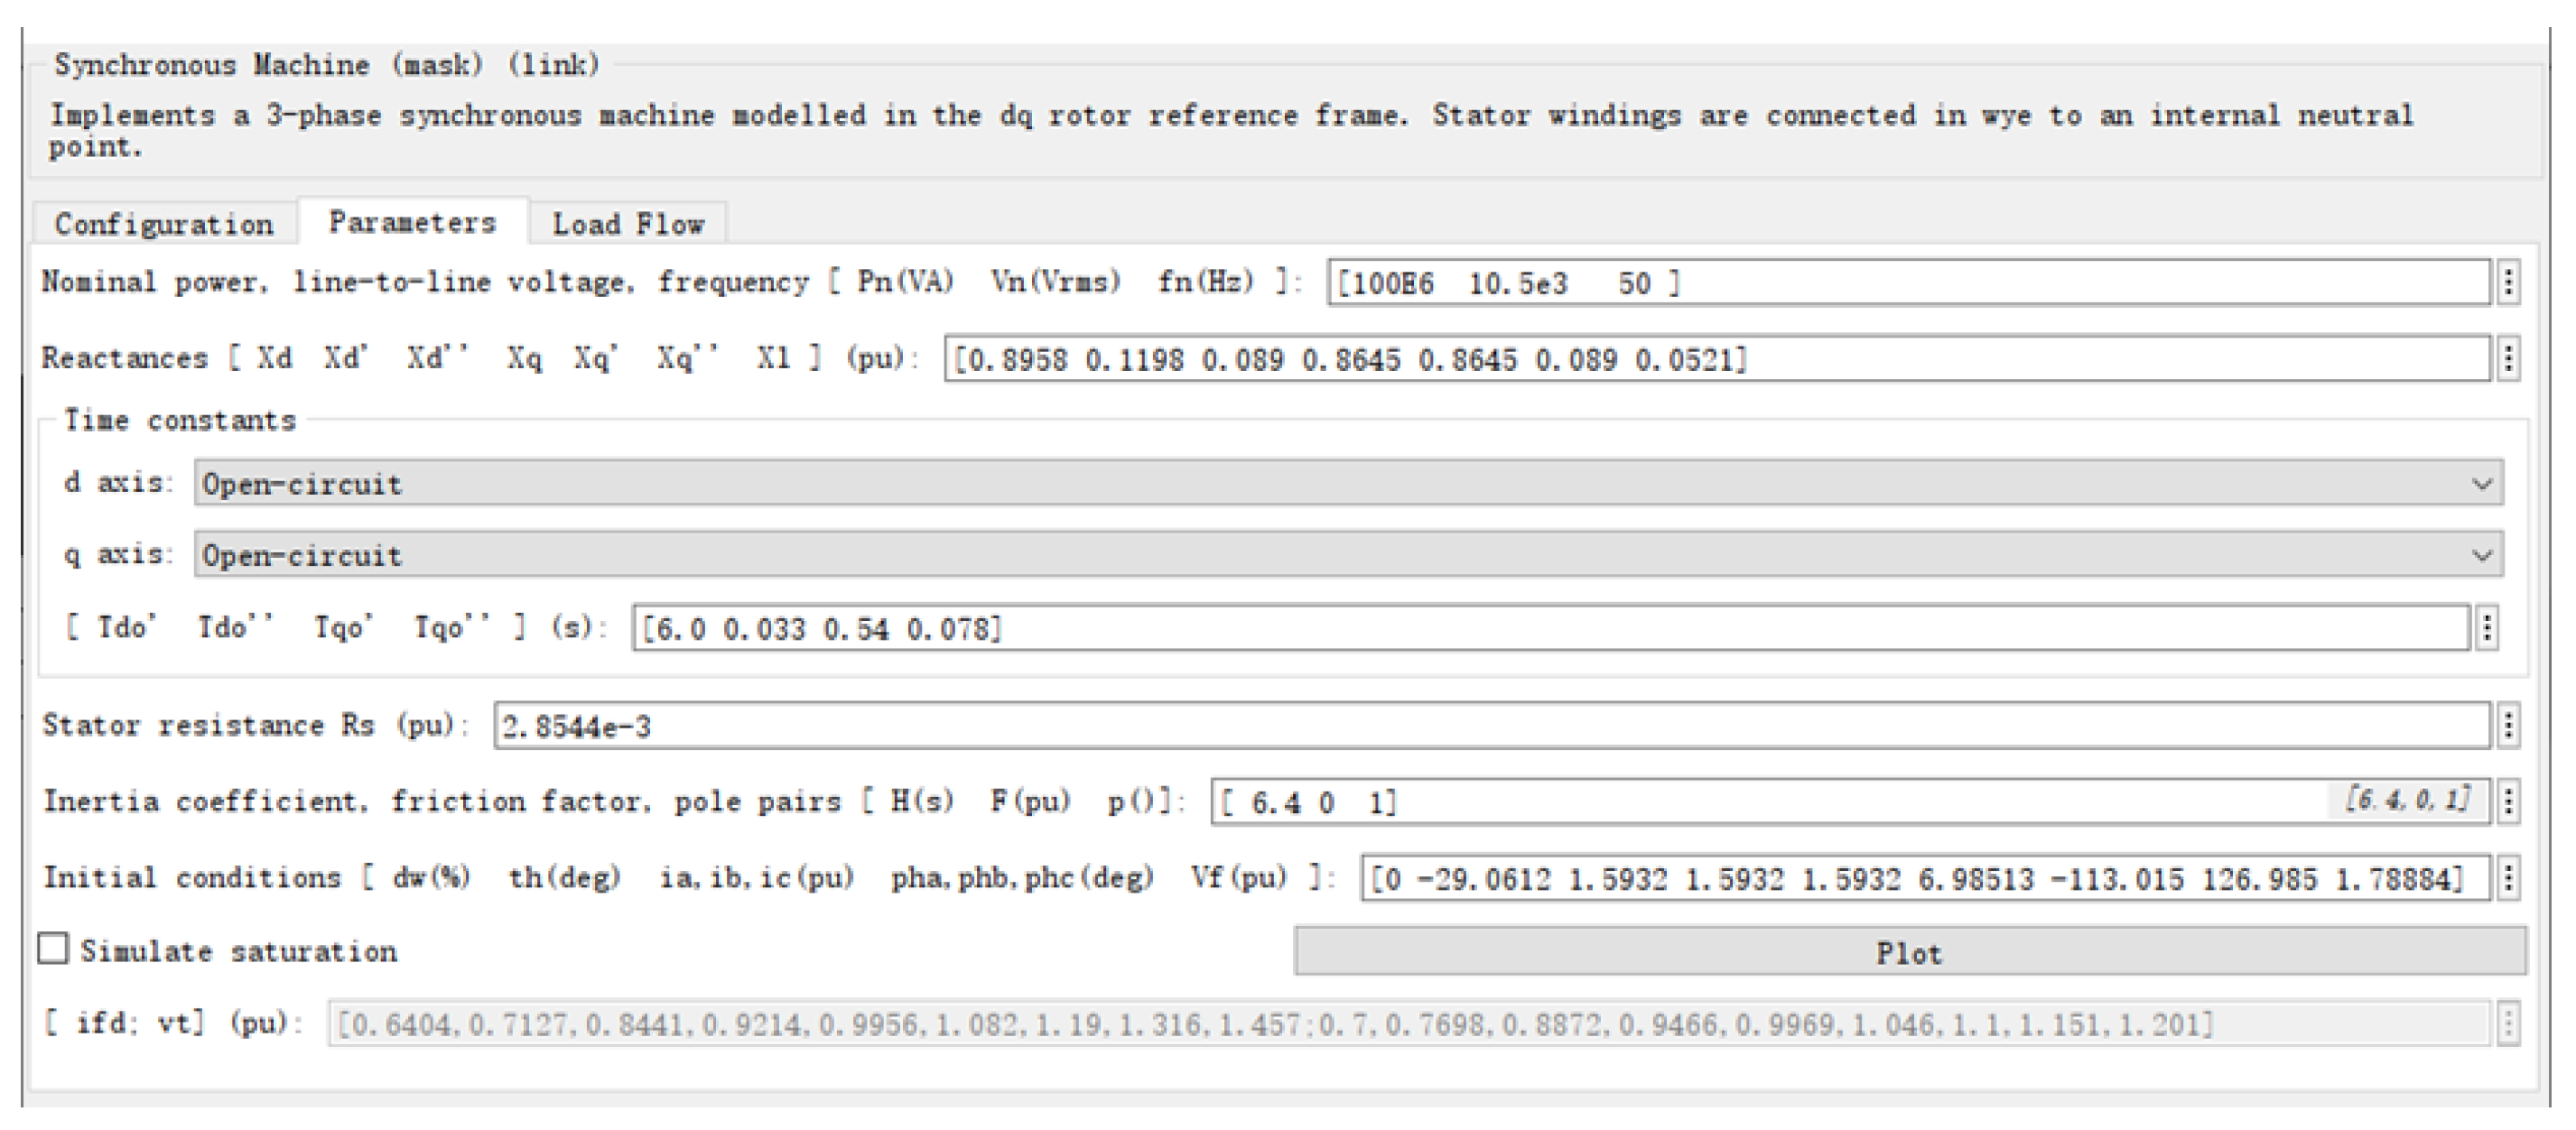
Figure A1, Figure A2, Figure A3 and Figure A4 provide the MATLAB/Simulink model and the set of parameters used in the configuration.
Figure A1. The single machine with a load model.
Energies 18 05106 g0a1
Figure A2. Parameters for the synchronous machine.
Energies 18 05106 g0a2
Figure A3. Parameters for the three-phase transformer.
Energies 18 05106 g0a3
Figure A4. Distributed parameters for the line.
Energies 18 05106 g0a4

References

  1. Wang, G.; Konstantinou, G.; Townsend, C.D.; Pou, J.; Vazquez, S.; Demetriades, G.D.; Agelidis, V.G. A Review of Power Electronics for Grid Connection of Utility-Scale Battery Energy Storage Systems. IEEE Trans. Sustain. Energy 2016, 7, 1778–1790. [Google Scholar] [CrossRef]
  2. Li, C.; Yang, Y.; Dragicevic, T.; Blaabjerg, F. A New Perspective for Relating Virtual Inertia with Wideband Oscillation of Voltage in Low-Inertia DC Microgrid. IEEE Trans. Ind. Electron. 2022, 69, 7029–7039. [Google Scholar]
  3. Xie, X.; Zhan, Y.; Shair, J.; Ka, Z.; Chang, X. Identifying the Source of Subsynchronous Control Interaction via Wide-Area Monitoring of Sub/Super-Synchronous Power Flows. IEEE Trans. Power Deliv. 2020, 35, 2177–2185. [Google Scholar] [CrossRef]
  4. Shair, J.; Xie, X.; Yang, J.; Li, J.; Li, H. Adaptive Damping Control of Subsynchronous Oscillation in DFIG-Based Wind Farms Connected to Series-Compensated Network. IEEE Trans. Power Deliv. 2022, 37, 1036–1049. [Google Scholar]
  5. Li, C.; Sun, C.; Chen, Z.; Zhang, Y. Broad Learning System Using Rectified Adaptive Moment Estimation for Harmonic Detection and Analysis. IEEE Trans. Ind. Electron. 2024, 71, 2873–2882. [Google Scholar]
  6. Hou, C.; Zhu, M.; Li, Z.; Li, Y.; Cai, X. Inter Harmonic THD Amplification of Voltage Source Converter: Concept and Case Study. IEEE Trans. Power Electron. 2020, 35, 12651–12656. [Google Scholar] [CrossRef]
  7. Testa, A.; Akram, M.F.; Burch, R.; Carpinelli, G.; Chang, G.; Dinavahi, V.; Hatziadoniu, C.; Grady, W.M.; Gunther, E.; Halpin, M.; et al. Interharmonics: Theory and Modeling. IEEE Trans. Power Deliv. 2007, 22, 2335–2348. [Google Scholar] [CrossRef]
  8. Chen, L.; Zhao, W.; Wang, F.; Wang, Q.; Huang, S. An Interharmonic Phasor and Frequency Estimator for Subsynchronous Oscillation Identification and Monitoring. IEEE Trans. Instrum. Meas. 2019, 68, 1714–1723. [Google Scholar] [CrossRef]
  9. Xiong, L.; Liu, X.; Liu, Y. Decaying DC and Harmonic Components Detection for Absorbing Impact Load Currents in Weak Grids. IEEE Trans. Power Deliv. 2021, 36, 1907–1910. [Google Scholar] [CrossRef]
  10. Friedemann, D.F.; Motter, D.; Oliveira, R.A. Stator-Ground Fault Location Method Based on Third-Harmonic Measures in High-Impedance Grounded Generators. IEEE Trans. Power Deliv. 2021, 36, 794–802. [Google Scholar]
  11. Ji, K.; Yang, Y. Harmonic Power Detection-Based Adaptive Resonance Suppression for Power Converters. IEEE Trans. Power Deliv. 2024, 39, 601–612. [Google Scholar]
  12. Jia, J.R.; Duan, X.B.; Lu, J.L.; Zhou, W.; Ren, R. Research on the Harmonic Transmission Characteristics of Transformers. Electric Power 2017, 50, 92–96+157. [Google Scholar] [CrossRef]
  13. Wang, J.; Wang, G.; Kuang, Y.; Tian, Z. Explorative research on harmonic transmission characteristics and corresponding measures of the UHV half-wavelength transmission lines. In Proceedings of the 2017 China International Electrical and Energy Conference (CIEEC), Beijing, China, 25–27 October 2017; pp. 360–364. [Google Scholar]
  14. Zhang, L.; Liang, S.; Li, X. Research on the harmonic in new continuous cable traction power supply system and its transmission characteristic. IET Gener. Transm. Distrib. 2020, 14, 2710–2718. [Google Scholar] [CrossRef]
  15. Li, Z.; Hu, H.; Tang, L.; Wang, Y.; Zang, T.; He, Z. Quantitative Severity Assessment and Sensitivity Analysis Under Uncertainty for Harmonic Resonance Amplification in Power Systems. IEEE Trans. Power Deliv. 2020, 35, 809–818. [Google Scholar]
  16. Pu, Y.; Shu, Q.; Xu, F. Harmonic Amplification Analysis of Cable Lines with Distributed Parameters Based on Kalman Filter and Convolution Inversion. J. Mod. Power Syst. Clean Energy 2023, 11, 1804–1813. [Google Scholar] [CrossRef]
  17. Chang, T.Y.; Wang, S.L.; Zhang, Y.M.; Ma, J.P.; Zhang, Y.H.; Liu, T.Q. Harmonic current amplification characteristics of DC lines based on distribution parameters. High Volt. Eng. 2023, 49, 4654–4664. [Google Scholar] [CrossRef]
  18. Yang, Y.; Xue, H.; Xu, R.; Zhang, S.; Chang, Z.; Xiao, Z. Conduction and Amplification of Harmonics in Distribution Network. In Proceedings of the 2023 IEEE 6th International Electrical and Energy Conference (CIEEC), Hefei, China, 12–14 May 2023; pp. 2100–2105. [Google Scholar]
  19. Wang, Y.; Zhou, Y.; Dang, J.; Ma, S.; Tian, C.; Cheng, S. Study on Main Factors of Dynamic Stability for Regional Interconnected Power System. In Proceedings of the 2020 IEEE 4th Conference on Energy Internet and Energy System Integration (EI2), Wuhan, China, 30 October–1 November 2020; pp. 1653–1658. [Google Scholar]
  20. Skinder, K.S.; Kerdphol, T.; Mitani, Y.; Turschner, D. Frequency Stability Assessment of Multiple Virtual Synchronous Generators for Interconnected Power System. IEEE Trans. Ind. Appl. 2022, 58, 91–101. [Google Scholar]
  21. Lu, D.; Liu, Y.; Liao, Q.; Wang, B.; Huang, W.; Xi, X. Time-Domain Transmission Line Fault Location Method With Full Consideration of Distributed Parameters and Line Asymmetry. IEEE Trans. Power Deliv. 2020, 35, 2651–2662. [Google Scholar] [CrossRef]
  22. Benato, R.; Gardan, G.; Milano, F. Effect of Uniformly Distributed Parameter Line Models on the Evaluation of PV Curves and of the Maximum Loading Condition. IEEE Trans. Power Syst. 2022, 37, 4974–4977. [Google Scholar] [CrossRef]
  23. Song, G.; Chu, X.; Gao, S.; Kang, X.; Jiao, Z.; Suonan, J. Novel Distance Protection Based on Distributed Parameter Model for Long-Distance Transmission Lines. IEEE Trans. Power Deliv. 2013, 28, 2116–2123. [Google Scholar] [CrossRef]
  24. Ma, S.; Guo, J.; Sun, H.; Yu, Y. The comparison and analysis of lumped parameter equivalent circuits of transmission line. In Proceedings of the 2011 International Conference on Advanced Power System Automation and Protection, Beijing, China, 16–20 October 2011; pp. 1225–1229. [Google Scholar]
  25. Dommel, H.W. Digital Computer Solution of Electromagnetic Transients in Single-and Multiphase Networks. IEEE Trans. Power Appar. Syst. 1969, PAS-88, 388–399. [Google Scholar] [CrossRef]
  26. Dong, C.; Wu, Z.; Huang, R.; Wang, Z. Stability Analysis of Hybrid Systems Containing the Grid-Forming Inverter and the Grid-Following Inverter Based on Sequential Impedance Modelling. In The Proceedings of the 11th Frontier Academic Forum of Electrical Engineering (FAFEE2024); FAFEE 2024. Lecture Notes in Electrical Engineering; Yang, Q., Li, J., Eds.; Springer: Singapore, 2025; Volume 1287. [Google Scholar]
Figure 1. Typical scenarios of long-distance transmission for grid-connected renewable energy.
Energies 18 05106 g001
Figure 2. Two-port transmission line circuit diagram.
Energies 18 05106 g002
Figure 3. Equivalent impedance characteristic diagram of π-type transmission line. (a) Impedance; (b) Phase.
Energies 18 05106 g003
Figure 4. Equivalent admittance characteristic diagram of π-type transmission line. (a) Admittance; (b) Phase.
Energies 18 05106 g004
Figure 5. Load frequency response of an asynchronous motor.
Energies 18 05106 g005
Figure 6. Asynchronous motor load d-q axis current response. (a) Current amplitude; (b) Current phase difference.
Energies 18 05106 g006
Figure 7. Comparison of equivalent impedance results of an asynchronous motor.
Energies 18 05106 g007
Figure 8. Verification of inter-harmonic amplification characteristics of transmission lines in the frequency domain over a wide frequency range.
Energies 18 05106 g008
Figure 9. Verification of inter-harmonic amplification characteristics when transmission lines resonate in the time domain by comparing head-end current and terminal current. (a) injecting low frequency current (0.2 Hz); (b) injecting super-synchronous oscillation frequency current (85 Hz); (c) injecting high frequency current (1500 Hz).
Energies 18 05106 g009
Figure 10. Diagram of the influence of line delay on inter-harmonic amplification.
Energies 18 05106 g010
Figure 11. Diagram of the influence of line structure parameters on inter-harmonic amplification.
Energies 18 05106 g011
Figure 12. Diagram of the influence of line distance on the frequency of the extreme value of inter-harmonic amplification.
Energies 18 05106 g012
Figure 13. Diagram of the influence of line parameters on the extreme value of inter-harmonic amplification. (a) Transfer coefficient trend with resistance increasing. (b) Transfer coefficient trend with inductance increasing. (c) Transfer coefficient trend with capacitance increasing. (d) Transfer coefficient trend with line distance increasing.
Energies 18 05106 g013
Figure 14. Sensitivity analysis of parameter variation. (a) Z h = 1 p.u. (b) Z h = 3 p.u. (c) Z h = 5 p.u. (d) Z h = 10 p.u.
Energies 18 05106 g014
Figure 15. Diagram of the influence of load parameters on inter-harmonic amplification. (a) Load resistance. (b) Load inductance. (c) Load capacitance.
Energies 18 05106 g015aEnergies 18 05106 g015b
Table 1. Inter-harmonic amplification frequency of extreme value comparison.
GroupTheoretical Frequency of Extreme Value (Hz)Simulation Frequency of Extreme Value (Hz)
16767.30
2202201.91
3336336.51
4471471.12
5606605.73
6740740.33
7875875.21
810101009.55
Table 2. Inter-harmonic amplification extreme value comparison.
GroupTheoretical Extreme Value (A)Simulation Extreme Value (A)
115.1215.09
221.3820.79
326.1926.15
430.2429.92
560.4760.47
675.5975.38
7120.95120.94
8151.18150.38
Disclaimer/Publisher’s Note: The statements, opinions and data contained in all publications are solely those of the individual author(s) and contributor(s) and not of MDPI and/or the editor(s). MDPI and/or the editor(s) disclaim responsibility for any injury to people or property resulting from any ideas, methods, instructions or products referred to in the content.