Article

Experimental Assessment of a Passive Waste Heat Recovery System Using Thermosyphons and Thermoelectric Generators for Integration into District Heating Applications

by
Luis V. G. Fachini
1,
Pedro Leineker Ochoski Machado
2,
Kamal A. R. Ismail
3,
Felipe M. Biglia
2,
Aleffe J. C. Vaz
1,
Romeu M. Szmoski
4 and
Thiago Antonini Alves
1,2,*
1
Graduate Program in Mechanical Engineering, Federal University of Technology-Parana (UTFPR), Ponta Grossa 84017-220, PR, Brazil
2
Graduate Program in Mechanical and Materials Engineering, Federal University of Technology-Parana (UTFPR), Curitiba 81280-340, PR, Brazil
3
Energy Department, Faculty of Mechanical Engineering, State University of Campinas, Mendeleiev St., 200, University City, Campinas 13083-860, SP, Brazil
4
Physics Department, Federal University of Technology-Parana (UTFPR), Ponta Grossa 84017-220, PR, Brazil
*
Author to whom correspondence should be addressed.
Energies 2025, 18(19), 5090; https://doi.org/10.3390/en18195090
Submission received: 12 August 2025 / Revised: 11 September 2025 / Accepted: 17 September 2025 / Published: 25 September 2025

Abstract

The efficient recovery of waste heat is essential for improving sustainability in industrial and urban energy systems. This study presents the experimental evaluation of a passive heat recovery unit composed of finned thermosyphons and Bismuth Telluride (Bi2Te3) thermoelectric generators (TEGs). The primary objective was to characterize its simultaneous thermal recovery and electrical generation capabilities under airflow and temperature conditions simulating low-grade industrial exhaust streams. The system was tested in an open-loop wind tunnel simulating exhaust gases under air velocities of 0.6, 1.1, and 1.7 m/s. Heat was transferred to the TEGs through finned thermosyphons, enabling power generation via the Seebeck effect. The passive heat exchange mechanism successfully recovered up to 250.9 W of thermal power, preheating the inlet air by a maximum of 9.5 °C with a peak thermal effectiveness of 44.4%. Simultaneously, the system achieved a maximum temperature difference of 30.0 °C across the thermoelectric modules, generating a total electrical power of 163.7 mW (81.8 mW per TEG). This dual-purpose operation resulted in a maximum overall first-law efficiency of 9.38% and an electrical power density of 52.20 W/m2 from the low-grade thermal stream. These results confirm the technical feasibility of this compact, passive, and maintenance-free design, highlighting its potential for integration into applications like district heating or industrial ventilation, where balancing thermal and electrical outputs is crucial.

1. Introduction

The industrial economic development of a country is closely linked to the consumption of fossil fuels and electricity. Therefore, there is a growing need for systems with high productivity and energy efficiency that minimize or reuse dissipated energy while maintaining ecological sustainability. In 2024, the global energy consumption reached 592.22 Exajoules, approximately 14,137 million tonnes of oil equivalent (MTOE) [1].
Approximately one-third of the total energy consumed in industrial processes is ultimately lost as residual heat. Notably, the majority of this rejected energy is classified as low-grade waste heat, typically characterized by relatively low temperatures and limited direct usability [2]. In the European Union, for instance, the total industrial waste heat potential has been estimated at 304.13 TWh per year, with the largest share falling within the 100–200 °C temperature range [3].
In light of growing concerns over global warming and the depletion of fossil fuel reserves, technologies aimed at heat recovery and energy conversion are attracting increasing attention, particularly those capable of efficiently utilizing low-grade waste heat. District heating emerges as a promising solution in this context. The core principle of district heating is to harness locally available fuel or residual heat sources, often otherwise wasted, to meet local thermal energy demands. This is achieved through a network of insulated pipes that effectively serves as a localized marketplace for heat distribution [4]. As of 2023, district heating accounted for approximately 10% of the global final heating demand in both buildings and industrial applications. This system offers significant potential for efficient, cost-effective, and flexible energy production, while also enabling the large-scale integration of low-emission energy sources [5].
Using thermoelectric generators could be one alternative to recover part of this waste-heat. The Seebeck effect refers to the generation of an electric potential difference between two different materials when exposed to a temperature gradient [6]. This principle forms the foundation of thermoelectric generators (TEGs). TEGs offer advantages such as compact size, low maintenance requirements, and the ability to function without moving parts [7]. Despite their low energy conversion efficiency of about 5%, research conducted at NASA’s Jet Propulsion Laboratory has reported efficiencies of up to 20% under high-temperature conditions [2].
A thermoelectric generator consists of alternating p-type and n-type semiconductor blocks, electrically connected in series and thermally in parallel, positioned between two thermally conductive plates. Heat applied to the hot side creates a thermal gradient, causing free electrons in the n-type material and holes in the p-type material to migrate towards the cold side. This migration generates an internal electric field, resulting in the Seebeck voltage [8], as illustrated in Figure 1.
While TEGs offer advantages like solid-state reliability, their overall performance and long-term stability are not only dependent on the system-level thermal management but also critically linked to the materials that it is composed. For instance, novel computational roadmaps based on phase diagram predictions are enabling the screening of highly stable thermoelectric interface materials (TEiMs), which suppress chemical diffusion and maintain low interfacial contact resistance over long operational periods [9]. The present study, however, focuses on the practical, system-level integration of currently available commercial Bi2Te3 TEGs, assessing their performance within a passive heat recovery unit designed for dual-purpose energy generation.
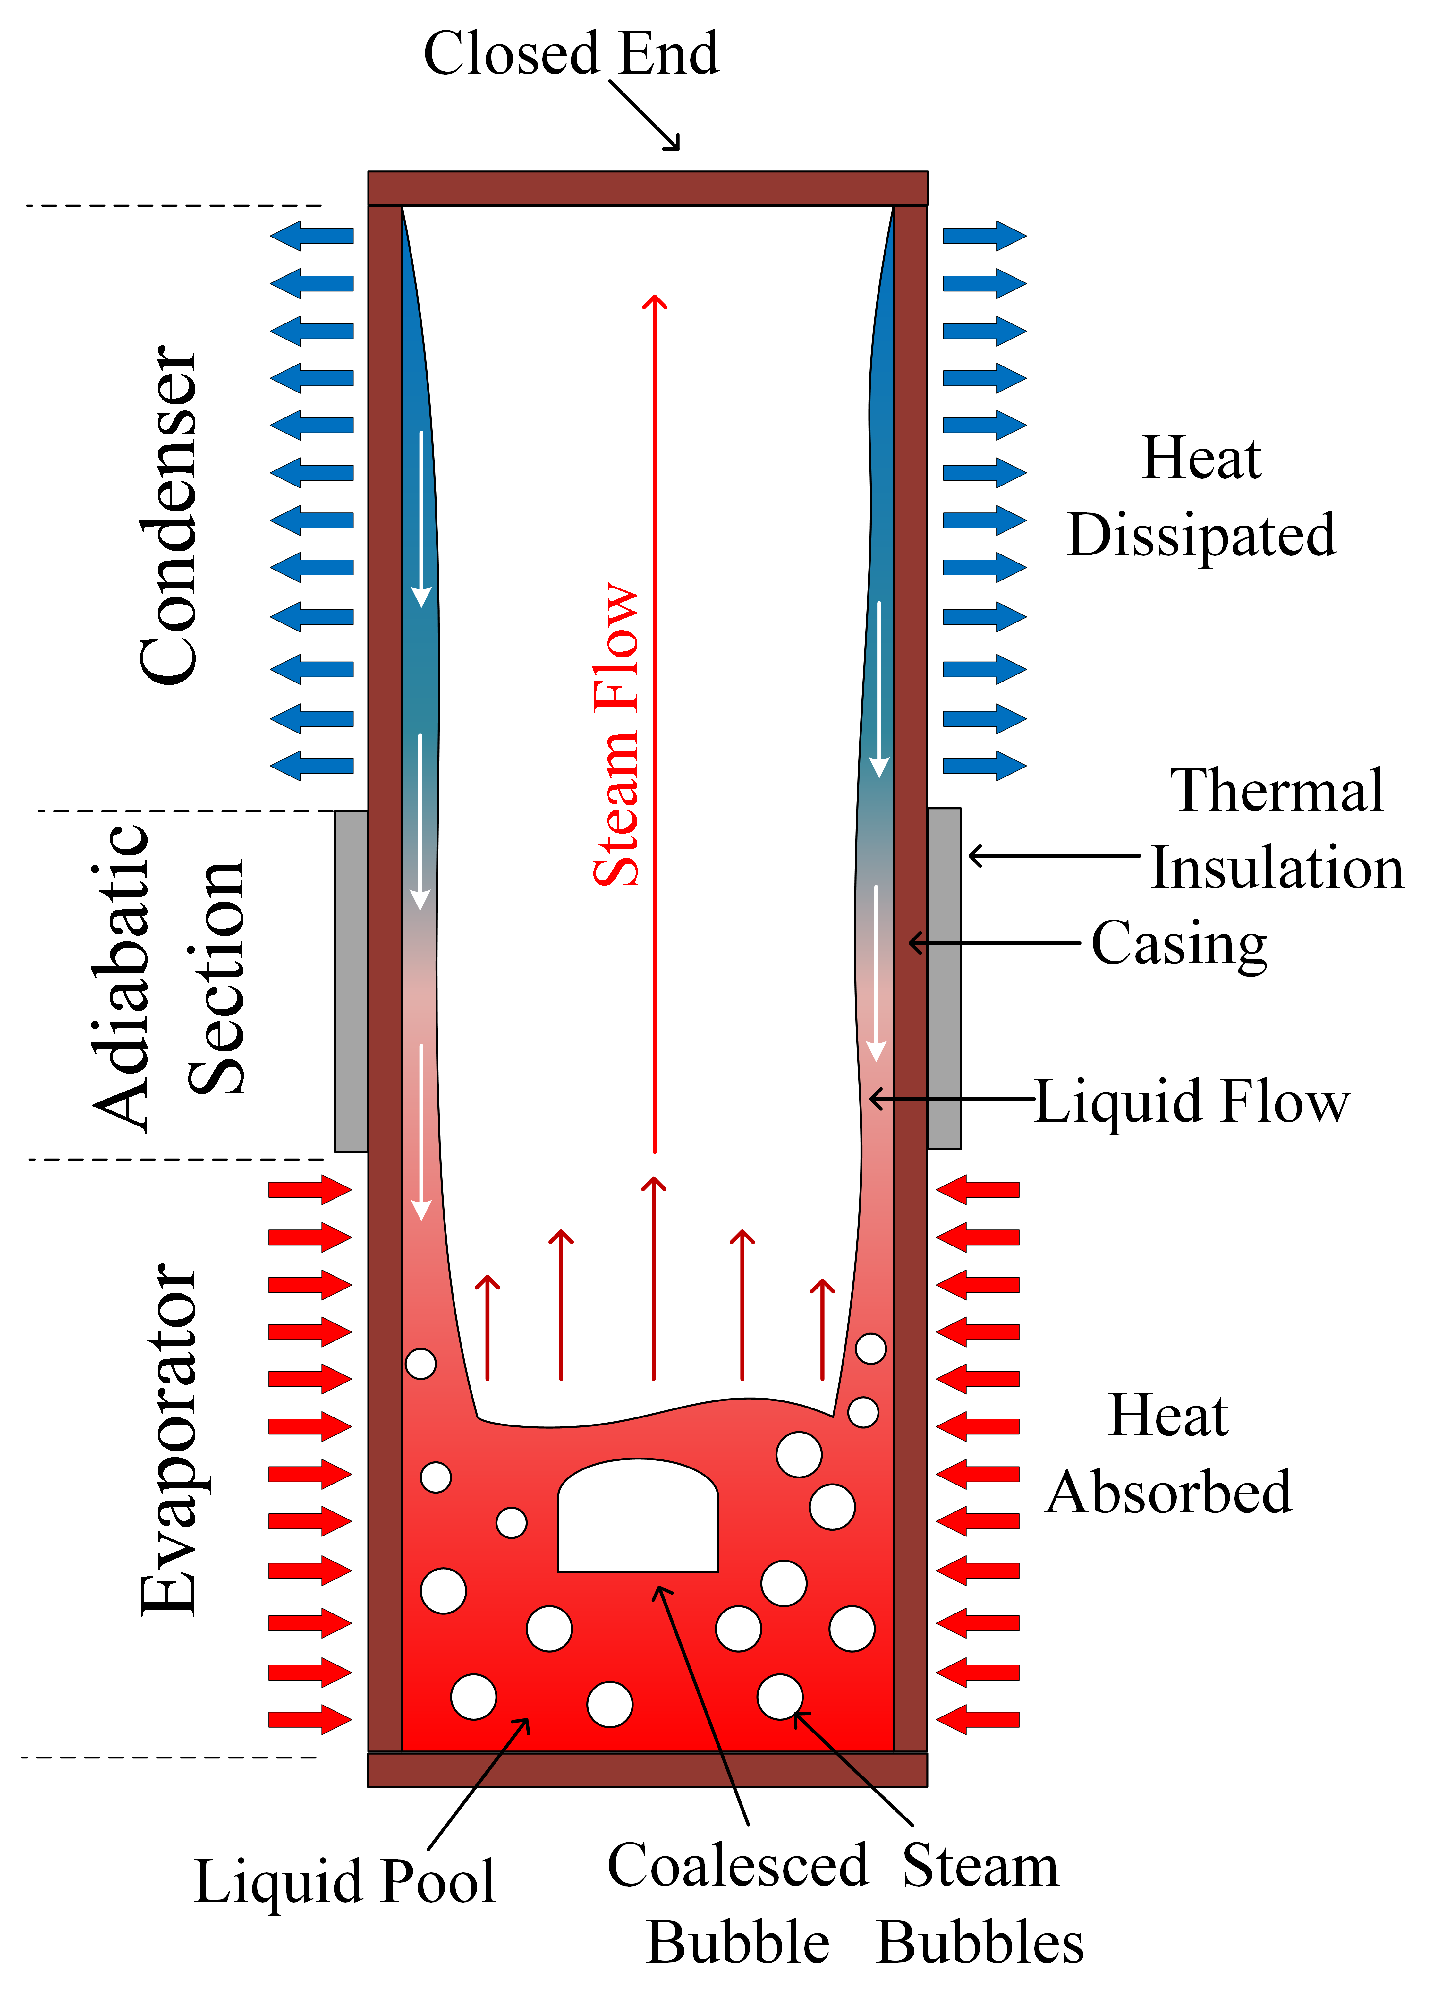
In parallel, thermosyphon-based heat exchangers present a promising solution for district heating applications while simultaneously enhancing the temperature gradient across thermoelectric generators (TEGs) [10]. Thermosyphons are passive heat transfer devices that operate through phase-change mechanism and are capable of transferring significant amounts of heat with minimal temperature drop [11,12,13]. A typical thermosyphon consists of three main sections: the evaporator, where heat is absorbed, the adiabatic section, where no heat exchange occurs, and the condenser, where heat is delivered to the surroundings. When heat is applied at the evaporator, the working fluid undergoes phase change into vapor, which rises to the condenser region. There, it condenses by releasing latent heat, and the condensed fluid returns to the evaporator by gravity [14,15]. The operational principle of a thermosyphon is illustrated schematically in Figure 2.
Thermoelectric generators (TEGs) represent a promising technology for waste heat recovery (WHR), capable of converting thermal energy directly into electricity. The versatility of TEGs has been demonstrated across a vast range of applications. Comprehensive reviews by [16,17] highlight the advantages of TEGs—such as their solid-state reliability and lack of moving parts—and survey their application in diverse sectors.
For instance, ref. [18] investigated a direct-contact TEG on a diesel engine, achieving power outputs between 12 and 45 W with a conversion efficiency of 1–2%, demonstrating the feasibility but also the challenges of direct heat transfer in such dynamic environments. Other studies have focused on the fundamental characterization of TEG modules under controlled laboratory conditions, simulating waste heat with electrical heaters to obtain essential performance curves, as demonstrated by [19].
Research has focused extensively on high-temperature waste heat from sources like automotive diesel exhausts, where direct-contact systems are often evaluated through a combination of CFD and experimental tests, as shown by [20]. The technology has also been adapted for various industrial settings, including recovering heat from cement factory kiln shells [21], industrial pipelines with custom heat collectors [22], and even in advanced concepts for waste heat from Proton Exchange Membrance (PEM) fuel cells [23] and nuclear reactor systems [24].
To enhance thermal transport to and from the TEG modules, thereby increasing the temperature difference and overall performance, many studies have successfully integrated TEGs with high-performance two-phase heat transfer devices such as heat pipes and thermosyphons. This integrated approach has been experimentally validated across a wide spectrum of operating temperatures. For high-temperature applications (>300 °C), ref. [25] developed a system with potassium heat pipes that achieved a system efficiency of 7.5% at over 600 °C, while ref. [26] demonstrated a power generation efficiency of up to 11.3% using gravity heat pipes in a similar temperature range. For medium-temperature ranges, ref. [27] investigated the effect of the number of TEG modules on the performance of a heat pipe-assisted system, reporting an efficiency of 3.8%. These studies collectively confirm that the Heat Pipe-TEG (HPTEG) is a robust and effective configuration for power generation. Table 1 presents a summary of the literature studies regarding waste-heat recovery using TEGs and/or heat pipes.
A review of the state-of-the-art reveals a diverse research field focused on optimizing thermoelectric generator (TEG) systems, often through the integration of heat transfer devices like heat pipes to improve thermal management. However, a critical analysis of the literature highlights a significant gap: the vast majority of studies concentrate exclusively on electricity generation, thereby underutilizing the total energy potential of the system. In most configurations, the heat rejected from the TEG’s cold side, which still possesses useful thermal quality, is simply discarded to the environment. Few studies have explored the concept of dual-purpose systems—the cogeneration of electricity and useful thermal energy—which represents a key frontier for substantially increasing the overall energy efficiency of waste heat recovery systems.
While the integration of heat pipes and TEGs has been demonstrated, a significant gap remains in the detailed characterization of dual-purpose systems, particularly those operating under challenging low-grade heat conditions. For instance, studies by [28] explored similar systems using large arrays of 48 TEGs to maximize total power output (achieving up to 7.0 W) from heat sources around 110 °C. More recently, Ref. [27] investigated systems with up to four TEGs, achieving higher power (10.85 W), but at significantly higher TEG hot-side temperatures, reaching up to 160 °C.
In this context, the present work provides a comprehensive experimental evaluation of a passive, dual-purpose system using a minimal configuration of only two TEG modules under a more constrained thermal regime, with TEG hot-side temperatures remaining below 100 °C. The contribution of this study lies in four areas: first, the holistic analysis of simultaneous thermal and electrical energy recovery; second, the emphasis on power density (W/m2) as a key performance metric for standardized comparison; third, the use of a minimal scale for a fundamental characterization of the unit’s behavior; and fourth, the focus on a more challenging low-temperature range. By quantitatively demonstrating that the conditions for maximizing thermal recovery are contrary to those for maximizing electrical output under these conditions, this research provides crucial insights for the practical design and optimization of such systems in realistic low-grade heat applications like district heating.
Table 1. Comparative summary of the state-of-the-art in thermoelectric waste heat recovery.
Reference (Year)ConfigurationOperating Temp. Range (Waste-Heat) [°C]Reported EfficiencyDual-Purpose Analysis
(Electrical + Useful Thermal)
Jang et al. (2015) [29]TEG + Loop Heat Pipe 170–420 (simulated exhaust gas)Not reported (focus on voltage output)No
Remeli et al. (2015) [30]TEG + Heat Pipes
(for heating and cooling)
108.5 (simulated low-grade waste heat)Not reported (focus on heat transfer effectiveness)No
Remeli et al. (2015) [31]TEG + Heat Pipes
(for heating and cooling)
108 (simulated low-grade waste heat)Not reported (focus on power output)No
Remeli et al. (2016) [28]TEG + Heat Pipes
(for heating and cooling)
 82 (simulated low-grade waste heat)0.7% (thermal-to-electric conversion efficiency)Yes (electricity and pre-heated air)
Kim et al. (2017) [18]Direct Contact TEG (DCTEG)Up to  200 (diesel engine exhaust)1.0–2.0% (energy conversion efficiency)No
Remeli et al. (2017) [32]TEG + Heat Pipes
(for heating and cooling)
Not specified (simulated low-grade
waste heat <150 °C)
Not reported (focus on power output
and heat transfer effectiveness)
Yes (electricity and space heating)
Singh et al. (2017) [33]TEG + In-pond heat
exchanger (Solar Pond)
Up to 100 (simulated solar pond)1.5% (maximum conversion efficiency)No
Mostafavi & Mahmoudi (2018) [34]TEG + Heat Sinks 125 (gasoline engine exhaust)Not reported (focus on power output)No
Fachini et al. (2019) [19]TEG OnlyNot specified (characterization study)Focus on characteristic curves (P-V)No
Wang et al. (2020) [25]TEG + Potassium Heat PipeUp to 630 (electric heater)7.5% (maximum system conversion efficiency)No
Kılkış et al. (2021) [35]Solar PVT panel with integrated
Heat Pipes, PCM, and TEG
Not specified (conceptual design)Not reportedYes (Solar PV + Thermal + additional TEG power)
Nadaf & Preethi (2021) [17]TEG + Heat SinkNot specified ( Δ T up to 105 °C reported)Not reportedNo
Dashevsky et al. (2022) [36]Multilayer TEG (Bi2Te3 + PbTe based)50–600 15% (energy conversion efficiency)Yes (electricity and domestic/water heating)
Gomaa et al. (2022) [21]TEG Only (on coaxial shell
of a cement kiln)
Up to 375 (cement kiln shell)Up to 4.71% (conversion efficiency)Yes (hot water production from cooling loop)
Pourrahmani et al. (2022) [23]TEG + Water-to-water heat
exchanger (from PEMFC)
 57.4 (PEMFC coolant)Not reported (focus on recovered power)No
Zhao et al. (2022) [27]TEG + Copper-Ethanol Heat PipeUp to 210 (controlled heater)3.81% (maximum conversion efficiency)No
Fernández-Yáñez et al. (2023) [20]TEG + Squared heat exchanger
with internal fins
423.4 (diesel engine exhaust)Not reported (focus on net power output)No
Xiao et al. (2023) [22]TEG + Arch bridge-shaped heat collector85–165 (simulated industrial pipe)2.67% (maximum conversion efficiency)No
Zhang et al. (2023) [24]TEG + Copper-Water Heat Pipe150–200 (simulated reactor waste heat)1.49% (maximum power generation efficiency)No
Goswami et al. (2024) [37]TEG-array with Salt Gradient Thermal StorageUp to 437.55 (from biomass engine exhaust)4.63% (maximum conversion efficiency)No
Wang et al. (2024) [38]Heat Pipe Electric Generator (HPEG)
using triboelectric effect
60–137 (heated PTFE tube)Not reported (focus on voltage output)No
Zhang et al. (2024) [26]TEG + Gravity Heat Pipe80–350 (controlled heater)Up to 11.62% (power generation efficiency)No
Jouhara et al. (2025) [39]Multi-sink Heat Pipe
Heat Exchanger (HPHE)
 340–360 (furnace exhaust gas)47% (average energy recovery)No (Thermal only: preheated air and hot water)
Kubenova et al. (2025) [40]TEG + Hexagonal heat
exchanger with internal fins
up to 335 (simulated exhaust gas)Up to 1.72% (conversion efficiency)No
Muratçobanoğlu et al. (2025) [41]TEG + Heat Pipes (for heating and cooling)Up to 220 (PTC heater) 2% (maximum conversion efficiency)No (PUE analysis conducted)

2. Materials and Methods

This section details the experimental apparatus, the design of the heat recovery unit, the instrumentation used, the experimental procedure and the uncertainty analysis.
The experimental tests were conducted in the Porous Media and Energy Efficiency Laboratory (LabMPEE), affiliated with the Graduate Program (Master’s) in Mechanical Engineering (PPGEM) of the Academic Department of Mechanical Engineering (DAMEC) at the Federal Technological University of Parana (UTFPR), Brazil, Ponta Grossa Campus.
The primary objective was to characterize its simultaneous thermal recovery and electrical generation capabilities under airflow and temperature conditions simulating low-grade industrial exhaust streams.

2.1. Experimental Setup

The experimental apparatus was designed to simulate the recovery of low-grade waste heat from industrial exhaust streams. In this setup, air is heated by electric resistors to mimic residual heat sources and directed through a wind tunnel. As the heated air flows over the finned thermosyphon–TEG assembly, thermal energy is passively transferred to the thermosyphons and partially converted into electrical energy via the Seebeck effect. Simultaneously, a portion of the heat is also recovered as preheating of the incoming airflow, reproducing the dual benefit of combined thermal and electrical energy recovery in district heating scenarios.
The experiments were performed in a custom-built, open-loop, blower-type wind tunnel designed to simulate industrial exhaust gas streams. The main structure was manufactured from SAE 1020 steel sheets and mounted on an aluminum frame.
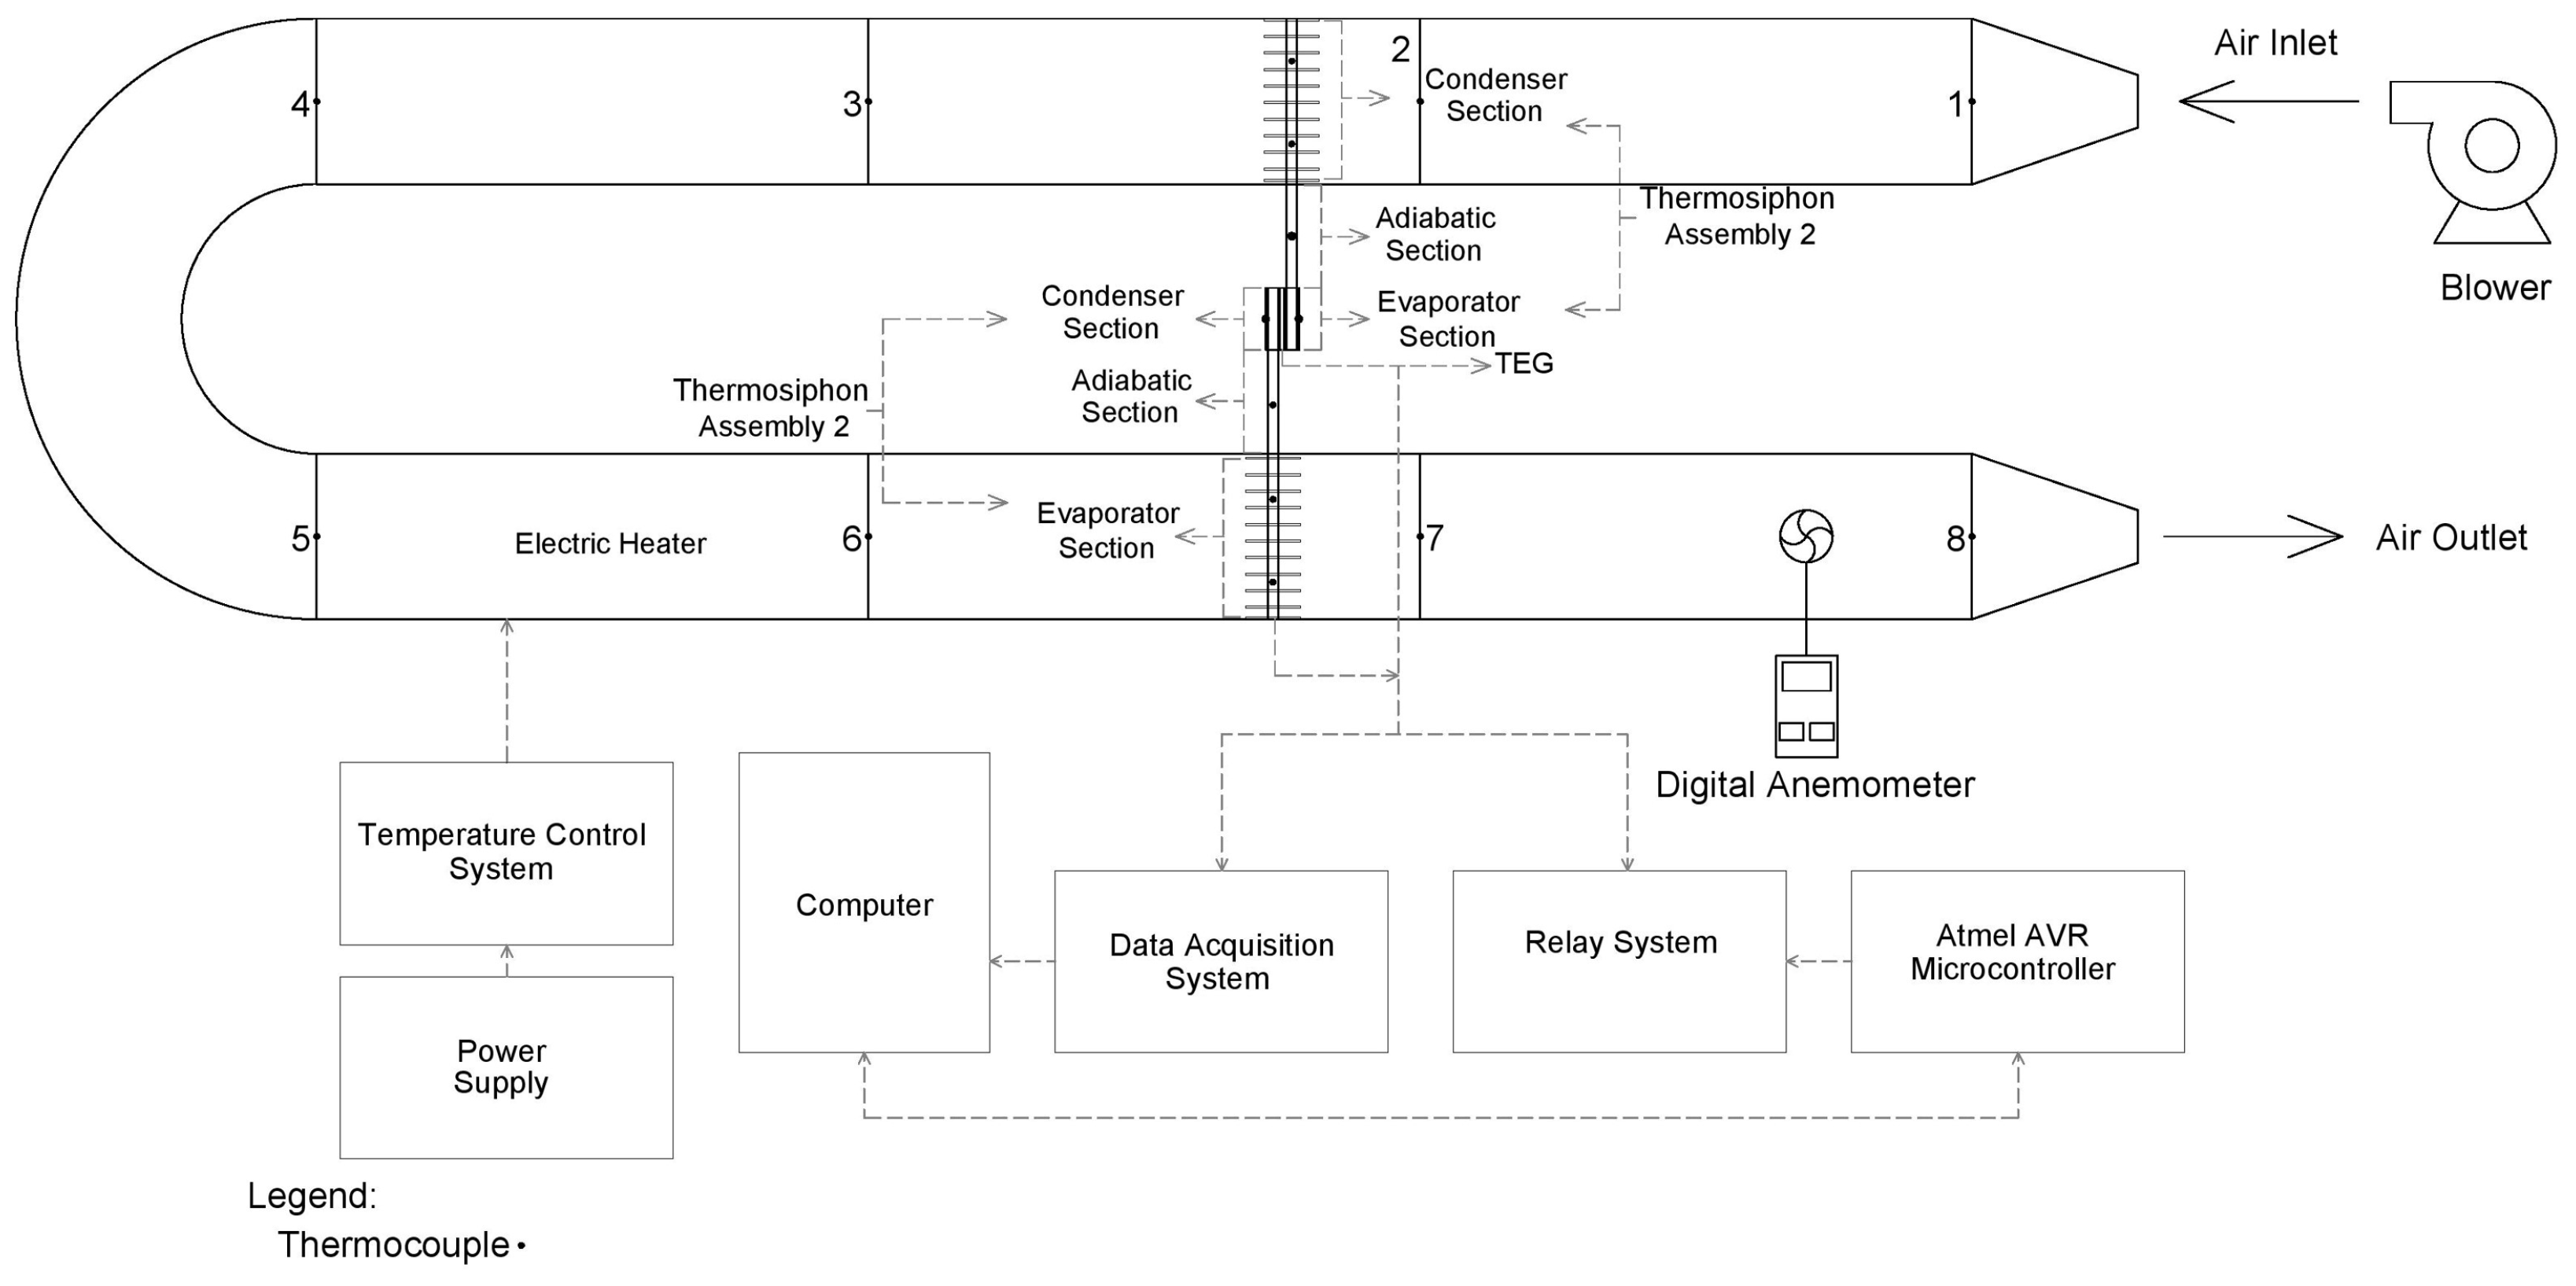
Figure 3 presents the scheme of the experimental setup, which consists of an open-circuit blower-type wind tunnel, an Agilent™ 34970A data acquisition system (Agilent Technologies, Santa Clara, CA, USA) with three Agilent™ 34901A 20-channel multiplexer modules, a Dell™ Latitude D820 notebook (Dell Inc., Round Rock, TX, USA), a Resist™ air heating unit with 18 electric resistors of 200 W each (total power of 3600 W-Resist Resistências Elétricas, São Paulo, SP, Brazil), a Novus™ temperature control system (NOVUS Produtos Eletrônicos, Canoas, RS, Brazil), an AeroMack™ CRE-04 industrial centrifugal blower/compressor (Aeromack, São Bernardo do Campo, SP, Brazil), a waste-heat recovery system composed of thermoelectric generators (TEGs) assisted by finned thermosyphons, an electrical control panel with WEG™ CFW300 frequency inverters for blower speed control (WEG S.A., Jaraguá do Sul, SC, Brazil), and a mass airflow measurement system.

2.2. Wind Tunnel

The experimental wind tunnel (Figure 4) is a custom-built, open-circuit blower-type system designed to simulate hot air flow through the heat recovery unit. Its structure is made of 3 mm-thick SAE 1020 carbon steel plates, joined by MIG welding, and supported by an aluminum frame.
The test section has an internal cross-sectional area of 150 mm × 150 mm, and the total tunnel length exceeds 3 m. The inlet and outlet are equipped with flanges for component integration and flow control devices.

2.3. Waste Heat Recovery System

The heat recovery system is the core component of this study, designed for passive heat transfer and direct energy conversion. It comprises Bismuth Telluride (Bi2Te3) thermoelectric generators (TEGs) assisted by a finned thermosyphon system.
The operational principle involves a parallel thermal circuit. The evaporator sections of the thermosyphon assembly 2 are exposed to the hot air stream in the lower duct, absorbing the waste heat. This thermal energy is efficiently transported via two-phase flow to the central section of the unit, where an aluminum coupling block distributes the heat to the hot faces of the two parallel-mounted thermoelectric generators. Simultaneously, the cold faces of both TEGs reject heat into the upper part of the assembly. This rejected heat is then absorbed by the condenser sections of the thermosyphons assembly 1, which are located in the upper duct. Finally, the cool inlet air flows over the finned condenser surfaces, removing the heat from the system and becoming preheated in the process.
To ensure effective thermal conduction and minimize contact resistance, all interfaces between components—including those involving TEGs, thermosyphons, and thermocouples—were assembled using thermal paste. Additionally, both the evaporator of thermosyphon assembly 2 and the condenser of assembly 1 were equipped with copper fins to enhance heat exchange with the surrounding air streams. All the ambient exposed parts were insulated with MTI Polyfab™ aeronautical thermal insulation and a coating of 3M™ polyethylene.
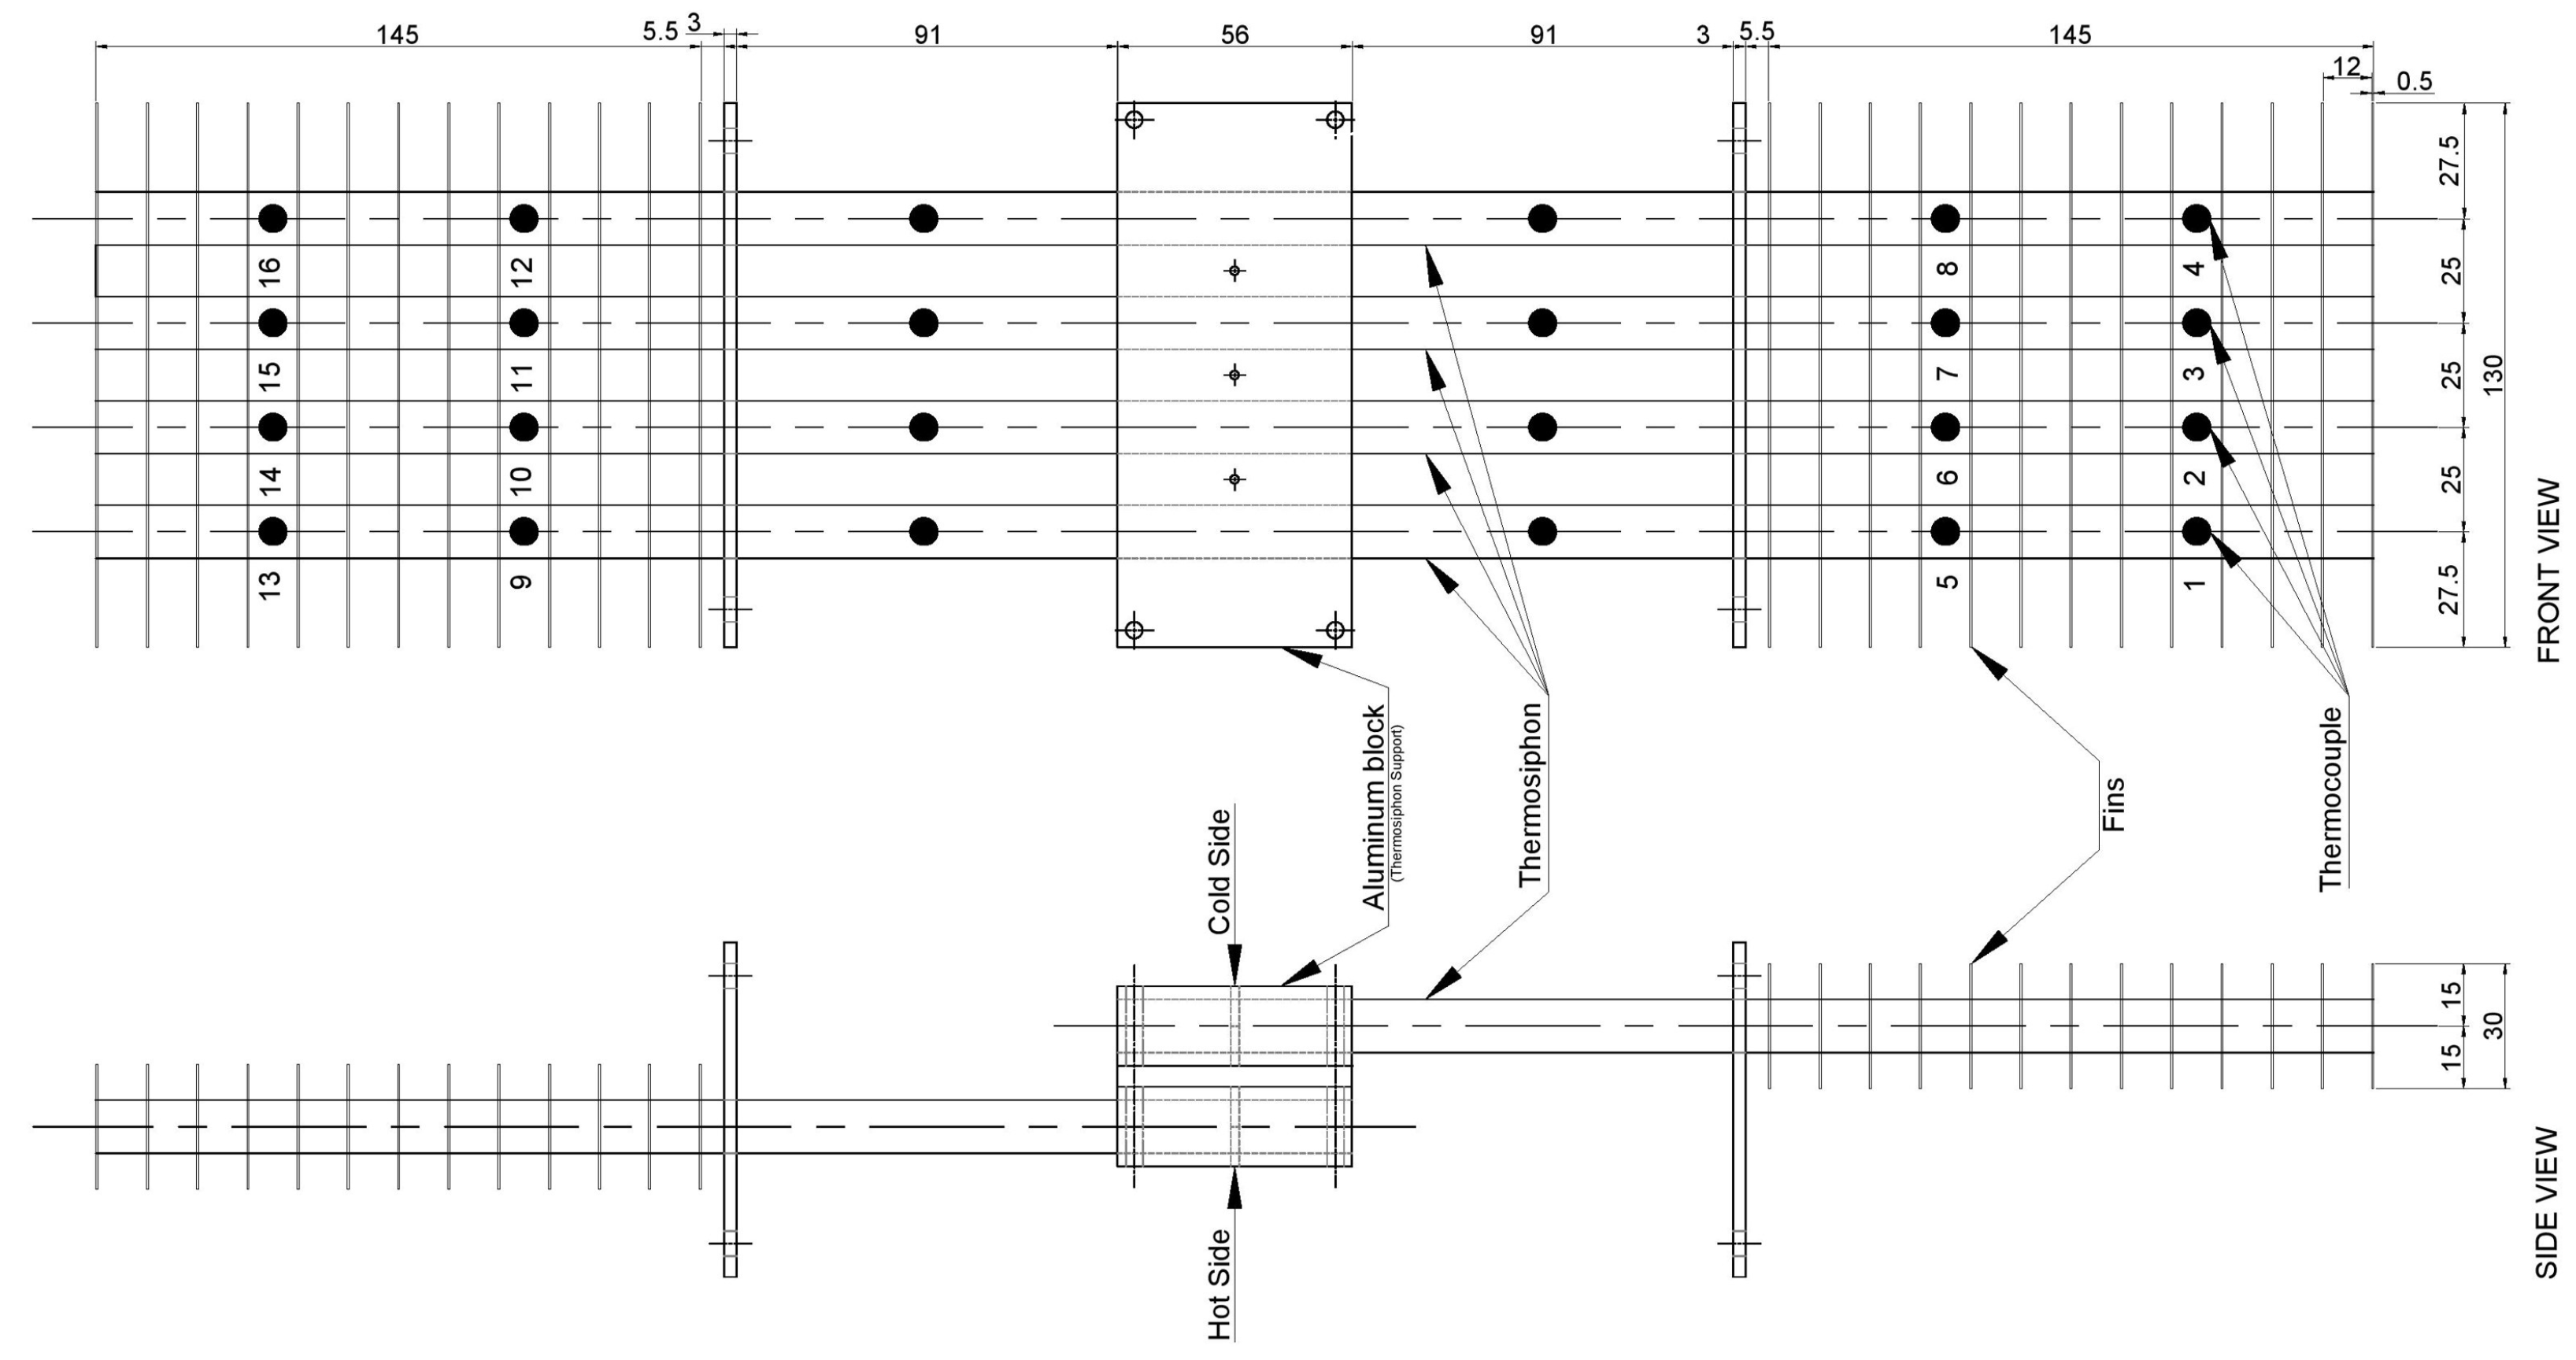
Figure 5 illustrates the fin configuration, showing the spacing, thickness, and positioning of the copper fins relative to the thermosyphon tubes. These fins were installed to enhance and maximize heat transfer between the thermosyphons and the surrounding airflow.
Each fin measures 130 mm × 30 mm, with a thickness of 0.5 mm, and they are evenly spaced at 12 mm intervals. A total of 13 fins were installed on each thermosyphon section, resulting in an estimated external surface area of approximately 507 cm2 per unit.
Figure 5 also indicates the positioning of the 16 Omega Engineering™ type-T thermocouples (Omega Engineering, Inc., Norwalk, CT, USA) along the thermosyphon wall, numbered sequentially from 1 to 16, used for detailed temperature monitoring along the vertical axis.

2.3.1. Thermoelectric Generators

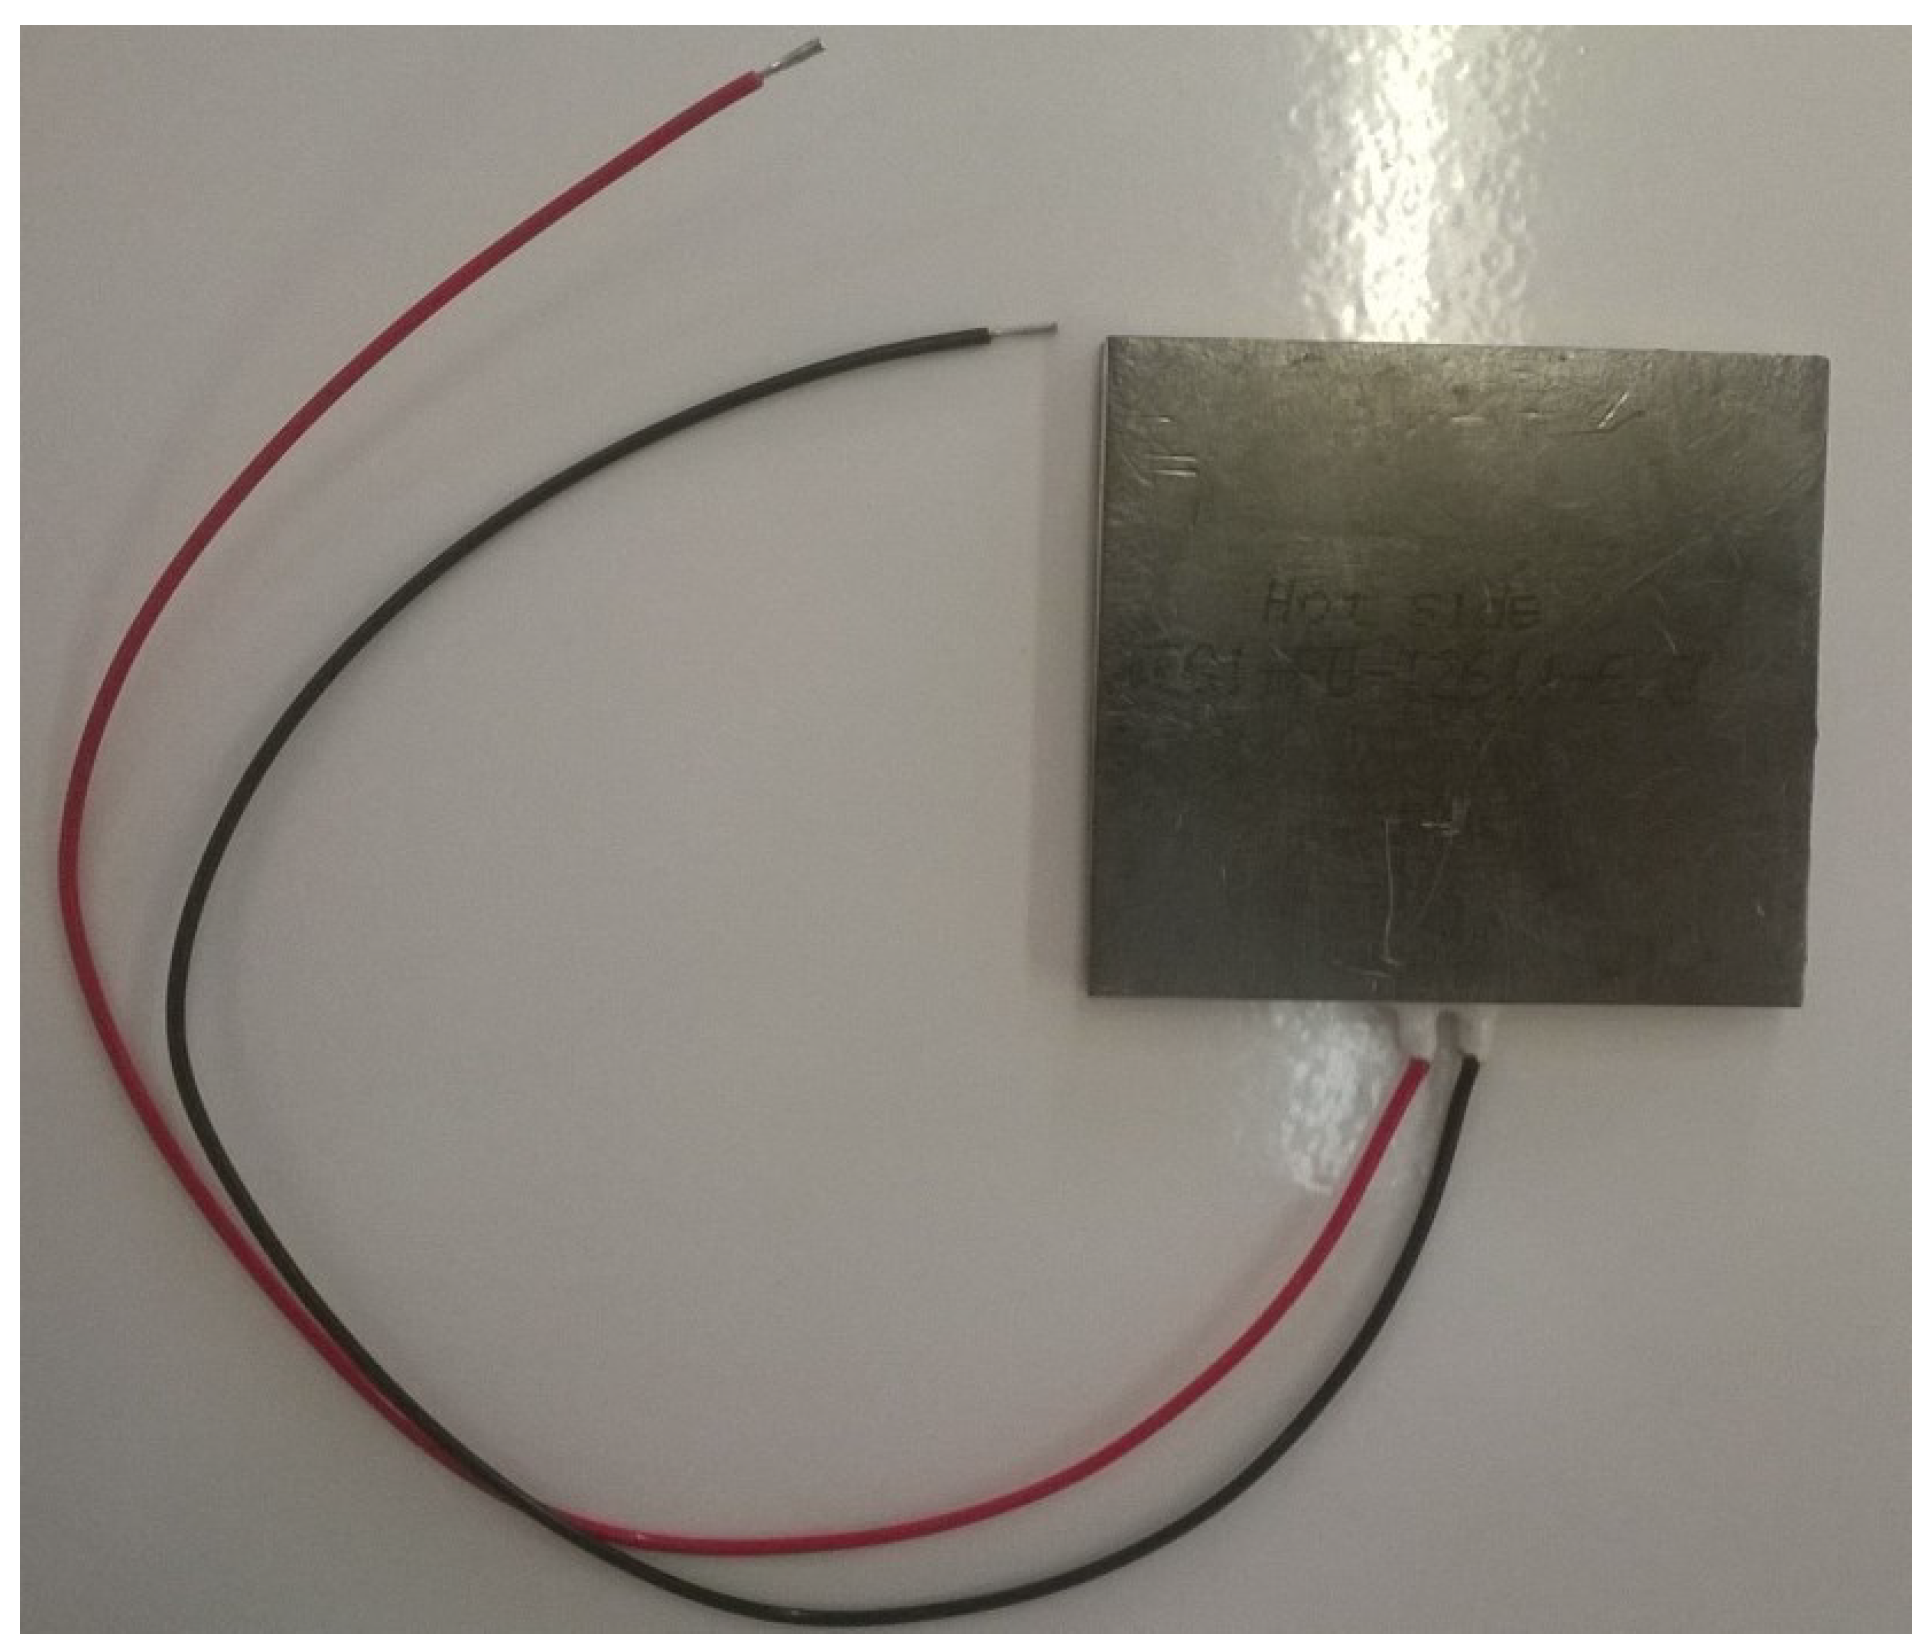
To directly convert heat into electrical energy, commercial thermoelectric generators (TEGs) of model TEG1-PB-12611-6.0 (TECTEG™, 56 × 56 mm–Figure 6) (TECTEG MFR., Carleton Place, ON, Canada) were used. The modules feature Teflon™-coated leads to ensure adequate thermal insulation. Each TEG has a ceramic exterior, which provides resistance to high temperatures, moderate mechanical loads, and corrosion. The ceramic surfaces are coated with graphite to improve thermal contact with rough metallic interfaces, as recommended by the manufacturer.
Internally, the modules contain alternating n-type and p-type doped Bismuth Telluride (Bi2Te3) elements. These thermoelectric legs are electrically connected in series and thermally in parallel to enable the Seebeck effect under a temperature gradient.

2.3.2. Thermosyphons

The methodology used in the construction of the thermosyphons (preparation, cleaning, assembly, tightness test, evacuation procedure, and filling with working fluid) was based on the information provided in [10].
For this experimental study, a total of eight thermosyphons were constructed in two distinct configurations: Type 1 and Type 2 (assembly 1 and assembly 2 from Figure 3, respectively), with four units of each type. The main body of each thermosyphon was fabricated from ASTM B-75 copper tubes, with dimensions specified in Table 2.
To seal the ends of the tubes, custom-machined copper caps (with and without through-holes) were produced from solid ASTM B-75 copper rods with a diameter of 12.7 mm. In order to allow evacuation and subsequent charging with the working fluid, capillary tubes with 1 mm diameter and 40 mm length were used.
The thermosyphon, as well as the fixing of the copper fins were made using a brazing process. An automatic portable torch was employed for heating, and foscoper rods were used as the filler metal. The filler composition consisted of 12% silver, 48% copper, and 40% zinc. The main thermosyphon components and the brazing process can be seen in Figure 7a,b, respectively.

2.4. Airflow Measurement and Control System

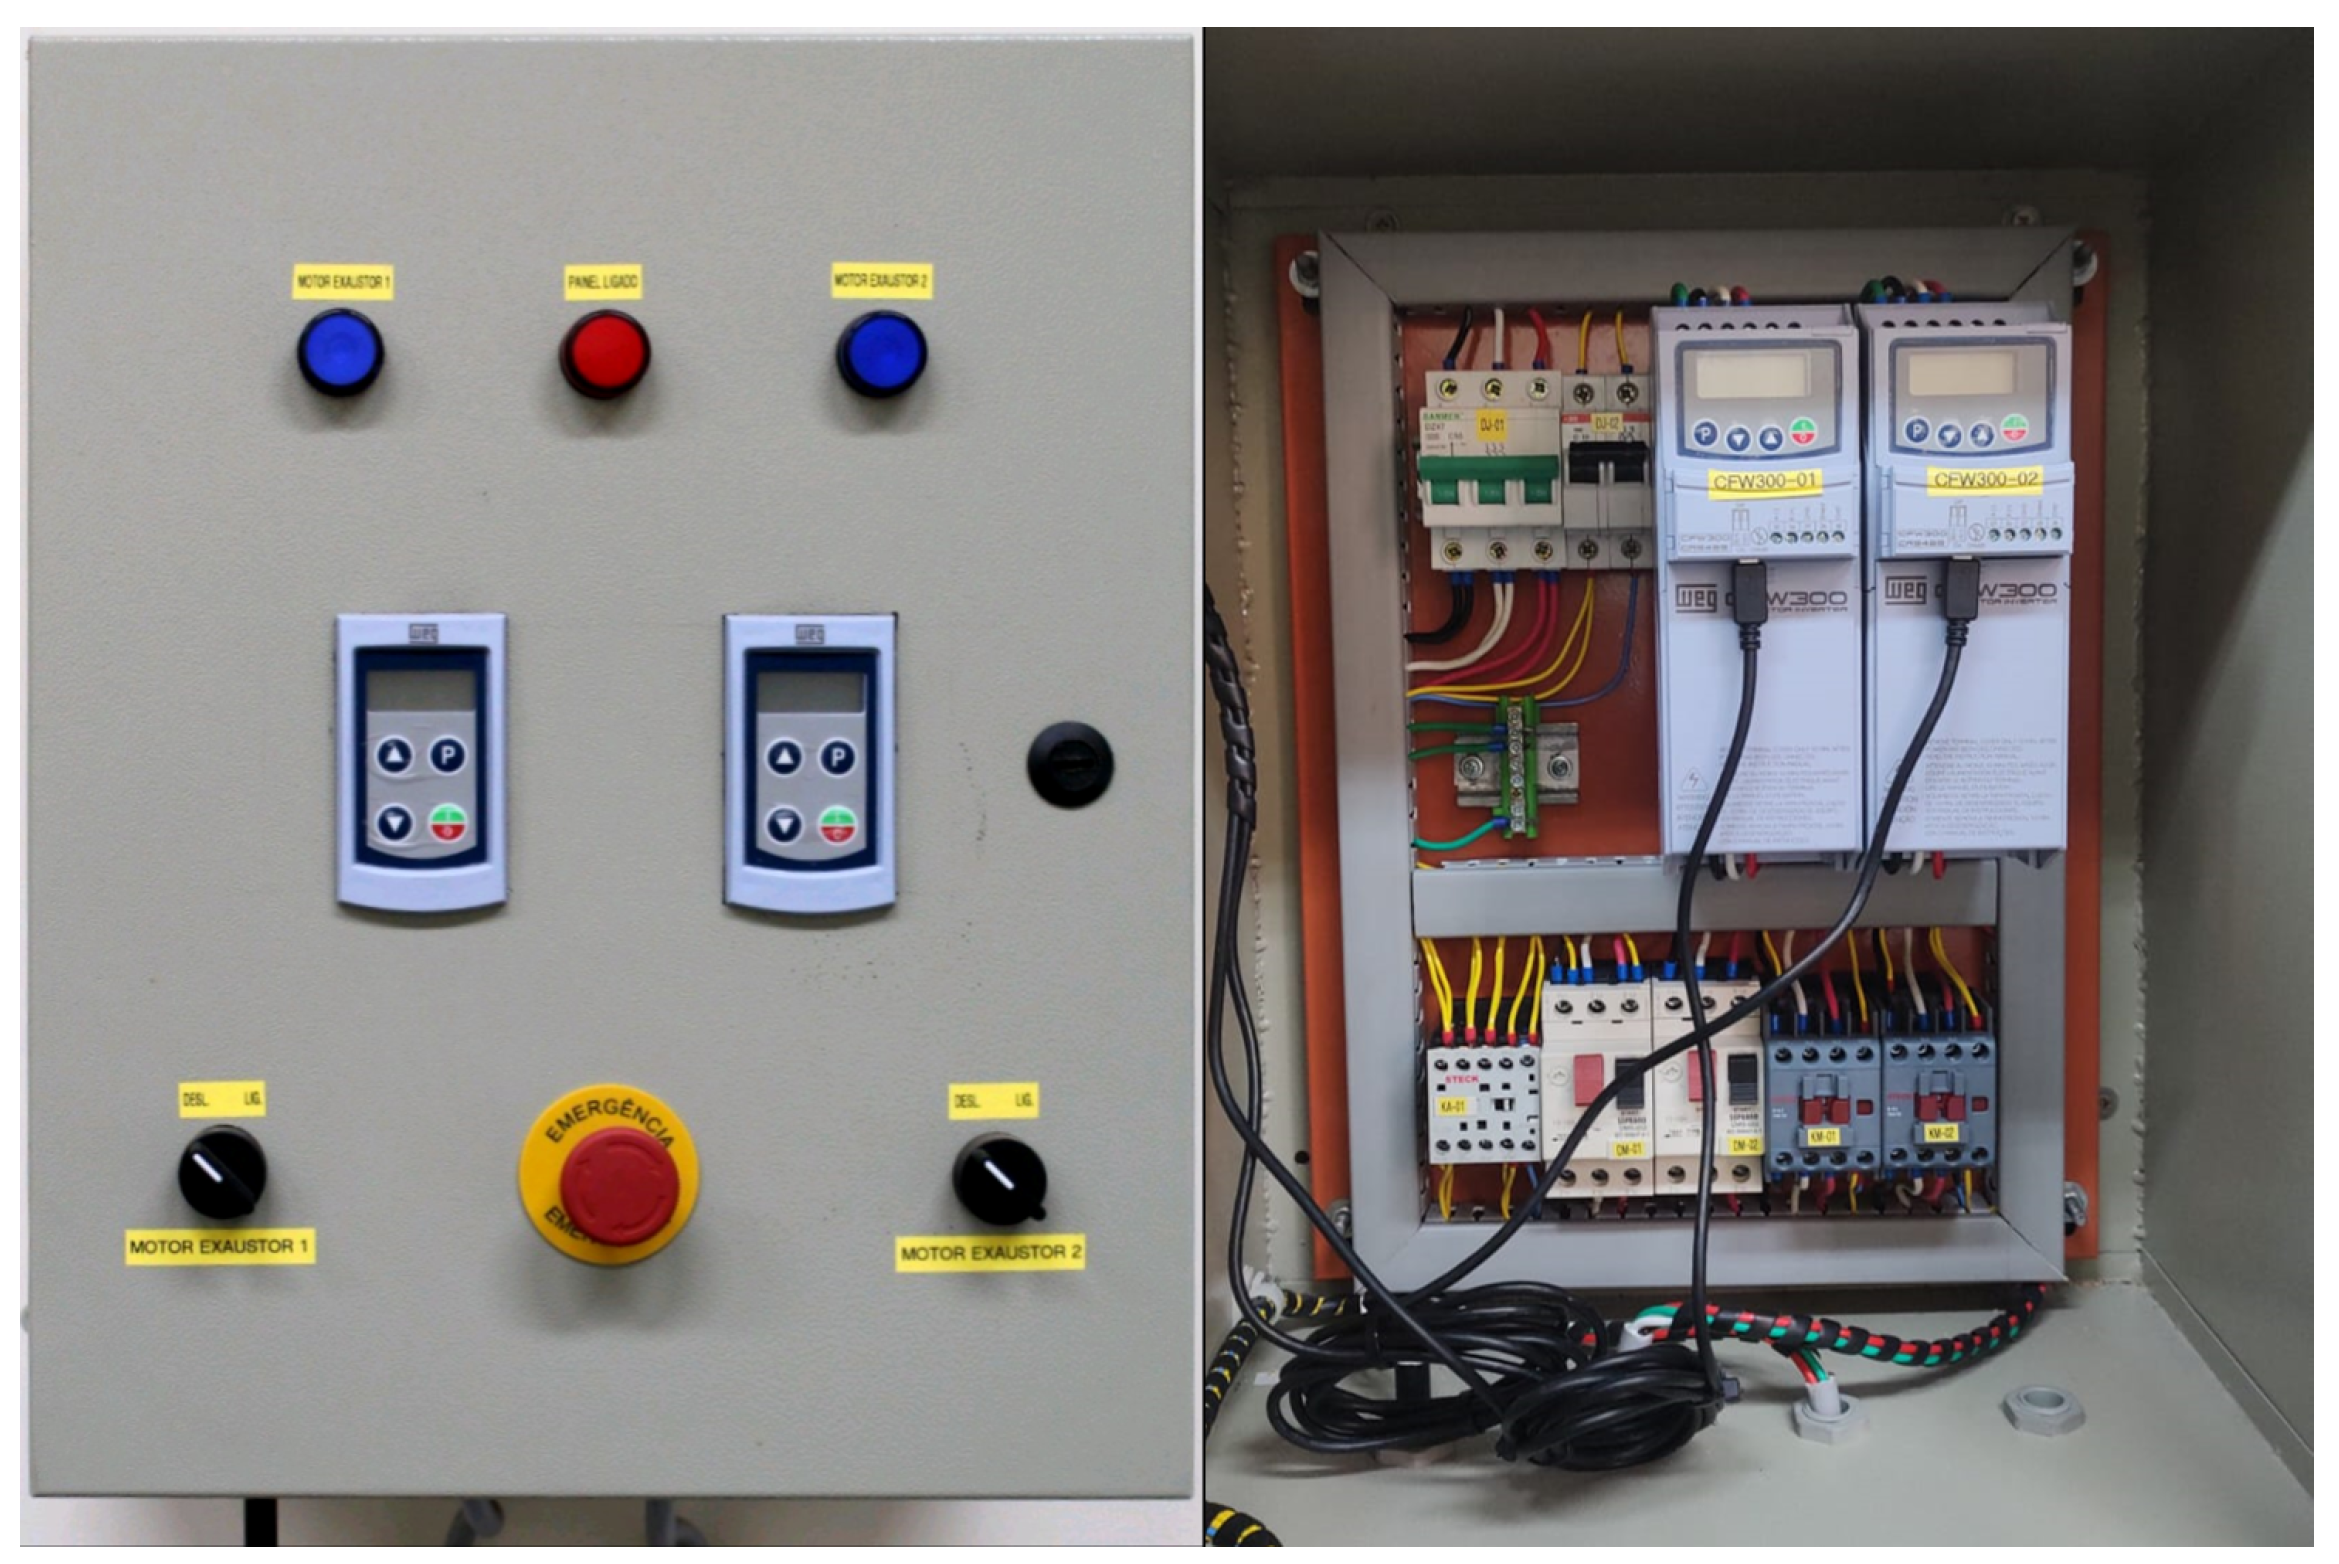
A portable digital anemometer (Instrutemp™ ITAN 720—Instrutemp Instrumentos de Medição Ltda., São Paulo, SP, Brazil) was used to measure the air velocity inside the wind tunnel. Airflow control was achieved through an electrical panel equipped with a WEG™ CFW300 variable frequency drive, which modulated the motor speed of the centrifugal blower by adjusting the electrical waveform. This configuration enabled precise and efficient control of the airflow rate.
The control panel, shown in Figure 8, also includes essential safety components such as mechanical protection relays, circuit breakers, a human–machine interface (HMI), and an emergency stop button.

2.5. Air Heating System

The air heating system was composed of a set of 18 electrical resistive elements (Resist™), each rated at 200 W, providing a total installed power of 3600 W. These resistors were arranged in parallel and mounted inside a stainless steel duct section positioned upstream of the test section within the wind tunnel.
A PID temperature controller (Novus™) was used to regulate the air temperature at the outlet of the heating chamber by modulating the power supplied to the resistors. The system allowed for stable control of the hot airflow conditions, simulating low-grade waste heat typically encountered in industrial ventilation or exhaust streams.

2.6. Data Acquisition System for Thermoelectric Generators

The electrical output of the thermoelectric generator (TEG) modules was monitored using a custom low-cost data acquisition (DAQ–Figure 9) system based on an Arduino™ board. The system was equipped with an automated relay-based load switching mechanism, which enabled sequential connection of a set of resistive loads to each TEG in order to trace its current and voltage (IV) response under different electrical conditions. IV measurements were captured at each switching interval and stored for later processing. This approach allowed the estimation of both open-circuit voltage and power output behavior over time.
Further details about the design, control logic, and performance of this DAQ system can be found in [42].

2.7. Full Setup

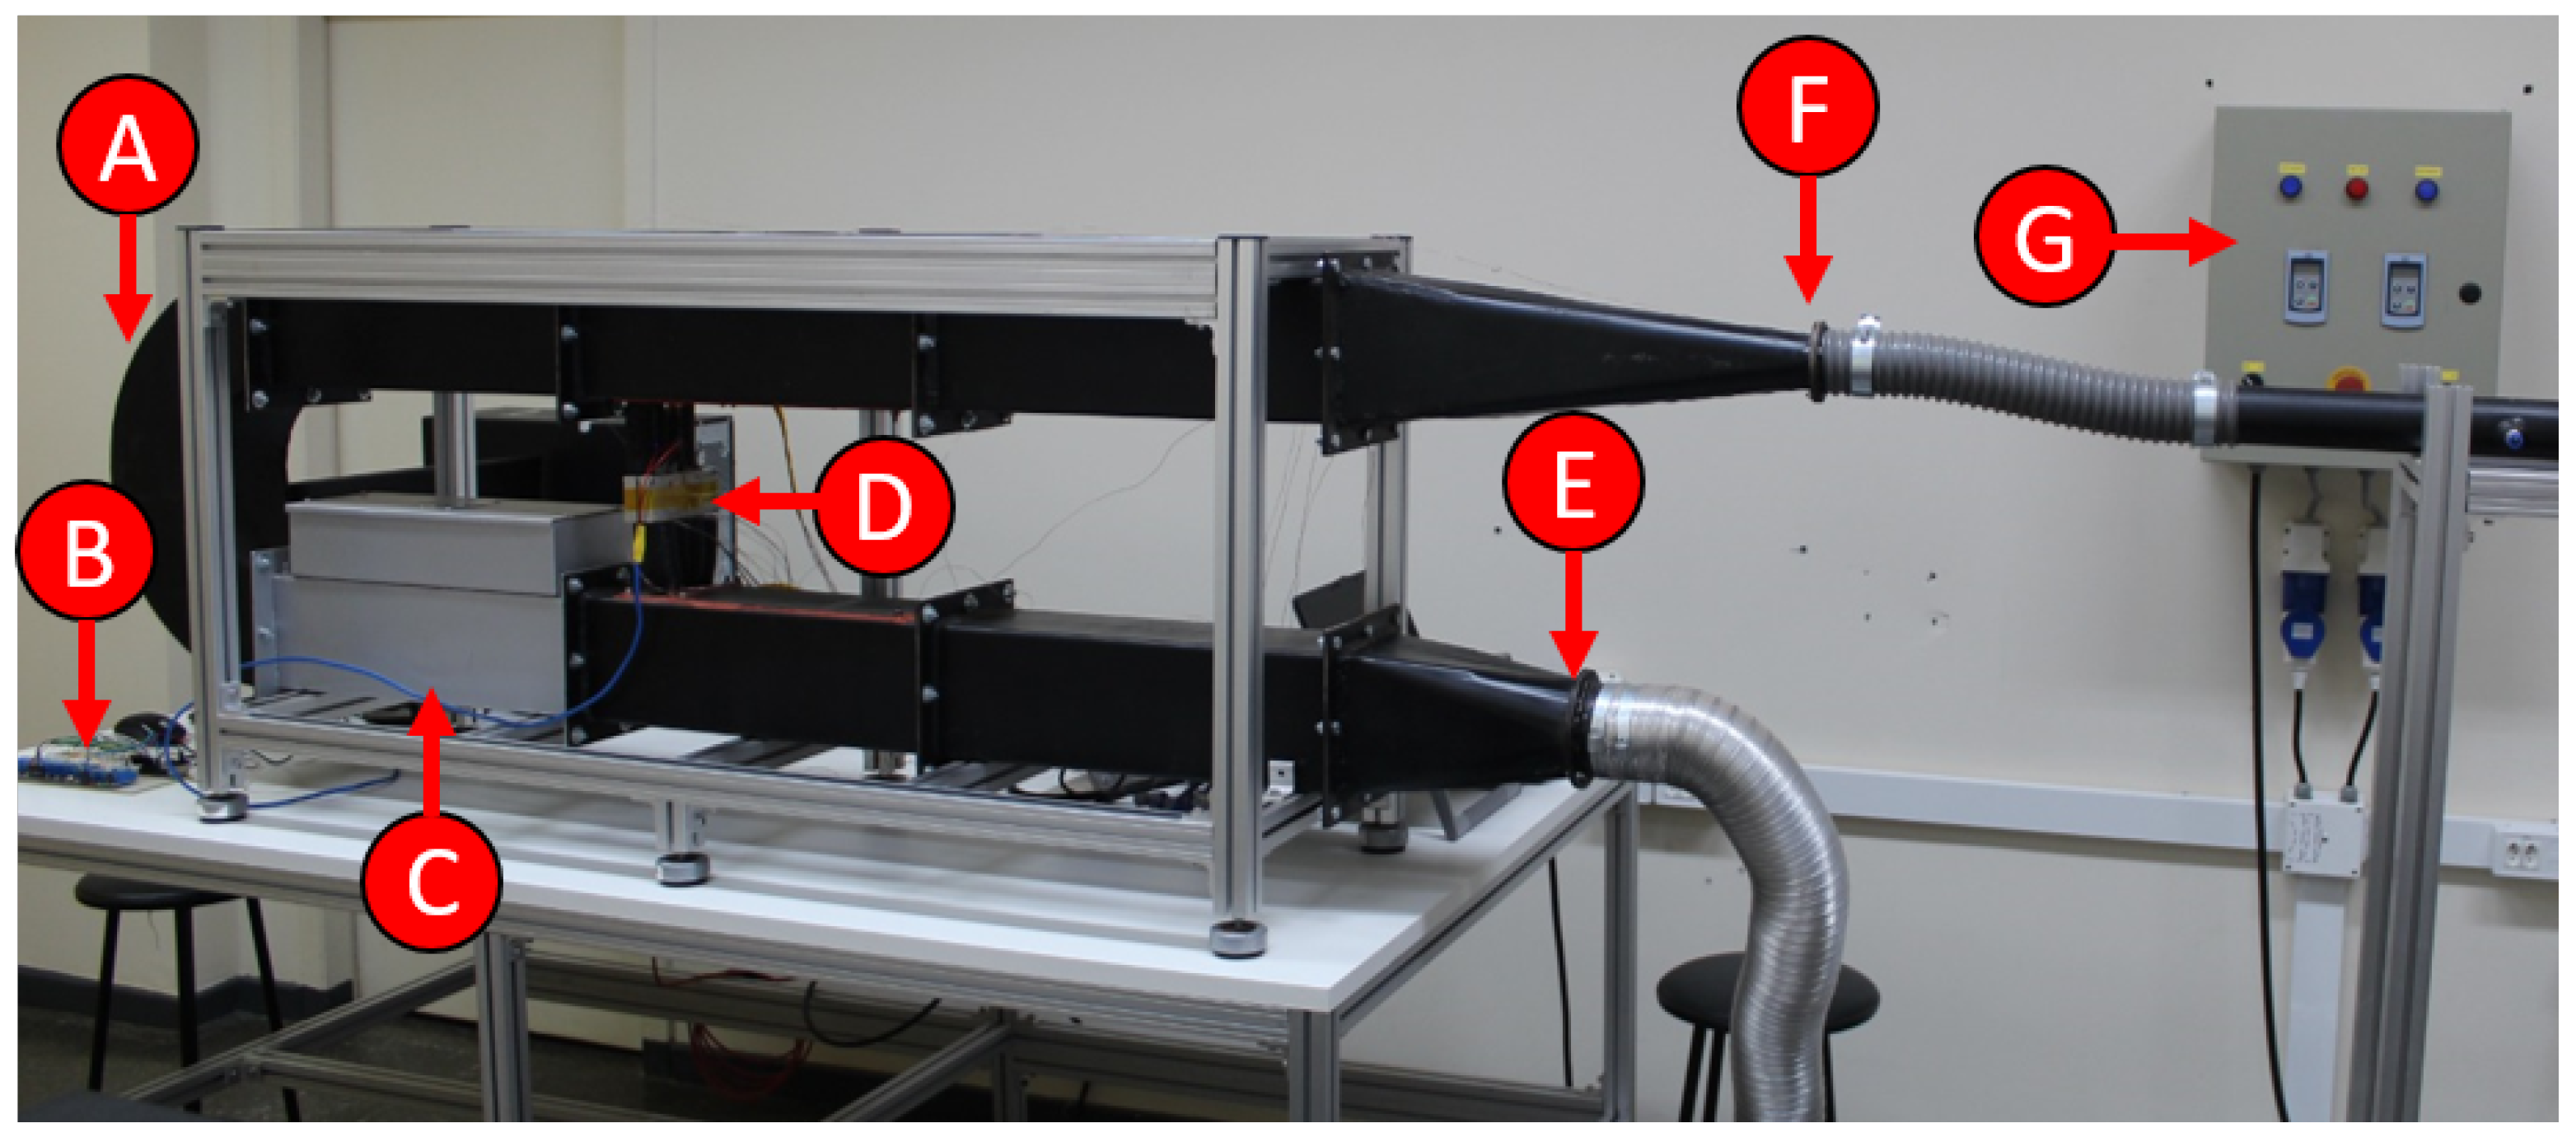
Figure 10 provides an overview of the experimental apparatus and identifies its main components. Label A corresponds to the internal airflow duct, label B indicates the data acquisition system used for the characterization of the thermoelectric generators (TEGs), label C identifies the electric resistance heater bank responsible for air heating, while D denotes the thermosyphon-assisted TEG module with finned heat exchangers. Finally, E and F represent the outlet and inlet of the airflow, respectively, and G corresponds to the airflow control system.
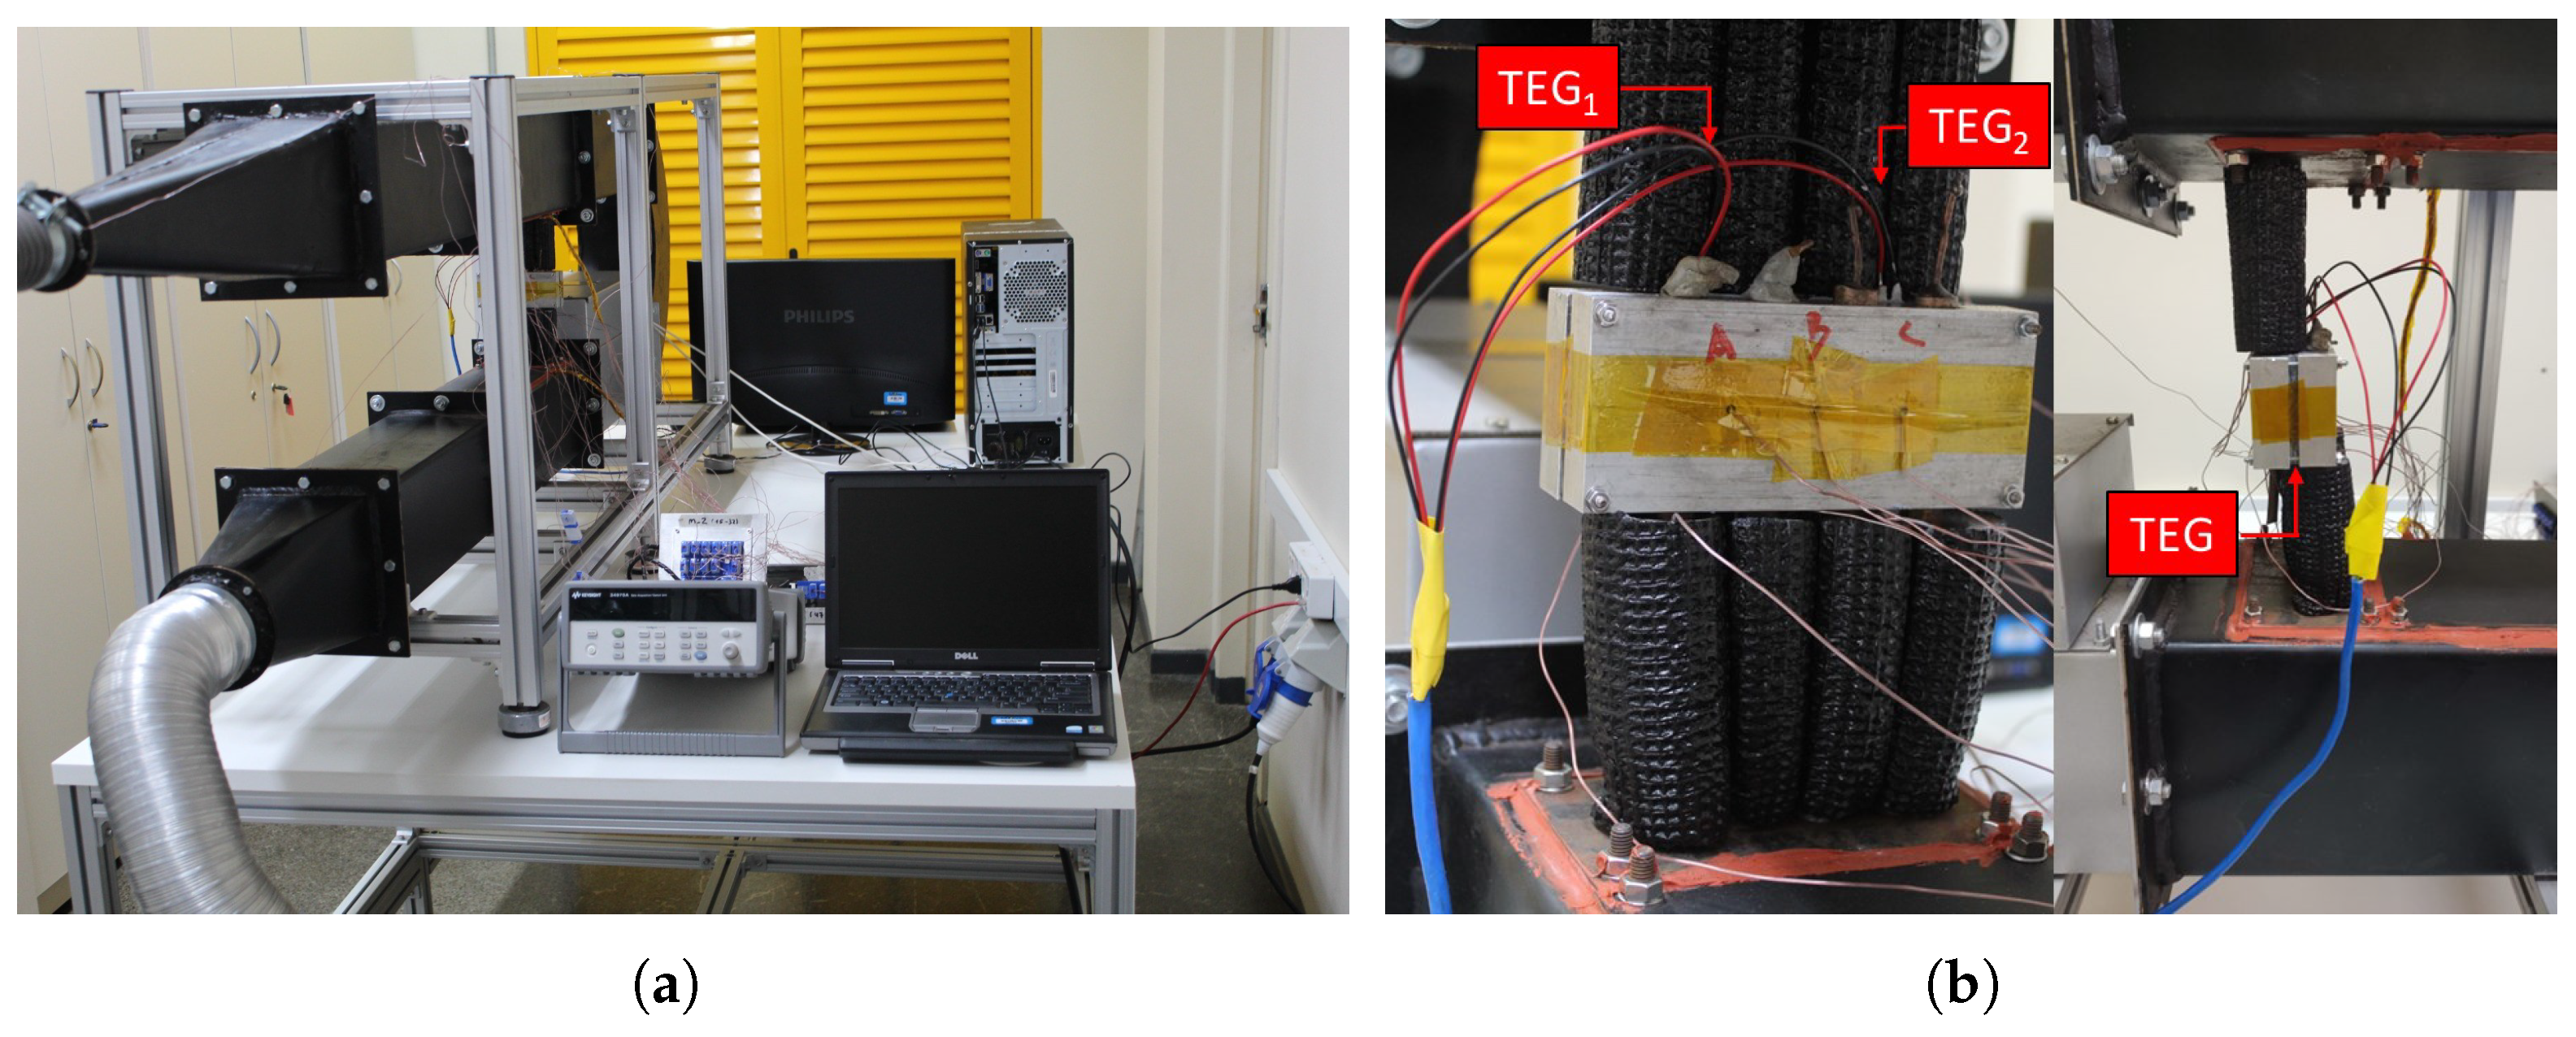
Figure 11a provides an overview of the experimental apparatus focousing on the data acquisition system, while Figure 11b provides an overview of the heat recovery unit.

2.8. Experimental Procedure

All experimental tests were conducted at the Porous Media and Energy Efficiency Laboratory (LabMPEE) at the Federal University of Technology-Parana (UTFPR). The ambient laboratory temperature was maintained at a constant 20 ± 1 °C using an air conditioning system to ensure stable initial conditions for all tests.
The investigation was performed under a matrix of distinct operating conditions by varying two primary parameters: the superficial air velocity and the temperature of the heated air stream.
Three air velocities were tested: 0.6, 1.1, and 1.7 m/s. These correspond to Reynolds numbers within the transitional and turbulent flow regimes, allowing for the evaluation of the system’s performance under varying convective heat transfer conditions. The Reynolds number ( R e ) was calculated according to Equation (1), where ρ air and μ air are the density and dynamic viscosity of air, respectively, v air is the air velocity, and D h is the hydraulic diameter of the wind tunnel.
R e = ρ air · v air · D h μ air
For each velocity setting, the temperature of the simulated exhaust gas was incrementally increased, starting from a setpoint of 90 °C and rising in 30 °C steps to a maximum of 180 °C, as Table 3 shows.
The temperatures showed in Table 3 are coherent with low temperature waste heat scenarios. For instance, studies on large-scale eucalyptus-fired power plants report final exhaust gas temperatures as low as 120 °C [43], and exhaust from smaller wood chip boilers often falls within the 154–179 °C range [44]. Our experimental range is therefore representative of these specific, practical scenarios.
To ensure consistency and accuracy, each experimental run followed a systematic protocol. First, all the connections (electrical, thermocouples, DAQ) were checked to ensure proper operation of the system.
For each test, the desired air velocity was first established using the WEG™ CFW300 variable frequency drive (VFD) to control the blower’s motor speed, after which the Resist™ electric heater bank was activated and set to the target temperature. The system was then operated continuously until it reached quasi-steady-state thermal conditions, defined as the point where temperature readings from key monitoring thermocouples varied by less than 0.5 °C over a 30 min interval.
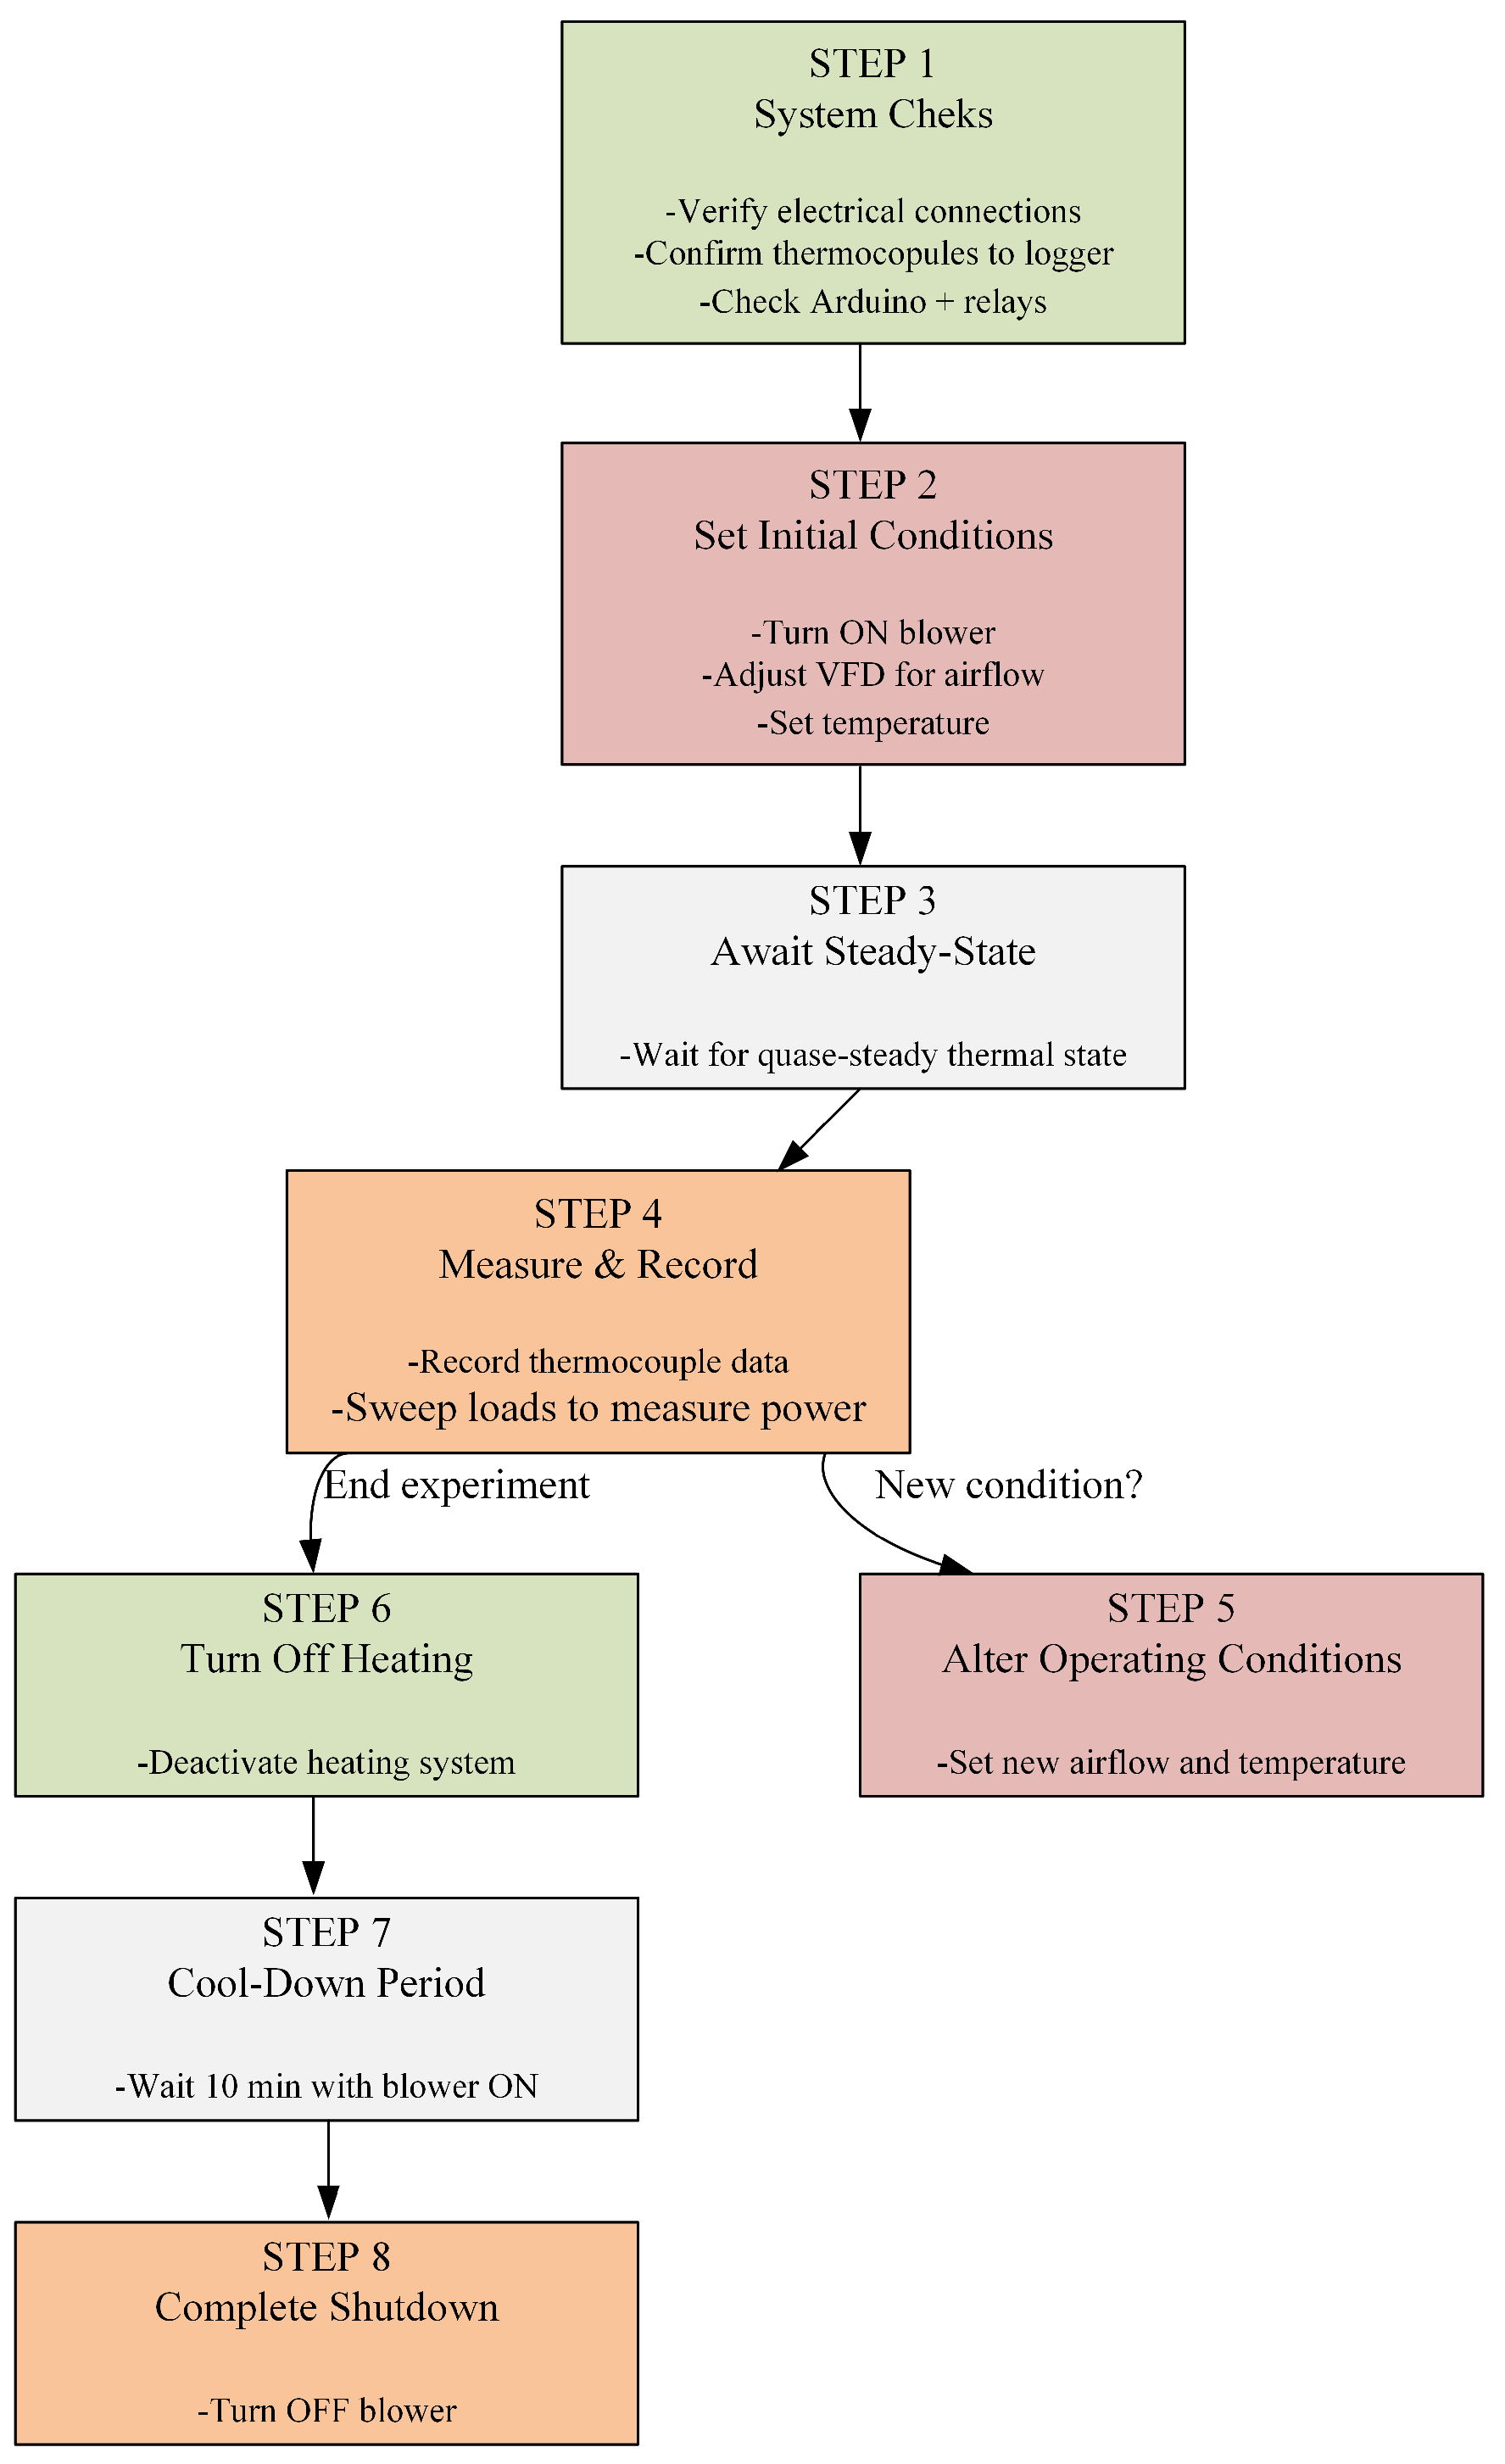
Once thermal stability was confirmed, the data acquisition protocol was initiated. Temperature data from all 16 thermocouples were logged every 10 s using the Agilent™ 34970A system, while the Arduino-based circuit was simultaneously triggered to perform a complete sweep of the resistive loads. This process involved measuring the voltage across each load to construct the characteristic V-I and P-V curves for each TEG module. Figure 12 illustrates the step-by-step operational flowchart that guided each experimental run, from system initialization to data acquisition and shutdown.

2.9. Experimental Uncertainty

All measurements in this study are subject to experimental uncertainties due to instrument precision and data acquisition limitations. Table 4 summarizes the main instruments used and their associated uncertainties, as specified by the manufacturers.
Experimental repeatability was ensured by performing three independent runs for each setpoint. The results from these runs were then averaged for the final analysis. A consistency criterion was applied, where the difference between the mean values of the runs had to be less than 0.5 °C to validate the data within the experimental uncertainty range.

2.10. Data Reduction

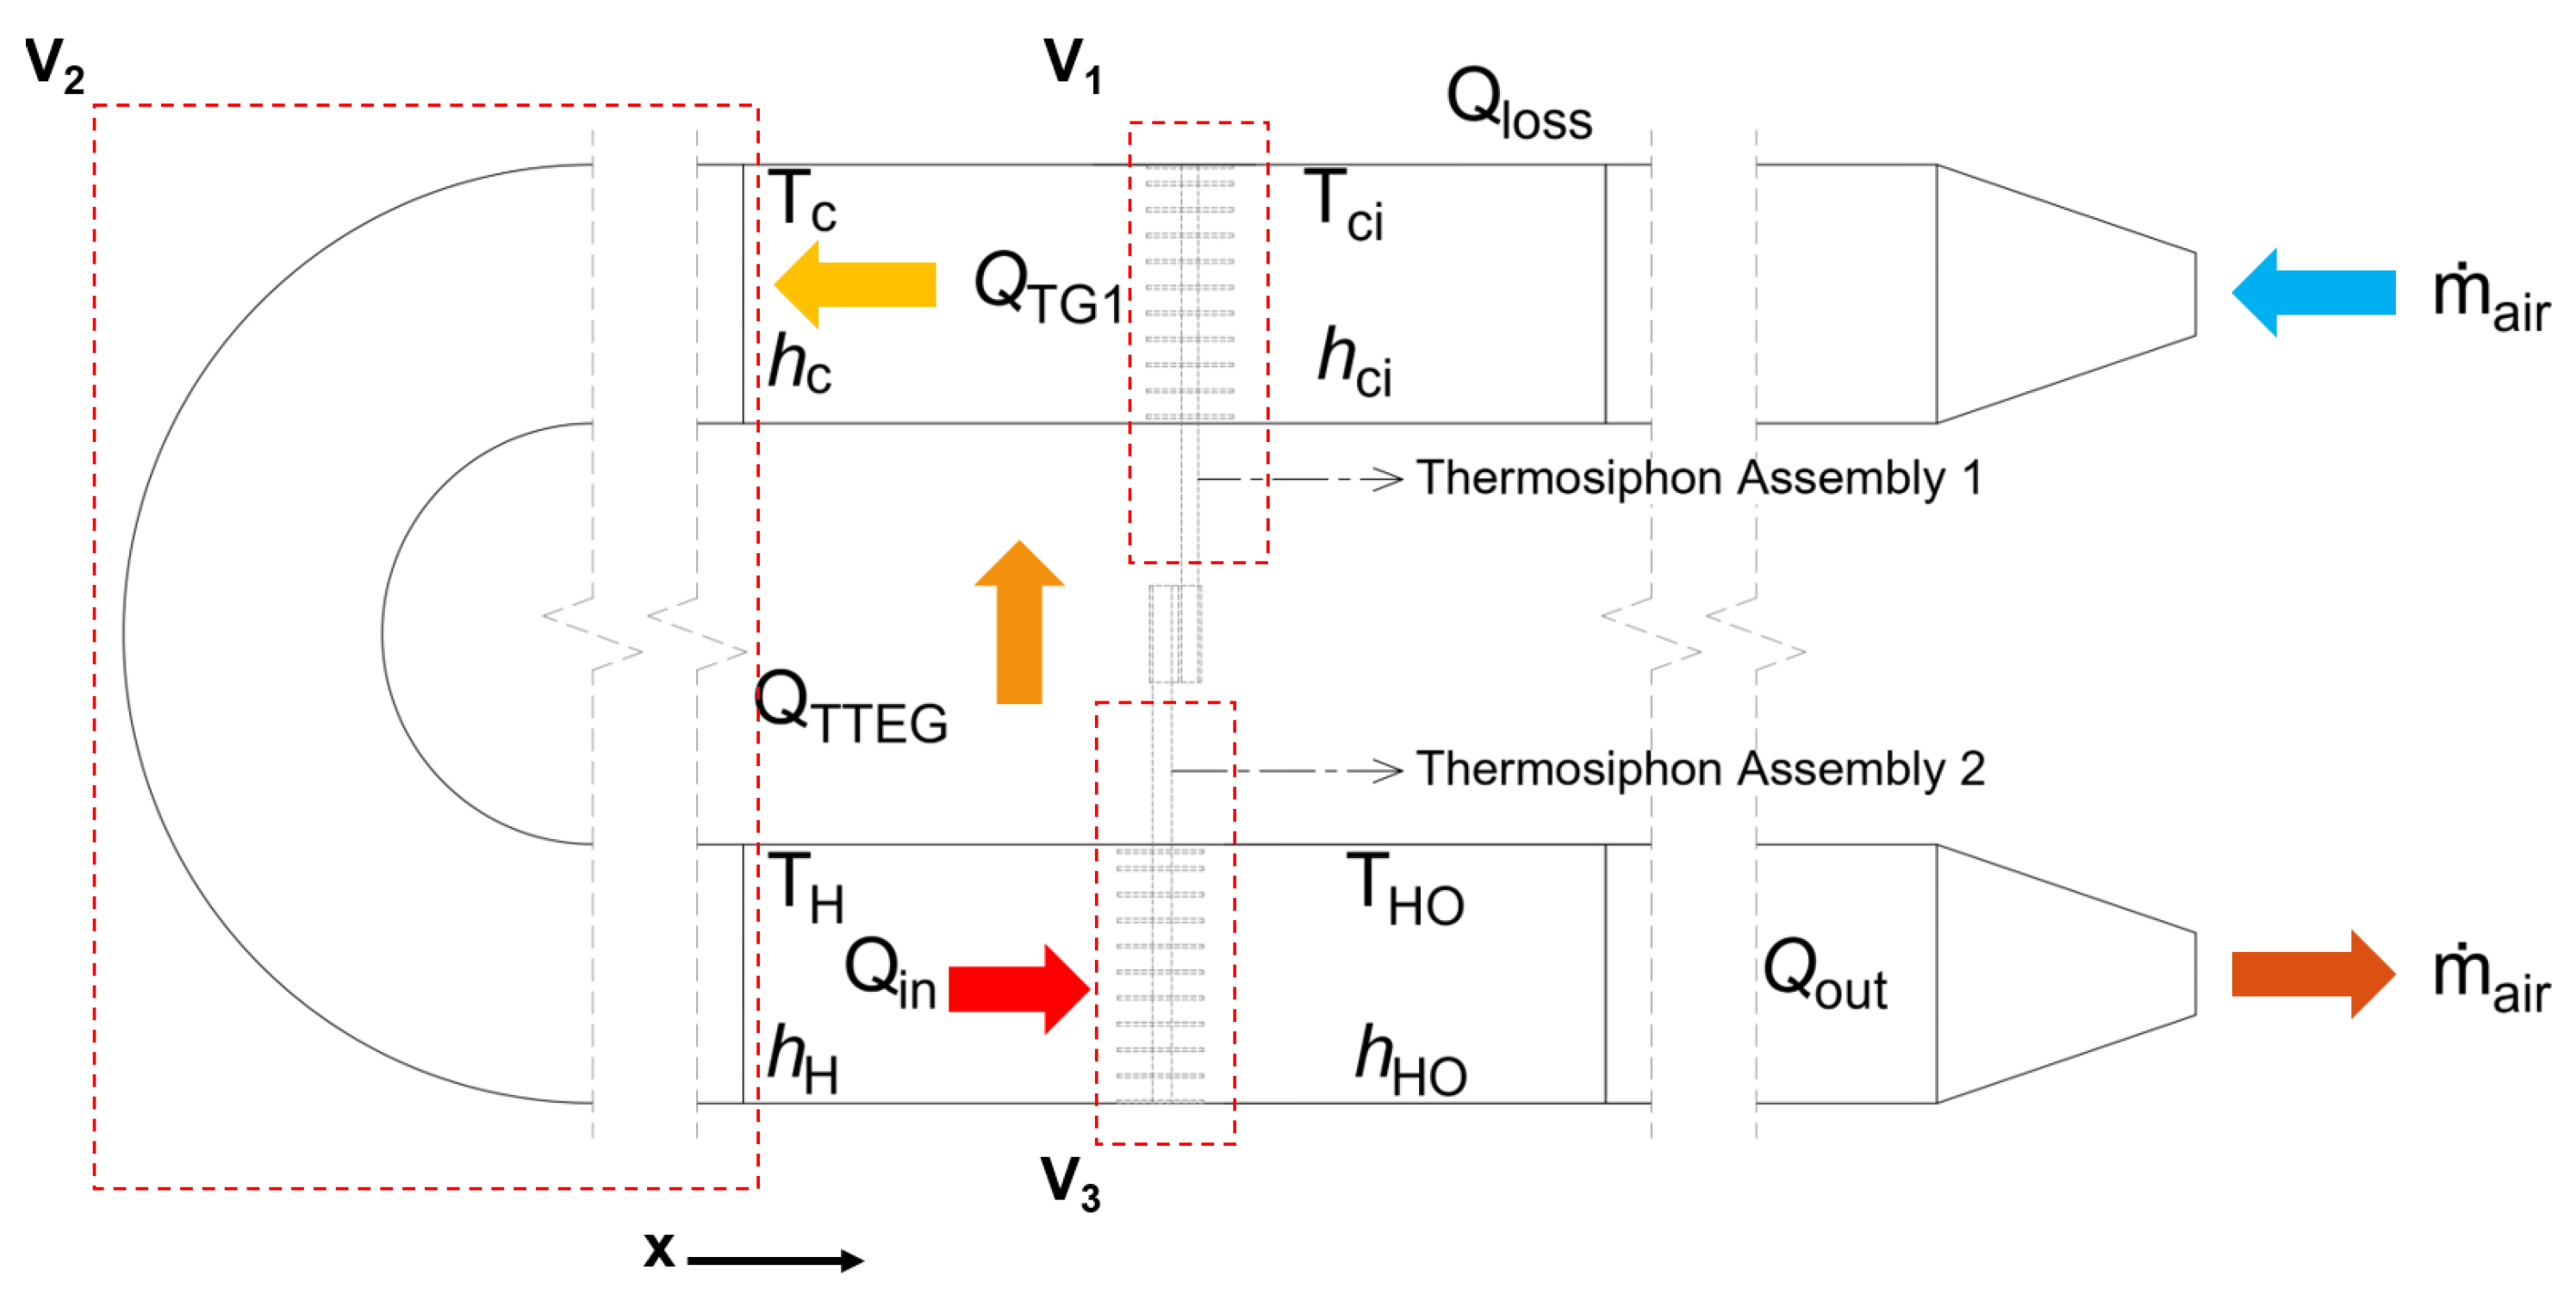
To evaluate the thermal performance of the passive heat recovery system, an energy balance analysis was conducted based on the control volumes shown in Figure 13. This analysis defines the key heat transfer rates used to quantify the energy input, the heat absorbed by the hot-side thermosyphons, and the heat delivered to the cold-side inlet air for preheating.
The total heat input provided to the air stream by the electric heater bank, Q i n [W], was determined by the change in enthalpy across the heater (control volume V 2 ), as shown in Equation (2). All enthapies were obtained using the F-Chart™ Engineering Equation Solver (EES).
Q i n = m ˙ a i r ( h H h C )
where m ˙ a i r is the mass flow rate of air (kg/s), h H is the specific enthalpy of the air immediately after the heater, and h C is the specific enthalpy of the air before the heater (after being preheated by the cold-side thermosyphons).
The heat recovered from the hot air stream by the evaporator sections of the hot-side thermosyphon assembly (Set 2), denoted as Q T T E G [W], was calculated based on the enthalpy drop across this section (control volume V 3 ), given by Equation (3):
Q T T E G = m ˙ a i r ( h H h H O )
where h H O is the specific enthalpy of the air at the outlet of the hot section. This value represents the total thermal energy absorbed by the heat recovery unit.
The heat effectively transferred to the cold inlet air by the condenser sections of the cold-side thermosyphon assembly (Set 1), Q T G 1 [W], quantifies the preheating effect. This was calculated within control volume V 1 using Equation (4):
Q T G 1 = m ˙ a i r ( h C h C i )
where h C i is the specific enthalpy of the air at the system inlet.
To evaluate how effectively the absorbed heat was transferred from the hot stream to the cold stream via the passive system, a heat transfer effectiveness, ϵ , was defined. This non-dimensional parameter is the ratio of the heat delivered for preheating to the heat absorbed from the hot stream, as shown in Equation (6):
ϵ th = Q T G 1 Q T T E G = h C h C i h H h H O
This effectiveness parameter accounts for all thermal resistances in the system (convection, conduction through thermosyphons, TEGs, and aluminum blocks) as well as heat losses ( Q l o s s ) to the surroundings.
The TEG efficiency in terms of the absorbed heat is expressed by Equation (6).
ϵ el = P T E G Q T T E G
The electrical efficiency was evaluated using Equation (7), which represents the ratio between the total recovered energy in the form of electrical power (PTEG) and the total energy supplied to the system. In the same way, the thermal efficiency was evaluated through Equation (8).
η el = P TEG Q in
η th = Q TG 1 Q in
Finally, the first-law efficiency was evaluated using Equation (9), which represents the ratio between the total recovered energy (including the electrical power generated by the TEGs—PTEG and the thermal energy gained by the preheated cold airflow) and the total energy supplied to the system.
η = P TEG + Q TG 1 Q in = η el + η th

3. Results and Discussion

For clarity and convenience, the results are presented in two main parts: thermal and electrical performance.

3.1. Thermal Performance

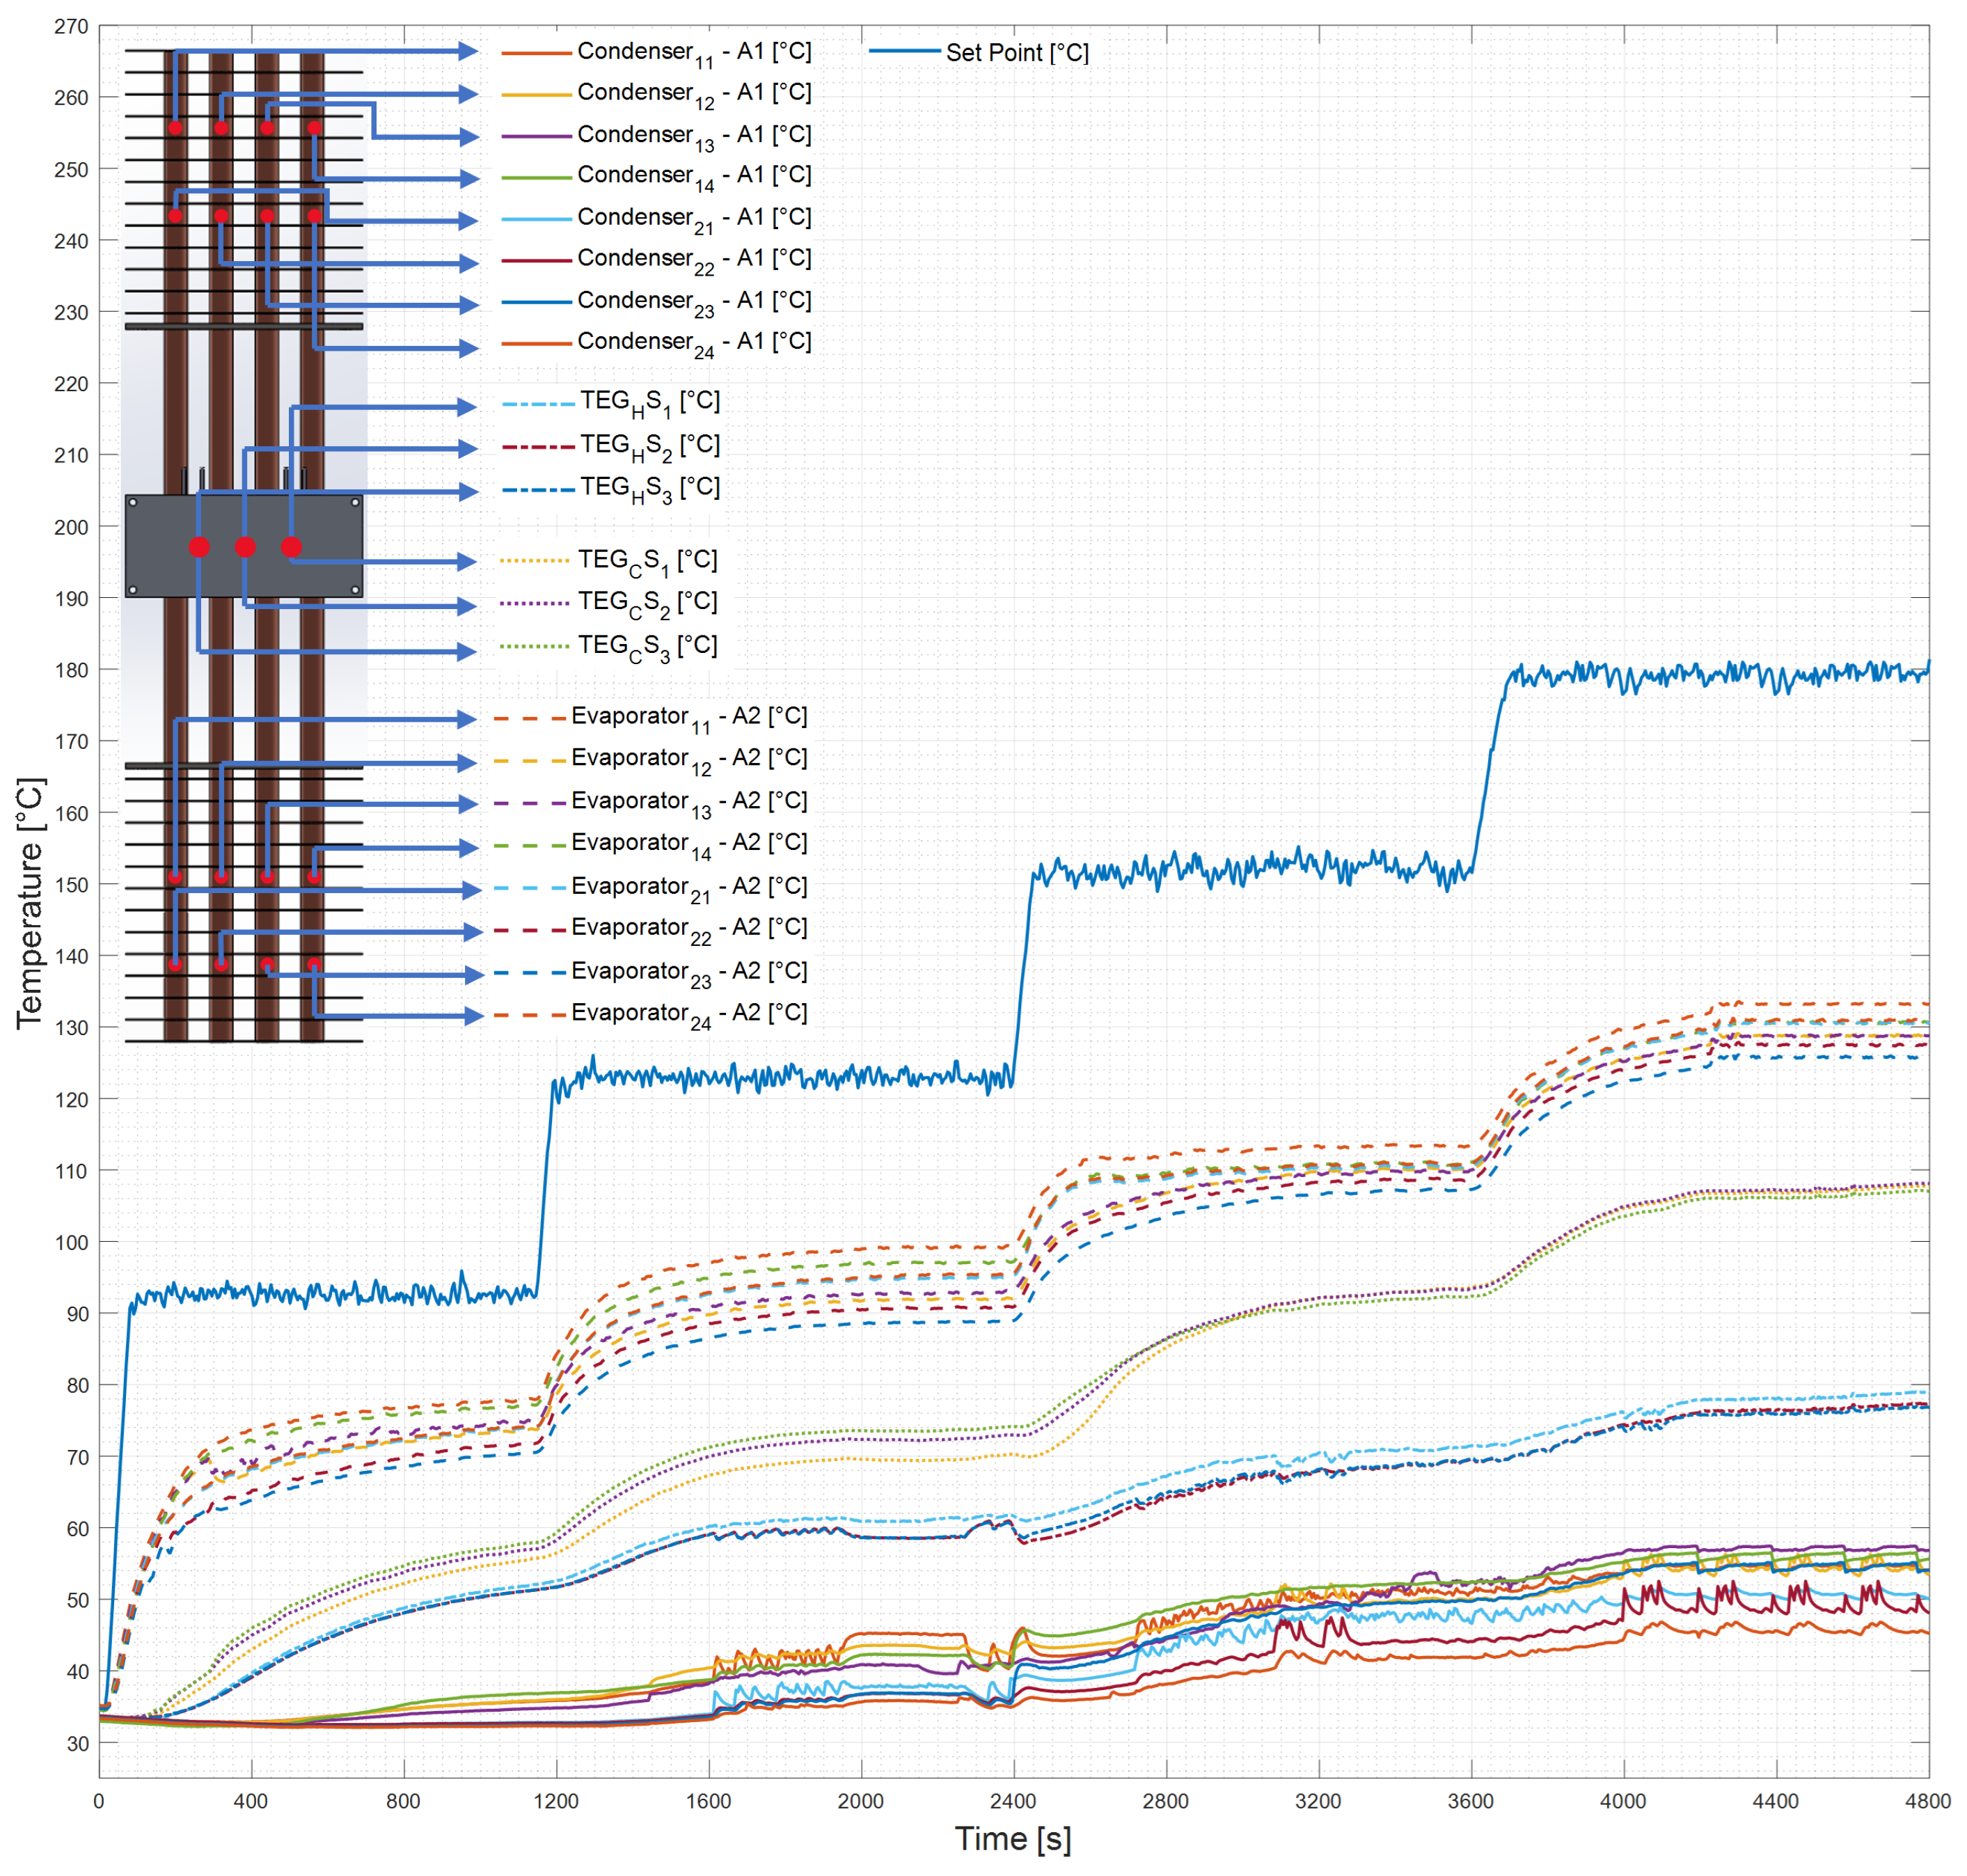
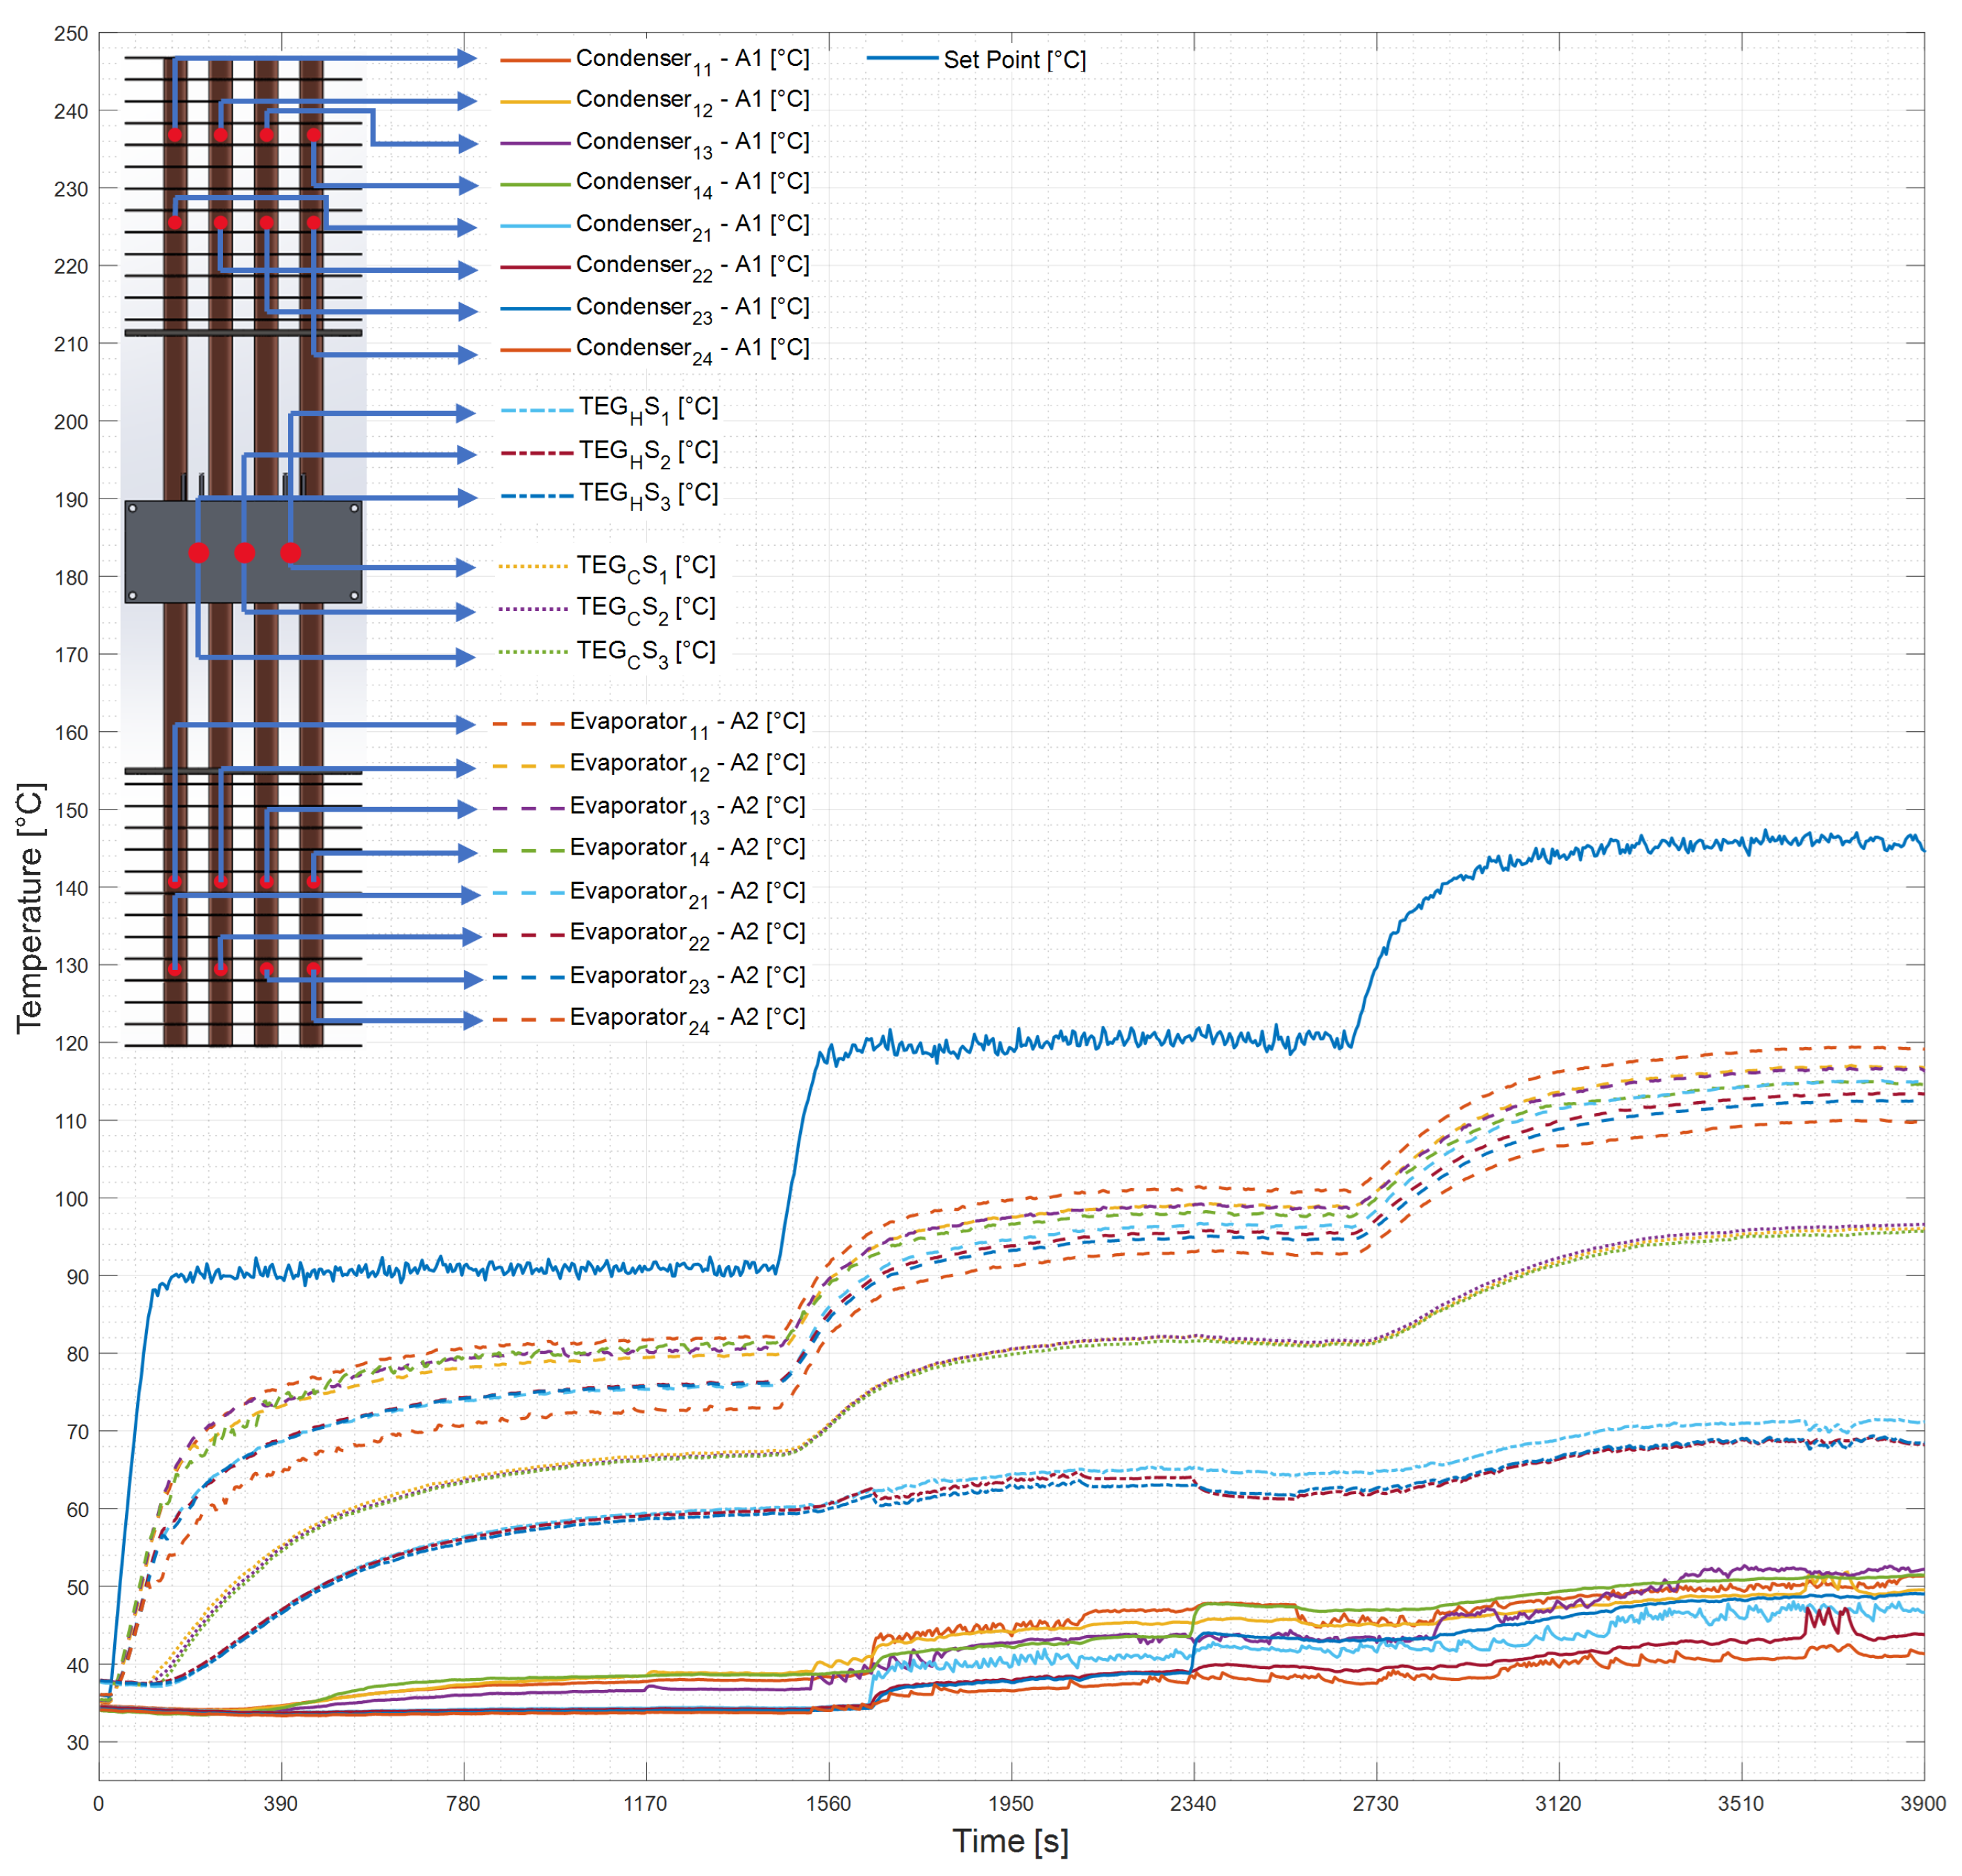
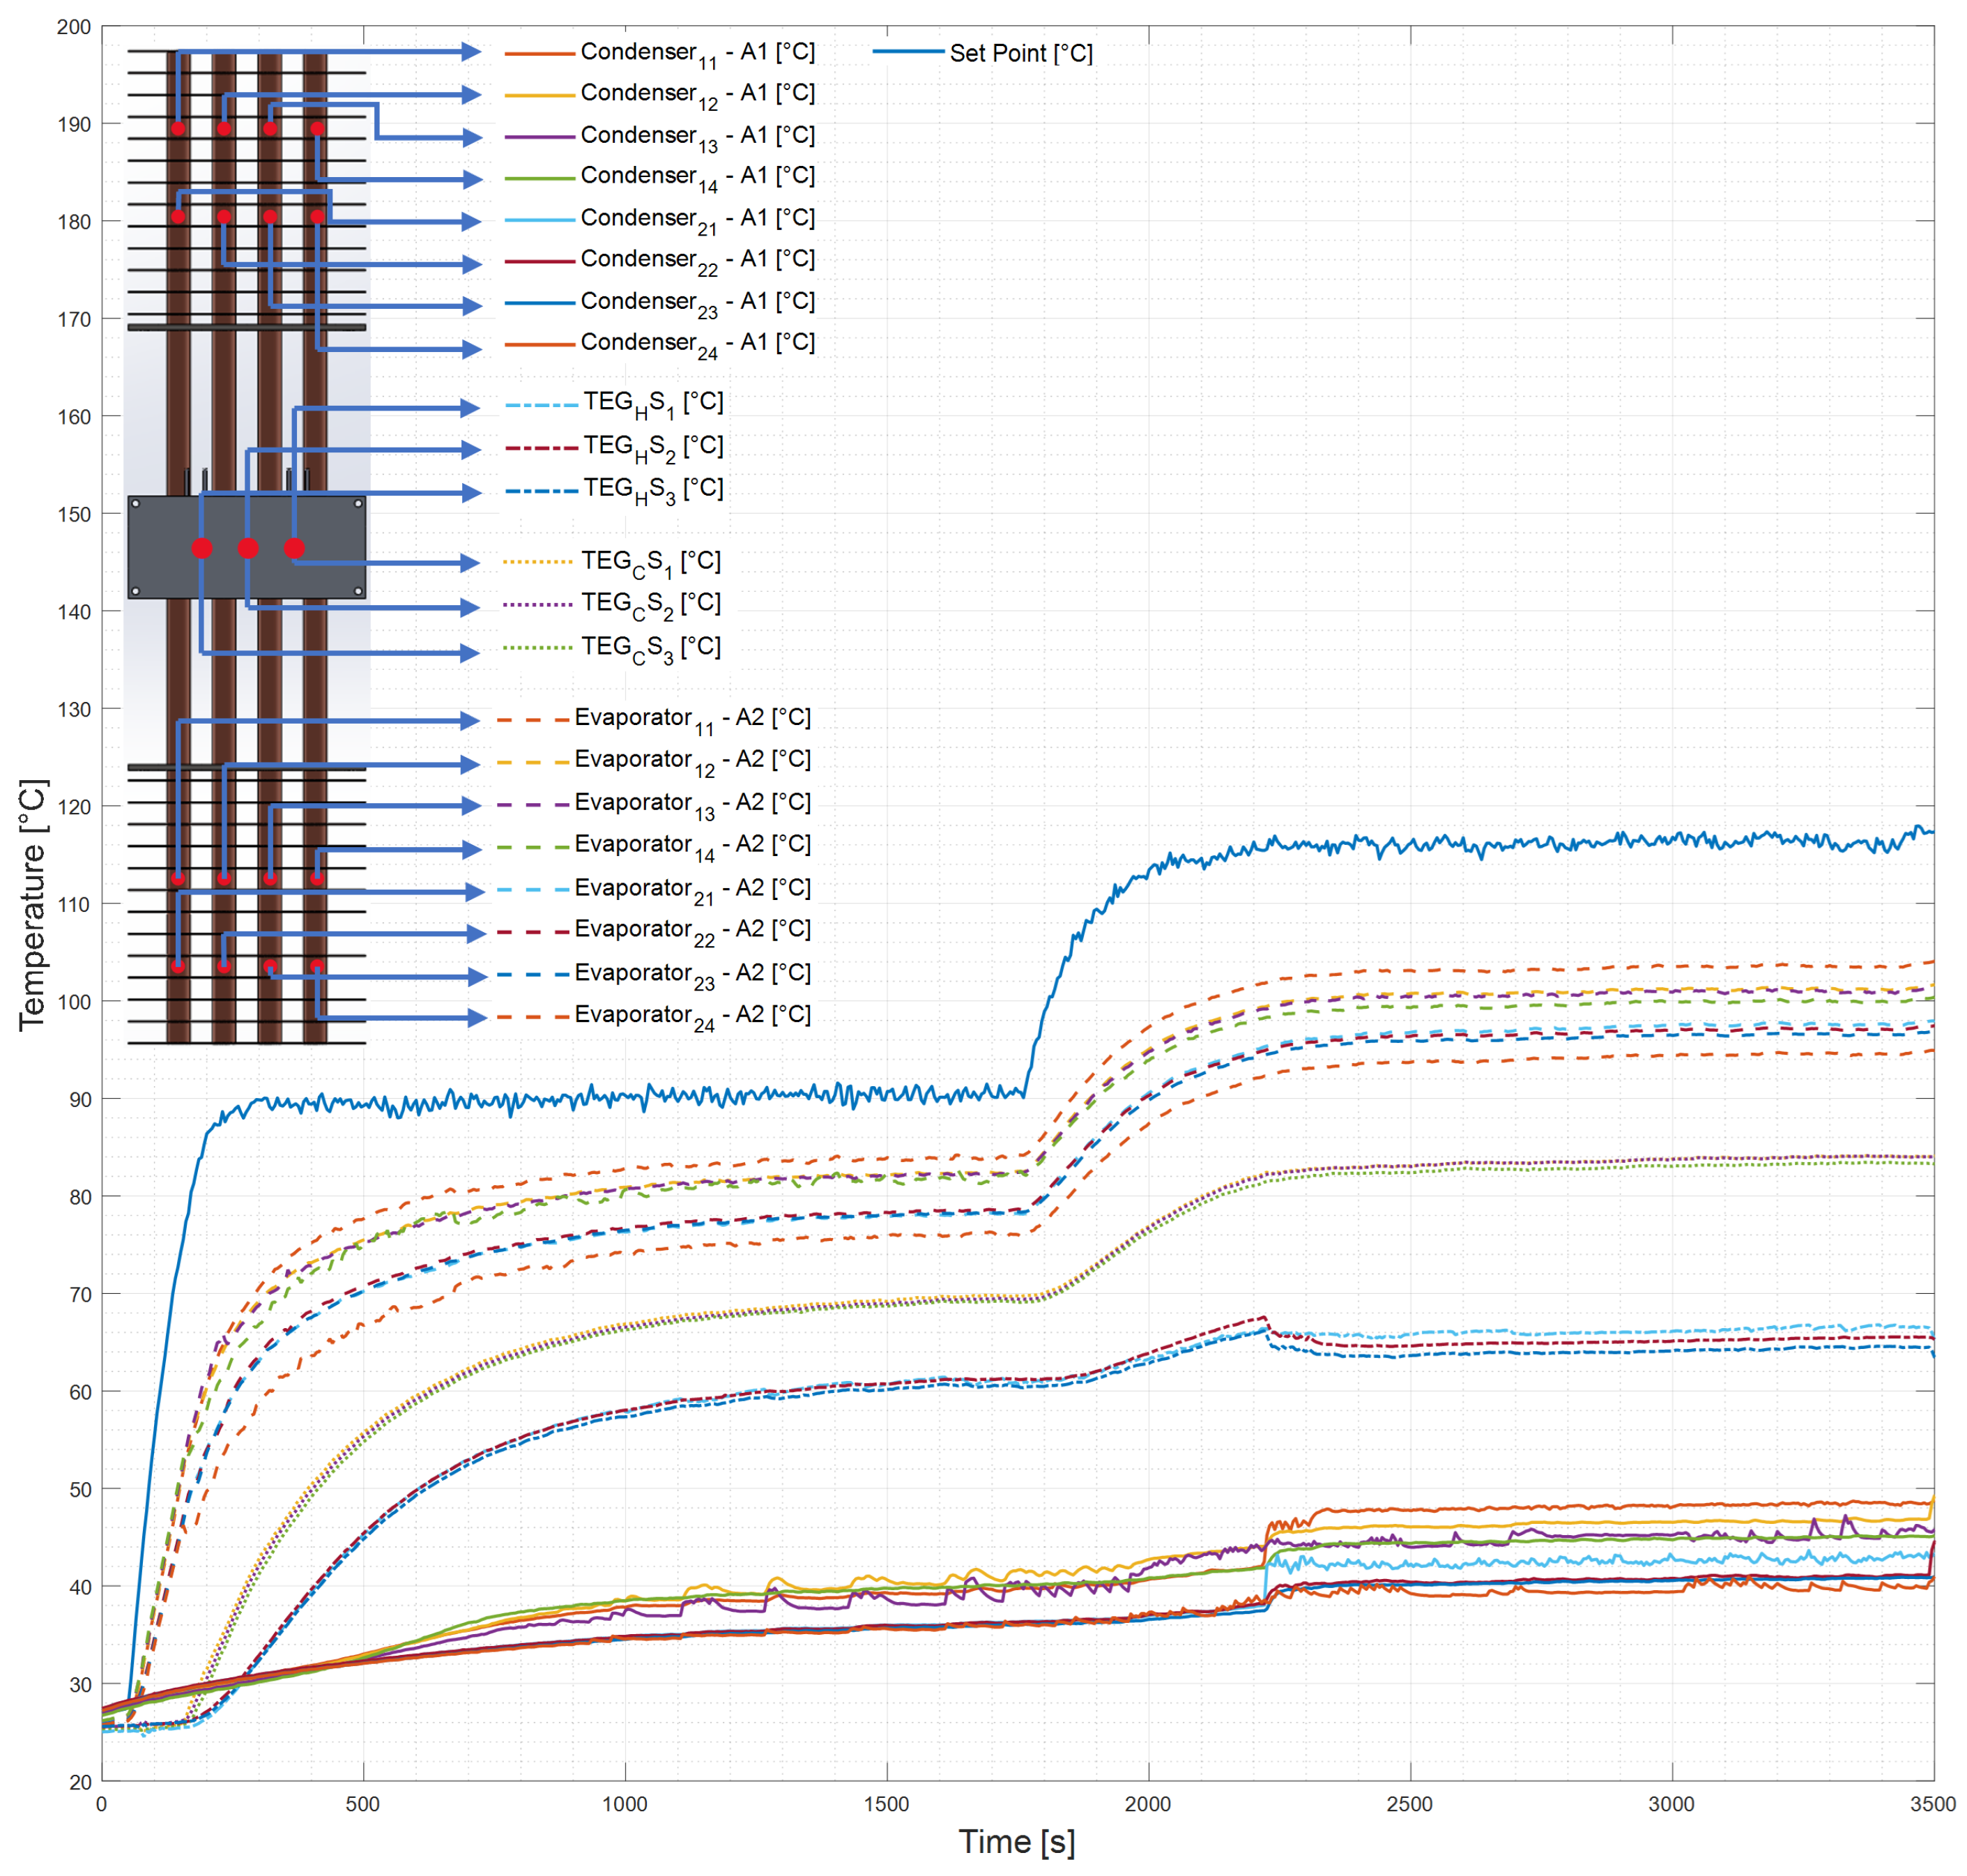
Figure 14, Figure 15 and Figure 16 show the temperature profiles for the air velocities of 0.6, 1.1, and 1.7 m/s from Table 3. As a general trend, the system demonstrated a predictable and stable thermal response across all tested conditions. It was consistently observed that an incremental increase in the hot air temperature setpoint led to a corresponding rise in the steady-state temperatures across all monitored sections of the apparatus. This expected behavior confirms that a stable heat transfer path was established from the hot air stream, through the thermosyphon and TEG assembly, to the cold inlet air stream, validating the overall functionality of the experimental setup.
However, a closer examination of the temperature profiles reveals significant thermal instabilities, particularly during the transient periods at the condenser region when the system was adapting to a new, higher heat load. Instead of a smooth monotonic rise, the temperature curves exhibited noticeable fluctuations. These thermal instabilities are indicative of the geyser boiling phenomenon [45], an intermittent and explosive boiling regime that occurs in thermosyphons with high filling ratios, such as the 100–120% ratios used in this study. These high filling ratios were used as a conservative design choice intended to ensure a sufficient liquid inventory and prevent evaporator dry-out under the highest anticipated thermal loads and overheating of the involucrum material.
This phenomenon occurs when the heat input is insufficient to maintain continuous and steady boiling [46], and originates from a rapid, almost explosive, formation of a large vapor slug in the evaporator, which then violently displaces the liquid column. While originating in the evaporator, the resulting thermal and pressure waves propagate throughout the device, with the effects being particularly evident in the temperature fluctuations recorded in the condenser region as the slug collapses and the liquid returns [45].
Such fluctuations can affect both thermal and electrical output consistency, raising concerns for continuous operation. For applications requiring greater stability and performance consistency, mitigation of this phenomenon would be a key objective for future work. Potential strategies include a systematic optimization of the working fluid filling ratio, likely reducing it to encourage a more stable nucleate boiling regime.
A comparative analysis of the system’s thermal dynamics at a constant hot air temperature reveals the significant influence of the airflow velocity on both the overall operating temperatures and the resulting thermal gradient across the TEG modules. At a fixed inlet temperature setpoint (e.g., 90 °C), higher air velocities consistently resulted in lower overall system temperatures, as can be seen when comparing the conditions of tests 1 (0.6 m/s), 5 (1.1 m/s), and 8 (1.7 m/s).
This behavior is attributed to the enhanced convective heat transfer at the condenser section; a higher airflow rate increases the heat dissipation from the cold side of the thermosyphons, which in turn lowers the equilibrium temperature of the entire passive heat transfer loop. Conversely, and more importantly for power generation, this enhanced cooling effect led to a larger temperature difference ( Δ T) across the TEG faces. The increased airflow had a more pronounced cooling effect on the TEGs’ cold side than on their hot side, thus widening the thermal gradient that drives the Seebeck effect. This highlights that for the same waste heat source temperature, operating at a higher airflow velocity is more effective for creating the necessary conditions for thermoelectric power generation.
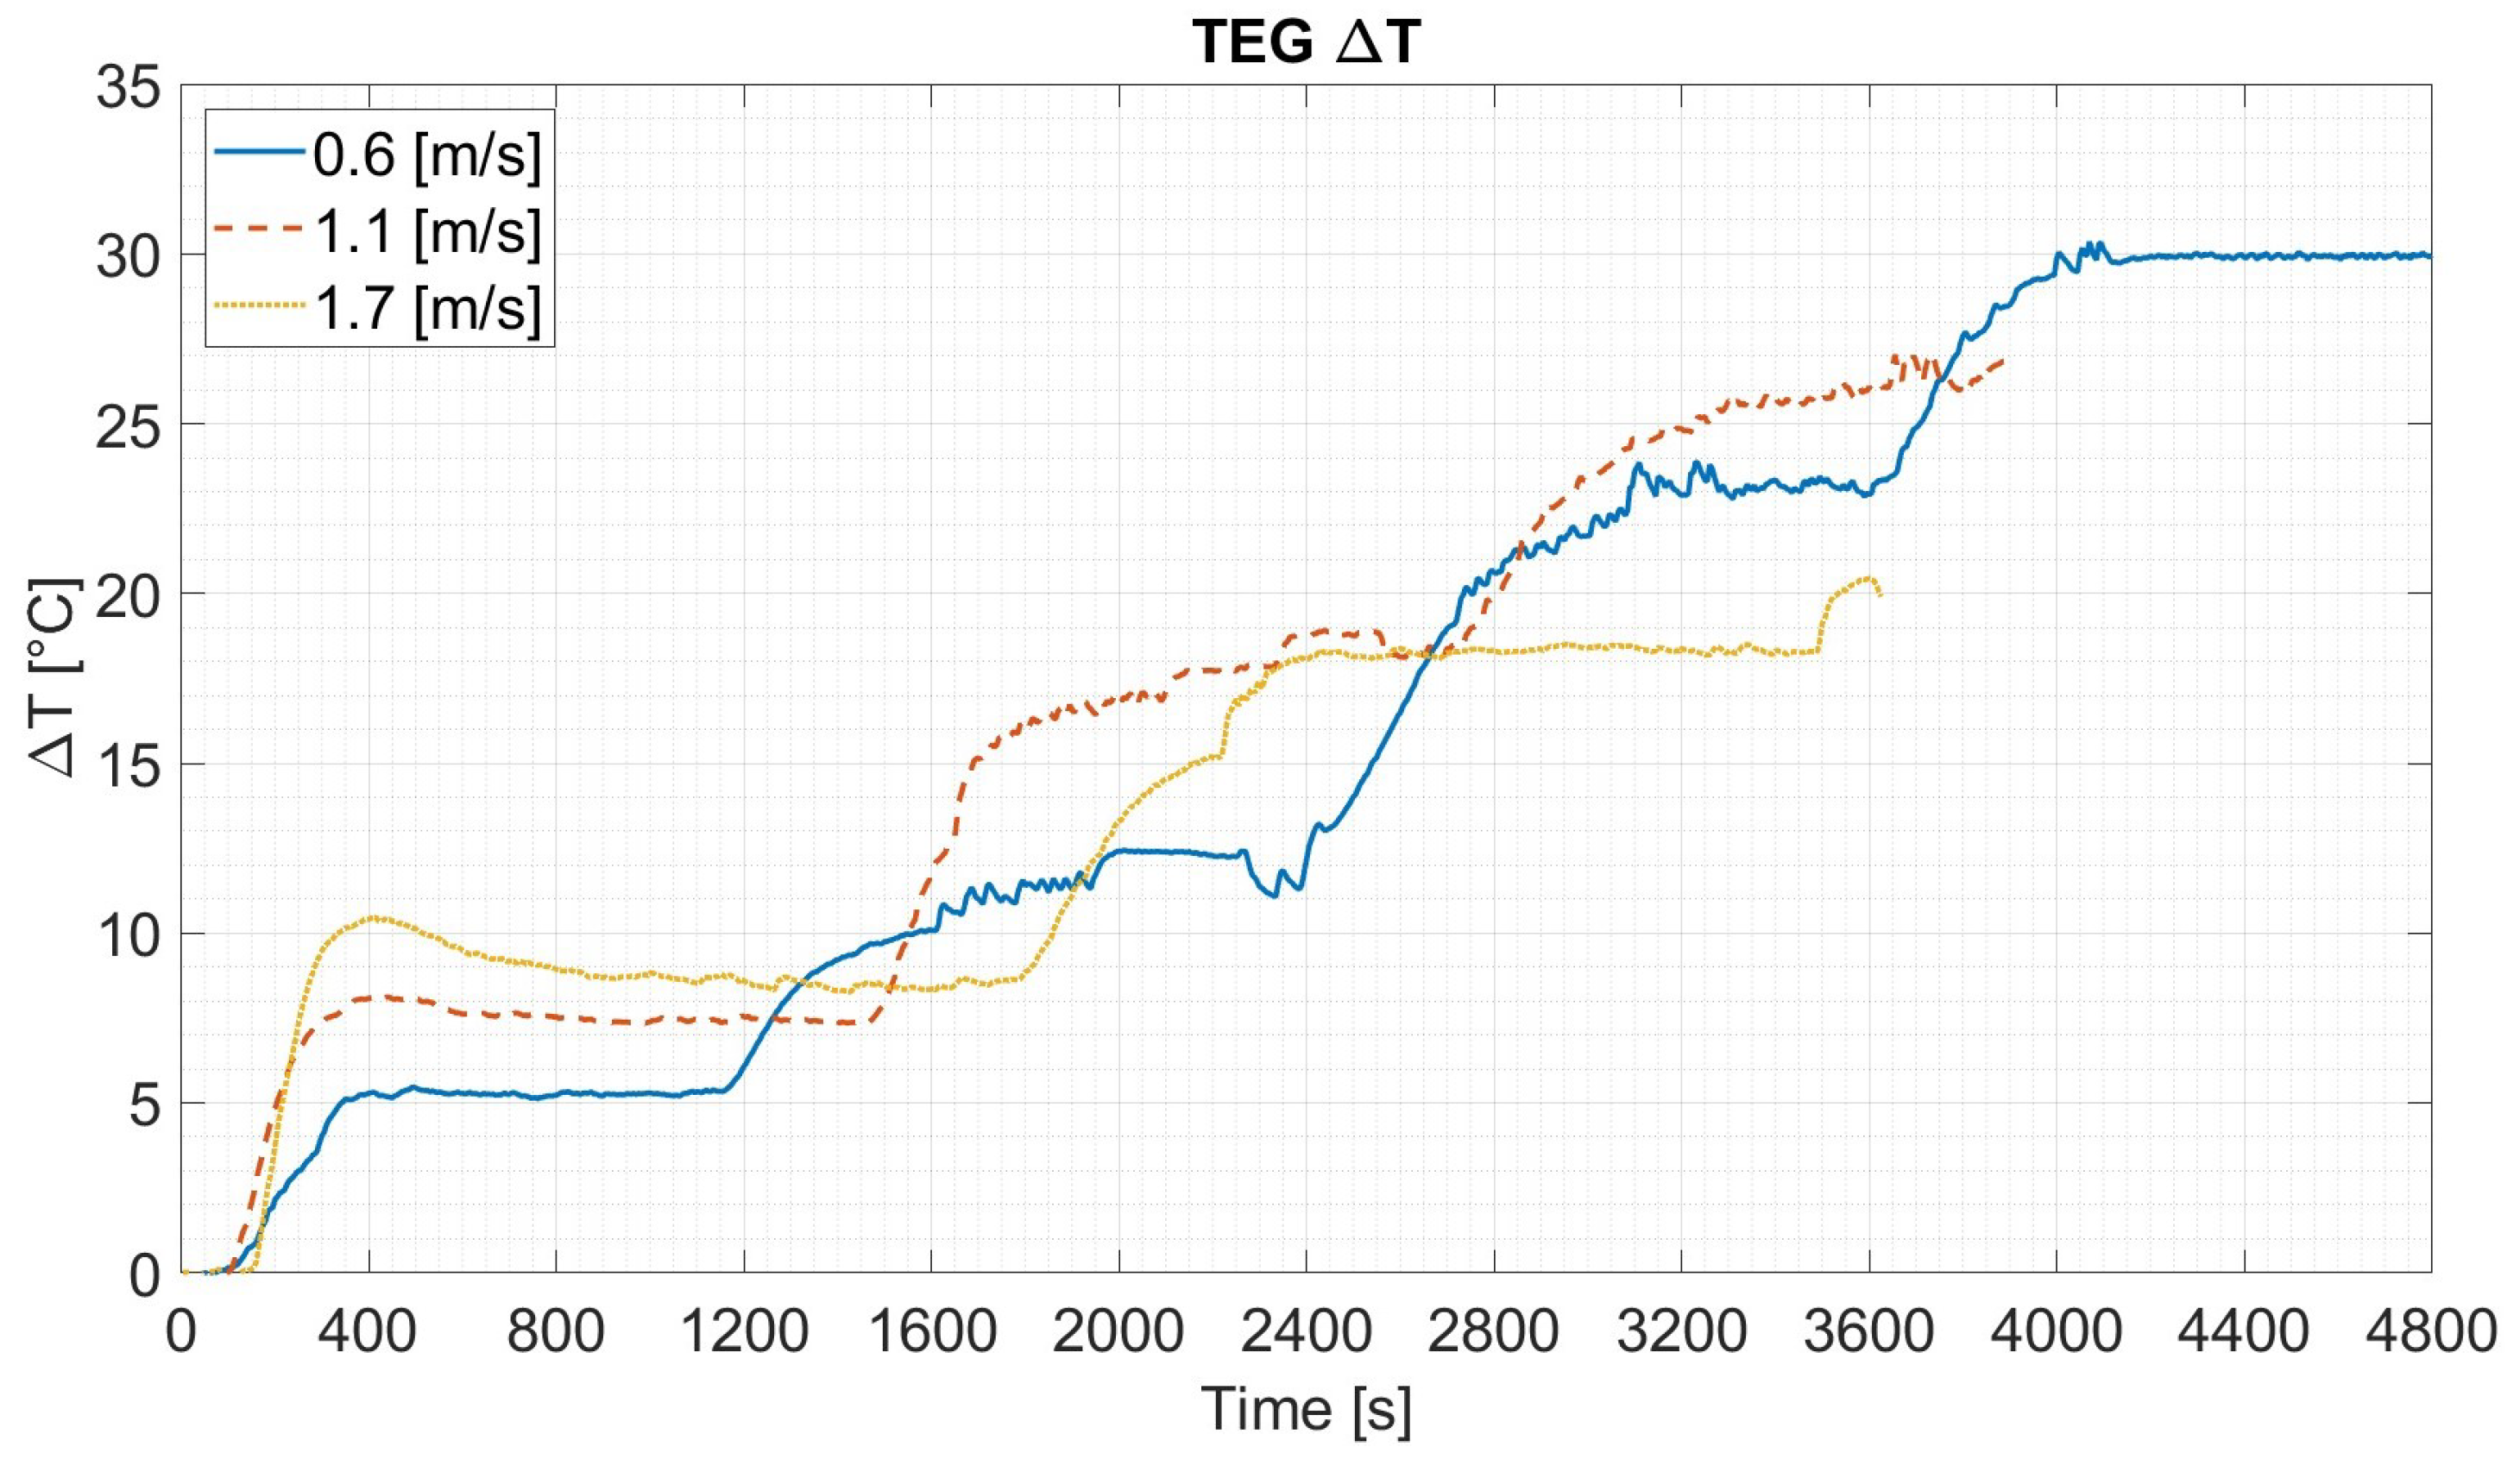
Figure 17 further details this relationship by showing the evolution of the temperature difference ( Δ T) across the TEG faces over time. The plot reveals a critical trade-off in the system’s operation. At lower heating setpoints (e.g., between t = 400–1200 s for the 90 °C condition), the highest air velocity (1.7 m/s) produced the largest Δ T. However, as the heat input increased, the lower air velocity (0.6 m/s) allowed the entire apparatus to reach higher absolute temperatures, ultimately resulting in the highest overall Δ T of approximately 30 °C. This demonstrates that while high velocity is superior at creating a thermal gradient for a fixed heat source temperature, a lower velocity enables the system to operate at a higher thermal potential, leading to the largest maximum temperature difference.
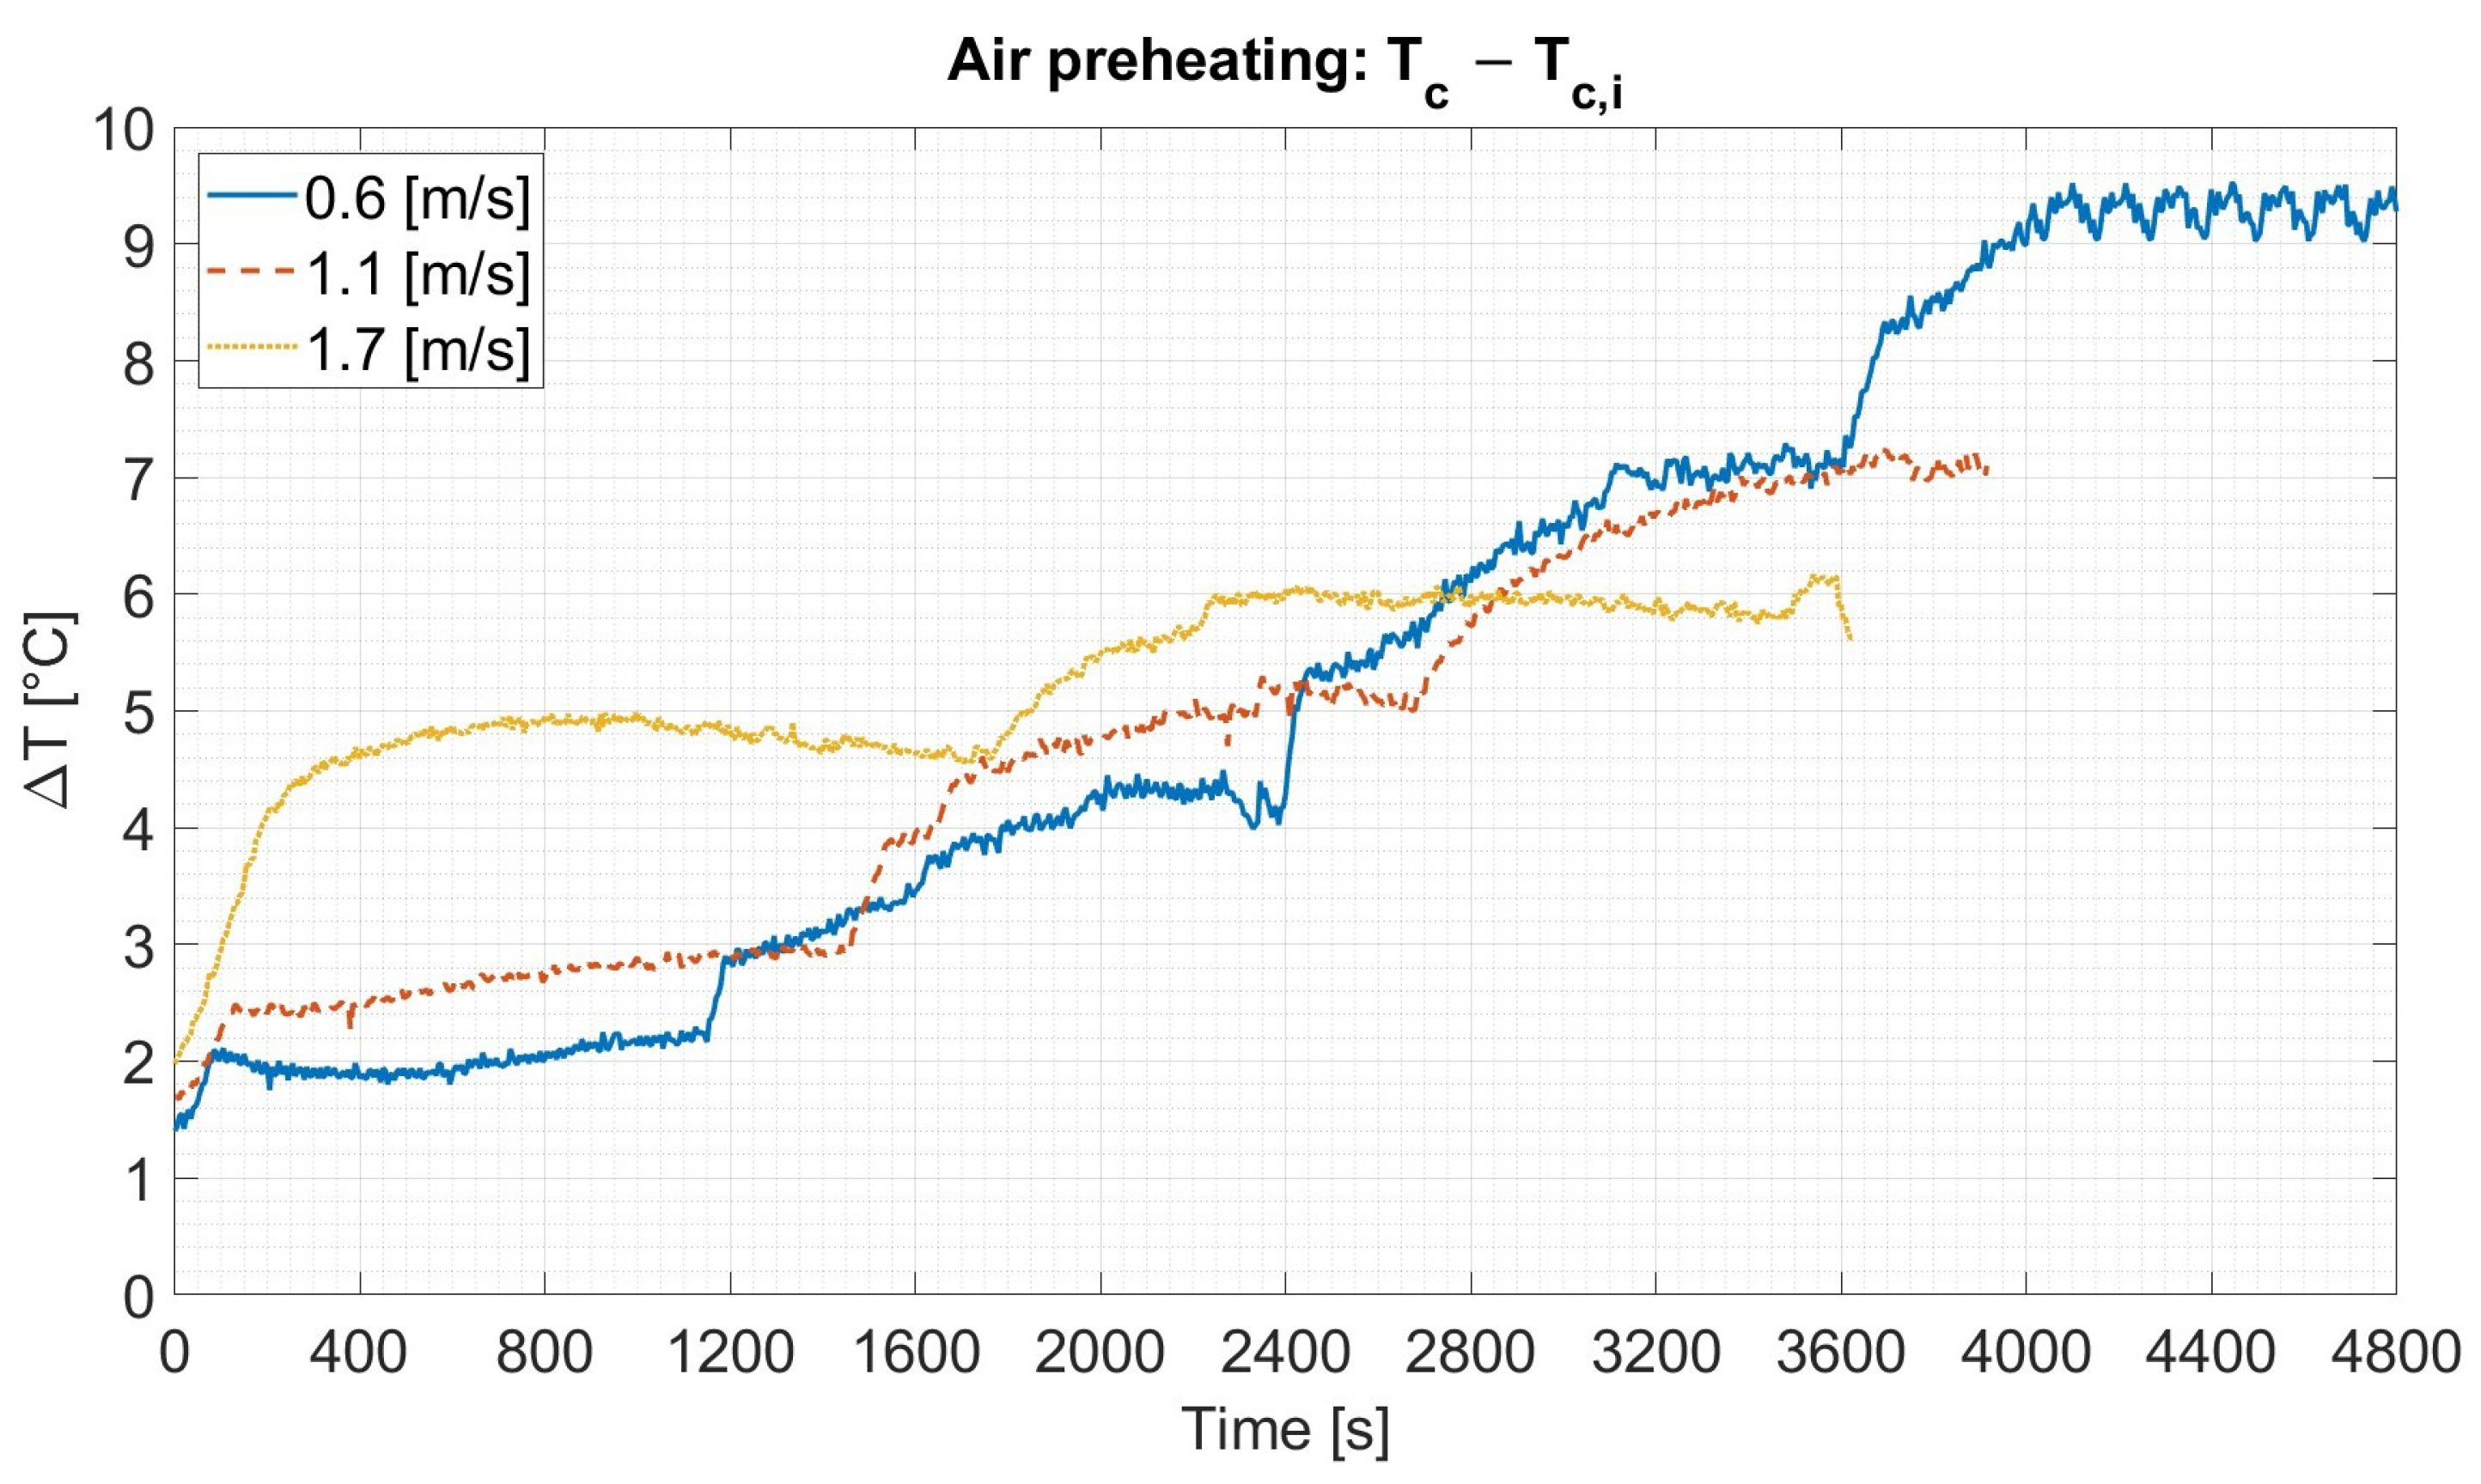
Figure 18 illustrates the system’s secondary functionality: the recovery of thermal energy by preheating the inlet air, quantified as the temperature difference Δ T = T c T c i . The results show a non-linear dependence between airflow velocity and preheating performance.
At lower heating setpoints (e.g., 90 °C), the highest air velocity (1.7 m/s) resulted in the greatest preheating. In this regime, the convective heat transfer coefficient, which is higher due to the more turbulent flow, is the dominant factor. It allows the available heat at the condenser surface to be transferred more effectively to the air. However, as the thermal load on the system increases, the trend inverts.
At the intermediate heating setpoint of 150 °C, the results for 0.6 and 1.1 m/s air velocities diverge notably. While the higher airflow (1.1 m/s) promotes a stronger convective heat transfer coefficient, it also leads to more rapid removal of heat from the condenser, preventing the surface temperature from rising significantly. In contrast, the lower velocity (0.6 m/s) results in a reduced convective coefficient but allows the condenser temperature to rise substantially, thus increasing the thermal gradient driving heat transfer to the air stream.
This trade-off becomes evident in the preheating performance: despite the lower airflow rate, the 0.6 m/s case achieves a greater Δ T , demonstrating that, under sufficiently high heating input, the elevated surface temperature of the condenser can outweigh the effect of a lower convective coefficient. These findings emphasize the dual influence of airflow rate and thermal potential on heat recovery efficiency.
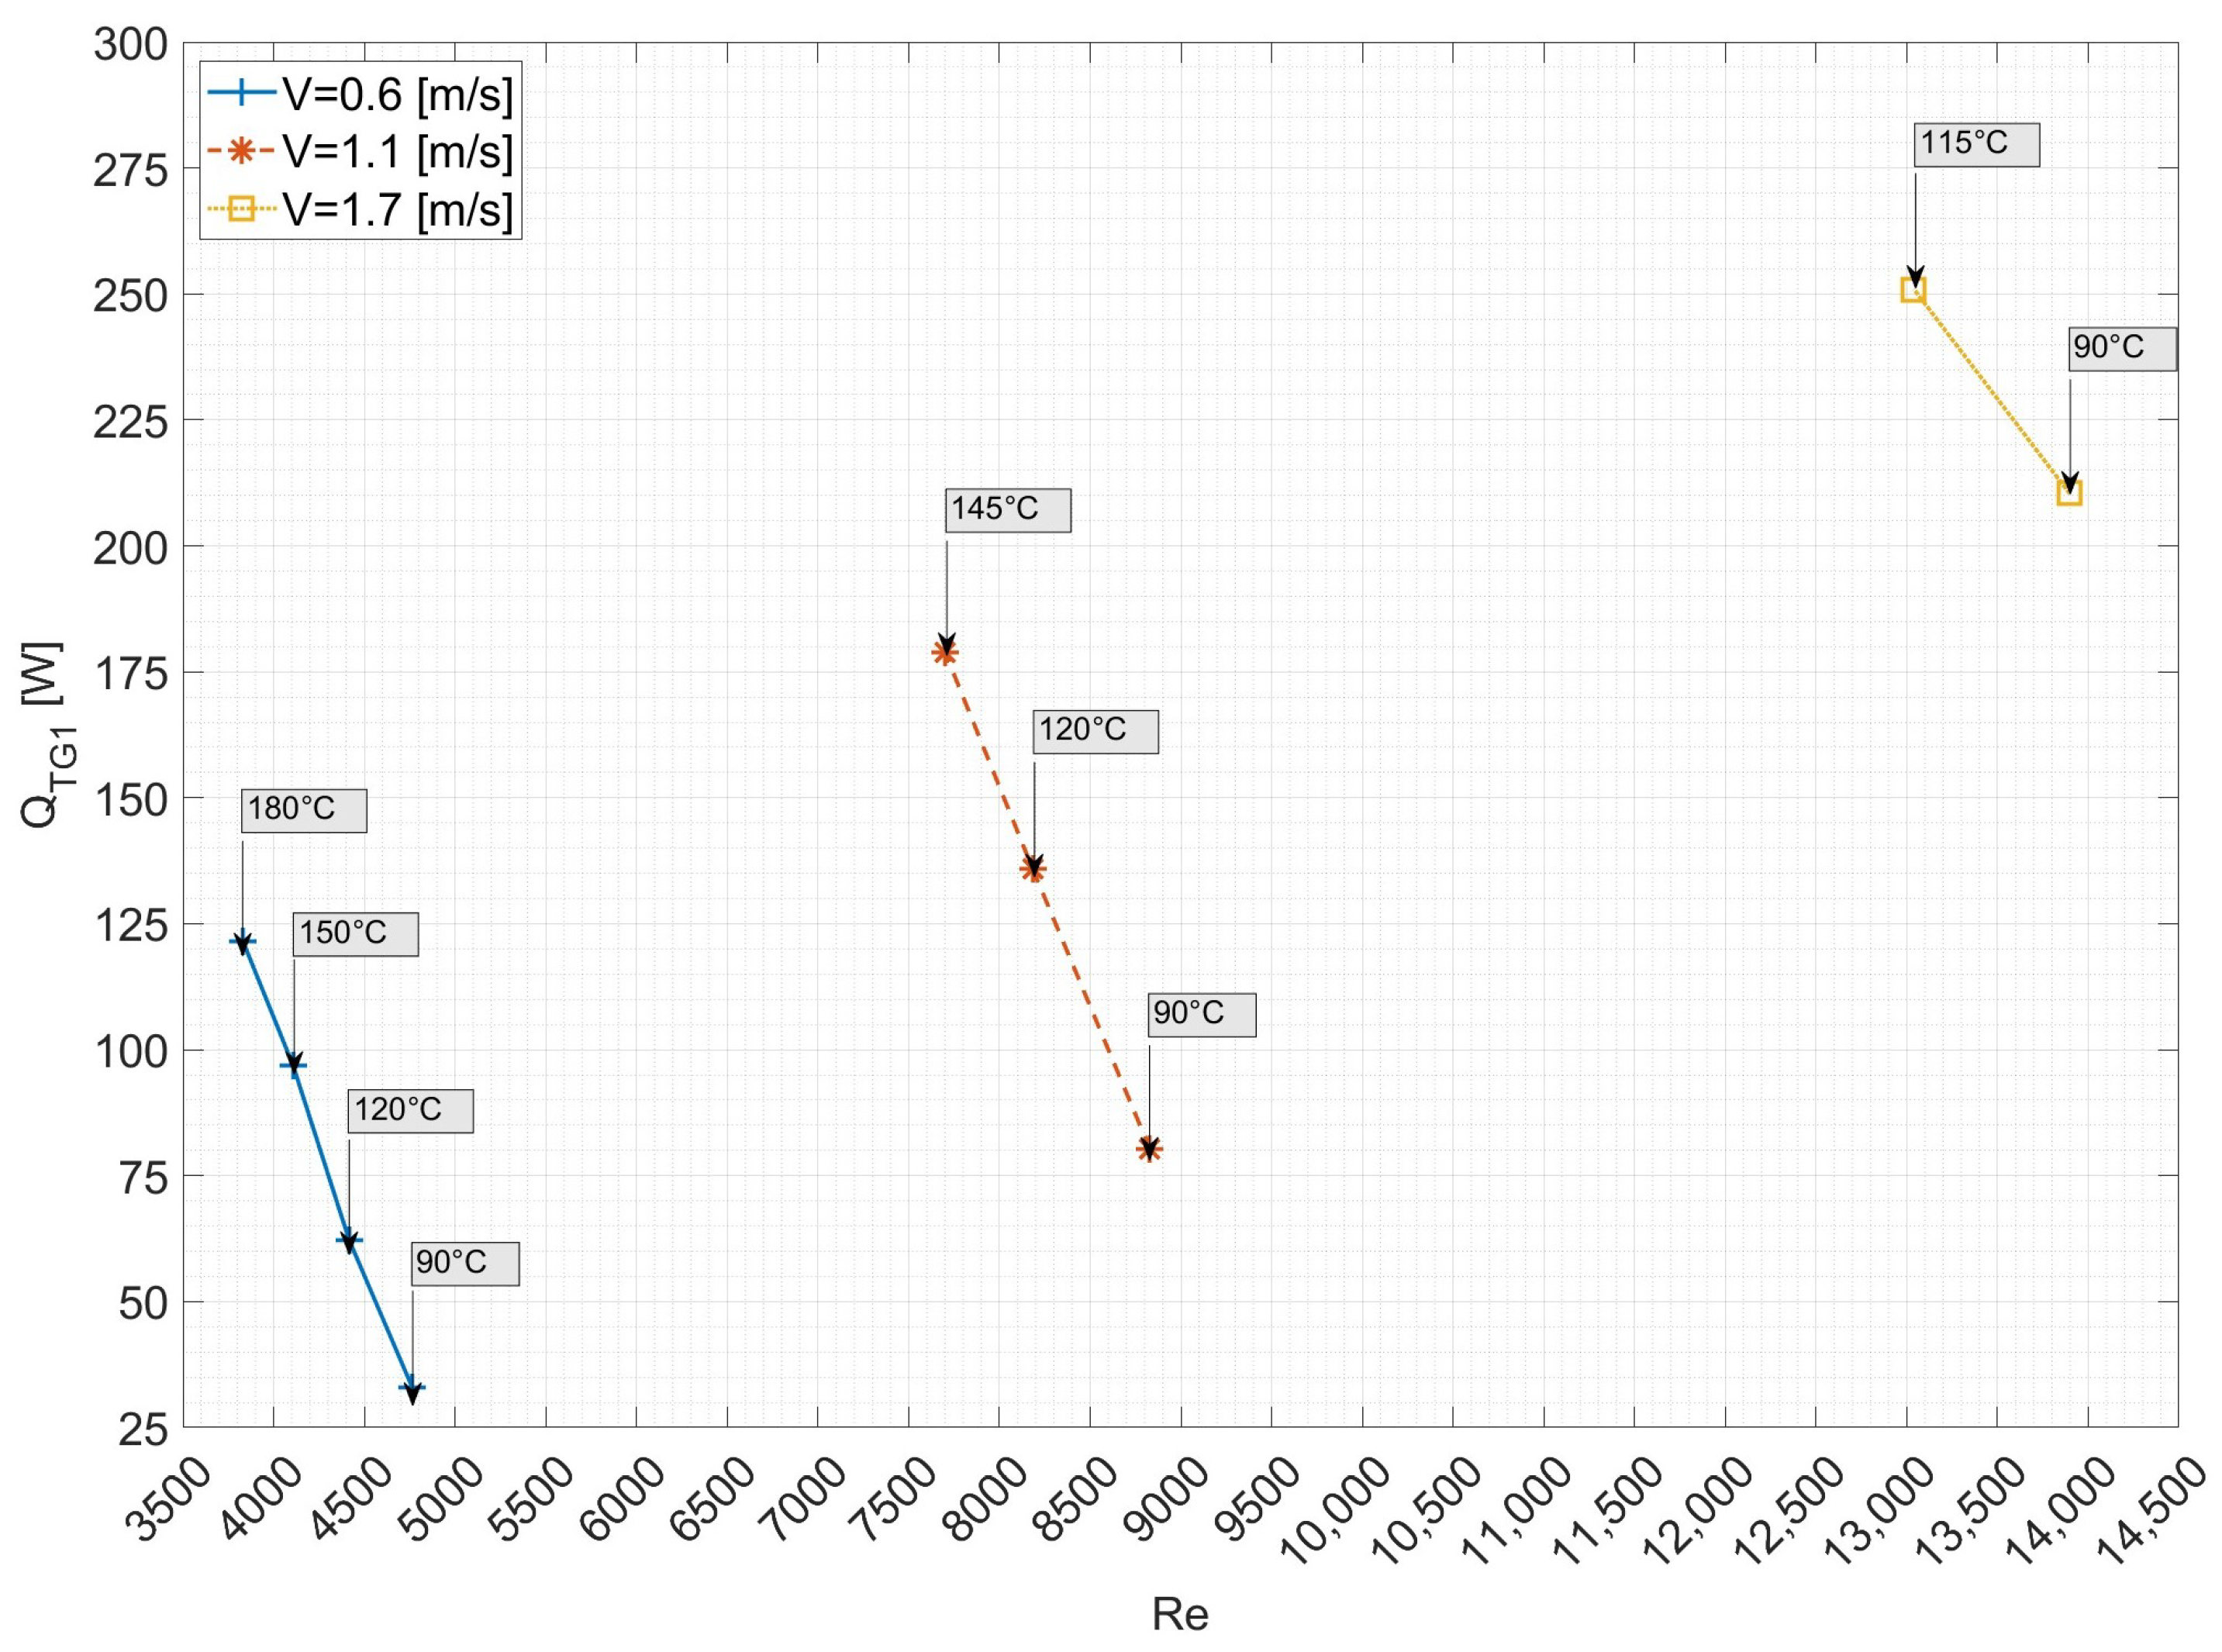
To provide a comprehensive assessment of the thermal energy recovery, Figure 19 presents the total heat transfer rate to the inlet air ( Q TG 1 ) as a function of the Reynolds number for all tested conditions. This analysis clarifies the apparent paradox observed in the preheating results. Although the lowest air velocity (0.6 m/s) yielded the highest preheating temperature difference ( Δ T preheating ), it resulted in the lowest overall heat recovery rate, with a maximum of approximately 125 W . This outcome is explained by the convective heat transfer relationship presented in Equation (10):
Q TG 1 = m ˙ air c p Δ T preheating
where m ˙ air is the air mass flow rate and c p is the specific heat capacity of air. While Δ T preheating was greatest for the 0.6 m/s case, the corresponding low mass flow rate limited the total amount of heat transferred.
Conversely, the case with 1.7 m / s air velocity achieved the highest heat recovery rate—exceeding 250 W . This distinction has practical implications: if the goal is to increase the outlet air temperature, lower velocities are preferable under high thermal load conditions. However, if the objective is to maximize the total thermal energy recovered (in Watts), higher air velocities are unequivocally more effective.
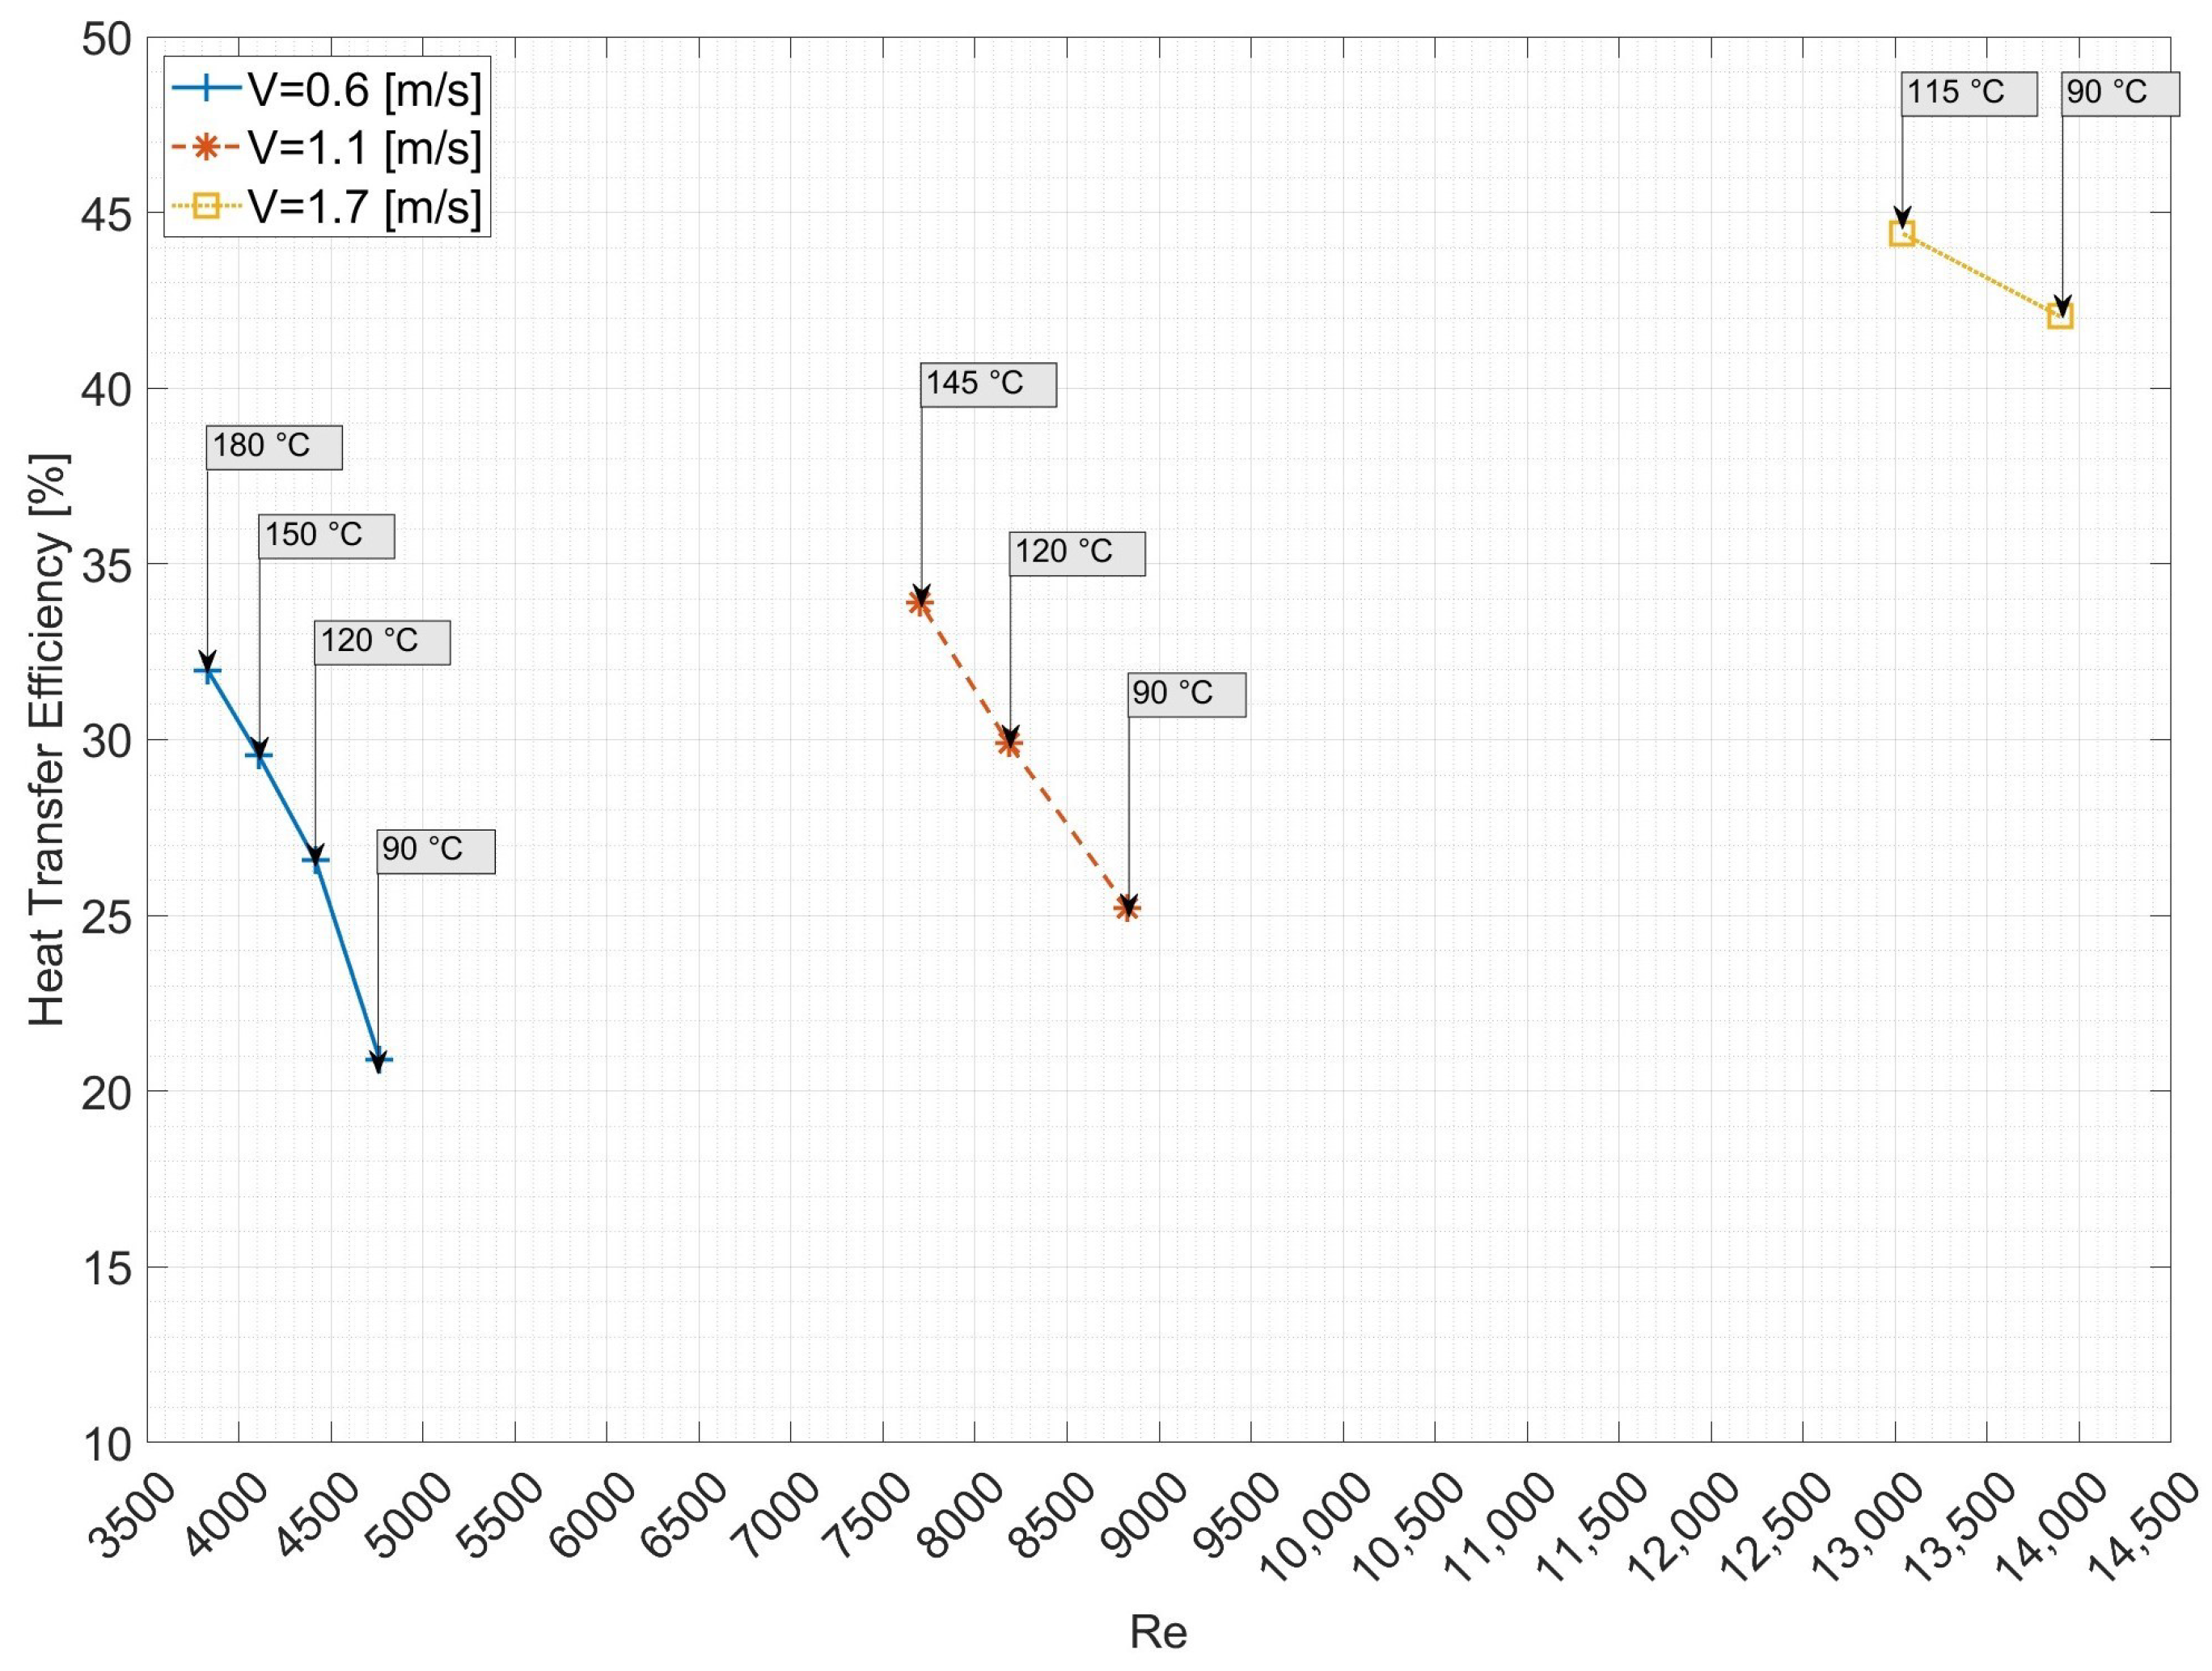
The overall performance of the passive heat transfer from the hot stream to the cold stream is best quantified by the heat transfer effectiveness ( ε ), calculated using Equation (5). Figure 20 presents this effectiveness as a function of the Reynolds number for all test conditions. The results clearly indicate that the effectiveness is strongly dependent on the airflow velocity, with the highest effectiveness of approximately 45% being achieved at the highest velocity of 1.7 m/s. This trend is attributed to the enhanced convective heat transfer coefficients on both the evaporator and condenser surfaces at higher Reynolds numbers. The improved convection on the condenser side is particularly crucial, as it allows the system to dissipate heat more readily, which in turn “pulls” more heat through the thermosyphon and TEG assembly from the hot side, reducing the proportion of energy lost to the surroundings ( Q loss ).
Furthermore, for any given air velocity, the effectiveness was observed to increase with the operating temperature. For instance, at 0.6 m/s, the effectiveness grew from approximately 21% at 90 °C to 32% at 180 °C. This suggests that at higher thermal loads, the internal two-phase circulation within the thermosyphons becomes more vigorous and efficient, improving the transport of heat relative to the losses. In summary, the analysis demonstrates that operating the system at higher velocities and temperatures is optimal for maximizing both the absolute rate of heat recovery ( Q TG 1 ) and the effectiveness ( ε ) of the energy transfer.
Table 5 provides a comprehensive summary of the key thermal performance metrics for all nine experimental conditions, allowing for a detailed quantitative analysis of the system’s behavior. The data reveal two primary trends related to the influence of thermal load and airflow velocity.
First, the results show a direct correlation between the inlet hot air temperature and the overall heat recovery performance. For a constant air velocity of 0.6 m/s, increasing the hot air temperature ( T h ) from 90 to 180 °C resulted in a nearly four-fold increase in the recovered thermal power for preheating ( Q TG 1 ), from 32.9 to 121.5 W. More significantly, the heat transfer effectiveness ( ε ) also improved substantially under these conditions, rising from 20.9 to 32.0%. This indicates that the passive system operates more efficiently at higher thermal potentials, as the increased temperature gradients overcome the system’s internal thermal resistances more effectively.
Second, the table quantifies the critical trade-off governed by the air velocity. As previously discussed, the lowest velocity (0.6 m/s) produced the highest preheating temperature increase ( Δ T = T c T c i = 9.5 °C at 180 °C). However, the table clearly shows that the highest absolute heat recovery rate ( Q TG 1 ) was achieved at the highest velocity (1.7 m/s), reaching 250.9 W. This value is more than double the maximum rate achieved at 0.6 m/s. This is because the substantially higher mass flow rate at 1.7 m/s (0.040 kg/s compared to 0.013 kg/s) more than compensates for the smaller temperature rise. Ultimately, the system’s highest operational effectiveness was also achieved under the highest velocity, reaching a peak of 44.4%. This confirms that turbulent flow conditions not only maximize the rate of heat recovery but also improve the efficiency of the passive energy transfer from the hot side to the cold side of the unit.

3.2. Electrical Performance

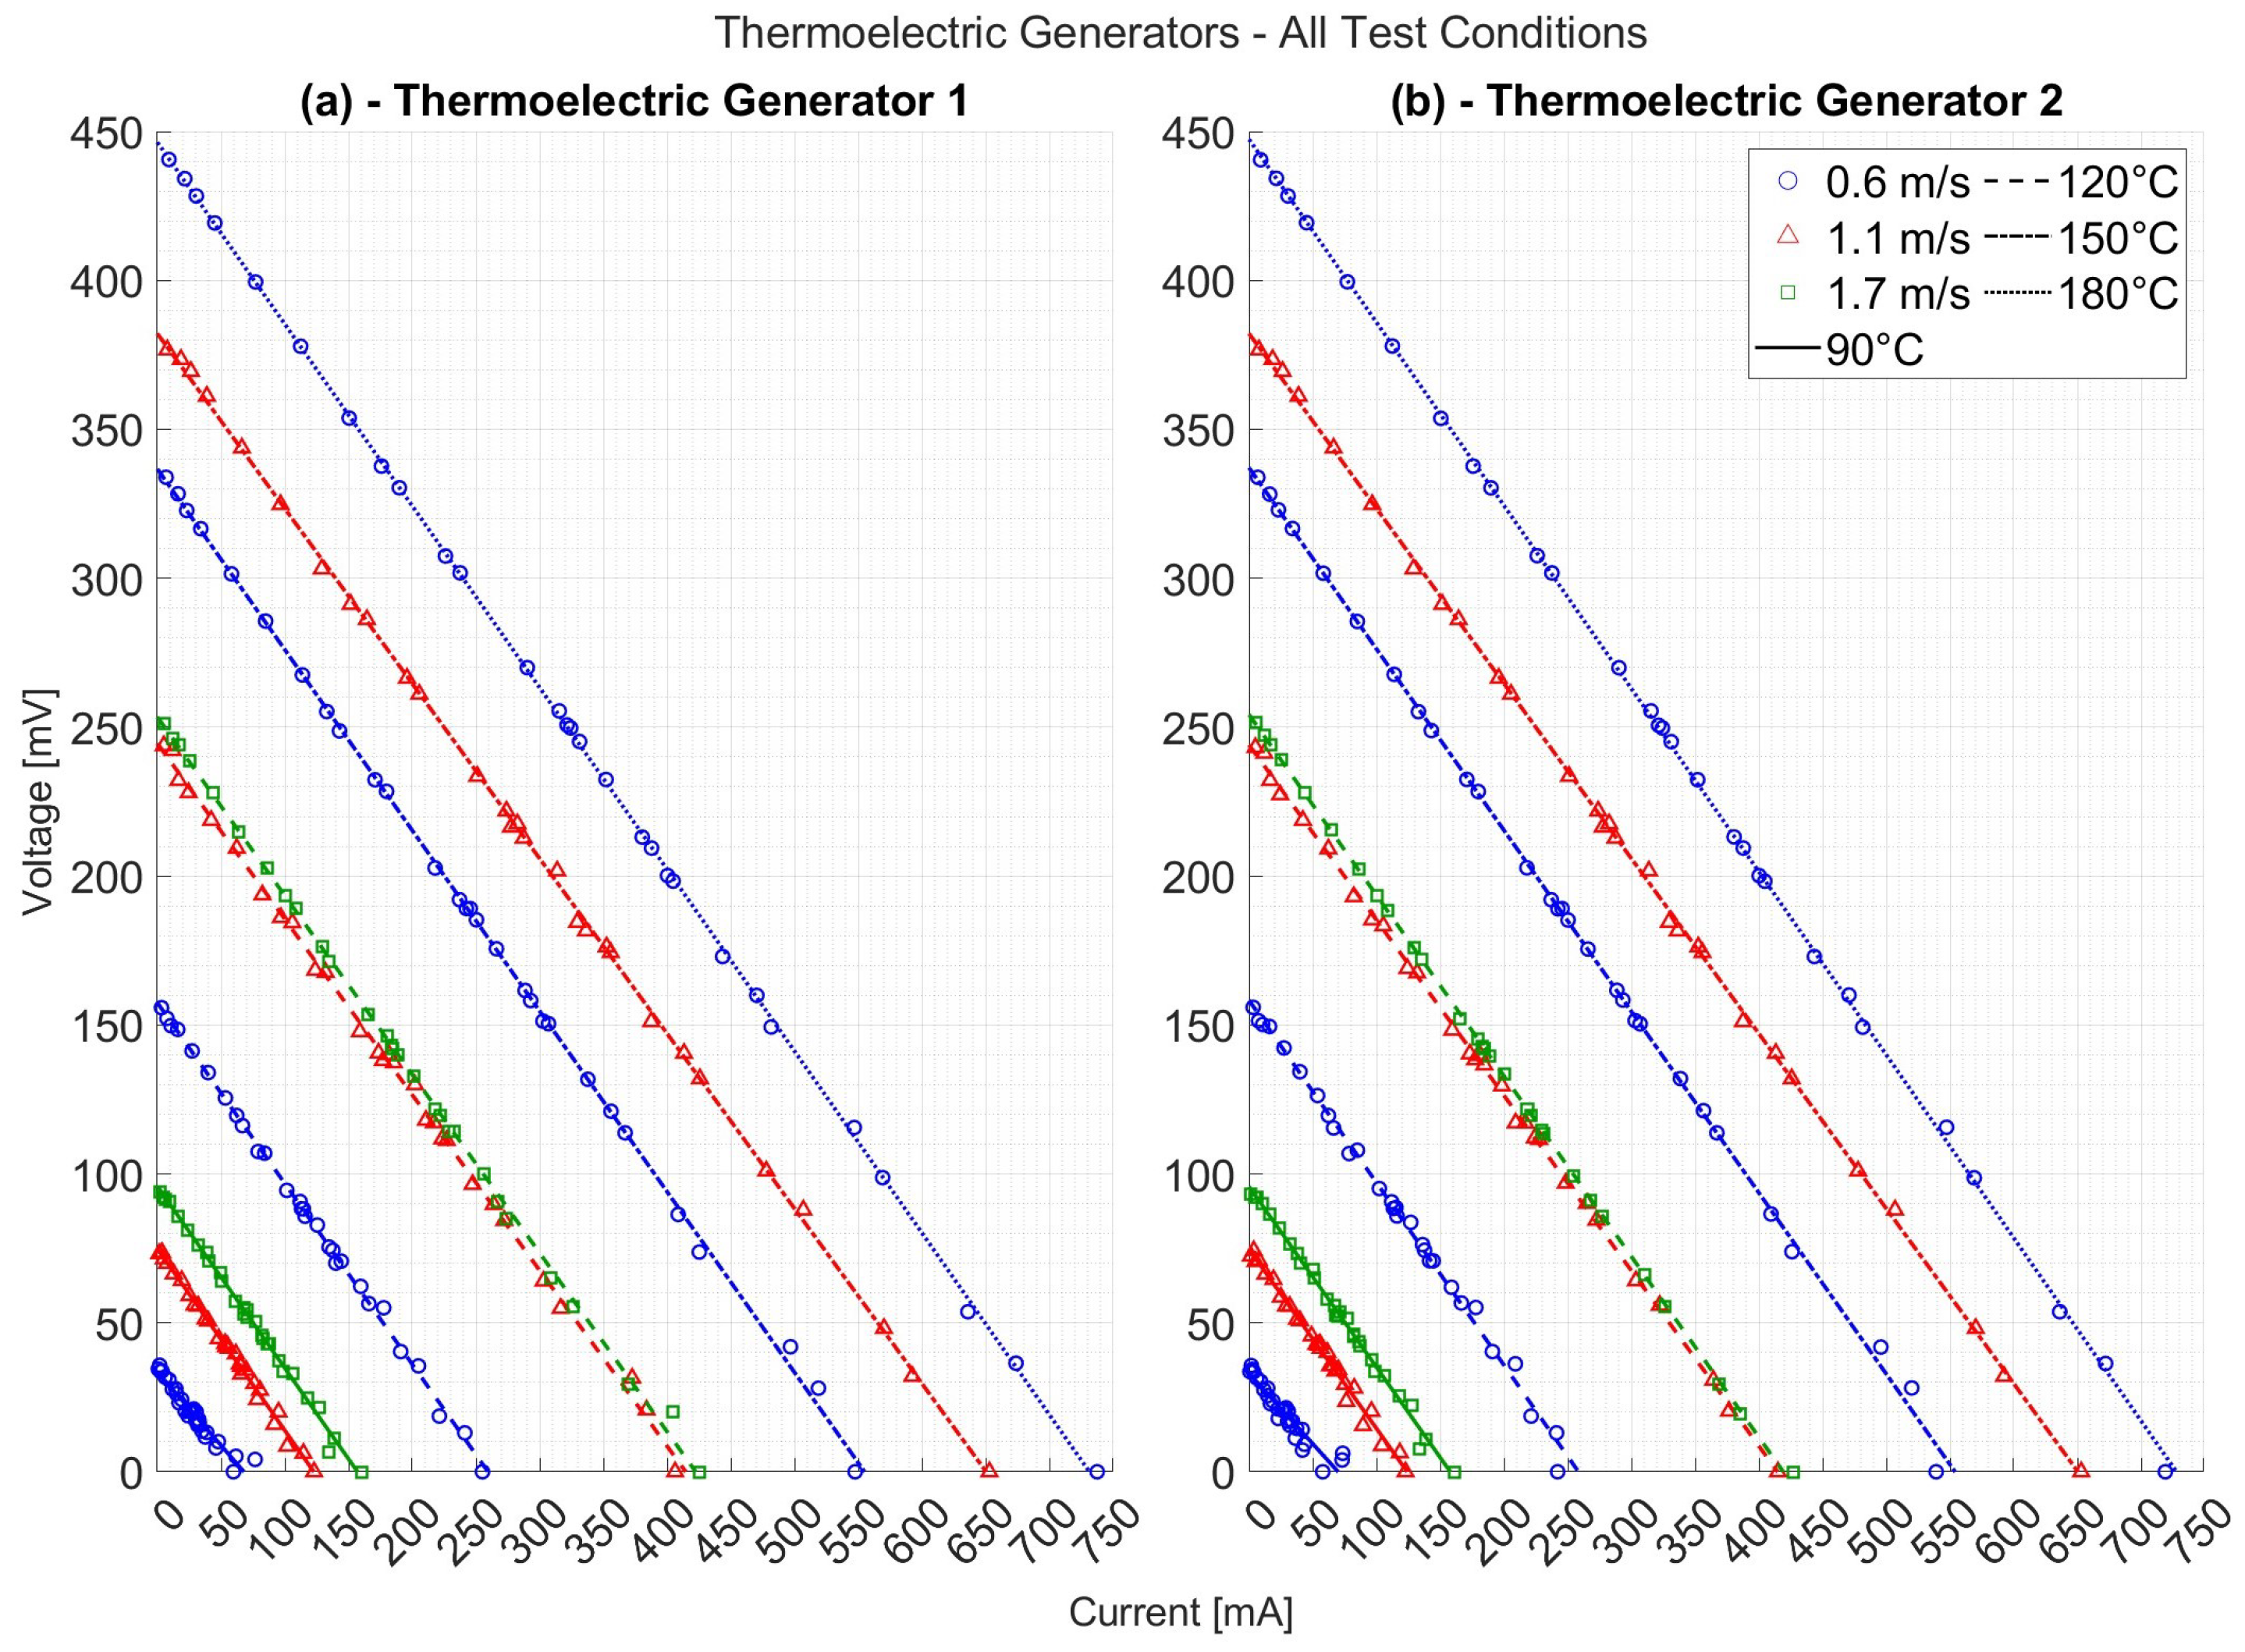
Figure 21 presents the experimental voltage–current (V-I) characteristic curves for the two thermoelectric generators, TEG 1 (left panel) and TEG 2 (right panel), under all tested operating conditions. As is characteristic of thermoelectric modules, the relationship between voltage and current is shown to be distinctly linear for each thermal condition. The data clearly illustrates that both the open-circuit voltage (Voc), represented by the y-intercept, and the short-circuit current (Isc), represented by the x-intercept, increase consistently as the thermal gradient across the modules becomes larger. A direct comparison between the two generators indicates a minor performance variance. For any given operating condition, TEG 1 consistently exhibits a slightly higher open-circuit voltage and short-circuit current than TEG 2. This suggests a marginally more effective heat transfer to TEG 1, possibly due to small variations in thermal contact resistances or slight non-uniformities in the airflow distribution across the heat exchanger.
To accurately assess the influence of airflow, a direct comparison must be made at identical heating setpoints. At both the 90 and 120 °C setpoints, where data for all three velocities are available, a clear trend is observed: the highest air velocity (1.7 m/s) consistently produced a superior V-I curve, followed by 1.1 m/s, with the 0.6 m/s case yielding the lowest voltage and current. This trend holds true when comparing the 0.6 and 1.1 m/s cases at 150 °C. This demonstrates that for a given thermal input, higher airflow velocity enhances the convective cooling on the condenser side, creating a larger temperature difference ( Δ T) across the modules and thus a better thermoelectric performance. The overall best V-I characteristic was achieved in the test at 0.6 m/s, but this is a direct consequence of the higher achievable temperature in that specific run. As the experimental conditions show, it was the only velocity that allowed the system to reach the 180 °C setpoint; therefore, its top performance is attributed solely to the higher source temperature, not the effect of the lower velocity itself.
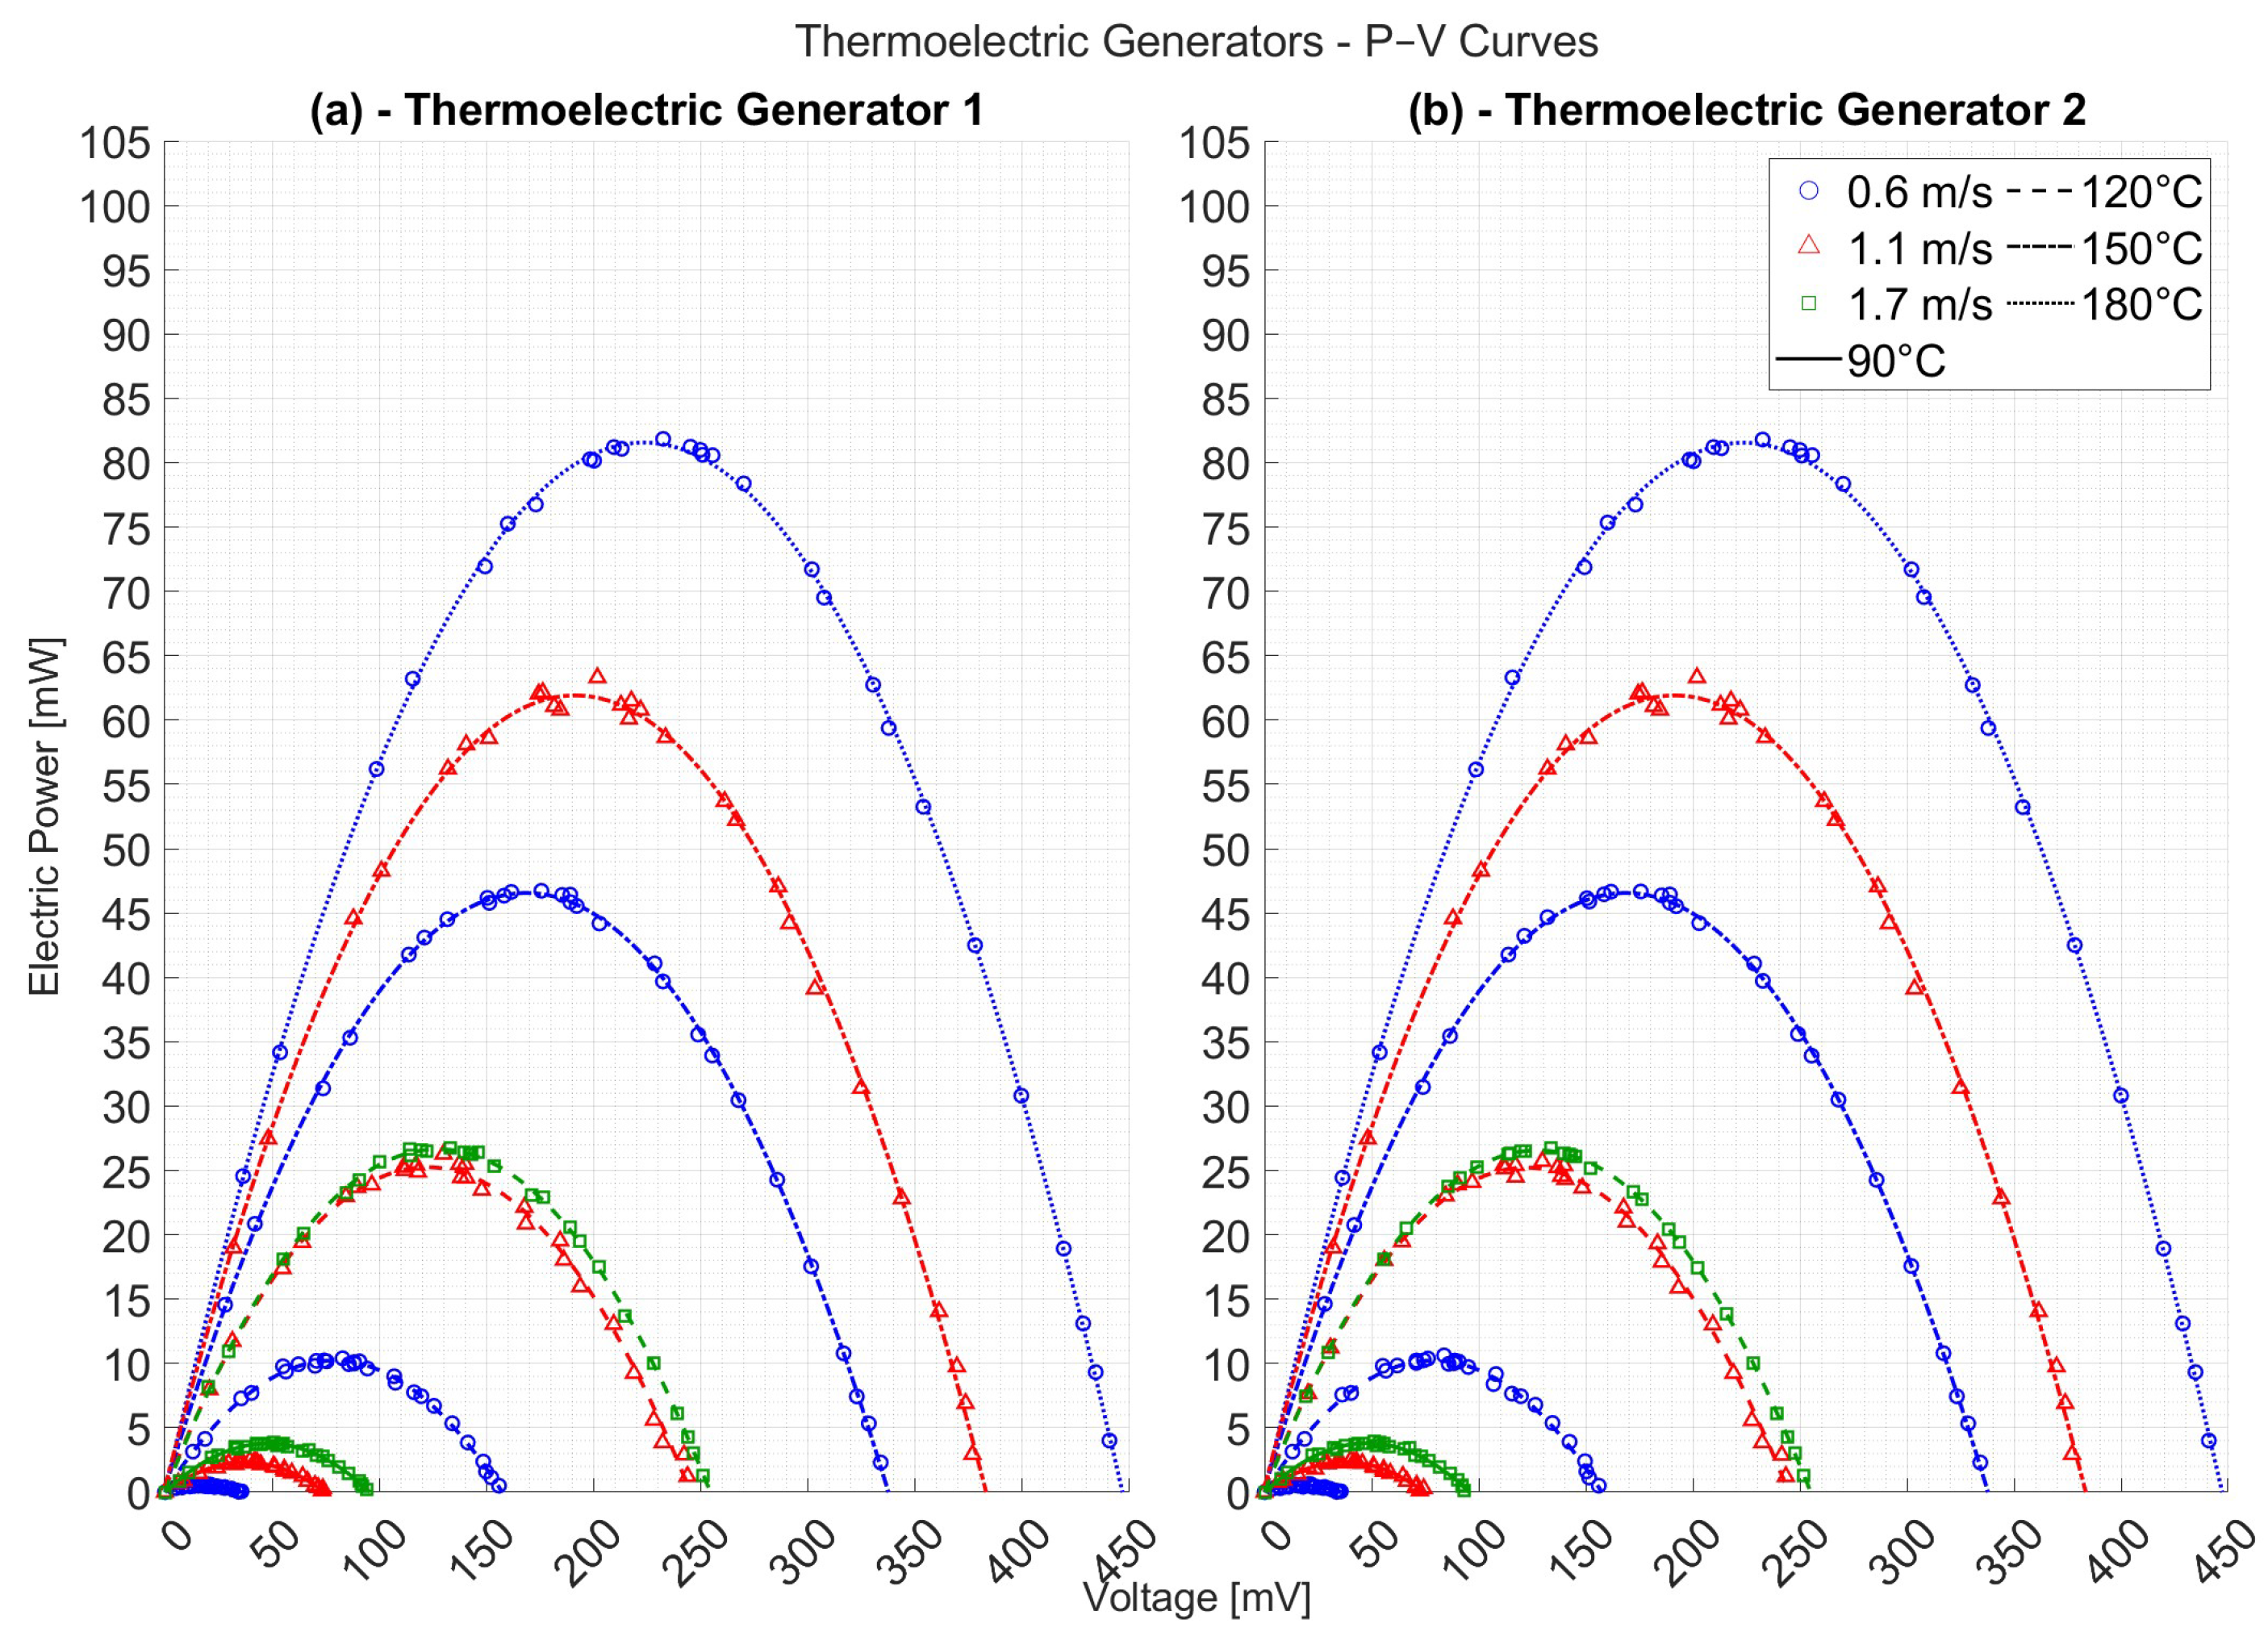
Complementing the V-I analysis, the P-V curves shown in Figure 22 directly illustrate the power output of the generators. The curves exhibit the expected parabolic shape, where the vertex of each parabola represents the Maximum Power Point (MPP) for that specific operating condition. This MPP occurs when the external load resistance matches the generator’s internal resistance (∼0.66 Ω). It is noteworthy that the data acquisition system, described in [42], successfully swept the full range of resistive loads necessary to construct these complete characteristic curves. Corroborating the V-I data, the highest performance was achieved by TEG 1 under the 0.6 m/s and 180 °C condition, delivering a maximum power of approximately 81 mW.
Both sets of curves confirm the critical operational trade-offs related to air velocity. At constant heating setpoints (e.g., 90 and 120 °C), the highest air velocity (1.7 m/s) consistently yielded superior V-I and P-V characteristics, resulting in higher peak power than the lower velocities. This is attributed to the enhanced thermal gradient created by more effective cooling. However, the absolute maximum power of the entire experiment was achieved at 0.6 m/s. This top performance is attributed solely to the higher source temperature (180 °C) that was only attainable under this low-flow condition, and not to the effect of the velocity itself.
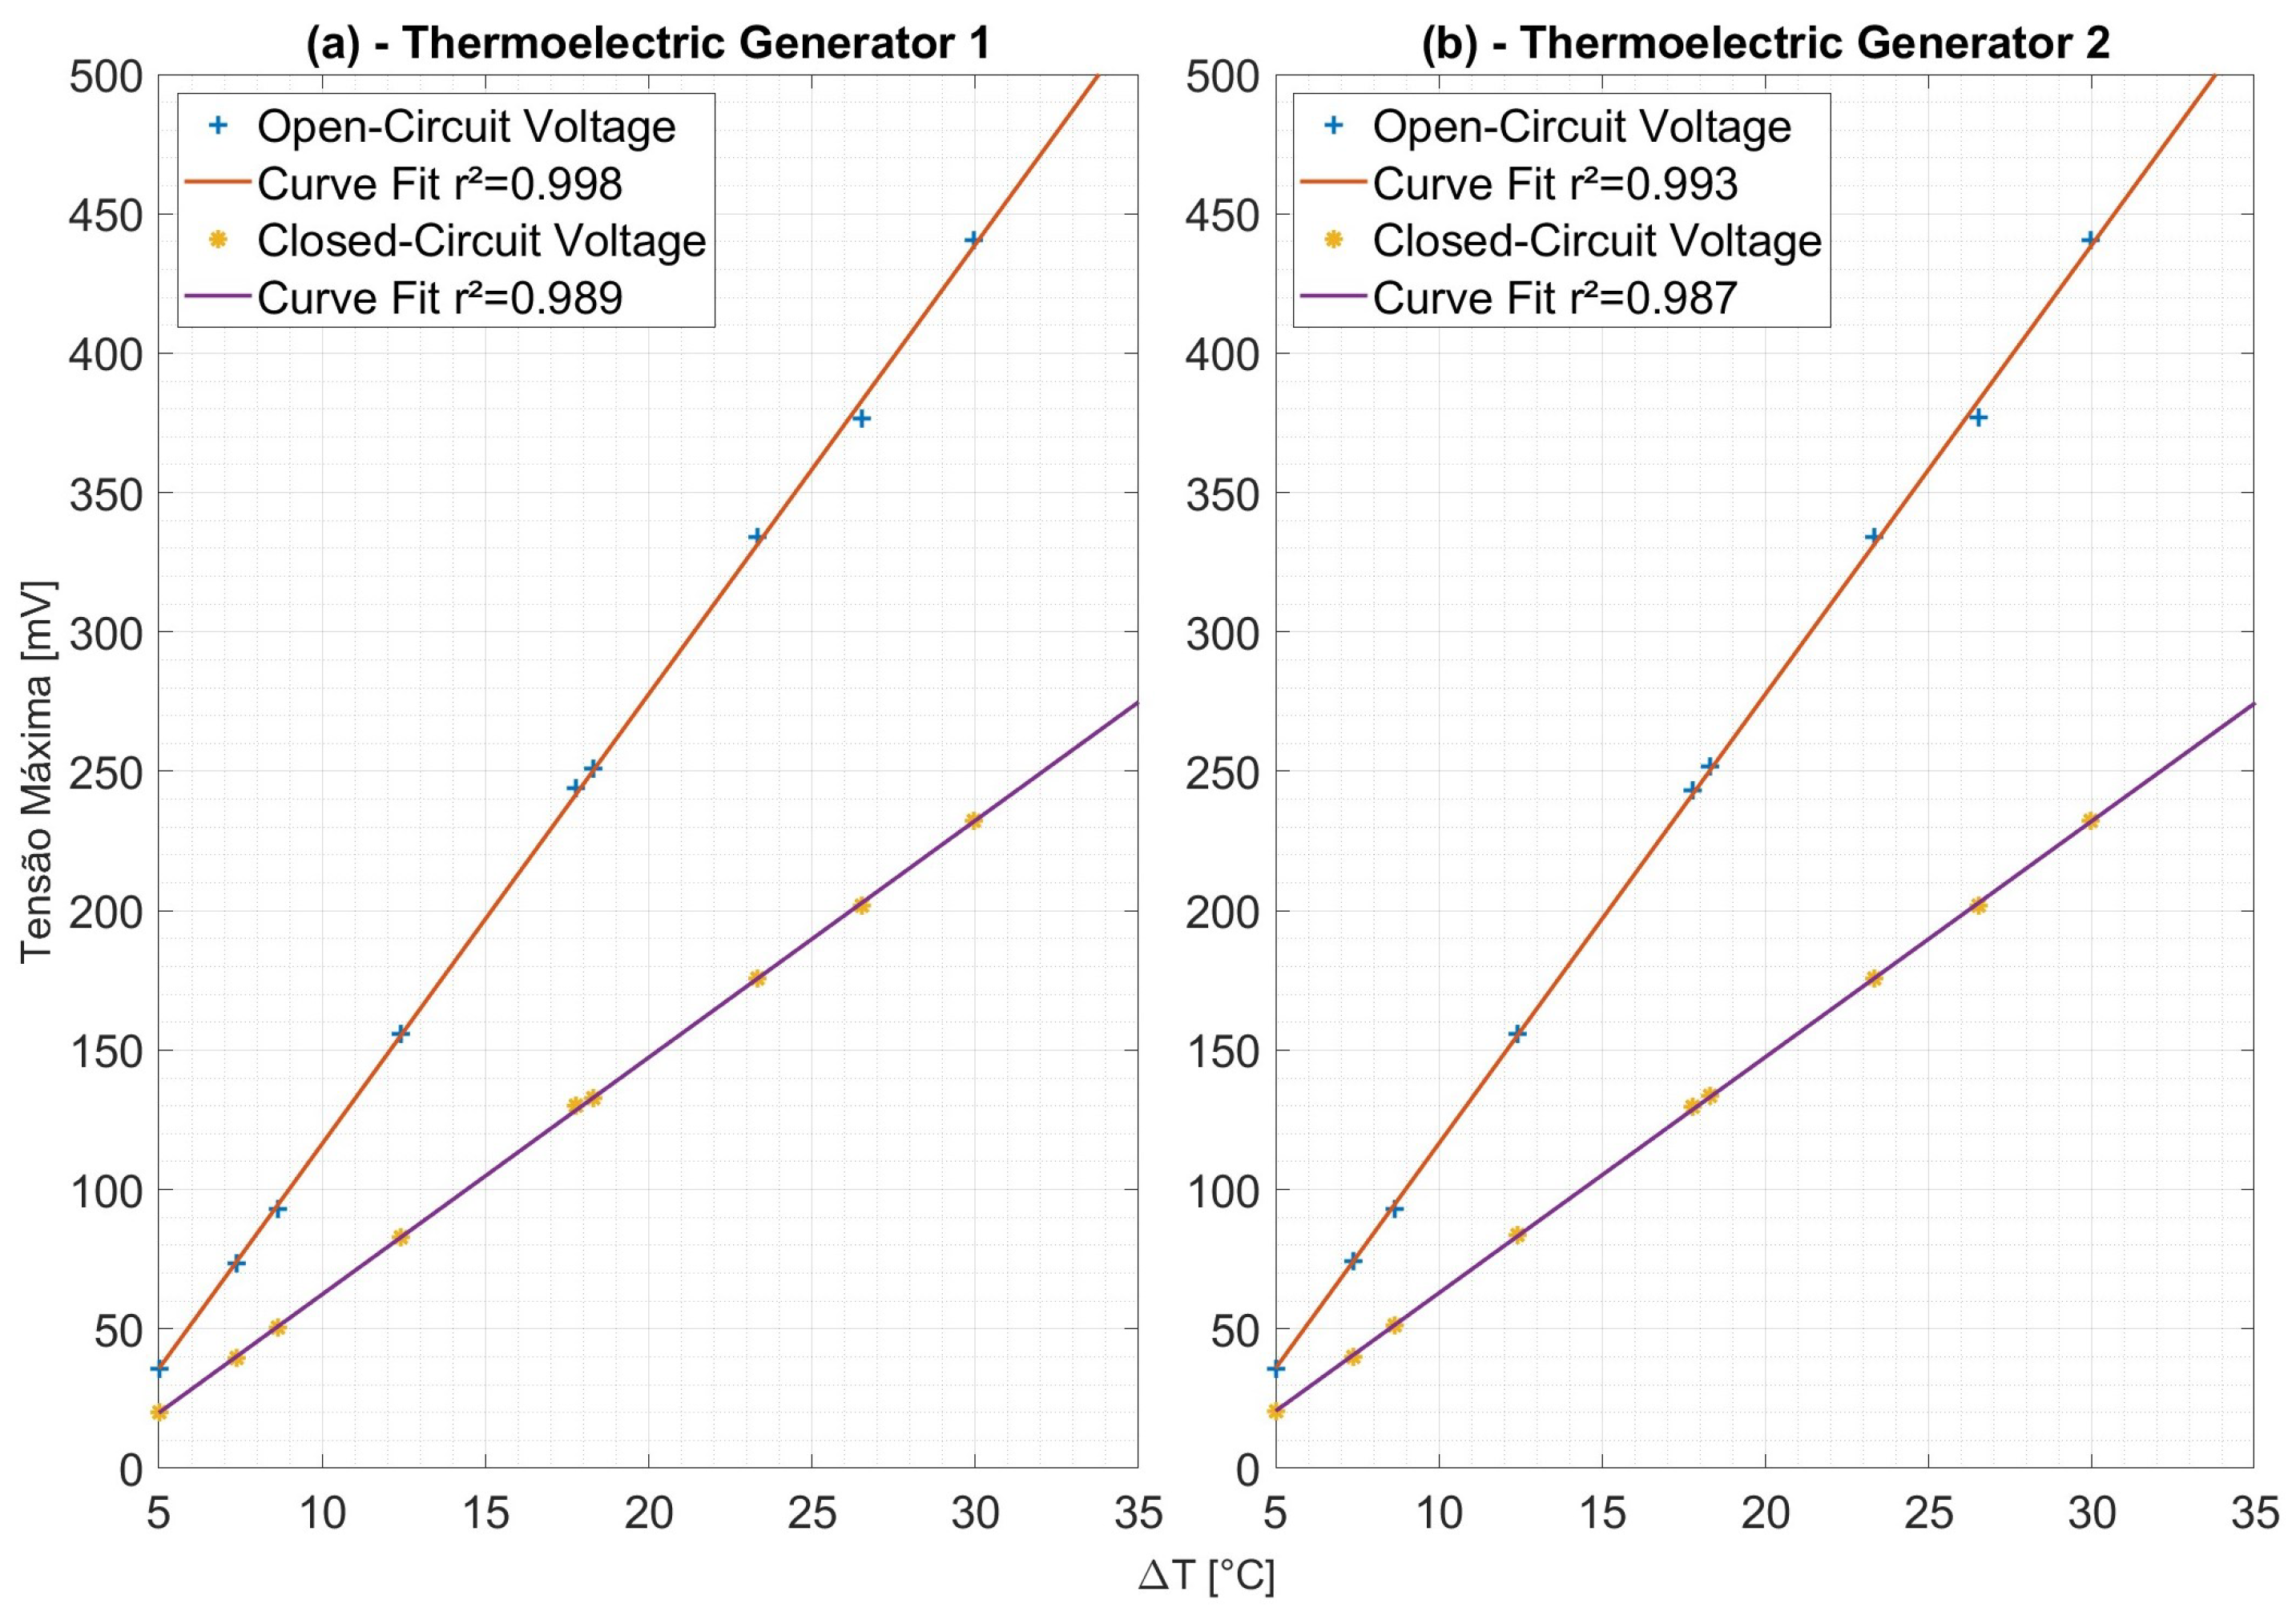
Figure 23 illustrates the distinction between the open-circuit voltage (OCV) and the closed-circuit voltage (CCV) for both generators throughout the experimental runs. The OCV represents the maximum theoretical potential difference generated by the module under a given thermal gradient, measured under no-load conditions where no current is drawn. In contrast, the CCV represents the actual voltage across the module’s terminals when connected to an external load—in this case, the specific load that corresponds to its Maximum Power Point (MPP).
As expected, both OCV and CCV increase directly with the system’s thermal load, mirroring the step-wise increases in the hot air temperature. For any given operating condition, the OCV is consistently higher than the CCV. This difference between the two voltages represents the internal voltage drop across the generator’s inherent internal resistance. The data align with the maximum power transfer theorem, which states that maximum power is delivered when the load resistance matches the internal resistance, at which point the closed-circuit voltage is approximately half of the open-circuit voltage [47]. This relationship is clearly observable in the figure across all conditions. Comparing the two panels, TEG 1 consistently exhibits slightly higher OCV and CCV values than TEG 2, which reinforces the previous findings of its marginally superior performance within the experimental setup.
Equations (11) and (12) correspond to Thermoelectric Generators 1 and 2 (TG1 and TG2), respectively, and provide curve-fitted expressions for the open-circuit voltage as a function of the temperature difference between the hot and cold surfaces of the thermoelectric modules, as shown in Figure 17. The linear regressions for the experimental data are given by the following:
U open , 1 = 16.128 Δ T 44.90
U open , 2 = 16.126 Δ T 44.73
where U open is the open-circuit voltage [mV], and Δ T is the temperature difference between the module’s hot and cold surfaces [°C]. These fits yielded high coefficients of determination, with R 2 = 0.9984 for TG1 and R 2 = 0.9989 for TG2, confirming the strong linear correlation.
Given the minimal difference between the two models, an average model (13) was derived to simplify the analysis and represent the system’s overall behavior:
U open , avg = 16.13 Δ T 44.82
This average model can be extended to estimate the closed-circuit voltage ( U TG ) by incorporating the effect of the internal resistance. Based on the V–I characteristic curves, an internal resistance of approximately ∼0.66 Ω was determined. This allows the derivation of a practical expression for the closed-circuit voltage as a function of both temperature difference and current (i):
U TG = 16.13 Δ T 0.66 i 44.82
Equation (14) provides an approximate relationship between the output voltage and electrical current for the thermoelectric generators tested, valid for the experimental temperature difference range from 5 to 30 °C.
Figure 24 plots the maximum power output ( P m a x ) achieved by each generator as a function of the measured temperature difference ( Δ T ) across its faces. A strong quadratic relationship is evident, which is consistent with thermoelectric theory, where the maximum power is proportional to the square of the temperature difference. The excellent correlation of the experimental data are confirmed by the high coefficient of determination for both curve fits ( R 2 > 0.999 ).
The plot reinforces that TEG 1 consistently outperformed TEG 2 across the entire operational range. At the maximum sustained temperature difference of 30.0 °C, TEG 1 produced approximately 81 mW. Furthermore, the curve fits provide robust empirical models for predicting the power output ( P m a x in mW) of each generator based on the temperature difference ( Δ T in °C), as given by Equations (15) and (16) for TEG 1 and TEG 2, respectively:
P max , 1 = 0.1085 Δ T 2 0.5280 Δ T + 0.4672
P max , 2 = 0.1075 Δ T 2 0.5472 Δ T + 0.4908
Similar to the open-circuit voltage analysis, an average model for the maximum power output was derived from these two expressions to provide a single, generalized equation for the system’s performance. This average model is given by Equation (17):
P max , avg = 0.1080 Δ T 2 0.5376 Δ T + 0.4790
These models serve as a practical tool for estimating the system’s electrical performance within the tested operational range and highlight the high degree of consistency in the experimental results.
Finally, Table 6 quantitatively summarizes the peak electrical performance of the system and provides a practical comparison against a reference photovoltaic (PV) solar panel. Under the optimal condition of 0.6 m/s airflow and a 180 °C heat source, the dual-generator system achieved a combined maximum power output of 163.69 mW, corresponding to a total power density of 52.20 W/m2.

3.3. Overall System Performance

The overall performance of the dual-purpose waste heat recovery system is summarized in Table 7, which consolidates the key electrical and thermal outputs into first-law efficiency metrics. The electrical efficiency ( η e l ) represents the conversion of input heat to electricity, the thermal efficiency ( η t h ) quantifies the recovery for air preheating, and the overall efficiency ( η o v e r a l l ) represents the combined useful energy output. Due to the comparatively small magnitude of the generated power ( P T E G ) in milliwatts versus the recovered thermal power ( Q T G 1 ) in watts, the overall efficiency is predominantly driven by the thermal recovery performance.
The data reveals that the system’s peak overall efficiency was achieved at the highest airflow rate. The optimal operating point occurred at an air velocity of 1.7 m/s and a hot side temperature of 90 °C, yielding a maximum overall efficiency ( η ) of 9.38%. This condition also corresponded to the highest electrical efficiency ( η e l ) of 0.00564%. This demonstrates that high convective cooling is crucial for maximizing the system’s effectiveness at converting the available heat input into useful outputs, as it likely minimizes proportional heat losses to the surroundings.
However, a critical trade-off is observed when considering absolute power generation. The maximum electrical power ( P T E G ) of 163.69 mW was generated at the highest velocity (1.7 m/s) but at the higher temperature of 115 °C. Interestingly, this increase in power came at the cost of reduced system efficiency, with η o v e r a l l dropping from 9.38% to 8.00%. This indicates that at higher thermal loads, the required heat input ( Q i n ) increases more rapidly than the useful energy outputs, leading to a less efficient, albeit more powerful, operation. In conclusion, these results highlight the dual-function capability of the system and underscore the importance of a holistic analysis for practical applications: the optimal conditions for maximum power generation do not necessarily coincide with those for maximum overall energy efficiency.
In summary, the experimental results have comprehensively characterized the performance of the dual-purpose thermosyphon-assisted thermoelectric generator system. The system successfully demonstrated simultaneous electrical power generation, with a maximum combined output of 159 mW, and thermal energy recovery, preheating the inlet air by up to 9.5 °C. The key contribution of this investigation is the detailed elucidation of the operational trade-offs governed by airflow velocity. It was unequivocally shown that high airflow rates (1.7 m/s) are optimal for maximizing the thermal recovery rate and effectiveness, while low airflow rates (0.6 m/s) are necessary to achieve the highest system temperatures, which in turn maximize the thermoelectric temperature difference (30.0 °C) and the resulting electrical power output.
It is important to note that the power output of the system could be further enhanced by increasing the number of thermoelectric modules. As demonstrated by [27], increasing the number of TEGs in a heat pipe-assisted system can significantly increase the total power output when the evaporator temperature is maintained (from arround 4.8 W for one thermoelectric module to 10.85 W for four thermoelectric modules). Using a higher number of heat recovery units was also reported in [28]. The heat recovery unit closest to the waste heat source produced a maximum output power of 1.3 W. Using seven more units resulted in an increase of arround 5 W in the electrical power output of the system.
Besides increasing the number of thermoelectric modules, the performance of the heat recovery unit could be enhanced by incorporating TEGs with superior intrinsic properties, as highlighted by [9]. The development of robust thermoelectric interface materials (TEiMs) that maintain low electrical contact resistance, especially under the thermal cycling inherent in waste heat recovery applications could result in substantial performance gains for elctrical power conversion in these kind of systems.
Beyond its performance, the proposed system’s design offers significant practical advantages. The heat recovery unit itself operates as a fully passive system that contains no moving parts, a key feature of both thermosyphons and thermoelectric generators. This intrinsic characteristic not only ensures silent operation but also translates to high reliability and virtually maintenance-free performance over its operational lifetime. These features, combined with its dual-function capability, make the design particularly attractive for long-term, unattended waste heat recovery applications.
The economic justification for such a system would hinge on a detailed life-cycle cost analysis. A primary advantage of the proposed configuration is its entirely passive nature, containing no moving parts, which translates to high reliability and virtually maintenance-free operation over its lifetime. This potential for reduced long-term operational expenditure is a key factor that must be weighed against the higher initial capital cost of the thermoelectric modules. The viability would ultimately depend on the specific application, including the value of the recovered heat, the cost of electricity, and the operational demands of the facility. A full economic assessment to determine the payback period was beyond the scope of this experimental investigation but is identified as a critical next step for future research.

3.4. Practical Integration Scenarios

The proposed heat recovery unit design was tested mainly for low-temperature conditions, which is particularly relevant since literature shows that waste heat valorisation achieves its highest potential when integrated into low-temperature district heating systems [48]. A study in Latvia showed that the theoretical high-temperature waste heat potential could cover around 24% of the existing DH supply of the region with 1834 GWh per year, while low-temperature waste heat reached 3408 GWh per year [48].
In literature, practical applications include the use in a bakery [49,50], in which the heat recovered and power generated resulted in an anual fuel and electrical savings of AUD 37,142 and AUD 1831, respectively, with a payback time of 0.84 years. The waste heat from data centers [51], supermarkets and power transformers was also investigated, with prices starting at 12 EUR/MWh for the supermarket and 100 EUR/MWh for the power transformer [52].
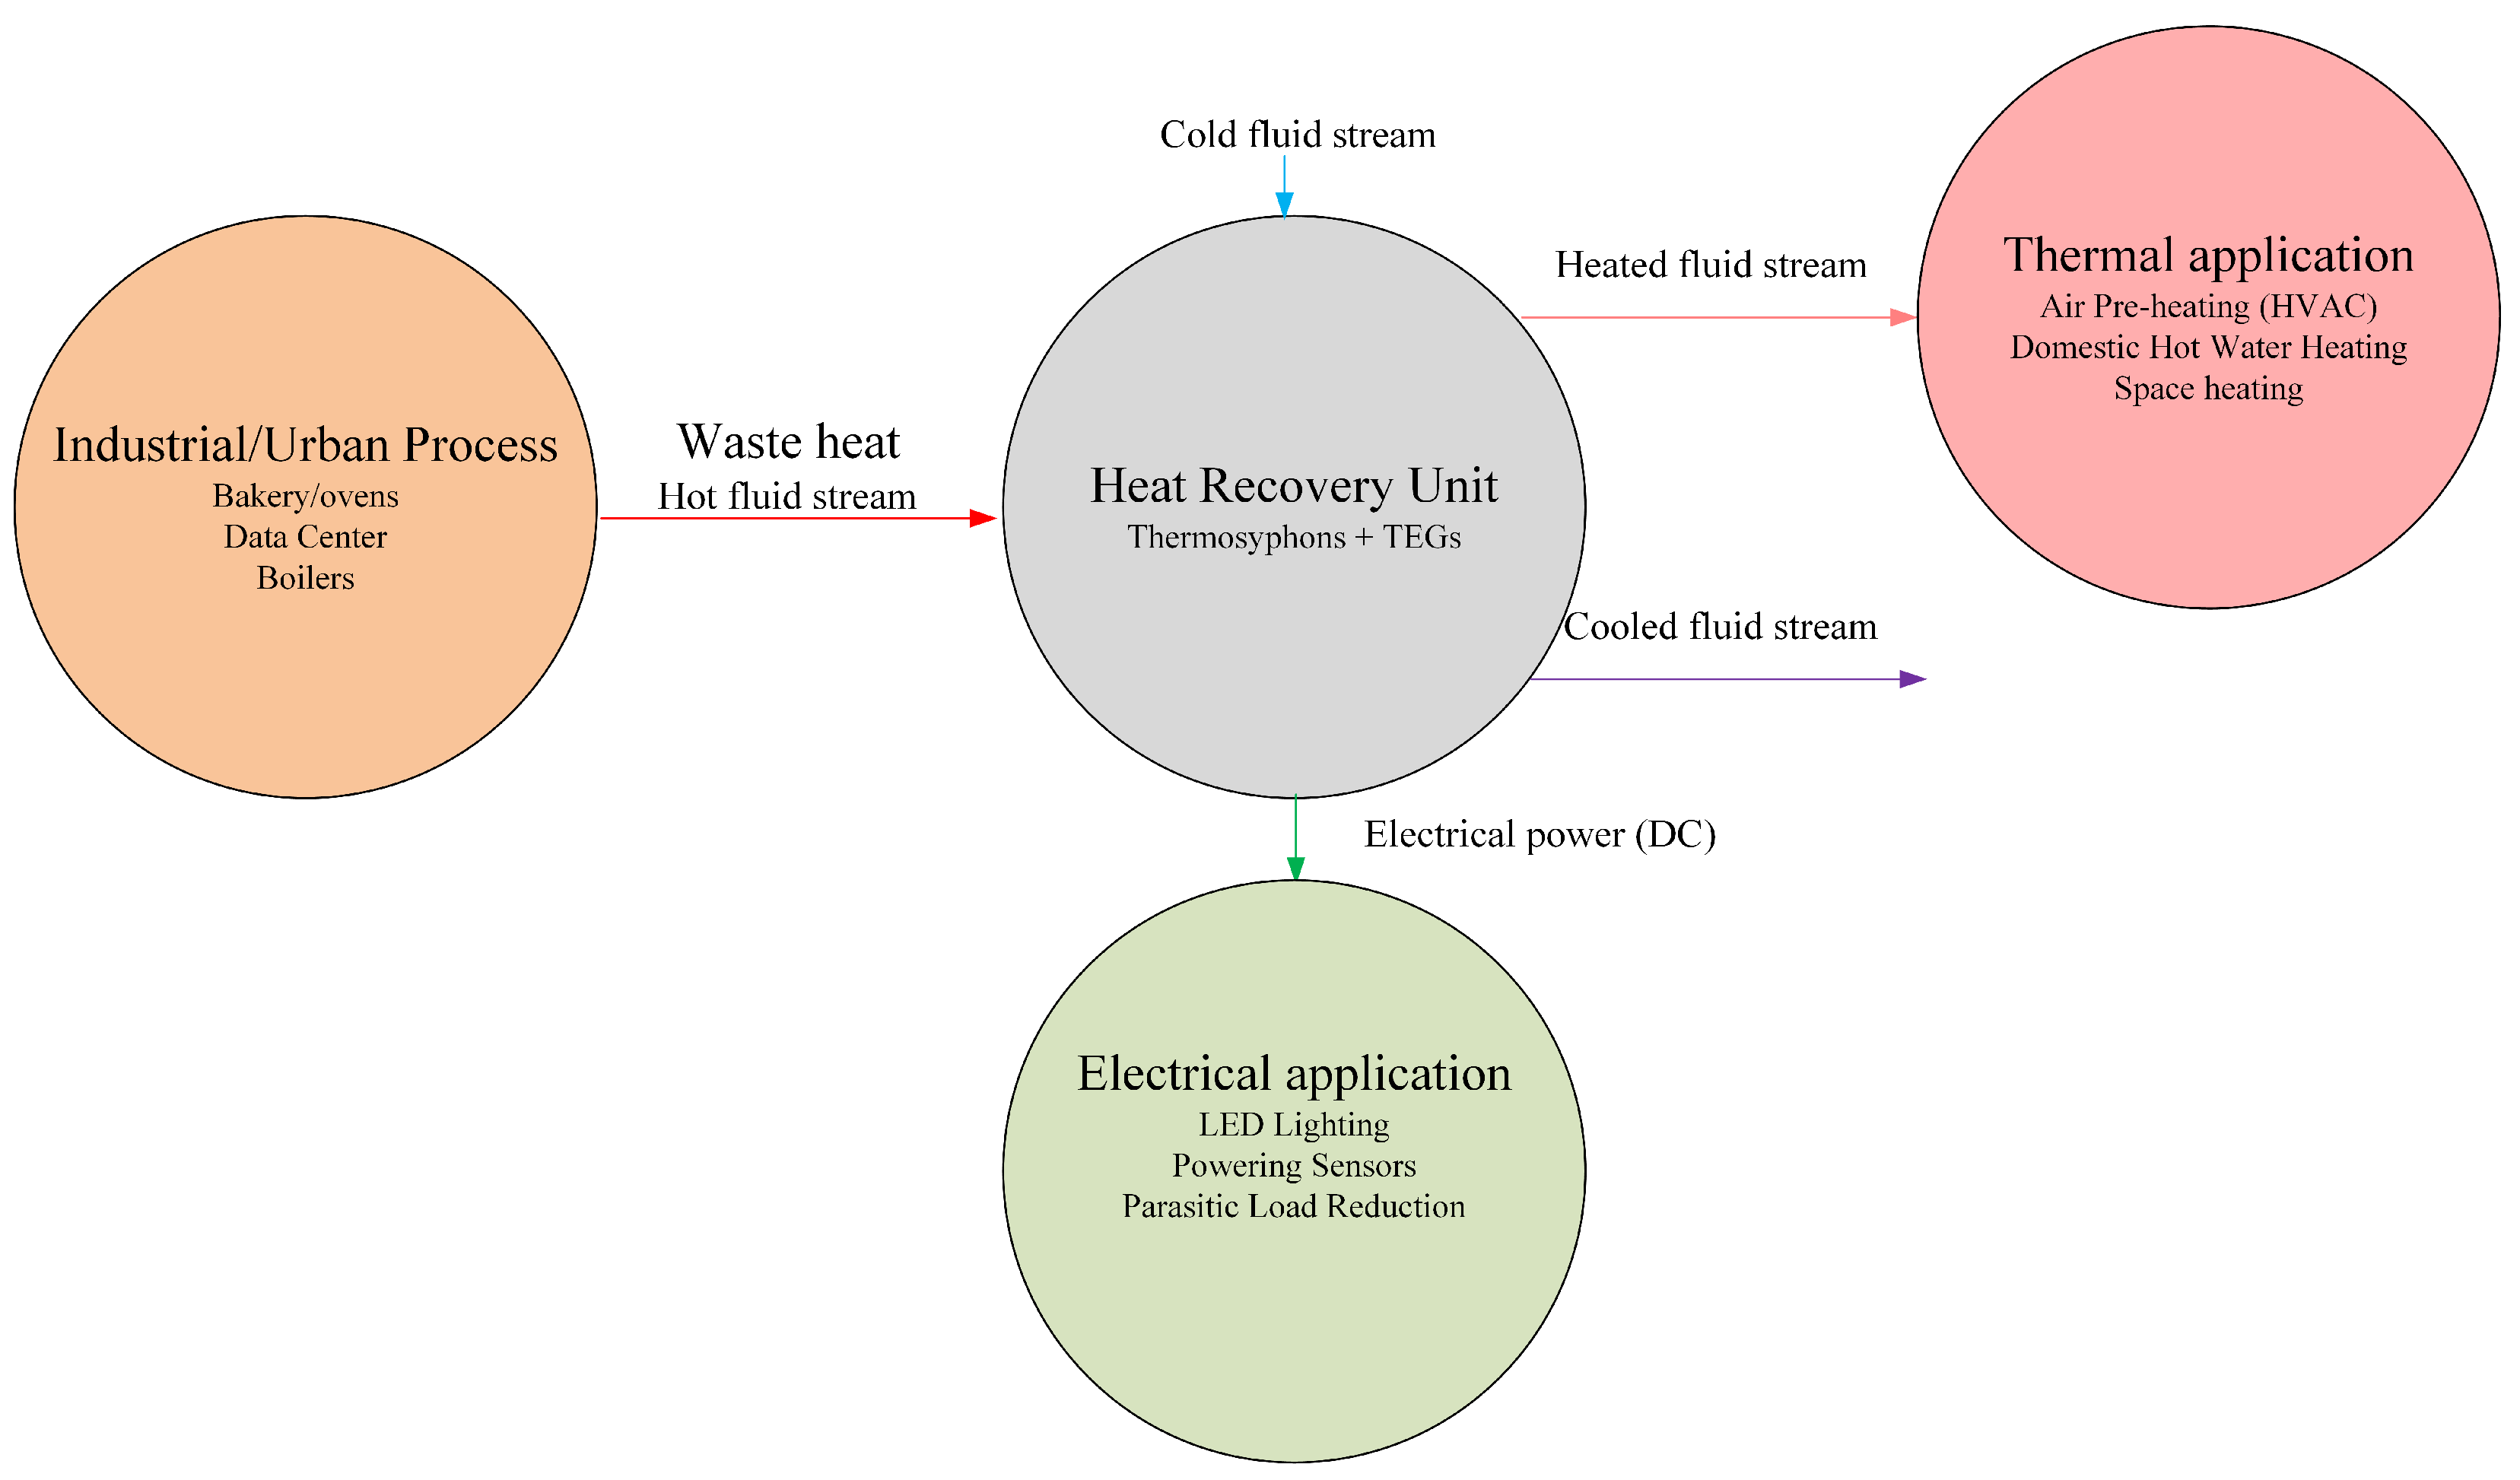
Figure 25 illustrates a possible implementation of the proposed heat recovery unit. Industrial/urban process could be used as a waste heat source that is used to heat a cold fluid stream for air pre-heating, domestic hot water heating, or space/ambient heating. The electrical power generated could be used to power led lighting, powering sensors or parasitic load reduction.

4. Conclusions

This study presented a comprehensive experimental assessment of a novel, dual-purpose waste heat recovery system composed of finned thermosyphons and thermoelectric generators.
The key experimental findings can be summarized as follows:
  • The system successfully demonstrated its dual-function capability, achieving a maximum electrical power output of 81.84 mW per TEG (163.69 mW total) and simultaneously preheating the inlet air by up to 9.5 °C.
  • The peak overall first-law efficiency of the system was 9.38%, achieved at an air velocity of 1.7 m/s and a hot side temperature of 90 °C, highlighting that the conditions for maximum efficiency and maximum power output do not coincide.
  • The thermal behavior of the thermosyphons was influenced by instabilities consistent with the geyser boiling phenomenon, a factor to be considered in the dynamic modeling of such systems.
The main contribution of this work is the elucidation of the critical operational trade-offs governed by airflow velocity. It was shown that high airflow rates (1.7 m/s) are optimal for maximizing the thermal recovery rate (up to 250.9 W) and effectiveness (44.4%). Conversely, low airflow rates (0.6 m/s) were necessary to allow the system to reach higher absolute temperatures, which in turn maximized the thermoelectric temperature difference (30.0 °C) and the resulting electrical power output.
These results confirm the technical feasibility of this compact, passive, and maintenance-free design for dual-purpose energy recovery. The power density of the system (54.74 W/m2) represents a valuable output from a thermal stream that would otherwise be wasted, offering a consistent energy source compared to intermittent renewables. The findings provide a critical framework for designing and optimizing such systems for specific applications, such as district heating or industrial ventilation, where balancing thermal and electrical outputs is essential.

Future Work

Regarding the system optimization and performance stability, future work should focus on developing a techno-economic optimization model. Such a model would determine the optimal operating point based on variable inputs like the local cost of electricity versus the price of the primary heating fuel, allowing the system to be tailored for maximum economic benefit in different scenarios.
Furthermore, to address the thermal instabilities caused by geyser boiling, a dedicated study should investigate mitigation strategies. This would involve experimentally evaluating the effect of reducing the thermosyphon filling ratio (e.g., to the 40–70% range) and modifying the evaporator’s internal geometry to promote a more stable and consistent heat transfer regime.
The potential for integration into district heating should be explored more concretely. A promising scenario is the deployment of these units as decentralized heat recovery nodes on the exhaust stacks of small-to-medium industrial facilities. The recovered thermal energy could be used to pre-heat the return loop of a modern, low-temperature (4th or 5th generation) district heating network, improving the overall efficiency of the grid. The co-generated electricity, while modest, could be sufficient to power the unit’s own sensors, actuators, and communication hardware, enabling it to operate as an autonomous, self-powered “smart” node within the larger energy infrastructure.
A full techno-economic analysis is a critical next step. This should go beyond a simple payback calculation to assess the levelized cost of energy, considering the system’s capital cost, installation expenses, and the combined lifetime value of the generated electricity and recovered heat. A key component of this analysis would be quantifying the economic benefit of the system’s passive, low-maintenance design, which reduces long-term operational costs. Finally, to assess practical durability, future tests must involve exposure to real industrial exhaust gases to evaluate the long-term effects of corrosion and particulate fouling on the performance of the fins, thermosyphons, and thermoelectric modules.

Author Contributions

Conceptualization, L.V.G.F., R.M.S., and T.A.A.; methodology, L.V.G.F., P.L.O.M., R.M.S., K.A.R.I., and T.A.A.; software, L.V.G.F., P.L.O.M., and R.M.S.; validation, L.V.G.F. and F.M.B.; formal analysis, L.V.G.F., P.L.O.M., K.A.R.I., R.M.S., and T.A.A.; investigation, L.V.G.F., P.L.O.M., F.M.B., and A.J.C.V.; resources, R.M.S. and T.A.A.; data curation, L.V.G.F., P.L.O.M., F.M.B., and R.M.S.; writing—original draft preparation, L.V.G.F. and P.L.O.M.; writing—review and editing, L.V.G.F., P.L.O.M., F.M.B., K.A.R.I., A.J.C.V., R.M.S., and T.A.A.; visualization, L.V.G.F., P.L.O.M., and F.M.B.; supervision, K.A.R.I., R.M.S., and T.A.A.; project administration, R.M.S. and T.A.A.; funding acquisition, R.M.S. and T.A.A. All authors have read and agreed to the published version of the manuscript.

Funding

This study was financed in part by the Coordenação de Aperfeiçoamento de Pessoal de Nível Superior—Brasil (CAPES)—Finance Code 001. The authors thank the Brazilian National Council for Scientific and Technological Development (CNPq), process numbers 409631/2021-3 and 312367/2022-8.

Institutional Review Board Statement

Not applicable.

Informed Consent Statement

Not applicable.

Data Availability Statement

The original contributions presented in this study are included in the article. Further inquiries can be directed to the corresponding author.

Acknowledgments

The authors gratefully acknowledge the support of CAPES and CNPq. They also extend their thanks to the PROPPG, DIRPPG, PPGEM, and DAMEC departments at the UTFPR Curitiba and Ponta Grossa campuses, and to the DAFIS department at the UTFPR Ponta Grossa campus. The generative AI tools ChatGPT-4 (OpenAI) and Gemini (Google) were utilized exclusively for minor language editing and proofreading. These tools were not used for content generation, data analysis, figure creation, or the interpretation of results.

Conflicts of Interest

The authors declare no conflict of interest. The funders had no role in the design of the study; in the collection, analyses, or interpretation of data; in the writing of the manuscript, or in the decision to publish the results.

Abbreviations

The following abbreviations are used in this manuscript:
Latin Symbols
AArea [m2]
c p Specific heat at constant pressure [J·kg−1·K−1]
D h Hydraulic diameter [m]
hSpecific enthalpy [J·kg−1]
iElectric current [A]
m ˙ Mass flow rate [kg·s−1]
PElectrical Power [W]
P Power Density [W·m−2]
QHeat transfer rate [W]
RElectrical Resistance [Ω]
R 2 Coefficient of determination [-]
ReReynolds number [-]
TTemperature [°C]
UVoltage [V]
vVelocity [m·s−1]
Greek Symbols
Δ Difference operator
ϵ Heat transfer effectiveness [-]
η Efficiency [-]
μ Dynamic viscosity [Pa·s]
ρ Density [kg·m−3]
Abbreviations
CCVClosed-Circuit Voltage
CFDComputational Fluid Dynamics
DAQData Acquisition
EESEngineering Equation Solver
MPPMaximum Power Point
OCVOpen-Circuit Voltage
PVPhotovoltaic
TEGThermoelectric Generator
VFDVariable Frequency Drive
WHRWaste Heat Recovery

References

  1. Brown, A.; Wayth, N. Statistical Review of World Energy. Energy Institute. 2025. Available online: https://www.energyinst.org/__data/assets/pdf_file/0007/1658077/Statistical-Review-of-World-Energy.pdf (accessed on 10 August 2025).
  2. Fleurial, J.P. Thermoelectric power generation materials: Technology and application opportunities. JOM 2009, 61, 79–85. [Google Scholar] [CrossRef]
  3. Papapetrou, M.; Kosmadakis, G.; Cipollina, A.; La Commare, U.; Micale, G. Industrial waste heat: Estimation of the technically available resource in the EU per industrial sector, temperature level and country. Appl. Therm. Eng. 2018, 138, 207–216. [Google Scholar] [CrossRef]
  4. Werner, S. International review of district heating and cooling. Energy 2017, 137, 617–631. [Google Scholar] [CrossRef]
  5. Savickas, R. Energy Efficiency in District Heating and Cooling, Waste Heat Utilisation. 2023. Available online: https://unece.org/sites/default/files/2024-04/UNEP%20CCC%2C%20CONFERENCE%2C%20UNECE%2C%20DC%20and%20WH%2C%202.pdf (accessed on 1 August 2025).
  6. Seebeck, T.J. Magnetische Polarisation der Metalle und Erregung Durch Temperatur-Differenz; Königlichen Akademie der Wissenschaften: Berlin, Germany, 1822; Available online: https://archive.org/details/magnetischepolar00seebuoft (accessed on 7 August 2025).
  7. Ismail, B.I.; Ahmed, W.H. Thermoelectric power generation using waste-heat energy as an alternative green technology. Recent Patents Electr. Electron. Eng. (Former. Recent Patents Electr. Eng.) 2009, 2, 27–39. [Google Scholar] [CrossRef]
  8. Singh, B.; Remeli, M.F.; Chet, D.L.; Oberoi, A.; Date, A.; Akbarzadeh, A. Experimental investigation on effect of adhesives on thermoelectric generator performance. J. Electron. Mater. 2015, 44, 1864–1869. [Google Scholar] [CrossRef]
  9. Wu, X.; Liu, W. An engineering roadmap for the thermoelectric interface materials. J. Mater. 2024, 10, 748–750. [Google Scholar] [CrossRef]
  10. Alves, T.A.; Krambeck, L.; Santos, P.d.; Aranguren, P. Heat pipe and thermosyphon for thermal management of thermoelectric cooling. In Bringing Thermoelectricity into Reality; IntechOpen: London, UK, 2018. [Google Scholar] [CrossRef]
  11. Jouhara, H.; Reay, D.; McGlen, R.; Kew, P.; McDonough, J. Heat Pipes: Theory, Design and Applications; Butterworth-Heinemann: Oxford, UK, 2023. [Google Scholar]
  12. Machado, P.L.; Pereira, T.S.; Trindade, M.G.; Biglia, F.M.; Santos, P.H.; Tadano, Y.S.; Siqueira, H.; Alves, T.A. Estimating thermal performance of thermosyphons by artificial neural networks. Alex. Eng. J. 2023, 79, 93–104. [Google Scholar] [CrossRef]
  13. Pereira, T.S.; Machado, P.L.O.; Veitia, B.D.R.; Biglia, F.M.; dos Santos, P.H.D.; Tadano, Y.d.S.; Siqueira, H.V.; Antonini Alves, T. Application of Artificial Neural Networks in Predicting the Thermal Performance of Heat Pipes. Energies 2024, 17, 5387. [Google Scholar] [CrossRef]
  14. Mantelli, M.B.H. Thermosyphons and Heat Pipes: Theory and Applications; Springer: Cham, Switzerland, 2021; Volume 1. [Google Scholar]
  15. Krambeck, L.; Baptista, N.F.; Marrone, V.d.A.; Dias, P.H.d.S.; Antonini Alves, T. Thermal Performance Evaluation of Different Passive Devices for Electronics Cooling. Therm. Sci. 2019, 23, 1151–1160. [Google Scholar] [CrossRef]
  16. Jaziri, N.; Boughamoura, A.; Müller, J.; Mezghani, B.; Tounsi, F.; Ismail, M. A comprehensive review of Thermoelectric Generators: Technologies and common applications. Energy Rep. 2020, 6, 264–287. [Google Scholar] [CrossRef]
  17. Nadaf, N.; Preethi, A. Review on waste heat energy harvesting using teg: Applications and enhancements. In Proceedings of the 2021 8th International Conference on Smart Computing and Communications (ICSCC), Kochi, Kerala, India, 1–3 July 2021; pp. 334–339. [Google Scholar] [CrossRef]
  18. Kim, T.Y.; Negash, A.; Cho, G. Experimental and numerical study of waste heat recovery characteristics of direct contact thermoelectric generator. Energy Convers. Manag. 2017, 140, 273–280. [Google Scholar] [CrossRef]
  19. Fachini, L.V.G.; Machado, P.L.O.; Krambeck, L.; Szmoski, R.M.; Alves, T.A. Heat Recovery and Power Generation Using Thermoelectric Generator. In Advanced Thermoelectric Materials for Energy Harvesting Applications; IntechOpen: London, UK, 2019. [Google Scholar] [CrossRef]
  20. Fernández-Yáñez, P.; Jarama, J.; Martos, F.J.; Armas, O. Heat transfer in thermoelectric generators for waste energy recovery in piston engines. Appl. Sci. 2023, 13, 5647. [Google Scholar] [CrossRef]
  21. Gomaa, M.R.; Murtadha, T.K.; Abu-jrai, A.; Rezk, H.; Altarawneh, M.A.; Marashli, A. Experimental investigation on waste heat recovery from a cement factory to enhance thermoelectric generation. Sustainability 2022, 14, 10146. [Google Scholar] [CrossRef]
  22. Xiao, D.; Sun, P.; Wu, J.; Zhang, Y.; Wu, J.; Liu, G.; Hu, H.; Hu, J.; Tan, X.; He, S.; et al. Thermoelectric generator design and characterization for industrial pipe waste heat recovery. Processes 2023, 11, 1714. [Google Scholar] [CrossRef]
  23. Pourrahmani, H.; Shakeri, H.; Van Herle, J. Thermoelectric generator as the waste heat recovery unit of proton exchange membrane fuel cell: A numerical study. Energies 2022, 15, 3018. [Google Scholar] [CrossRef]
  24. Zhang, J.; Tian, Z.; Guo, K.; Dong, Z.; Wang, C.; Cui, S.; Tian, W.; Qiu, S.; Su, G. Investigations on thermoelectric characteristic of heat pipe thermoelectric generator waste heat utilization device in nuclear power system. Nucl. Eng. Des. 2023, 407, 112299. [Google Scholar] [CrossRef]
  25. Wang, C.; Tang, S.; Liu, X.; Su, G.; Tian, W.; Qiu, S. Experimental study on heat pipe thermoelectric generator for industrial high temperature waste heat recovery. Appl. Therm. Eng. 2020, 175, 115299. [Google Scholar] [CrossRef]
  26. Zhang, X.; Zhang, X.; Ge, S.; Zhang, B. Multi-criteria decision analysis and experimental study on heat pipe thermoelectric generator for waste heat recovery. Appl. Therm. Eng. 2024, 255, 123930. [Google Scholar] [CrossRef]
  27. Zhao, Y.; Fan, Y.; Li, W.; Li, Y.; Ge, M.; Xie, L. Experimental investigation of heat pipe thermoelectric generator. Energy Convers. Manag. 2022, 252, 115123. [Google Scholar] [CrossRef]
  28. Remeli, M.F.; Date, A.; Orr, B.; Ding, L.C.; Singh, B.; Affandi, N.D.N.; Akbarzadeh, A. Experimental investigation of combined heat recovery and power generation using a heat pipe assisted thermoelectric generator system. Energy Convers. Manag. 2016, 111, 147–157. [Google Scholar] [CrossRef]
  29. Jang, J.C.; Chi, R.G.; Rhi, S.H.; Lee, K.B.; Hwang, H.C.; Lee, J.S.; Lee, W.H. Heat pipe-assisted thermoelectric power generation technology for waste heat recovery. J. Electron. Mater. 2015, 44, 2039–2047. [Google Scholar] [CrossRef]
  30. Remeli, M.F.; Verojporn, K.; Singh, B.; Kiatbodin, L.; Date, A.; Akbarzadeh, A. Passive heat recovery system using combination of heat pipe and thermoelectric generator. Energy Procedia 2015, 75, 608–614. [Google Scholar] [CrossRef]
  31. Remeli, M.F.; Kiatbodin, L.; Singh, B.; Verojporn, K.; Date, A.; Akbarzadeh, A. Power generation from waste heat using heat pipe and thermoelectric generator. Energy Procedia 2015, 75, 645–650. [Google Scholar] [CrossRef]
  32. Remeli, M.F.; Singh, B.; Affandi, N.D.N.; Ding, L.C.; Date, A.; Akbarzadeh, A. Investigation of counter-flow in a heat pipe–thermoelectric generator (HPTEG). J. Electron. Mater. 2017, 46, 3115–3123. [Google Scholar] [CrossRef]
  33. Singh, B.; Baharin, N.A.; Remeli, M.F.; Oberoi, A.; Date, A.; Akbarzadeh, A. Experimental analysis of thermoelectric heat exchanger for power generation from salinity gradient solar pond using low-grade heat. J. Electron. Mater. 2017, 46, 2854–2859. [Google Scholar] [CrossRef]
  34. Mostafavi, S.A.; Mahmoudi, M. Modeling and fabricating a prototype of a thermoelectric generator system of heat energy recovery from hot exhaust gases and evaluating the effects of important system parameters. Appl. Therm. Eng. 2018, 132, 624–636. [Google Scholar] [CrossRef]
  35. Kılkıs, B.; Çağlar, M.; Sengül, M. Energy Benefits of Heat Pipe Technology for Achieving 100% Renewable Heating and Cooling for Fifth-Generation, Low-Temperature District Heating Systems. Energies 2021, 14, 5398. [Google Scholar] [CrossRef]
  36. Dashevsky, Z.; Jarashneli, A.; Unigovski, Y.; Dzunzda, B.; Gao, F.; Shneck, R.Z. Development of a High Perfomance Gas Thermoelectric Generator (TEG) with Possibible Use of Waste Heat. Energies 2022, 15, 3960. [Google Scholar] [CrossRef]
  37. Goswami, R.; Ganguly, S.; Das, R. Waste heat recovery from the biomass engine for effective power generation using a new array-based system. Sustain. Energy Technol. Assess. 2024, 63, 103630. [Google Scholar] [CrossRef]
  38. Wang, Y.; Guo, H.; Qin, Y.; Liao, J.; Feng, Z.; Li, C. Heat pipe-based electric generator for waste heat harvesting. Appl. Therm. Eng. 2024, 242, 122482. [Google Scholar] [CrossRef]
  39. Jouhara, H.; Delpech, B.; Almahmoud, S.; Chauhan, A.; Al-Mansour, F.; Pusnik, M.; Buhvald, A.; Plesnik, K. Experimental investigation on an advanced thermosiphon-based heat exchanger for enhanced waste heat recovery in the steel industry. Energy 2025, 315, 134428. [Google Scholar] [CrossRef]
  40. Kubenova, M.; Kuterbekov, K.; Bekmyrza, K.; Kabyshev, A.; Kabdrakhimova, G.; Atamurotov, F.; Ibrahim, W. Exhaust waste heat recovery system using thermoelectric generator: A prospective of novel simulation technique toward low-carbon technology. Int. J. Low-Carbon Technol. 2025, 20, 8–24. [Google Scholar] [CrossRef]
  41. Muratçobanoğlu, B.; Akyürek, E.F.; Manay, E. Experimental evaluation and optimization of the heat pipes integrated thermoelectric generator using response surface methodology. Appl. Therm. Eng. 2025, 258, 124599. [Google Scholar] [CrossRef]
  42. Machado, P.L.O.; Fachini, L.V.G.; Tiuman, E.T.; Barchi, T.M.; Stevan, S.L., Jr.; Siqueira, H.V.; Szmoski, R.M.; Antonini Alves, T. A Low-Cost Arduino-Based I–V Curve Tracer with Automated Load Switching for PV Panel Characterization. Appl. Sci. 2025, 15, 8186. [Google Scholar] [CrossRef]
  43. Cavalcanti, E.J.; Carvalho, M.; Azevedo, J.L. Exergoenvironmental results of a eucalyptus biomass-fired power plant. Energy 2019, 189, 116188. [Google Scholar] [CrossRef]
  44. König, M.; Eisinger, K.; Hartmann, I.; Müller, M. Combined removal of particulate matter and nitrogen oxides from the exhaust gas of small-scale biomass combustion. Biomass Convers. Biorefinery 2019, 9, 201–212. [Google Scholar] [CrossRef]
  45. Oliveira, d.S.D.; Ochoski, M.P.L.; Chiarello, C.; Nunes, D.S.E.; da Silva, M.J.; Dias, D.S.P.H.; Antonini, A.T. Experimental study of hydrodynamic parameters regarding on geyser boiling phenomenon in glass thermosyphon using wire-mesh sensor. Therm. Sci. 2022, 26, 1391–1404. [Google Scholar] [CrossRef]
  46. Liu, Y.; Li, Z.; Li, Y.; Kim, S.; Jiang, Y. Experimental investigation of geyser boiling in a two-phase closed loop thermosyphon with high filling ratios. Int. J. Heat Mass Transf. 2018, 127, 857–869. [Google Scholar] [CrossRef]
  47. Alexander, C.K.; Sadiku, M.N.; Sadiku, M. Fundamentals of Electric Circuits; McGraw-Hill Higher Education: Boston, MA, USA, 2007. [Google Scholar]
  48. Pakere, I.; Blumberga, D.; Volkova, A.; Lepiksaar, K.; Zirne, A. Valorisation of waste heat in existing and future district heating systems. Energies 2023, 16, 6796. [Google Scholar] [CrossRef]
  49. Akbarzadeh, A.; Dube, V. Industrial waste heat recovery, using a loop thermosyphon heat exchanger. In Proceedings of the ISES 2001 Solar World Congress, Adeleide, Australia, 25–30 November 2001. [Google Scholar]
  50. Remeli, M.F. Simultaneous Industrial Waste Heat Recovery and Power Generation Using Heat Pipe Assisted Thermoelectric Generator. Ph.D. Thesis, RMIT University, Melbourne, Australia, 2024. [Google Scholar]
  51. Yuan, X.; Liu, J.; Sun, S.; Lin, X.; Fan, X.; Zhao, W.; Kosonen, R. Data center waste heat for district heating networks: A review. Renew. Sustain. Energy Rev. 2025, 219, 115863. [Google Scholar] [CrossRef]
  52. Dorotić, H.; Čuljak, K.; Miškić, J.; Pukšec, T.; Duić, N. Technical and economic assessment of supermarket and power substation waste heat integration into existing district heating systems. Energies 2022, 15, 1666. [Google Scholar] [CrossRef]
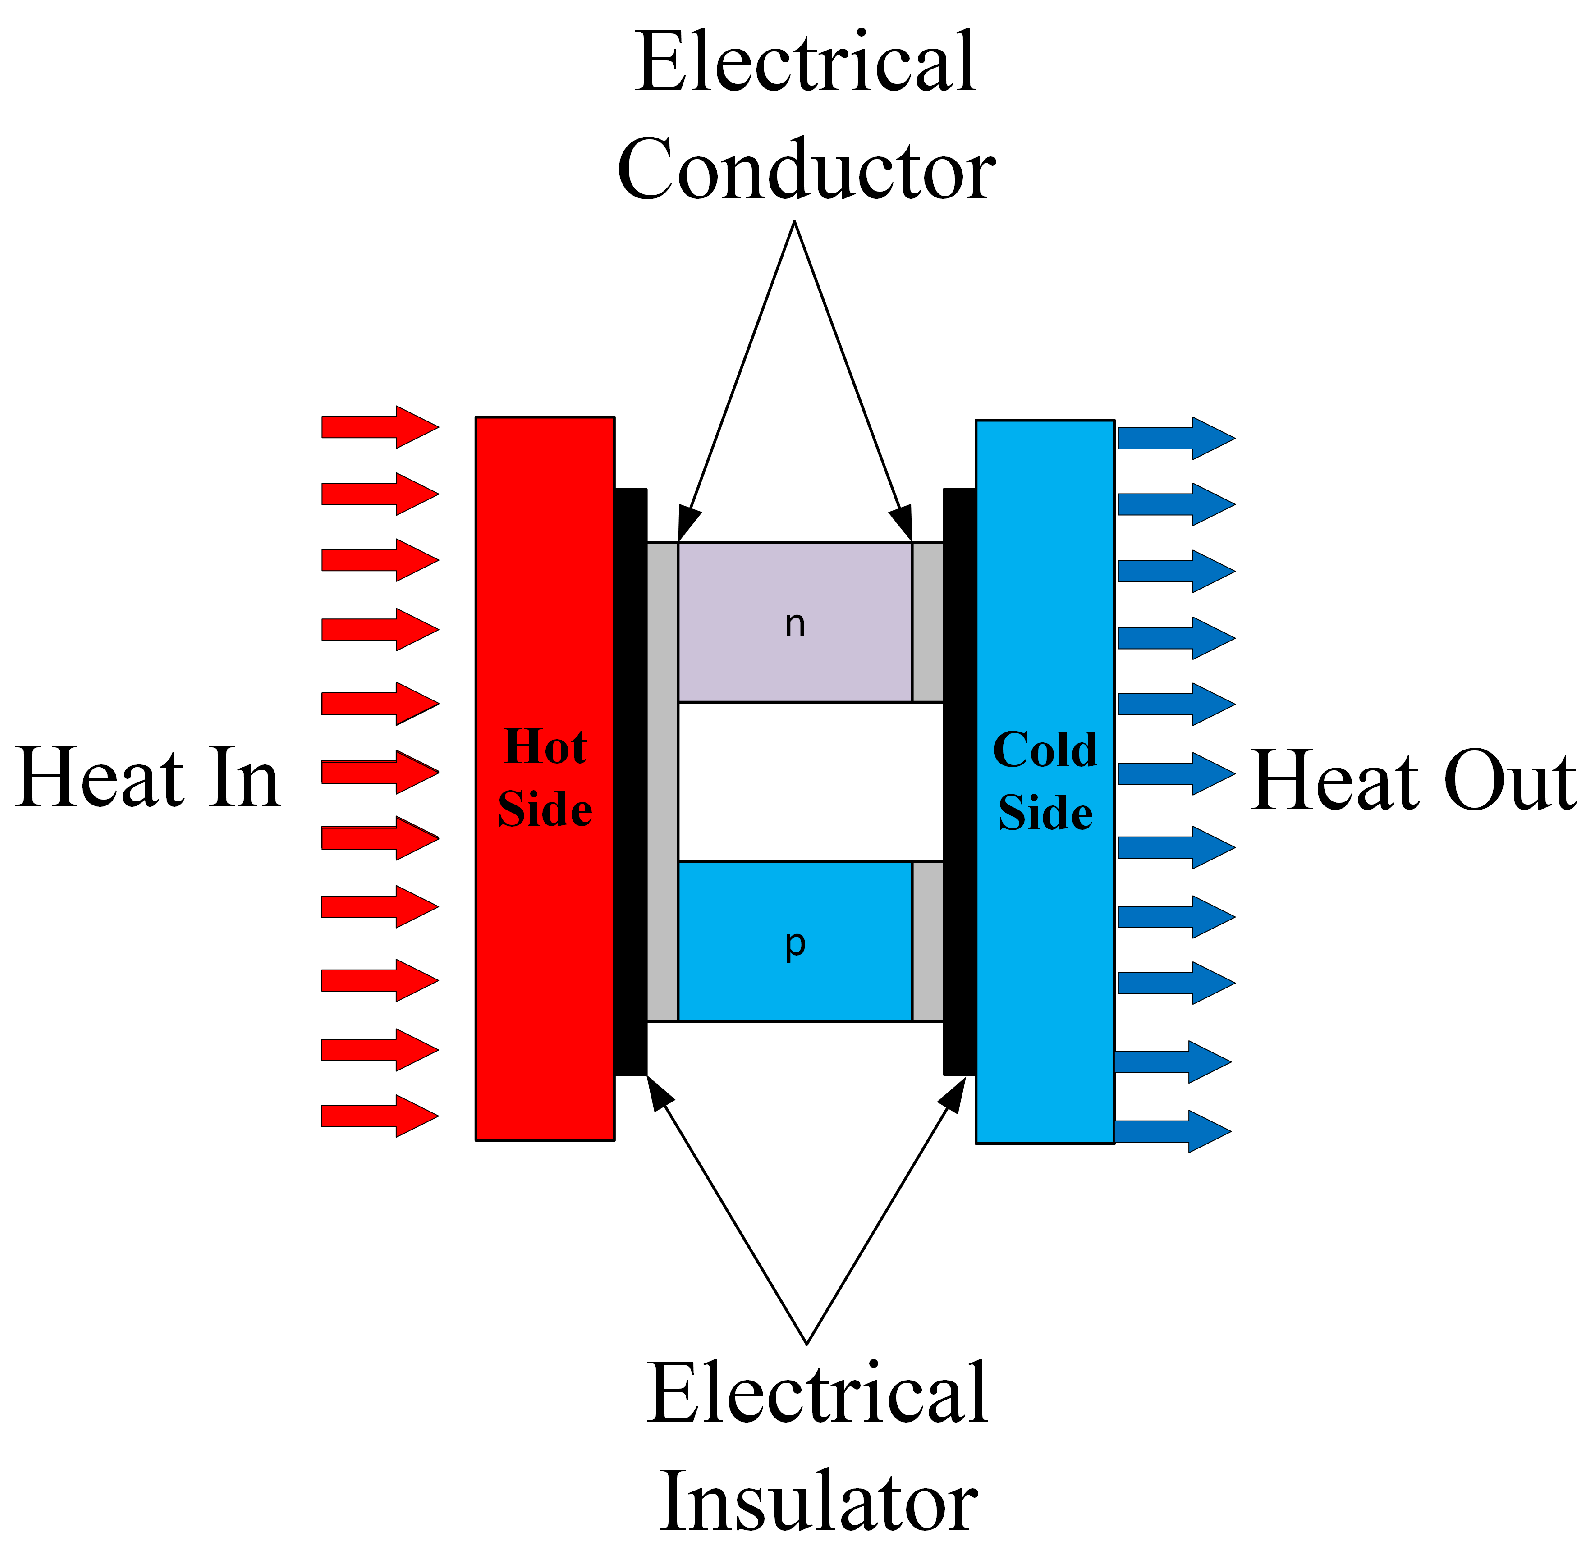
Figure 1. Schematic diagram of a thermoelectric generator.
Energies 18 05090 g001
Figure 2. Schematic diagram of a thermosyphon operation.
Energies 18 05090 g002
Figure 3. Experimental setup scheme. Numbers indicate thermocouples positioning.
Energies 18 05090 g003
Figure 4. Wind tunnel.
Energies 18 05090 g004
Figure 5. Heat recovery system (dimensions in mm).
Energies 18 05090 g005
Figure 6. Thermoelectric generator.
Energies 18 05090 g006
Figure 7. Thermosyphon: (a) main components; (b) assembly.
Energies 18 05090 g007
Figure 8. Airflow control system.
Energies 18 05090 g008
Figure 9. DAQ for TEG.
Energies 18 05090 g009
Figure 10. Experimental setup.
Energies 18 05090 g010
Figure 11. Experimental setup: (a) wind tunnel; (b) heat recovery unit.
Energies 18 05090 g011
Figure 12. Experimental procedure.
Energies 18 05090 g012
Figure 13. Energy balance.
Energies 18 05090 g013
Figure 14. Temperature profiles: 0.6 m/s.
Energies 18 05090 g014
Figure 15. Temperature profiles: 1.1 m/s.
Energies 18 05090 g015
Figure 16. Temperature profiles: 1.7 m/s.
Energies 18 05090 g016
Figure 17. Temperature difference at the thermoelectric generators.
Energies 18 05090 g017
Figure 18. Air preheating.
Energies 18 05090 g018
Figure 19. Air heat transfer.
Energies 18 05090 g019
Figure 20. Heat transfer efficiency.
Energies 18 05090 g020
Figure 21. I-V curves for all test conditions. Marker shape and color represent fluid velocity: blue circles ( ) for 0.6 m/s, red triangles ( ) for 1.1 m/s, and green squares ( ) for 1.7 m/s. Line styles indicate waste-heat temperature: solid line (—) for 90 °C, dashed line (– –) for 120 °C, dash-dot line ( -·- ) for 150 °C, and dotted line ( ) for 180 °C.
Energies 18 05090 g021
Figure 22. P-V curves for all test conditions. Marker shape and color represent fluid velocity: blue circles ( ) for 0.6 m/s, red triangles ( ) for 1.1 m/s, and green squares ( ) for 1.7 m/s. Line styles indicate waste-heat temperature: solid line (—) for 90 °C, dashed line (– –) for 120 °C, dash–dot line ( -·- ) for 150 °C, and dotted line ( ) for 180 °C.
Energies 18 05090 g022
Figure 23. Open Circuit Voltage (OCV) and Closed Circtuit Voltage (CCV).
Energies 18 05090 g023
Figure 24. Maximum power vs. temperature difference at the TEG.
Energies 18 05090 g024
Figure 25. Heat Recovery Unit implementation.
Energies 18 05090 g025
Table 2. Physical characteristics of the thermosyphons.
CharacteristicType 1Type 2
Inner diameter [in]7/167/16
Outer diameter [in]1/21/2
Evaporator length [mm]56150
Adiabatic section length [mm]9494
Condenser length [mm]15056
Working fluidDistilled waterDistilled water
Working fluid volume [mL]6.5214.55
Filling ratio [%]120100
Table 3. Test conditions used in the experimental campaign.
TestAir Velocity [m/s]Reynolds NumberAir Temperature [°C]
10.6476590
20.64416120
30.64107150
40.63831180
51.1883090
61.18183120
71.17701145
81.713,89790
91.713,040115
Table 4. Experimental uncertainties.
ParameterInstrumentUncertainty
TemperatureType T thermocouples (Agilent™ 34970A)±0.25 °C
Air velocityITAN 720 Anemometer ± 0.215 m/s
Voltage (TEG output)Arduino-based DAQ ± 0.5 % + 0.01 V
Current (TEG output)Arduino-based DAQ ± 2 % + 0.00001 A
Hydraulic diameter (test section)Millimeter scale ± 0.5 mm
Table 5. Summary of experimental thermal results for all test conditions.
v [m/s]ReT [°C] m ˙ [kg/s] T ci [°C] T c [°C] T h [°C] T ho [°C] Q in [W] Q TG 1 [W] Q TTEG [W] ε th [%]
0.604765900.01432.0034.2792.5481.73808.532.88157.220.91
0.6044161200.01432.0036.49122.87106.10116162.24234.226.57
0.6041071500.01332.0039.29151.94127.50147896.9327.829.56
0.6038311800.01332.0041.52179.21149.801779121.5380.031.98
1.108830900.03032.0034.9990.6978.86147985.02318.525.20
1.1081831200.02032.0037.29120.06102.502131135.9454.729.89
1.1077011450.02032.0039.21145.73124.602263178.8527.433.91
1.7013897900.04032.0036.9989.9678.152244210.4500.542.04
1.70130401150.04032.0038.16116.29102.503138250.9565.044.40
Table 6. Electrical power density and total output as a function of temperature difference. Each thermoelectric module has an area of 56 × 56 mm.
ΔT [°C]Power Density [W/m2]Power [mW]Total PowerTotal Density ϵ el
TG1TG2TG1TG2[mW][W/m2][%]
0.200.200.200.610.611.230.390.000078
0.780.780.782.442.444.881.560.002084
1.251.251.253.913.917.822.490.002383
3.323.323.3210.4010.4020.806.630.005474
8.388.537.4026.2723.2149.4815.780.015536
8.538.538.5326.7526.7553.5017.060.011767
14.9014.9013.3446.7341.8488.5628.240.016792
20.1920.1920.1963.3063.30126.6040.370.025295
26.1026.1026.1081.8481.84163.6952.200.028971
Table 7. Measured power generation and thermal/electrical efficiencies under different thermal and flow conditions.
Flow Rate T hot Δ T Q in P TEG Q TG 1 η el η th η
[m/s][°C][°C][W][mW][W][%][%][%]
0.60905.00808.51.2332.880.000154.074.07
0.6012012.4111614.8862.240.000425.365.36
0.6015023.3314787.8196.900.000536.566.56
0.6018029.96177920.80121.50.001176.836.83
1.10907.37147949.4880.250.003355.435.43
1.1012017.77213153.50135.90.002516.386.38
1.1014526.53263588.56178.80.003366.796.79
1.70908.652244126.60210.40.005649.389.38
1.7011518.313138163.69250.90.005228.008.00
Disclaimer/Publisher’s Note: The statements, opinions and data contained in all publications are solely those of the individual author(s) and contributor(s) and not of MDPI and/or the editor(s). MDPI and/or the editor(s) disclaim responsibility for any injury to people or property resulting from any ideas, methods, instructions or products referred to in the content.