Abstract
Wave loads significantly influence offshore structure design; the structures must be strong enough to resist those loads. On the other hand, waves can be used as a renewable energy source if the loads are adequately exploited. The wave loads can be obtained by experimental methods or simulations. However, experimental methods are costly and limited in shape, accuracy, and the details of the measurements. This study uses the CFD method to capture the interaction between waves and a partially submerged object. The simulations are performed by utilizing two-phase open-channel transient flow and Volume of Fluid (VOF) techniques. The simulations are performed for different wave scenarios, i.e., wave height and frequency. Simulation results are validated by experimental tests. The experiments are performed in a dedicated lab, which includes a water tank with a wave generator and a facility for measuring drag and lift forces. The study focuses on the study of wave loads on partially submerged objects. The CFD simulations show strong consistency with the experimental data. The results show load distribution over the floating objects that can be used to design proper structures for resisting or energy-harvesting wave loads.
1. Introduction
Offshore structures are subjected to loads induced by waves, and their design is significantly influenced by the hydrodynamic loads. During the design phase and before deployment, the structure’s resilience to wave loads needs to be thoroughly tested and verified. On the other hand, the demand for renewable energy is growing, while the use of formerly secure energy sources, e.g., oil and gas, needs to be reduced to tackle global warming issues. Among other energy sources like ocean wind energy and tidal energy, wave energy is an option. In order to understand the potential of this energy source, studying hydrodynamic forces is essential. The available potential can be investigated using numerical simulations such as computational fluid dynamics (CFD), as well as experimental testing of different ideas. Experimental testing is usually more expensive and time-consuming, and designing a test rig to accurately measure the desired parameters can be difficult. Numerical models, on the other hand, can save time and cost while providing valuable detailed data. The wave hydrodynamic loads and coefficients are not new topics. Many studies have been done to predict the wave loads against the structures. However, most of the studied structures are offshore oil and gas or wind turbine structures. Therefore, vertical cylinders with circular sections, as the most usual structure shape in these industries, have been focused on. For example, Bihs H. et al. [1] developed a new 3D numerical wave tank to study wave propagation and wave hydrodynamics by solving the incompressible Navier–Stokes equations. Bai W. and Taylor R. E. [2] investigated the wave propagation and diffraction around a vertical circular cylinder in a numerical wave tank by applying the Mixed Eulerian–Lagrangian approach. They showed that the domain decomposition technique is efficient and accurate. In another study [3], a vertical cylinder was experimentally subjected to the impact of a shoaling solitary wave, and the results were compared with a numerical 3D simulation. Another study [4] focused on the force distribution on a vertical cylinder exposed to shoaling regular waves. The calculated coefficients were in good agreement with the other literature. A comparison study [5] between the Morison equation and Rainey corrections on a fixed cylinder in regular steep waves against experimental data showed that the Morison equation correctly estimates the amplitude of the loading but not in higher-order loading components in very steep waves, and a more appropriate loading model is required for such cases. A numerical study using CFD simulations was carried out by Ha Y.-J.. et al. [6] on a truncated circular cylinder, and the results were validated by experimental data. In another study, numerical simulations were used to consider a numerical wave tank and the secondary load cycle on a vertical cylinder [7]. Yoon-Jin H. et al. [8] experimentally studied the air bubble effects on a vertical circular cylinder to characterize wave impact loads. Sangmin L. et al. [9] used theoretical solutions such as the Morison equation to predict wave forces on offshore structures with a vertical cylindrical shape. They studied different wave steepness and showed that the force magnitude is dependent on the incident wave condition, e.g., the relative depth, amplitude, and elevation. Renaud P. et al. [10] estimated the hydrodynamic load of breaking waves impacting a fixed, rigid vertical cylinder using two semi-analytical models. They compared the results with 3D numerical results and other formulations and showed similarities. In another study [11], new simulation results of breaking wave impacts on a surface-piercing cylinder were presented. They found more agreement between the experimental and numerical results over the force impulse rather than the maximum force. A different study [12] showed that the coupled effects between surface waves and a subsurface current play a vital role in the hydrodynamic loading on a bottom-fixed vertical slender structure. Some research works addressed the drag coefficients by studying the loadings and structural design. For example, the drag coefficient of a circular cylinder was studied by Chaplin J.R. et al. [13] using experiments in which steady towing speeds were applied. Another study [14] focused on measuring forces on stationary circular cylinders with very low aspect ratios and showed that coefficients decrease with decreasing aspect ratios. Ren H. et al. [15] studied the hydrodynamic coefficients for partially and fully submerged cylinders, and significant differences were observed. In another study [16], 3D large eddy simulations were compared with experimental results to measure the drag and the wake angle on cylinders for a range of velocities. Additionally, some studies (e.g. [17]) investigated more complex shapes. Among others, the total force on a square cylinder was studied using laboratory measurements and a numerical model. It was shown that the RANS model and LES predicted the forces more accurately when strong turbulence was present. In another study [18], a cruciform structure consisting of two intersecting cylinders and a center sphere in uniform flow was studied. They showed that the drag force on the sphere with the cruciform configuration can be two to three times the drag force on a sphere without the configuration. An experimental study focused on the interaction between unidirectional waves and a horizontally moored complex model [19]. In addition, the CFD simulation of the interaction of the floater system and wave is reported by applying a novel numerical model [20]. Similarly, Liu B. et al. [21] studied horizontal and floating cylindrical fences. They modified the Morison equation and accurately predicted the wave force of the horizontal cylindrical float. They also investigated the effect of some parameters, such as the amplitude, immersion depth, and wave period. Added mass and drag coefficients for subsea manifolds were studied using experimental model tests, and it was shown that hydrodynamic parameters for real complex geometry are higher than those for flat plates [22]. Liang X. et al. [23] investigated the drag coefficient of the subsea tree using the finite difference method and experiment. Domagala M. et al. [24] studied the hydrodynamic forces and drag coefficient on an egg-shaped fish farm. In another study [25], the hydrodynamic coefficients of a submerged 3D prism were calculated using CFD simulations in OpenFOAM and experimental tests using the constant acceleration method. The results were in good agreement. Cheng Y. et al. [26] demonstrated that the drag and lift coefficients of an elliptical shape can decrease by 76.15 % and 51.30 %, respectively, in comparison with a circular section, using the finite volume method. Recently, some studies have focused on numerical tool capabilities. For example, Chen L.F. et al. [27] focused on OpenFOAM performance by applying non-linear wave interactions with offshore structures. Liu Z. et al. [28] implemented the numerical simulation using an in-house CFD solver that was developed on OpenFOAM. Another study [29] investigated the uncertainty of wave load resulting from CFD simulations on offshore structures using OpenFOAM in comparison with experimental results. And, finally, newer studies are considering applying a machine learning model that can quickly predict the nonlinear loading on vertical cylinders [30]. However, as mentioned, the focus of these studies is the offshore structures, while for wave energy harvesting, the spherical shape is more interesting. James M. et al. [31] presented an experimental evaluation of drag coefficients for a submerged sphere.
The primary objective of this research is to capture phenomena that arise during the interaction between regular waves and a partially submerged spherical buoy. The research is mainly focused on drag and lift forces that are induced by the waves. CFD simulation that uses open-channel transient flow and Volume of Fluid (VOF) techniques, along with experimental tests, was used in this study. The simulations were performed for different wave patterns, their height and frequency, which allowed for obtaining a relation between lift and drag forces and wave frequency and height. The experimental testing was performed at a designated test site that included a wave generator. The experimental tests were compared with the simulation results. The outcome of this study is the drag and lift force for a half-submerged spherical buoy for selected wave parameters.
2. Materials and Methods
2.1. CFD Method
The flow over a partially submerged spherical buoy is a complex phenomenon that includes two fluid phases (air and water) and, additionally, interaction with a rigid object. The flow over the buoy can be described by well-known governing equations called the Navier–Stokes equations, which include the equations of mass conservation [32]:
and momentum conservation:
where stands for density, p for pressure, for velocity, and for viscosity. , is external force, Q is the fluid source for the stress tensor, I is unit tensor, and is gravity.
The interaction of waves and a rigid spherical buoy makes the flow turbulent, which means that the N-S equations can not be directly used. The two common approaches that can overcome that problem are the implementation of the Boussinesq approach and using Reynolds Averaged N-S (RANS) and Scale-Resolving Simulation. The first mentioned utilizes the time-averaged values and their fluctuation, which transforms the governing N-S equations into RANS equations in a way that any scalar quantities can be presented as their mean value and fluctuations over that value:
where corresponds to the time-averaged quantity, while designates the deviation from the mean value.
Under the assumptions of no mass transfer between fluid phases and the absence of external forces, the source term in Equation (1) Q becomes zero, and the force vector in Equation (2) vanishes. Accordingly, the time-averaged continuity equation in Cartesian coordinates can be expressed as
In the same manner, the time-averaged momentum conservation equation is formulated as
The transformation of the N-S equation into RANS adds the additional term , which is called Reynolds Stress and is expressed as
where is the Kronecker delta:
The RANS equations can be closed by implementing a turbulence model. The historically first model, known as k– due to its nature and drawbacks, could not be directly used in the simulation of flow over the submerged spherical buoy. Other turbulence models that overcome the typical problems of the mentioned model, like modification of the k– known as the Shear Stress Transport (), seem to be effective enough to meet the objective of this research. The study [33] proved the usefulness of the model in the simulation of flow over a cylinder. The initial simulations that were made in this research showed comparable results of the k– model with the Reynolds Stress Model. The Scale-Resolving Simulation, due to the model size, its complexity, and its computational effort, was not implemented in the CFD simulations in this study. The model can be described starting from the turbulence kinetic energy, k, in the k– model, which is described as
The specific dissipation rate is
The effective diffusivity for k and in the above equations can be expressed as
The turbulent viscosity () is expressed by
The S stands for the strain rate magnitude, while is the low number correction coefficient, which is expressed as
where
In the above, .
When the Reynolds number reaches high values, .
In the above, y denotes the distance to the nearest surface, while is expressed as
In Equation (11), the production of is represented by
To model the flow near boundaries, the wall functions are employed. The standard wall function, in this context, defines the mean velocity adjacent to the walls as
where is a dimensionless velocity:
and is a dimensionless distance from the wall:
The flow over a partially submerged buoy is a typical multiphase flow problem with the free surface between air and water. The interface between them can be predicted by the utilization of Volume of Fluid (VOF) techniques, which use an Eulerian grid to simulate each fraction (air and water) in the computational domain. Assuming that there is no additional source term and no mass transfer between fractions, the mass conservation Equation (1) can be formulated as follows:
The here represents a volume fraction of fluid, while the index denotes the number of fluids. The may have the following values:
- it equals 0 if the first fluid is not present in the cell;
- it equals 1 if a cell is entirely filled with the first fluid;
- it is a value between 0 and 1 when the interface between fluids exists in the cell.
Forces which are induced by fluid flow are calculated by the following expression:
where k stands for cell surfaces at the considered wall, while n represents the normal vector to the cell.
The CFD simulations in this research were conducted in the Ansys Fluent 2022 CFD simulation package. A flow over the half-submerged spherical buoy was conducted for half of the model, whose domain is presented in Figure 1. The fluid domain was sliced in order to create an initial structural grid, which was later adapted. The following assumptions were used in the simulations:
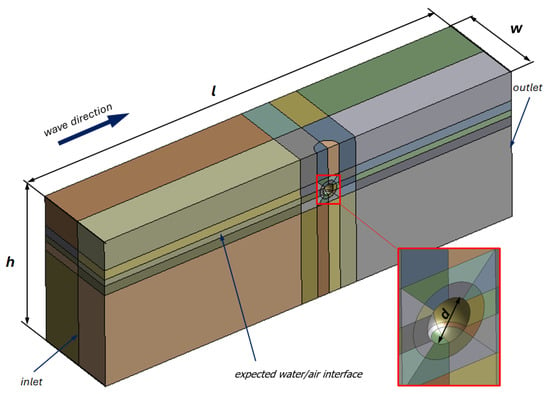
Figure 1.
Fluid domain: spherical bouy diameter d = 0.25 [m]; fluid domain length l depends on wavelength; width w = 10 d and height h = 14 d; the free surface level is 2.5 [m] from the bottom.
- Fluid domain size was set to avoid the influence of boundary conditions on the flow over the buoy and allow full development of waves before they reached the buoy; the fluid domain varied depending on wavelength;
- A Multiphase flow of air and water with a VOF approach was implemented;
- The fluid domain included a damping zone at the end to avoid backflow;
- A transient Multiphase flow of air and water with a VOF approach was implemented;
- There was no mass or heat transfer between both fractions;
- Both fractions were homogeneous fluids with constant properties;
- Air properties were used for normal ambient temperature, while water was used for seawater at a normal ambient temperature;
- The k– turbulence model was implemented;
- The solver used PISO algorithm;
- The surface tension was omitted;
- The time step was adjusted to flow conditions and cell size; a maximum of 20 iterations was used for a time step;
- The inlet and outlet used an open channel boundary condition, whose details were adjusted to the wave pattern.
A sliced geometry allowed the creation of a structured initial grid, which was later refined around the buoy and in the region of the estimated interface between the two fractions. The example of a refined grid is presented in Figure 2.
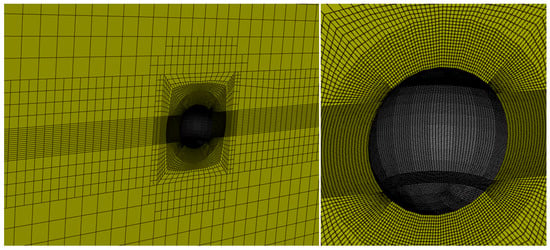
Figure 2.
Refined grid.
The cell size was set based on the initial simulation for steady state conditions, when the number of cells on a spherical buoy was refined until the difference in the recorded force was less than 3%. Figure 3 shows the grid sensitivity plot and the number of cells on a spherical buoy. Table 1 shows the force value for different grid versions and the normalized force value.
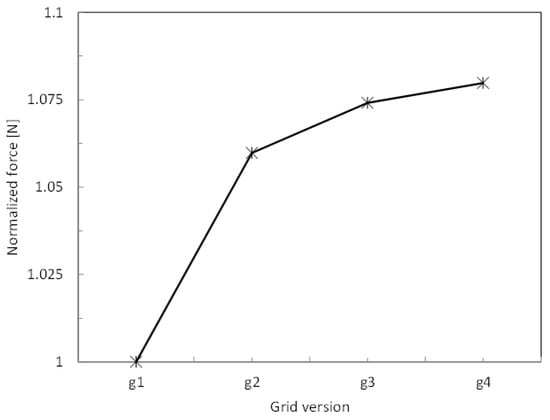
Figure 3.
Grid sensitivity plot.

Table 1.
Grid sensitivity results.
The drag and lift forces were recorded throughout the simulations. The subsequent sections present these results in comparison with experimental measurements.
2.2. Experimental Test
Experiments were performed in the MarinLab, a test facility of Western Norway University of Applied Sciences. The hydrodynamic tests were carried out on a tank with a length of 50 [m], a height of 2.2 [m], and a width of 3 [m], which is illustrated in Figure 4.
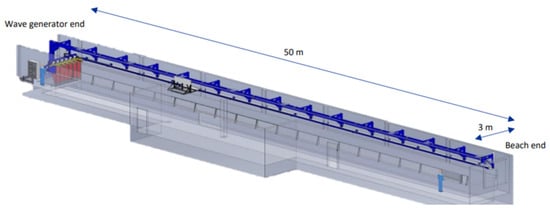
Figure 4.
Experimental test facility.
The experimental tests were carried out on a test setup equipped with a wave generator. The testing tank is equipped with a towing carriage capable of a maximum acceleration of 1.2 [m/s2] and speed of 5 [m/s]. The wave generator consists of wave paddles, capable of producing waves up to 0.5 [m] in height at wave periods near 2 [s]. The paddles are controlled via a force-feedback system, which enables damping of wave reflections. They can generate both regular and irregular waves based on JONSWAP [34], Bretschneider [35], and Pierson–Moskowitz spectra [36,37].
On the other tank end, a passive beach is installed. Its aim is to break the waves and absorb the incoming waves to eliminate wave reflections. The test setup is a structure that keeps the tested spherical buoy in a proper position and allows transferring vertical and horizontal forces into the load cells. It is realized by aluminum profiles, which are attached on one side to two load cells arranged orthogonally and to a buoy on the other side. The load cells measure the horizontal (drag) and vertical (lift) forces. The structure with load cells and the buoy is attached to the carriage. The buoy is half-submerged, but it has no neutral buoyancy. The initial vertical loads were eliminated from the measurements by zeroing the load cell in the vertical direction. The tested spherical buoy and load cells attachments in the testing tank are presented in Figure 5.
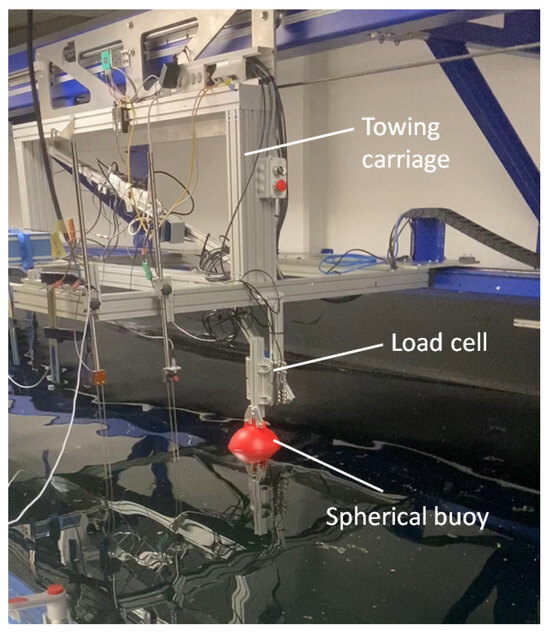
Figure 5.
Test tank with attached spherical buoy.
The experimental setup employed the following equipment:
- Load cells, DBBSM-003-000 type with accuracy of 0.03% by Applied Measurements LTD, Reading, UK;
- Data acquisition DAQ unit in LabView by National Instruments, Austin, TX, USA;
- Wave gauges WG8USB by Edinburgh Designs, Loanhead, UK;
- Spherical buoy with a diameter of 0.25 [m].
Before the experimental tests, the load cells were calibrated. The calibration procedure was conducted according to ITTC recommendations [38,39]. The results of the calibration are presented in Figure 6.
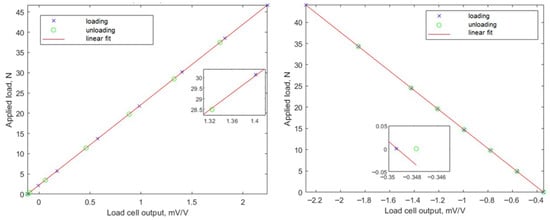
Figure 6.
Calibration of load cells. (Left) load cell for drag force. (Right) load cell for lift force.
Maximal errors to the linear fit curve are presented in Table 2.

Table 2.
Maximal errors of load cells.
The maximal error for load cells to the linear fit was 0.135% of nominal capacity.
As the load cells are subjected to the dynamic load induced by waves, the structure that was attached to the carriage was checked for its dynamic properties. The Finite Element Method simulation and Modal analysis were used to check the structure’s natural frequencies. The modal simulation showed that the first natural frequency is equal to 7.2 [Hz], and it is much beyond the frequency of waves during experimental tests.
Both load cells were additionally verified after the experimental test to verify the initial calibration.
3. Results
3.1. Experimental Results
The experimental tests were conducted for the following cases:
- Case 1 wave parameters: height 0.8 [m] and frequency 0.3 [Hz];
- Case 2 wave parameters: height 0.12 [m] and frequency 0.4 [Hz];
- Case 3 wave parameters: height 0.16 [m] and frequency 0.5 [Hz].
In all cases, the spherical buoy was half-submerged. The examples of recorded forces on a spherical buoy for Case 1 are presented in Figure 7. The initial stage of experiments, marked by a red color, represents the period when wave patterns are forming until they become stable. Therefore, this period was excluded, and time was restarted. The results of drag and lift forces for Case 2 and Case 3 are presented in Figure 8. Those results present only the stable period with a regular wave pattern.
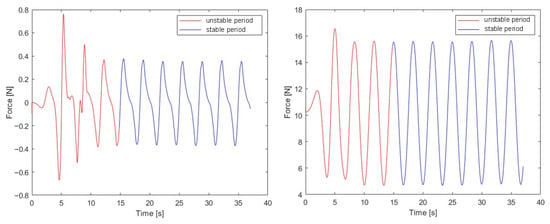
Figure 7.
Drag (left) and lift forces (right) for Case 1.
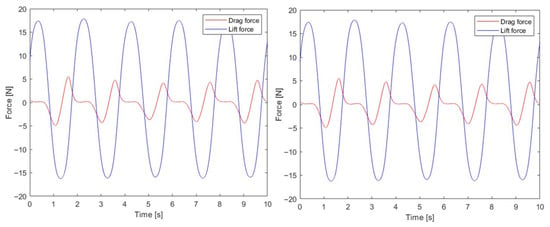
Figure 8.
Drag and lift forces for Case 2 (left) and Case 3 (right).
3.2. Comparison of Experimental Test and CFD Simulation
The drag and lift forces obtained in the CFD simulations were compared with those from the experimental tests. Figure 9, Figure 10 and Figure 11 presents a comparison of the CFD results and experiments for Case 1, Case 2, and Case 3, respectively. What can be observed is that both drag and lift force patterns are the same for the CFD and experimental tests. The difference between the experimental test and CFD simulation is the smallest for Case 1. The difference rises when the wave height rises.
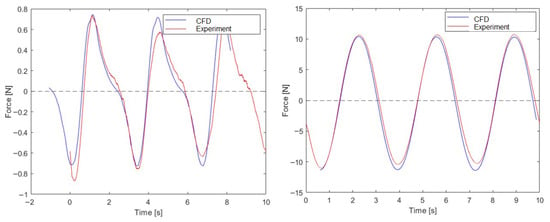
Figure 9.
Drag (left) and lift (right) forces for Case 1.
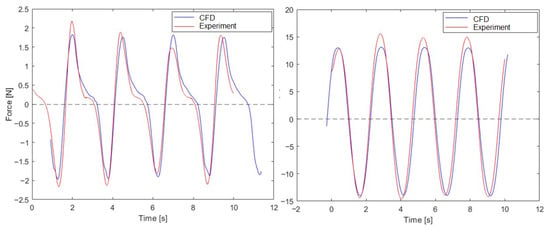
Figure 10.
Drag (left) and lift (right) forces for Case 2.
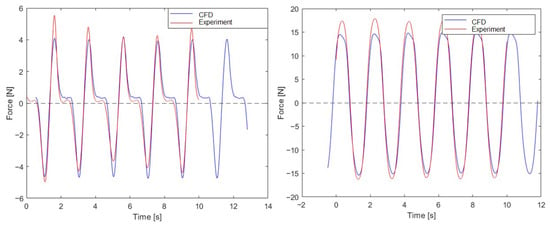
Figure 11.
Drag (left) and lift (right) forces for Case 3.
The detailed comparison of drag and lift forces is presented in Table 3 and Table 4. The maximal values from the experiments are the average values during the stable periods.

Table 3.
Drag forces from CFD and experiments in [N].

Table 4.
Lift forces from CFD and experiments in [N].
The results presented above show good consistency between experimental measurements and simulation results. Therefore, the CFD model was used for the simulation of flow over the buoy for other wave parameters. The drag and lift forces are presented in Figure 12 and Figure 13.
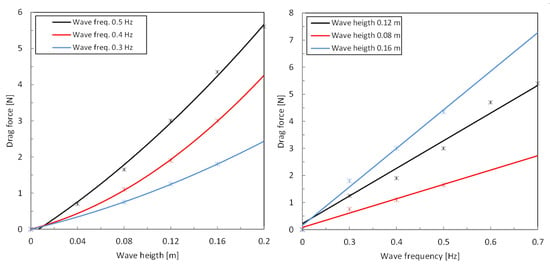
Figure 12.
Drag force. (Left) is a constant frequency. (Right) is a constant wave load.
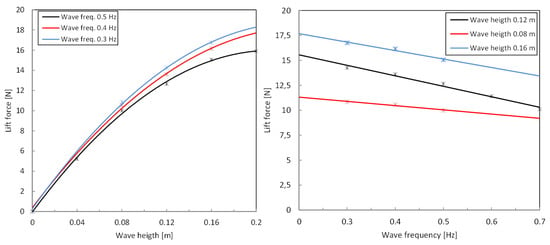
Figure 13.
Lift force. (Left) constant frequency. (Right) constant wave load.
The CFD simulations were made for wave heights of 0.08, 0.12, and 0.16 [m] and frequencies 0.3, 0.4, and 0.5 [Hz].
The drag and lift forces for various wave heights and frequencies are presented in Figure 12 and Figure 13, with a focus on the height effect on the left-hand side and the frequency effect on the right-hand side. The wave frequency affects the drag and lift forces linearly, while the wave height affects the loads in a second-order polynomial.
4. Discussion
The test’s experimental results show that the lift force has almost the same pattern for each wave. The minimal and maximal values are nearly the same for all waves. For the drag force, we can observe a little deviation in the maximal/minimal values for each wave. That was the reason why the average values of the experimental test were used for comparison. The differences between peak values rise when the wave height increases. And those peak values form a sinusoidal-like shape, presented in Figure 14.
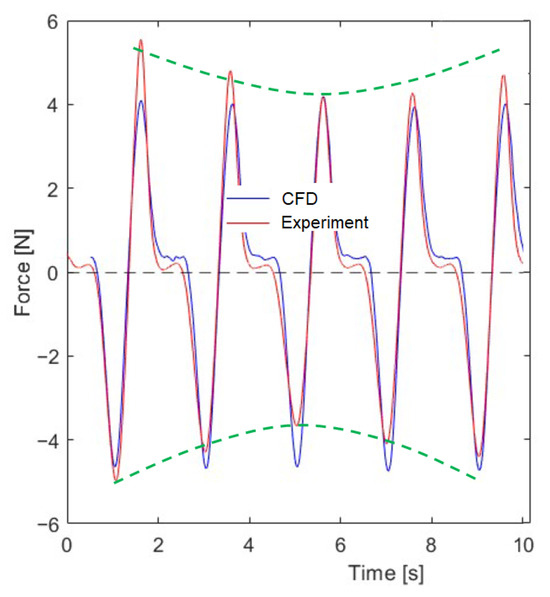
Figure 14.
Pattern of the peaks of drag forces for Case 2.
The explanation of this can be an interaction with a back wave, which may happen even though the tank is equipped with a passive beach whose primary goal is to prevent wave reflections. Another explanation might be the structure on which the buoy is installed. The peaks of forces create a shape that might be generated by elastic oscillations of the structure holding the buoy, induced by waves that hit the buoy. Despite the fact that FEM simulations showed that the natural frequency is much higher than the wave frequencies, the real dynamic properties of the structure on which the buoy is fixed can be smaller due to the fixtures used. To avoid problems with periodic loads, the calibration procedure can be extended and prepared in the way it is shown in the study [40]. The prepared simulation model is adequate enough to capture phenomena that can appear during the interaction of waves and a partially submerged buoy. The assumed RANS approach and the k– turbulence model showed that the simulation results have good agreement with the experimental tests in terms of drag and lift force pattern and periodicity. The model is a good balance between computational effort and accuracy.
The results show that for a given wave height increase, the wave frequency causes a rise in the drag force. And, respectively, for a given frequency rise of wave height, there is a rise in the drag force. For a given wave height, lift force drops when the frequency rises. The results presented in this study are valid for the range of wave heights that is smaller than the floating buoy diameter.
5. Conclusions
This research presents CFD simulations and experimental tests on wave loads on a half-submerged buoy. The experimental tests were conducted at a testing facility with a wave generator and the ability to record lift and drag forces induced by waves. The tests were performed for various wave heights and periods. CFD simulations were used for predicting the interaction between waves and a half-submerged buoy.
The study concludes the following:
- The CFD model uses the RANS approach along with the k– turbulence model, and the VOF technique can evaluate drag and lift forces for a spherical buoy with a good approximation.
- The usability of the model is limited to the size of the spherical buoy and wave height. The wave height should be smaller than the buoy diameter.
- The obtained drag and lift forces can be used for the calculation of wave energy extracted by a floating object, i.e., a spherical object.
The research can be extended to the investigation of partially submerged objects and their shapes, sizes, and submersion levels in terms of wave loads. That investigation can lead to finding the most effective method of wave energy harvesting.
Author Contributions
Conceptualization, S.B., M.D., and H.M.; methodology, E.C.D. and H.M.; validation, E.C.D. and M.D.; formal analysis, H.M.; investigation, E.C.D.; resources, S.B. and M.D.; data curation, E.C.D.; original draft preparation, M.D.; writing—review and editing, M.D.; visualization, E.C.D.; supervision, S.B. and H.M.; All authors have read and agreed to the published version of the manuscript.
Funding
This research received no external funding.
Data Availability Statement
Data is contained within the article.
Acknowledgments
The authors thank the staff of the MarinLab of Western Norway University of Applied Science for help on experimental tests.
Conflicts of Interest
The authors declare no conflicts of interest.
Abbreviations
The following abbreviations are used in this manuscript:
| CFD | Computational Fluid Dynamics |
| NS | Navier–Stokes equations |
| RANS | Reynolds Averaged Navier–Stokes equations |
| VOF | Volume of Fluid |
References
- Bihs, H.; Kamath, A.; Chella, M.A.; Aggarwal, A.; Arntsen, Ø.A. A new level set numerical wave tank with improved density interpolation for complex wave hydrodynamics. Comput. Fluids 2016, 140, 191–208. [Google Scholar] [CrossRef]
- Bai, W.; Taylor, R.E. Numerical simulation of fully nonlinear regular and focused wave diffraction around a vertical cylinder using domain decomposition. Appl. Ocean Res. 2007, 29, 55–71. [Google Scholar] [CrossRef]
- Mo, W.; Jensen, A.; Liu, P.L.-F. Plunging solitary wave and its interaction with a slender cylinder on a sloping beach. Ocean Eng. 2013, 74, 48–60. [Google Scholar] [CrossRef]
- Vested, M.V.; Carstensen, S.; Christensen, E.D. Experimental study of wave kinematics and wave load distribution on a vertical circular cylinder. Coast. Eng. 2020, 157, 103660. [Google Scholar] [CrossRef]
- Mockutė, A.; Marino, E.; Lugni, C.; Borri, C. Comparison of hydrodynamic loading models for vertical cylinders in nonlinear waves. Procedia Eng. 2017, 199, 3224–3229. [Google Scholar] [CrossRef]
- Ha, Y.-J.; Nam, B.W.; Kim, K.-H.; Hong, S.Y. CFD Simulations of Wave Impact Loads on a Truncated Circular Cylinder by Breaking Waves. Int. J. Offshore Polar Eng. 2019, 199, 306–314. [Google Scholar] [CrossRef]
- Chang, S.; Huang, W.; Sun, H.; Li, L. Numerical investigation of secondary load cycle and ringing response of a vertical cylinder. Appl. Ocean Res. 2019, 91, 101872. [Google Scholar] [CrossRef]
- Ha, Y.-J.; Kim, K.-H.; Nam, B.W.; Hong, S.Y. Experimental investigation for characteristics of wave impact loads on a vertical cylinder in breaking waves. Ocean Eng. 2020, 209, 107470. [Google Scholar] [CrossRef]
- Lee, S.; Kim, M.; Ko, K.; Hong, J.-W. Nondimensionalized semi-empirical equation to predict secondary load cycles on vertical cylinders of different diameters. Ocean Eng. 2021, 230, 108968. [Google Scholar] [CrossRef]
- Renaud, P.; Martin, M.B.; Hulin, F.; Harris, J.C.; Filipot, J.-F.; Scolan, Y.-M. Semi-analytical load models describing the progressive immersion of a fixed vertical cylinder in a breaking wave. Ocean Eng. 2023, 276, 114116. [Google Scholar] [CrossRef]
- Batlle Martin, M.; Harris, J.C.; Filipot, J.-F.; Hulin, F.; Tassin, A.; Renaud, P. Deep water focused breaking wave loads on a fixed cylinder. Coast. Eng. 2023, 186, 104397. [Google Scholar] [CrossRef]
- Xin, Z.; Li, X.; Li, Y. Coupled effects of wave and depth-dependent current interaction on loads on a bottom-fixed vertical slender cylinder. Coast. Eng. 2023, 183, 104304. [Google Scholar] [CrossRef]
- Chaplin, J.R.; Teigen, P. Steady flow past a vertical surface-piercing circular cylinder. J. Fluids Struct. 2003, 18, 271–285. [Google Scholar] [CrossRef]
- Gonçalves, R.T.; Franzini, G.R.; Rosetti, G.F.; Meneghini, J.R.; Fujarra, A.L.C. Flow around circular cylinders with very low aspect ratio. J. Fluids Struct. 2014, 54, 122–141. [Google Scholar] [CrossRef]
- Ren, H.; Xu, Y.; Zhang, M.; Deng, S.; Li, S.; Fu, S.; Sun, H. Hydrodynamic forces on a partially submerged cylinder at high Reynolds number in a steady flow. Appl. Ocean Res. 2019, 88, 160–169. [Google Scholar] [CrossRef]
- Ageorges, V.; Peixinho, J.; Perret, G.; Lartigue, G.; Moureau, V. Experiments and Simulations of Free-Surface Flow behind a Finite Height Rigid Vertical Cylinder. Fluids 2021, 6, 367. [Google Scholar] [CrossRef]
- Wu, T.-R.; Liu, P.-L.-F. Numerical Study on the Three-dimensional Dambreak Bore Interacting with a Square Cylinder. In Nonlinear Wave Dynamics; World Scientific: Singapore, 2009. [Google Scholar] [CrossRef]
- Lader, P.; Enerhaug, B.; Fredheim, A.; Klebert, P.; Pettersen, B. Forces on a cruciform/sphere structure in uniform current. Ocean Eng. 2014, 82, 180–190. [Google Scholar] [CrossRef]
- Banks, M.; Abdussamie, N. The response of a semisubmersible model under focused wave groups: Experimental investigation. J. Ocean Eng. Sci. 2017, 2, 161–171. [Google Scholar] [CrossRef]
- Chen, H.; Christensen, E.D. Simulating the hydrodynamic response of a floater–net system in current and waves. J. Fluids Struct. 2018, 79, 50–75. [Google Scholar] [CrossRef]
- Liu, B.; Fu, D.; Zhang, Y.; Chen, X. Experimental and numerical study on the wave force calculation of a partially immersed horizontal cylindrical float. Int. J. Nav. Archit. Ocean Eng. 2020, 12, 733–742. [Google Scholar] [CrossRef]
- Pestana, R.G.; Fonseca de Carvalho e Silva, D.; Do Nascimento Gomes, C.; De Oliveira Carvalho, L.; Vileti, V.; De Tarso Themistocles Esperança, P.; Kim, M. Subsea manifold installation: Operational windows estimation based on hydrodynamic model testing. Ocean Eng. 2020, 219, 108364. [Google Scholar] [CrossRef]
- Liang, X.; Liu, Z.; Huang, D.; Wang, T.; Wang, C. Experimental and numerical investigation of the drag coefficients of subsea tree. Ocean Eng. 2021, 238, 109701. [Google Scholar] [CrossRef]
- Domagala, M.; Larsson Aga, H.; Bikass, S.; Momeni, H.; Stenfelt, G. CFD Estimation of a Resistance Coefficient for an Egg-Shaped Geometric Dome. Appl. Sci. 2022, 12, 10780. [Google Scholar] [CrossRef]
- Xiang, G.; Guedes Soares, C. A CFD approach for numerical assessment of hydrodynamic coefficients of an inclined prism near the sea bottom. Ocean Eng. 2022, 252, 111140. [Google Scholar] [CrossRef]
- Cheng, Y.; Duan, D.; Liu, X.; Yang, X.; Zhang, H.; Han, Q. Numerical study on hydrodynamic performance of underwater manipulator in the subcritical region. Ocean Eng. 2022, 262, 112214. [Google Scholar] [CrossRef]
- Chen, L.F.; Zang, J.; Hillis, A.J.; Morgan, G.C.J.; Plummer, A.R. Numerical investigation of wave–structure interaction using OpenFOAM. Ocean Eng. 2014, 88, 91–109. [Google Scholar] [CrossRef]
- Liu, Z.; Zhao, W.; Wan, D. CFD study of wave interaction with single and two tandem circular cylinders. Ocean Eng. 2021, 239, 109855. [Google Scholar] [CrossRef]
- Islam, H.; Guedes Soares, C. Assessment of uncertainty in the CFD simulation of the wave-induced loads on a vertical cylinder. Mar. Struct. 2021, 80, 103088. [Google Scholar] [CrossRef]
- Tang, T.; Ryan, G.; Ding, H.; Chen, X.; Zang, J.; Taylor, P.H.; Adcock, T.A. A new Gaussian Process based model for non-linear wave loading on vertical cylinders. Coast. Eng. 2021, 188, 104427. [Google Scholar] [CrossRef]
- James, M.; Forrester, A.; Hudson, D.; Taunton, D.; Turnock, S. Experimental study of the transitional flow of a sphere located at the free surface. In Proceedings of the 9th International Workshop on Ship and Marine Hydrodynamics, Glasgow, UK, 25–26 August 2015. [Google Scholar]
- Batchelor, G.K. An Introduction to Fluid Dynamics; Cambridge University Press: Cambridge, UK, 1967. [Google Scholar]
- Son, H.A.; Lee, S.; Lee, J. Numerical Analysis of Drag Force Acting on 2D Cylinder Immersed in Accelerated Flow. Water 2020, 12, 1790. [Google Scholar] [CrossRef]
- Hasselmann, K.; Barnett, T.P.; Bouws, E.; Carlson, H.; Cartwright, D.E.; Enke, K.; Ewing, J.A.; Gienapp, H.; Hasselmann, D.E.; Kruseman, P.; et al. Measurements of Wind-Wave Growth and Swell Decay during the Joint North Sea Wave Project (JONSWAP). Dtsch. Hydrogr. Z. 1973, 12, 1–95. [Google Scholar]
- Bretschneider, C.L.; Crutcher, H.L.; Darbyshire, J.; Neumann, G.; Pierson, W.J.; Walden, H.; Wilson, B.W. Data for High Wave Conditions Observed by the OWS WEATHER REPORTER in December 1959. Dtsch. Hydrogr. Z. 1962, 15, 243–255. [Google Scholar] [CrossRef]
- Moskowitz, L. Estimates of the power spectrums for fully- developed seas for wind speeds of 20 to 40 knots. J. Geophys. Res. 1964, 69, 5161–5179. [Google Scholar] [CrossRef]
- Pierson, W.J. The interpretation of wave spectrum in terms of the wind profile instead of the wind measured at a constant height. J. Geophys. Res. 1964, 69, 5191–5203. [Google Scholar] [CrossRef]
- ITTC. Recommended Procedures and Guidelines 7.6-02-09. Work Instructions, Calibration of Load Cells; ITTC: Singapore, 2002. [Google Scholar]
- International Towing Tank Conference (ITTC). Resistance Test. In Recommended Procedures and Guidelines; 7.5-02-02-01; ITTC: Singapore, 2021; Available online: https://www.ittc.info/media/9595/75-02-02-01.pdf (accessed on 15 September 2025).
- Sun, Z.; Yao, Q.; Jin, H.; Xu, Y.; Hang, W.; Chen, H.; Li, K.; Shi, L.; Gu, J.; Zhang, Q.; et al. A novel in-situ sensor calibration method for building thermal systems based on virtual samples and autoencoder. Energy 2024, 297, 131314. [Google Scholar] [CrossRef]
Disclaimer/Publisher’s Note: The statements, opinions and data contained in all publications are solely those of the individual author(s) and contributor(s) and not of MDPI and/or the editor(s). MDPI and/or the editor(s) disclaim responsibility for any injury to people or property resulting from any ideas, methods, instructions or products referred to in the content. |
© 2025 by the authors. Licensee MDPI, Basel, Switzerland. This article is an open access article distributed under the terms and conditions of the Creative Commons Attribution (CC BY) license (https://creativecommons.org/licenses/by/4.0/).