Article

Predicting the Temperature Rise in Oil-Immersed Transformers Based on the Identification of Thermal Circuit Model Parameters

1
Zhejiang Huadian Equipment Testing and Research Institute Co., Ltd., Hangzhou 310022, China
2
State Grid Zhejiang Electric Power Co., Ltd. Materials Branch, Hangzhou 310022, China
3
State Key Lab of Electrical Insulation and Power Equipment, Xi’an Jiaotong University, Xi’an 710049, China
*
Author to whom correspondence should be addressed.
Energies 2025, 18(17), 4707; https://doi.org/10.3390/en18174707
Submission received: 9 July 2025 / Revised: 6 August 2025 / Accepted: 13 August 2025 / Published: 4 September 2025

Abstract

The temperature rise test for transformers is time-consuming, energy-intensive, and has low detection efficiency. To improve the efficiency of the temperature rise test and reduce energy consumption, this paper proposes a temperature rise prediction method for oil-immersed transformer windings. This method is based on identifying the parameters of a thermal circuit model. Firstly, a fifth-order thermal circuit model of oil-immersed transformers is put forward. Then, based on a two-hour temperature rise curve, the thermal capacity and resistance model is identified through genetic algorithms. The obtained parameters are used to compute the temperature rise curve, steady-state average temperature rise, and top oil temperature rise. The results show that the heat capacities of the low-voltage (LV) winding, high-voltage (HV) winding, oil tank, and oil of a 400 kVA transformer are approximately 50 kJ/K, 75 kJ/K, 320 kJ/K, and 90 kJ/K, respectively. Additionally, the thermal resistances from the LV winding to oil, HV winding to oil, oil tank, and air are about 8 mK/W, 5 mK/W, 1 mK/W, and 11 mK/W, respectively. When the transformer capacity increases, the heating power of the windings escalates, and the oil resistance of HV windings decreases from 8 mK/W for a 400 kVA capacity to 5 mK/W for an 800 kVA capacity. The absolute prediction error for transformers of 400 kVA, 630 kVA, and 800 kVA is 2.9 °C. These findings can facilitate the swift detection and assessment of the winding temperature rise in oil-immersed transformers.

1. Introduction

The temperature rise test, as an important means to evaluate thermal stability and insulation life, is of great significance in transformer design and test assessment. However, the traditional temperature rise test usually lasts for dozens of hours, takes a long time, and consumes a lot of energy. It is urgent to establish a more efficient temperature rise test and thermal performance evaluation method to accelerate product verification and technical iteration.
Currently, the evaluation methods for the temperature rise performance of oil-immersed transformers are primarily categorized into Computational Fluid Dynamics (CFD) simulation, thermal path modeling, and direct measurement methods. Wen et al. utilized CFD simulation to calculate the detailed temperature distribution of oil-immersed transformer windings for the rapid solution of temperature rise [1,2]. However, such methods require the discretization of high-order nonlinear N-S equations. A single transient temperature rise solution takes several hours to compute. Additionally, the computational results depend on the transformer’s structure and material parameters, necessitating the establishment of simulation models for different transformers [3,4,5]. Equivalent thermal circuit models are widely used for steady-state temperature calculations in transformers due to their physical interpretability and computational efficiency. The core principle of the thermal circuit is to characterize the internal heat transfer process of the transformer through a thermal resistance–thermal capacitance network and deriving the calculation method for temperature nodes via a thermoelectric analogy. Low-order thermal circuit models simplify the transformer by treating oil and air as a lumped thermal resistance to establish the thermal circuit model. These models have two or three parameters and fast computation speeds, but they cannot calculate winding temperatures [6,7]. Third-order thermal circuit models, which consider both winding and top-layer oil temperatures, have better performance, but involve complex calculations of thermal capacitance and thermal resistance. The thermal network models perform distributed calculations on high- and low-voltage windings, enabling the determination of winding hotspot temperatures and their specific locations. However, such methods involve numerous parameters, result in significant computational loads, and are susceptible to variations in transformer winding configurations and cooling methods, leading to large computational errors that limit their engineering applications [8,9,10,11]. Direct temperature measurement is only applicable in simulated devices or in the oil flow at the top and bottom layers of the transformer, and cannot be directly applied to measuring the temperature of the transformer windings [12,13,14,15].
Based on this, the study developed a fifth-order thermal circuit model that considers the core and winding losses of transformers at high and low voltages. Genetic algorithm r is used to identifying the thermal capacity and thermal resistance parameters of the thermal circuit model using two-hour temperature rise curve data. Then identified parameters are used to predict the steady-state transformer’s temperature rise. This yielded three key technical parameters are the temperature rise in the high-voltage winding, the temperature rise in the low-voltage winding, and the temperature rise in the top layer of oil in oil-immersed transformers. These parameters enable the evaluation of transformers’ thermal performance. The research methods presented in this paper can be used to rapidly detect and evaluate the winding temperature rise in oil-immersed transformers.

2. Hot Circuit Model Parameter Identification and Winding Temperature Rise Prediction

2.1. Internal Heat Conduction Process of Transformers

In oil-immersed transformers, the primary heat sources are windings and the core. Copper losses in the windings are attributed to the Joule heat generated when currents flow through the windings [16,17,18]. The core’s hysteresis and eddy current losses stem from the alternating magnetic field. During operation, the heat generated by losses in silicon steel sheets and conductors is transferred to their surfaces via solid heat conduction, causing an increase in the surface temperature [19,20,21]. The surface heats the oil that transfers heat from the transformer interior to the oil tank and radiator fins via thermal convection. The oil tank and external radiators then dissipate heat to the surrounding air through convective cooling and radiation [22,23,24,25,26]. Hence, the transformer’s internal heat conduction process is characterized by a sequence of events that includes winding (core) → oil → oil tank (radiator fins) → environment (air).
The above heat dissipation is often analyzed through the thermal circuit model. Such models are similar to the electric circuit model. The definitions and corresponding relationships of parameters in the thermoelectric analogy method are shown in Table 1. The heat sources can be regarded as a current source. Therefore, the temperature is similar to the voltage on the resistor, whose value is determined by the thermal resistance. The thermal capacitor works as the capacitance to absorb and release the heat from circuits.

2.2. Fifth-Order Thermal Circuit Modeling of Oil-Immersed Transformers

Based on the above physical processes, the losses in the high-voltage and low-voltage windings and the no-load losses of the transformer are treated as three ideal heat sources; the ambient temperature is analogized as an ideal temperature source and the heat transfer between the transformer core, windings, oil, and external air is analogized to the resistance and capacitance in a circuit [27,28,29]. The five-order thermal circuit model of the transformer is shown in Figure 1.
The model parameters are defined as shown in Table 2. QC, QWL, and QWH represent the losses of the transformer core, low-voltage winding, and high-voltage winding, respectively, with units in W; CC, CWL, CWH, CO, and CT represent the equivalent thermal capacities of the core, low-voltage winding, high-voltage winding, oil, and oil tank, respectively, with units in J/K; RC-O, RWL-O, RWH-O, RO-T, and RT-A represent the thermal resistance between the core and oil, low-voltage winding and oil, high-voltage winding and oil, oil and oil tank, and oil tank and environment, respectively, with units in K/W; TC, TWL, TWH, TO, TT, and TA represent the average temperature of the transformer core, low-voltage winding, high-voltage winding, top oil layer, oil tank, and environment, respectively, with units in K.
The impact of core temperature on lifespan is negligible, since the core’s losses are lower than those of the windings and the core has better heat dissipation than the windings. Consequently, when solving the thermal circuit model equations in practice, the thermal resistance between the core and oil is ignored. According to the aforementioned thermal circuit model, the subsequent system of differential equations can be formulated:
Q W L = C W L d T W L d t + T W L T O R W L O
Q W H = C WH d T W H d t + T W H T O R W H O
Q C + T W L T O R W L O + T W H T O R W H O = C O d T O d t + T O T T R O T
T O T T R O T = C T d T T d t + T T T A R T A
Since the ratio of resistance loss, eddy current loss, and stray loss to the total loss of each winding is approximately 85%, 10%, and 5%, respectively, the losses in the high-voltage and low-voltage windings are directly proportional to the direct resistance loss. The proportion of these losses to the total load loss is as follows:
Q W H = P W H D C P W H D C + P W L D C Q W , Q W L = P W L D C P W H D C + P W L D C Q W
Among them, QW is the load loss and PWHDC and PWLDC are the direct resistance losses of the high- and low-voltage windings, respectively.
From the above equation, it can be seen that the temperature rise in an oil-immersed transformer can be regarded as a multi-input, multi-output response system. If QC, QWL, QWH, and the ambient temperature TA are taken as input variables, and the parameters of the thermal circuit model are known, the temperature rise and steady-state temperature can be obtained by solving the above differential equations. Although references [30,31,32,33] provide formulas for calculating the thermal capacity and thermal resistance in the model using heat transfer theory, the complex internal structure of transformers brings difficulty in directly obtaining them.

2.3. Parameter Identification Methods

The top-layer oil temperature can be measured directly. Therefore, this paper uses the measured top-layer oil temperature as the parameter identification object, the power loss as the model input, and the calculated top-layer oil temperature as the output.
Genetic algorithms [34,35] exhibit strong global search capabilities, enabling them to avoid being trapped in local optima. The genetic algorithm parameter settings used are shown in Table 3. Through approximation with the measured top-layer oil temperature, the thermal capacity and thermal resistance parameters are continuously assessed for fitness, propagated to offspring, mutated, and re-adapted to continuously optimize the population until the optimal thermal capacity and thermal resistance parameters are obtained.
The specific implementation steps for identifying transformers’ thermal circuit parameters using genetic algorithms are as follows:
Step 1: Input parameters and initial values, including high- and low-voltage winding load losses, core losses, initial values of high- and low-voltage winding temperatures, initial value of top oil temperature, initial value of tank wall temperature, and ambient temperature value. Determine the initial thermal capacitance and thermal resistance values of the fifth-order thermal circuit model based on the transformer’s structural parameters. The formula for calculating these initial values is as follows:
C t h = m c p
R t h = L λ A
where m (kg) is the mass; cp (J/(kg·K)) is the specific thermal capacity; L (m) is the heat transfer path length; λ (W/(m·K)) is the thermal conductivity; and A (m2) is the heat transfer cross-sectional area. Due to the presence of contact thermal resistance between structures, the results calculated from Equations (6) and (7) are not absolute accurate values, but rather estimated initial values. These values facilitate parameter convergence, enhance computational efficiency, and reduce computational time;
Step 2: Use the Runge–Kutta method to solve the system of differential equations defined by Equations (1)–(5), obtaining the top-layer oil temperature curve;
Step 3: Use the error between the model’s response and the measured temperature as the objective function. The top-layer oil temperature at time n is related to the temperature at time n – 1 and the input power at time n, and can be expressed as follows:
T ( n ) = f n ( T ( n 1 ) , T A , Q C , Q W L , Q W H , x )
Then, the target error function can be expressed as follows:
R ( x ) = n = 1 N T ( n ) T O ( n ) 2
The root mean square error is expressed as follows:
R M S E = 1 n R ( x )
where TO(n) represents the measured temperature of the top-layer oil at time n, and x denotes the target vector parameters to be identified, where x = [CWH, CWL, CO, CT, RWH-O, RWL-O, RO-T, RT-A]. If a vector x whose elements are all non-negative exists, such that the objective function R(x) is minimized, i.e., the root mean square error (RMSE) is minimized, then the elements of x are equivalent thermal path parameters. The influence of contact thermal resistance between structures on the parameters is implicitly reflected in the identification results. Due to differences in the structural components of different transformers, the actual thermal path parameters may vary within a certain range. Therefore, the identification parameter range is set to 80–120% of its initial value to accelerate the convergence process of the algorithm;
Step 4: Output the identified thermal capacity and resistance.

2.4. Temperature Rise Calculation Method

Based on the identified thermal capacity and resistance, input power, and initial temperatures at each node, the ODE45 solver in MATLAB R2024a is used to calculate the temperature. The gradient (dT/dt) of top-layer oil temperature rise is calculated. When the temperature changes to lower than 1 K/h in three hours, the steady-state termination condition is triggered, and the calculation is stopped.
Based on the aforementioned parameter identification and temperature rise calculation methods, the temperature response curves and steady-state temperature rise in the transformer under any power input can be calculated.

3. Test Validation and Results

3.1. Temperature Rise Test Platform and Test Method

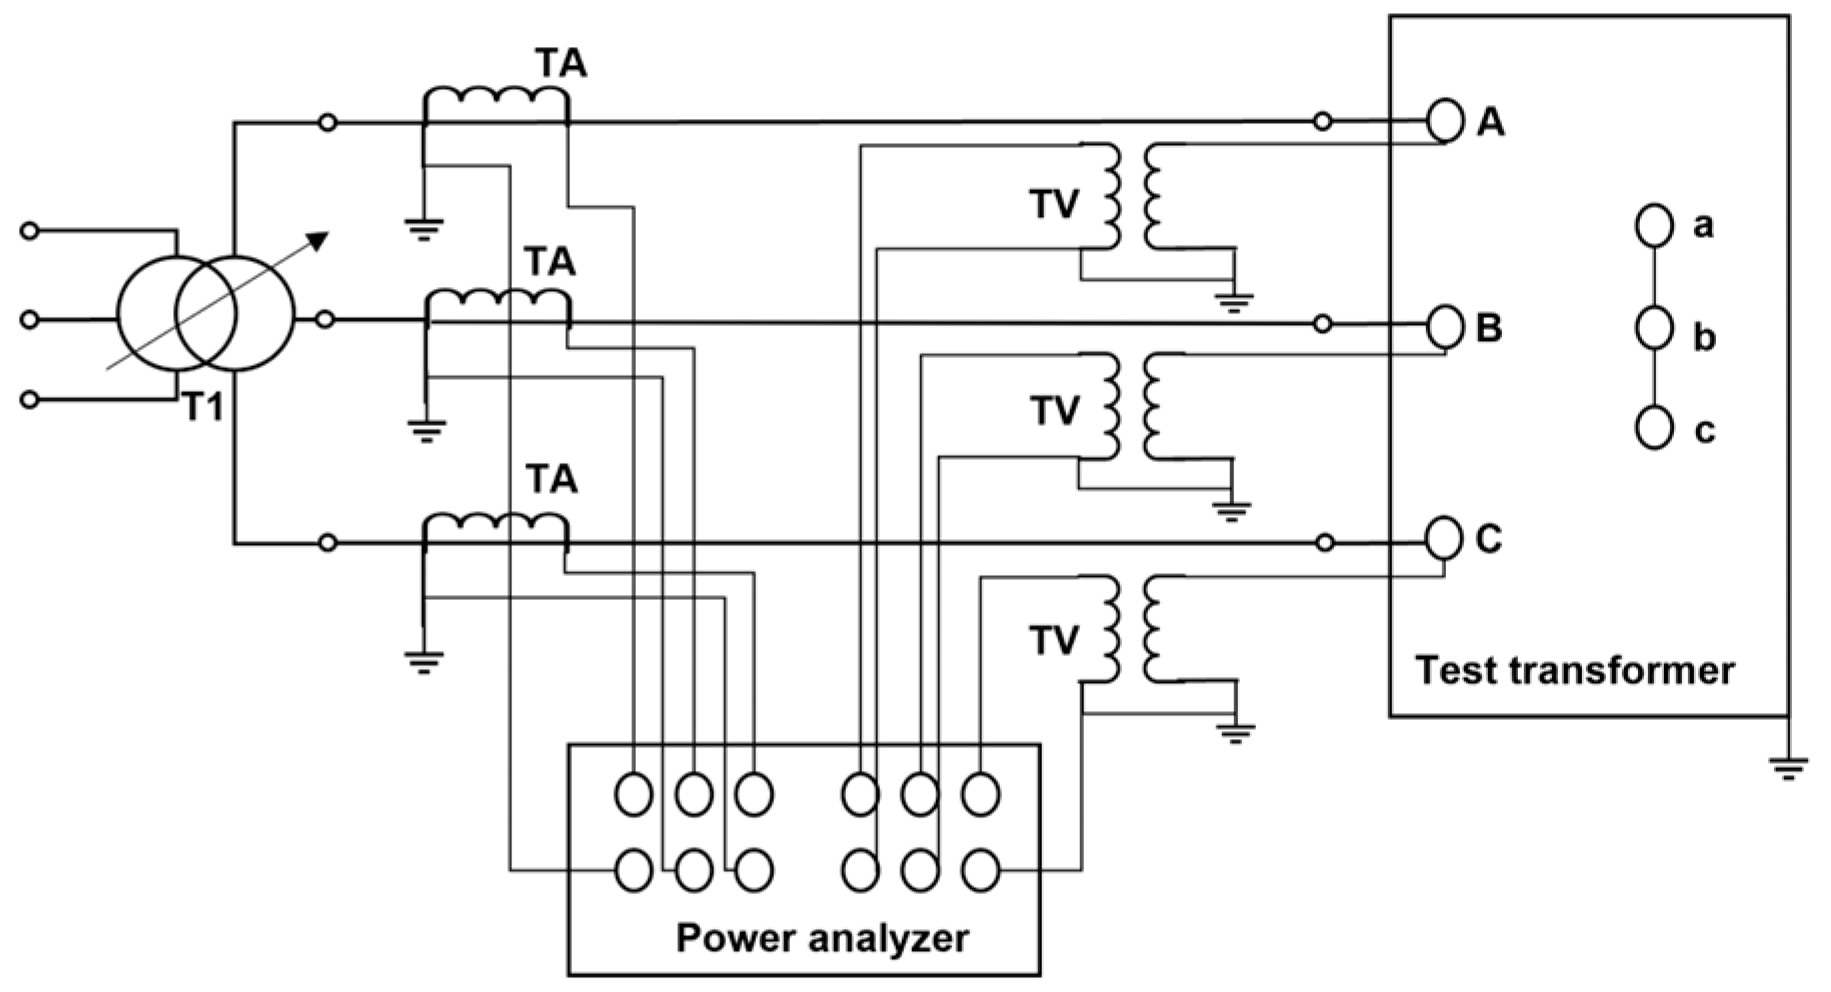
The diagram of the temperature rise test platform is shown in Figure 2.
In the temperature rise test, the LV winding of the tested transformer was short-circuited, and the high-voltage side was supplied with power. The voltage regulator T1 adjusted the voltage and current of the test transformer. The measurement accuracy of the voltage and current transformers (TA, TV) is both 0.2%. The power measurement error is <±0.5% (CosΦ > 0.1) and ±1.0% (0.05 < CosΦ < 0.1). In the test transformer, A, B, and C are the high-voltage side input terminals, while a, b, and c are the low-voltage side input terminals. The low-voltage side is in a short-circuited state.
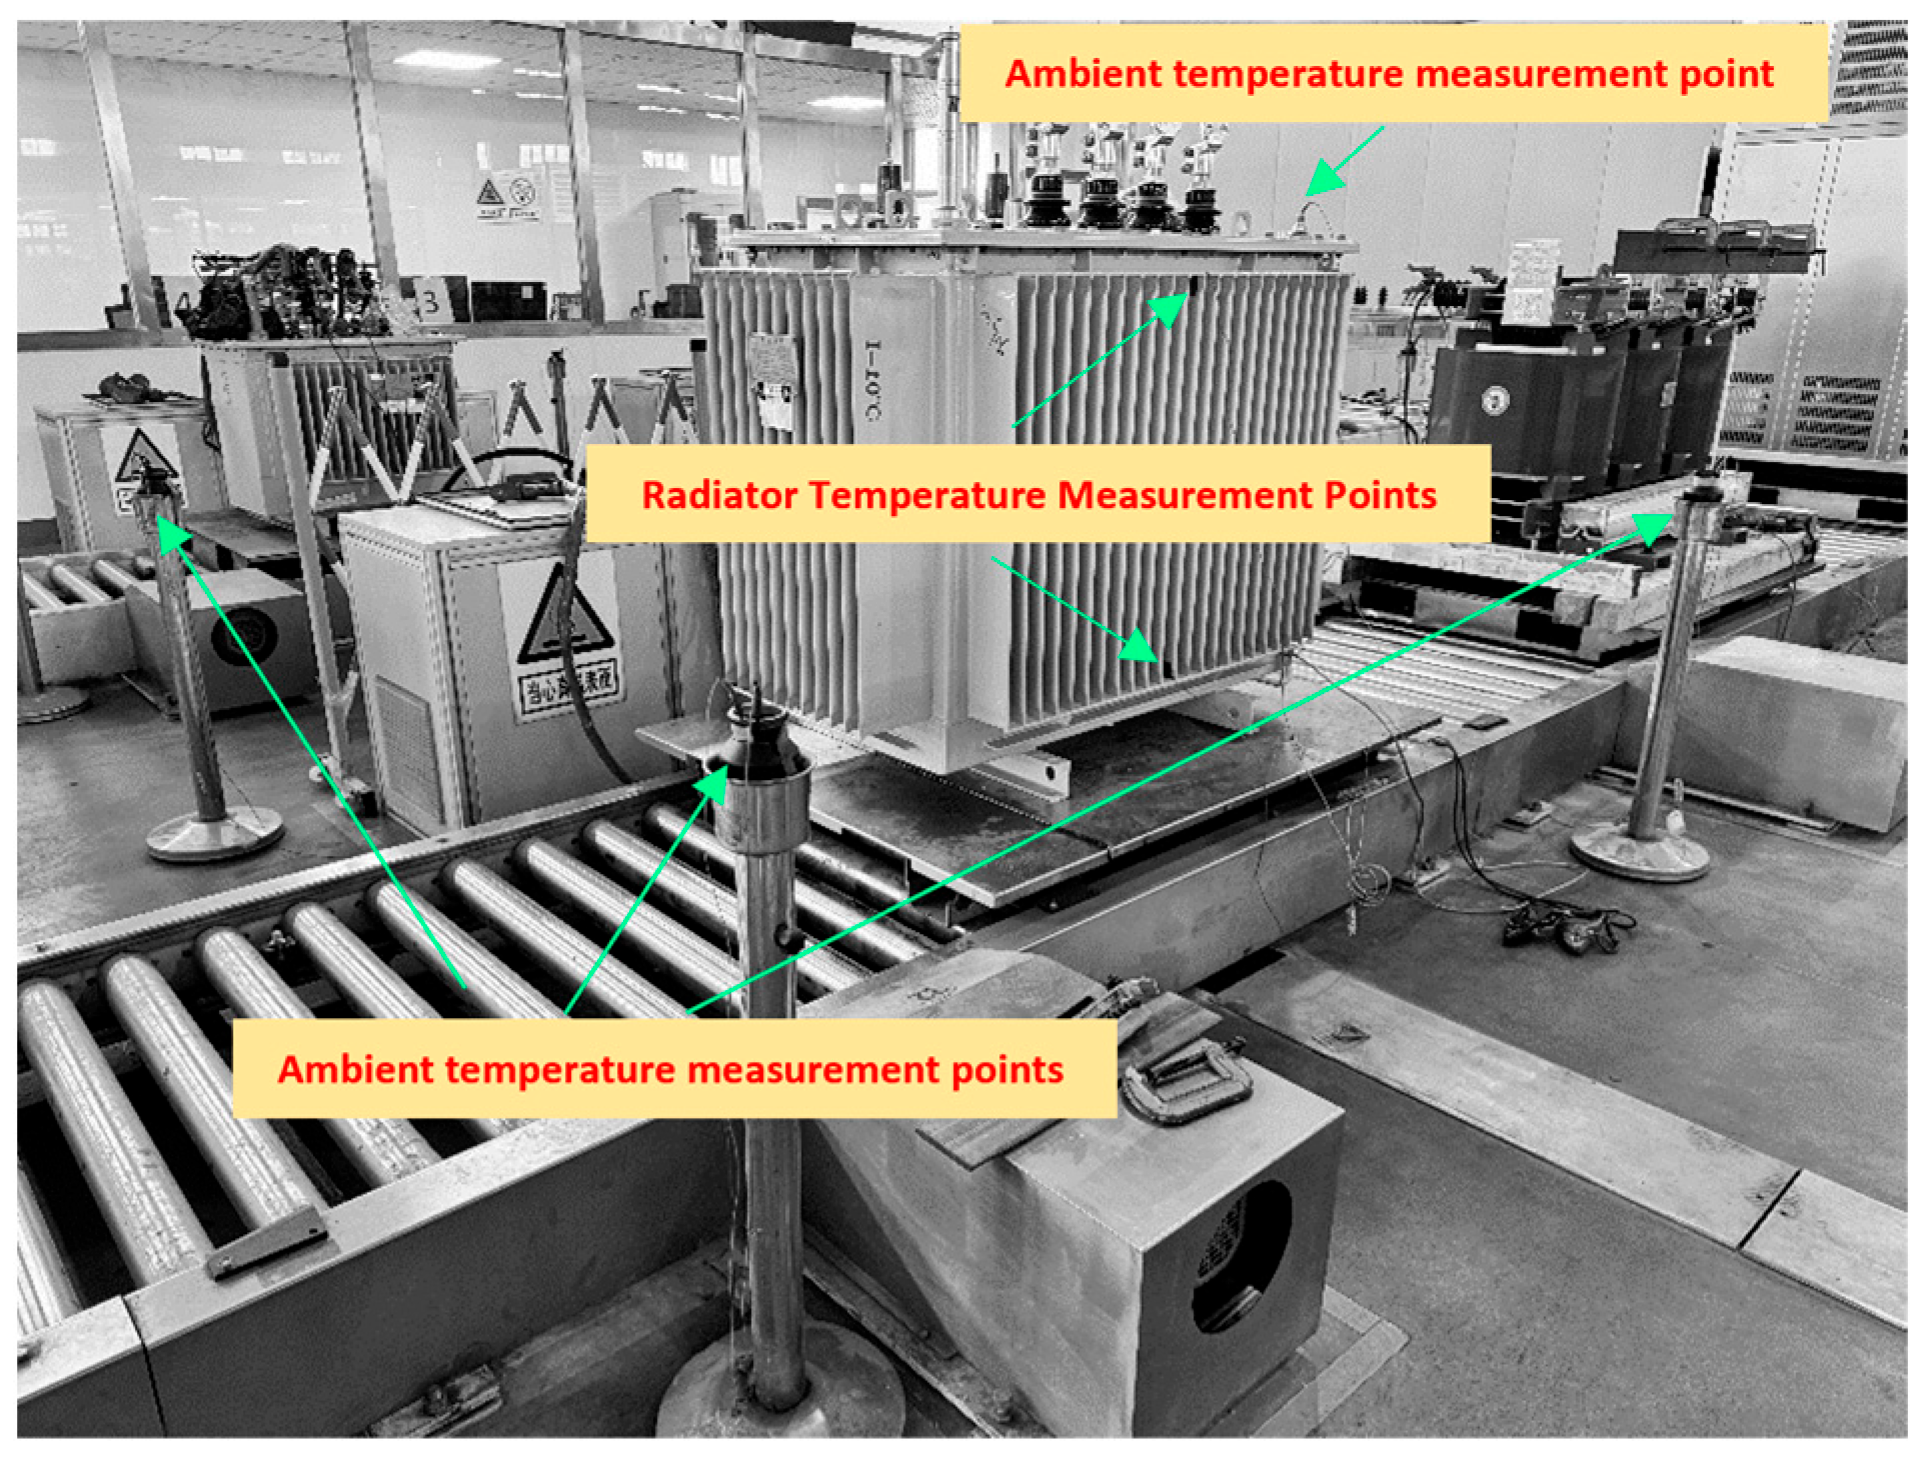
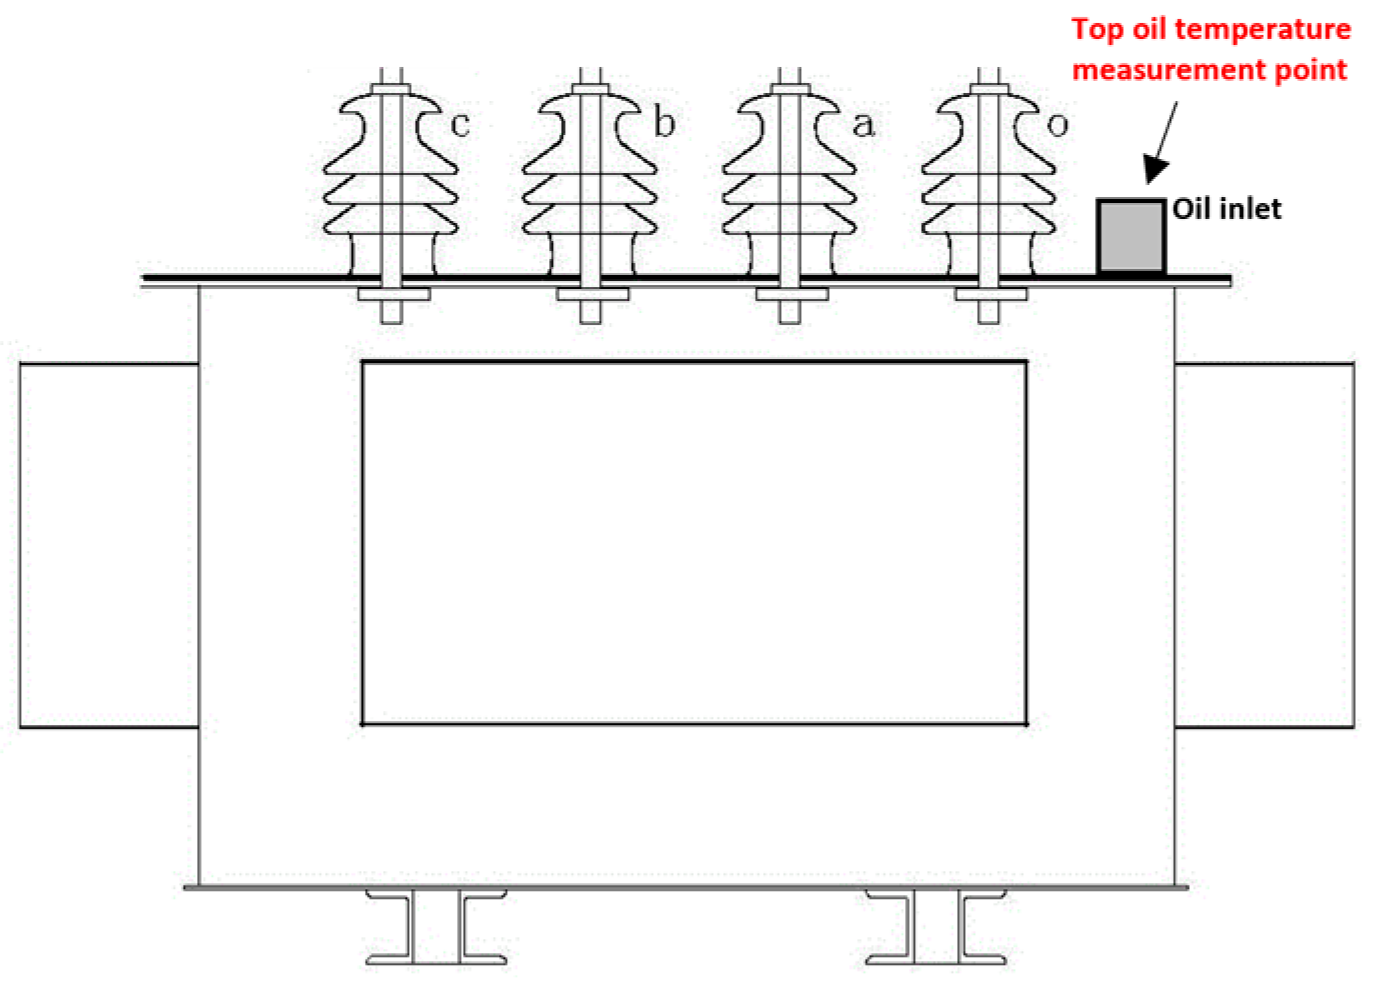
K-type thermocouple temperature sensors were used to measure temperature. The measurement accuracy of the thermocouples is ±0.2 °C. The location of the thermocouples is shown in Figure 3. Four environmental temperature measurement points were distributed around the test transformer. Their measured temperatures were averaged as the environmental temperature. Four measurement points were placed at the upper and lower ends of the radiators on the front and back of the transformer. Their measured temperatures were averaged as the oil temperature. One measurement point was located at the oil inlet of the transformer, as shown in Figure 4. Its measured temperature was taken as the top oil temperature. To guarantee the accuracy of the parameter identification results, the temperature measurement interval was set to 1 min.
The test is divided into the total loss stage and the rated current stage [36,37]. When the rate of change in the top oil temperature remains below 1 K/h for at least three hours, the test transitions from the total loss stage to the rated current stage. After one hour in the rated current stage, the power supply was quickly disconnected, and the short-circuit connection was disconnected. The resistance of the high-voltage and low-voltage windings is measured, and the average temperature rise in the high-voltage and low-voltage windings of the tested transformer is calculated using the measured winding resistance data. The measurement accuracy of the DC resistance is as follows: high-voltage 0.2% ± 1 μΩ; low-voltage 0.2% ± 0.2 μΩ, with a minimum resolution of 0.1 μΩ.
Using the established platform, tests and predictions were conducted on the temperature rise in nine distribution transformers (3 units each of 400 kVA, 630 kVA, and 800 kVA) from different manufacturers but with the same capacity. Their winding direct resistances are shown in Table 4. Both the high- and low-voltage windings use layered coils.

3.2. Model Parameter Identification Results

3.2.1. Thermal Capacity and Thermal Resistance of 400 kVA Transformers

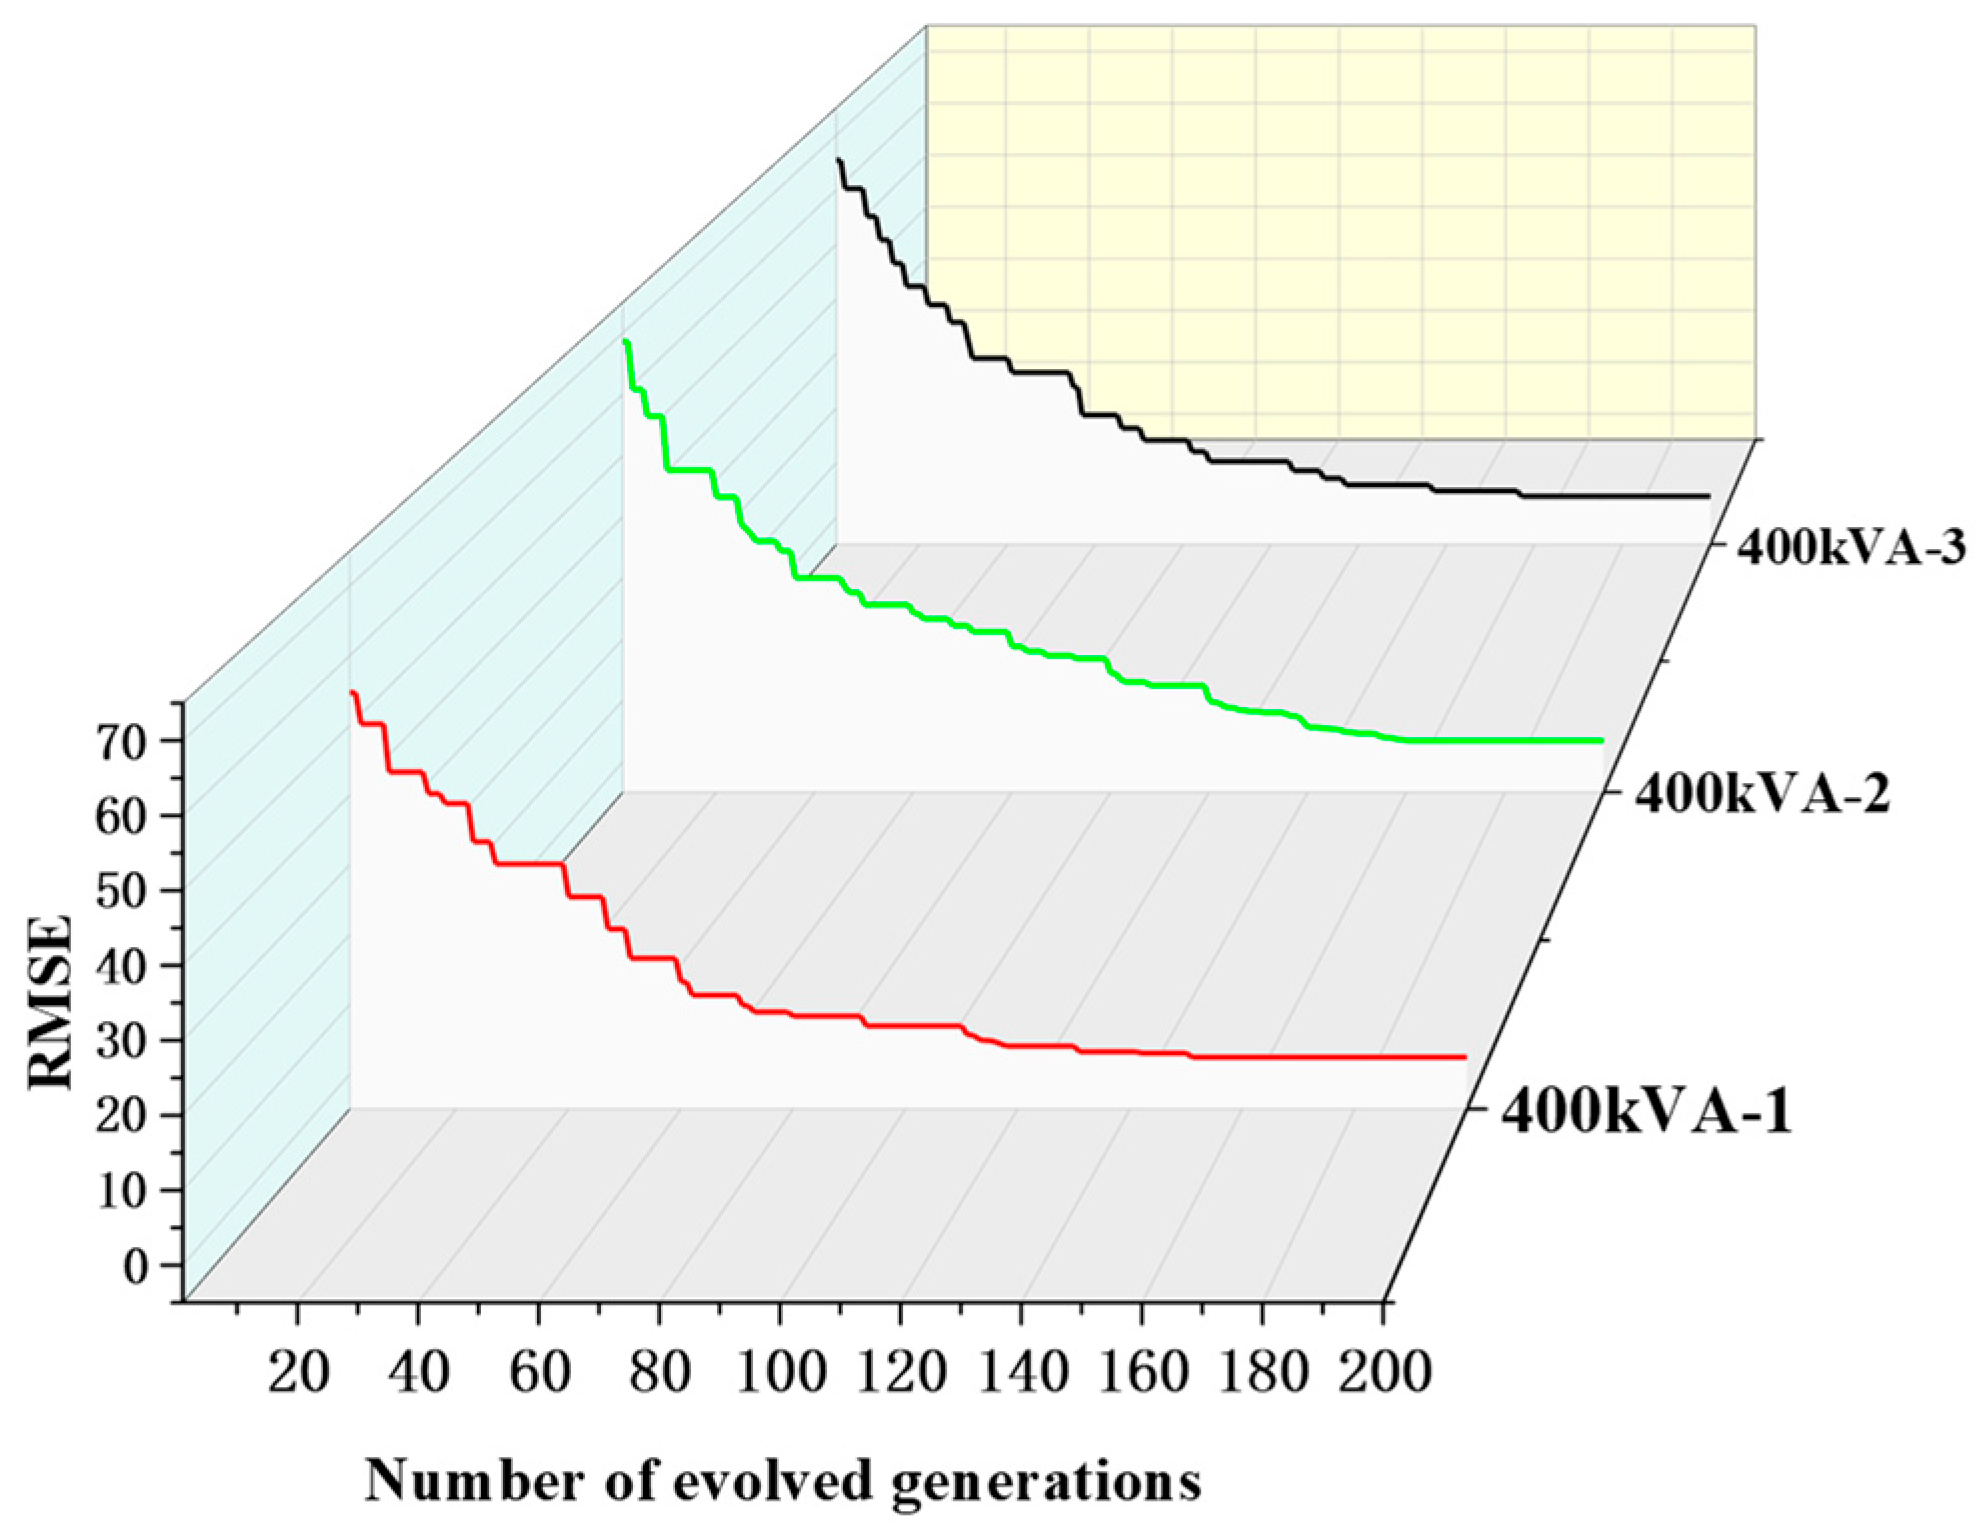
Thermal path model parameter identification was performed based on data from the first 2 h of normal temperature rise. The curve showing the change in the RMSE was calculated according to Equation (10) as the number of evolutionary generations increases, as shown in Figure 5.
Figure 5 shows that as the number of evolutionary generations increases, the root mean square error (RMSE) of the fitted parameters exhibits a significant decreasing trend. After the offspring reach the 150th generation, the parameters gradually converge, and the RMSE of the fitted parameters for all three transformers is lower than 5, indicating excellent fitting performance.
Based on the identified parameters, the steady-state temperatures of the high-voltage and low-voltage windings and the top-layer oil were predicted using the calculation method described in Section 2.4. The predicted values and measured values are compared as shown in Table 5.
The table shows that TActual and TPredicted represent the measured and predicted steady-state temperature values, respectively; ∆TActual and ∆TPredicted represent the measured and predicted steady-state temperature rise values, respectively; TA_Final represents the ambient temperature at steady state; and TA_Set represents the ambient temperature value set in the algorithm, which is also the average ambient temperature during the 2 h temperature rise test. Taking the average value reduces the impact of minor changes in ambient temperature within the 2 h period. The data in Table 5 show that there is a significant difference between the initial and final values of the environmental temperature during the actual measurement process, and the corresponding measured steady-state temperature values and predicted values also have significant errors, with the maximum error reaching 6.8 °C. In fact, the temperature rise values at the indicator temperature nodes do not change with the ambient temperature. The data in Table 5 also validate this conclusion: the measured and predicted errors for the steady-state temperature rise values of the top-layer oil in the three transformers are 0.9 °C, 0.4 °C, and 2 °C, respectively. In terms of winding temperature prediction, the study used an extrapolation method to calculate the winding temperature rise values at the moment of power disconnection. The results showed that the average temperature rise errors for the high-voltage windings were 0.5 °C, 2.8 °C, and 1 °C, respectively; the average temperature rise errors for the low-voltage windings were 2.9 °C, 0.8 °C, and 2.1 °C, respectively.
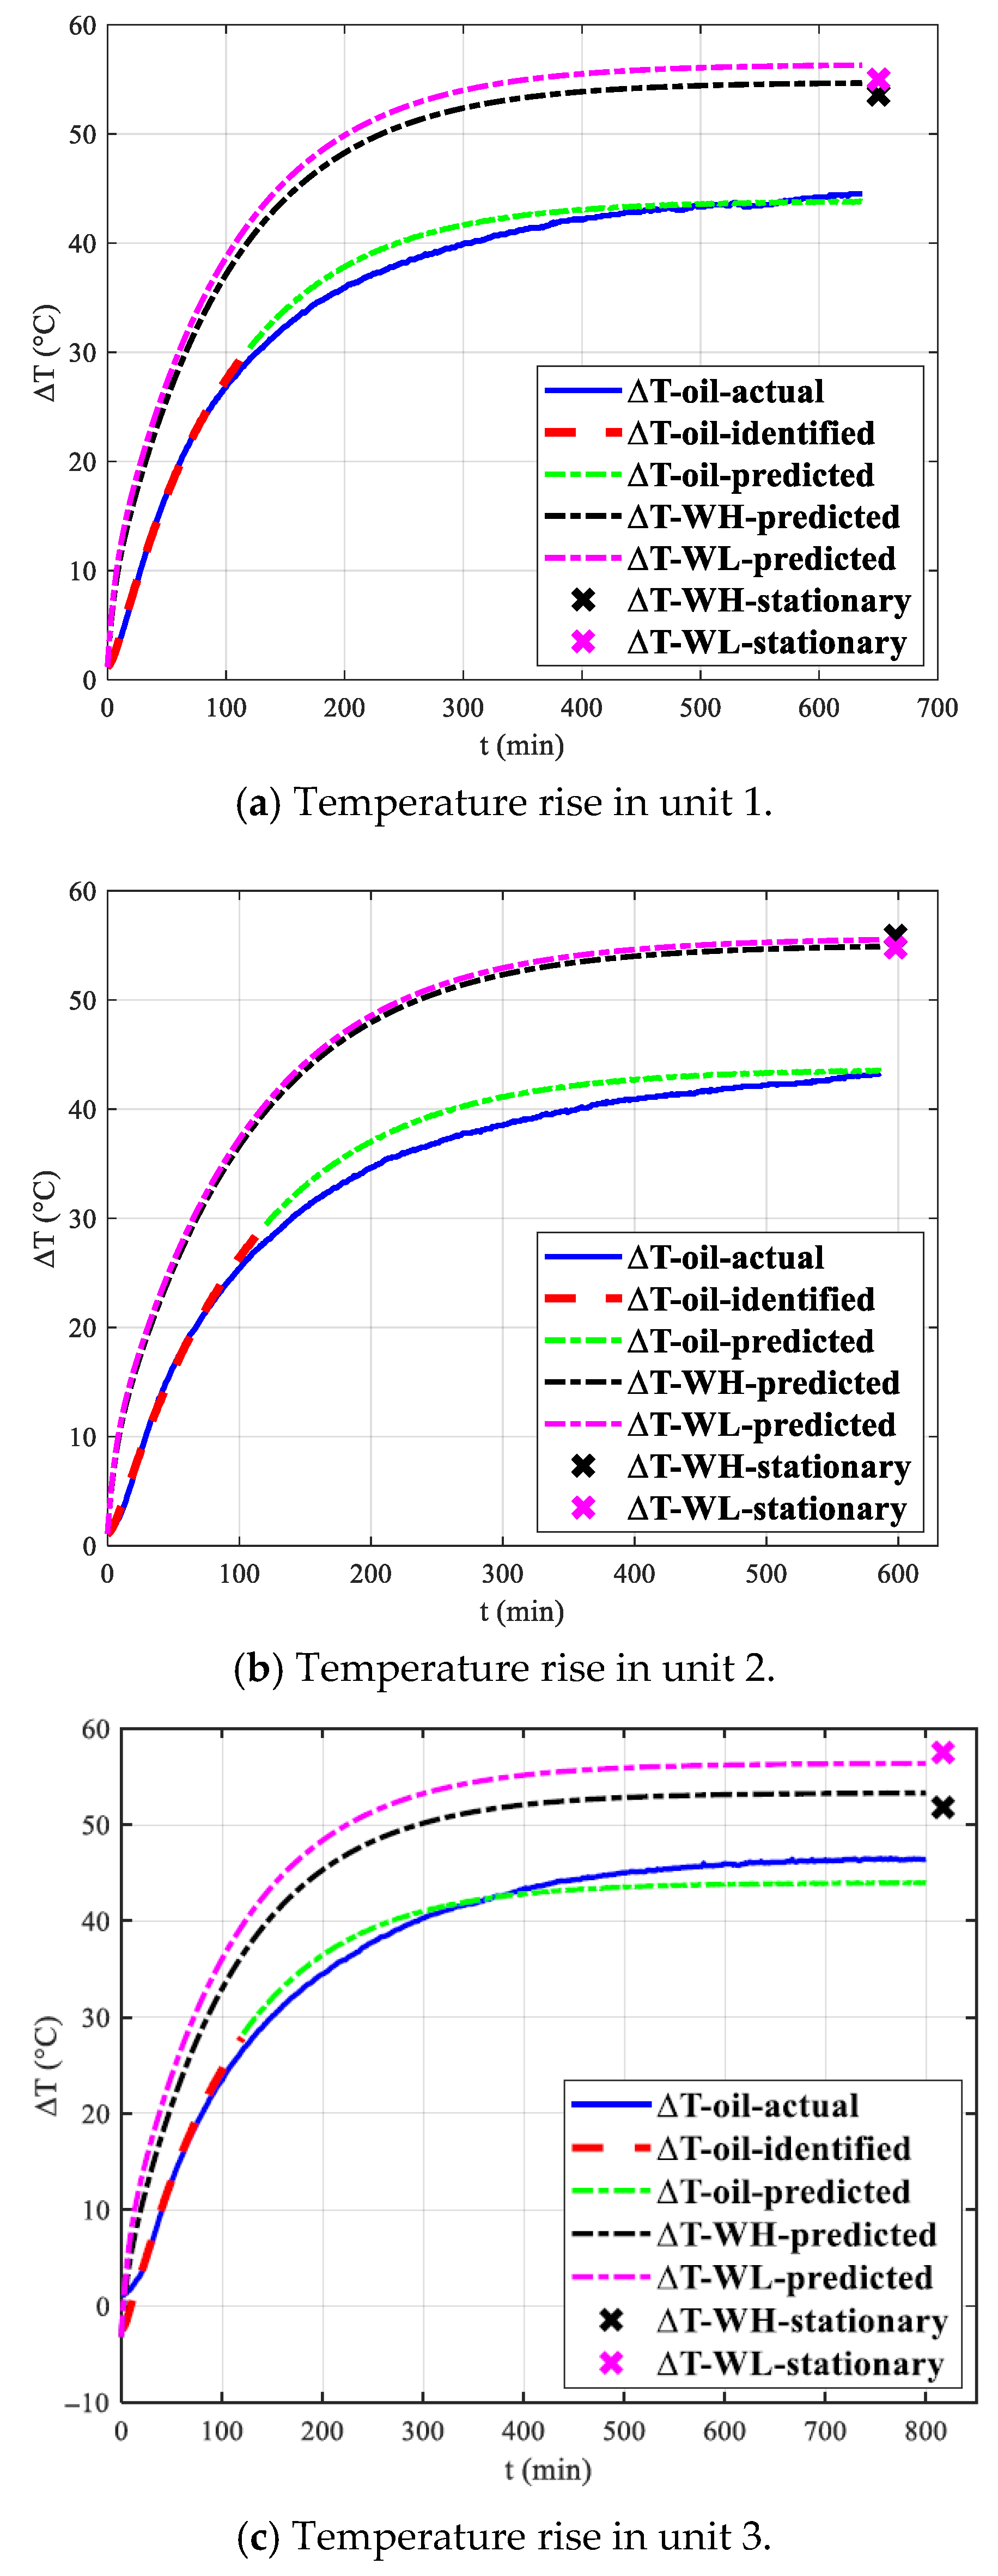
Since the environmental temperatures are different, this paper compares the measured and calculated temperature rise. The temperature rise in the three transformers is shown in Figure 6. The temperature rise change curves for the three transformers are shown in Figure 6. The blue curve represents the measured temperature rise curve, the red dashed line represents the temperature rise fitting curve obtained through parameter identification, and the black and pink dashed lines represent the predicted temperature rise curves for the high-voltage and low-voltage windings, respectively. The corresponding black and pink “X” points indicate the measured temperature rise values of the high-voltage and low-voltage windings at steady state.
The intuitive effect of the fit can be seen in Figure 6. Even with differences in the manufacturers and manufacturing processes of the three transformers, the top oil temperature curve, calculated from the temperature rise 2 h curve identification parameters, still maintains good agreement with the measured curve. Furthermore, when the high- and low-voltage winding temperature rise prediction curves reach steady state, they also closely approach the actual measured values. The error of oil temperature curve prediction is as follows:
R m a x = | Δ T o i l p r e d i c t e d Δ T o i l a c t u a l | m a x Δ T o i l a c t u a l
The error calculation results for the three transformers were 4.84%, 5.68%, and 3.69%, respectively. These data indicate that the parameter identification method not only has high prediction accuracy for the top oil temperature, but also achieves good accuracy in predicting the winding temperature rise, fully verifying the reliability of the parameter identification results.
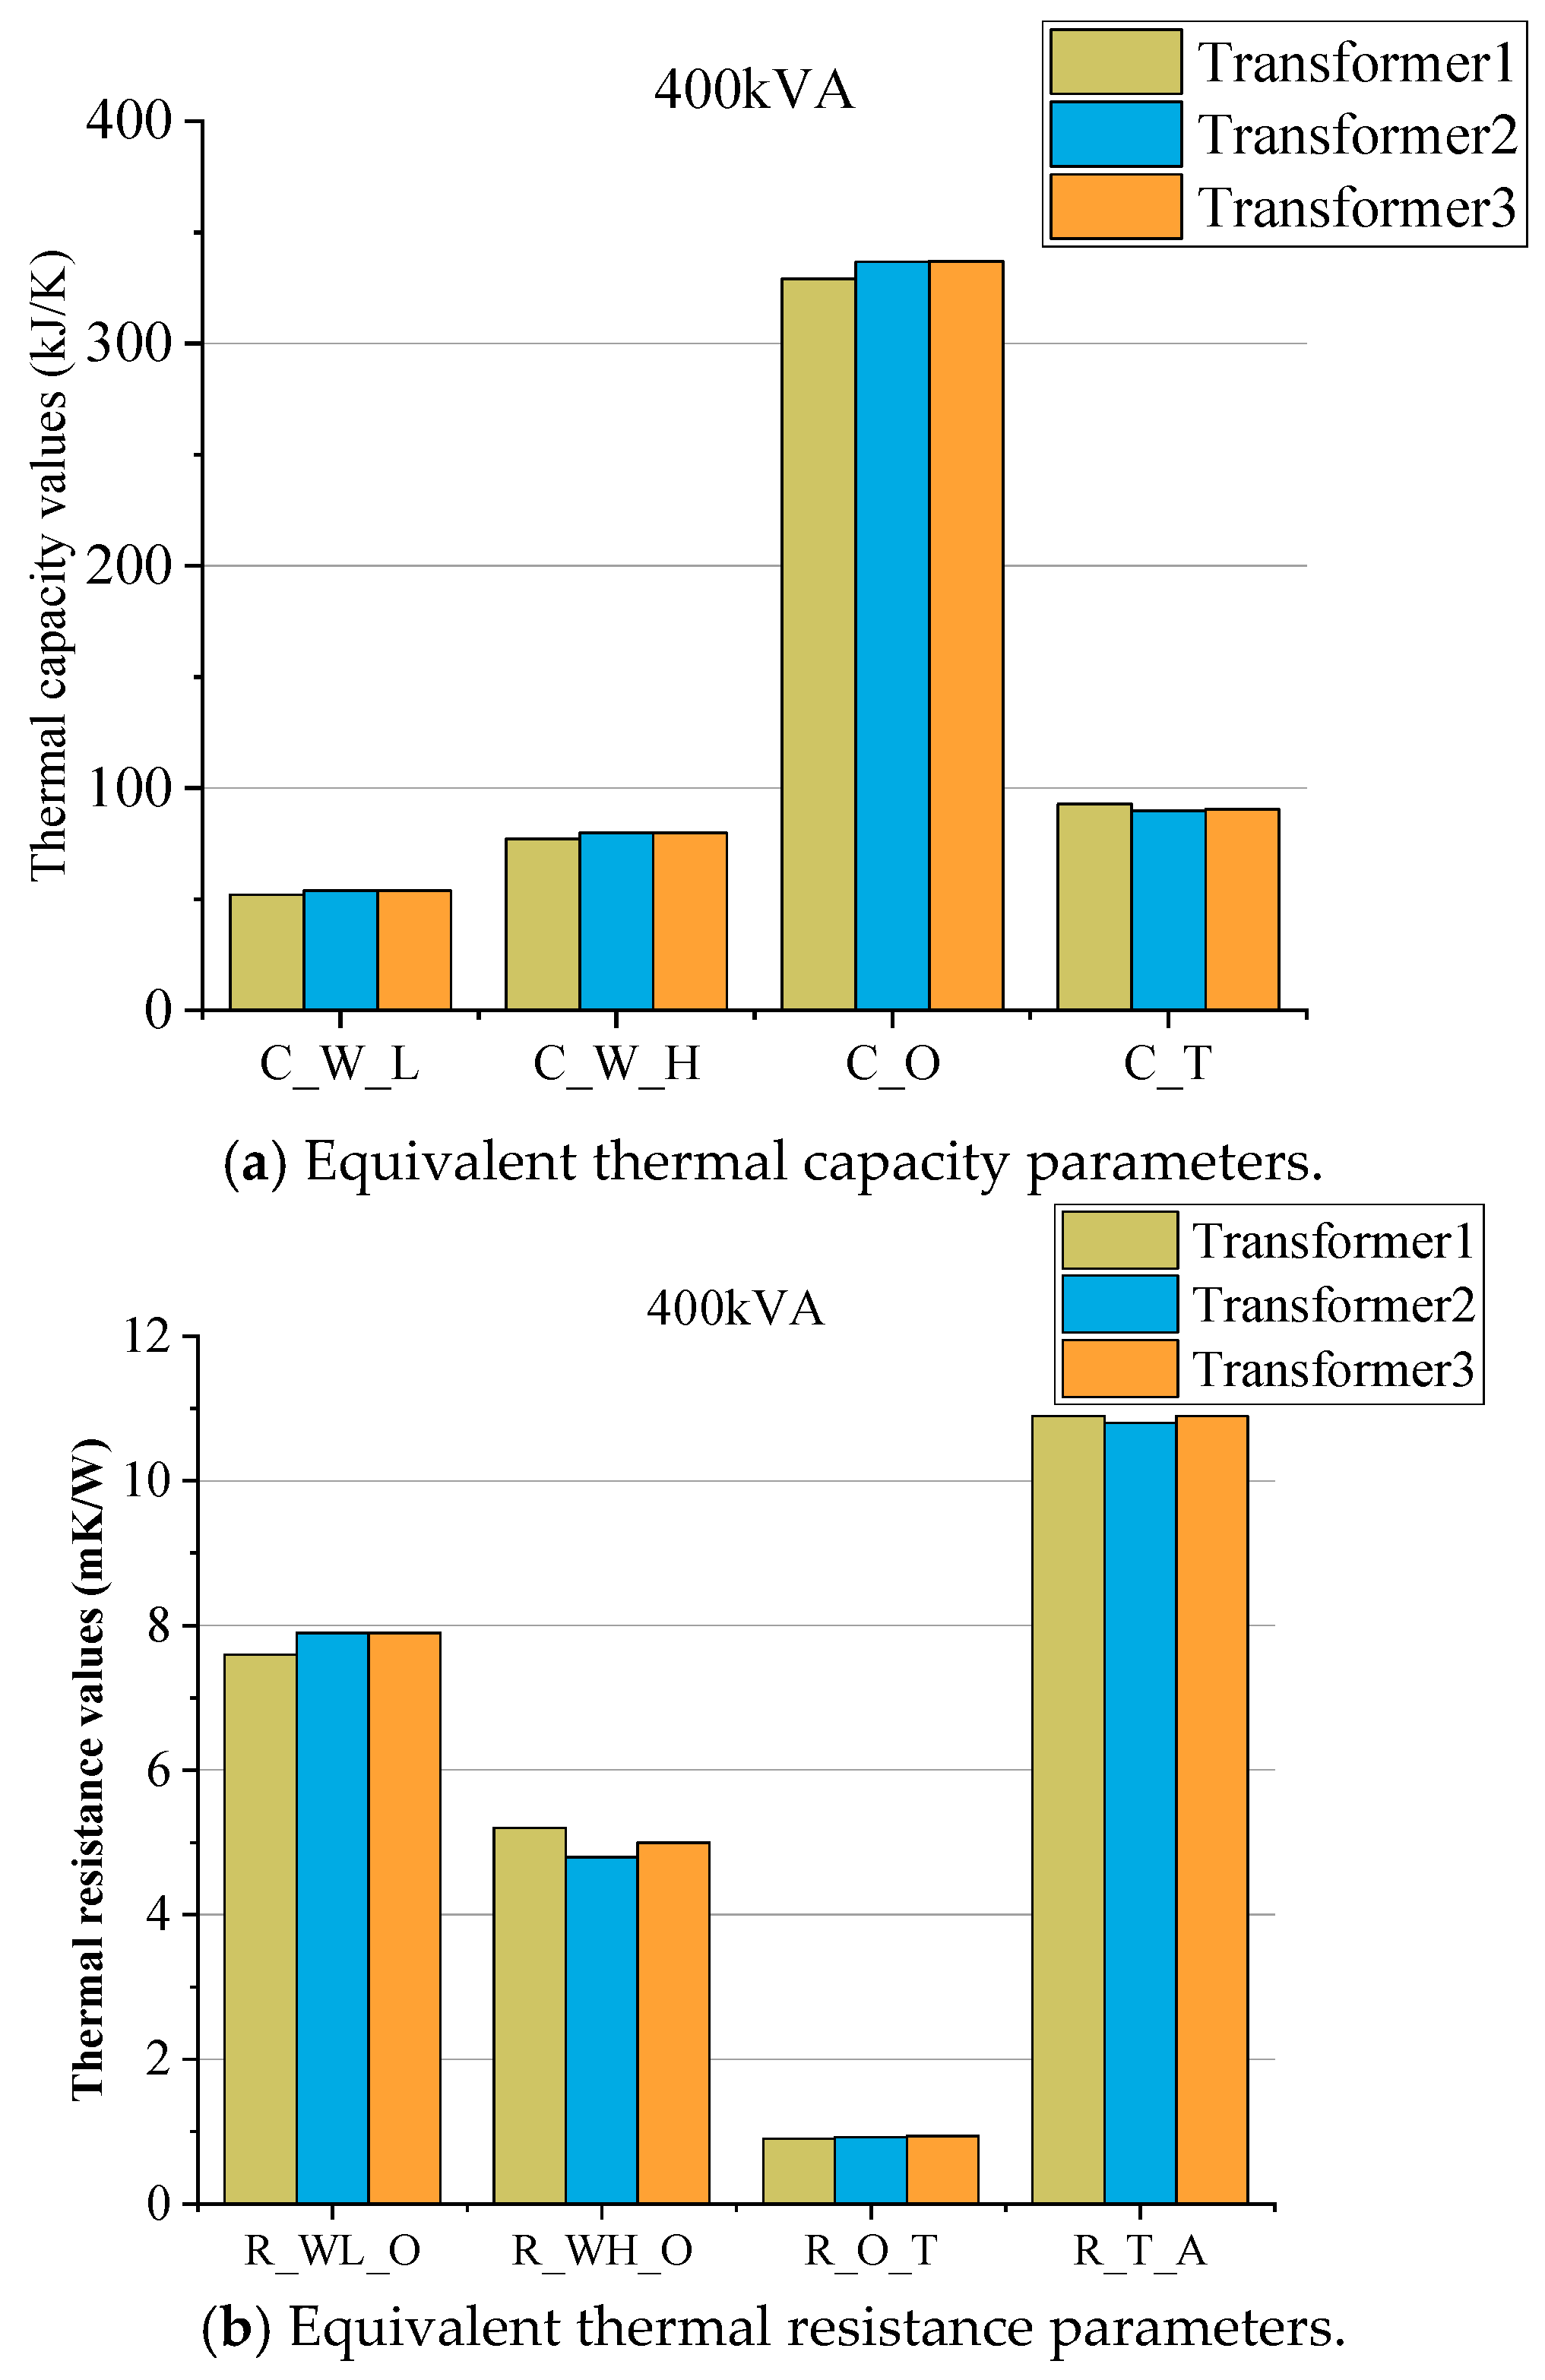
The thermal capacity and thermal resistance parameters, obtained from the 2 h temperature rise curve, are shown in Figure 7.
The identification results indicate that the fluctuation range of the equivalent thermal circuit parameters for transformers of the same model is <10%. The thermal capacity of the low-voltage winding ranges from 52.0 to 53.8 kJ/K, the thermal capacity of the high-voltage winding varies from 77.2 to 77.9 kJ/K, the thermal capacity of the oil is between 32.9 and 33.7 kJ/K, and the thermal capacity of the oil tank changes from 89.9 to 92.9 kJ/K. Thermal resistance parameters: RT-A (10.7 to 10.9 mK/W) > RWL-O (7.6 to 7.9 mK/W) > RWH-O (4.8 to 5.2 mK/W) > RO-T (0.90 to 0.94 mK/W). Since the low-voltage winding has poorer heat dissipation conditions than the high-voltage winding, the corresponding thermal resistance parameters are relatively higher. Additionally, since the winding is wrapped in insulating paper on the outer side, its corresponding thermal resistance is significantly greater than that between the oil and the tank.

3.2.2. Thermal Capacitance and Thermal Resistance of Transformers of Different Capacities

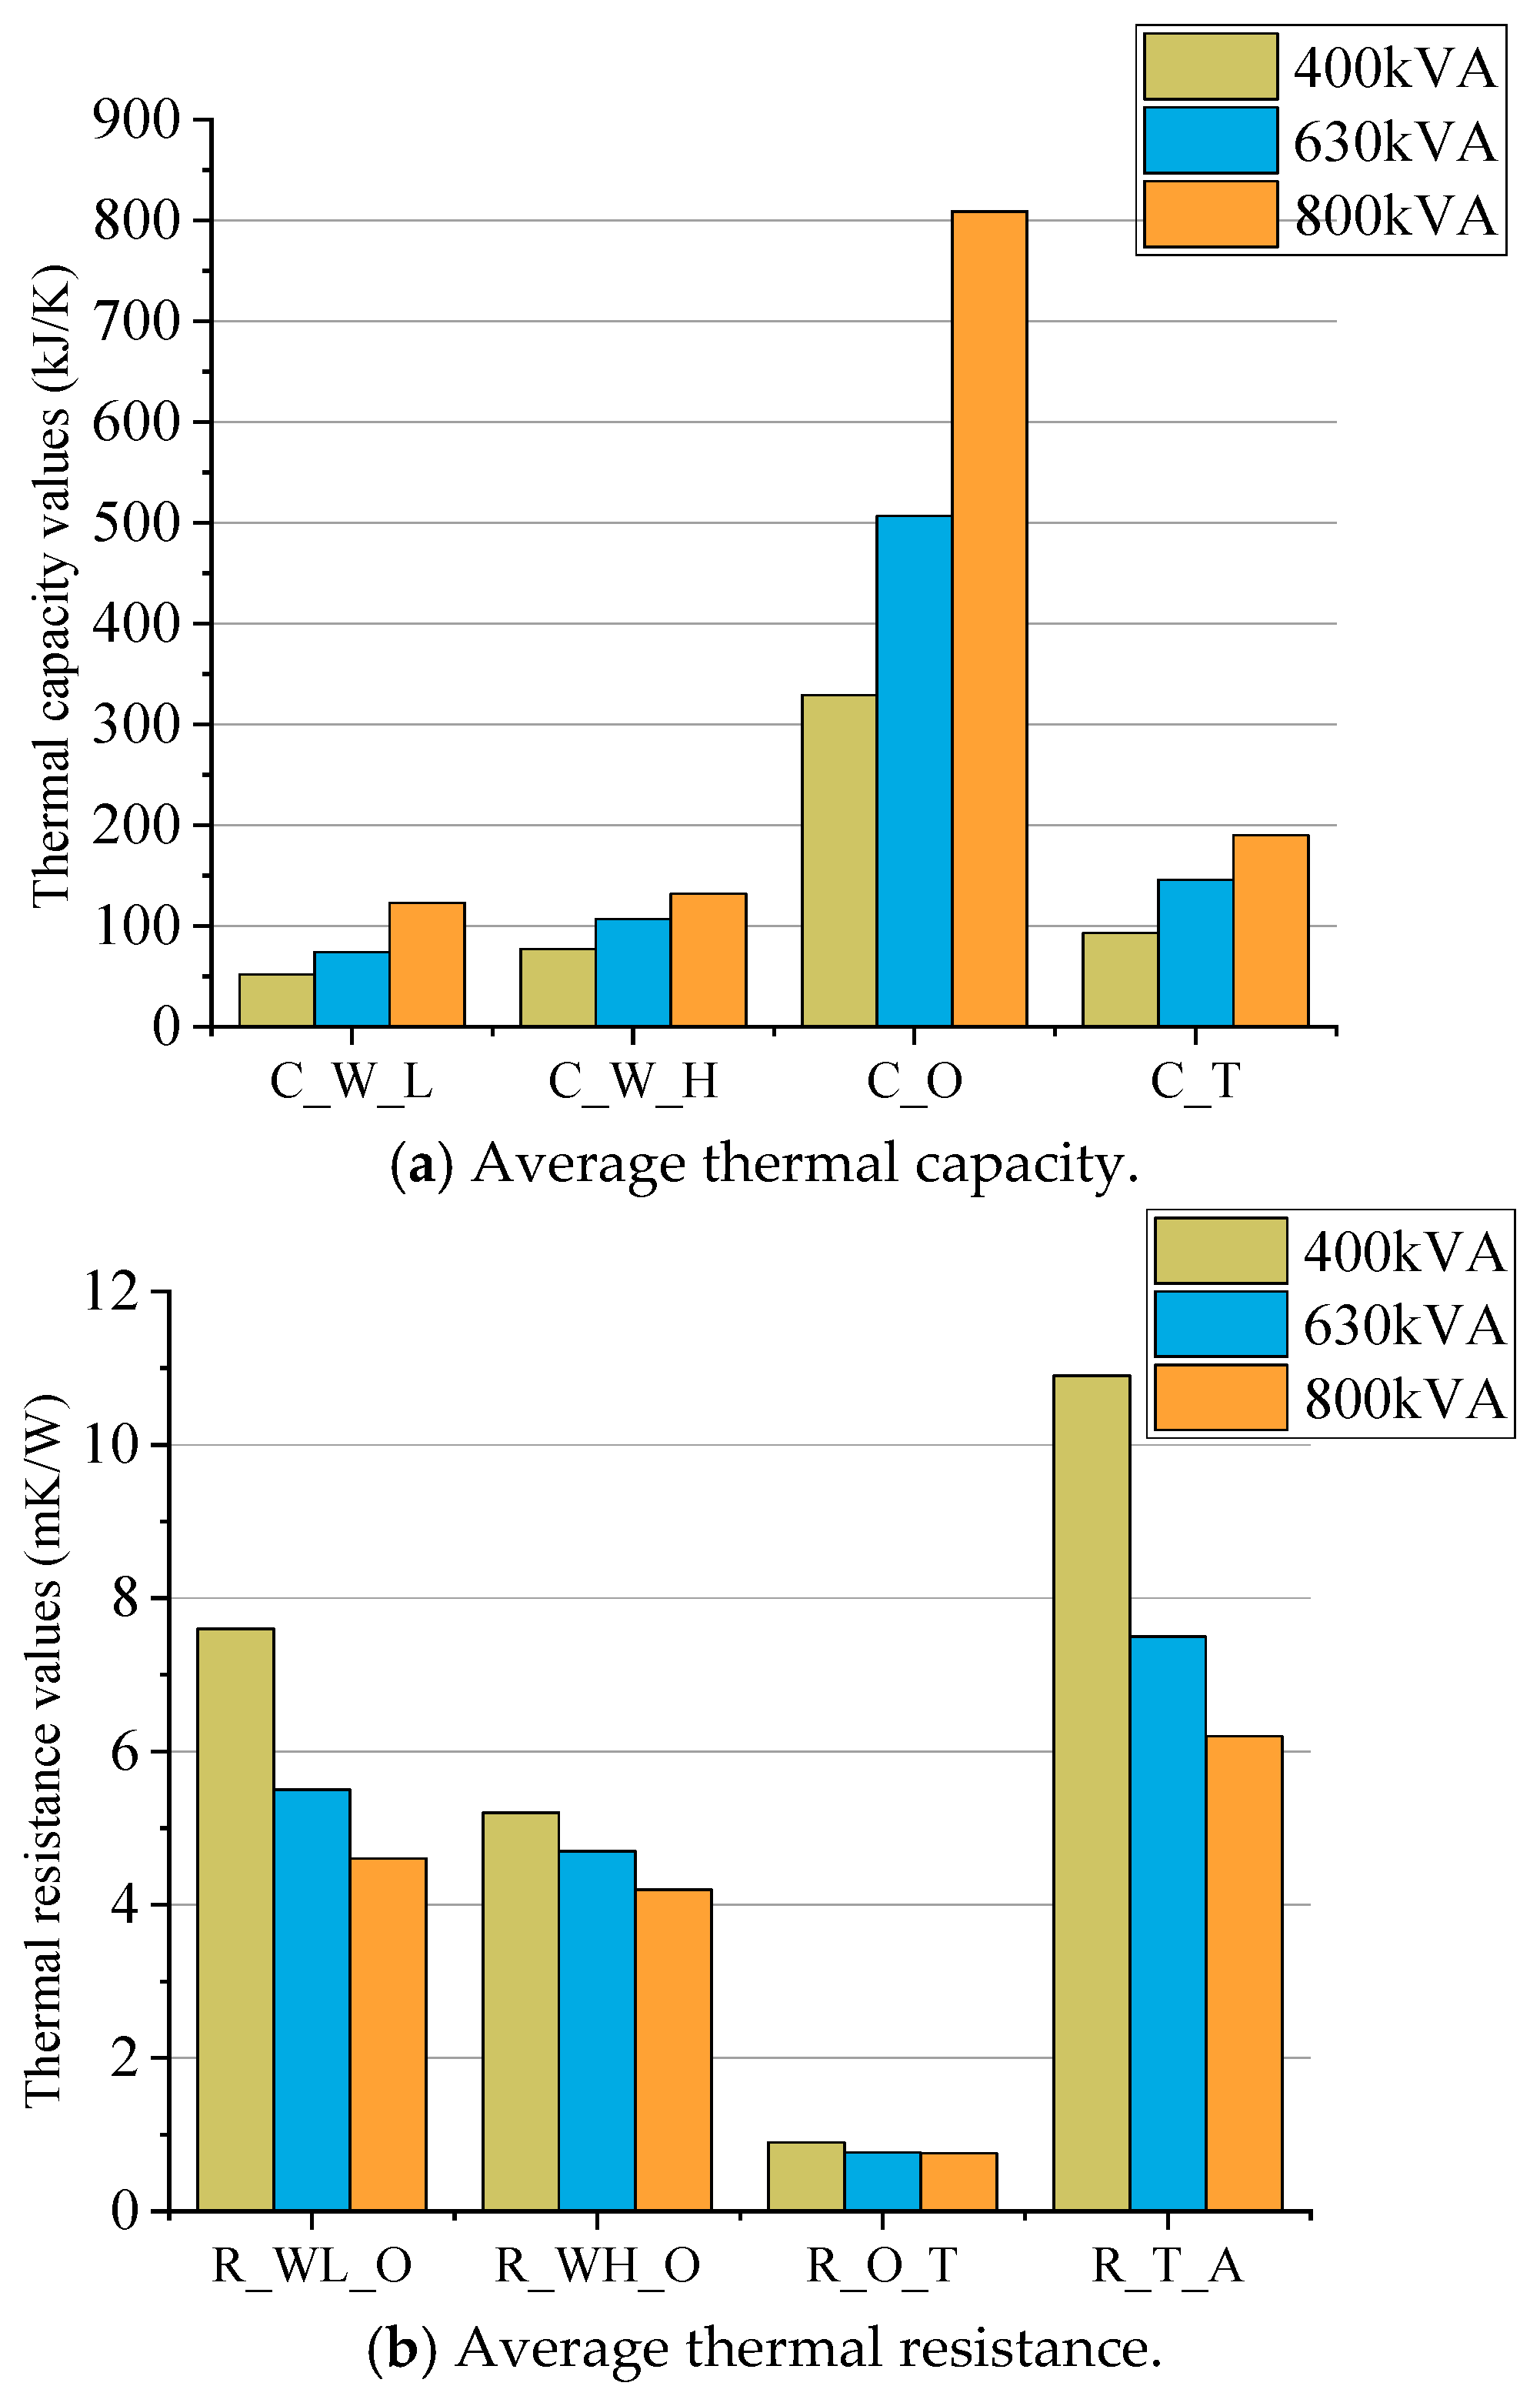
The average equivalent thermal capacitance and thermal resistance of transformers with different capacities, obtained by identifying the 2 h temperature rise curve, are shown in Figure 8.
As shown in the figure, as the transformer capacity increases, the thermal capacity increases. The oil thermal capacity rises from 350 kJ/K at 400 kVA to 800 kJ/K at 800 kVA. Thermal resistance decreases as the capacity increases. The thermal resistance of the high-voltage winding to oil decreases from 7.6 mK/W at 400 kVA to 4.6 mK/W at 800 kVA, while the thermal resistance of the oil tank to the environment decreases from 10.9 mK/W at 400 kVA to 6.2 mK/W at 800 kVA. The above patterns can be explained by the fact that as the capacity increases, the masses of copper, iron, and oil increase, thereby increasing the thermal capacity. As the heat generation power increases, thermal resistance decreases to constrain the temperature rise limits.

3.3. Temperature Rise Predictions with Different Transformers and Losses

3.3.1. Prediction of Temperature Rise for Transformers with Different Capacities

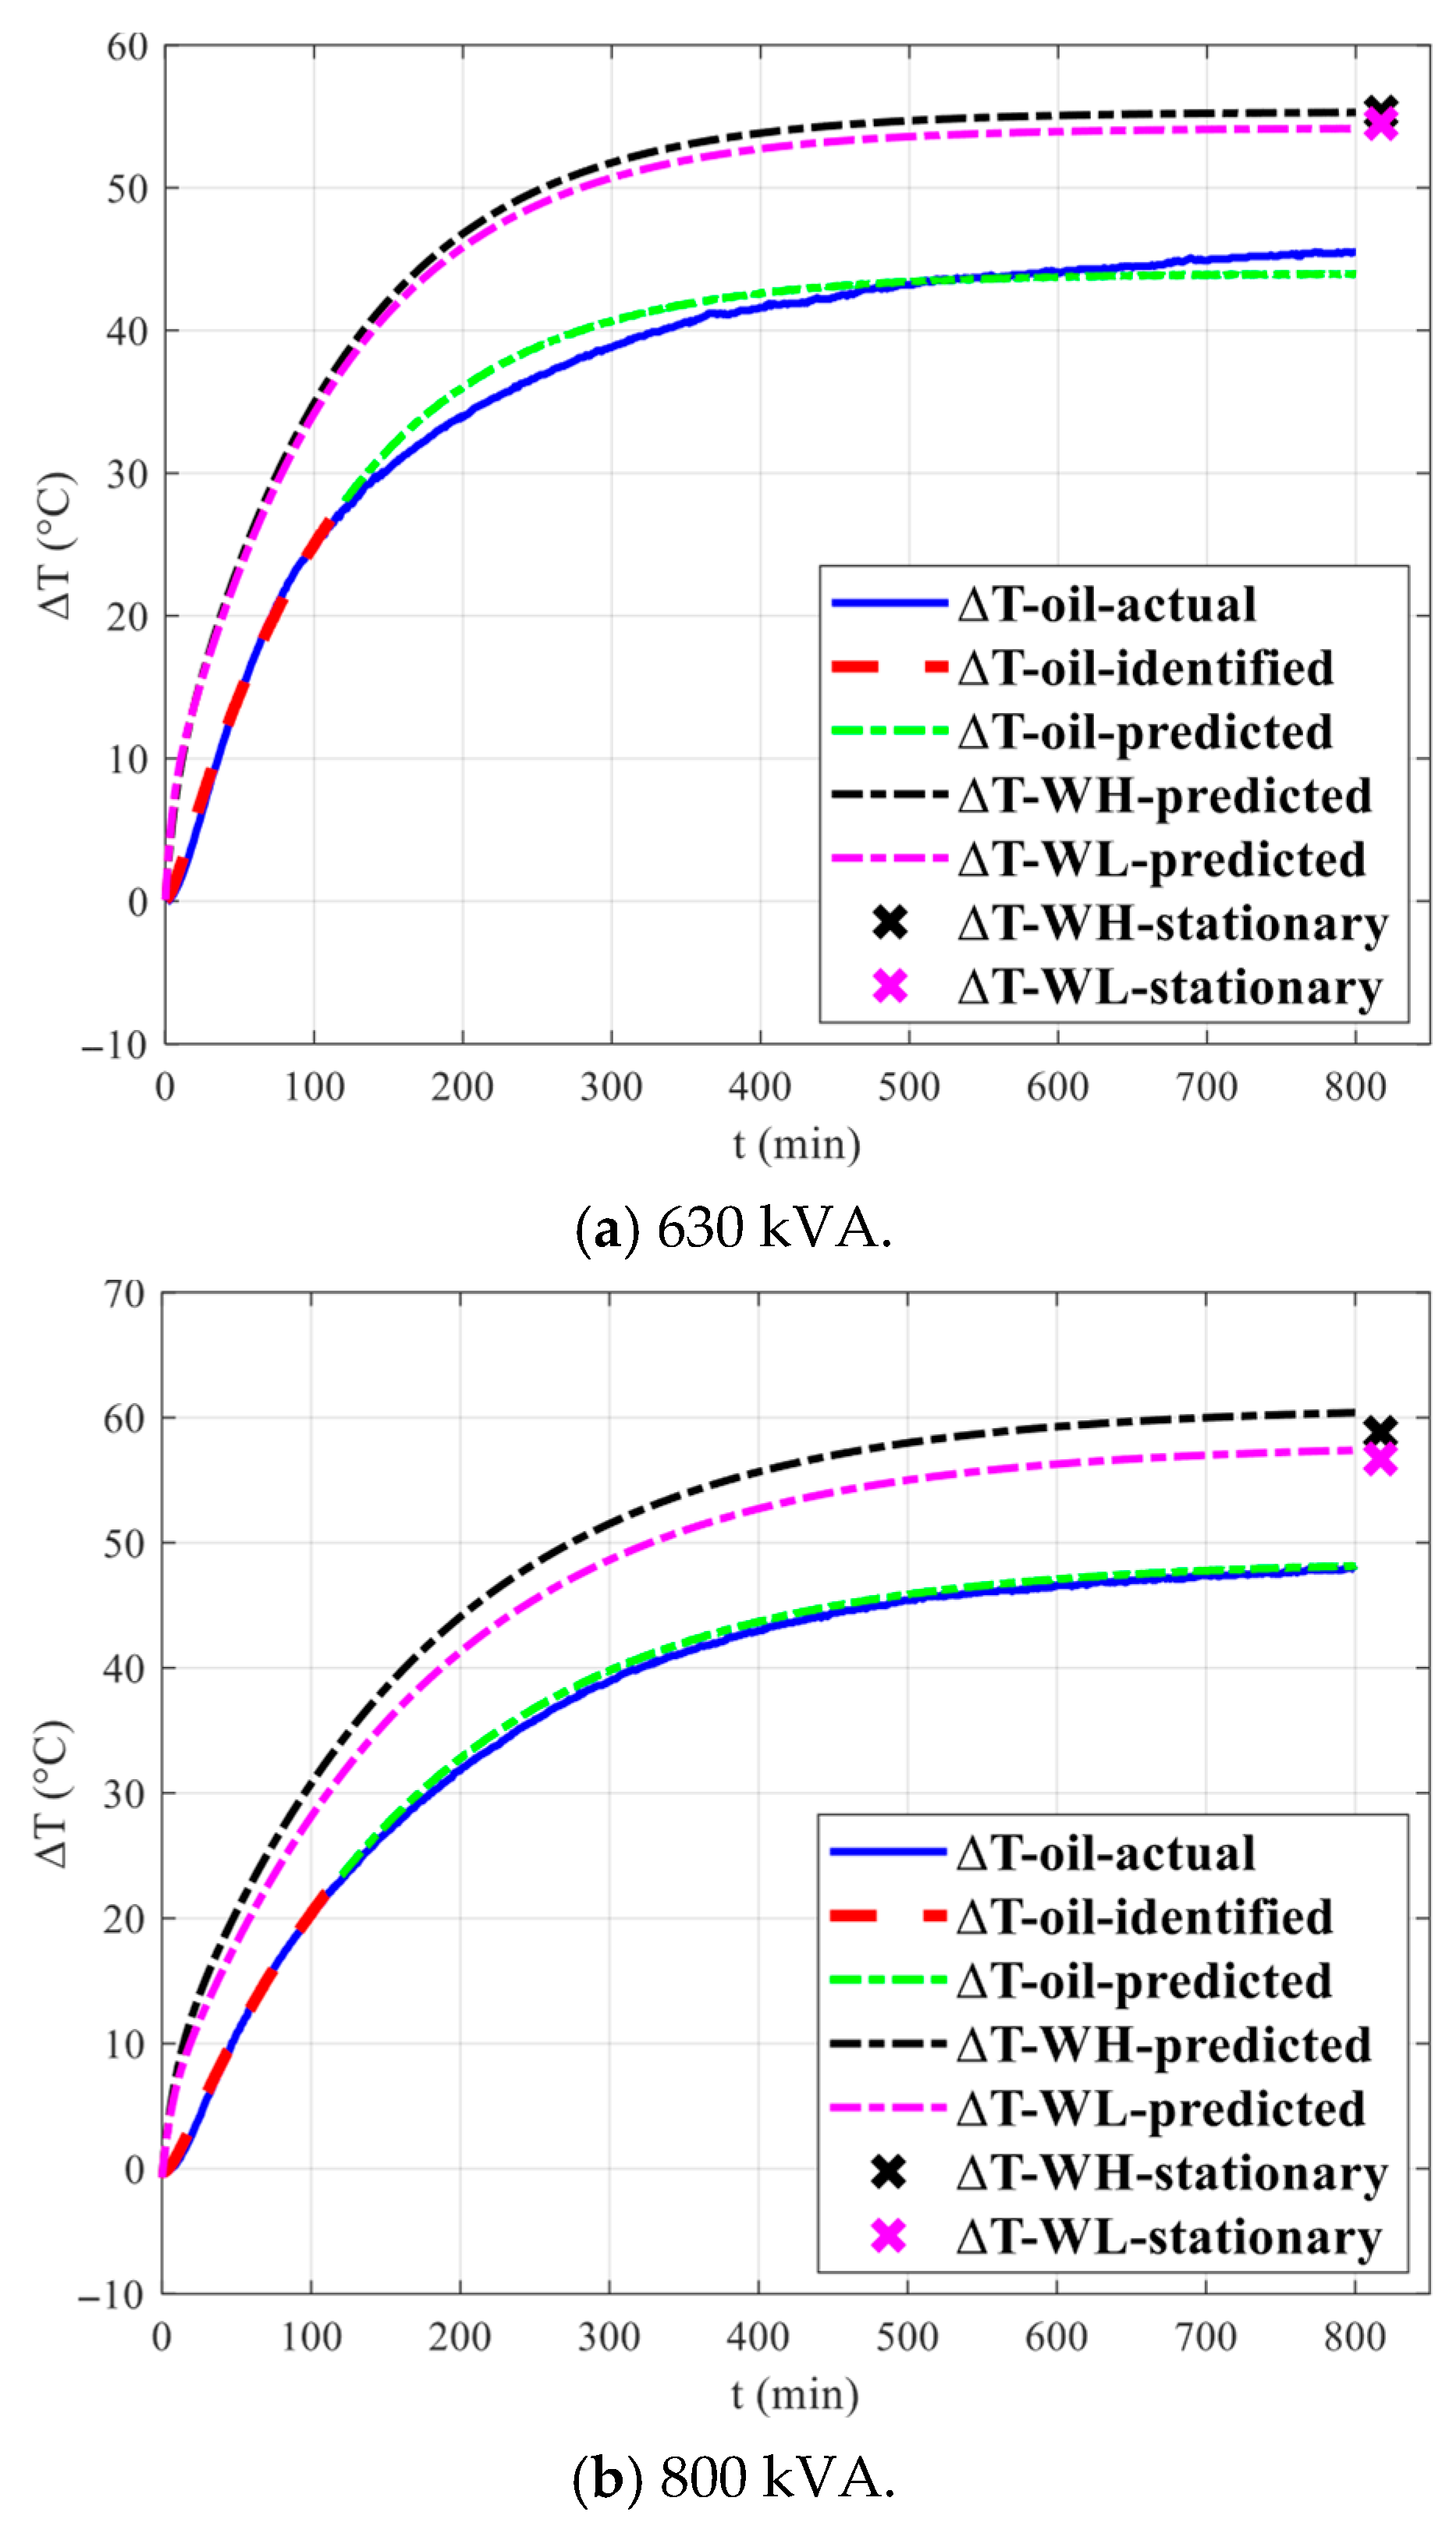
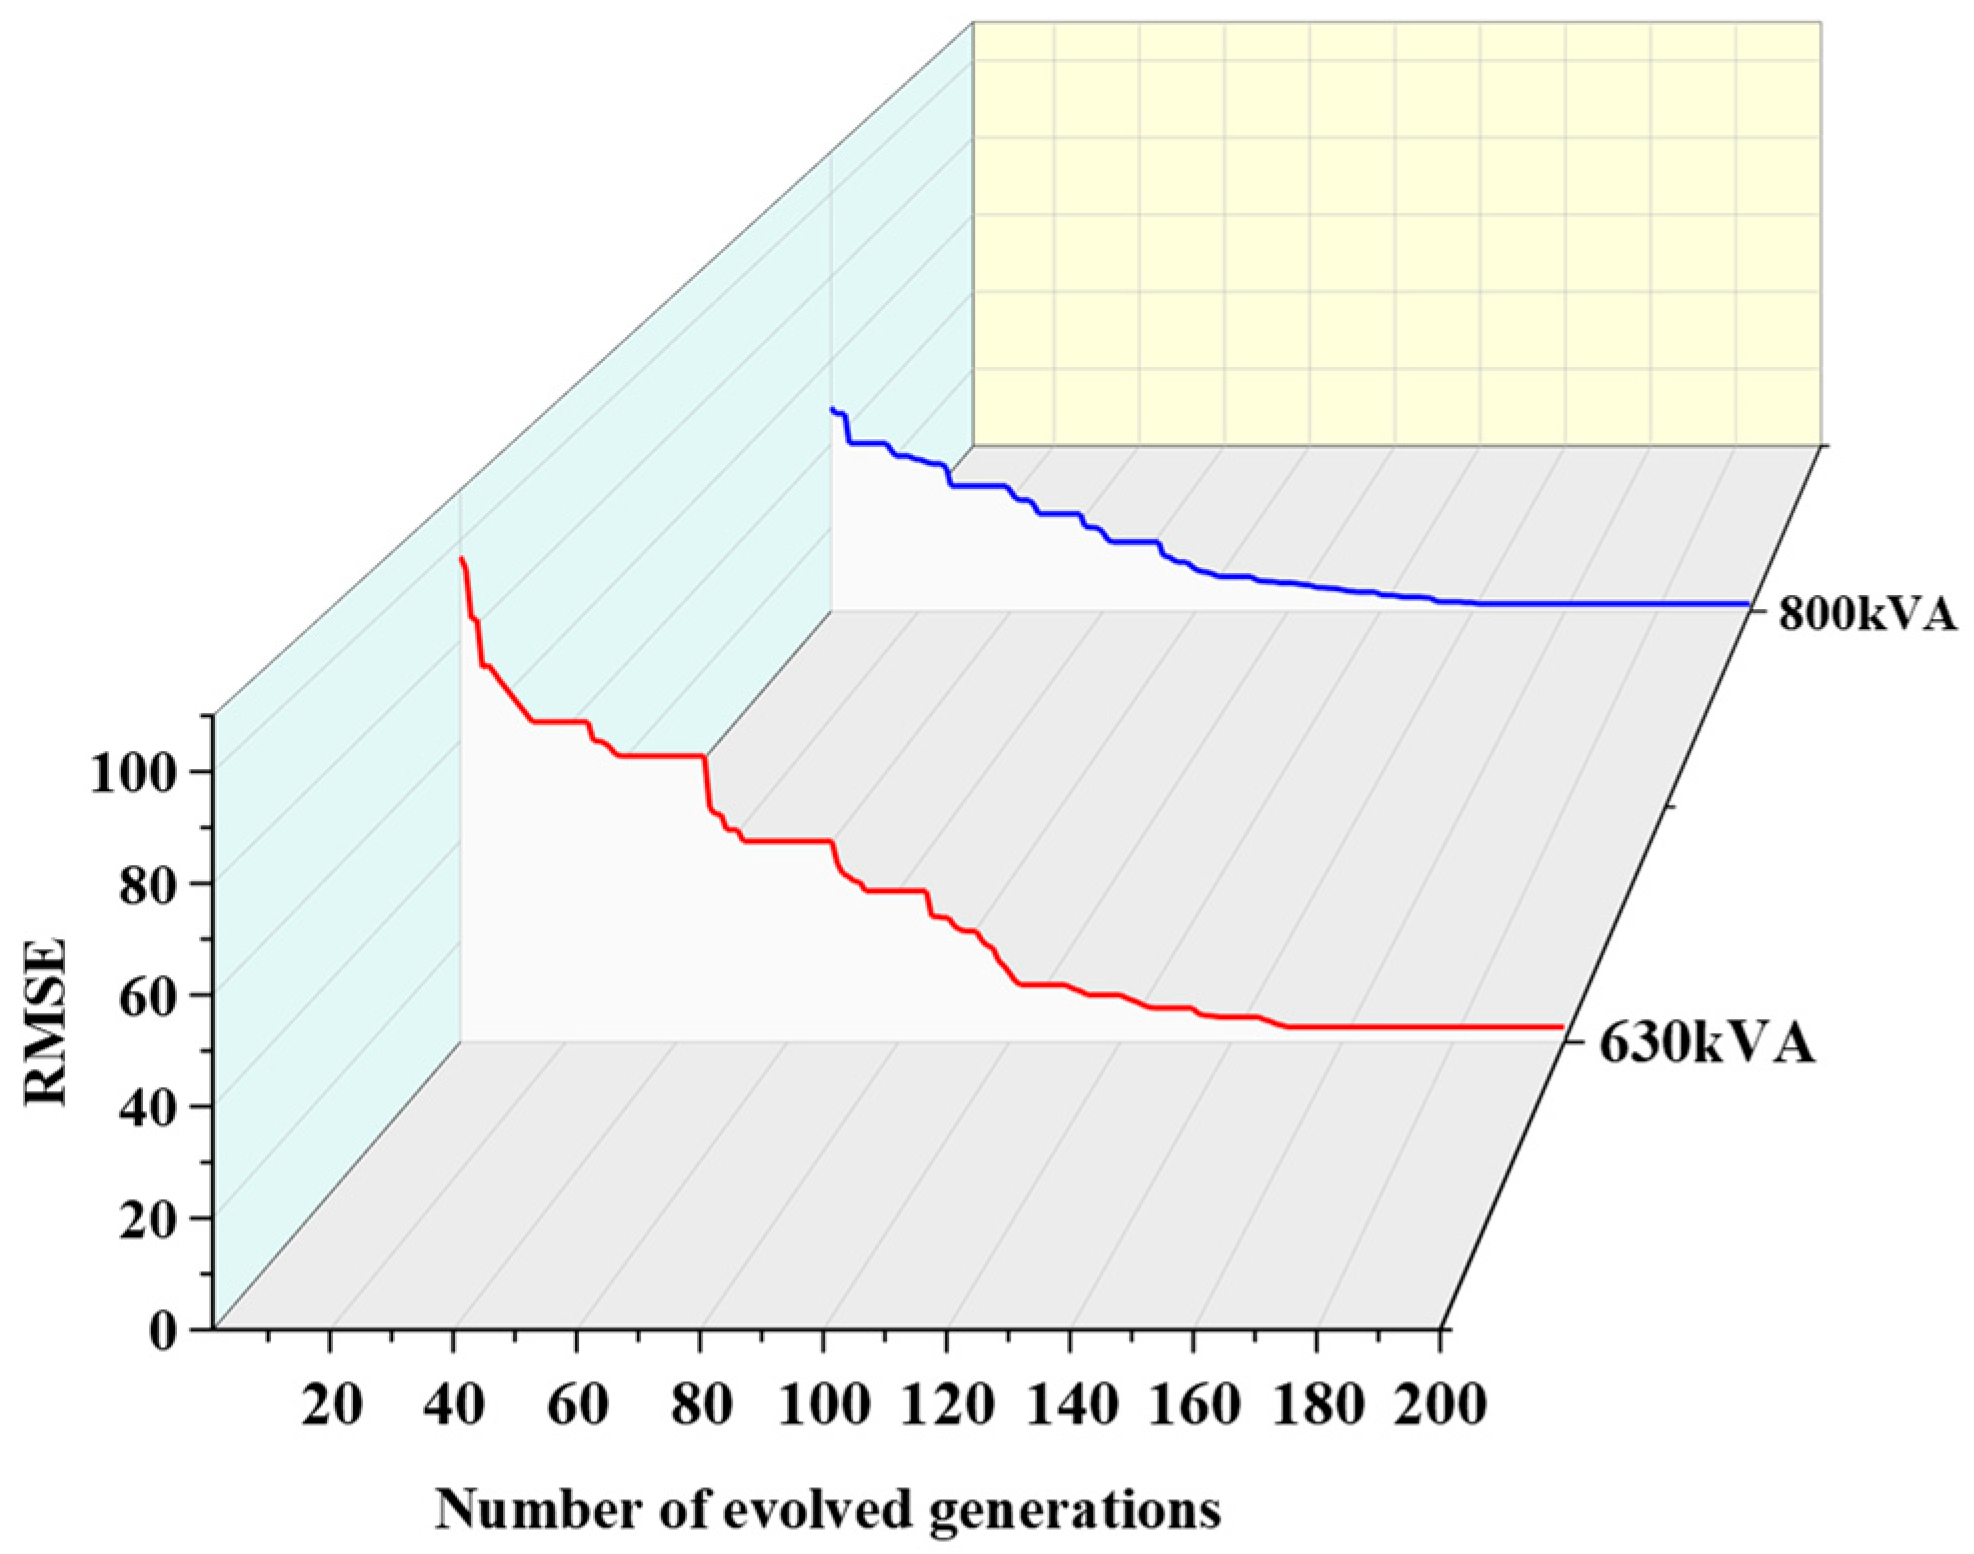
The typical temperature rise curves of transformer oil and windings for 630 kVA- and 800 kVA-capacity transformers obtained from experiments and predictions are shown in Figure 9, and the convergence process of the fitting error is shown in Figure 10.
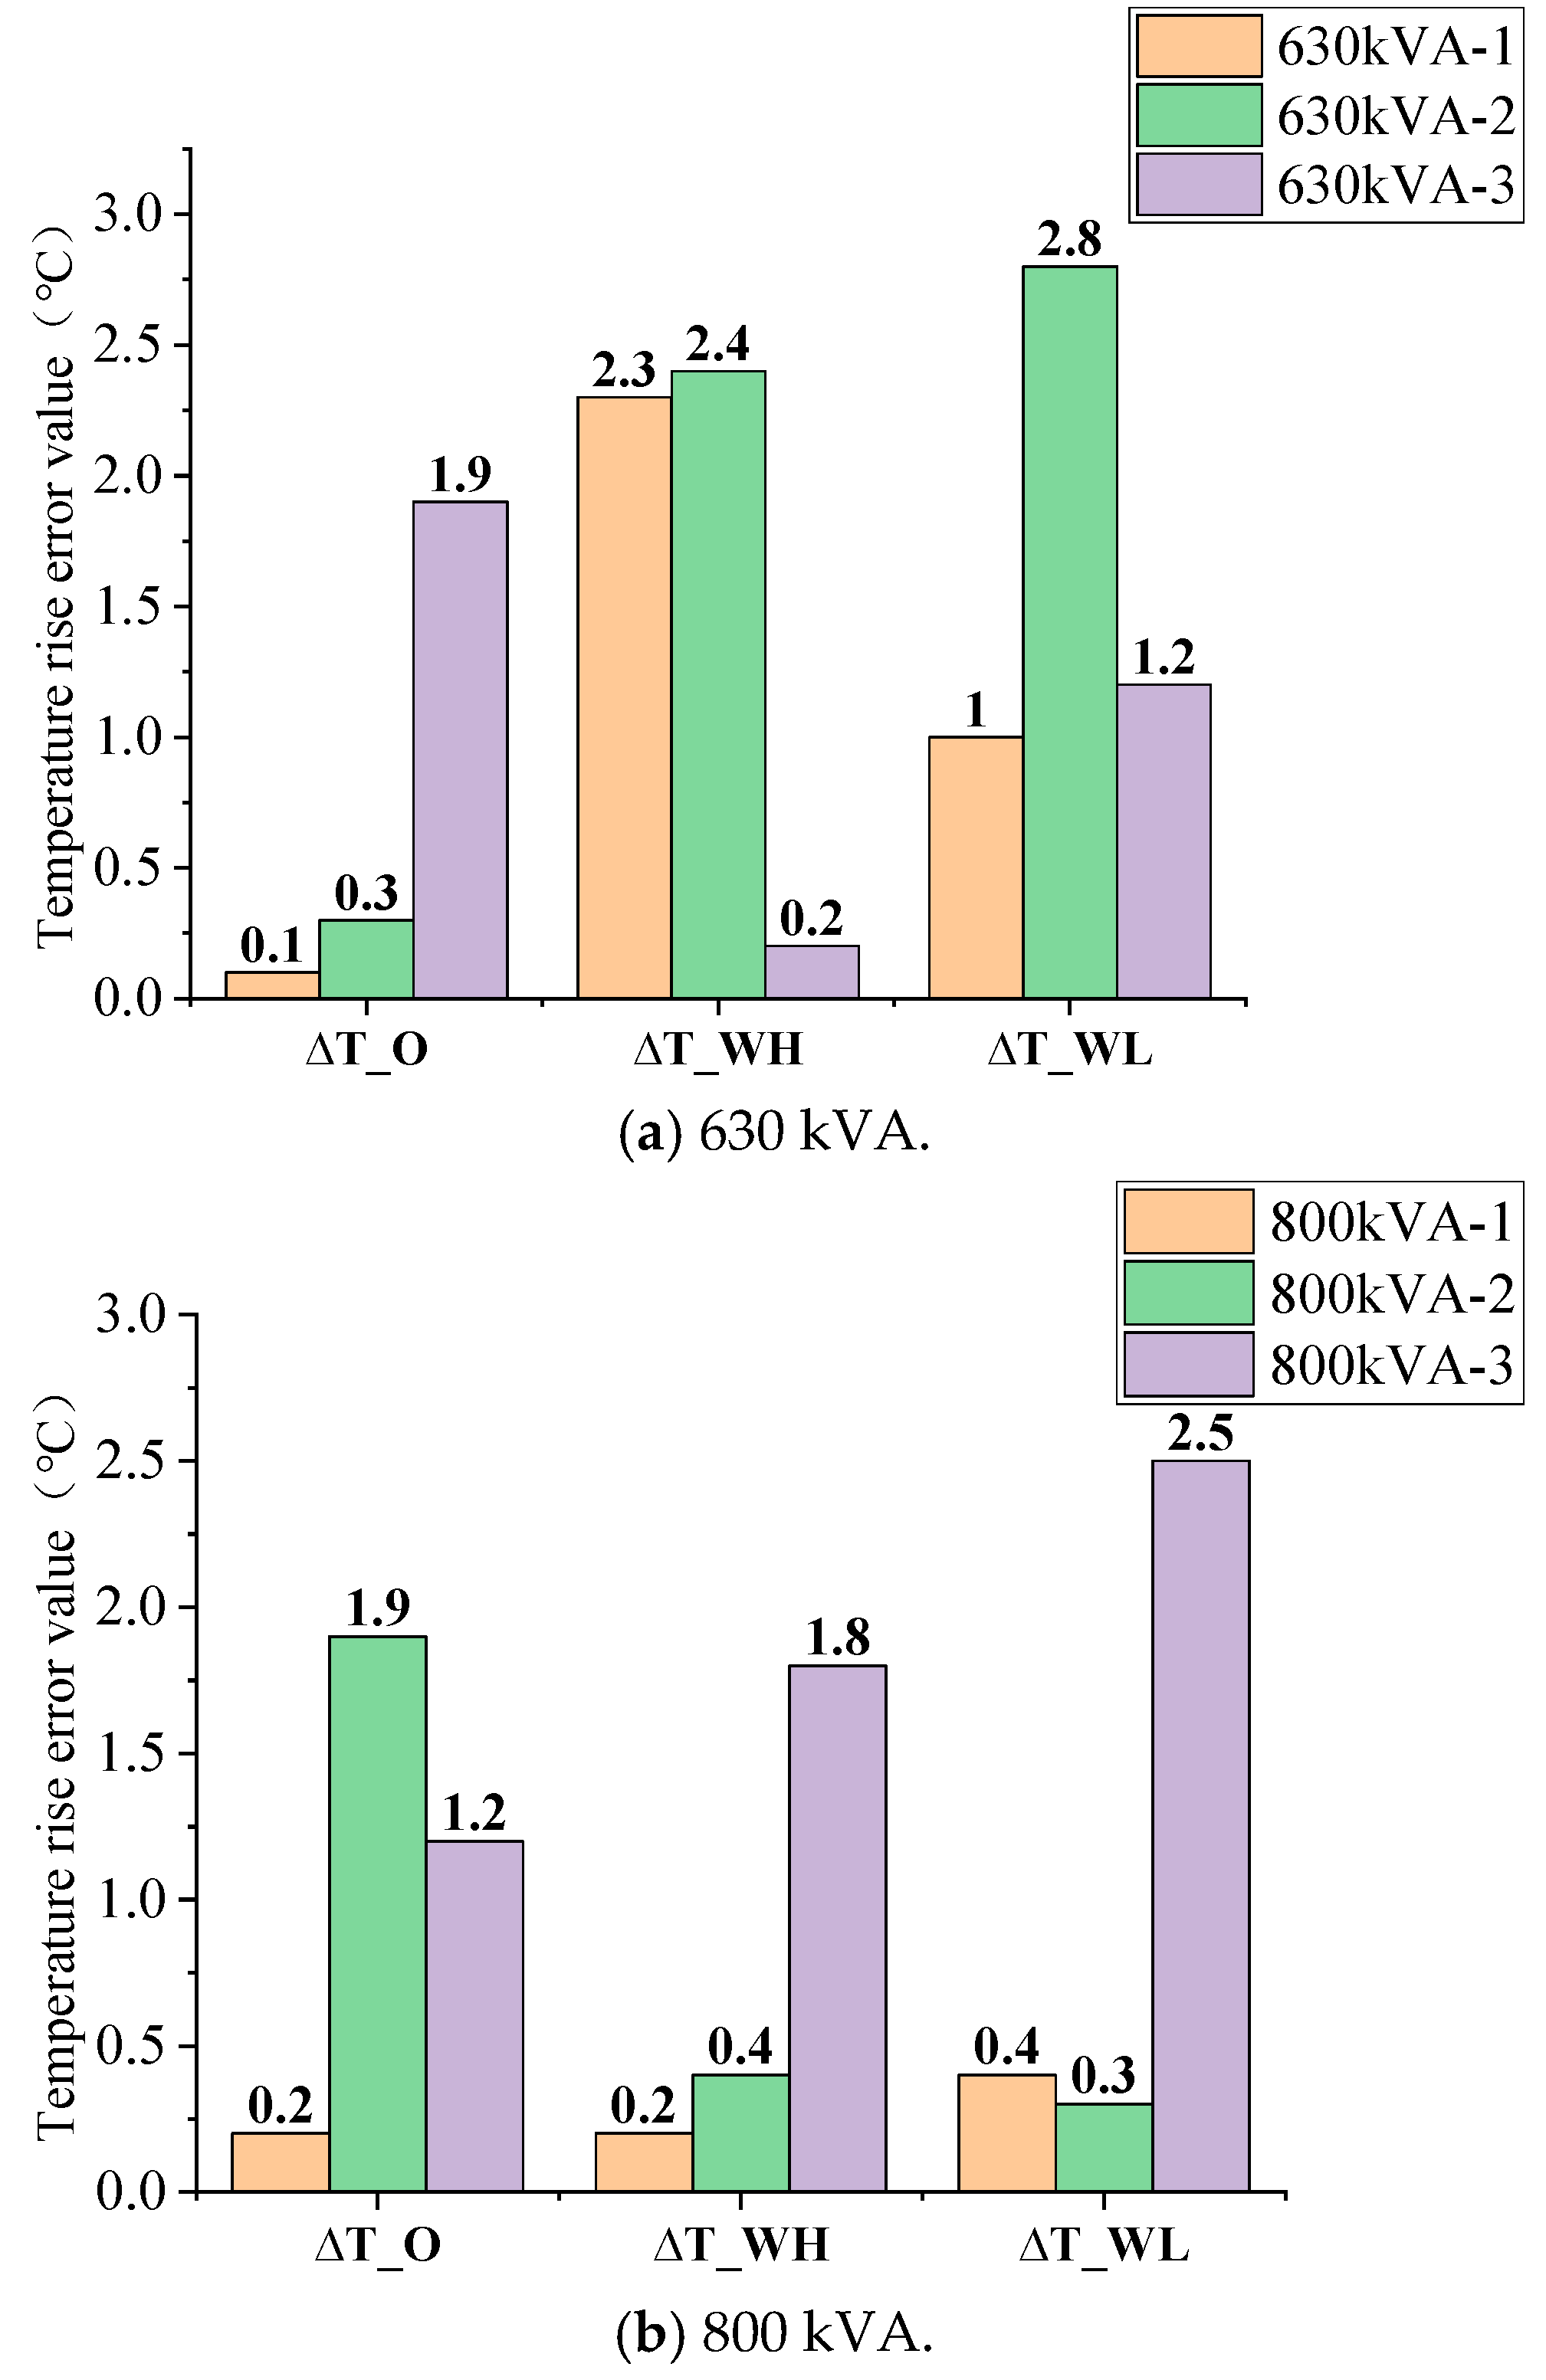
As shown in Figure 8, Figure 9 and Figure 10, from the start of temperature rise to the steady-state temperature rise process, the predicted and measured temperature rise curves show a high degree of overlap, with the RMSE eventually stabilizing at a value below 5, indicating good fitting performance. The steady-state temperature rise and the absolute errors between the predicted and measured temperature of the high-voltage and low-voltage windings and top oil temperature of 630 kVA- and 800 kVA-capacity transformers are shown in Figure 11.
As shown in the figure, the prediction model demonstrates stable accuracy for the top oil temperature, with errors lower than 2 °C. The maximum prediction error for the average temperature rise in the high-voltage winding is 2.9 °C, while the maximum prediction error for the average temperature rise in the low-voltage winding is only 2.6 °C. Such accuracy can meet engineering requirements.

3.3.2. Impact of Losses on Prediction Results

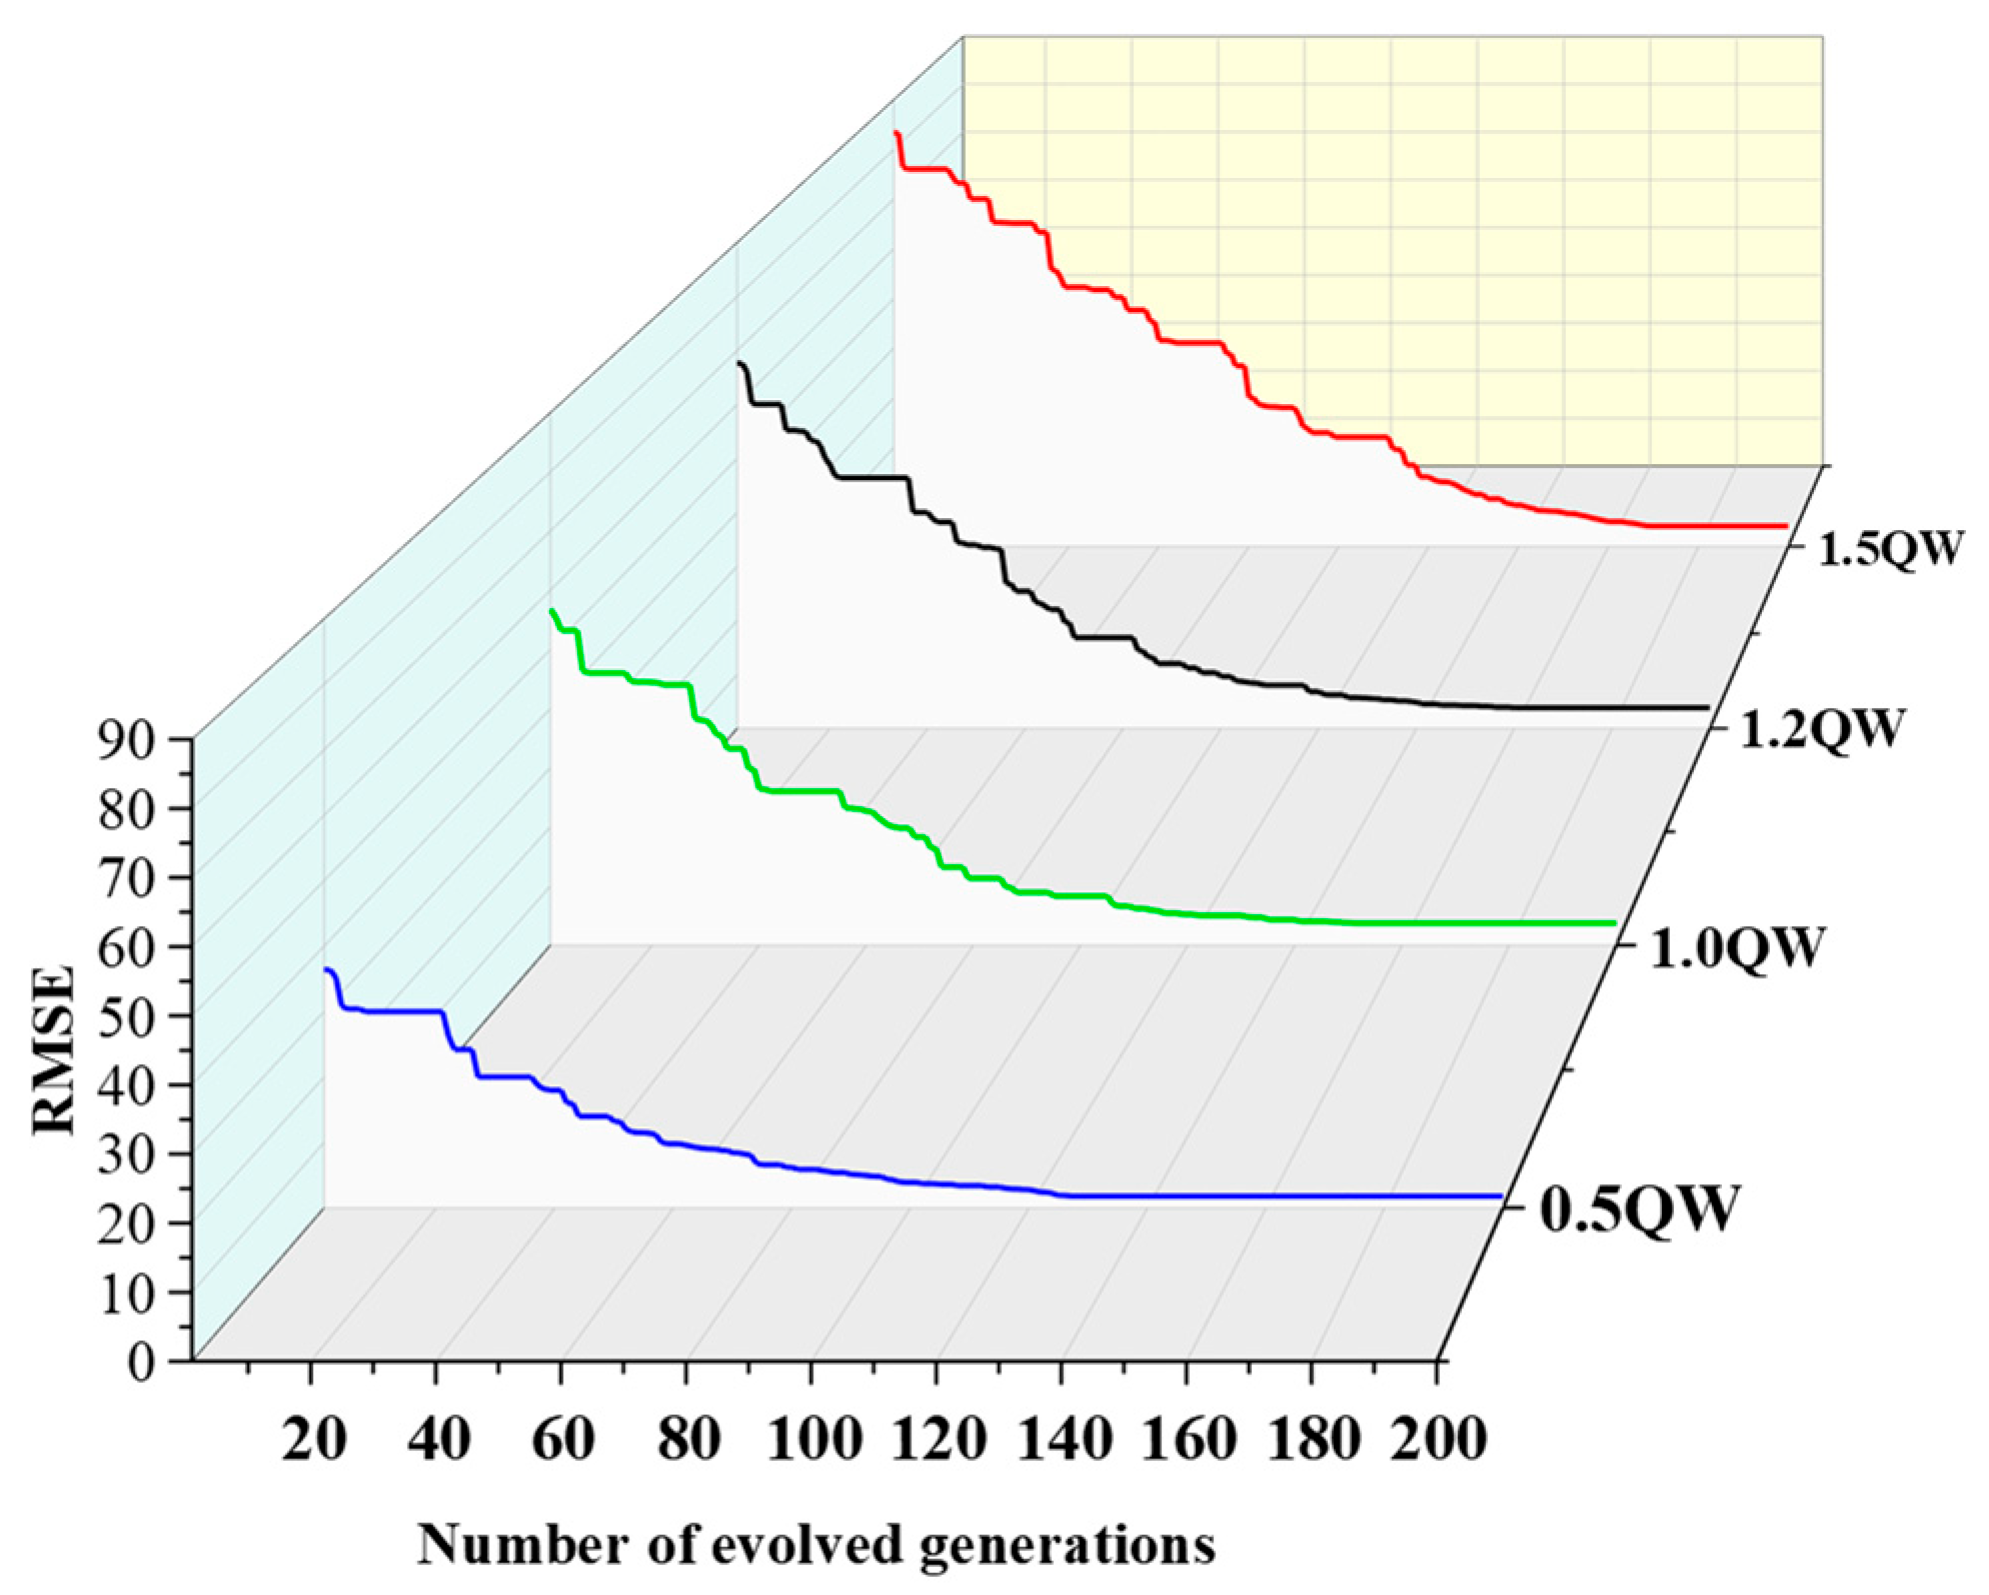
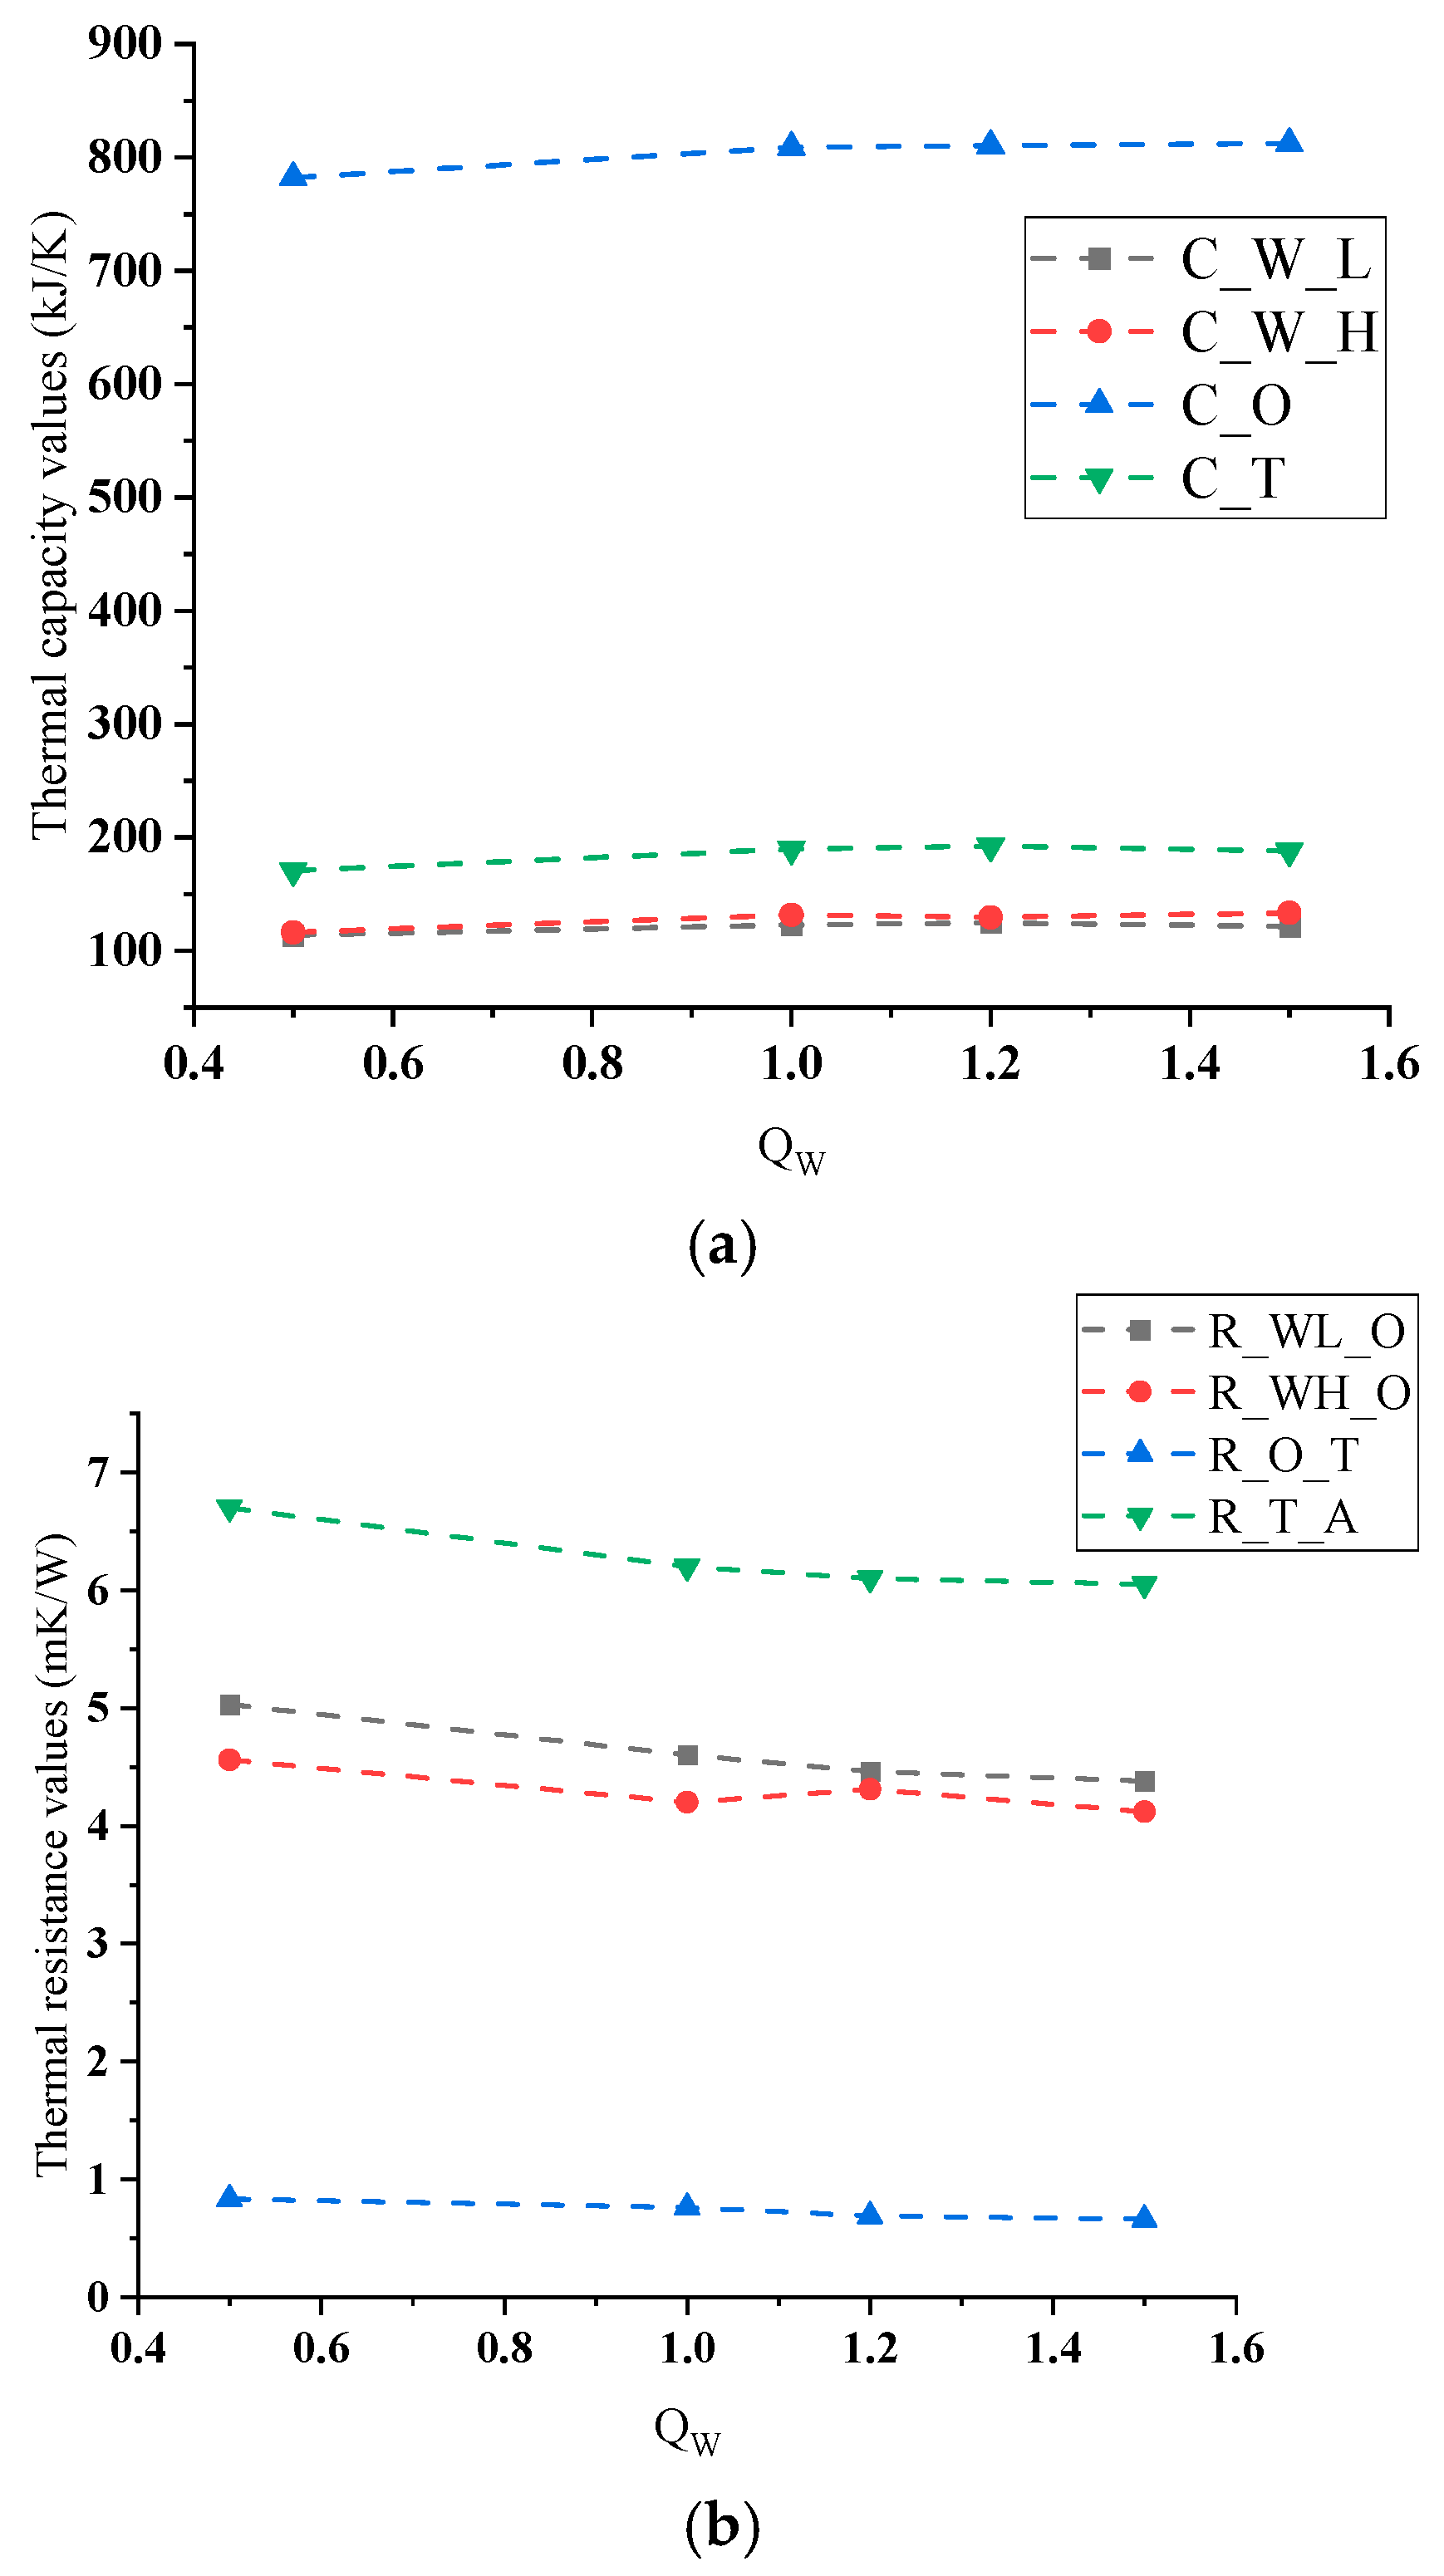
The total losses that need to be applied during temperature rise tests increase with the capacity of the transformer. Conducting temperature rise tests on high-capacity transformers at low power and for short periods of time can save energy. To investigate the accuracy and feasibility of parameter identification under different loss power conditions, parameter identification was performed on the same 800 kVA transformer at 0.5 QW, 1.0 QW, 1.2 QW, and 1.5 QW. The curve of the root mean square error, calculated according to Equation (10) with the change in evolutionary generation, is shown in Figure 12, and the identification results of thermal capacity and thermal resistance under different power levels are shown in Figure 13.
Figure 12 shows that the parameter fitting results at different power levels gradually converge as the number of evolutionary generations increases. The RMSE at 200 generations is well below 5, indicating that the top-layer oil temperature fits well at all power levels. The results in Figure 13 show that the identified parameters vary within a small range, indicating that the proposed method is numerically stable for various power conditions.
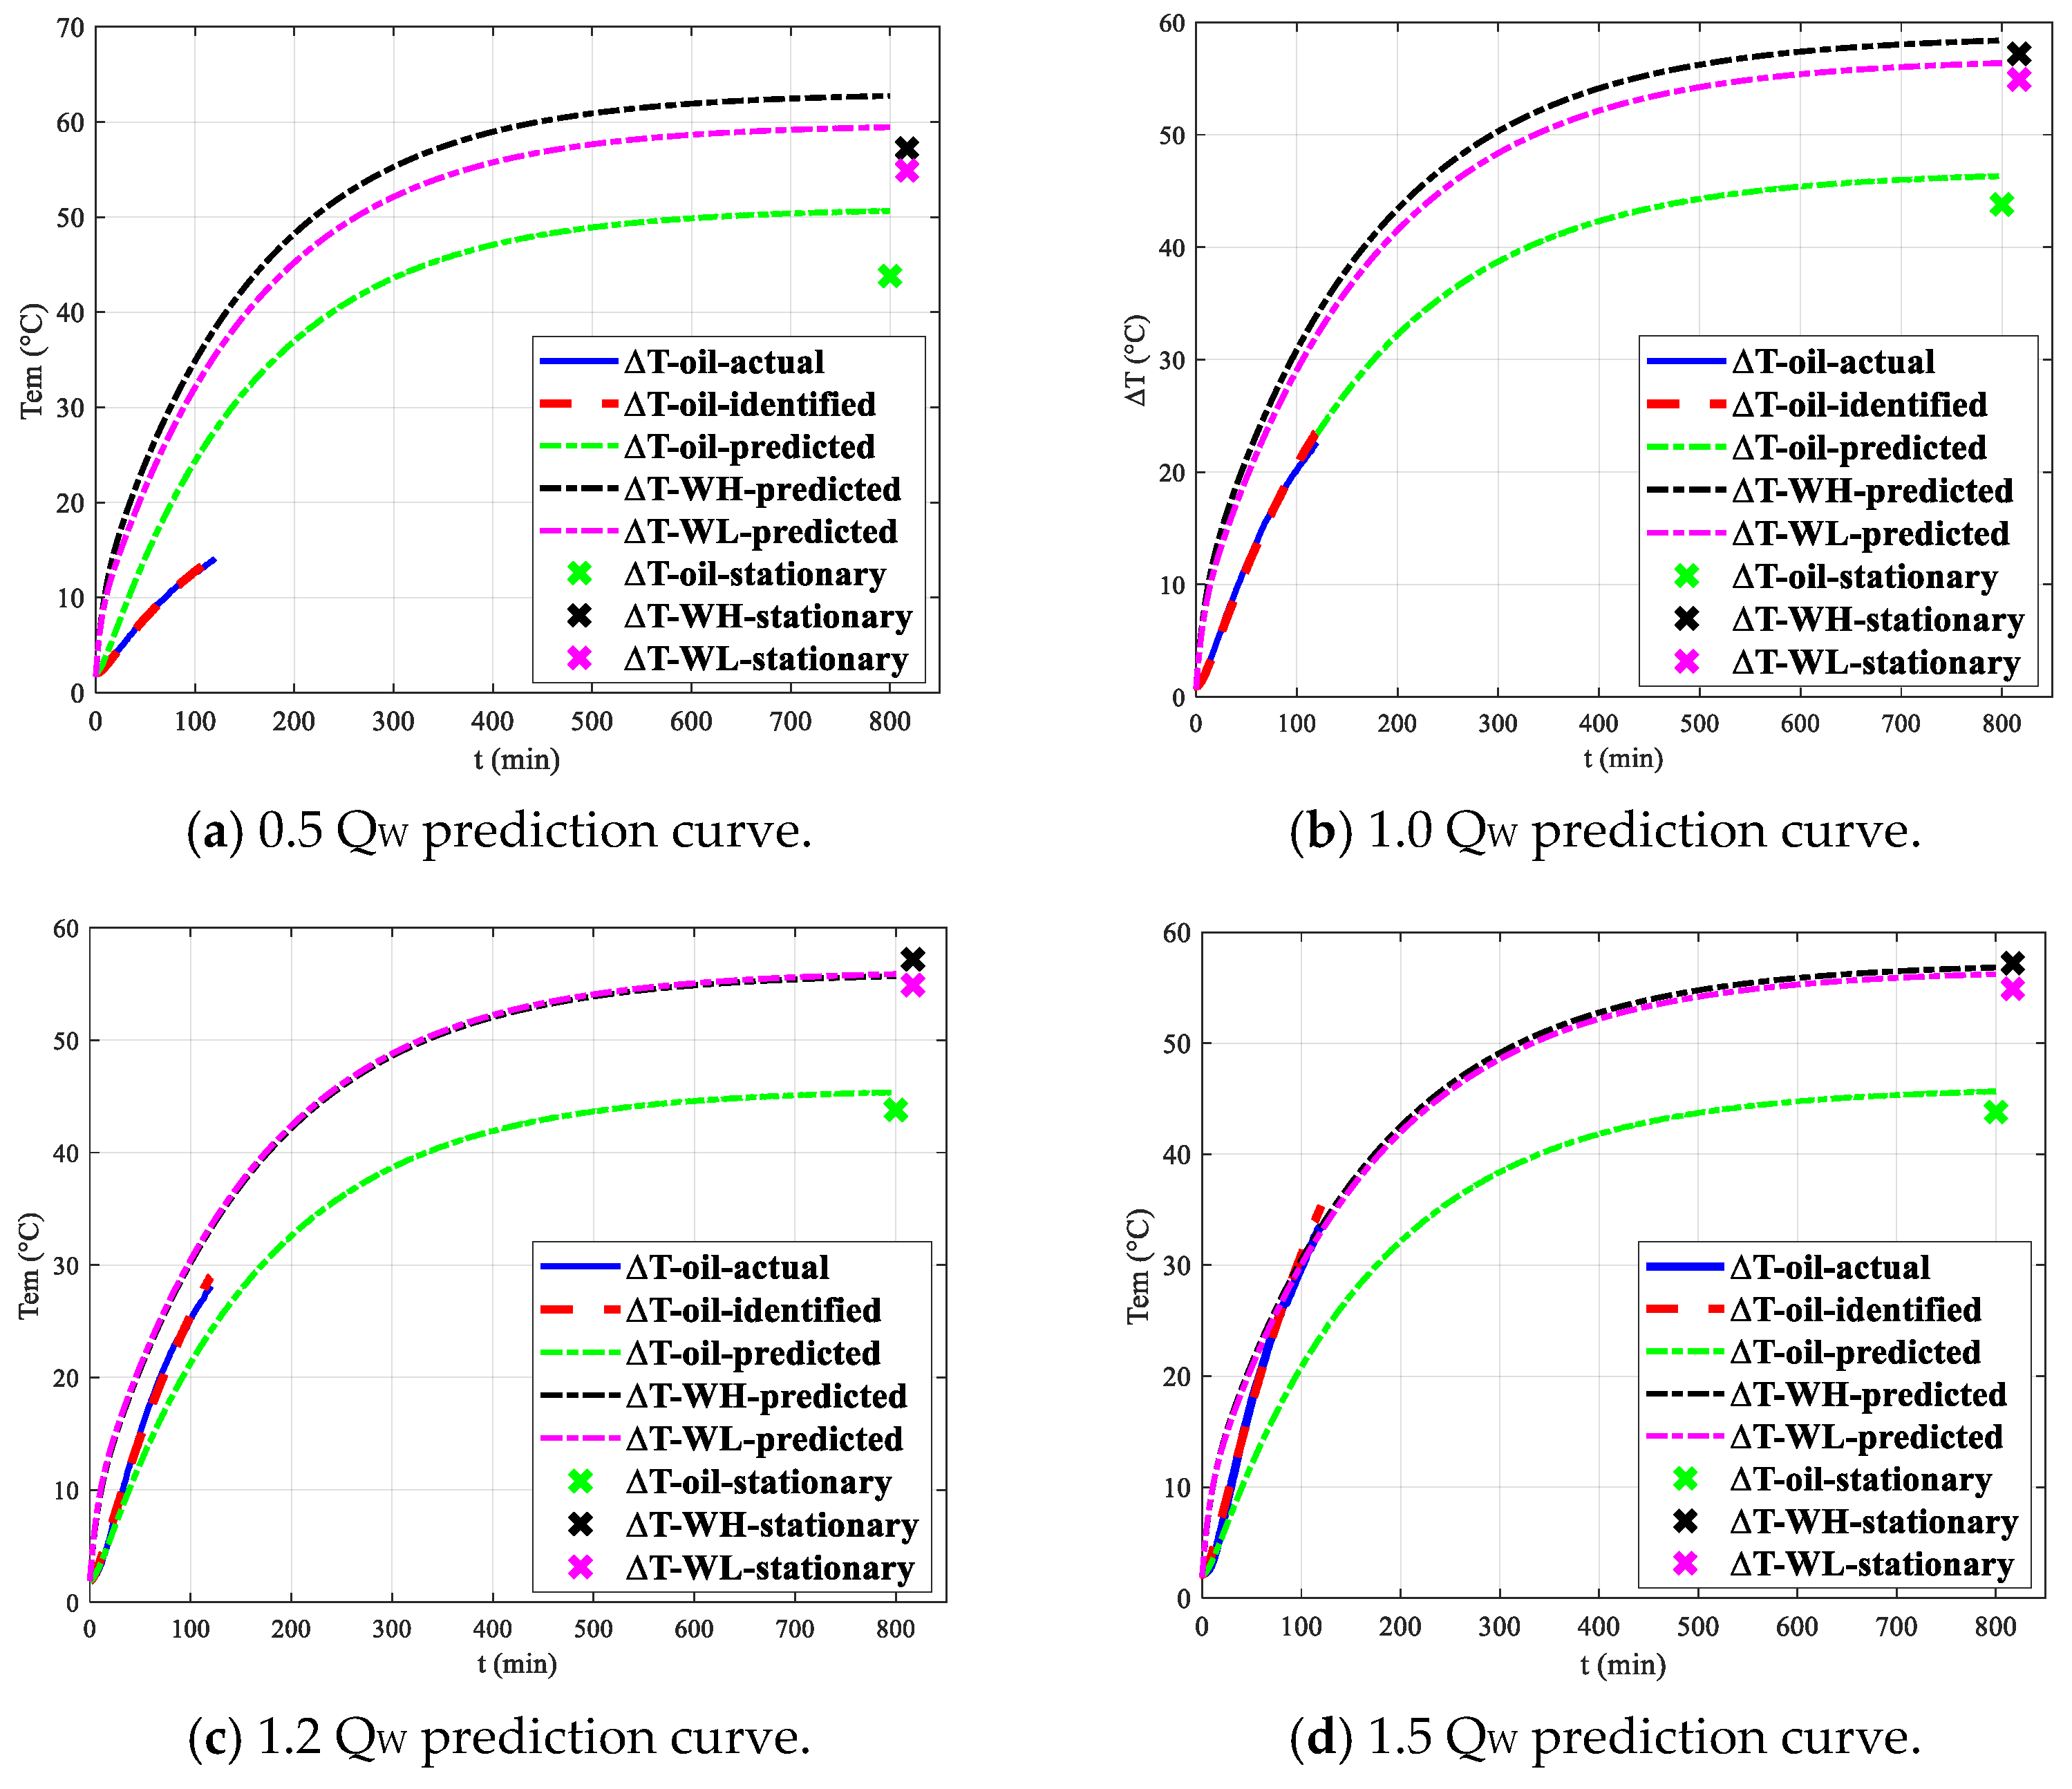
The identification results were used to predict the temperature rise curve under 1 times the total loss, and the results are shown in Figure 14.
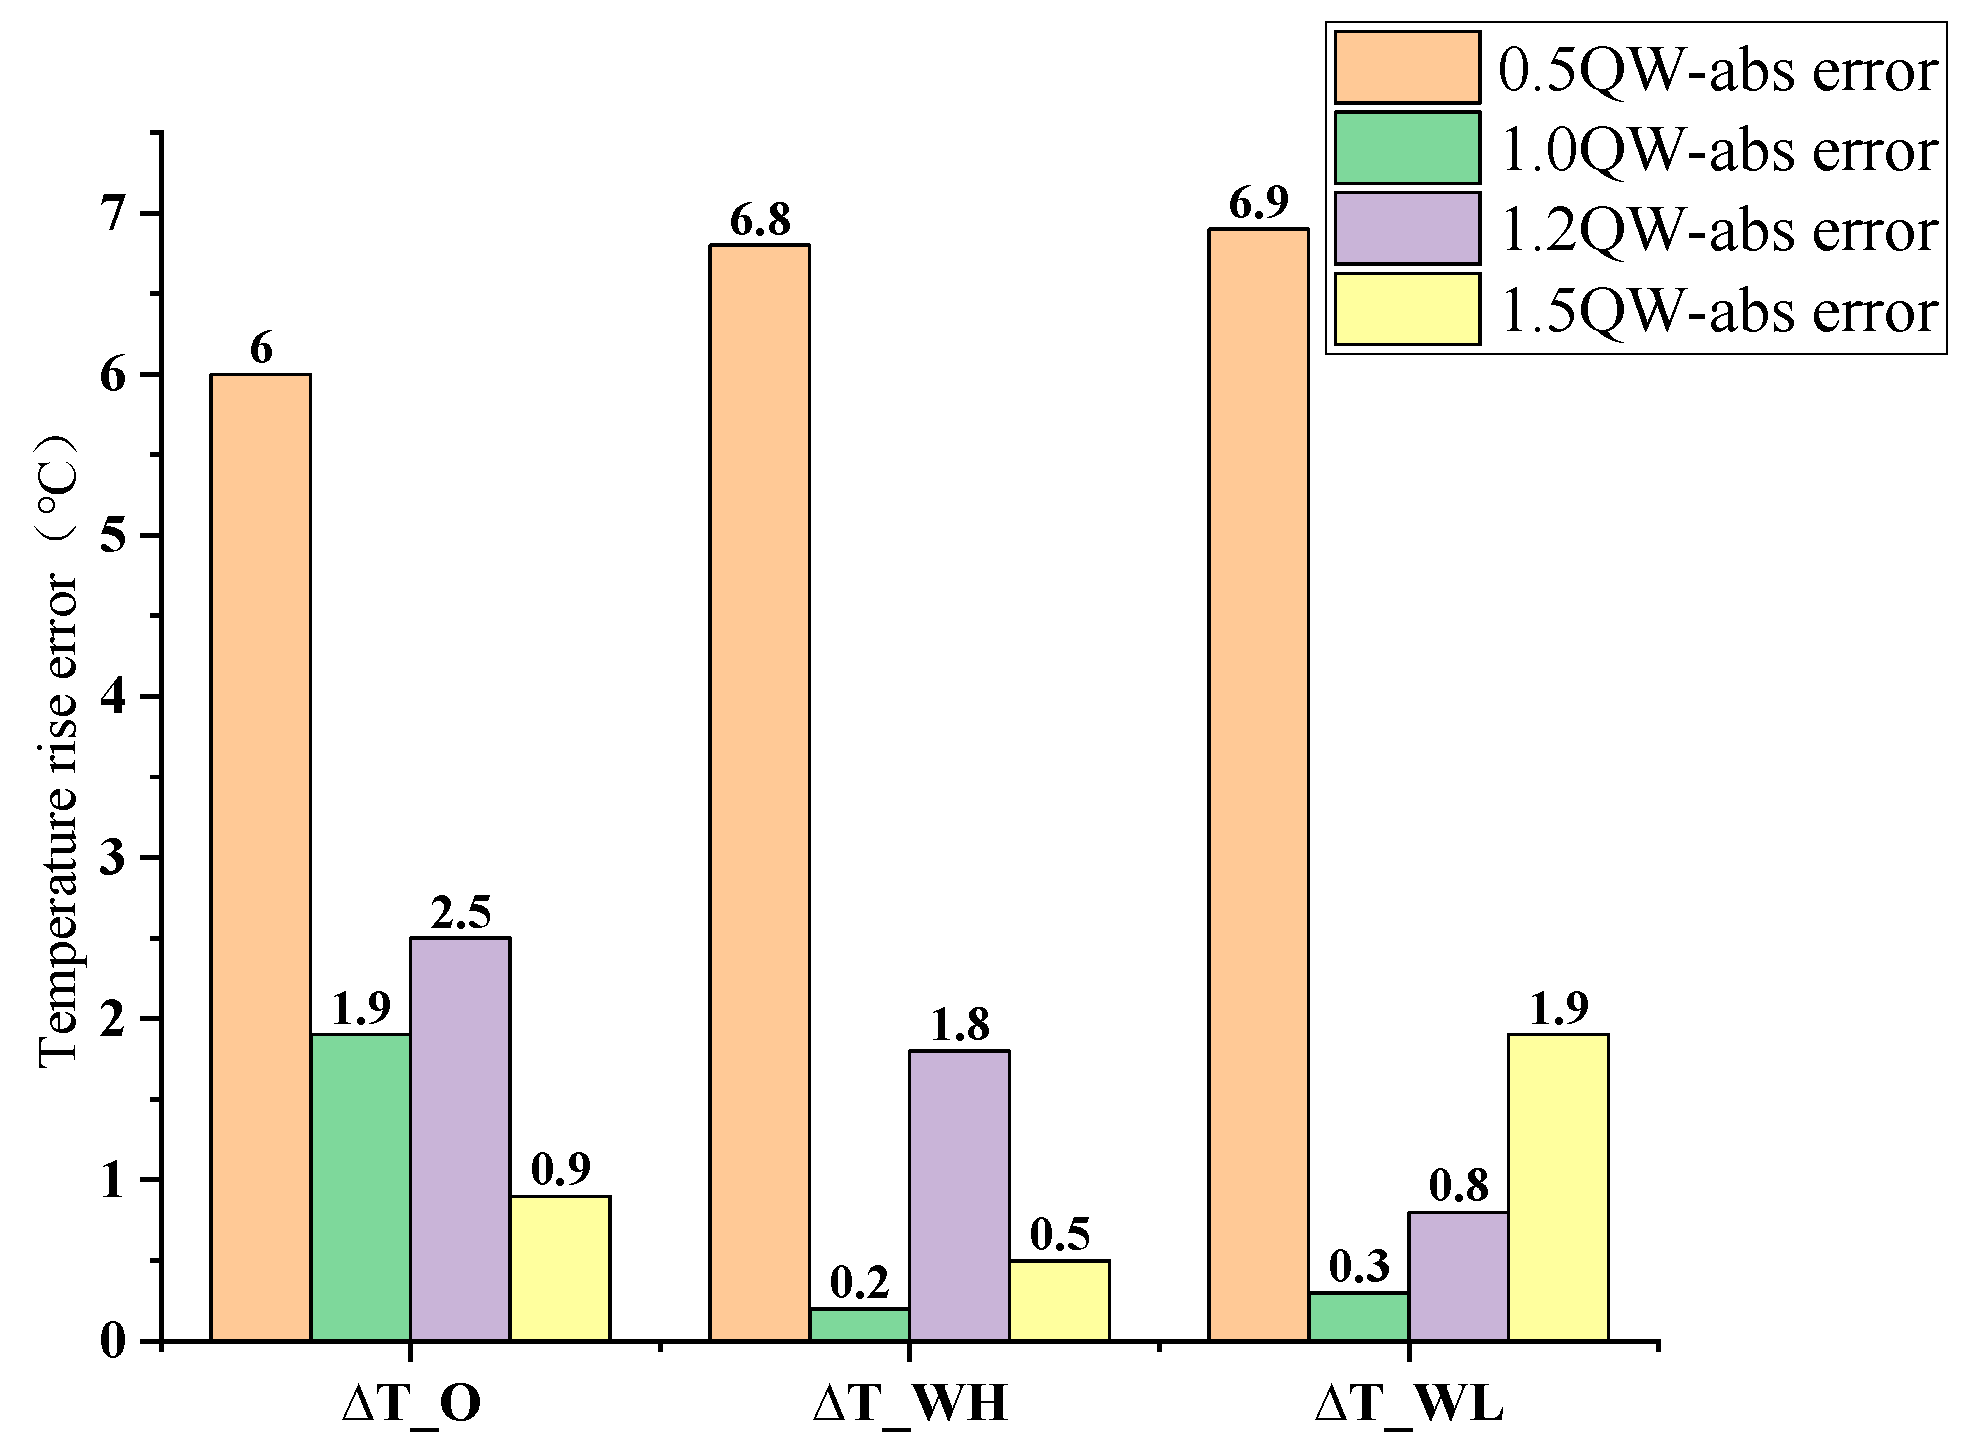
As shown by the results, in the 2 h temperature rise test, the temperature increases in the top-layer oil at four different power loss levels were 14.7 °C, 23 °C, 28.1 °C, and 35.4 °C. The normalized temperature rises to QW are 29.4 °C/QW, 23 °C/QW, 23.4 °C/QW, and 23.6 °C/QW. The above results indicate that measurement results at 0.5 times the total loss may be influenced by system nonlinearity and measurement errors under low temperature rise conditions. Temperature rises above 1 times the total loss are within the permissible error range and conform to the response characteristics of a linear system. The steady-state top-layer oil temperature prediction errors at four different power loss levels are shown in Figure 15.
Figure 15 shows that among the thermal circuit model parameters identified under different power loss conditions, the parameters identified using 1, 1.2, and 1.5 times the total power loss are accurate for predicting the temperature rise. This is due to the system nonlinearity at low temperature rises.
Based on the results shown in Figure 13, Figure 14 and Figure 15, a fundamental analysis of the cause reveals that the nonlinear temperature rise at low power levels caused a shift in the parameter identification results, thereby increasing the prediction error. Therefore, the temperature rise from tests conducted at 1 times the total loss can be used to predict the temperature rise in the windings and top-layer oil.

4. Discussion and Conclusions

This study proposes a fifth-order thermal circuit model, identifies the model parameters from the first two-hour temperature test, and predicts the steady-state temperature. The conclusions are as follows:
(1)
The thermal resistance of the low-voltage winding is higher than that of the high-voltage winding. The oil–solid thermal resistance is significantly lower than the solid–gas thermal resistance. The parameter variation range for transformers of the same capacity, but different individuals, is lower than 10%;
(2)
The results indicate a positive correlation between thermal capacity and losses. A negative relationship was found between the thermal resistance and capacity. This coincides with the necessity to enhance the efficiency of heat dissipation in transformer design as the capacity increases;
(3)
The maximum absolute error of the calculated temperature is 2.9 °C. When the loss power is only half of the rated losses, the prediction error increases substantially, reaching a maximum of 6.9 °C. This can be attributed to the nonlinear characteristic shift exhibited by the transformer’s thermal system under low loss power conditions.
The method proposed in this paper can reduce the temperature rise test to 2 h. It is a fast, energy-efficient approach for the rapid assessment of transformers’ thermal performance.

Author Contributions

Methodology, G.W. and F.Z.; Software, G.W.; Investigation, G.W.; Resources, Y.H., L.W., J.L., H.W. and Z.Z.; Writing—original draft, G.W.; Writing—review & editing, G.W.; Supervision, Z.Z. All authors have read and agreed to the published version of the manuscript.

Funding

This research was funded by the Science and Technology Project of the State Grid Corporation of China, grant number [5700-202319605A-3-2-ZN]. And The APC was funded by [5700-202319605A-3-2-ZN].

Data Availability Statement

The original contributions presented in the study are included in the article, further inquiries can be directed to the corresponding author.

Acknowledgments

This paper is funded by the Science and Technology Project of the State Grid Corporation of China [Project Name: Research and Application of Key Technologies for Intelligent Control of Edge-Cloud Collaborative Power Material Logistics, Project No: 5700-202319605A-3-2-ZN].

Conflicts of Interest

Authors Yujia Hu, Yujia Hu, Zhiyao Zheng were employed by the company Zhejiang Huadian Equipment Testing and Research Institute Co., Ltd. Authors Li Wang, Huiying Weng were employed by the company State Grid Zhejiang Electric Power Co., Ltd. Materials Branch. The remaining authors declare that the research was conducted in the absence of any commercial or financial relationships that could be construed as a potential conflict of interest.

References

  1. Wen, Q.; Baohui, Z.; Zhiguo, H.; Zhiqian, B. Simulation and analysis of oil-immersed transformer based on thermal-fluid coupled field. In Proceedings of the 2014 International Conference on Power System Technology, Chengdu, China, 20–22 October 2014. [Google Scholar]
  2. Hao, Y.; Zhang, Z.; Xiao, J.; Zhao, H.; Yang, Y.; Dong, Z. Study on Thermal Characteristics of Winding Under Inter-Turn Fault of Oil-Immersed Transformer. Electronics 2024, 13, 2869. [Google Scholar] [CrossRef]
  3. Kalić, D.; Radaković, Z.; Lazarević, Z.; Radosavljević, R. On the determination of characteristic temperatures in power oil transformers during transient states. Arch. Für Elektrotechnik 1993, 76, 457–468. [Google Scholar] [CrossRef]
  4. Liao, C.; Ruan, J.; Liu, C.; Wen, W.; Du, Z. 3-D Coupled Electromagnetic-Fluid-Thermal Analysis of Oil-Immersed Triangular Wound Core Transformer. IEEE Trans. Magn. 2014, 50, 1–4. [Google Scholar] [CrossRef]
  5. Wang, Q.; Yang, X.; Peng, Z.; Liu, P. 3D Coupled Electromagnetic-Thermal-Fluid Method for Computation of Temperature Field of Converter Transformer RIP Bushings. Proc. CSEE 2016, 36, 6269–6275. [Google Scholar] [CrossRef]
  6. Torriano, F.; Chaaban, M.; Picher, P. Numerical study of parameters affecting the temperature distribution in a disc-type transformer winding. Appl. Therm. Eng. 2010, 30, 2034–2044. [Google Scholar] [CrossRef]
  7. Susa, D.; Lehtonen, M.; Nordman, H. Dynamic thermal modelling of power transformers. IEEE Trans. Power Deliv. 2005, 20, 197–204. [Google Scholar] [CrossRef]
  8. Swift, G.; Molinski, T.S.; Lehn, W. A fundamental approach to transformer thermal modeling, I. Theory and equivalent circuit. IEEE Trans. Power Deliv. 2002, 16, 171–175. [Google Scholar] [CrossRef]
  9. Gerling, D.; Dajaku, G. Novel lumped-parameter thermal model for electrical systems. In Proceedings of the 2005 European Conference on Power Electronics and Applications, Dresden, Germany, 11–14 September 2005. [Google Scholar] [CrossRef]
  10. Li, H.; Liu, Y.; Zhuang, X.; Xiao, H.; Fan, X.; Wang, J.; Li, X.; Jiang, T. Test and Analysis on Extended Temperature Rise of 110 kV Transformer Based on Distributed Temperature Sensing. IEEE Trans. Power Deliv. 2023, 38, 1030–1041. [Google Scholar] [CrossRef]
  11. Tembo, F.; Bragone, F.; Laneryd, T.; Barreau, M.; Morozovska, K. Data-Driven vs Traditional Approaches to Power Transformers’ Top-Oil Temperature Estimation. arXiv 2025, arXiv:2501.16831. [Google Scholar]
  12. Wang, L.; Zhou, L.; Tang, H.; Wang, D.; Cui, Y. Numerical and experimental validation of variation of power transformers’ thermal time constants with load factor. Appl. Therm. Eng. 2017, 126, 939–948. [Google Scholar] [CrossRef]
  13. Córdoba, P.A.; Silin, N.; Osorio, D.; Dari, E. An experimental study of natural convection in a distribution transformer slice model. Int. J. Therm. Sci. 2018, 129, 94–105. [Google Scholar] [CrossRef]
  14. Picanço, A.F.; Martinez, M.L.; Rosa, P.C. Bragg system for temperature monitoring in distribution transformers—ScienceDirect. Electr. Power Syst. Res. 2010, 80, 77–83. [Google Scholar] [CrossRef]
  15. Liu, Y.; Li, X.; Li, H.; Wang, J.; Fan, X. Experimental and Numerical Investigation of the Internal Temperature of an Oil-Immersed Power Transformer with DOFS. Appl. Sci. 2020, 10, 5718. [Google Scholar] [CrossRef]
  16. Huang, Y.C.; Huang, C.M. Evolving wavelet networks for power transformer condition monitoring. IEEE Power Eng. Rev. 2007, 22, 63. [Google Scholar] [CrossRef]
  17. Feng, J.; Feng, Z.; Jiang, G.; Zhang, G.; Jin, W.; Zhu, H. A Prediction Method for the Average Winding Temperature of a Transformer Based on the Fully Connected Neural Network. Appl. Sci. 2024, 14, 6841. [Google Scholar] [CrossRef]
  18. Song, H.; Yao, H.; Wei, X.; Qin, H.; Li, Y.; Lv, K.; Chen, Q. Experimental Study on Fire Suppression of the Outdoor Oil-Immersed Transformer by High-Pressure Water Mist System. Fire 2023, 6, 238. [Google Scholar] [CrossRef]
  19. You, Y.; Shao, K.; Yi, Z. Dynamic Heat Dissipation Model of Distributed Parameters for Oil-Directed and Air-Forced Traction Transformers and Its Experimental Validation. Entropy 2023, 25, 457. [Google Scholar] [CrossRef]
  20. Liu, L.; Longfei, L.; Houguang, C.; Zhang, F.; Jin, M.; Zhang, W.; Zhijie, G.; Zhaoguang, D. Research of the Loss of Power Transformer Structure. IEEJ Trans. Electr. Electron. Eng. 2022, 2320, 012017. [Google Scholar]
  21. Wang, P.; Cao, H.; Xiao, J. Structure Design of a Four-Pillar Magnetically Integrated Fractional-Turn Planar Transformer and its Loss Analysis. IEEJ Trans. Electr. Electron. Eng. 2025, 20, 208–216. [Google Scholar] [CrossRef]
  22. Dou, M.; Zhao, W.; Zhang, L.; Sun, Y. Analysis of Parasitic Parameters and Winding Loss Characteristics of High-Frequency Transformer under Different Winding Structures. J. Phys. Conf. Ser. 2024, 2774, 012029. [Google Scholar] [CrossRef]
  23. Wei, B.; Huang, H.; Fu, C.; Li, H.; Liu, J. Algorithm for Transformer Top-Oil Temperature and Winding Hot-Point Temperature Based on Modified Thermal Circuit Model. East China Electr. Power 2012, 40, 444–447. [Google Scholar]
  24. Xu, W. Review of Studies on the Hot Spot Temperature of Oil-Immersed Transformers. Energies 2024, 18, 74. [Google Scholar] [CrossRef]
  25. Smolyanov, I.; Shmakov, E.; Butusov, D.; Khalyasmaa, A.I. Review of Modeling Approaches for Conjugate Heat Transfer Processes in Oil-Immersed Transformers. Computation 2024, 12, 97. [Google Scholar] [CrossRef]
  26. Taghikhani, M.A. Heat transfer modeling in a transformer using magneto-CFD analysis and GWO algorithm considering dynamic thermal model. Results Eng. 2024, 23, 102856. [Google Scholar] [CrossRef]
  27. Liang, J.; Liang, K.; Shao, Z.; Niu, Y.; Song, X.; Sun, P.; Feng, J. Research on Temperature-Rise Characteristics of Motor Based on Simplified Lumped-Parameter Thermal Network Model. Energies 2024, 17, 4717. [Google Scholar] [CrossRef]
  28. Jin, N.S.; Xu, X.P.; Wen, H.M.; Zhang, X. Thermal Behavior Calculation Model of Oil-immersed Transformer Winding Based on Thermoelectric Analogy Theory. Control Instrum. Chem. Ind. 2019, 725–730. [Google Scholar] [CrossRef]
  29. Tang, W.H.; Wu, Q.H. Thermoelectric Analogy Thermal Models of Power Transformers. In Condition Monitoring and Assessment of Power Transformers Using Computational Intelligence. Power Systems; Springer: London, UK, 2011; pp. 55–71. [Google Scholar] [CrossRef]
  30. Ding, Y.Q.; Zhang, Q.G.; Gao, M.; Li, Y.; Zhao, Y.; Yang, W.H. Distributed Thermal Circuit Model of Oil-immersed Distribution Transformers. High Volt. Eng. 2019, 45, 968–974. [Google Scholar] [CrossRef]
  31. Wang, F.W.; Zhou, X.; Gao, P.; Xi, X.G. Improved Thermal Circuit Model of Hot Spot Temperature in Oil-immersed Transformers Based on Heat Distribution of Winding. High Volt. Eng. 2015, 41, 895–901. [Google Scholar] [CrossRef]
  32. Weigen, C.; Chong, P.; Yuxin, Y. Power transformer top-oil temperature model based on thermal-electric analogy theory. Eur. Trans. Electr. Power Eng. 2009, 19, 341–354. [Google Scholar] [CrossRef]
  33. Mikhak-Beyranvand, M.; Faiz, J.; Rezaeealam, B. Thermal Analysis of Power Transformer Using an Improved Dynamic Thermal Equivalent Circuit Model. Electr. Power Compon. Syst. 2019, 47, 1598–1609. [Google Scholar] [CrossRef]
  34. Moradi, M.H.; Abedini, M.A. Combination of Genetic Algorithm and Particle Swarm Optimization for Optimal Distributed Generation Location and Sizing in Distribution Systems with Fuzzy Optimal Theory. Int. J. Green Energy 2012, 9, 641–660. [Google Scholar] [CrossRef]
  35. Soltani, H.; Shafiei, S. Heat exchanger networks retrofit with considering pressure drop by coupling genetic algorithm with LP (linear programming) and ILP (integer linear programming) methods. Energy 2011, 36, 2381–2391. [Google Scholar] [CrossRef]
  36. IEC 60076-2-2011; Power Transformers—Part 2: Temperature Rise of Liquid-Immersed Transformers. IEC: Geneva, Switzerland, 2012.
  37. C57.91-2011; IEEE Guide for Loading Mineral-Oil-Immersed Transformers and Step-Voltage Regulators. IEEE: New York, NY, USA, 2012. [CrossRef]
Figure 1. Fifth-order thermal circuit modeling of oil-immersed transformers.
Energies 18 04707 g001
Figure 2. Diagram of the load test.
Energies 18 04707 g002
Figure 3. 400 kVA oil-immersed transformer temperature rise test platform.
Energies 18 04707 g003
Figure 4. Top oil temperature measuring point.
Energies 18 04707 g004
Figure 5. Changes in RMSE of three 400 kVA transformers with the number of generations.
Energies 18 04707 g005
Figure 6. Comparison of predicted and measured temperature rise in three 400 kVA transformers.
Energies 18 04707 g006
Figure 7. Thermal resistance identification results for a 400 kVA transformer.
Energies 18 04707 g007
Figure 8. Identification results of thermal capacity and thermal resistance parameters for 400-, 630-, and 800 kVA-capacity transformers.
Energies 18 04707 g008
Figure 9. Temperature identification and prediction results for 630- and 800 kVA-capacity transformers.
Energies 18 04707 g009
Figure 10. Changes in RMSE of 630 kVA and 800 kVA transformers with the number of generations.
Energies 18 04707 g010
Figure 11. Comparison of steady-state measured and predicted temperature rise at each node for 630- and 800 kVA-capacity transformers.
Energies 18 04707 g011
Figure 12. RMSE of parameter identification for 800 kVA-capacity transformers under different power losses as a function of the number of evolutionary generations.
Energies 18 04707 g012
Figure 13. Parameter identification results for an 800 kVA transformer under different power loss conditions. (a) Identification results of thermal capacity parameters at different power levels. (b) Identification results of thermal resistance parameters at different power levels.
Energies 18 04707 g013
Figure 14. Comparison of temperature predictions based on different loss power identification parameters for 800 kVA transformers.
Energies 18 04707 g014
Figure 15. Comparison of node steady-state predicted temperature vs. ambient temperature rise vs. actual temperature rise difference for 0.5QW, 1.0QW, 1.2QW, and 1.5QW.
Energies 18 04707 g015
Table 1. Parameter comparison in thermoelectric analogy method.
Thermal ParametersElectrical Parameters
Heat output q/WCurrent i/A
Temperature T/KVoltage u/V
Thermal resistance Rth/(K·W−1)Resistor Rel
Thermal capacitor Cth/(J·K−1)Capacitance Cel/F
Table 2. Hot circuit model parameter comparison table.
ParametersNotationUnit
High-voltage winding lossQWHW
Low-voltage winding lossQWLW
Core lossQCW
Core thermal capacityCCJ/K
High-voltage winding thermal capacityCWHJ/K
Low-voltage winding thermal capacityCWLJ/K
Oil thermal capacityCoJ/K
Tank thermal capacityCTJ/K
Core to oil thermal resistanceRC-OK/W
High-voltage winding to oil thermal resistanceRWH-OK/W
Low-voltage winding to oil thermal resistanceRWL-OK/W
Oil to tank thermal resistanceRO-TK/W
Tank to ambient thermal resistanceRT-AK/W
Core average temperatureTCK
High-voltage winding temperatureTWHK
Low-voltage winding temperatureTWLK
Top oil temperatureTOK
Tank temperatureTTK
Ambient temperatureTAK
Table 3. Genetic algorithm parameter settings table.
Parameter TypeParameter Value/Method Name
Population size150
Crossover probability0.6
Mutation probability0.1
Number of generations200
Operator selection methodRoulette wheel selection
Operator crossover methodUniform crossover
Operator mutation methodAdaptive mutation
Table 4. Test transformer parameters.
ModelCapacity/kVALoad Loss/kWNo-Load Loss/kWHV/LV Winding DC Resistance (75 °C)
S20-M-400/104003.6150.373.312 Ω/1.494 mΩ
S20-M-630/106304.960.61.771 Ω/0.809 mΩ
S20-M-800/108006.00.631.483 Ω/0.464 mΩ
Table 5. Comparison of steady-state values at each temperature node (All unit values below are in °C.).
NumberTA_Final/TA_SetTemperature NodeTActual/TPredicted∆TActual = TActual – TA_Final∆TPredicted = TPredicted – TA_SetError = |∆TPredicted − ∆TActual|
400kVA-114.8/11.9TO58.8/55.144.145.00.9
TWH68.4/64.753.654.10.5
TWL69.8/66.855.057.92.9
400kVA-215.3/10.7TO57.9/53.742.643.00.4
TWH71.2/63.855.953.12.8
TWL70.1/67.354.856.60.8
400kVA-333.6/28.9TO79.8/73.146.244.22
TWH85.4/81.751.852.81
TWL92.5/85.758.956.82.1
Disclaimer/Publisher’s Note: The statements, opinions and data contained in all publications are solely those of the individual author(s) and contributor(s) and not of MDPI and/or the editor(s). MDPI and/or the editor(s) disclaim responsibility for any injury to people or property resulting from any ideas, methods, instructions or products referred to in the content.