1. Introduction
With the global energy structure transforming towards low carbonization, renewable energy represented by wind energy has developed rapidly. As an important component of clean energy, its strategic position in the modern power system has been continuously rising and has become a key support for the adjustment of the energy structure [
1]. However, the stable operation of the power system is facing new tests brought about by the inherent random fluctuations and uncertainties of wind power generation [
2,
3,
4]. Therefore, analyzing the impact mechanism of wind power integration on the power system and developing effective countermeasures is essential for ensuring the system’s safe and stable operation [
5,
6,
7,
8].
Currently, the optimal power flow (OPF) model is no longer sufficient to address new challenges, particularly when dealing with the fluctuating characteristics of new energy sources and their impact on system transient stability [
9,
10,
11]. Reference [
12] employed scenario reduction techniques to reduce the number of deterministic scenarios and improve computational speed. However, this approach considers a comprehensive range of dimensions, which can lead to excessive computational complexity due to the high number of dimensions. Reference [
13] employed fuzzy set theory for uncertainty modeling, but this requires training with historical data, and the nonlinearity and dynamic nature of renewable energy may lead to overfitting or insufficient generalization capabilities. Reference [
14] achieved a good balance between robustness and cost-effectiveness through a combined strategy of data generation and linear decision rules. However, this method relies on meteorological data quality and performs poorly when data are scarce. Reference [
15] employed a Weibull distribution to construct a probability model for wind power output, capturing the uncertainty of renewable energy generation. Yet, wind power output is influenced by multiple factors such as wind speed and direction, making it difficult to reflect complex fluctuating characteristics. Reference [
16] employed data-driven uncertainty sets to simulate renewable energy variability, effectively enhancing the economic efficiency and robustness of hybrid microgrid interconnection planning. It particularly excels in reducing conservatism and improving computational efficiency. Nevertheless, this approach remains highly dependent on historical data quality and retains relatively high computational complexity.
With the large-scale grid connection of new energy sources, the issue of transient stability in power systems has become increasingly prominent. Therefore, incorporating transient stability constraints into the OPF problem and constructing a TSCOPF model that includes new energy sources has become a hot topic of research in the field of power systems [
17,
18,
19,
20]. Traditional TSCOPF models are typically based on deterministic assumptions, making it difficult to effectively handle uncertainties in the system, which may lead to optimization results becoming ineffective in actual operation. Reference [
21] addressed the uncertainty issues related to wind power output and load demand by establishing an opportunity-constrained stochastic OPF model aimed at minimizing the cost of adjusting generator output power. This model comprehensively considers both uncertainty factors and employs an iterative method for the solution process. Reference [
22] constructed a multi-objective distributed robust opportunity-constrained optimization model with the objective of minimizing both system-wide operational costs and carbon emissions. Then, by solving the model, a distributed robust boundary is obtained to address wind power uncertainty, converting the multi-objective distributed robust opportunity-constrained optimization model into a multi-objective deterministic optimization model. However, in the aforementioned studies, if the model does not adequately incorporate considerations of system transient stability during its construction, the optimized configuration may cause the system to operate near the transient stability threshold, increasing the risk of system instability.
Reference [
23] employed fuzzy processing for the power angle constraint, but this approach may result in unclear safety margins and overly conservative optimization outcomes. Reference [
24] employed polynomial chaos expansion and the stochastic Galerkin method to approximate the parametric transient stable trajectory, transforming the original system of differential-algebraic equations into a parametric nonlinear programming problem expressed as a system of algebraic equations. However, this approach has limited capability in approximating strong nonlinearities and non-Gaussian uncertainties. Therefore, to overcome the shortcomings of the aforementioned methods, this paper proposes a TSCOPF model that accounts for wind power uncertainty. This method constructs the probability density function of wind power using nonparametric kernel density estimation. A TSCOPF model incorporating renewable energy sources is then constructed. Subsequently, the opportunity constraints are converted into deterministic constraints using a semi-invariant probability flow calculation method based on the desegregated Halton sequence. Next, the ISTOA is used to solve the model. Finally, simulation analysis is conducted on case studies to validate the superiority and effectiveness of the proposed method. Compared to the aforementioned methods, the approach presented in this paper combines flexibility with accuracy in uncertainty modeling, achieves precise conversion of probabilistic constraints in constraint handling, and ensures high-performance solution capabilities for high-dimensional problems in its algorithmic implementation.
2. Uncertainty Modeling
2.1. Nonparametric Kernel Density Estimation of Wind Power Probability Density
Let
be the
n samples of wind power active output
sampled and collected during the sampling period, then the nonparametric kernel density of the wind power probability density function is estimated as
where
is the probability density function of wind power based on nonparametric kernel density estimation,
is the kernel function,
is the
ith sample value of wind power active output, and
l is the bandwidth.
The bandwidth selection is crucial to the accuracy of the fitting, too-small bandwidths easily lead to over-sensitive estimation results, too-large bandwidths lead to the estimation results of the loss of some of the data details, in order to ensure the effect of the error probability distribution fitting, the introduction of an adaptive algorithm for the bandwidth selection based on the integration of the mean square error and the calculation of the optimal bandwidth value of each sample are introduced points.
This paper selects the Gaussian function as the kernel function for estimating the probability density of wind power, with the formula as follows:
The adaptive kernel density estimation function is
where
and
are the bandwidth and weight of sample
i, respectively, and
is the sensitivity factor as 0.5.
2.2. Load Modeling
During power system operation, a variety of factors, including weather changes, customer demand fluctuations, and equipment failures, can lead to load uncertainty, which, in turn, brings challenges to the stable operation of the power grid. Taking active power modeling as an example (similar to reactive power modeling), in order to effectively deal with the uncertainty of the system, this paper adopts a normal distribution to simulate the load uncertainty [
25] modeled as
where
is the active power of the load,
is the standard deviation of the active power of the load, and
is the mean value of the active power of the load.
According to the historical data, the load prediction error probability distribution function, and prediction error superimposed on the predicted value, the load active power actual value can be obtained
as follows:
where
is the load active power prediction value, and
is the load active power prediction error.
3. TSCOPF Modeling
3.1. Objective Function
The objective function is to minimize the total cost
of generator active output adjustment:
where
is the total number of thermal generators,
is the unit cost of upward adjustment of the active output of the
ith thermal generator,
is the unit cost of downward adjustment of its active output,
and
are the amount of upward and downward adjustments of the active output of the
ith generator, respectively.
3.2. Equational Constraint
where
is the total number of system buses,
and
are the active and reactive powers of the thermal generator at the access bus
i,
and
are the active and reactive powers of the generator at access bus
i, respectively,
and
are the active and reactive powers at the load bus
i, and
and
are the active and reactive power functions of the losses between nodes
i and
j related to the voltage magnitude
and phase angle
, respectively.
3.3. Inequality Constraint
Given the stochastic nature of wind power output, the resulting state variables exhibit randomness. Therefore, chance constraints are used to characterize the constraints on these state variables:
where the probability of the inequality in parentheses is expressed by
;
denotes the number of branch circuits in the system;
,
,
, and
denote the probability thresholds of the system to maintain static safety;
and
denote the lower and upper limits of the generator active power in the system;
and
denote the lower and upper limits of the reactive power in the system;
and
denote the lower and upper limits of the node voltage amplitude;
denotes the active power of the branch circuits between nodes
i and
j;
and
denote the lower and upper limits of the branch active power, respectively.
3.4. Transient Stability Constraint
To ensure the dynamic safety of power systems, this paper introduces transient stability constraints (TSCs) as key limiting conditions, with CCT established as the basic evaluation parameter. The CCT metric reflects the maximum fault duration threshold during which the power network can maintain synchronous operation in the event of a fault. Its numerical value directly reflects the grid’s ability to withstand transient instability [
26], as expressed by the following equation:
is the maximum fault duration for the system to maintain transient stability, and
is the time required to complete the fault clearance action. If TSC is positive, the system remains stable; when this indicator turns negative, the system will become unstable. The TSC value is positively correlated with the stability of the system, i.e., the higher the indicator value, the better the stability of the system.
4. Transformation Semi-Invariant Method
The semi-invariant method and point estimation method are mostly used in the calculation of probability trends, so this paper proposes a semi-invariant probability trend calculation method based on the de-randomized Halton sequence, which can reduce the amount of convolutional computation and improve the computational efficiency, as follows.
4.1. Halton Sequence
Halton sequence sampling belongs to a low-discrepancy sequence sampling method, which is computationally efficient, and its adoption value distribution is well characterized.
Any integer
n can be represented by a unique progression greater than 2:
where
is the number of steps;
Define the function
as
From Equation (11), the Vander Corput sequence with base b can be denoted as
. In turn, the
S-dimensional Halton sequence
can be composed of Vander Corput sequences with different primes
as bases:
4.2. De-Randomization Methods
Linear scrambling is a simple and effective method to remove the correlation of Halton sequences, based on the numerical substitution of transformed Halton sequences:
where
is a permutation of the set
. The function
is used for scrambling:
4.3. Calculation of Probabilistic Power Based on the Semi-Invariant Method
The relationship between the semi-invariants and the moments at the origin is as follows:
where
is the origin moment of each order,
is the semi-invariant of each order, and
is the number of combinations.
The nonlinear tidal equation in polar coordinates is Taylor series-expanded at the reference point, omitting the higher terms linearized as
where
is the branch power,
is the node voltage state, subscript
is the reference operating point,
denotes perturbation,
is the node injected power,
is the power function,
is the node function, and
is the Jacobi matrix.
Using Equation (15), the variable
kth order semi-invariant is obtained as
where
is the matrix formed by the kth power of each element of
, and
is the same.
From Equation (17), when
are independent of each other, the
kth order semi-invariance
of the injected power perturbation
at node
i is
where the subscript
of
represents the
ith motor, the subscript
of
represents the
ith load.
The semi-invariance of the output random variable is obtained from Equation (18). This is then combined with the Gram–Charlier series expansion [
27], which, in turn, leads to the probability density function and cumulative distribution function of the output random variable:
where
and
are the cumulative distribution function and probability density function of the random variable, respectively,
is a semi-invariant of order
i, and
is an Ermitian polynomial of order
i.
5. Improved Sooty Tern Optimization Algorithm
5.1. Initialization Process Based on Chaos Theory
The conventional random initialization strategy in the ocelot algorithm often suffers from the defect of uneven distribution of population space, which directly affects the initial exploration performance and final convergence characteristics of the algorithm. To address this problem, circle mapping shows significant optimization effect, which can achieve uniform coverage of individuals in the solution space and effectively prevent local aggregation; at the same time, it can retain the nonlinear correlation relationship between the parameter dimensions and significantly enhance the sampling density of the boundary region; these improvements significantly enhance the global exploration ability and solution accuracy of the algorithm [
28], with the following expression:
where
is the current position of the ocelot, and
is the position of the ocelot after the chaos initialization process.
5.2. Nonlinear Dynamic Evolution of the Collision Avoidance Factor
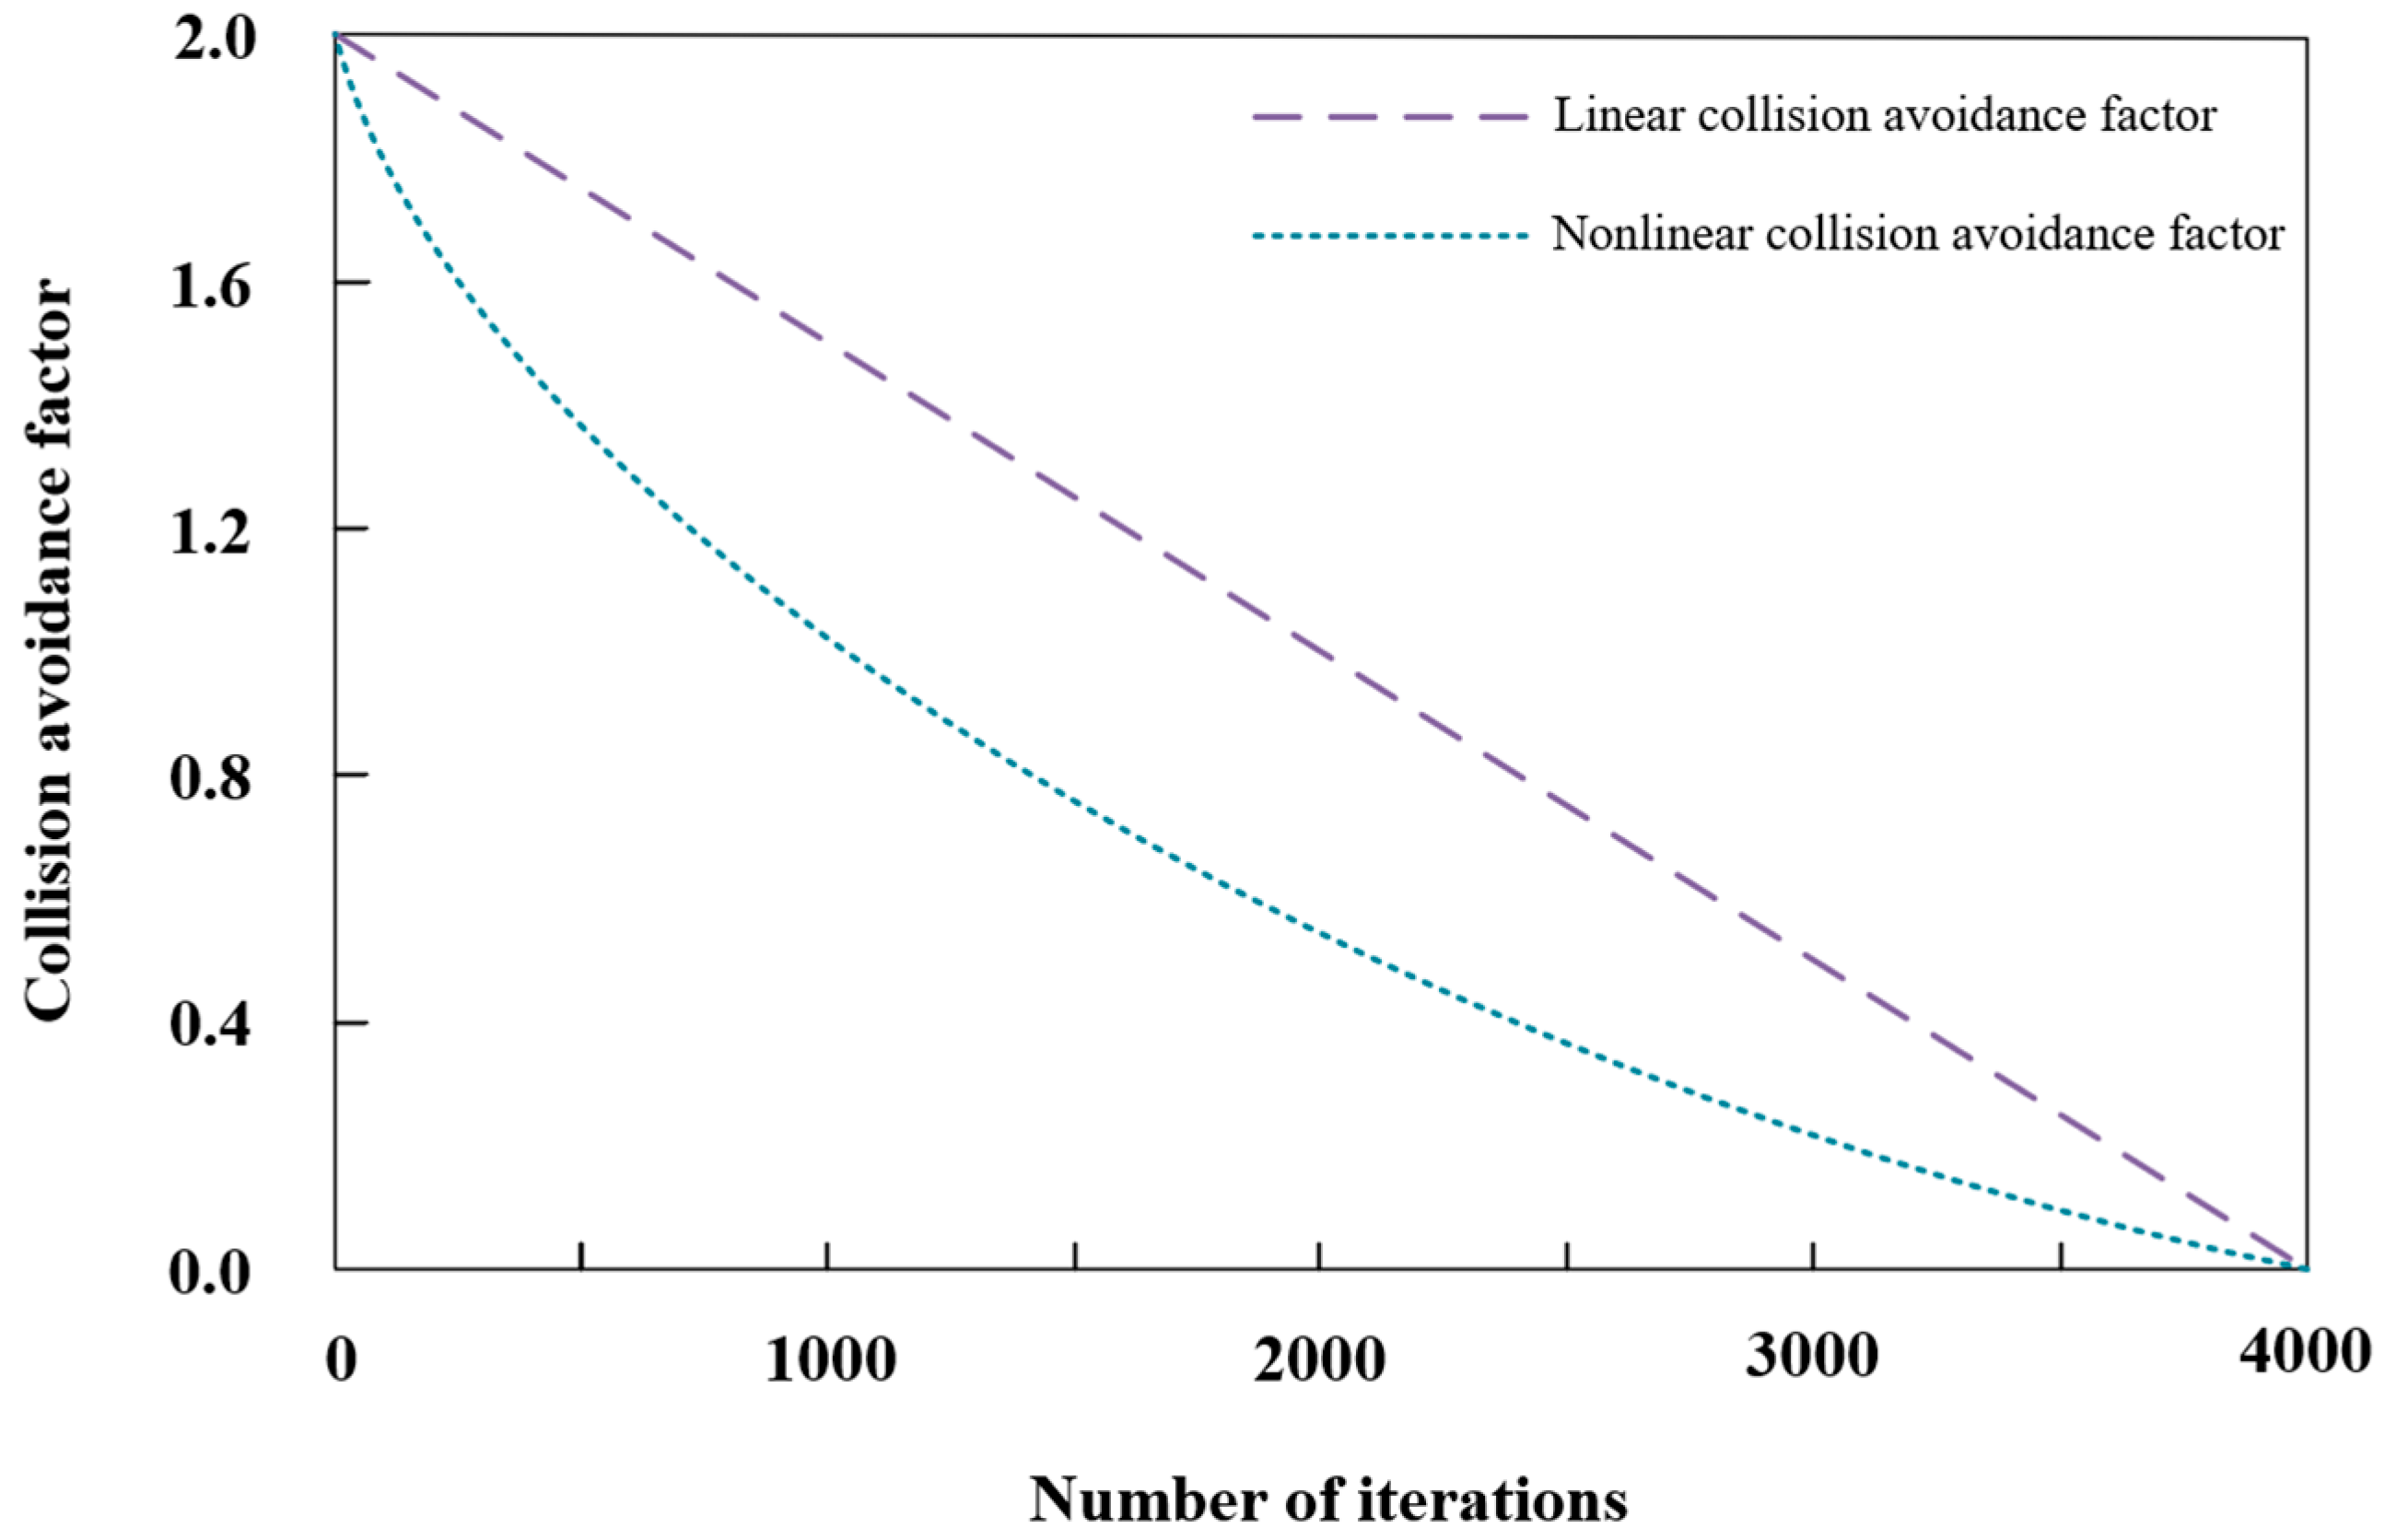
Figure 1 shows that the collision avoidance factor
in the sooty tern optimization algorithm (STOA) tends to decrease linearly with the number of iterations. This variation limits the algorithm’s ability to balance between global and local searches, thus affecting the optimization results. When the value of
is large, the algorithm tends to favor global exploration; when the value of
is small, it focuses more on local exploitation. To enhance the local search ability of STOA, this paper proposes to improve
to a nonlinear decreasing form of sinusoidal control. After the improvement,
changes rapidly at the beginning of the iteration to enhance the global search and slowly at the later stage to improve the local accuracy, which realizes the dynamic adjustment of the search capability. This tuning allows the algorithm to quickly locate potential solution regions in the pre-optimization phase and to perform a fine search for candidate solutions in the later phase. The nonlinear collision avoidance factor
has the following expression:
where
is the current number of evolutionary iterations of the algorithm,
is the maximum number of evolutionary iterations that the algorithm is preset to cap, and
is the conflict avoidance coefficient, which is used to determine the spatial coordinates of the individual adjusted by collision avoidance.
5.3. Levy Flight Mechanism
Levy flight mechanism can effectively enhance the global exploration ability of the algorithm and avoid falling into the local optimal solution due to its unique step size property and random distribution characteristic [
29], and the motion has the expression as follows:
where
is the motion trajectory characteristic of Levi’s flight,
is the spatial coordinates of the ocelot when it performs the feeding behavior,
is the optimal layout point position of the ocelot individual,
is the iteration count of the current algorithm,
is the characteristic radius of each spiral path,
is the position of the ocelot individual after it completes its migration behavior, and
is the random azimuthal angle uniformly distributed in the circumference of the circle.
6. Simulation Analysis
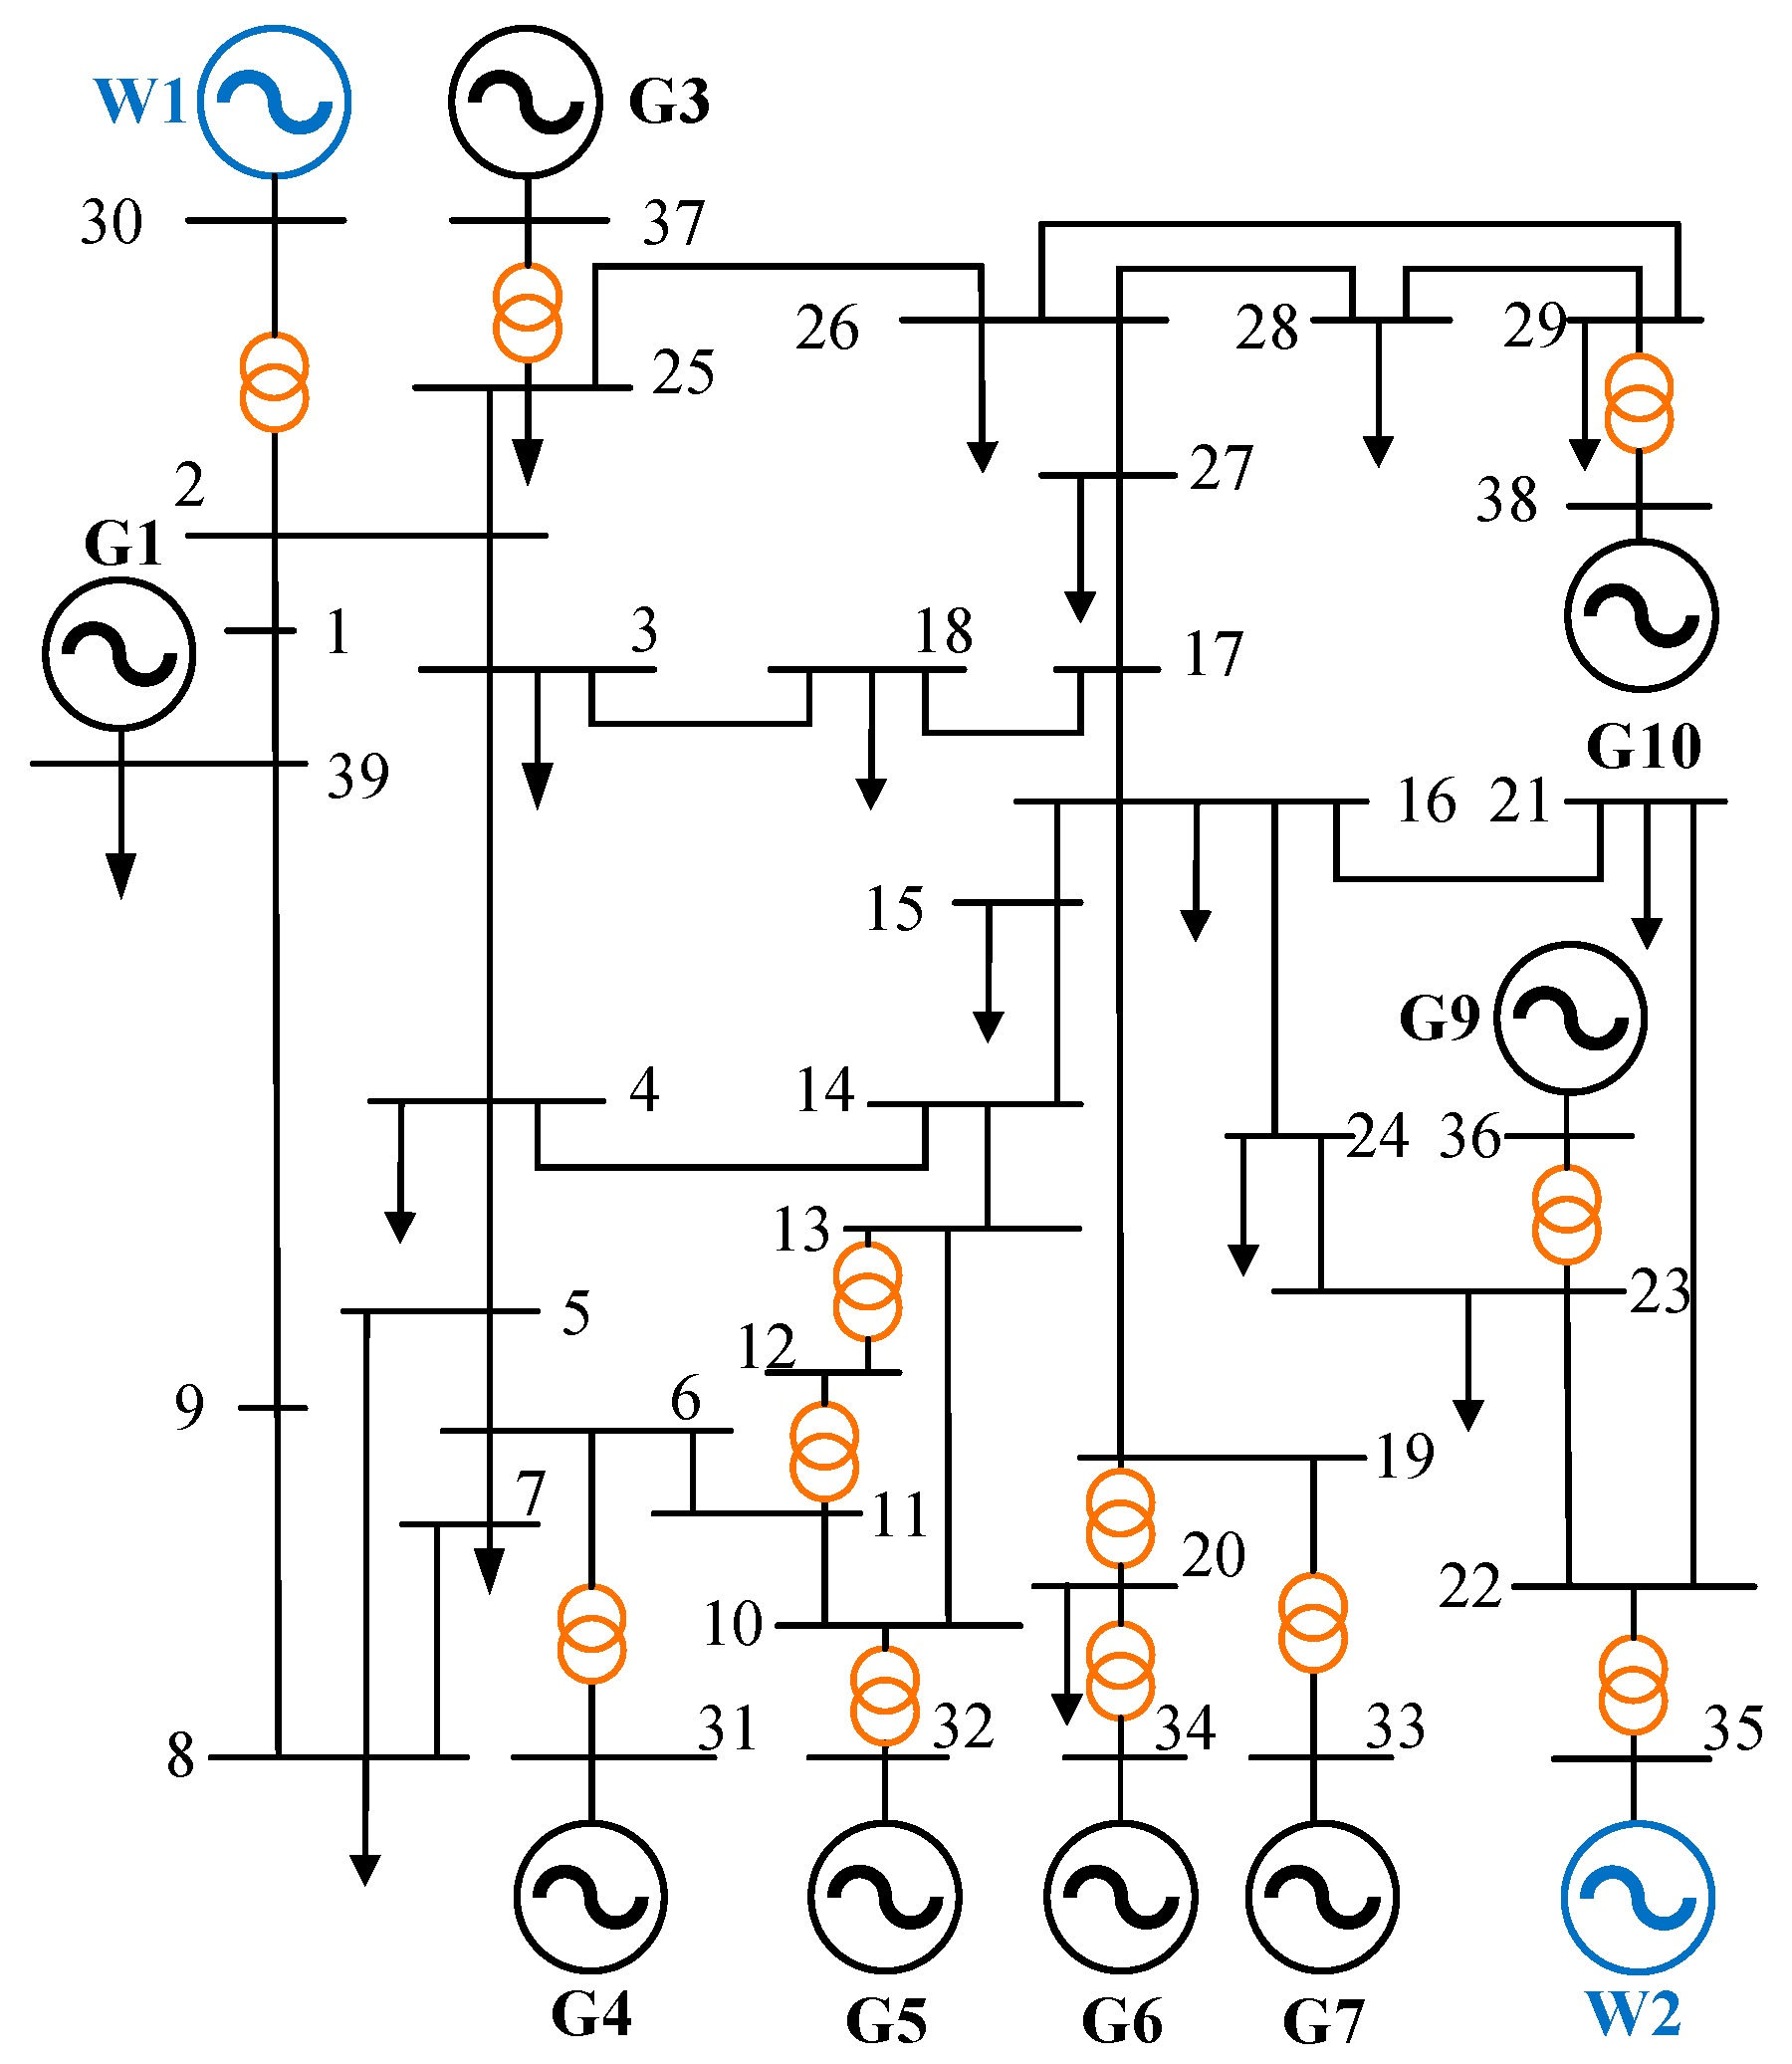
Figure 2 illustrates the modified IEEE 39 bus test system, which contains 10 coal-fired units G1–G10, where G2 and G8 are replaced by wind turbines W1 and W2 with a capacity of 350 MW, respectively. In this paper, simulation experiments and analysis will be performed on this system. In addition, the node voltage amplitude is limited between 1.05 p. u. and 0.95 p. u., and the confidence level probabilities
,
,
, and
are set at 95% for all output random variables. All the simulation experiments are completed on a computer platform configured with Intel Core i7 processor (main frequency 2.3 GHz) and 12 GB memory, and the test program is developed and realized based on the MATLAB 2022a environment.
6.1. Analysis of the Validity and Applicability of Modeling Methods
In order to verify the accuracy of the wind power probability density modeling method proposed in this paper, the following two commonly used metrics are usually used: Mean Absolute Error (MAE) and Root Mean Square Error (RMSE), which physical quantities are denoted by
and
, respectively. The wind power probability density model was established using the modeling method of this paper, Weibull distribution, and mixed Gaussian distribution [
30], respectively, and the distribution model fitting accuracy is shown in
Table 1.
6.2. Model Optimization Effect
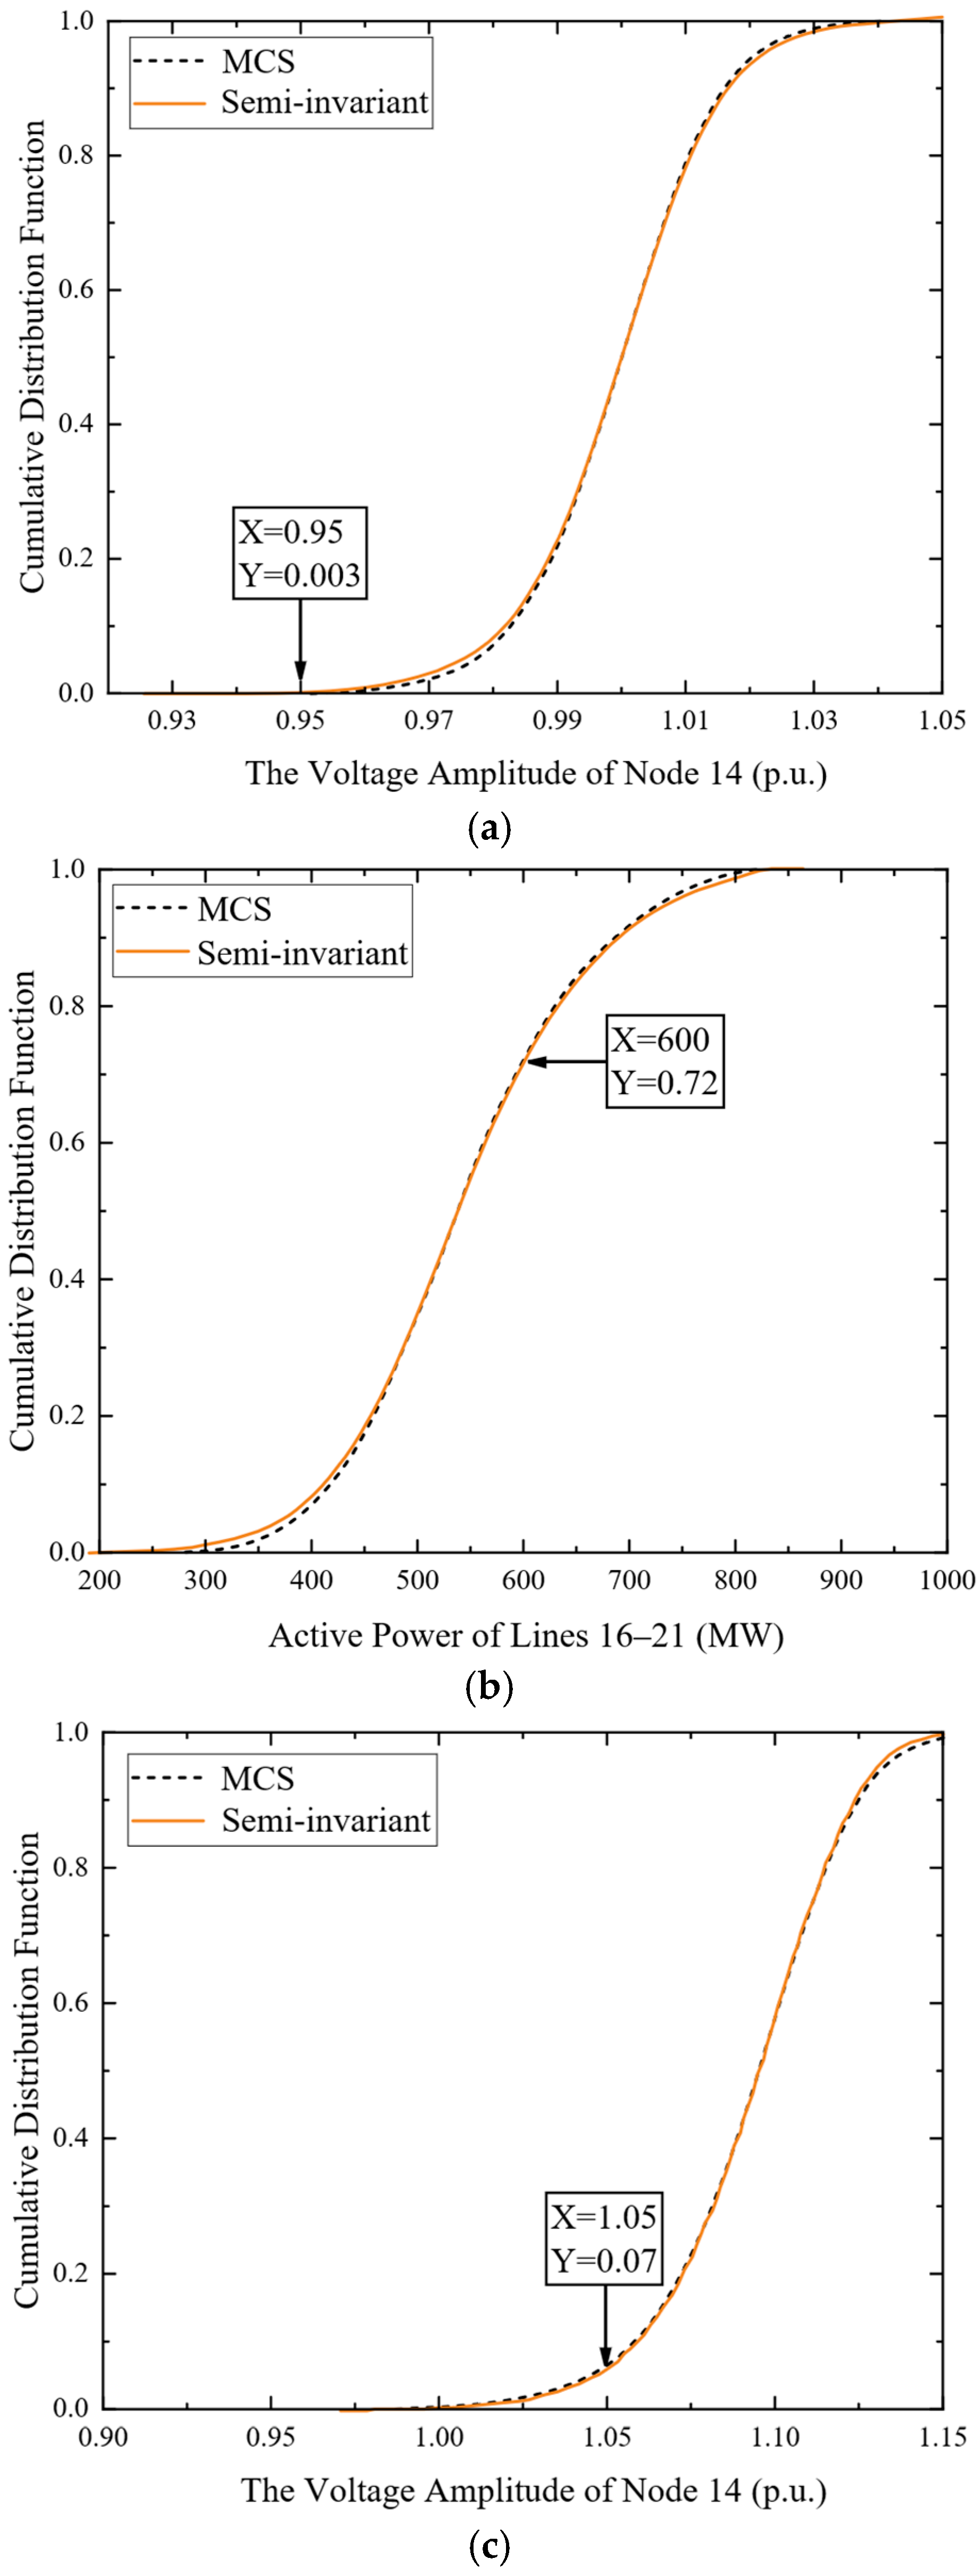
In order to verify the effectiveness of the proposed method, this test compares in detail the chance constraint overruns of the output random variables before and after optimizing the system operation mode with the proposed method. Meanwhile, in order to further illustrate the accuracy of the proposed method, the calculation results of the Monte Carlo simulation (MCS) are used as a comparison, and the test results are shown in
Figure 3. It should be noted that, in order to more intuitively respond to the experimental effect, the cumulative distribution function plot of the voltage amplitude at node 14 and the apparent power between lines 16–21 are selected as the experimental observation.
From
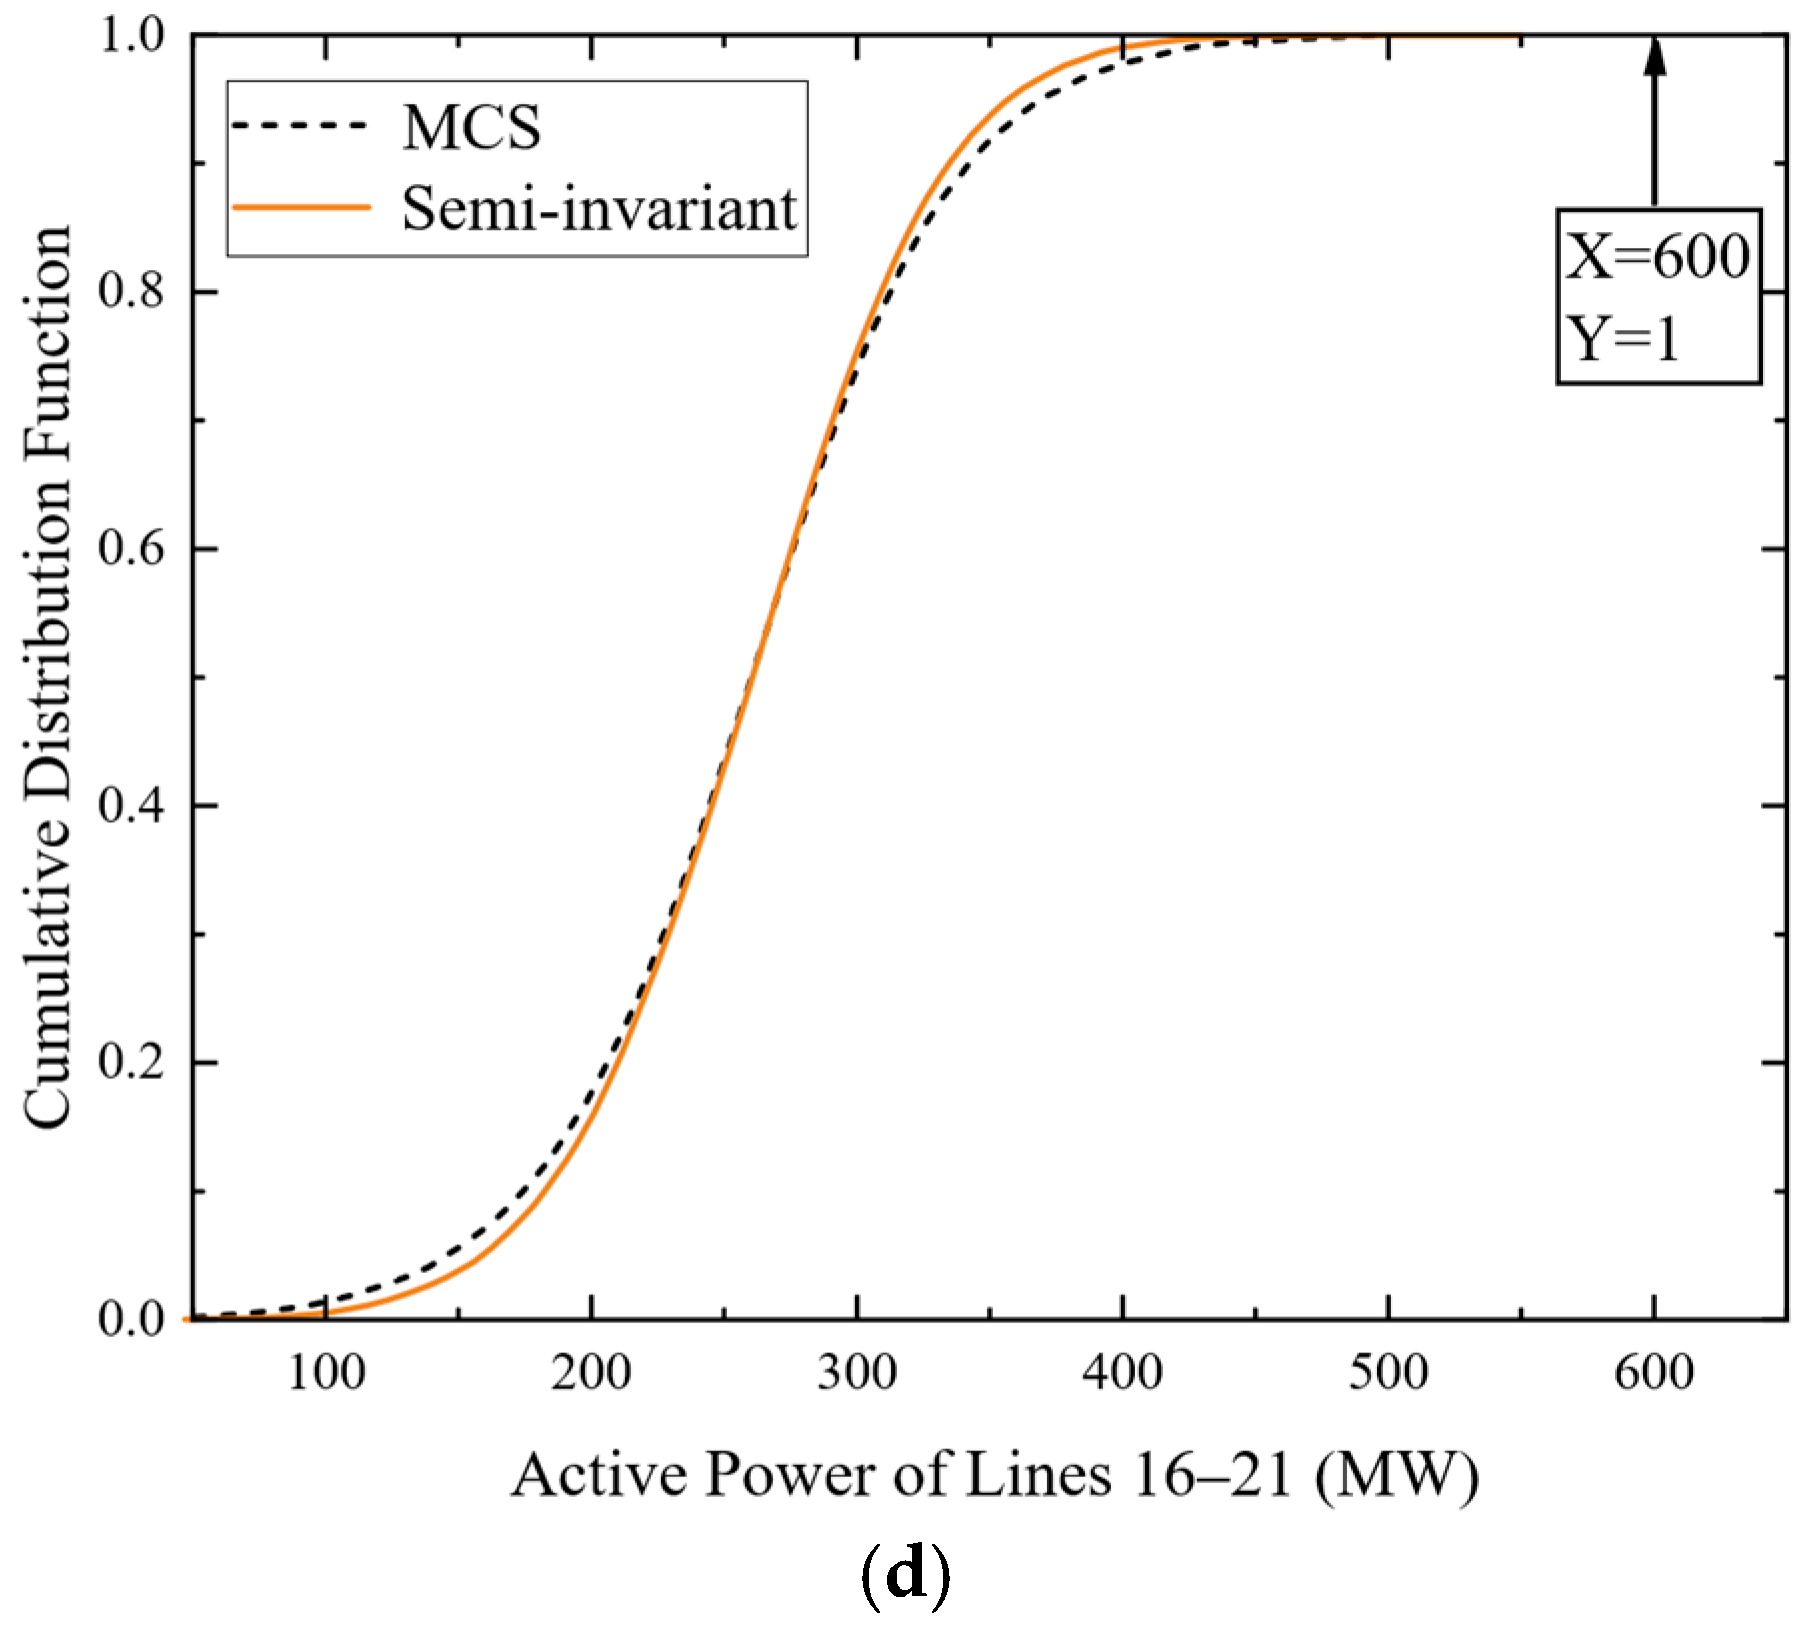
Figure 3a,b, it can be seen that, before optimizing the system operation mode, the probability that the voltage amplitude of bus 14 is between the set boundary of 0.95 p.u. and 1.05 p.u. is only 0.07, and the probability that the active power between lines 16–21 is lower than the set power upper limit of 600 MW is 0.72, which is much lower than the confidence level of 0.95 set. It shows that, under the current operation mode, it is difficult for the system to maintain safe and stable operation at a satisfactory confidence level in the face of the uncertainty of new energy and load power. After optimizing the system operation mode using the proposed method, the overruns of the operation variables are shown in
Figure 3c,d, and the probability that the voltage amplitude of a bus is between the set boundaries under the new operation state is 0.997 and the probability that the active power of the lines 16–21 is lower than the set upper limit of 600 MW is 1, which is satisfactory for the confidence level of 0.95 set. It shows that the proposed model can fully consider the uncertainty factors of new energy and load power in the solution process, effectively improve the safety and stability of the system, and has good practical value. From the comparison of the curves obtained by the two methods in
Figure 3, it can be seen that the cumulative distribution function curve obtained by the proposed method is very close to that of the MCS method, and it has a high computational accuracy.
6.3. Algorithm Convergence
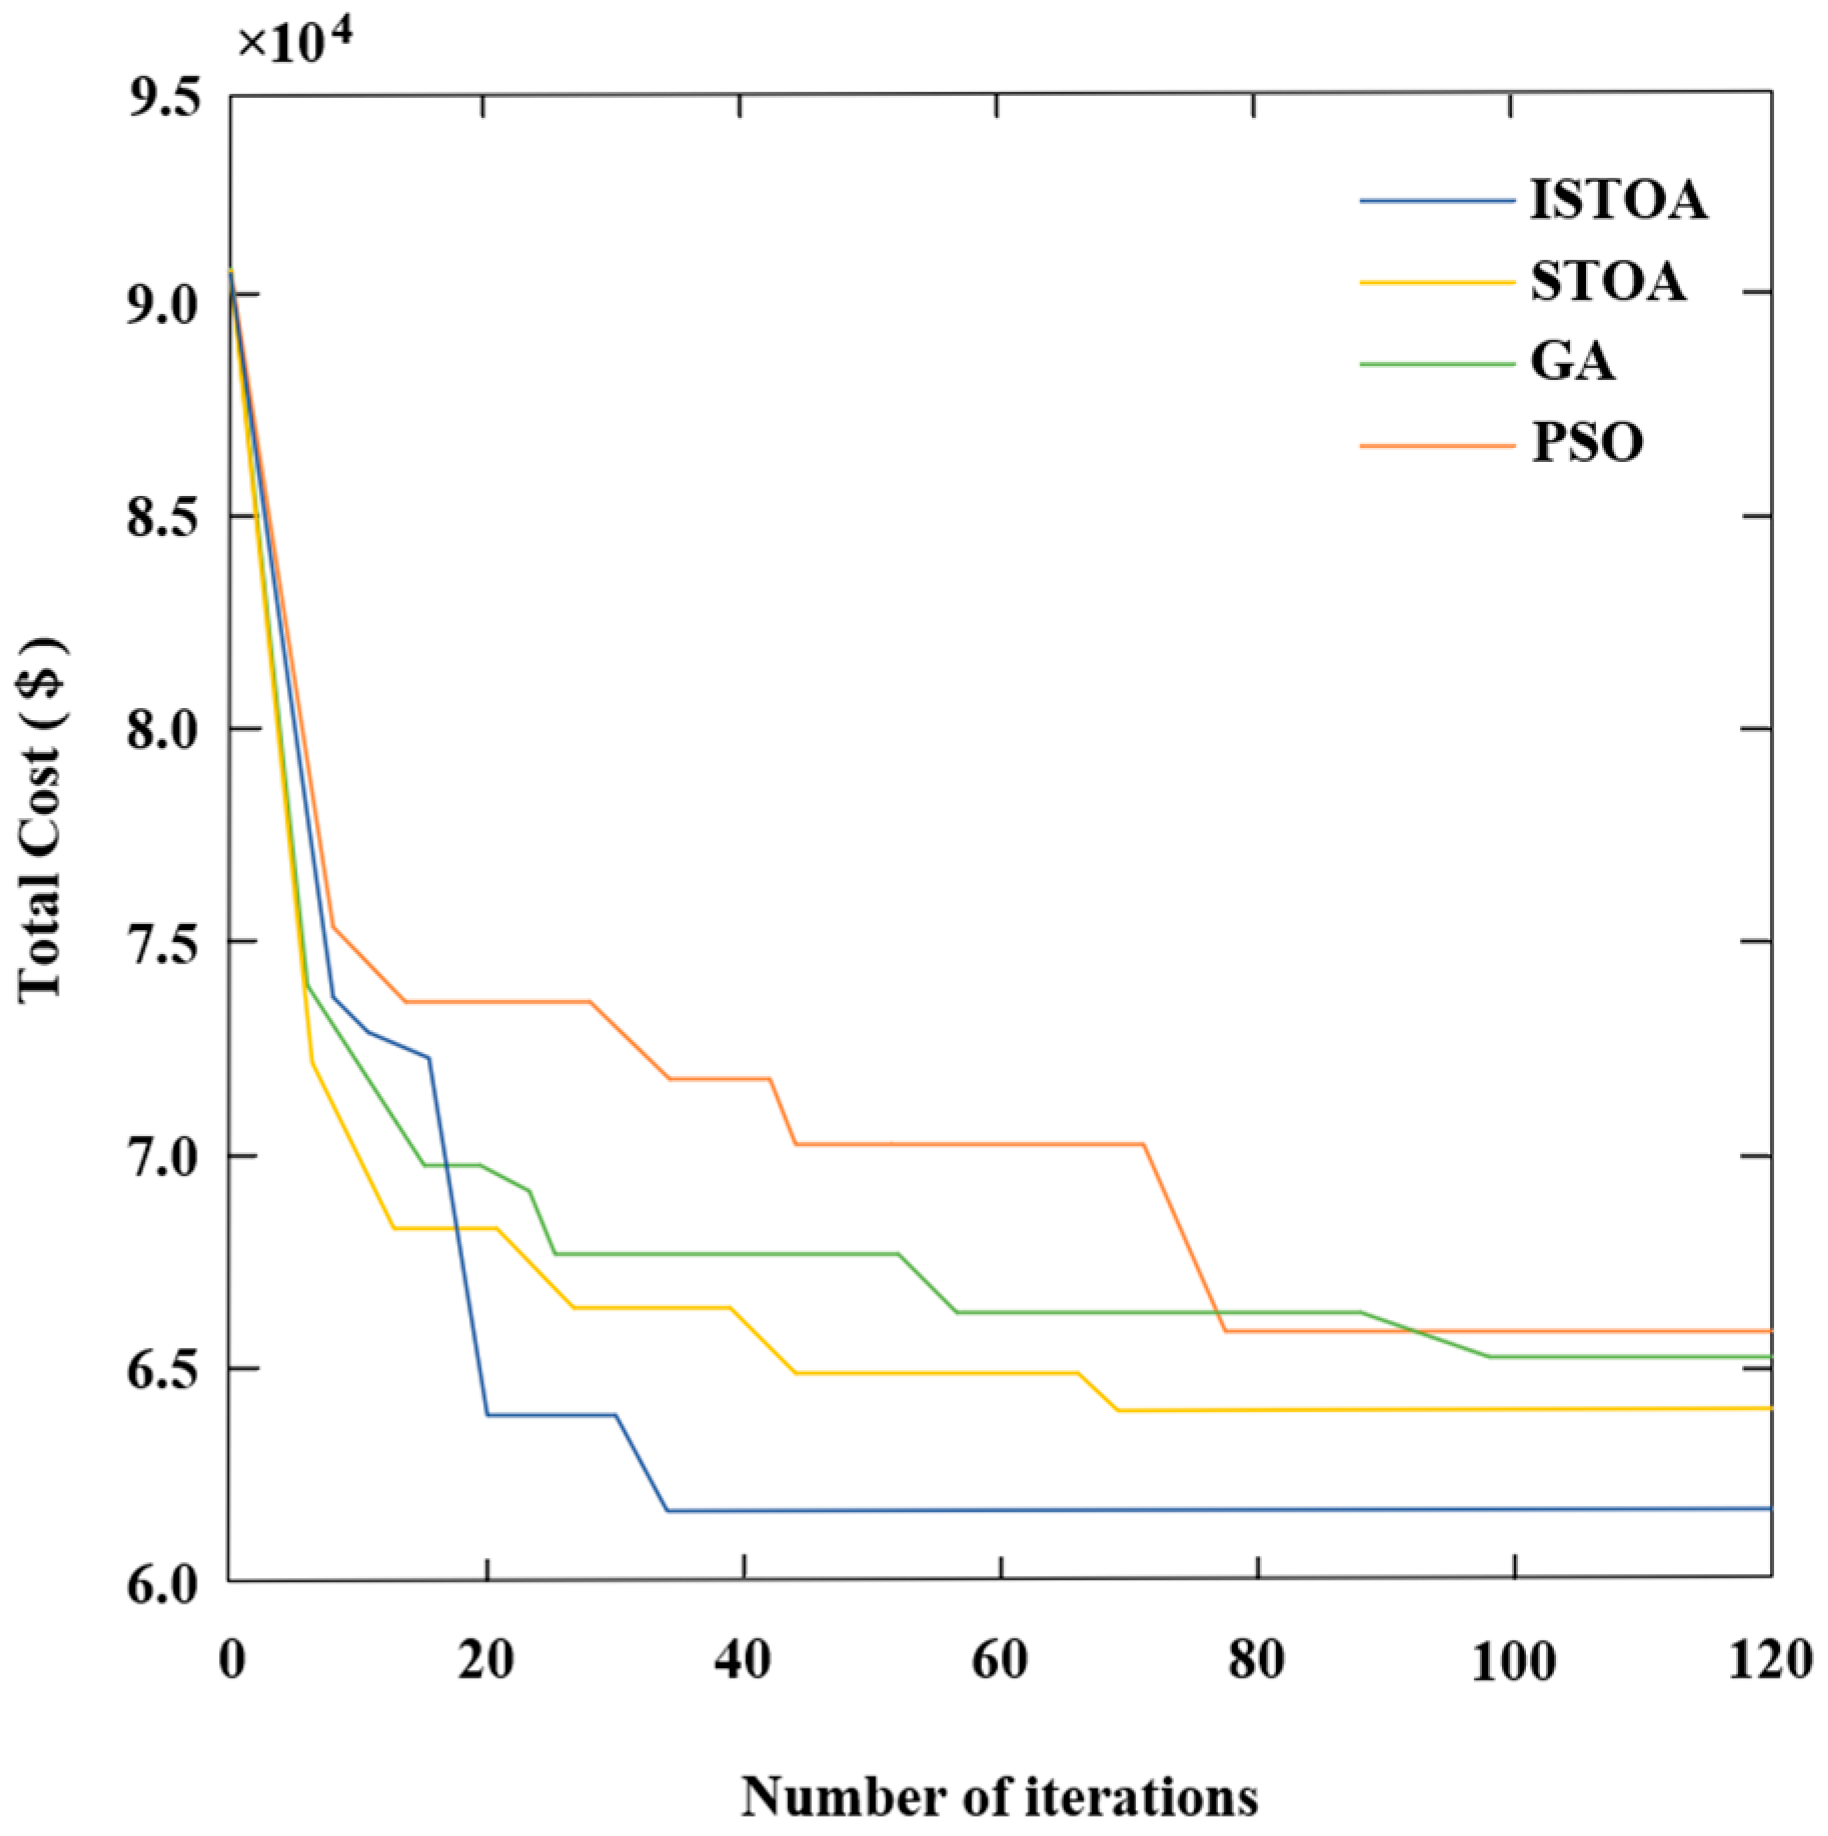
Algorithm iterations were used to compare and analyze the optimization performance of the ISTOA. STOA, particle swarm optimization (PSO) algorithm, and genetic algorithm (GA) are selected as reference objects, and the experimental parameters are set as follows: population size 60, maximum iteration number 120, and dimensionality of decision variables 20. In a unified test environment, each algorithm is run independently 15 times for the typical fault scenarios in order to obtain the statistical results. The results of the comparative analysis of the convergence characteristic curve of each optimization method are shown in
Figure 4.
The ISTOA significantly improves the performance of the STOA by introducing a circle mapping mechanism, a nonlinear collision avoidance factor, and Levy flight. As shown in
Figure 4, compared to other methods, ISTOA achieves a lower total generator cost in fewer iterations, indicating that ISTOA has extremely high convergence efficiency and can quickly find solutions close to the optimal solution. Furthermore, the total generator cost obtained by the ISTOA is the lowest, enabling it to more accurately find the global optimal solution. When dealing with problems such as generator cost optimization, ISTOA effectively reduces costs and improves resource utilization efficiency.
To fully validate the universality and reliability of the proposed algorithm on large-scale systems, this paper conducts verification on an improved IEEE 68 bus system, as shown in
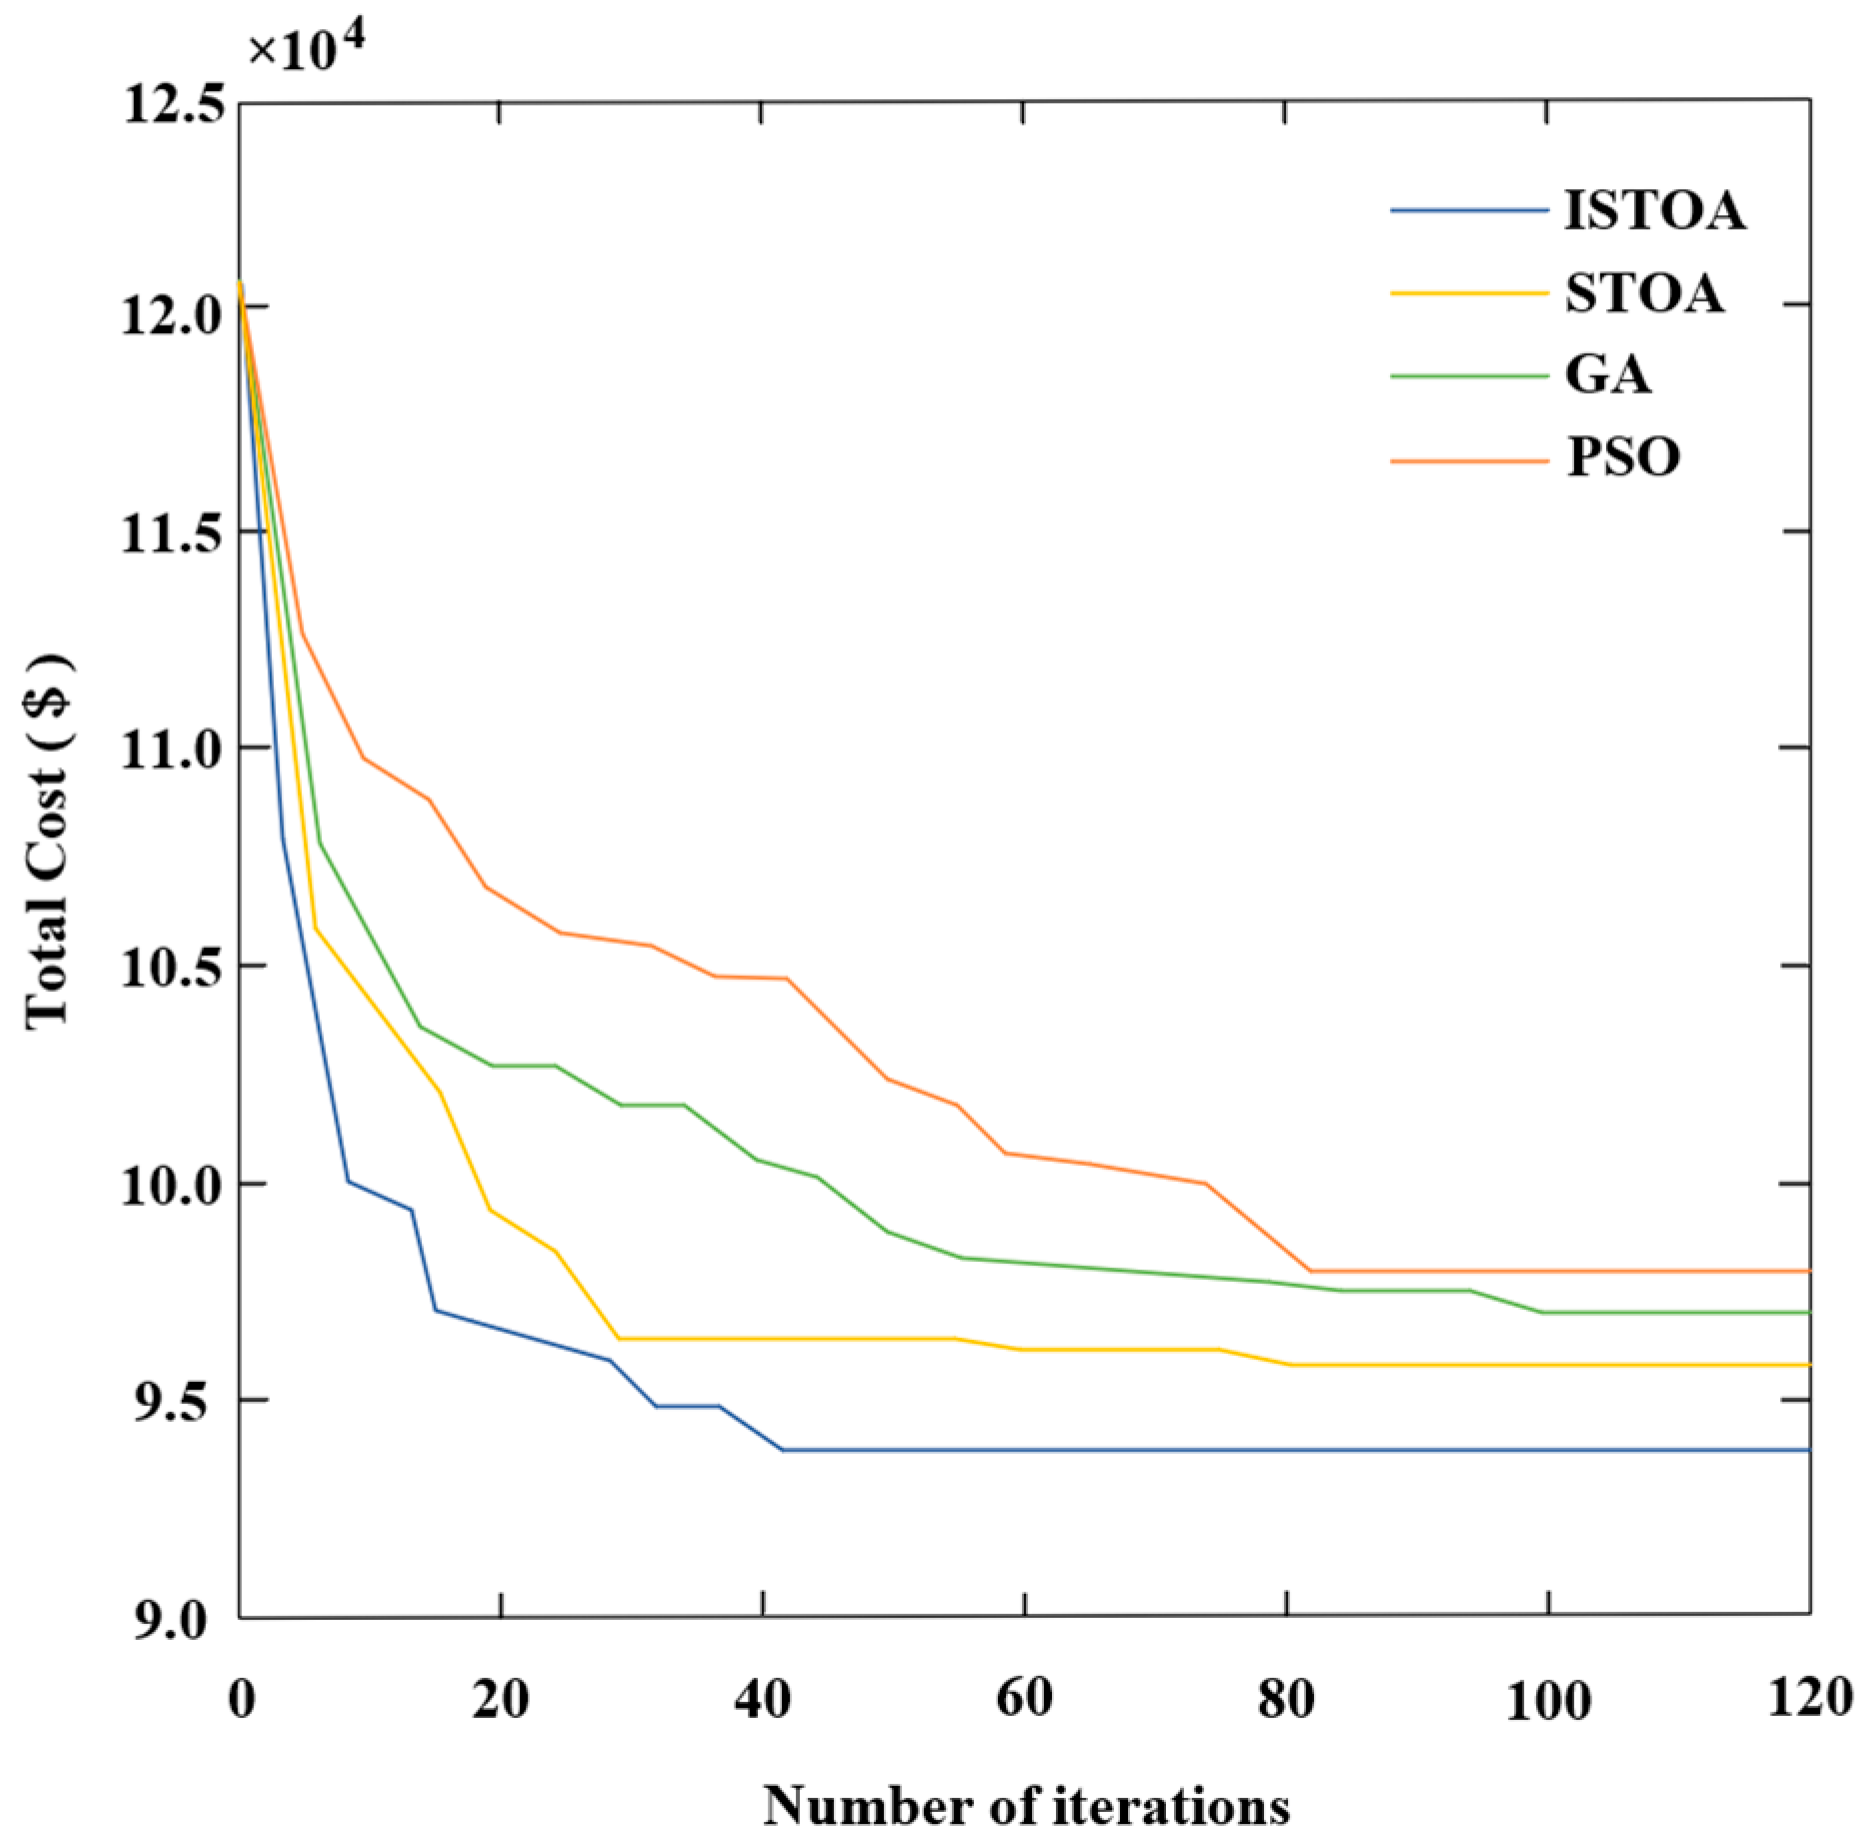
Figure 5. Here, G1–G12 represent 12 thermal power generators. The thermal generators at nodes 65, 66, 67, and 68 are replaced with wind generators W1, W2, W3, and W4 of equivalent installed capacity, with all other settings identical to the IEEE 39 bus system. The comparative analysis of convergence characteristics for each optimization algorithm is presented in
Figure 6.
The results demonstrate that, within the IEEE 68 bus system, the proposed ISTOA significantly enhances the performance of the STOA by incorporating circle mapping, a nonlinear collision-free factor, and a Levy flight mechanism. Compared to the other three algorithms, it incurs the lowest adjustment costs during model computation, thereby offering superior economic efficiency.
In summary, compared to other algorithms, the proposed ISTOA demonstrates distinct advantages in convergence speed and economic efficiency.
6.4. The Impact of Different Confidence Levels
The TSCOPF model established in this paper requires that the system operating parameters satisfy the constraint conditions under a specific confidence interval. To further investigate the impact of different confidence levels on the safe and stable operation of the system, we focused on examining the performance of the optimization scheme under different confidence level settings, including key indicators such as total power generation cost, ISTOA convergence characteristics, and computation time, as shown in
Table 2.
Table 2 presents data analyzing the correlation between confidence and system performance. These quantitative analysis results provide important theoretical support for TSCOPF research. As the confidence threshold increases, system operating costs and computational time consumption exhibit a synchronous growth trend. This phenomenon reveals the inherent characteristic of the TSCOPF model, which requires balancing operational safety and economic efficiency when addressing uncertainty. The increased number of iterations in the ISTOA indicates that strict transient stability constraints significantly increase the difficulty of solving the optimization problem. This study provides critical technical references for the application of TSCOPF in actual power systems, particularly in scenarios with high wind power penetration, laying a theoretical foundation for optimizing system operation decisions. Additionally, comparison results under different confidence levels further demonstrate that the TSCOPF model can dynamically adjust the strictness of constraints to flexibly adapt to the differentiated requirements of power systems between safety margins and economic efficiency. This provides valuable information for operators, who can select an appropriate confidence interval by balancing safety and economic considerations based on specific on-site conditions.
6.5. CTT Error Analysis
This paper employs a binary search method to calculate the CCT of a fault, defining the CCT at that fault location as the maximum clearance time required to maintain stable system operation.
Case 1: Three-phase short circuit on lines 5–8. Case 2: Three-phase short circuit on lines 26–28. The CCT reference values obtained via the bisection method serve as the reference baseline. In the TSCOPF model, CCT values with errors are used as input values. To analyze the impact of different CCT calculation errors on the TSCOPF model optimization results, the outcomes obtained by solving the TSCOPF model based on the CCT input values with errors are shown in the table below.
According to
Table 3, when the CCT estimate exhibits negative error—meaning the input value is below the benchmark—it represents a conservative stability estimate. The model maintains stability under actual faults, and while costs increase with greater negative error, stability remains reliably assured. When the CCT estimate exhibits positive error—meaning the input value exceeds the benchmark—it indicates an optimistic stability assessment. The model becomes unstable under actual faults, and as positive error increases, costs decrease, while stability risks surge dramatically. Therefore, using a CCT value slightly below the benchmark as input ensures stability without excessive economic sacrifice.
6.6. Analysis of TSCOPF Model Optimization Results
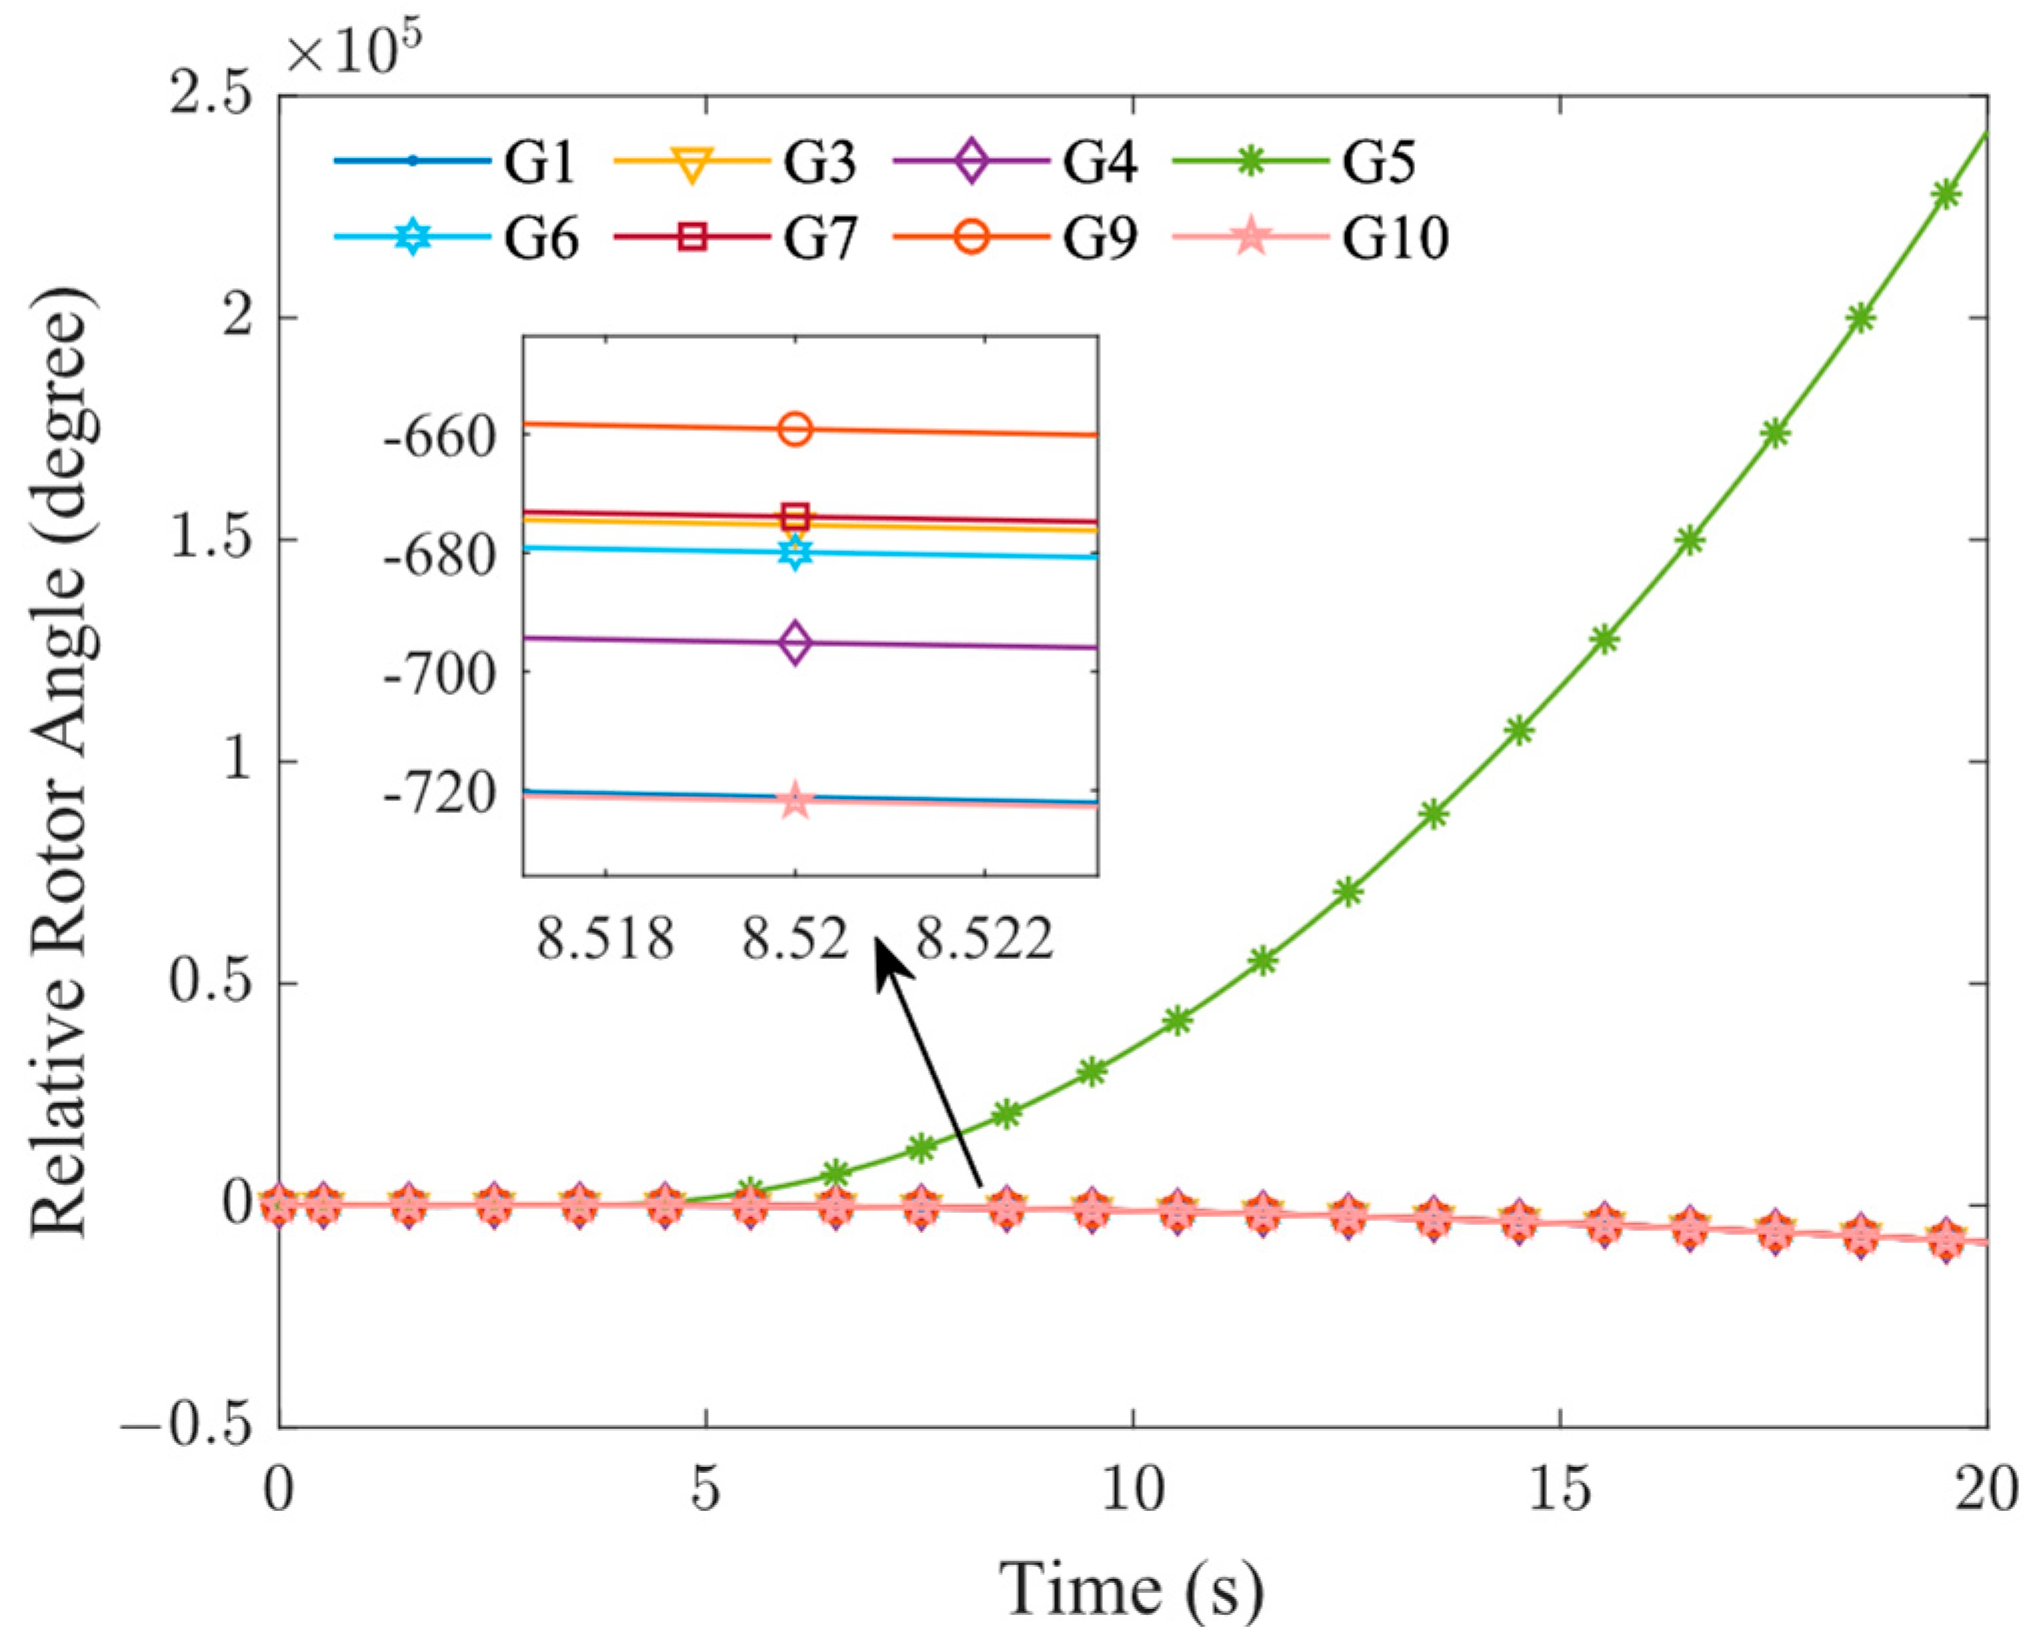
To evaluate the effectiveness of the proposed optimization method, a three-phase short-circuit fault was set at node 3 near lines 3–18, and numerical simulations were performed to analyze the dynamic response characteristics of the power system under the same fault conditions. The transient states of the system optimized using the proposed model were compared with those of the TSCOPF model that did not consider renewable energy factors. The changes in power angle when the system is unstable under this scenario are shown in
Figure 7.
As shown in
Figure 7, in the case of transient instability of the system due to faults, the power angle trajectory of the generator shows a continuous spreading trend, which indicates that the system has entered a serious transient unstable operation.
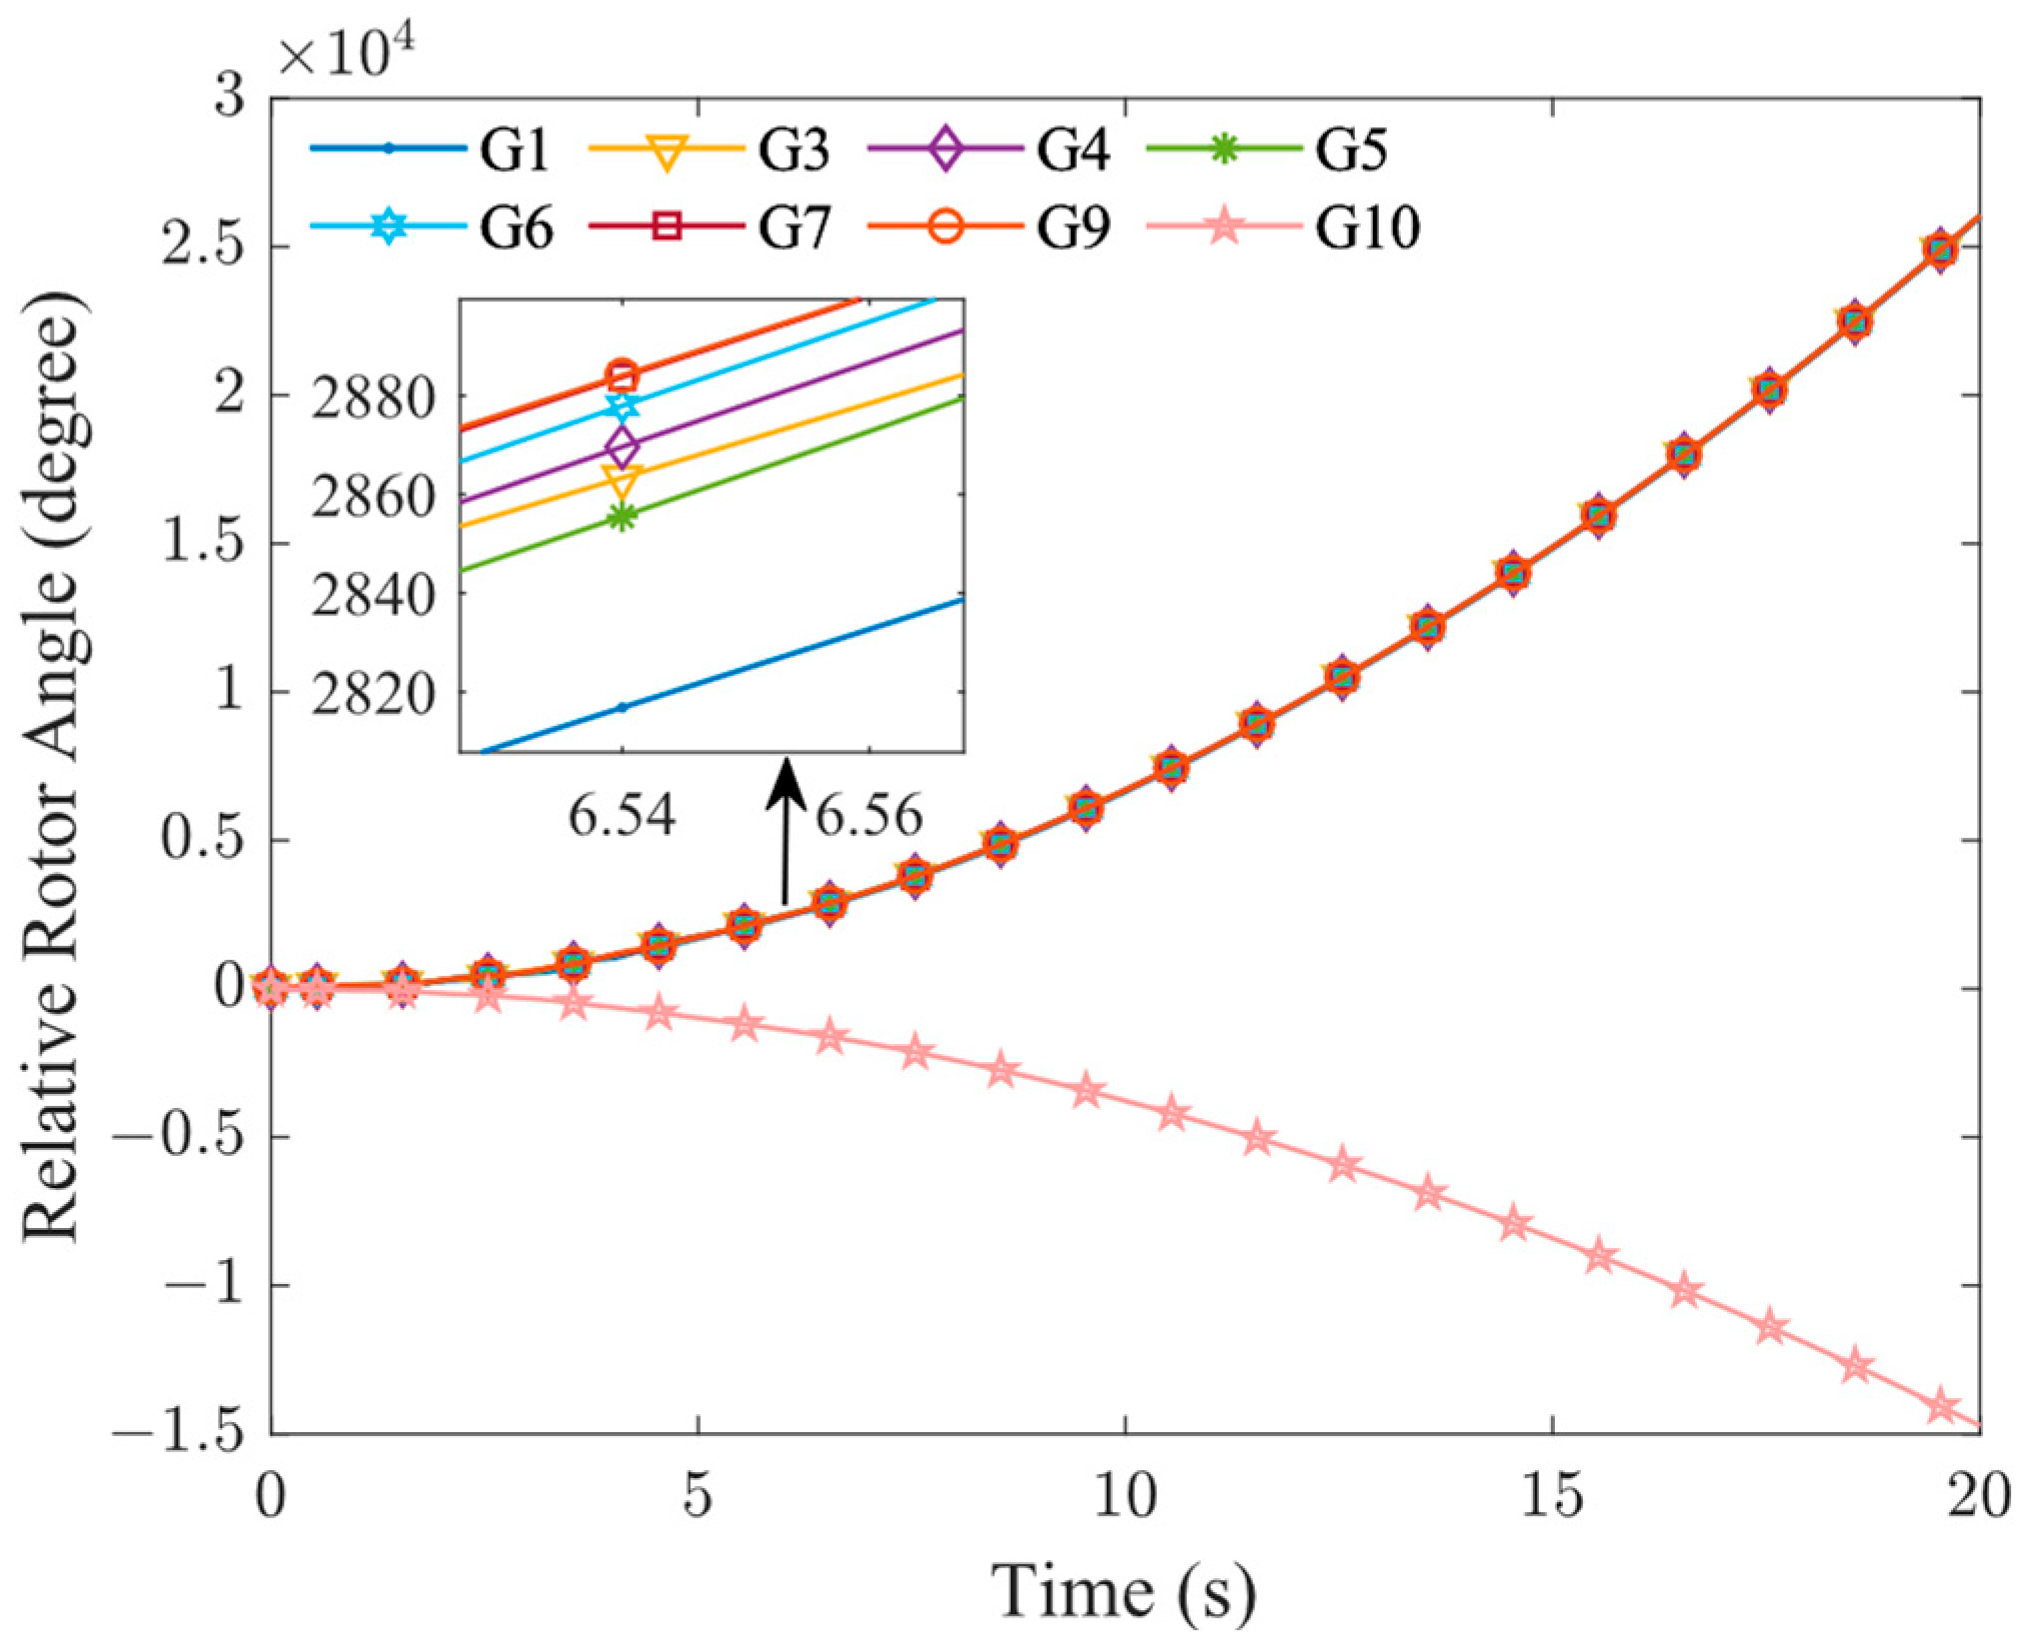
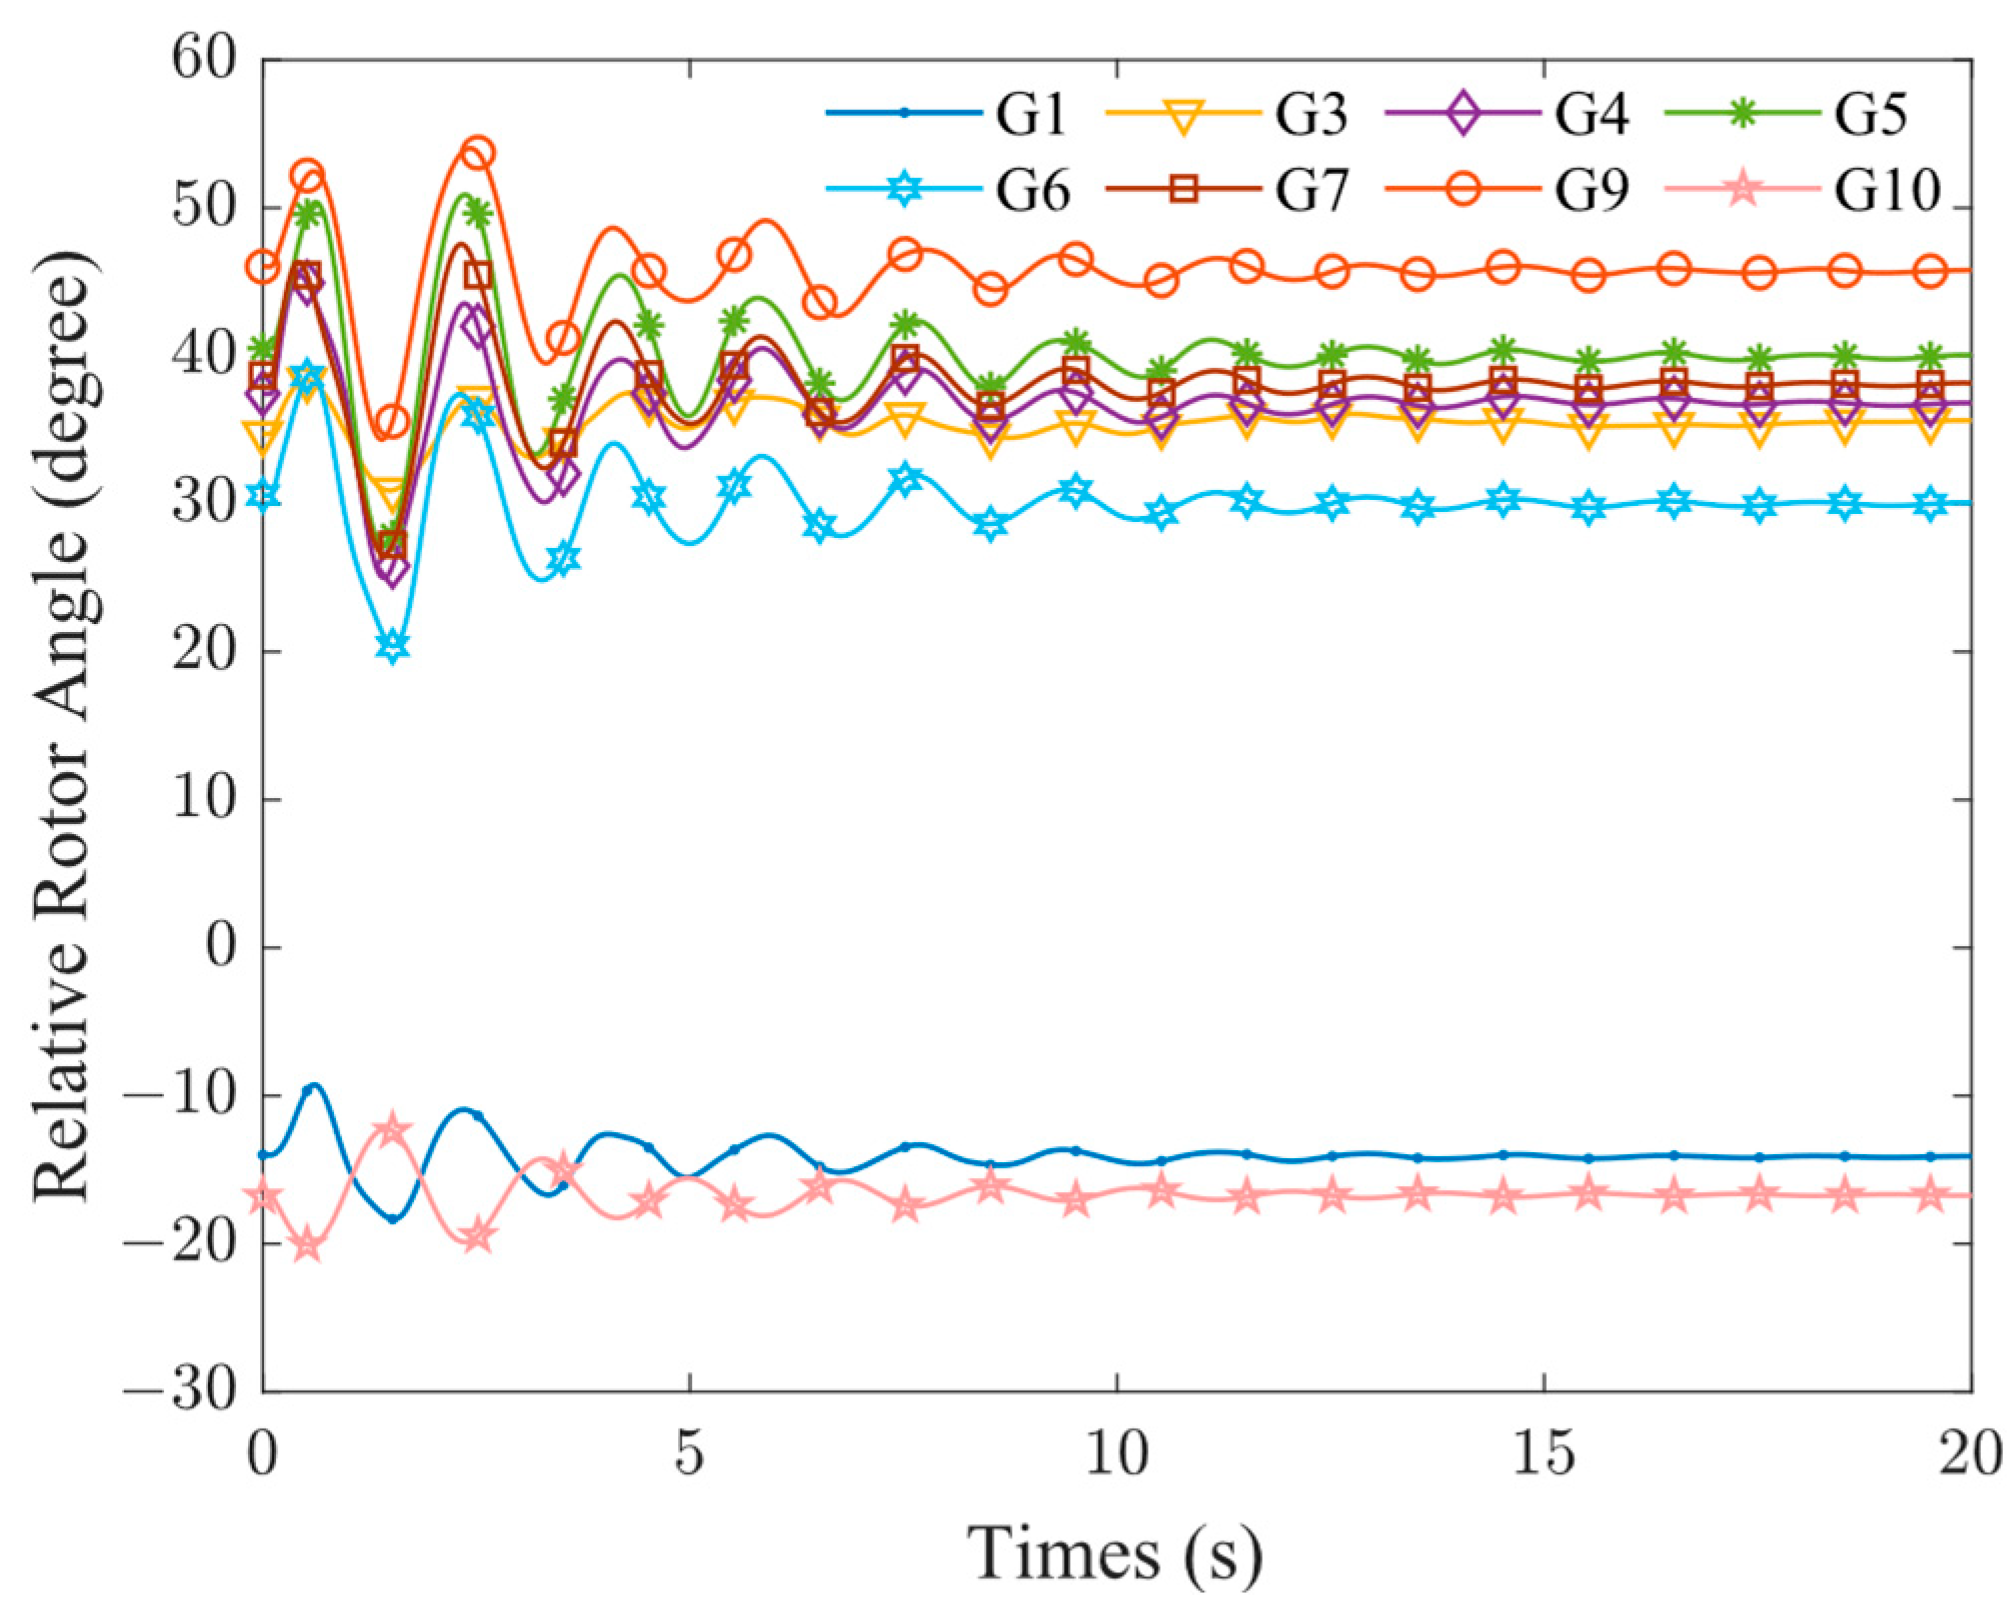
To address this situation, two TSCOPF models are compared and analyzed: one is the traditional model without incorporating the new energy factor, and the other is the TSCOPF model proposed in this paper. By optimizing and solving these two models, respectively, the corresponding power angle change diagrams were obtained, as shown in
Figure 8 and
Figure 9.
As can be seen in
Figure 8, although the power angle difference of the generator is reduced after the TSCOPF model without considering the new energy, TSC is still negative, indicating that the system has not yet reached a stable state, which reflects the limitations of the TSCOPF model without considering the new energy factor in dealing with the uncertainty. In contrast,
Figure 9 shows the results of the TSCOPF model, in which the power angle trajectory of the generator tends to stabilize after a certain degree of fluctuation, and the power angle difference is controlled within 360° and TSC is positive, indicating that the system has reached a transient stable state. This demonstrates that the TSCOPF model presented in this paper has a significant impact on enhancing the transient stability of the system.
7. Conclusions
Aiming at the challenge of system uncertainty brought by wind power access, this paper constructs a TSCOPF model considering uncertainty and designs a corresponding solution scheme. The effectiveness of the proposed method is verified by testing the improved 39-node system. The conclusions are as follows:
(1) The model constructed is based on OPF and incorporates transient stability constraints based on CCT indicators, forming a complete mathematical optimization problem description. By establishing mathematical relationships between CCT and system operating variables, the model achieves quantitative representation and constraint expression of transient stability constraints. The model not only accurately assesses system transient stability but also provides an effective analytical tool for the safe and economical operation of power systems with a high proportion of renewable energy. Compared to traditional methods, it avoids extensive time domain simulation calculations.
(2) The variables are sampled by de-randomized Halton sequences, the semi-invariants of state variables such as input and output variables are calculated, and their probability distribution functions and cumulative distribution functions are obtained by combining with the Gram–Charlier series to determine the overrun of the output random variables. Compared to traditional MCS methods, computational efficiency is significantly improved.
(3) In order to enhance the algorithm solving efficiency, this paper improves the STOA so that it shows faster convergence speed and higher solving accuracy than the traditional ISTOA in solving high-dimensional nonlinear optimization problems.
(4) A higher confidence level indicates greater safety, but it also increases economic costs. Setting an appropriate confidence level can effectively balance the demands of both economic efficiency and safety. This provides a reference for operators.
However, this research methodology also has certain limitations and potential areas for future improvement, primarily including the following points:
(1) Although our proposed ISTOA enhances solution efficiency, the overall computational cost of the framework remains higher compared to traditional deterministic optimal power flow methods. This may pose challenges for scenarios requiring online applications or extremely high computational speed. This trade-off is primarily incurred to achieve higher precision in probabilistic assessments.
(2) This study primarily focuses on validating the effectiveness and superiority of the proposed integrated framework. While comparisons with baseline methods were conducted, future work could involve more comprehensive performance comparisons with a wider range of state-of-the-art algorithms to further delineate the advantage range of the proposed method.
(3) When applied to actual large-scale power grids, this method may encounter challenges related to data availability and quality. For instance, obtaining sufficient historical wind power data to construct accurate nonparametric kernel density estimates and acquiring detailed system dynamic parameters are required. Corresponding future work will focus on overcoming these limitations.
Author Contributions
Methodology, S.L. and B.Y.; Software, P.H., J.C. and Y.L.; Validation, M.W. and B.Y.; Writing—original draft, B.Y.; writing—review and editing, S.L. All authors have read and agreed to the published version of the manuscript.
Funding
This research was supported by the National Natural Science Foundation of China (52407118), The Open Foundation of Hubei Provincial Key Laboratory for Operation and Control of Cascaded Hydropower Station under Grant (2023KJX06).
Data Availability Statement
The original contributions presented in the study are included in the article, and further inquiries can be directed to the corresponding author.
Conflicts of Interest
Author Pan Hu is employed by the company State Grid Hubei Electric Power Research Institute. The remaining authors declare that the research was conducted in the absence of any commercial or financial relationships that could be construed as a potential conflict of interest.
References
- IEA. Global Energy Review 2025; IEA: Paris, France, 2025; Available online: https://www.iea.org/reports/global-energy-review-2025 (accessed on 30 August 2025).
- Xue, Y.; Lei, X.; Xue, F.; Yu, C.; Dong, Z.; Wen, F.S.; Ju, P. A Review on Impacts of Wind Power Uncertainties on Power Systems. Proc. CSEE 2014, 34, 5029–5040. [Google Scholar]
- Tingyi, H.; Shengnan, L.; Shuijun, W.; Zhen, C.; Zixuan, Z. Study on the influence of large-scale wind power integration on power system transient stability risk. Electr. Meas. Instrum. 2017, 54, 6. [Google Scholar]
- Zhang, J.; Huang, Y.; Lei, Q.; Li, D.; Jia, H. Power System Fault Recovery Considering Frequency Deviation Under Large-Scale Wind Power Access. Electr. Power Constr. 2021, 37, 254–263. [Google Scholar]
- Lei, X.; Yang, Z. Electricity Market Pricing Method Considering Multiple Statistical Moments of Renewable Energy Uncertainty. Proc. CSEE 2023, 43, 5772–5784. [Google Scholar]
- Mi, Y.; Zhao, H.; Fu, Q.; Ma, S.; Cai, P.; Yuan, M.H. Two-level Game Optimal Operation of Regional Integrated Energy System Considering Windand Solar Uncertainty and Carbon Trading. IEEE Trans. Energy Convers. 2023, 47, 2174–2188. [Google Scholar]
- Liu, K.; Gu, X.; Bai, Y.; Li, S.; Liu, Y.; Liu, Y.; Wang, H. Online dynamic partition restoration optimization method of a power system considering wind power uncertainty. Power Syst. Prot. Control 2024, 52, 60–73. [Google Scholar]
- Xia, B.; Wu, H.; Yang, W.; Cao, L.; Song, Y. Parametric Transient Stability Constrained Optimal Power Flow Solved by Polynomial Approximation Based on the Stochastic Collocation Method. Energies 2022, 15, 4127. [Google Scholar] [CrossRef]
- Xia, S.; Ding, Z.; Wu, Q.; Shahidehpour, M.; Chan, K.; Bu, S.; Li, G. Transient Stability-Constrained Optimal Power Flow Calculation With Extremely Unstable Conditions Using Energy Sensitivity Method. IEEE Trans. Power Syst. 2021, 36, 355–365. [Google Scholar] [CrossRef]
- Tao, R.; Li, F.; Li, Y. A Bi-Level Optimized Dispatching Method for Grids with High Penetration of New Energy Considering Ancillary Service Costs. Energies 2024, 17, 3270. [Google Scholar] [CrossRef]
- Guchhait, R.; Sarkar, B. Increasing Growth of Renewable Energy: A State of Art. Energies 2023, 16, 2665. [Google Scholar] [CrossRef]
- Zhang, C.; Xu, G. Distributed multivariate random dynamic scenario generation and fast & accurate scenario simplified algorithm. Power Syst. Technol. 2022, 46, 671–681. [Google Scholar]
- Alismail, F.; Xiong, P.; Singh, C. Optimal wind farm allocation in multi-area power systems using distributionally robust optimization approach. IEEE Trans. Power Syst. 2018, 33, 536–544. [Google Scholar] [CrossRef]
- Guo, F.; Feng, X.; Yang, H.; Tang, Y.; Wang, L. Dual-data-model-driven Distributionally Robust Optimal Scheduling of Renewable Energy Microgrid. Autom. Electr. Power Syst. 2024, 48, 36–47. [Google Scholar]
- Li, C.; Wu, C. Probabilistic transient stability constrained optimal power flow considering multiple uncertainties. Water Resour. Hydropower Eng. 2025, 56, 98–109. [Google Scholar]
- Liang, Z.; Chung, C.Y.; Wang, Q.; Chen, H.; Yang, H.; Wu, C. Fortifying Renewable-Dominant Hybrid Microgrids: A Bi-Directional Converter Based Interconnection Planning Approach. Engineering 2025, 51, 130–143. [Google Scholar] [CrossRef]
- Xia, S.; Luo, X.; Chan, K.; Zhou, M.; Li, G. Probabilistic Transient Stability Constrained Optimal Power Flow for Power Systems With Multiple Correlated Uncertain Wind Generations. IEEE Trans. Sustain. Energy 2016, 7, 1133–1144. [Google Scholar] [CrossRef]
- Yu, Z.; Shen, C.; Liu, F. Transient stability constrained economic dispatch considering wind power uncertainty. Proc. CSEE 2020, 40, 7270–7282. [Google Scholar]
- Liu, D.; Guo, J.; Huang, Y.; Wang, W. Dynamic economic dispatch of wind integrated power system based on wind power probabilistic forecasting and operation risk constraints. Proc. CSEE 2013, 33, 9–15. [Google Scholar]
- Wang, Z.; Teng, F.; Zhou, Y.; Guo, Q.; Sun, H. Uncertainty-Aware Transient Stability-Constrained Preventive Redispatch: A Distributional Reinforcement Learning Approach. IEEE Trans. Power Syst. 2025, 40, 1295–1308. [Google Scholar] [CrossRef]
- Xia, B.; Chen, Y.; Yang, W.; Chen, Q.; Wang, X.; Min, K. Stochastic optimal power flow for power systems considering wind farms based on the stochastic collocation method. IEEE Access 2022, 10, 44023–44032. [Google Scholar] [CrossRef]
- Zheng, D.; Cui, S.; Fan, X.; Zhao, L. Multi-objective Distributionally Robust Optimization Scheduling for Integrated Energy System Considering Wind Power Uncertainty. Smart Power 2024, 52, 1–8+18. [Google Scholar]
- Lu, J.; Zhang, J. Optimal power flow algorithm with transient stability constraints in power system. Power Syst. Prot. Control 2017, 45, 24–30. [Google Scholar]
- Liu, S.; Li, Z.; Zhou, Q.; Yang, C.; Hu, J.; Ruan, Z. Parameterized Transient Stability Constrained Optimal Power Flow of Power Systems Based on Polynomial Chaos Expansion. Power Syst. Clean Energy 2024, 40, 48–57. [Google Scholar]
- Hu, R.; Liu, J.; Liu, Y.; Liu, J.; He, X.; Shu, J.; Song, L. Reserve benefit equilibrium model of cascade hydropower-wind power alliance to promote new energy transmission. Power Syst. Clean Energy 2023, 39, 103–113. [Google Scholar]
- Zhang, Y.; Liu, F.; Guo, Q. Critical clearing time sensitivity of power systems with high power electronic penetration. iEnergy 2025, 4, 3–15. [Google Scholar] [CrossRef]
- Li, Y.; Sun, G.; Qian, X.; Shen, H. Probabilistic Power Flow Calculation Method of Power System Considering Input Variables With Discrete Distribution. Power Syst. Technol. 2015, 39, 3254–3259. [Google Scholar]
- Zhang, D.M.; Xu, H.; Wang, Y.R.; Song, T.; Wang, L. Whale optimization algorithm for embedded Circle mapping and onedimensional oppositional learning based small hole imaging. Control Decis. 2021, 36, 1173–1180. [Google Scholar]
- Zhang, Y.; Lu, Z.G.; Lu, Q.; Wang, J. Research on optimal configuration of photovoltaicdc microgrid based on levy flight improved bird swarm algorithm. Acta Energiae Solaris Sin. 2021, 42, 214–220. [Google Scholar]
- Lv, X.; Liang, J. Longitudinal instant probability distribution of wind farm output power. Electr. Power Autom. Equip. 2014, 34, 40–45. [Google Scholar]
| Disclaimer/Publisher’s Note: The statements, opinions and data contained in all publications are solely those of the individual author(s) and contributor(s) and not of MDPI and/or the editor(s). MDPI and/or the editor(s) disclaim responsibility for any injury to people or property resulting from any ideas, methods, instructions or products referred to in the content. |
© 2025 by the authors. Licensee MDPI, Basel, Switzerland. This article is an open access article distributed under the terms and conditions of the Creative Commons Attribution (CC BY) license (https://creativecommons.org/licenses/by/4.0/).
