Article

Lithofacies Characteristics of Point Bars and Their Control on Incremental Oil Recovery Distribution During Surfactant–Polymer Flooding: A Case Study from the Gudao Oilfield

1
Exploration and Development Research Institute, Shengli Oilfield Company, SINOPEC, Dongying 257015, China
2
State Key Laboratory of Petroleum Resources and Engineering, China University of Petroleum (Beijing), Beijing 102249, China
3
College of Geosciences, China University of Petroleum (Beijing), Beijing 102249, China
*
Author to whom correspondence should be addressed.
Energies 2025, 18(17), 4703; https://doi.org/10.3390/en18174703
Submission received: 22 July 2025 / Revised: 14 August 2025 / Accepted: 2 September 2025 / Published: 4 September 2025
(This article belongs to the Special Issue Enhanced Oil Recovery: Numerical Simulation and Deep Machine Learning)

Abstract

Meandering river point bar sand bodies, serving as critical reservoir units, exhibit significant lithofacies heterogeneity that governs remaining oil distribution patterns. Taking the Guantao Formation in the Gudao Oilfield as an example, this study integrates core observation, pore-throat structure characterization, and numerical simulation to reveal lithofacies characteristics of point bar sand bodies and their controlling mechanisms on incremental oil recovery distribution during surfactant–polymer (SP) flooding. The results demonstrate that point bar lithofacies display planar grain-size fining from concave to convex banks, with vertical upward-fining sequences (point bar medium sandstone facies → fine sandstone facies → siltstone facies). Physical property variations among lithofacies lead to remaining oil enrichment in relatively low-permeability portions of fine sandstone facies and low-permeability siltstone facies after waterflooding. SP flooding significantly enhances remaining oil mobilization through a “lithofacies-controlled percolation—chemical synergy” coupling mechanisms. The petrophysical heterogeneity formed by vertical lithofacies assemblages in the reservoir directly governs the targeted zones of chemical agent action (with interfacial tension reduction preferentially occurring in high-permeability lithofacies, while viscosity control dominates sweep enhancement in low-permeability lithofacies). This results in a distinct spatial differentiation of the incremental oil recovery, characterized by a spindle-shaped sweep improvement zone and a dam-type displacement efficiency enhancement zone.

1. Introduction

Meandering river point bar sand bodies, as crucial reservoir units in continental petroliferous basins, present a key geological challenge constraining enhanced oil recovery due to the complexity of remaining oil distribution caused by depositional heterogeneity. As oilfields enter the ultra-high water-cut stage (water cut > 90%), flow barrier effects controlled by lithofacies assemblages within reservoirs become increasingly pronounced. Previous studies and field practices demonstrate that long-term waterflooding development tends to induce flow field solidification and development of high-permeability channels, leading to exacerbated differential oil–water two-phase flow capacities, displacement efficiency imbalance [1,2,3], and limited sweep efficiency [4,5,6]. This phenomenon is particularly evident in the Guantao Formation of the Gudao Oilfield. Specifically, sealed coring well data reveal that after nearly 50 years of waterflooding, macroscopic remaining oil saturation persists at 0.3–0.5. However, controlled by the upward-fining rhythmic facies architecture of point bar sand bodies, the remaining oil primarily accumulates in point bar siltstone facies and relatively low-permeability fine sandstone facies, where conventional waterflooding techniques prove ineffective [1,7,8].
Facing the development bottlenecks of high-water-cut oilfields, chemical flooding technologies have progressively become the core approach for enhanced oil recovery [9,10]. Since the emergence of alkaline–surfactant–polymer (ASP) ternary composite flooding in the 1980s, its synergistic mechanisms have significantly improved sweep efficiency [11,12]. However, field applications revealed limitations including severe scaling and emulsification issues [13,14]. To overcome these drawbacks, alkali-free surfactant–polymer (SP) flooding technology was developed and widely implemented in Shengli Oilfield, demonstrating superior performance [8,15]. Notably, meandering river point bar sand bodies exhibit pronounced lithofacies differentiation. Long-term waterflooding has solidified flow fields, locally developing high-permeability channels that amplify differential oil–water flow capacities, create displacement imbalance [1,2,3], and reduce flooding efficiency, ultimately resulting in insufficient sweep coverage in low-permeability lithofacies layers. Current research on chemical flooding predominantly focuses on displacement mechanisms in homogeneous models or field-scale performance evaluation [8,14,15,16]. However, studies addressing how the internal lithofacies assemblages of meandering river point bar sand bodies control the dynamic response of chemical flooding remain scarce. This study refines the scale of reservoir characterization down to the lithofacies unit level, revealing the constraining mechanism of lithofacies spatial configuration on the propagation pathways of surfactant–polymer (SP) binary flooding. Thereby, it bridges the gap between reservoir geology and chemical enhanced oil recovery (EOR) theory.
Therefore, this study employs a tripartite methodology integrating “lithofacies assemblages, flow units, and displacement response”. Focusing on the meandering river point bar sand bodies within the Guantao Formation of the Gudao Oilfield, it elucidates the 3D spatial control mechanism exerted by petrophysical heterogeneity on the dynamic response pathways of surfactant–polymer (SP) binary flooding, under the constraints of the upward-fining lithofacies assemblages characteristic of these point bars. Thereby, it reveals the differentiated distribution characteristics of the incremental oil recovery at the lithofacies unit scale.

2. Materials and Methods

This study employs an integrated approach combining geological analysis and numerical simulation to elucidate the lithofacies characteristics of meandering river point bar sand bodies within the Guantao Formation of the Gudao Oilfield and their controlling mechanisms on the distribution of incremental oil recovery during surfactant–polymer (SP) binary flooding. The methodology primarily encompasses detailed core-scale description and characterization, quantitative analysis of pore-throat structures, and reservoir numerical simulation based on the geological model.

2.1. Lithofacies Characterization

This study utilized core samples from six cored wells in the Bo 72 Block of the Gudao Oilfield, obtaining a cumulative length of 297 m of point bar sandstones from Members 3–4 of the Guantao Formation. Systematic centimeter-resolution observations and descriptions were conducted on all cores, with emphasis on lithology and sedimentary structures, to establish detailed composite core logs.
A total of 156 representative plug samples (2.5 cm diameter × 5–7 cm length) were systematically drilled from the cores for petrophysical analysis and experiments. These samples encompassed distinct lithofacies within the point bar system (point bar medium sandstone facies, point bar fine sandstone facies, and point bar siltstone facies). As presented in Table 1, measured petrophysical properties exhibit wide variations. Specifically, permeability ranges from 100 to 20,000 mD, while porosity varies between 22% and 40%. The reservoir demonstrates ultra-high porosity and permeability characteristics, yet significant property contrasts exist among lithofacies.
To characterize microscopic pore-throat structures, a representative subset of 48 samples stratified across all lithofacies underwent high-pressure mercury injection capillary pressure (MICP) experiments to acquire capillary pressure curves and derive key parameters including displacement pressure, median capillary pressure, median pore-throat radius, pore-throat size distribution frequency, and permeability contribution values; concurrently, 30 independent samples were analyzed using field emission scanning electron microscopy (FE-SEM) to observe pore morphology and clay mineral occurrence habits.

2.2. Parameterization of the Mechanistic Model

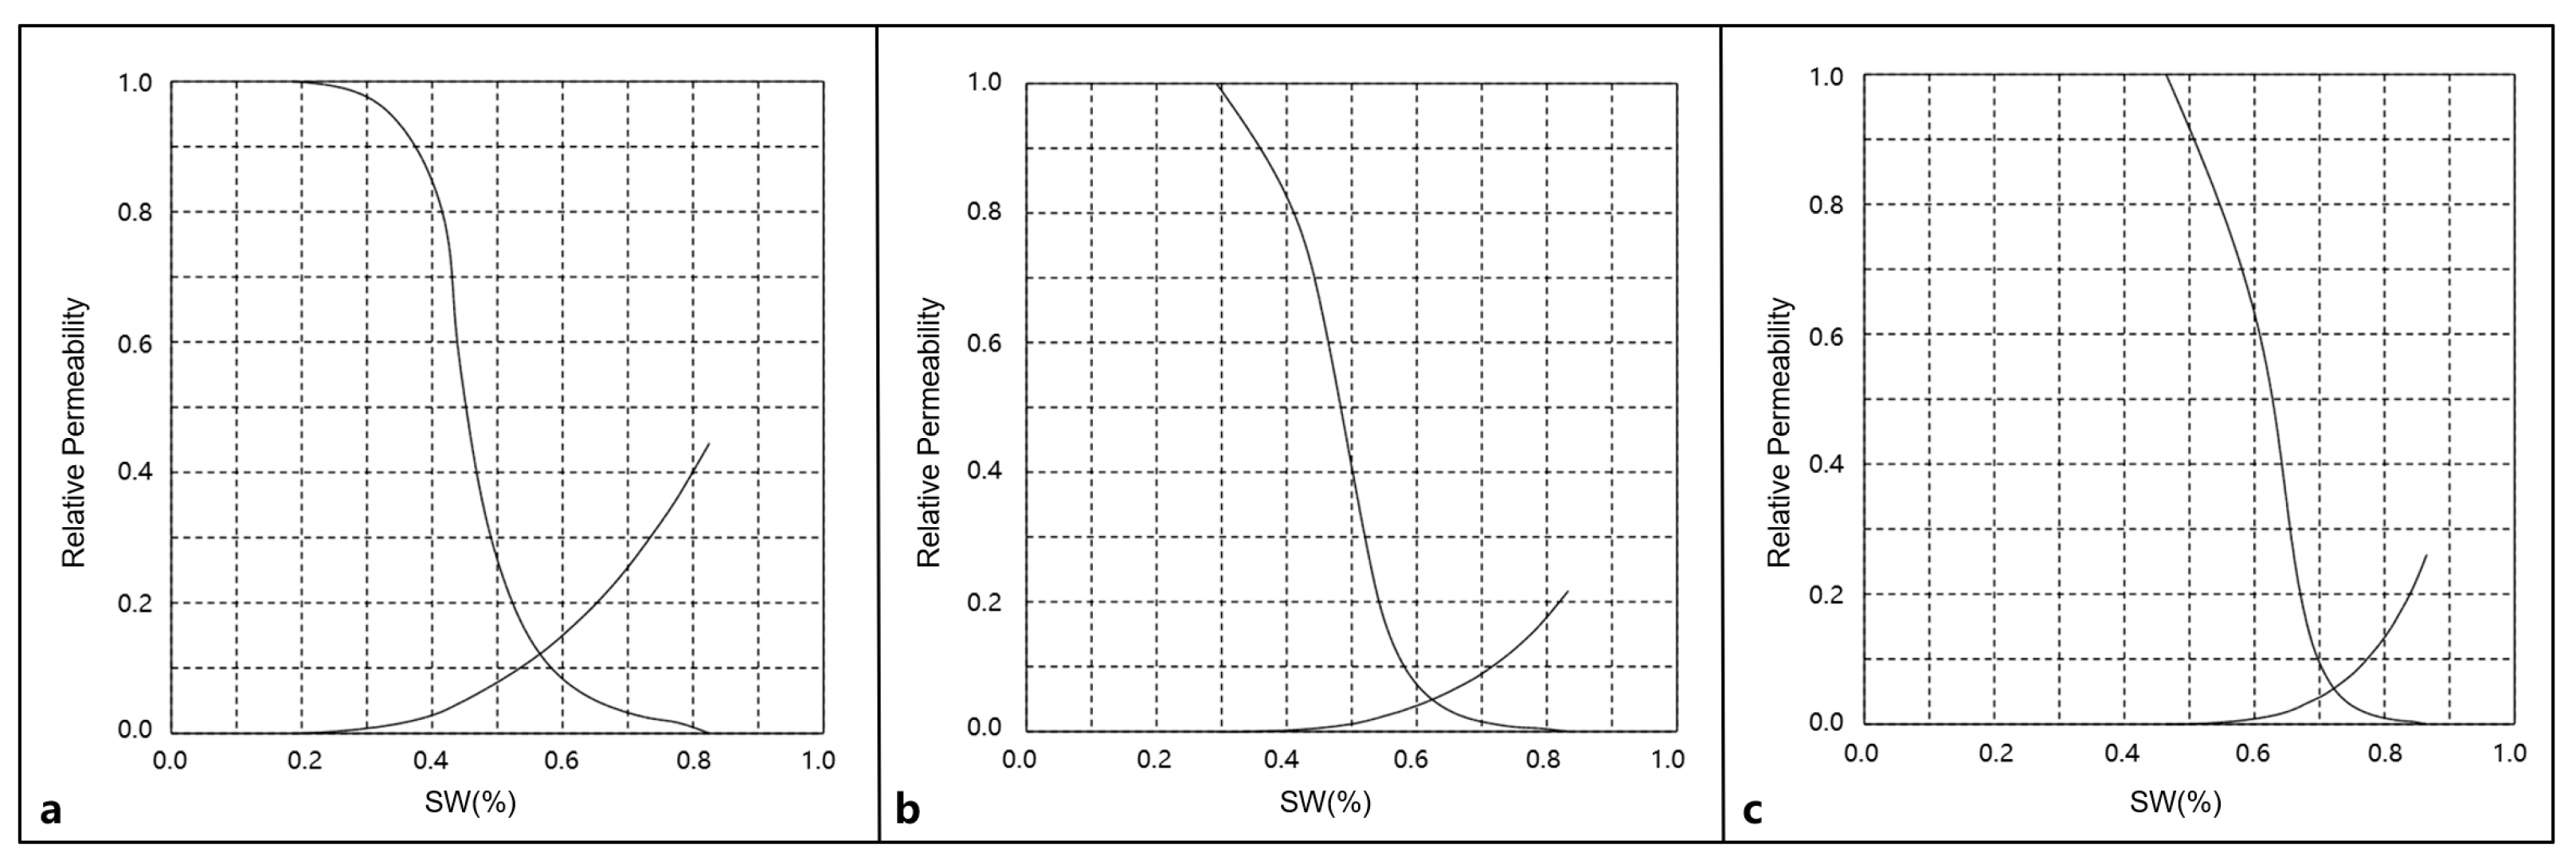
Surfactant–polymer (SP) flooding implemented in the Guantao Formation of Bo 72 Block, Gudao Oilfield demonstrated favorable development performance. Reservoir parameters for this block are presented in Table 2. The polymer concentration employed in the SP flooding operation was 2000 mg/L with a surfactant concentration of 0.45%, consistent with previously reported research [16]. Utilizing these established operational parameters, numerical simulation of the SP flooding process was conducted to quantify critical chemical properties. Polymer behavior was characterized by concentration-dependent viscosity variation and adsorption effects, whereas surfactant properties primarily included interfacial tension reduction and adsorption characteristics. Figure 1 displays history matching results between simulated and field water-cut data under constant liquid production rate conditions. Key chemical parameters used in the simulation are compiled in Figure 2 as well as Table 3 and Table 4, which will be incorporated into subsequent mechanistic modeling.

3. Geological Overview

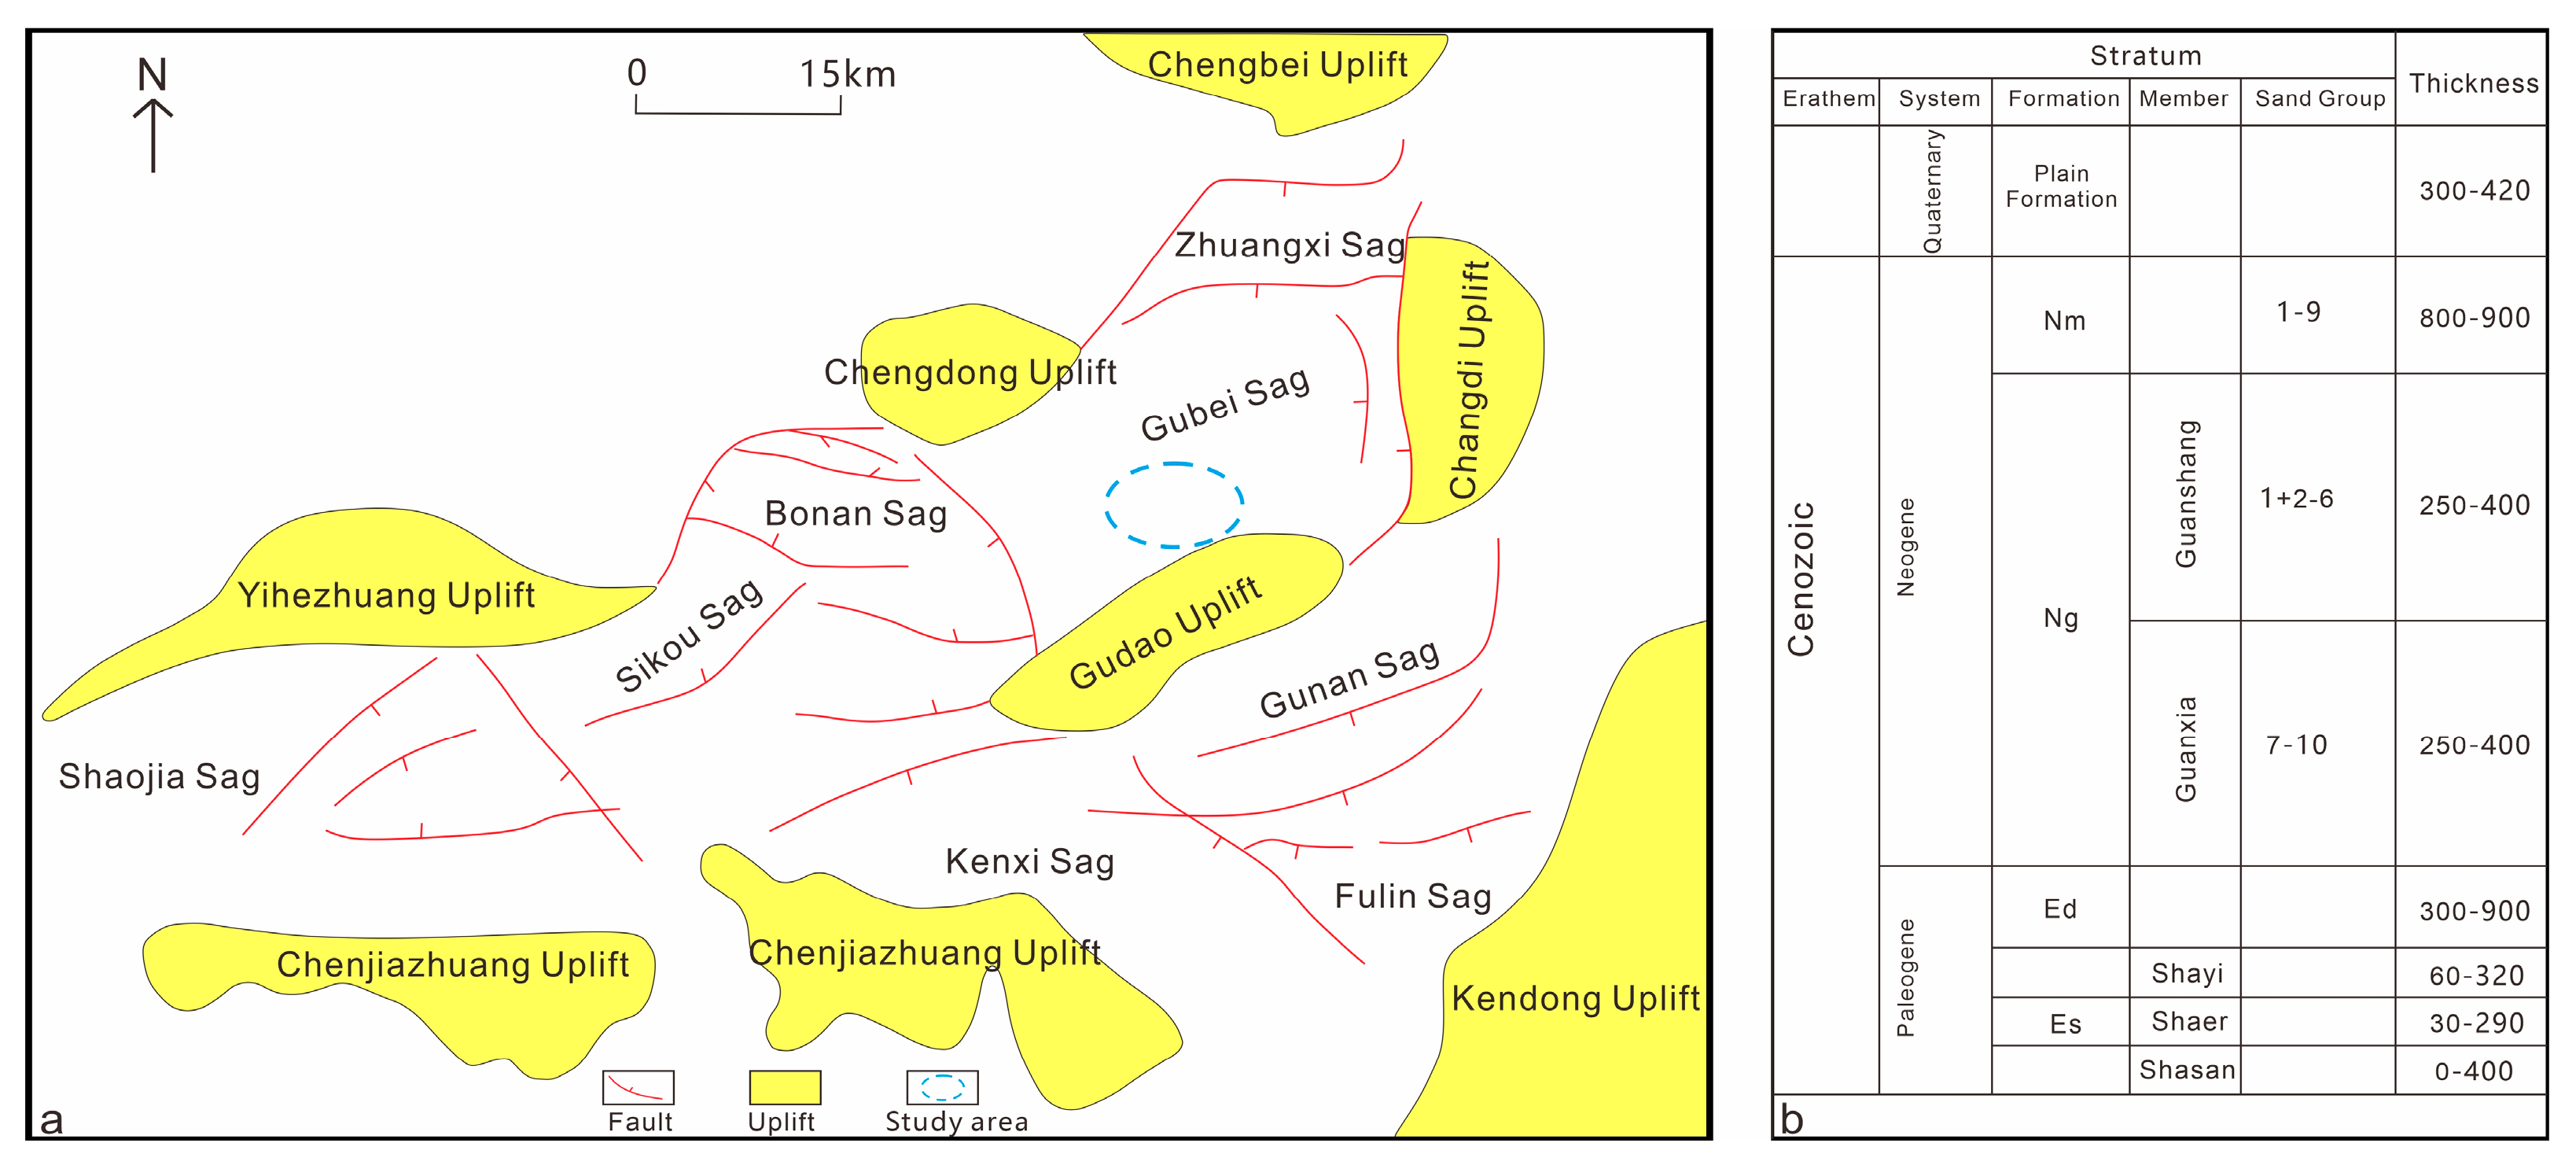
The Gudao Oilfield is located in the eastern Zhanhua Sag of the Jiyang Depression, Bohai Bay Basin. Influenced by Yanshanian and Himalayan tectonic activities, it has developed a half-graben dustpan-shaped faulted structure characterized by northern faulting and southern overlap [7,17,18,19,20]. The study area is situated in the southern Bo 72 Unit of the Gudao Oilfield. Figure 3 presents the structural location map of the study area. Drilling data reveal six major oil-bearing formations from top to bottom: Minghuazhen Formation, Guantao Formation, Dongying Formation, and Shahejie Formation. The Guantao Formation, at a burial depth of approximately 1150 m, has long been a critical target for hydrocarbon exploration and development, exhibiting alternating deposition of braided river and meandering river facies [21,22,23].
The studied interval (Guantao 3–4 Members) comprises meandering river deposits dominated by point bar sand bodies. These reservoirs generally exhibit positive rhythm sequences characterized by upward-fining grain size and upward-thinning layer thickness, demonstrating distinct binary structural features. The lithofacies show complex and diverse characteristics. Reservoir porosity ranges from 22.3% to 39.8% (average 32.9%), while permeability varies between 100 and 20,000 mD (average 1350 mD), classifying them as ultra-high porosity and ultra-high permeability reservoirs [1,6,24]. Different lithofacies types within point bars present varying pore structures and permeability characteristics, resulting in reservoir property heterogeneity. This heterogeneity further influences hydrocarbon migration and accumulation during development, forming complex remaining oil distribution patterns. The remaining oil distribution becomes increasingly scattered and difficult to extract.

4. Results

4.1. Lithofacies Types and Characteristics

4.1.1. Lithofacies Classification Scheme

The term “lithofacies” is now widely adopted in geological studies [25,26,27,28]. This study employs Feng Zengzhao’s definition of “facies” [28]. Observations from six coring wells (297 m total core length), grain size analysis, and mercury injection analysis in the Bo 72 Unit reveal that the meandering river depositional system primarily develops fine sandstone, followed by medium sandstone, siltstone, and argillaceous siltstone. Sedimentary structures are dominated by parallel bedding and cross-bedding, with grain size probability curves exhibiting a two-segment pattern. Based on lithology, grain size, and sedimentary structures, the meandering river point bar sand bodies in the Bo 72 Unit are classified into three lithofacies: point bar medium sandstone facies, point bar fine sandstone facies, and point bar siltstone facies.

4.1.2. Characteristics of the Point Bar Medium Sandstone Facies

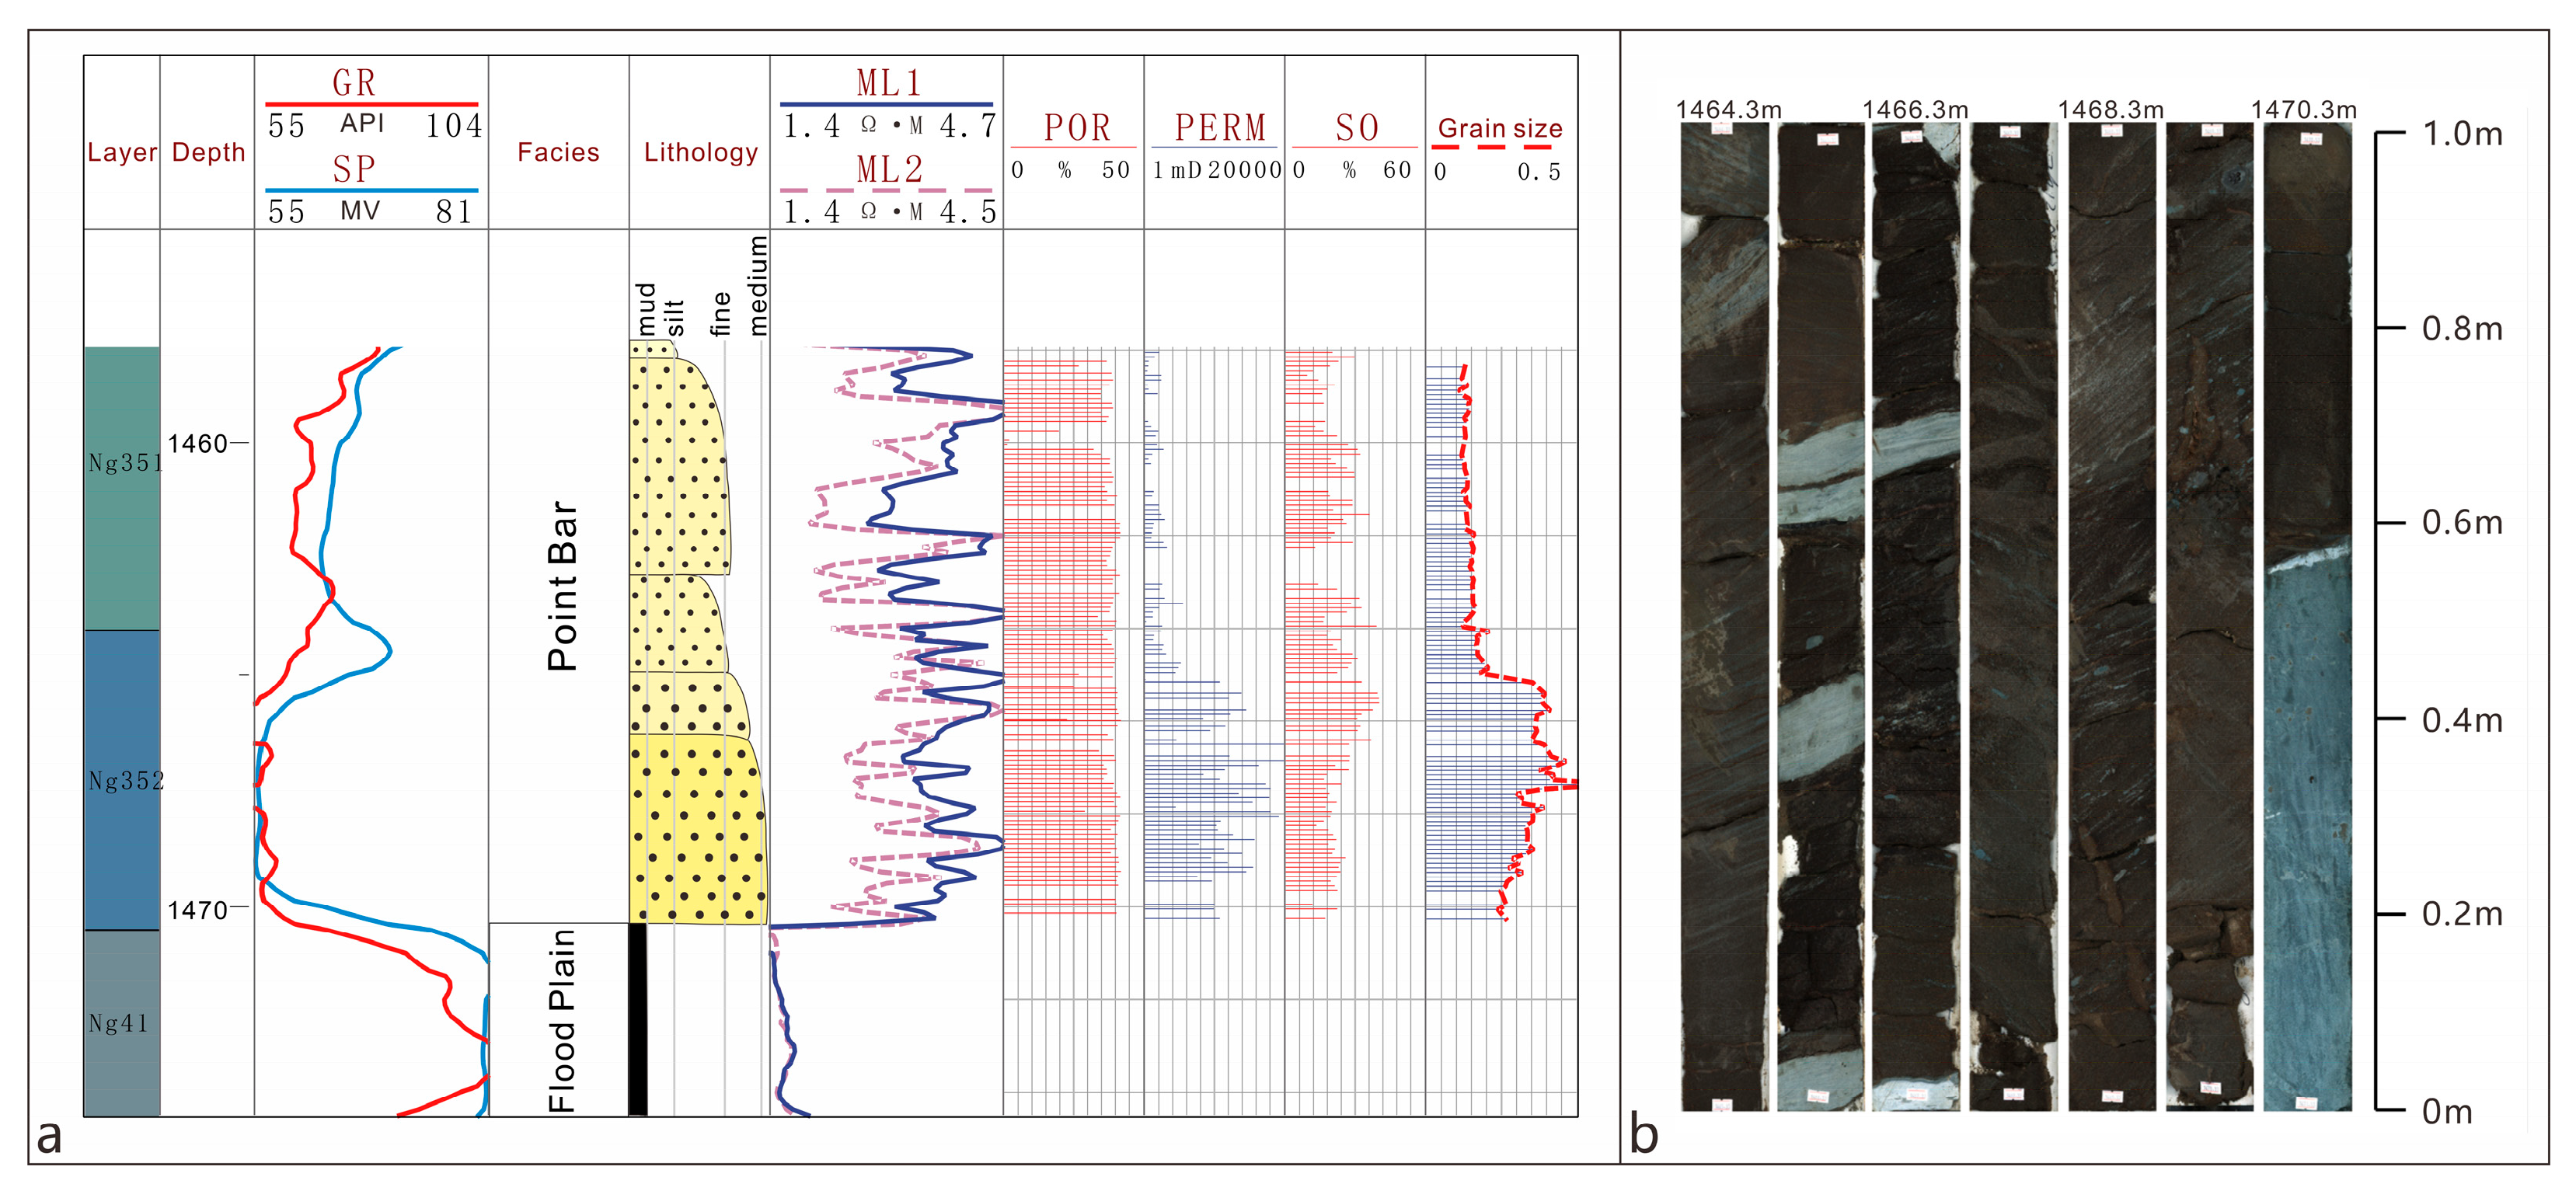
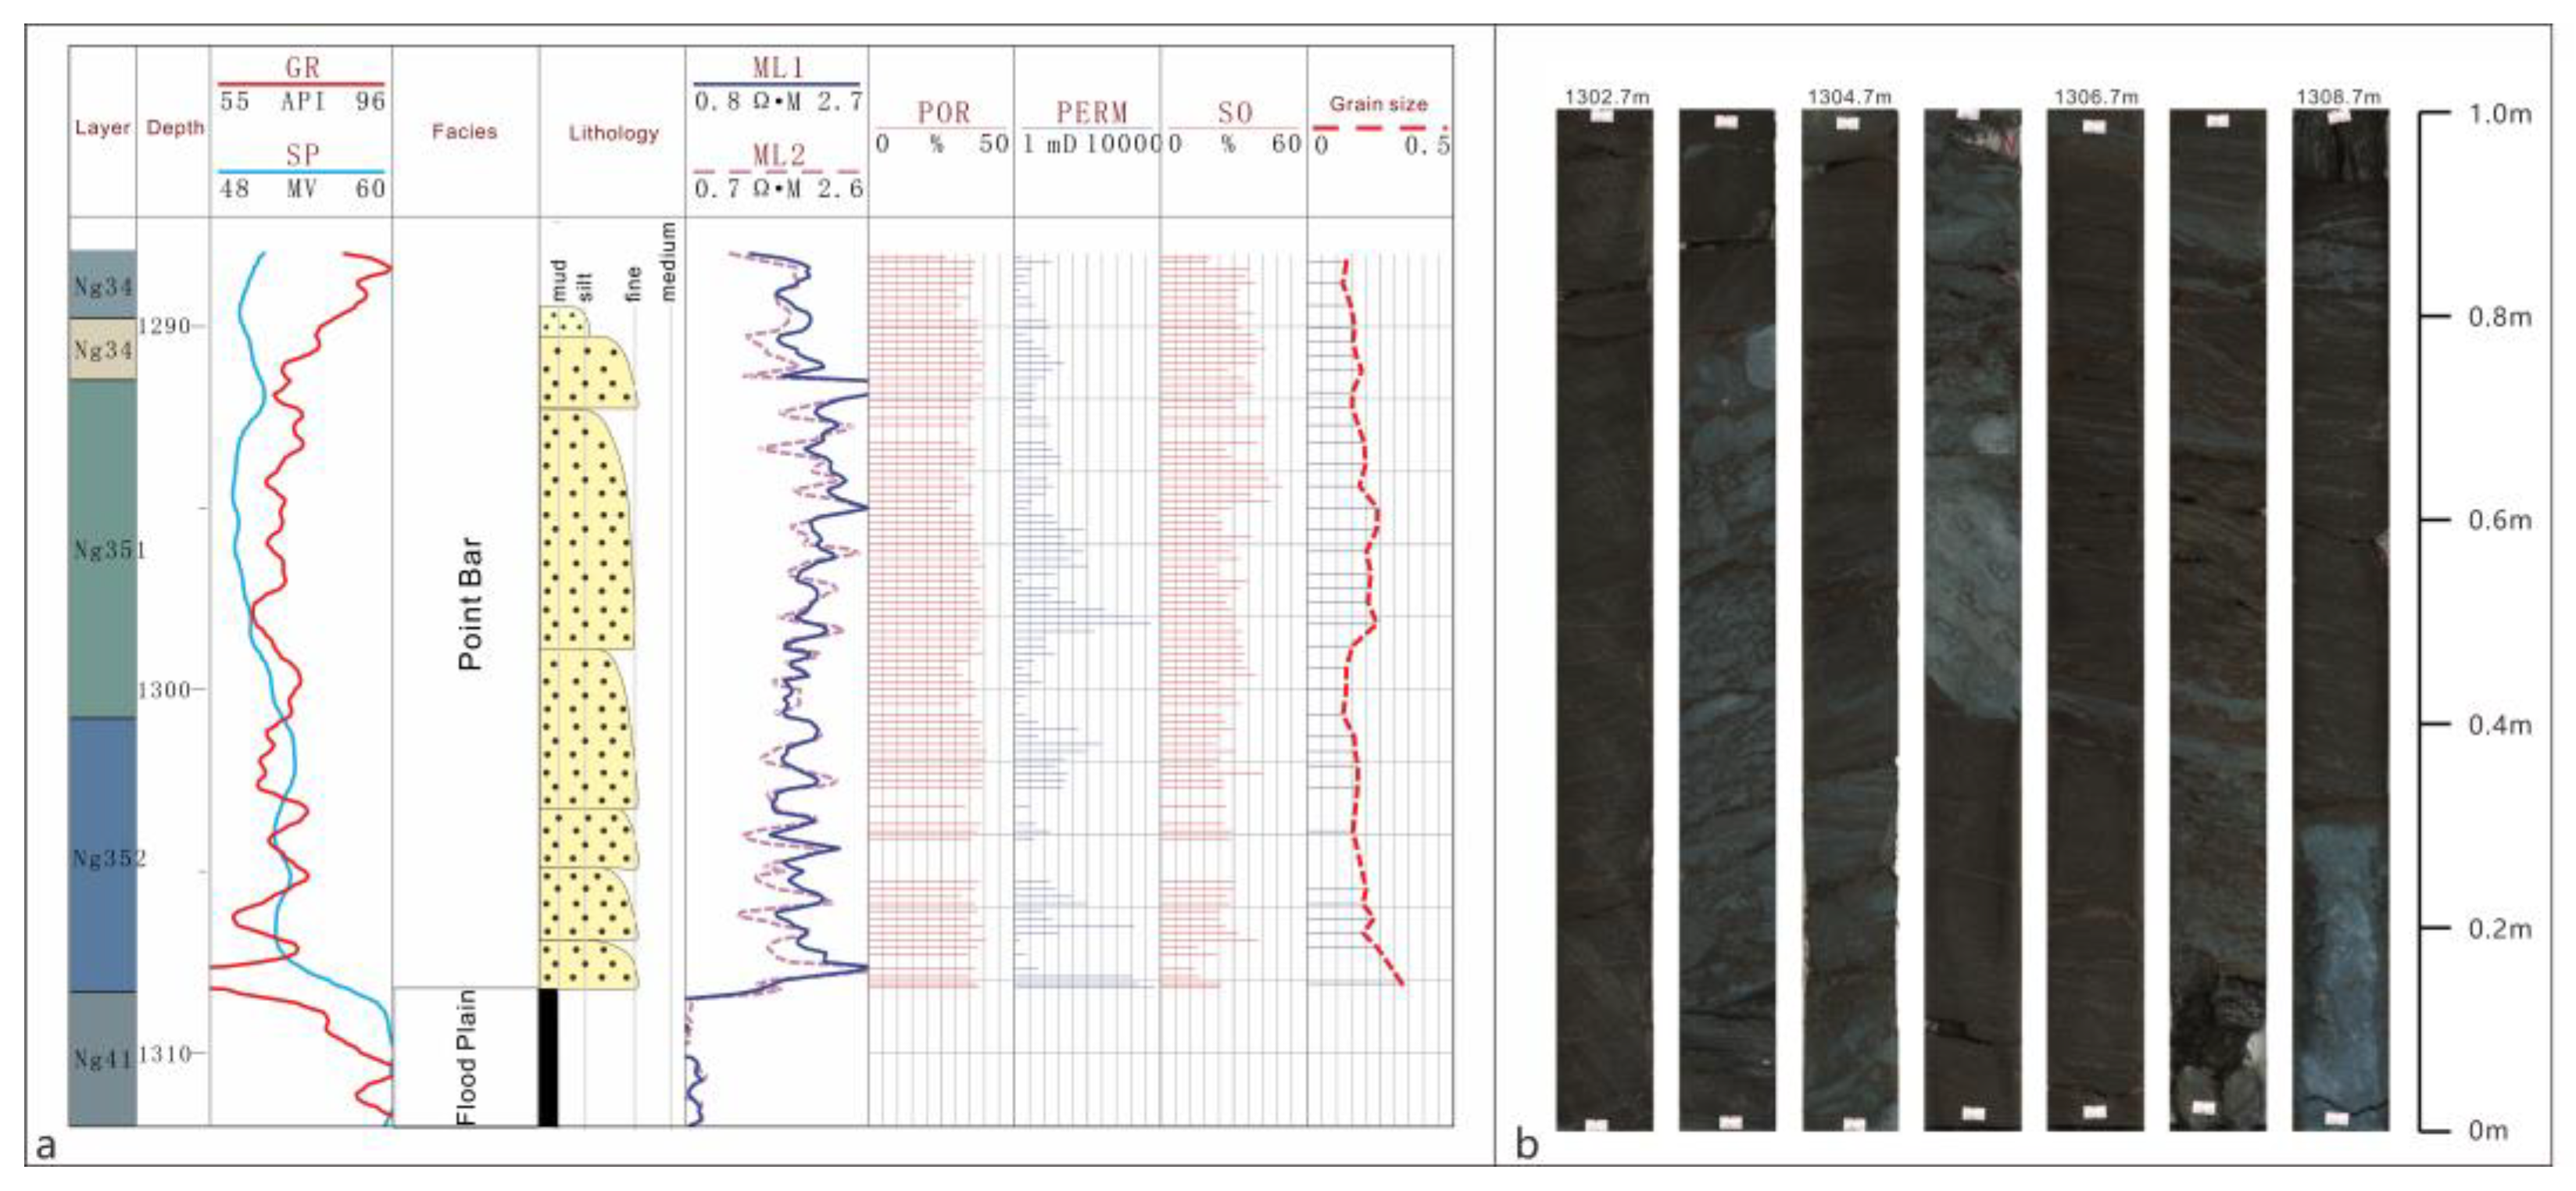
The point bar medium sandstone facies, as the basal unit of meandering river point bar sand bodies, occupies the lowermost layer of the vertical sedimentary sequence and exhibits the highest porosity and permeability among the three lithofacies types (porosity: 34–40%, average 37.2%; permeability: 2500–20,000 mD, average 8500 mD). Figure 4 presents the macroscopic characteristics of the point bar medium sandstone facies. In terms of sedimentary structures, this facies is dominated by massive bedding with indistinct stratification, indicating rapid sediment accumulation under high-energy flow conditions [29]. This contrasts notably with the diverse bedding types in the fine-grained sandstone facies and the low-angle cross-stratification characteristic of the siltstone facies within the point bar system. Regarding contact relationships, this facies shows abrupt contact with underlying mudstone, reflecting a swift transition from low-energy muddy to high-energy sandy depositional environments.
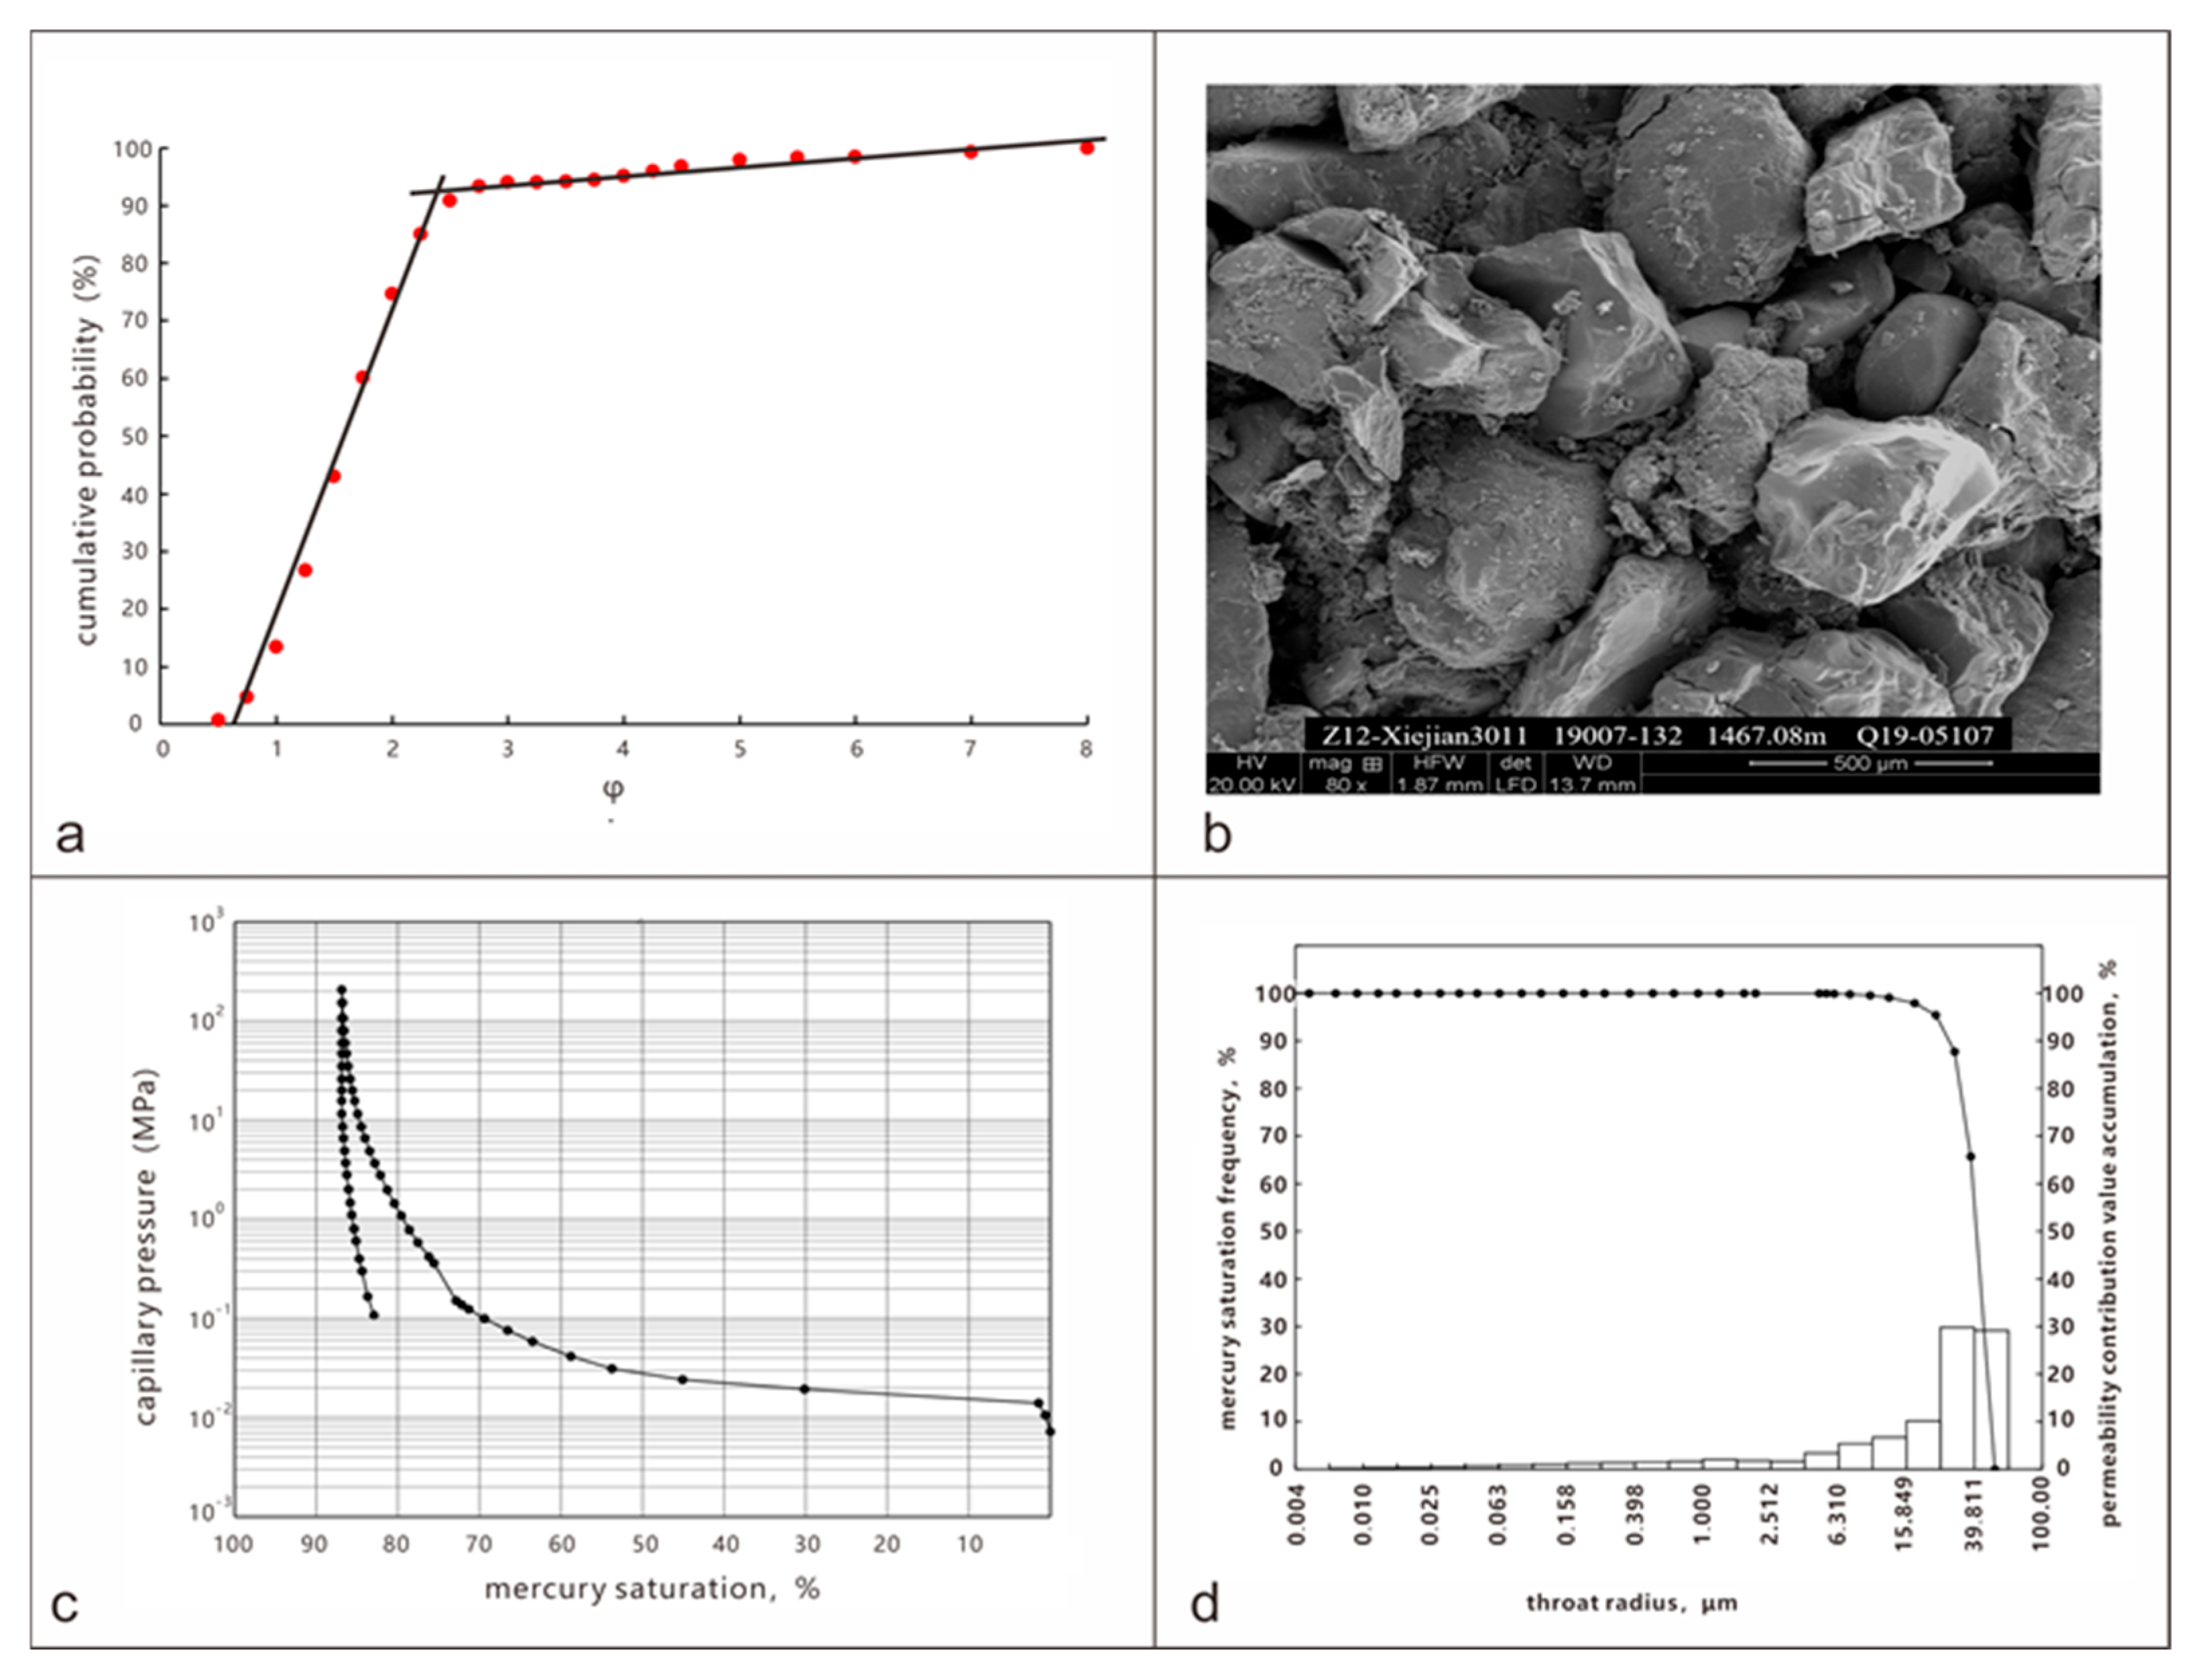
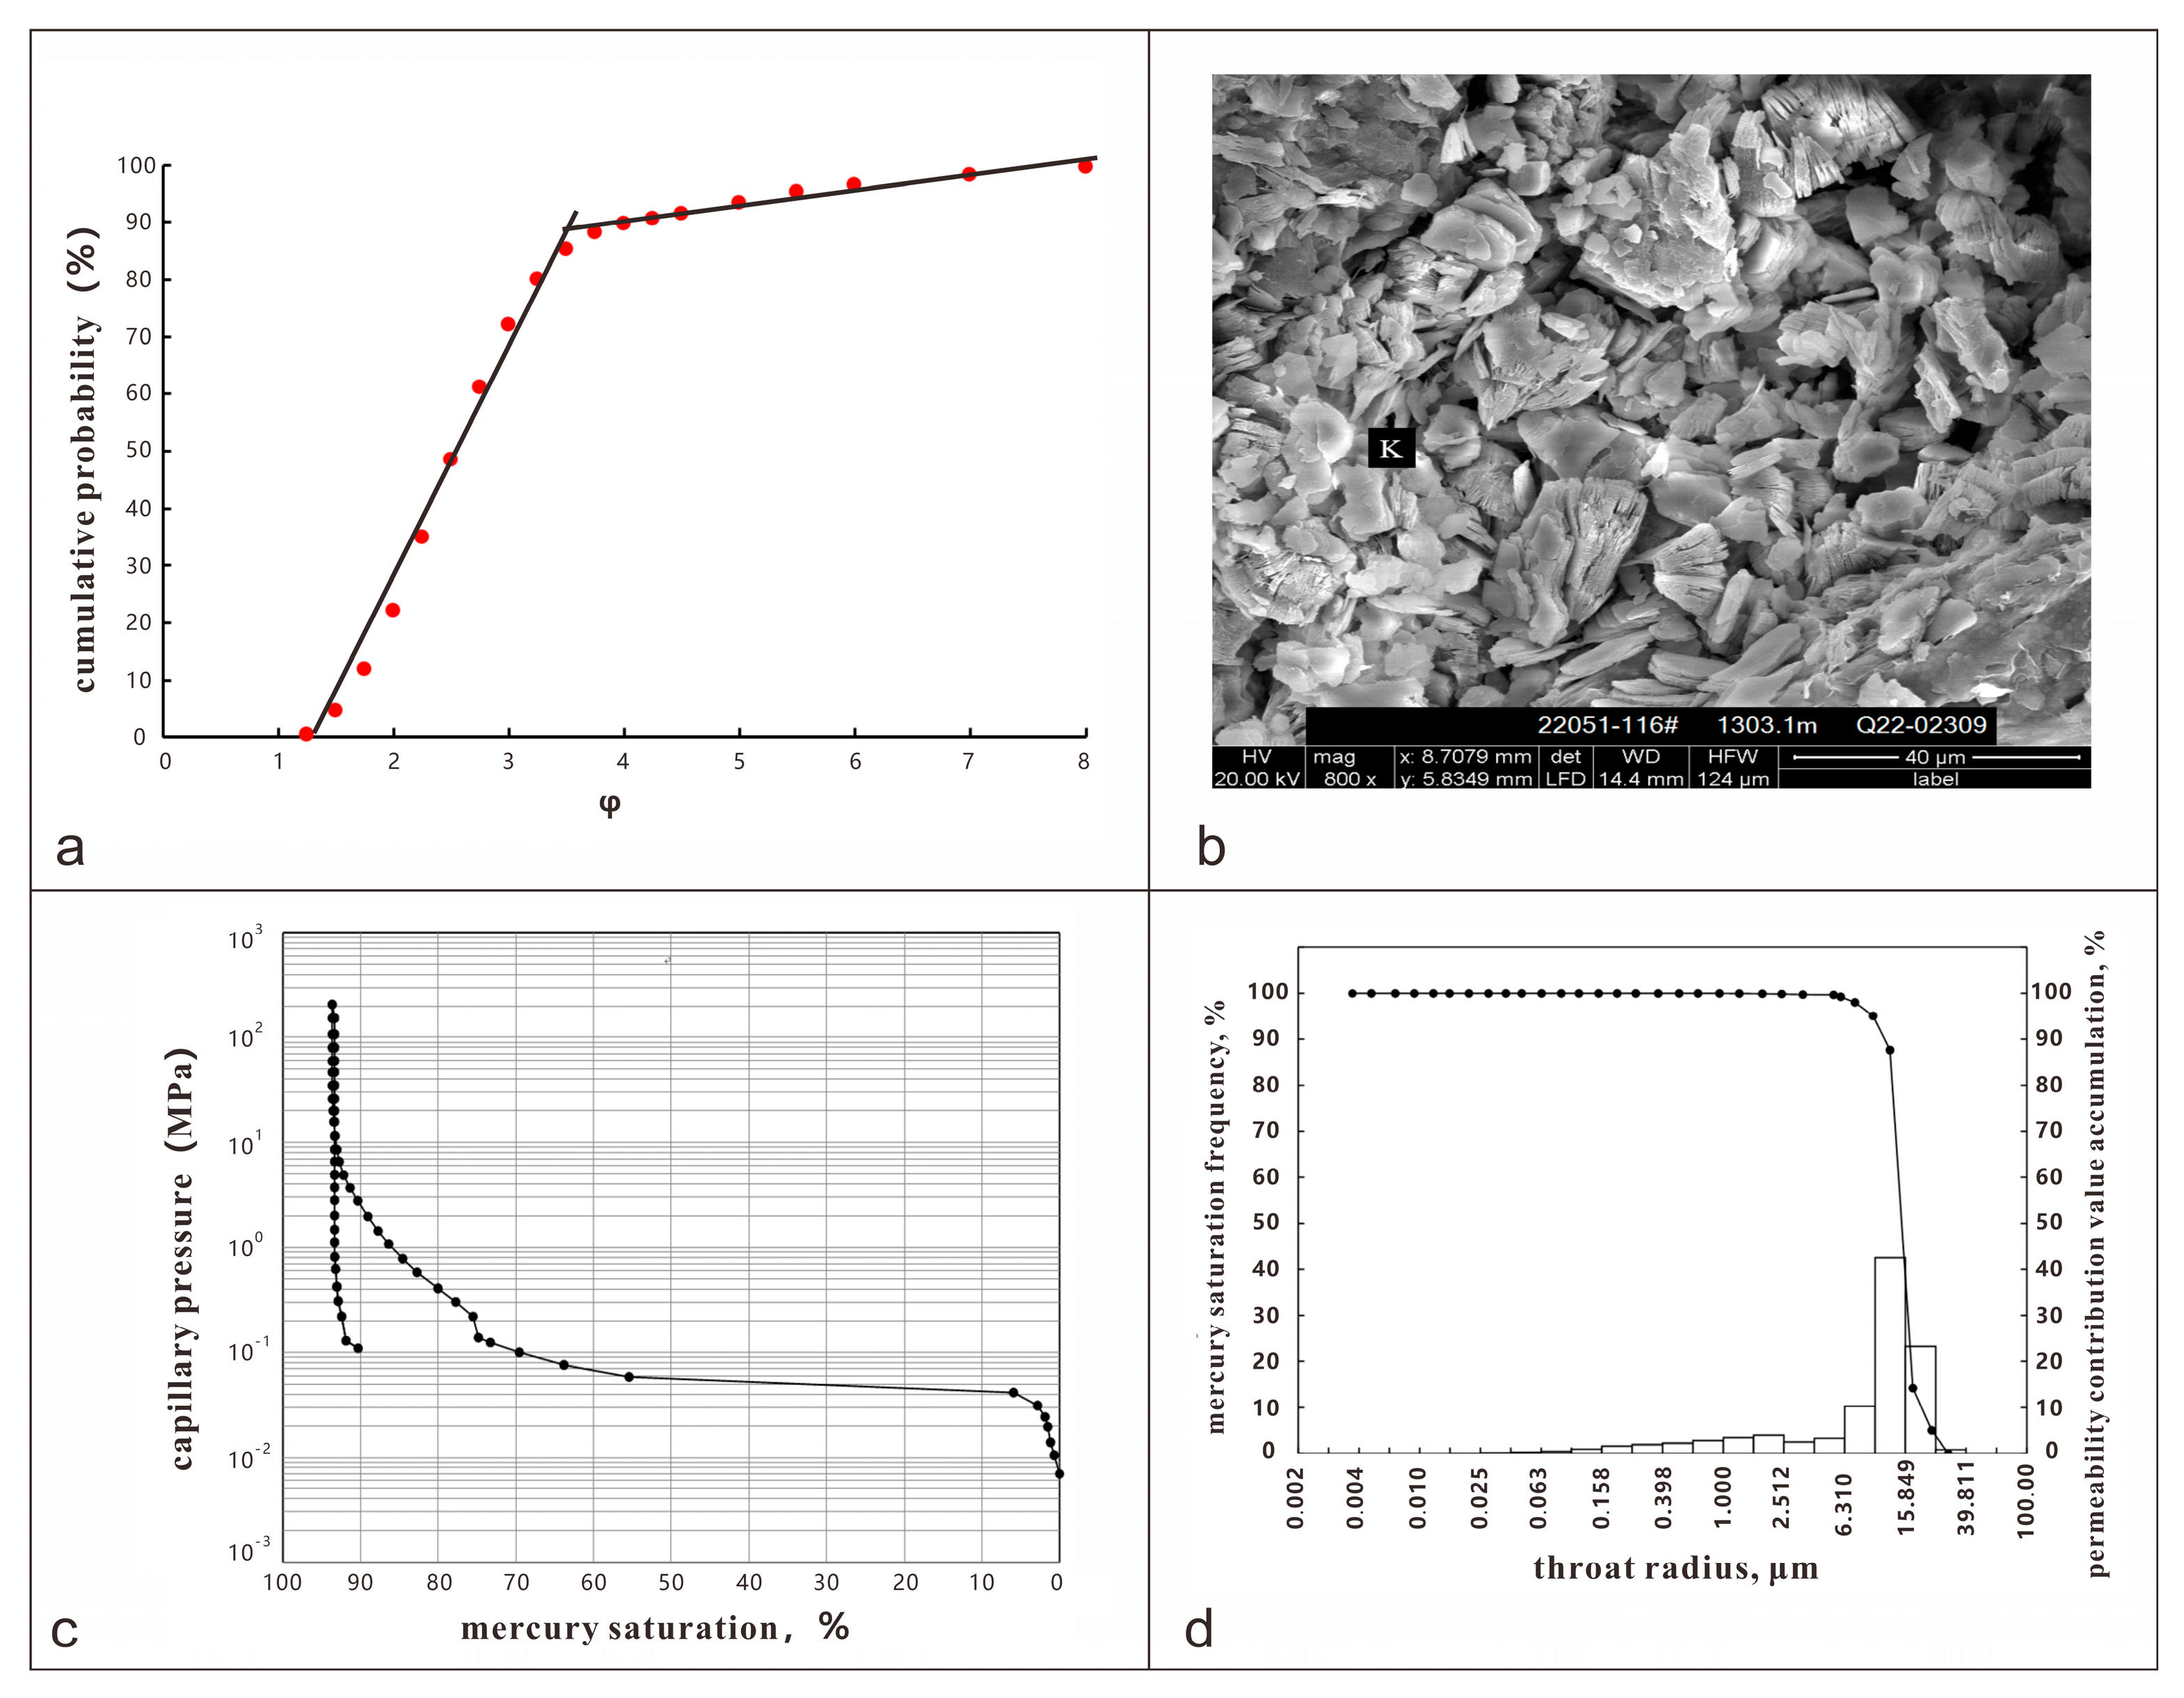
From sediment dynamic parameters, this facies features relatively coarse grain sizes ranging from 0.25 mm to 0.54 mm (average 0.38 mm). Figure 5 presents the microscopic characteristics of the point bar medium sandstone facies. Its grain size probability curve displays a typical two-segment pattern, suggesting strong hydrodynamic transport and depositional processes.
Pore-throat structure analysis reveals well-developed intergranular pores with favorable connectivity as observed in Figure 5b. The mercury injection curve exhibits a broad, gentle platform (displacement pressure < 0.015 MPa) as observed in Figure 5c, with an average pore-throat radius of 21.8 μm and a maximum connected pore-throat radius of 52.48 μm as observed in Figure 5d. The high proportion of large pore throats contributes significantly to enhanced flow capacity.

4.1.3. Characteristics of the Point Bar Fine Sandstone Facies

The point bar fine sandstone facies, as the primary reservoir unit of meandering river point bar sand bodies, is situated in the middle-lower part of the sand body. It formed during the waning stage of flood events. Figure 6 presents the macroscopic characteristics of the point bar fine sandstone facies and exhibits moderate porosity and permeability characteristics (porosity: 28–37%, average 34.2%; permeability: 800–2500 mD, average 1350 mD). This facies serves as a key control on reservoir heterogeneity and remaining oil distribution.
Dominantly composed of fine-grained sandstone, it displays distinctive composite bedding architectures, with alternating high-angle (20–35°) and low-angle (5–15°) cross-bedding, reflecting bidirectional flow patterns during lateral accretion of point bars. Subparallel bedding occurs in the upper portions of thick cross-bedded layers, characterized by planar bedding surfaces that indicate lower hydrodynamic energy than the point bar medium sandstone facies but higher energy than the siltstone facies. Localized argillaceous drapes separate sand bodies of different depositional episodes, creating vertical flow barriers.
The median grain size ranges from 0.08 mm to 0.24 mm (average 0.18 mm) as observed in Figure 6a. Figure 7 presents the microscopic characteristics of the point bar fine sandstone facies. Its grain size probability curves exhibit a two-segment pattern, dominated by saltation populations with increased suspended load compared to the point bar medium sandstone facies, suggesting periodic hydrodynamic fluctuations and intermediate transport distances. Scanning electron microscopy reveals well-developed intergranular pores, though local pore connectivity is reduced due to kaolinite (K) infill. Mercury injection curves show steep-to-gentle transitional shapes (displacement pressure: 0.02–0.04 MPa), with an average pore-throat radius of 10.3 μm and maximum connected radius of 30.34 μm. The coexistence of medium and small pore throats results in flow capacities intermediate between the sandstone facies and siltstone facies in point bars.

4.1.4. Characteristics of the Point Bar Siltstone Facies

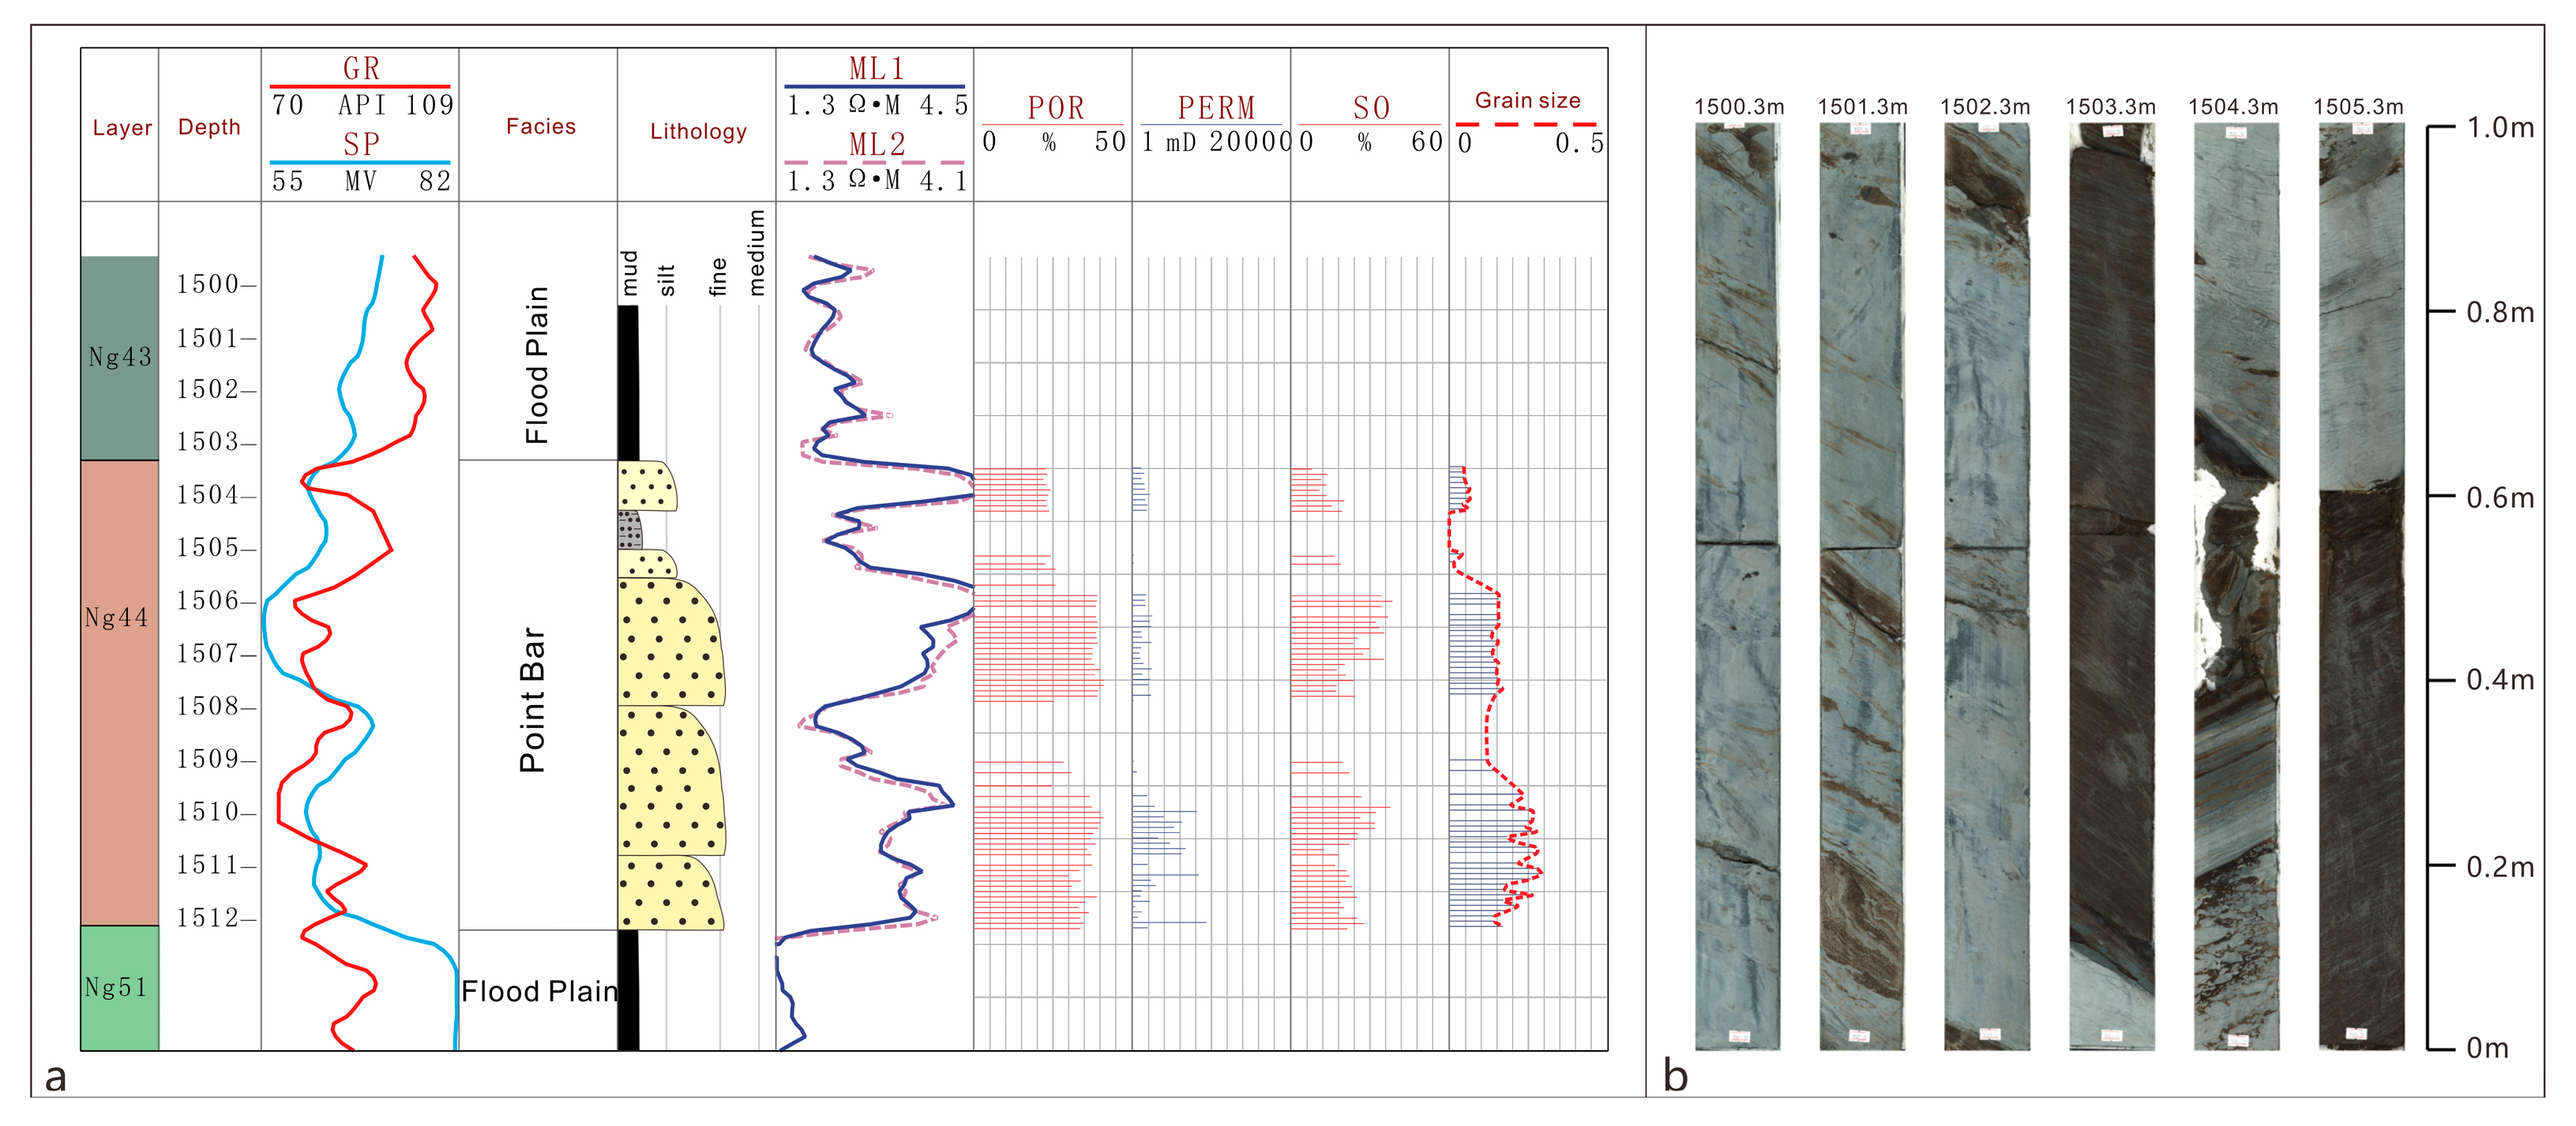
Figure 8 presents the macroscopic characteristics of the point bar siltstone facies, positioned at the top of the vertical sequence in meandering river point bar sand bodies, forms during the late flood to waning stages with significantly diminished hydrodynamic energy. It records quiet water deposition of fine-grained clastics and exhibits the lowest porosity and permeability among the three lithofacies types (porosity: 22–30%, average 27.8%; permeability: 100–600 mD, average 500 mD), serving as the primary remaining oil enrichment zone post-waterflooding.
This facie is dominated by siltstone, developing low-angle wavy bedding [30,31] with gently undulating bedding surfaces, indicative of slow deposition in stagnant water. Locally observed horizontal bedding suggests intermittent subaerial exposure or ultra-low-energy depositional conditions.
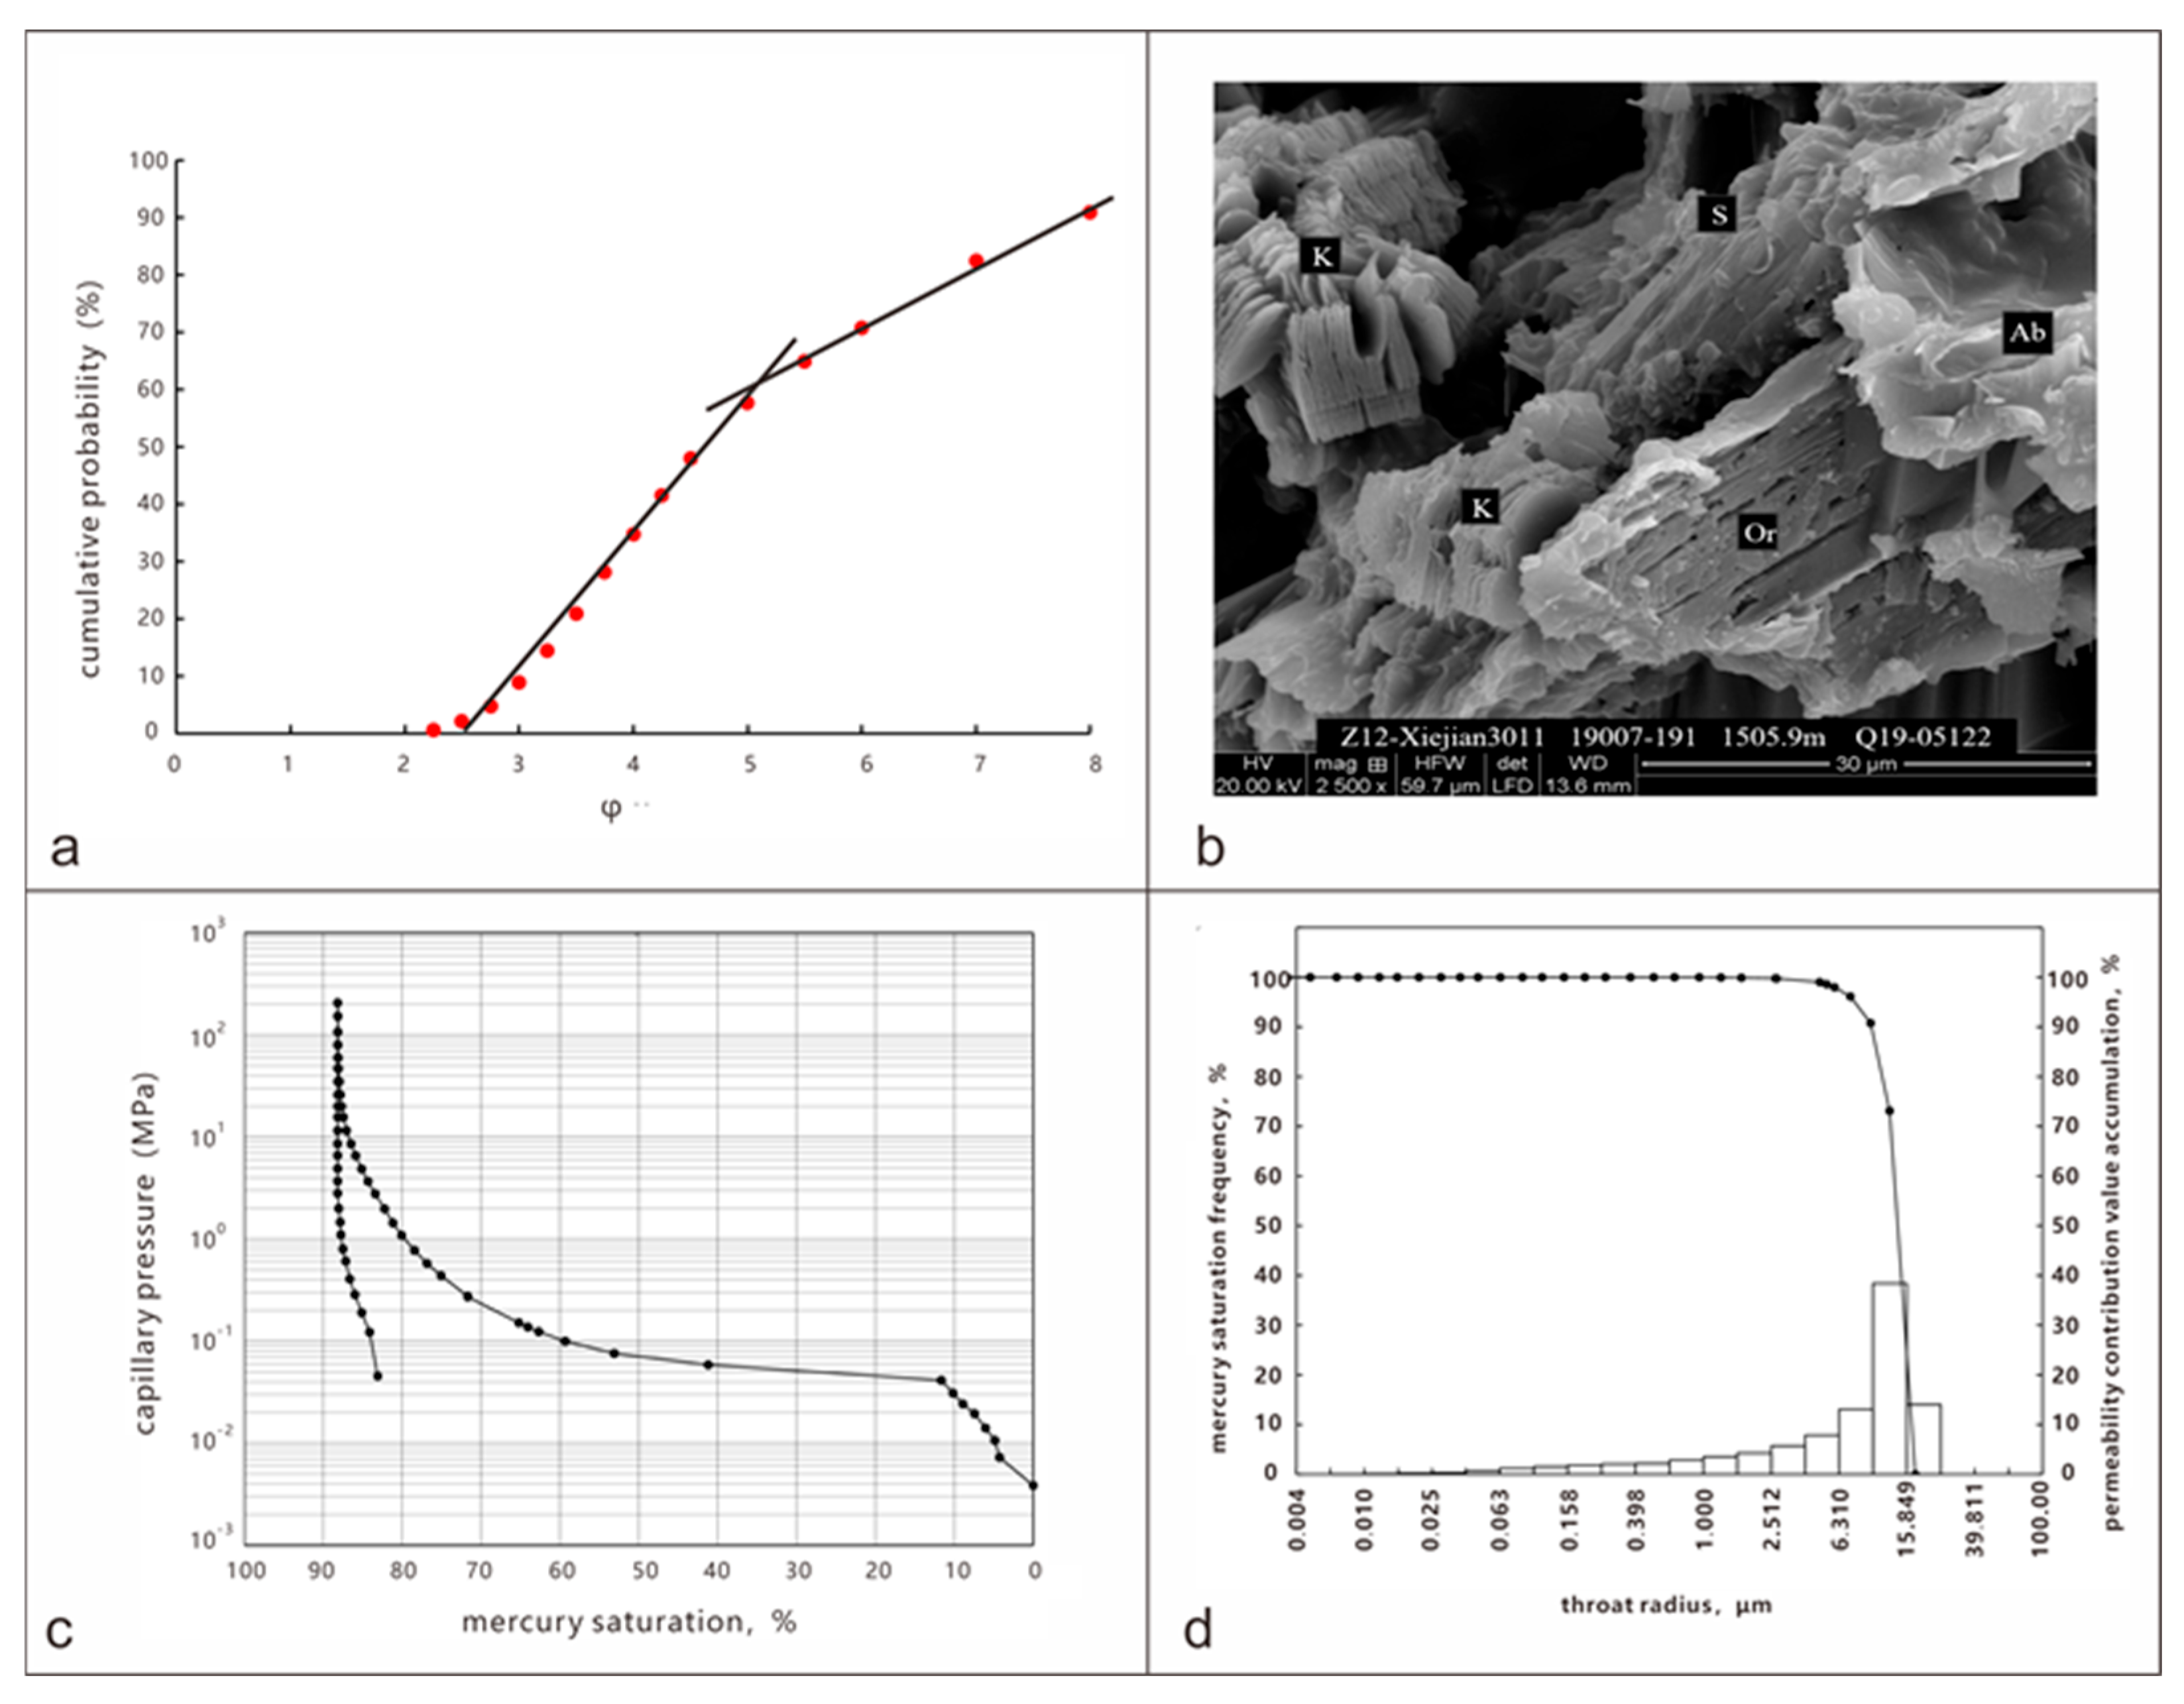
Figure 9 presents the microscopic characteristics of the point bar siltstone facies. Grain size probability curves display a two-segment pattern, with a higher proportion of suspended load compared to both the point bar medium sandstone facies and fine sandstone facies, reflecting chaotic accumulation under progressively waning hydrodynamic energy.
Scanning electron microscopy reveals limited intergranular pore development, where clay minerals (kaolinite, smectite) form pore-filling sheet-like aggregates that severely degrade connectivity. Mercury injection curves exhibit steep profiles (displacement pressure > 0.04 MPa), with an average pore-throat radius of 7.9 μm and maximum connected radius of 17.75 μm. Predominance of micro-scale pore throats results in permeability significantly lower than both the point bar medium sandstone facies and fine sandstone facies.

4.1.5. Lithofacies Variations and Genetic Linkages

Table 5 contrasts key characteristics of major lithofacies within the point bar sand bodies, revealing significant variations and intrinsic genetic linkages among the three facies. These variations constitute the fundamental geological controls on reservoir heterogeneity and fluid flow behavior.
The lithofacies exhibit a systematic vertical distribution in upward-fining sequences: point bar medium sandstone facies dominate the base (deposited during high-energy flow regimes), point bar fine sandstone facies occupy intermediate positions (waning-energy phase), and point bar siltstone facies cap the sequence (low-energy stagnant conditions). Petrophysical properties display a pronounced stepwise decline, with permeability contrast ratios reaching orders of magnitude—a hallmark of strong reservoir heterogeneity. This permeability gradient (high-medium-low) directly controls displacement dynamics: the high-porosity/permeability point bar medium sandstone facies form preferential flow pathways. The moderate properties and internal heterogeneity of point bar fine sandstone facies cause uneven displacement front advancement, while the low-permeability point bar siltstone facies act as flow baffles and residual oil enrichment zones. During surfactant–polymer (SP) flooding, polymers enhance sweep efficiency in low-permeability siltstones through viscosity control, surfactants mobilize residual oil in medium sandstones via interfacial tension reduction, and the fine sandstone facies—subjected to dual mechanisms—emerge as critical zones for incremental recovery.

4.2. Lithofacies Depositional Model of Point Bar Sand Bodies in a Meandering River

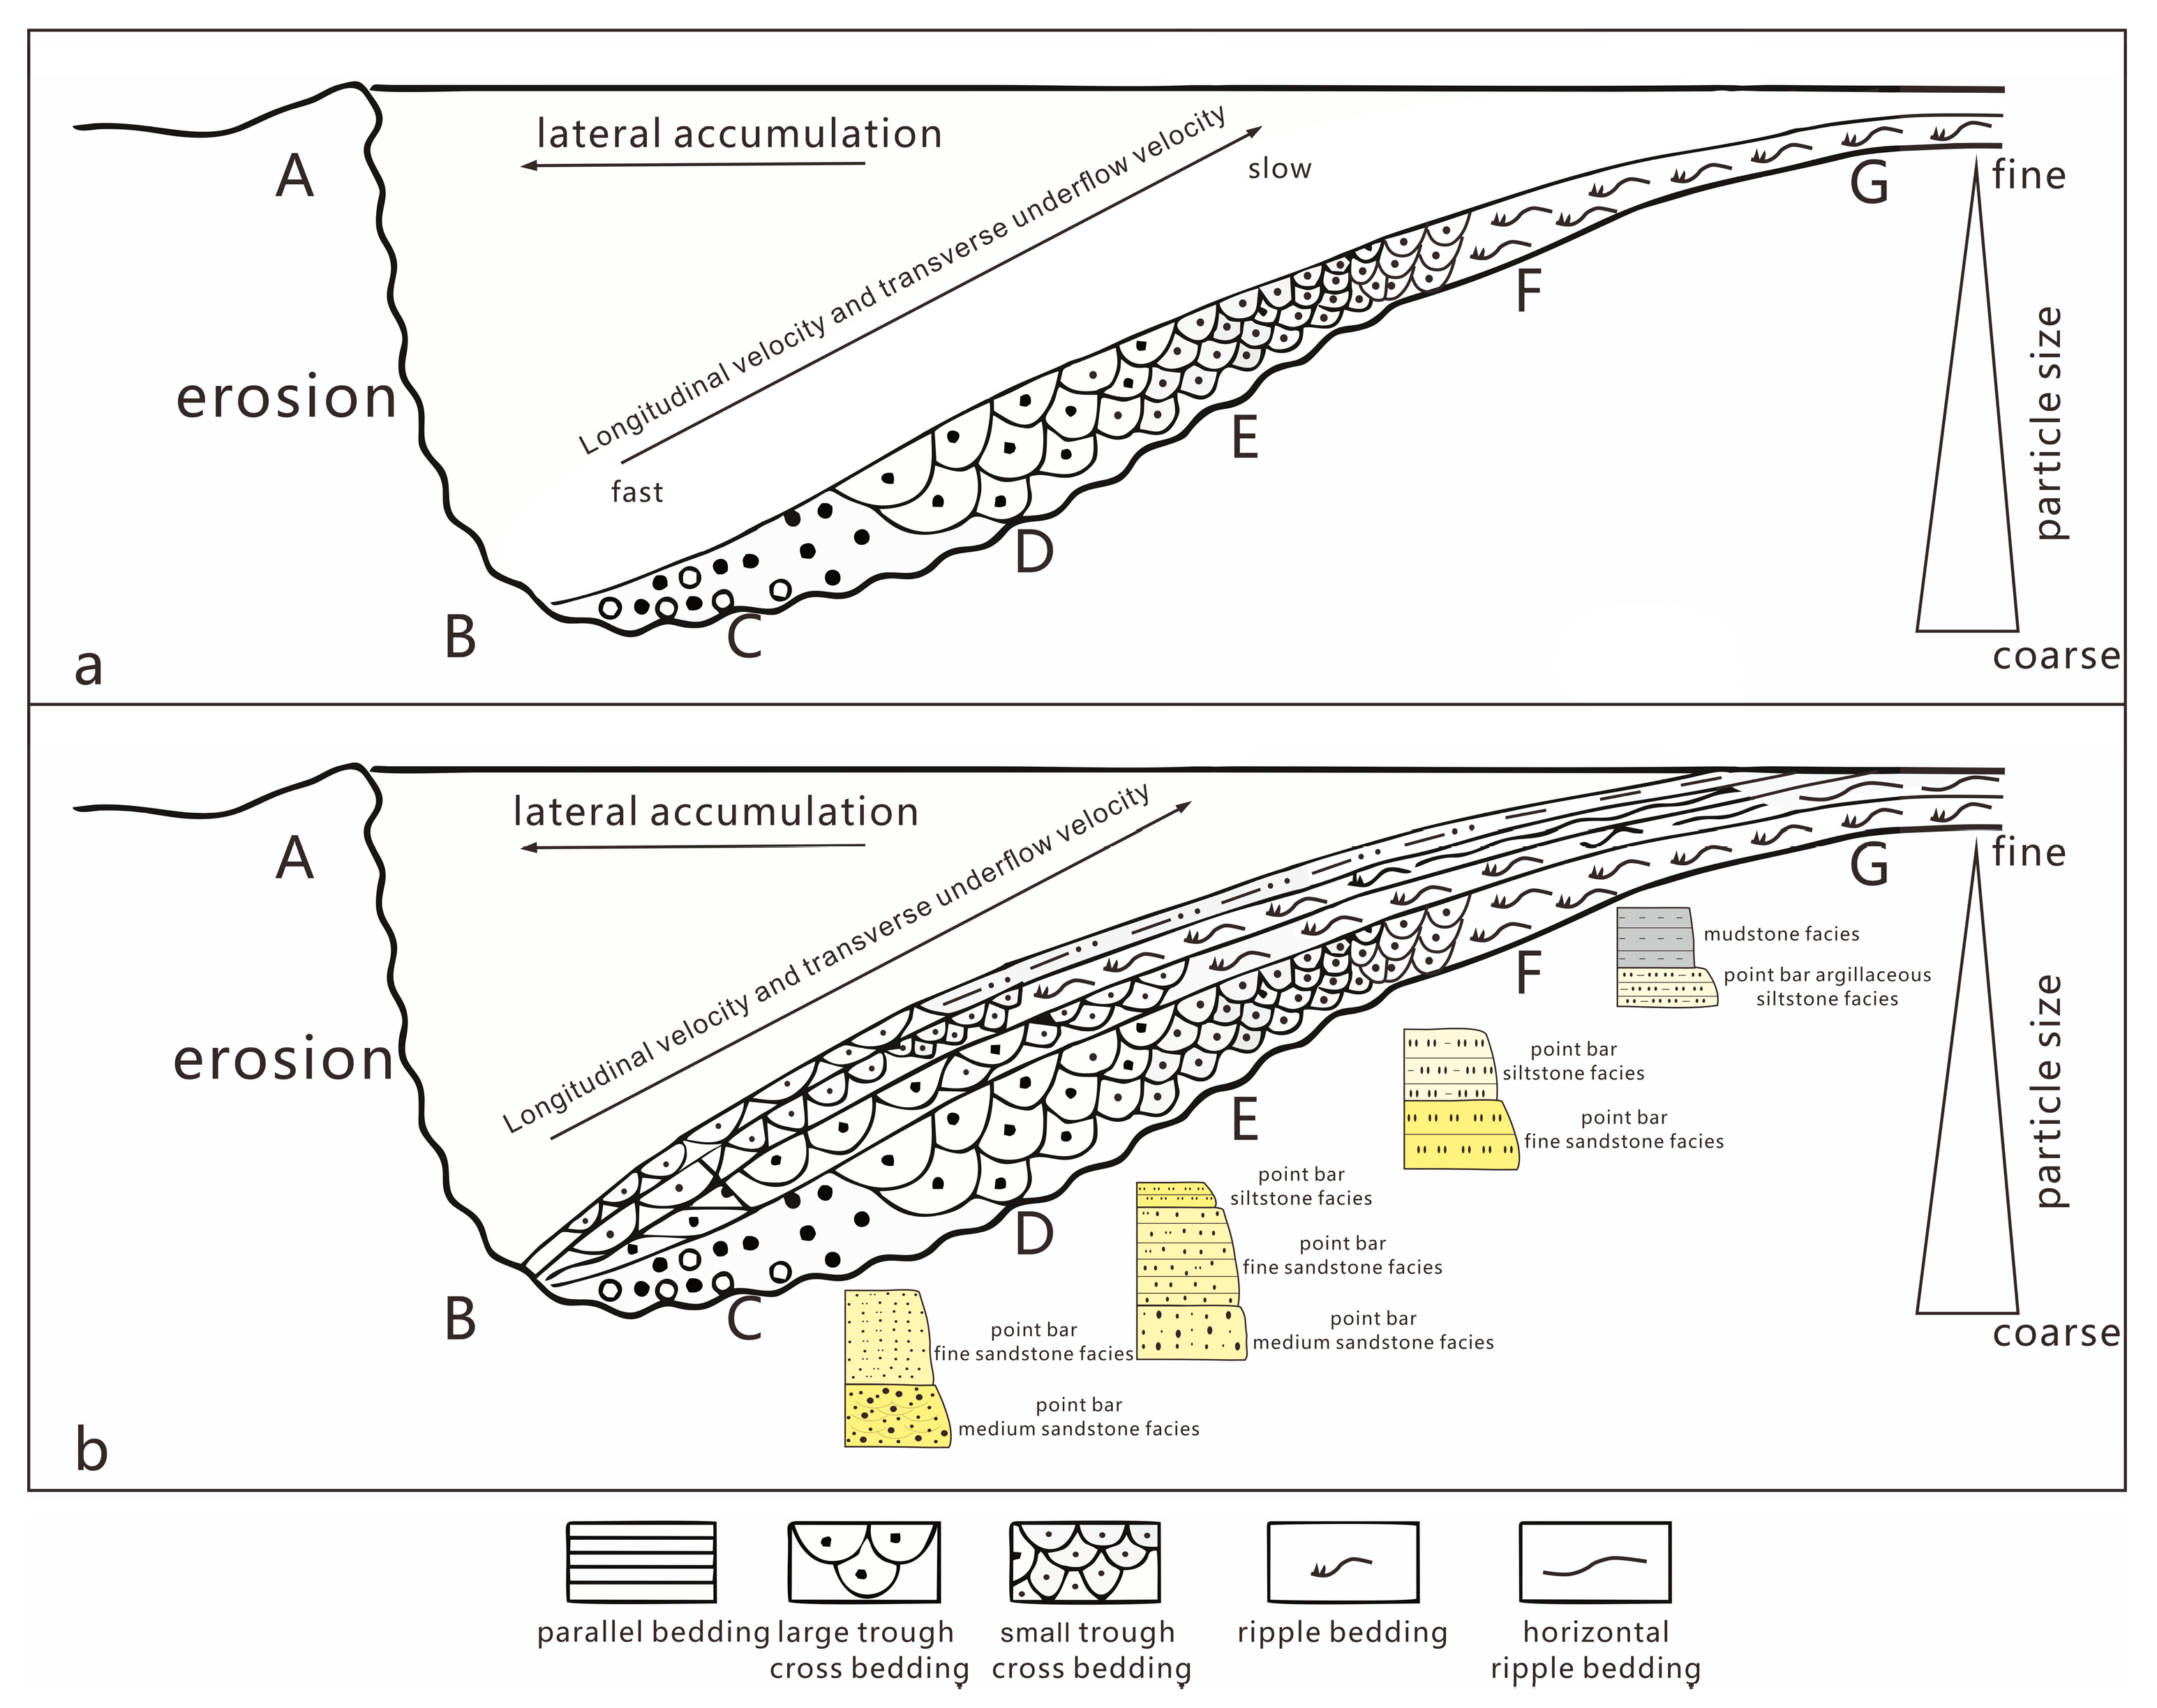
To investigate the lateral sedimentary characteristics of lithofacies, this study examines depositional features at different locations during a specific sedimentary phase. According to the concave erosion and convex accretion mechanism of meandering rivers, the water depth decreases from the concave bank to the convex bank, accompanied by reduced longitudinal flow velocity and diminished transverse bottom current. These hydrodynamic changes lead to gradual sediment fining and a transition in dominant depositional loads from rolling → saltation → suspension components, ultimately forming distinct lithofacies at different positions, thereby establishing a lateral depositional model for point bar lithofacies [32].
Figure 10 presents the depositional model of lithofacies within point bar sand bodies. In the lower point bar (CD), despite the initial shift toward the convex bank and slightly reduced flow velocity, the current remains sufficiently strong to deposit coarse saltation components (medium sand) as the dominant sediment. The middle point bar (DE) continues to shift toward the convex bank with progressively decreasing flow velocity, forming trough cross-bedded point bar medium-fine sandstone facies. In the upper point bar (EF), shallow water depths and low flow velocities allow deposition of fine-grained saltation components (fine silt), generating ripple bedforms and developing wavy cross-bedded point bar fine-silty sandstone facies. At the point bar top (FG), extremely shallow water and minimal flow velocity result in deposition of the finest saltation components (argillaceous silt), forming ripple or flat beddings that develop into wavy or horizontally bedded point bar argillaceous siltstone facies. This lateral lithofacies model reflects general depositional patterns, and lateral lithofacies variations consequently influence reservoir property distributions.
A single flood event comprises multiple phases, each exhibiting lateral fining trends toward the convex bank. However, distinct hydrodynamic conditions in each phase produce lithofacies with unique grain sizes and bedding structures at the same location. Vertical stacking of these phase-specific lateral deposits forms the vertical lithofacies depositional model.
Overall, the vertical lithofacies succession displays a coarsening-upward trend [33,34]. Under gradually weakening hydrodynamic conditions, grain size transitions upward from point bar medium sandstone → fine sandstone → siltstone → argillaceous deposits. Rapid energy decline causes abrupt vertical transitions from argillaceous deposits to point bar medium/fine sandstone facies, omitting intermediate siltstone facies. Different point bar segments exhibit distinct lithofacies associations. The lower-middle sections show gradual transitions from point bar medium sandstone facies to siltstone facies or thick-bedded homogeneous point bar medium/fine sandstone facies, while the upper sections display progressive transitions from point bar siltstone facies to argillaceous deposits.

5. Discussion

5.1. Development of a Conceptual Model for Numerical Simulation

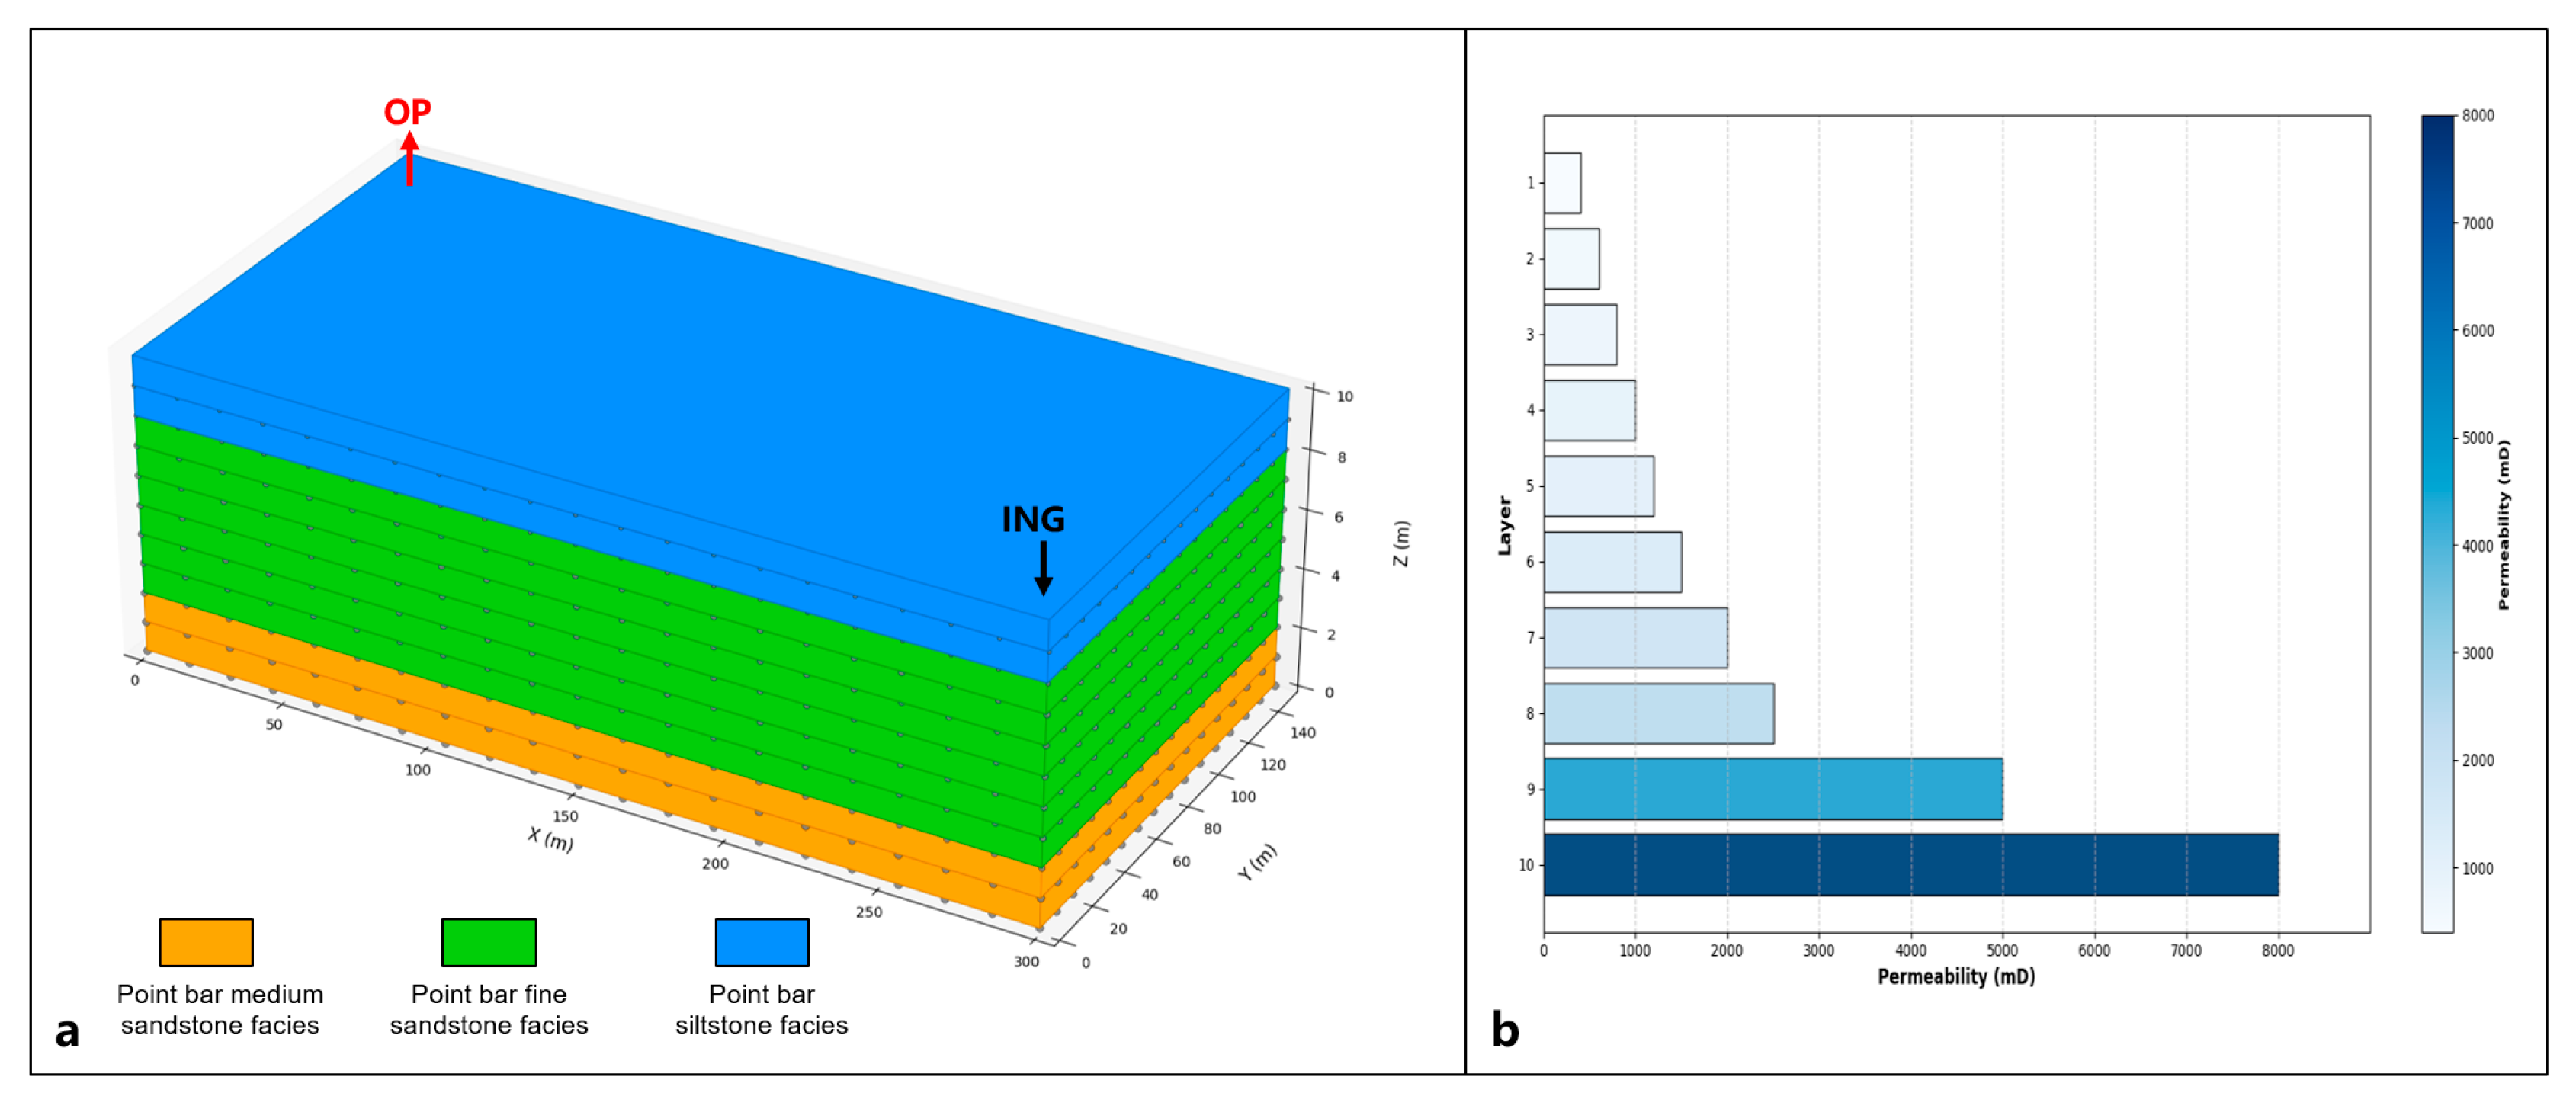
Given the inherent uncertainties in full-field reservoir models that may obscure SP flooding mechanisms, this study establishes a three-dimensional mechanistic model based on the study area’s reservoir characteristics and production dynamics to decipher the coupling mechanism of “lithofacies-controlled percolation and chemical synergy” governing incremental oil recovery distribution during SP flooding. As illustrated in Figure 11, the model employs a staggered well pattern with one injector and one producer, scaled to reservoir dimensions (300 m × 150 m × 10 m). Discretized into 5 m × 5 m areal grids and 10 upward-fining layers, it replicates the vertical facies sequence. Layer permeabilities were calculated using the measured permeability variation coefficient (0.5) of point bar sand bodies, with key parameters detailed in Table 2, Table 3 and Table 4. Injection/production rates mirror field operations, progressing through waterflooding until water cut > 90%, SP flooding (2000 mg/L polymer + 0.45 wt% surfactant, 0.5 PV injected), and post-flush waterflooding to 98% water cut.

5.2. Lithofacies-Controlled Flow Dynamics and Synergistic Mechanisms of Surfactant–Polymer Flooding

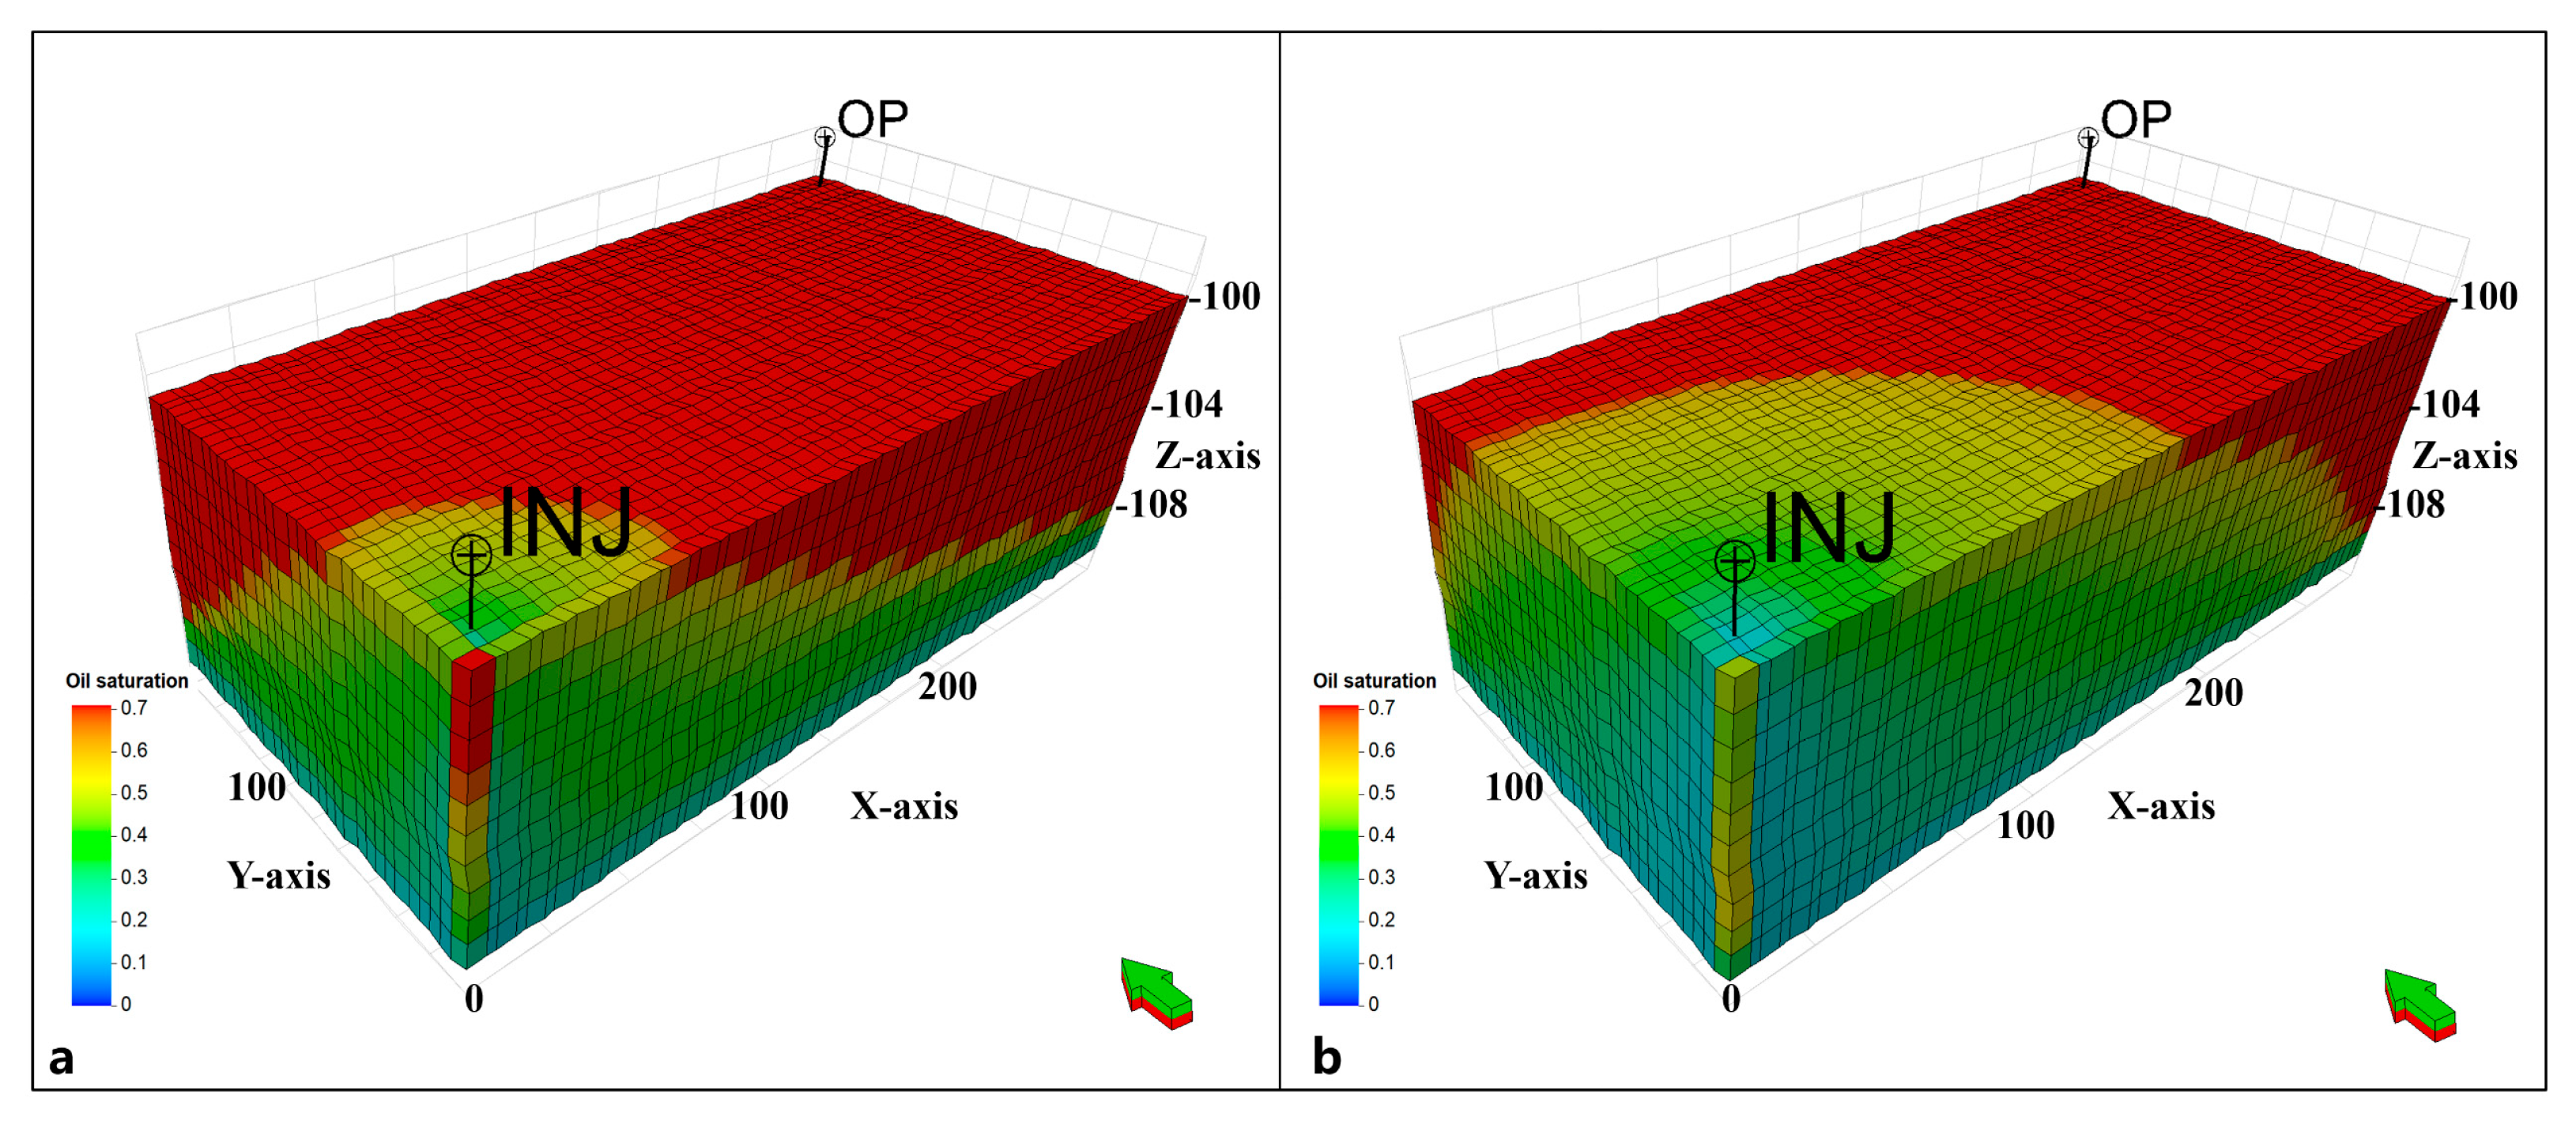
Figure 12 presents the distribution characteristics of residual oil after water flooding and SP flooding. The significantly higher permeability of the point bar medium sandstone facies compared to other lithofacies dominates fluid flow during water flooding. Injected water preferentially channels through these high-permeability zones, creating dominant flow pathways. This results in uneven displacement front advancement within the point bar fine sandstone facies and severely limited sweep efficiency in the low-permeability siltstone facies, ultimately leading to substantial residual oil accumulation.
Surfactant–polymer flooding overcomes the lithofacies-controlled percolation constraints through synergistic interactions between polymer and surfactant, enabling efficient mobilization of remaining oil [35,36]. The chemical synergy mechanism hinges on the dynamic coupling of sweep expansion and displacement efficiency enhancement: polymers increase displacing fluid viscosity to reduce mobility ratios, redirecting flow from high-permeability point bar medium sandstone facies to fine sandstone and low-permeability siltstone facies, improving sweep coverage by 25–30% in point bar fine sandstone facies and 35–45% in point bar siltstone facies (Figure 11). Simultaneously, surfactants reduce oil–water interfacial tension to strip residual oil from high-permeability point bar medium sandstone facies, enhancing oil washing efficiency.
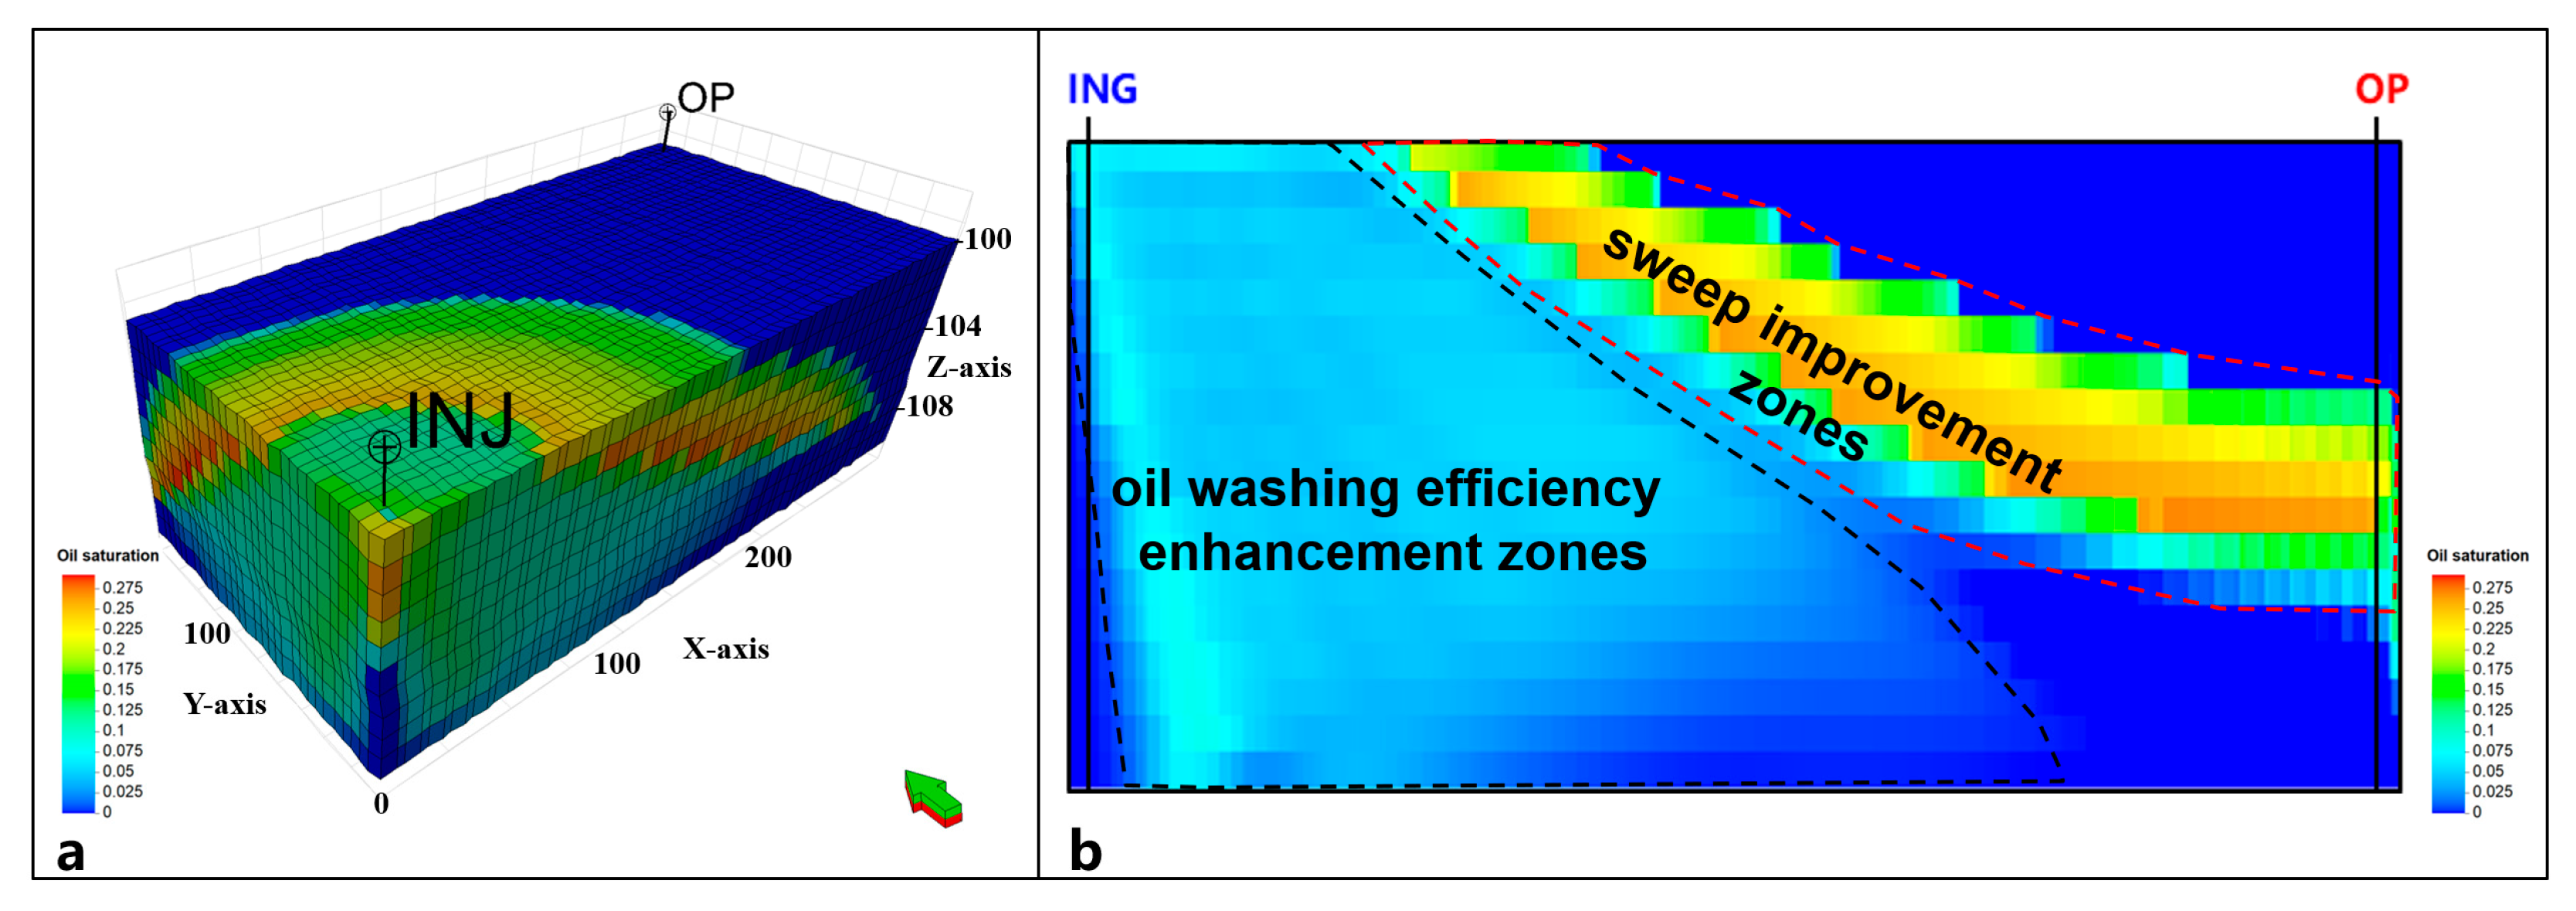
To further analyze the mechanisms of incremental oil recovery in surfactant–polymer flooding compared to waterflooding, we calculated the difference in remaining oil saturation between the two processes at equivalent injected pore volumes for each grid cell, generating a saturation difference field that represents the spatial distribution of incremental oil recovery mobilized by SP flooding, as shown in Figure 13. Simulation results reveal that reservoir lithofacies exhibit zone-specific responses. Low-permeability lithofacies dominate the sweep improvement zones, while high-permeability lithofacies near injectors govern the oil washing efficiency enhancement zones, reflecting the dual control of lithofacies heterogeneity and chemical agent interactions.
During the waterflooding stage, residual oil accumulates in low-permeability zones of the point bar siltstone facies and the less permeable portions of the point bar fine sandstone facies due to inefficient sweep coverage. In SP flooding, polymers within the binary system increase fluid viscosity, improve mobility ratios, and redirect flow toward these low-permeability layers, significantly expanding sweep volume and enhancing sweep efficiency to form spindle-shaped sweep improvement zones.
Meanwhile, the point bar medium sandstone facies and the higher-permeability sections of the fine sandstone facies readily develop preferential flow channels during waterflooding, causing rapid water breakthrough and lower residual oil saturation. During SP flooding, surfactants near injectors and within high-permeability lithofacies reduce oil-water interfacial tension to further strip residual oil from pore walls, creating dam-shaped zones dominated by displacement efficiency enhancement, primarily distributed along high-permeability lithofacies near injection wells.
Figure 14 compares the incremental oil recovery distribution during polymer flooding, surfactant flooding, and surfactant–polymer (SP) flooding under identical injection conditions. In contrast to SP flooding, polymer flooding solely enhances sweep improvement zones while surfactant flooding exclusively targets oil washing efficiency enhancement zones. This underscores the critical role of synergistic effects between polymer and surfactant in mobilizing residual oil.
Figure 15 illustrates the impact of surfactant and polymer concentrations on the distribution of incremental oil recovery. In Figure 15a, surfactant concentration incrementally increases from 0.00% to 0.70% (0.5 PV injected), while polymer concentration remains constant at 2000 mg/L. Results demonstrate progressive expansion of oil washing efficiency enhancement zones with rising surfactant concentration, whereas sweep improvement zones exhibit negligible variation. Conversely, Figure 15b shows polymer concentration escalating from 0 to 2500 mg/L (0.5 PV injected) at a fixed surfactant concentration of 0.45 wt%. Here, sweep improvement zones expand progressively until stabilizing at a 2000 mg/L polymer concentration, while oil washing efficiency enhancement zones remain relatively constant throughout the flooding process.

6. Conclusions

(1)
The upward-fining vertical lithofacies assemblages of meandering river point bar sand bodies lead to the development of preferential flow channels in high-permeability point bar medium sandstone facies, where waterflooding achieves high sweep efficiency with minimal remaining oil. Conversely, low-permeability portions of the point bar fine sandstone facies and the siltstone facies, constrained by percolation barrier effects, become primary remaining oil enrichment zones and key targets for incremental oil recovery during SP flooding.
(2)
The framework is governed by petrophysical heterogeneities: flow baffles (point bar siltstone facies) and preferential pathways (point bar medium sandstone facies) form the hydraulic foundation for chemical agent deployment. Polymers force fluid diversion into low-permeability lithofacies through viscoelastic effects, while surfactants preferentially strip residual oil from high-permeability lithofacies. Their synergistic interaction generates the characteristic spatial differentiation pattern of affected remaining oil.
(3)
The spatial distribution of incremental oil recovery exhibits marked heterogeneity: low-permeability lithofacies-dominated “spindle-shaped” sweep improvement zones concentrate in the siltstone facies and low-permeability sections of the fine sandstone facies, whereas high-permeability lithofacies-governed “dam-shaped” displacement efficiency enhancement zones distribute within high-permeability point bar medium sandstone facies near injection wells.

Author Contributions

Conceptualization and methodology, X.L.; investigation, C.G.; data curation, Q.C. and M.Z.; writing—original draft preparation, X.L. and C.G.; writing—review and editing, Y.L. and X.L. All authors have read and agreed to the published version of the manuscript.

Funding

This research was funded by National Natural Science Foundation of China (No. 42172154; No. 42472205).

Data Availability Statement

For confidentiality reasons, some of the data in the article cannot be publicly displayed. If you have data-related questions, you are welcome to contact me by email.

Conflicts of Interest

Authors Xilei Liu, Changchun Guo were employed by the Exploration and Development Research Institute, Shengli Oilfield Company, SINOPEC. The remaining authors declare that the research was conducted in the absence of any commercial or financial relationships that could be construed as a potential conflict of interest.

References

  1. Zhang, S.; Lv, Q.; Wang, J.; Liu, L.; Yu, C.; Ji, Y.; Wu, Y.; Hu, H.; Tao, D.; Zhang, M. Research and practice on deep development technology through flow field regulation in reservoirs with medium-high permeability and high water cut in Shengli Oilfield. Pet. Geol. Recover. Eff. 2025, 32, 88–101. [Google Scholar]
  2. Lv, J.; Sun, Y.; Liu, L.; Tao, D.; Liu, H.; Chen, D.; Li, X. Research of the distribution rule of high water consumption zone in positive rhythm water-drive reservoir. In Proceedings of the 2021 International Field Exploration and Development Conference, Qingdao, China, 16–18 September 2021; pp. 980–988. [Google Scholar]
  3. Cui, C.; Han, X.; Bing, S.; Huang, Y.; Li, W.; Liu, L.; Wu, Z. Characterization indexes and grading method of water-consumption zones in waterflooding oil reservoirs during high water cut period. Pet. Geol. Recover. Eff. 2022, 29, 85–91. [Google Scholar]
  4. Yue, D.; Wu, S.; Cheng, H.; Yu, Y. Numerical reservoir simulation and remaining oil distribution patterns based on 3D reservoir architecture model. J. China Univ. Pet. Ed. Nat. Sci. 2008, 32, 21–27. [Google Scholar]
  5. Yin, S.; Chen, G.; Dai, C.; Wu, S.; Lu, F.; Feng, W. Reservoir architecture and remaining oil distribution in mouth bar-A case study on the braided delta of long-axis gentle slope in Zaonan fault block of Dagang Oilfield. Oil Gas Geol. 2015, 36, 630–639. [Google Scholar]
  6. Li, Y.; Wu, S.; Hou, J.; Liu, J. Progress and prospects of reservoir development geology. Pet. Explor. Dev. 2017, 44, 569–579. [Google Scholar] [CrossRef]
  7. Guo, J.; Liu, Y. Model of sequence stratum of Neogene of Jiyang depression. J. China Univ. Pet. Ed. Nat. Sci. 2008, 32, 18. [Google Scholar]
  8. Yao, X.; Gai, L.; Cui, C.; Wu, Z.; Wang, C.; Ma, J. Variation Laws of Reservoir Physical Properties and Remaining Oil Distributions after Various Displacement Methods: Taking 11-Jian 11 Well Area of Ng3 Unit of Zhong 1 Block of GD Oilfield as an Example. Sci. Technol. Eng. 2023, 23, 1488–1493. [Google Scholar]
  9. Li, Q.; Li, Q.; Wang, F.; Xu, N.; Wang, Y.; Bai, B. Settling behavior and mechanism analysis of kaolinite as a fracture proppant of hydrocarbon reservoirs in CO2 fracturing fluid. Colloids Surf. A Physicochem. Eng. Asp. 2025, 724, 137463. [Google Scholar] [CrossRef]
  10. Qingchao, L.; Jingjuan, W.; Qiang, L.; Fuling, W.; Yuanfang, C. Sediment Instability Caused by Gas Production from Hydrate-Bearing Sediment in Northern South China Sea by Horizontal Wellbore: Sensitivity Analysis. Nat. Resour. Res. 2025, 34, 1667–1699. [Google Scholar] [CrossRef]
  11. Hernandez, C.; Chacon, L.J.; Anselmi, L. ASP system design for an offshore application in La Salina Field, Lake Maracaibo. SPE Reserv. Eval. Eng. 2003, 6, 147–156. [Google Scholar] [CrossRef]
  12. Carrero, E.; Queipo, N.V.; Pintos, S.; Zerpa, L.E. Global sensitivity analysis of alkali–surfactant–polymer enhanced oil recovery processes. J. Pet. Sci. Eng 2007, 58, 30–42. [Google Scholar] [CrossRef]
  13. Wang, H.; Zhang, B.; Zhang, J.; Tu, W.; Zhang, L.; Zhang, W. Study on Scale Inhibitors for ASP Combinational Flooding Solution Developed in Shengli Oil Fields. Oilfield Chem. 2005, 22, 252–254. [Google Scholar]
  14. Zhang, L.; Xiao, H.; Zhang, H.; Xu, L.; Zhang, D. Optimal design of a novel oilwater separator for raw oil produced from ASP flooding. J. Pet. Sci. Eng. 2007, 59, 213–218. [Google Scholar] [CrossRef]
  15. Wang, H.; Cao, X.; Zhang, J.; Zhang, A. Development and application of dilute surfactant–polymer flooding system for Shengli oilfield. J. Pet. Sci. Eng. 2009, 65, 45–50. [Google Scholar] [CrossRef]
  16. Salager, J.L.; Mongan, J.C. Optimum formulation of surfactant/water/oil system for minimum interfacial tension or phase behavior. Soc. Pet. Eng. J. 1979, 19, 107–115. [Google Scholar] [CrossRef]
  17. Liu, P.; Zhang, L.; Huang, Z.; Song, G. Sequence stratigraphic framework and favorable zone prediction in Guantao Formation of Raoyang sag, Bohai Bay Basin. J. China Univ. Pet. Ed. Nat. Sci. 2014, 38, 17–24. [Google Scholar]
  18. Xiong, J. The Sedimentary Characteristics of Guan 1 + 2 Sand Member in the Fault Block of B82-B19 of Gudao Oilfiled. Master’s Thesis, China University of Petroleum (EastChina), Qingdao, China, 2011. [Google Scholar]
  19. Lin, H.; Fang, X.; Li, L.; Lin, Y.; Liu, H.; Li, W.; Wu, Z. Development of buried hills of the eastern Zhanhua subbasin, Jiyang depression, northern Shandong, China and controlling factors of the formation of petroleum accumulations. Geol. Bull. China 2006, 25, 1160–1167. [Google Scholar]
  20. Li, Y.; Wang, W.; Wang, G.; Xie, Y.; Li, H. Neotectonic characteristics and hydrocarbon accumulation controls in the Huanghua Depression, Bohai Bay Basin. J. Northeast Pet. Univ. 2019, 43, 94–104+10–11. [Google Scholar]
  21. Shu, Q. Interlayer characterization of fluvial reservoir in Guantao Formation of Gudao Oilfield. Acta Pet. Sin. 2006, 27, 100–103. [Google Scholar]
  22. Cheng, P. Researching on the Distribution of Reservoir Sand Body of the 3–4 Section of the 72 Block of Gudao Oilfield. Master’s Thesis, China University of Petroleum, Beijing, China, 2017. [Google Scholar]
  23. Yue, D.; Wu, S.; Tan, H.; Yu, D.; Jiang, X.; Liu, S. An anatomy of paleochannel reservoir architecture of meandering river reservoir-a case study of Guantao formation, the west 7th block of Gudong oilfield. Earth Sci. Front. 2008, 15, 101–109. [Google Scholar]
  24. Liu, R. Study on the Sand Body Architecture of Complex Meandering Belt and Its Control Action on the Remaining Oil Distribution-A Case Study of Neogene GuantaoNg3 Formation in Zhongyi area, Gudao Oilfield. Ph.D. Thesis, Northeast Petroleum University, Daqing, China, 2022. [Google Scholar]
  25. Lu, X. Principles of Sedimentary Petrology; Geological Publishing House: Beijing, China, 1955; pp. 1–174. [Google Scholar]
  26. Editorial Committee of Encyclopedia of Geosciences. Encyclopedia of Geosciences: Basic Disciplines; Geological Publishing House: Beijing, China, 2006; pp. 1–1173. [Google Scholar]
  27. Feng, Z. A review on the definitions of terms of sedimentary facies. J. Palaeogeogr. 2020, 22, 207–220. [Google Scholar] [CrossRef]
  28. Feng, Z. Some new thoughts on definitions of terms of sedimentary facies: Based on Miall’s paper (1985). J. Palaeogeogr. 2022, 24, 183–190. [Google Scholar] [CrossRef]
  29. Miall, A.D. A review of the braided-river depositional environment. Earth-Sci. Rev. 1977, 13, 1–62. [Google Scholar] [CrossRef]
  30. Best, J.; Bridge, J. The morphology and dynamics of low amplitude bed waves upon upper stage plane beds and the preservation of planar laminae. Sedimentology 1992, 39, 737–752. [Google Scholar] [CrossRef]
  31. Bridge, J.S.; Best, J.I. Preservation of planar laminae due to migration of low-relief bed waves over aggrading upper-stage plane beds: Comparison of experimental data with theory. Sedimentology 1997, 44, 253–262. [Google Scholar] [CrossRef]
  32. Ma, S.; Yang, Q. Depositional model, 3D architecture, and heterogeneity of meandering point bar reservoirs. Acta Sedimentol. Sin. 2000, 2, 241–247. [Google Scholar]
  33. Allen, J.R.L. Studies in fluviatile sedimentation: A comparison of fining-upwards cyclothems, with special reference to coarsemember composition and interpretation. J. Sediment. Petrol. 1970, 40, 298–323. [Google Scholar]
  34. Walker, R.G. Facies Models, 2nd ed.; Geoscience Canda: Ottawa, ON, Canda, 1984; pp. 71–91. [Google Scholar]
  35. Hou, J.; Du, Q.; Shu, Q.; Zhang, B.; Gao, D. Macroscopic response mechanism and distribution rules of remaining oil in polymer flooding. Acta Pet. Sin. 2010, 31, 96–99. [Google Scholar]
  36. Hou, J.; Pan, G.; Lu, X.; Wei, C.; Qiu, M. The distribution characteristics of additional extracted oil displaced by surfactant–polymer flooding and its genetic mechanisms. J. Pet. Sci. Eng. 2013, 112, 322–334. [Google Scholar] [CrossRef]
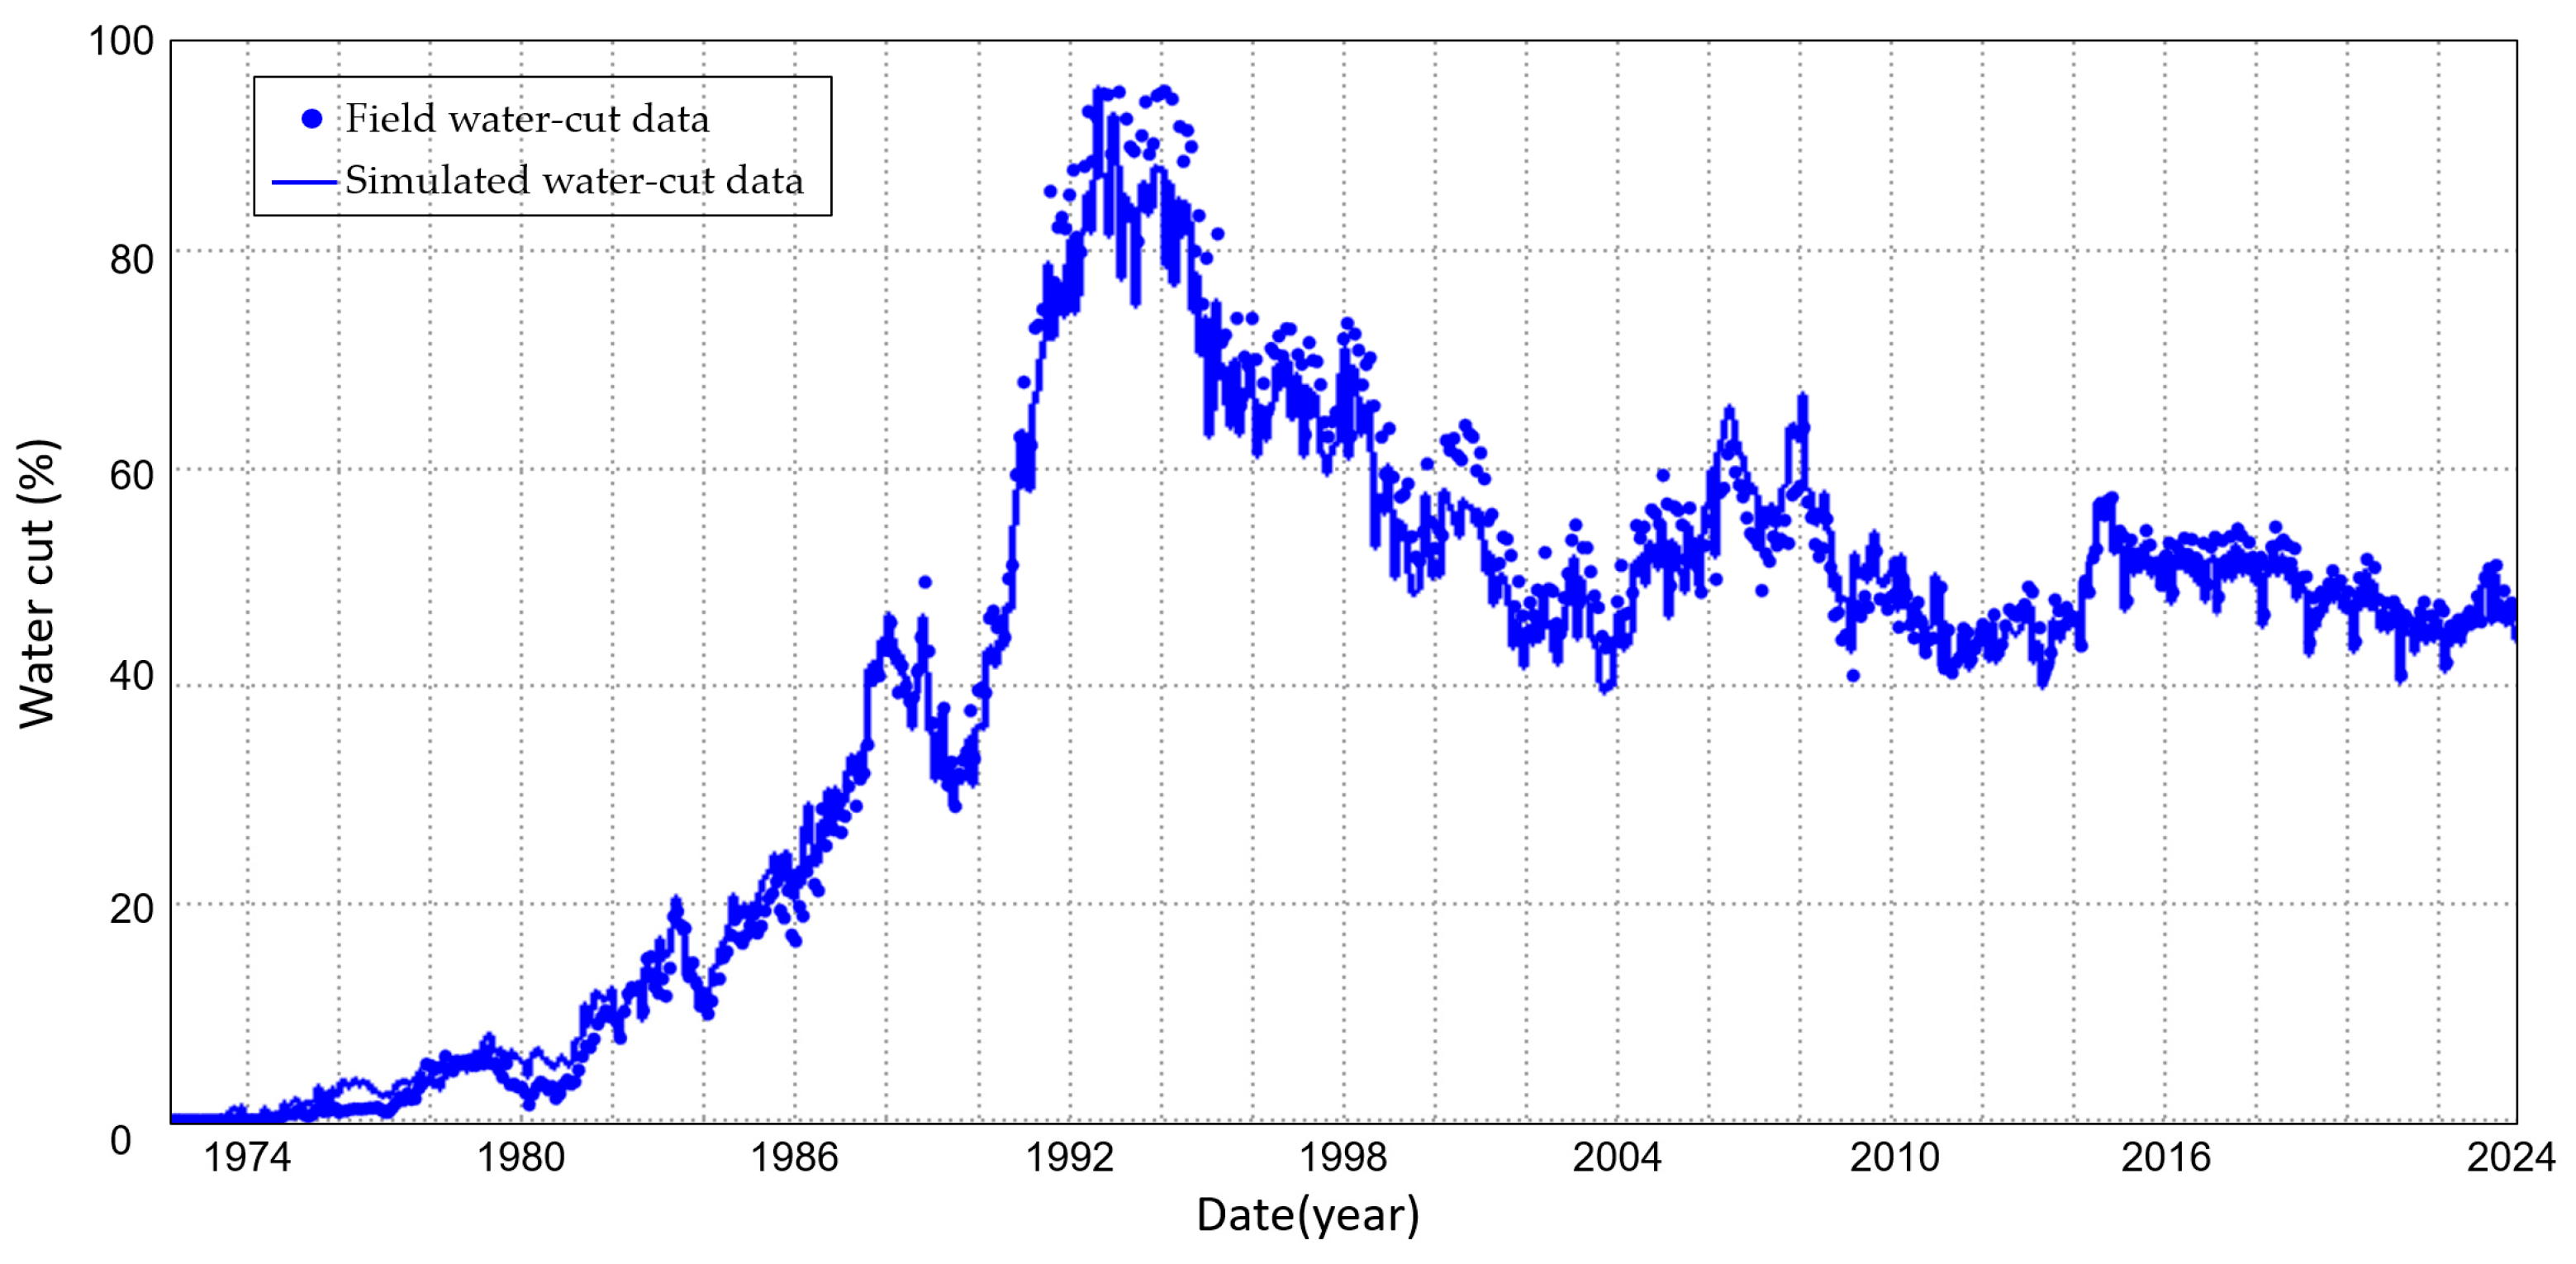
Figure 1. History matching results of liquid production rate in Bo 72 Block.
Energies 18 04703 g001
Figure 2. Relative permeability curve: (a) point bar medium sandstone facies; (b) point bar fine sandstone facies; (c) point bar siltstone sandstone facies.
Energies 18 04703 g002
Figure 3. (a) Structural location map of the Zhanhua Sag; (b) Composite stratigraphic characteristics of the Zhanhua Sag.
Energies 18 04703 g003
Figure 4. Macroscopic characteristics of the point bar medium sandstone facies: (a) logging curve characteristics, physical properties, and grain size features; (b) core photographs.
Energies 18 04703 g004
Figure 5. Microscopic characteristics of the point bar medium sandstone facies: (a) grain size probability curves; (b) scanning electron microscopy characteristics; (c) capillary pressure curve characteristics; (d) pore-throat characteristics.
Energies 18 04703 g005
Figure 6. Macroscopic characteristics of the point bar fine sandstone facies: (a) logging curve characteristics, physical properties, and grain size features; (b) core photographs.
Energies 18 04703 g006
Figure 7. Microscopic characteristics of the point bar fine sandstone facies: (a) grain size probability curves; (b) scanning electron microscopy characteristics; (c) capillary pressure curve characteristics; (d) pore-throat characteristics.
Energies 18 04703 g007
Figure 8. Macroscopic characteristics of the point bar siltstone facies: (a) logging curve characteristics, physical properties, and grain size features; (b) core photographs. The median grain size ranges from 0.04 mm to 0.08 mm (average 0.06 mm).
Energies 18 04703 g008
Figure 9. Microscopic characteristics of the point bar siltstone facies: (a) grain size probability curves; (b) scanning electron microscopy characteristics; (c) capillary pressure curve characteristics; (d) pore-throat characteristics.
Energies 18 04703 g009
Figure 10. (a) Lateral lithofacies depositional model; (b) vertical lithofacies depositional model (modified from Ma Shizhong [32]).
Energies 18 04703 g010
Figure 11. (a) Conceptual model of reservoir numerical simulation; (b) permeability distribution of each lithofacies in the conceptual model.
Energies 18 04703 g011
Figure 12. Characteristics of residual oil: (a) water flooding; (b) SP flooding.
Energies 18 04703 g012
Figure 13. Spatial distribution characteristics of incremental oil recovery during surfactant–polymer flooding: (a) 3D map of incremental oil recovery distribution; (b) interwell cross-sectional profile.
Energies 18 04703 g013
Figure 14. Spatial distribution characteristics of incremental oil recovery: (a) surfactant flooding; (b) polymer flooding; (c) SP flooding.
Energies 18 04703 g014
Figure 15. Impact of chemical agent concentration on spatial distribution of incremental oil recovery: (a) surfactant concentration; (b) polymer concentration.
Energies 18 04703 g015
Table 1. Petrophysical property characterization of major lithofacies.
LithofaciesPorosity Range
(Average)
%
Permeability Range
(Average)
mD
Sample Size
Point bar medium sandstone facies34.0–40.0 (37.2)2500–20,000 (8500)38
Point bar fine sandstone facies28.0–37.0 (34.2)800–2500 (1760)69
Point bar siltstone facies22.0–30.0 (27.8)100–600 (500)49
Table 2. Study area reservoir parameters.
ParametersValueUnit
Porosity24.3–38.6%
Permeability100–20,000mD
Oil Viscosity45Cp
Reservoir Temperature68°C
Initial Oil Saturation65%
Formation Water Salinity4870Mg/L
Table 3. Polymer behavior: concentration-dependent viscosity and adsorption.
Concentration (mg/L)Viscosity (mPa.s)Concentration (mg/L)Adsorption Capacity (kg/m3)Shear Rate (1/S)Viscosity (mPa.s)
100019.500.0000.137169
150040.05000.1560.298159
200071.610000.3600.557145
2500115.615000.3901.04113
3000176.320000.4042.2780.5
25000.4105.055.9
Table 4. Surfactant properties: interfacial tension reduction versus concentration and adsorption.
Concentration
(%)
Interfacial Tension
(dyne/cm)
Concentration
(%)
Adsorption Capacity (kg/m3)
0.0010.00000.000.000
0.150.01040.051.894
0.300.00240.103.883
0.400.00230.154.950
0.500.00300.205.901
0.600.00660.255.987
0.700.00860.306.814
0.406.754
0.507.106
0.808.475
1.008.730
Table 5. Comparative analysis of key lithofacies characteristics in point bar sand bodies.
CharacteristicsPoint Bar Medium Sandstone FaciesPoint Bar Fine Sandstone FaciesPoint Bar Siltstone Facies
Vertical PositionBaseMiddleTop
Avg. Porosity (%)37.2 (Ultra-High)34.2 (High)27.8 (Moderate)
Avg. Permeability (mD)8500 (Ultra-High)1350 (Moderate-High)500 (Moderate-Low)
Avg. Pore-Throat Radius (μm)21.8 (Maximum)10.3 (Intermediate)7.9 (Minimum)
Pore-Throat ConnectivityOptimalIntermediatePoor
Median Grain Size (mm)0.38 (Coarsest)0.18 (Intermediate)0.06 (Finest)
Grain Size Probability CurveMinimal Suspension PopulationModerate Suspension PopulationDominant Suspension Population
Hydraulic EnergyStrongestIntermediateWeakest
Waterflood Flow BehaviorPreferential Flow PathwaysHeterogeneous Front AdvancementFlow Baffles/Residual Oil Enrichment
SP Flooding MechanismSurfactant Oil Stripping Sweep Improvement + Oil StrippingSweep Enhancement
Disclaimer/Publisher’s Note: The statements, opinions and data contained in all publications are solely those of the individual author(s) and contributor(s) and not of MDPI and/or the editor(s). MDPI and/or the editor(s) disclaim responsibility for any injury to people or property resulting from any ideas, methods, instructions or products referred to in the content.