1. Introduction
Modern aviation engineering faces increasing challenges in optimizing combustion processes and reducing harmful emissions from aircraft engines. One of the most promising research directions is the development and implementation of alternative aviation fuels that can lower the environmental footprint while maintaining or improving propulsion efficiency. Hydrogen is of particular interest due to its high energy content per unit mass and the absence of carbon in its molecular structure, which eliminates direct carbon dioxide emissions during combustion. When co-combusted with conventional fuels such as aviation kerosene, hydrogen can contribute to a reduction in nitrogen oxides (NOx) emissions, improve combustion stability, and potentially enhance overall engine performance.
Despite these advantages, the use of hydrogen in aviation presents significant technical challenges. These include its influence on combustion temperature, flame characteristics, and the resulting thermal and mechanical loads on engine components. Understanding these effects is crucial for ensuring operational safety, material durability, and optimal engine efficiency. Miniature turbojet engines provide an effective and cost-efficient platform for experimental and numerical studies on hydrogen and kerosene co-combustion, enabling detailed analysis of flow, heat transfer, and structural behaviour under controlled conditions.
Intensive research is being conducted on fuels with reduced greenhouse gas emissions that maintain or improve the energy efficiency of aircraft engines [
1,
2,
3]. In particular, studies focus on the co-combustion of fossil fuels such as aviation kerosene (e.g., JET A-1) with hydrogen, aiming to reduce CO
2 and NO
x emissions while preserving engine performance and reliability [
4,
5]. Miniature turbojet engines, such as the GTM 400 MOD, are widely used for analyzing thermomechanical processes during combustion due to their compact size and simplified design. For example, Yan et al. [
6] developed a multispectral radiation thermometry method for measuring turbine blade temperatures without assuming emissivity, achieving deviations of less than 50 K compared with conventional thermocouples. Li et al. [
7] improved turbojet performance using a supersonic preconditioner with microchannels, increasing the Mach number to 3.35 and thrust by 39.8%. Sogut [
8] analysed hybrid propulsion systems for UAVs, reporting an average energy efficiency of 38 % and identifying significant potential for optimization.
Experimental platforms allow precise assessment of how different fuel mixtures affect engine operation, particularly regarding combustion stability and component durability. Beltrán et al. [
9] showed that advanced micromixing techniques can reduce NO
x emissions during hydrogen combustion, while highlighting gaps in material selection and burner geometry design that remain barriers to industrial adoption. The exhaust nozzle plays a critical role in exhaust gas expansion and thrust generation [
10], and must withstand high thermal and mechanical stresses, especially when operating with fuels that alter flame temperature and flow characteristics [
11]. Strategies such as nozzle profiling, high-temperature coatings, and active cooling [
12,
13] can improve durability.
Numerical methods, including computational fluid dynamics (CFD) and finite element analysis (FEA), have become essential tools for these studies. CFD enables accurate modelling of exhaust flows and their influence on performance and emissions, while FEA predicts thermal stresses and potential structural damage. Recent work has combined CFD with optimization algorithms [
14] and rotor-motion modelling [
15] to improve prediction accuracy, while studies on air–fuel ratio effects [
16] have advanced understanding of combustion efficiency.
Research into green gaseous fuels, including hydrogen, has demonstrated performance benefits. Sekar [
17] reported that injecting a hydrogen–biogas mixture into a turbojet engine increased maximum thrust by 4.5 % and reduced fuel consumption by 2.2 %, with potential to mitigate NO
x emissions through optimized injection strategies. Aygun et al. [
18] used multi-objective optimization methods to evaluate small turbojet engine (STJE) performance under varying turbine inlet temperature, compressor pressure ratio, and ambient conditions, identifying trade-offs between thrust and specific fuel consumption. Wang et al. [
19] proposed a multi-stage precooling–compression cycle to enhance high-speed turbojet performance, while Cican et al. [
20] evaluated alcohol–kerosene blends in micro turbojets, finding reductions in CO
2 emissions but with efficiency trade-offs.
Other relevant studies include Lee et al. [
21], who developed an integrated simulation model for micro gas turbines with secondary flow and combustion efficiency effects, achieving performance prediction errors below 5 %. Xu [
22] examined particulate number emissions from micro-turbojets, identifying higher non-volatile PM compared with micro-piston engines, and Cican et al. [
23] explored exhaust nozzle chevron geometries for noise reduction and improved shear layer mixing.
However, the literature provides limited data on stresses generated in the nozzle during kerosene–hydrogen co-combustion. Most studies address combustion characteristics, emissions, or mixing processes without assessing structural impacts under realistic operating conditions. This study addresses that gap by experimentally measuring outlet nozzle temperature and dynamic pressure, and by performing coupled CFD–FEA simulations to evaluate temperature distribution, stress, and deformation for kerosene combustion and kerosene–hydrogen co-combustion at comparable thrust levels. The results provide new insight into the thermomechanical implications of hydrogen use in turbojet propulsion.
This paper involved both basic and extended numerical analysis. The basic analysis takes into account a smaller number of phenomena occurring during gas flow through the nozzle. Some of the coefficients related to steel properties were also simplified, i.e., not related to temperature. More detailed information is included in the Methods section.
2. Methods
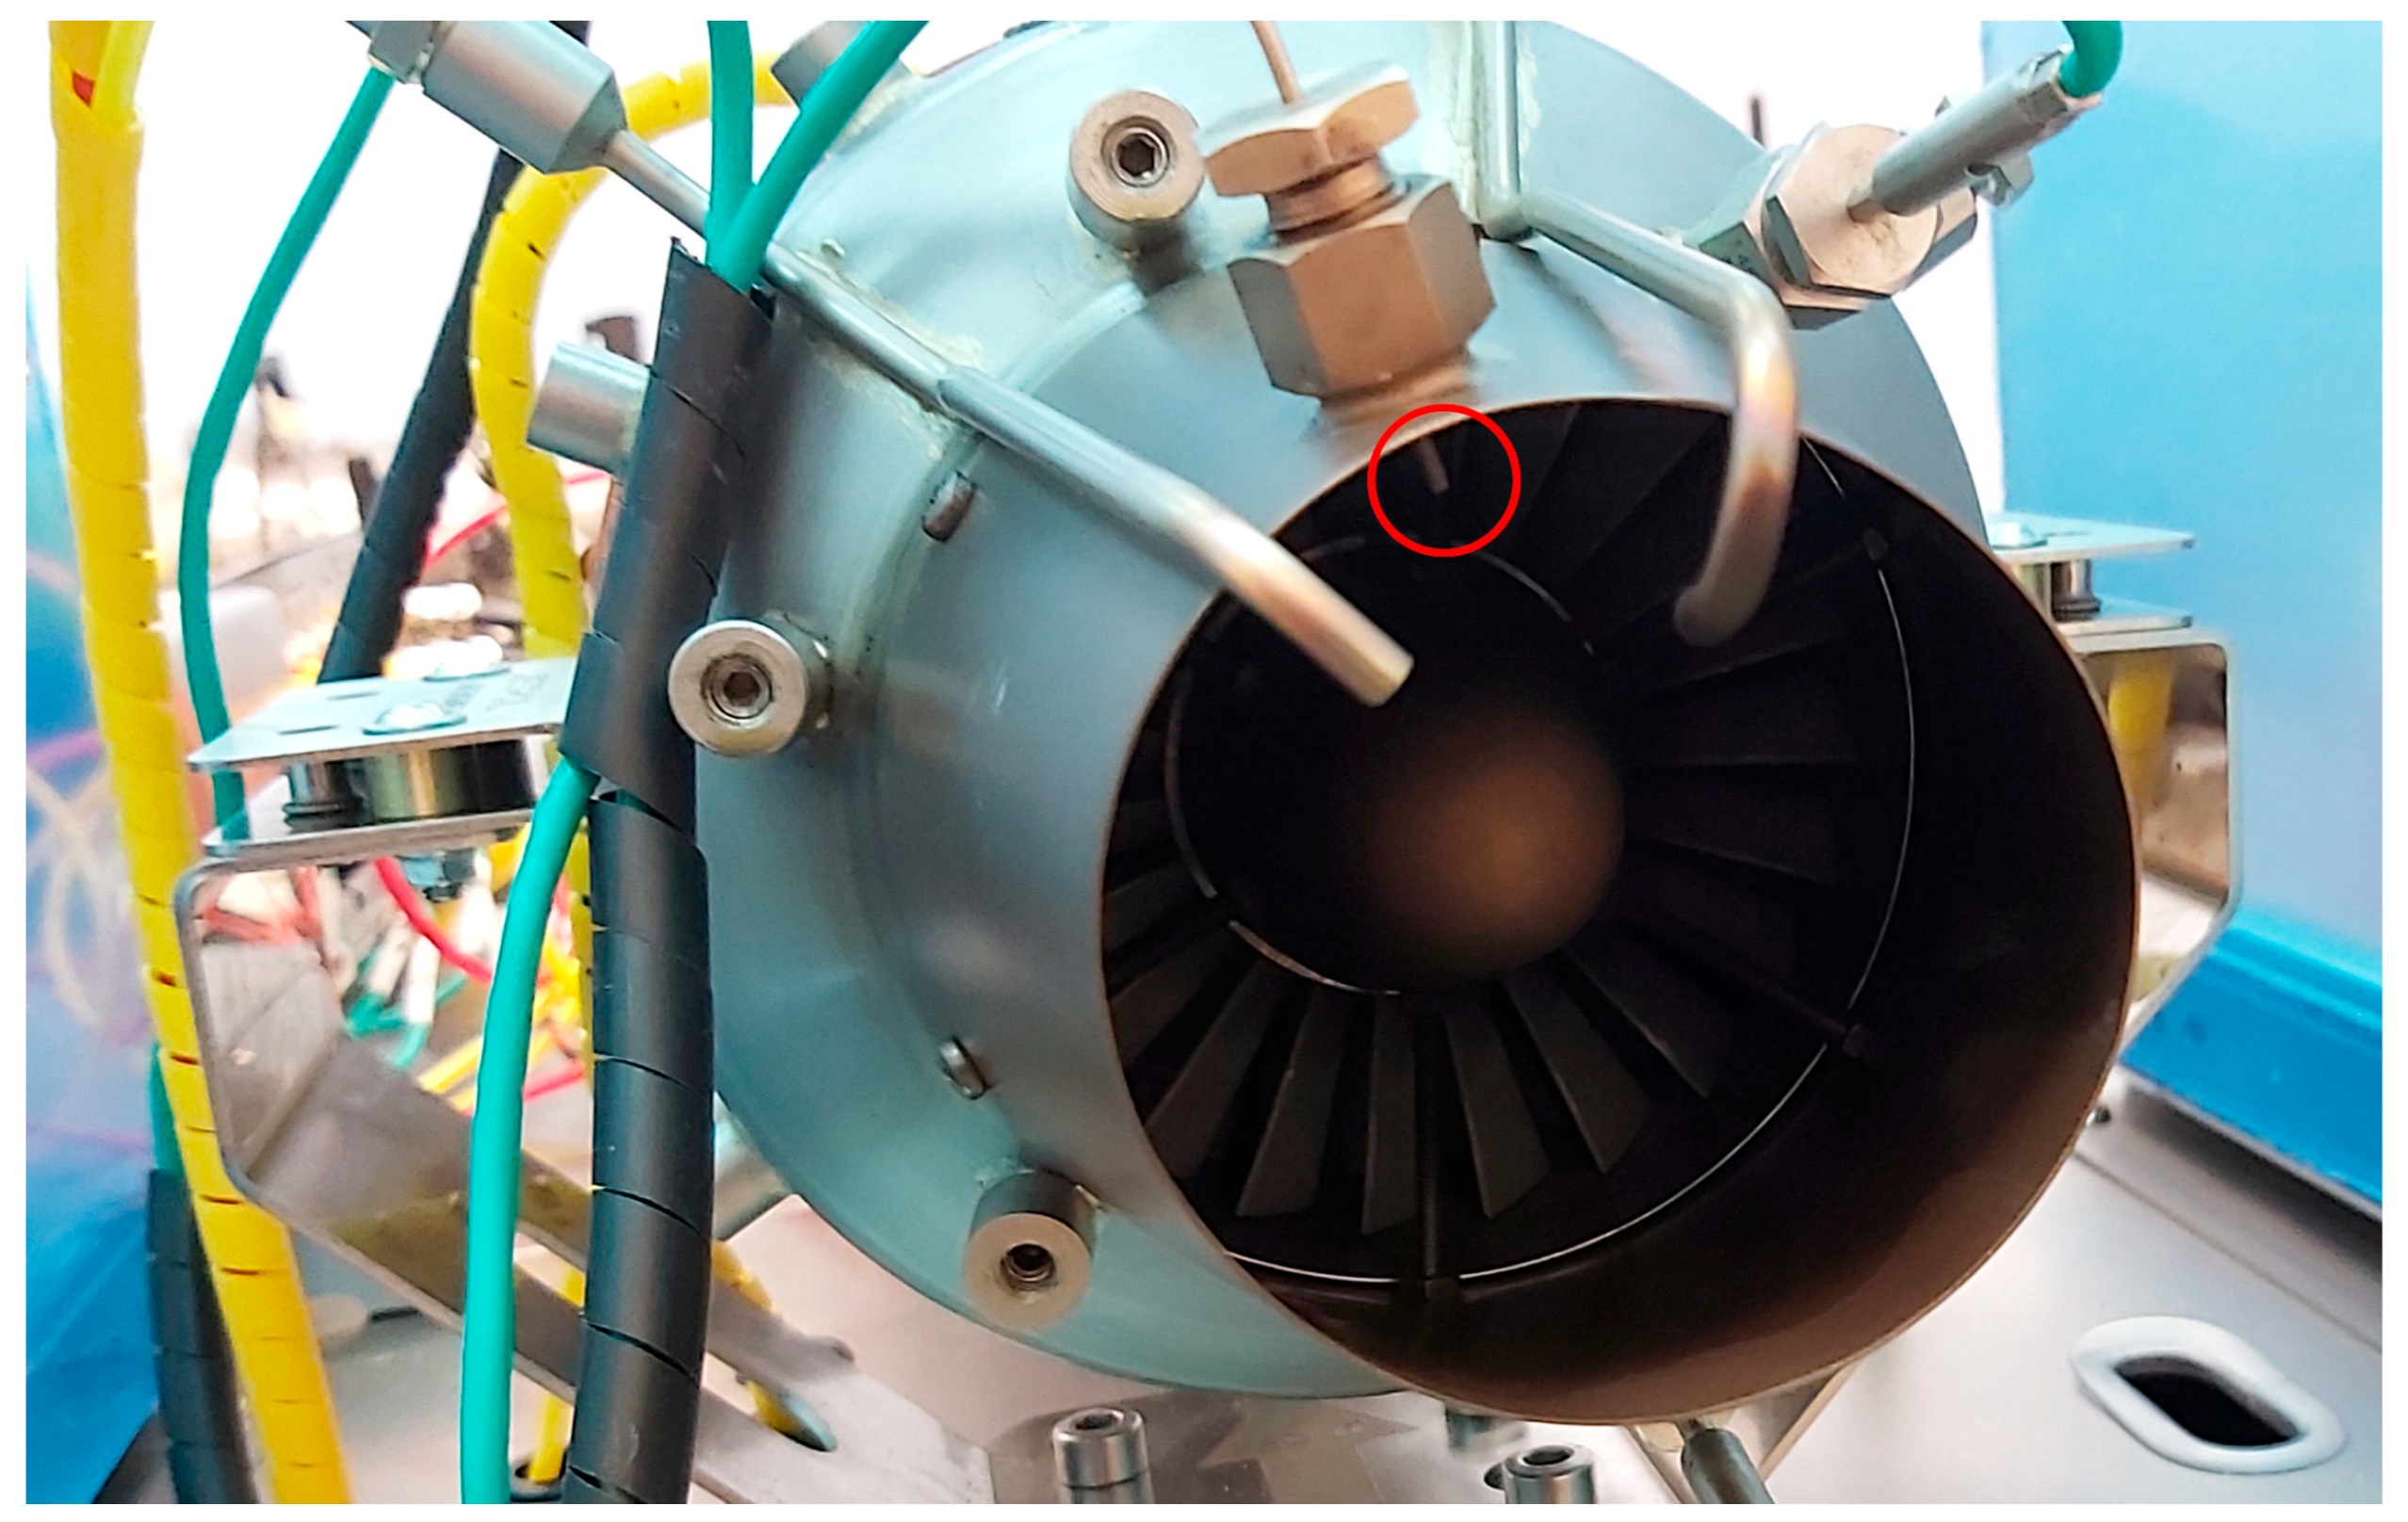
Numerical studies were performed on the exhaust nozzle geometry of the JETPOL (Poznan, Poland) GTM400 MOD turbojet engine, shown in
Figure 1. This is a miniature single-flow engine fuelled with JET A-1 kerosene and hydrogen. The analysis was performed for rotational speeds of 31,630 rpm, 47,110 rpm, 64,200 rpm, and 65,830 rpm. For the first two speeds, the simulation assumed the engine was fuelled with kerosene, and then with kerosene and hydrogen. For the last two speeds, the lower value corresponds to kerosene combustion, and the higher value corresponds to hydrogen combustion. A more detailed description of the engine and hydrogen system is included in [
24]. The experiment, along with kerosene and hydrogen consumption values for assumed engine speeds, is presented in [
5].
In the first stage of the analysis, the flow through the exhaust nozzle was simulated as shown in
Figure 2 and
Table 1. The ANSYS Fluent (ver. R1, 2025) computational environment was used for the calculations. The goal was to determine the thermal load distribution on the inner wall of the exhaust nozzle.
To simulate the flow inside the nozzle, it was necessary to solve the basic equations of fluid motion. The first equation is the continuity equation:
where
is the fluid density,
,
is time,
, and
are velocity vectors in the Cartesian coordinate system,
. In pointer notation, the expression
means
.
The second equation is the conservation of momentum equation:
where
is the stress tensor
is the external force,
. The constitutive relations between the stress tensor and the strain rate for a Newtonian fluid are given by
where
is the pressure,
,
is the dynamic viscosity coefficient,
, consistent with Satherland’s law,
is the Kronecker symbol.
The third equation is the energy conservation equation:
where
is the internal energy,
,
is the thermal conductivity coefficient for air,
, and
is the heat flux determined from Fourier’s law
,
,
is the temperature,
.
Equations (1)–(4) were solved numerically using the finite volume method.
The above equations are valid for laminar flows. For real flow, the presence of vortex flows must be taken into account. Their behaviour is reflected in various turbulence models. The SST k–ω model was used for the described analysis due to its advantages in calculating parameters related to both free flows and boundary layers [
25,
26]. This model accurately simulates jet separation and is less susceptible to errors when boundary conditions change, which makes it numerically stable. Additionally, it is characterized by moderate computational requirements, making it a common choice for CFD analyses.
In the analysis of gas flow through the nozzle, the boundary conditions were temperature and gas velocity. The dynamic pressure and temperature were defined at the outlet. Heat transfer was determined by convection on the nozzle inner wall and turbine cone. The wall thickness was assumed to be 3 mm. Calculations were performed for an ambient pressure of 100,330 Pa. The boundary conditions are presented in
Table 1. The gas velocities used in the table were estimated based on the dynamic pressure measured during the experiment. The heat transfer coefficient results assumed for the boundary condition are explained in the next step and are based on the data in
Table 2.
In the second stage, the Steady-State Thermal module was used. Based on the calculations, the temperature distribution across the entire model was obtained. In this case, the temperature field on the inner wall of the outlet nozzle was mapped. This distribution constituted one of the boundary conditions used in the calculations. Convection was assumed to occur on the outer and inner walls of the outlet nozzle. The convection coefficient value varied as a function of temperature and was determined based on the empirical Dittus–Boelter correlation for turbulent flow in smooth tubes [
27]:
where
Nu is the Nusselt number,
Re is the Reynolds number, and
Pr is the Prandtl number.
This correlation is widely applied in engineering heat transfer calculations for estimating convective heat transfer coefficients in turbulent internal flows.
The results are presented in
Table 2.
The same values for this parameter were assumed in the ANSYS Fluent analysis.
As described above, in the thermal analysis, heat transfer with the initial condition:
In the three-dimensional model of the nozzle, it was calculated according to the following formula:
where
is the thermal conductivity coefficient changing under the considered direction in the Cartesian coordinate system, and
is assumed to be
.
In the inner and outer walls, the heat transfer was calculated according to the boundary condition of the third type:
where
is the heat transfer coefficient,
and
is the fluid temperature,
.
For the last nozzle wall (turbine side), the following condition was assumed:
The remaining air parameters were as shown in
Table 3.
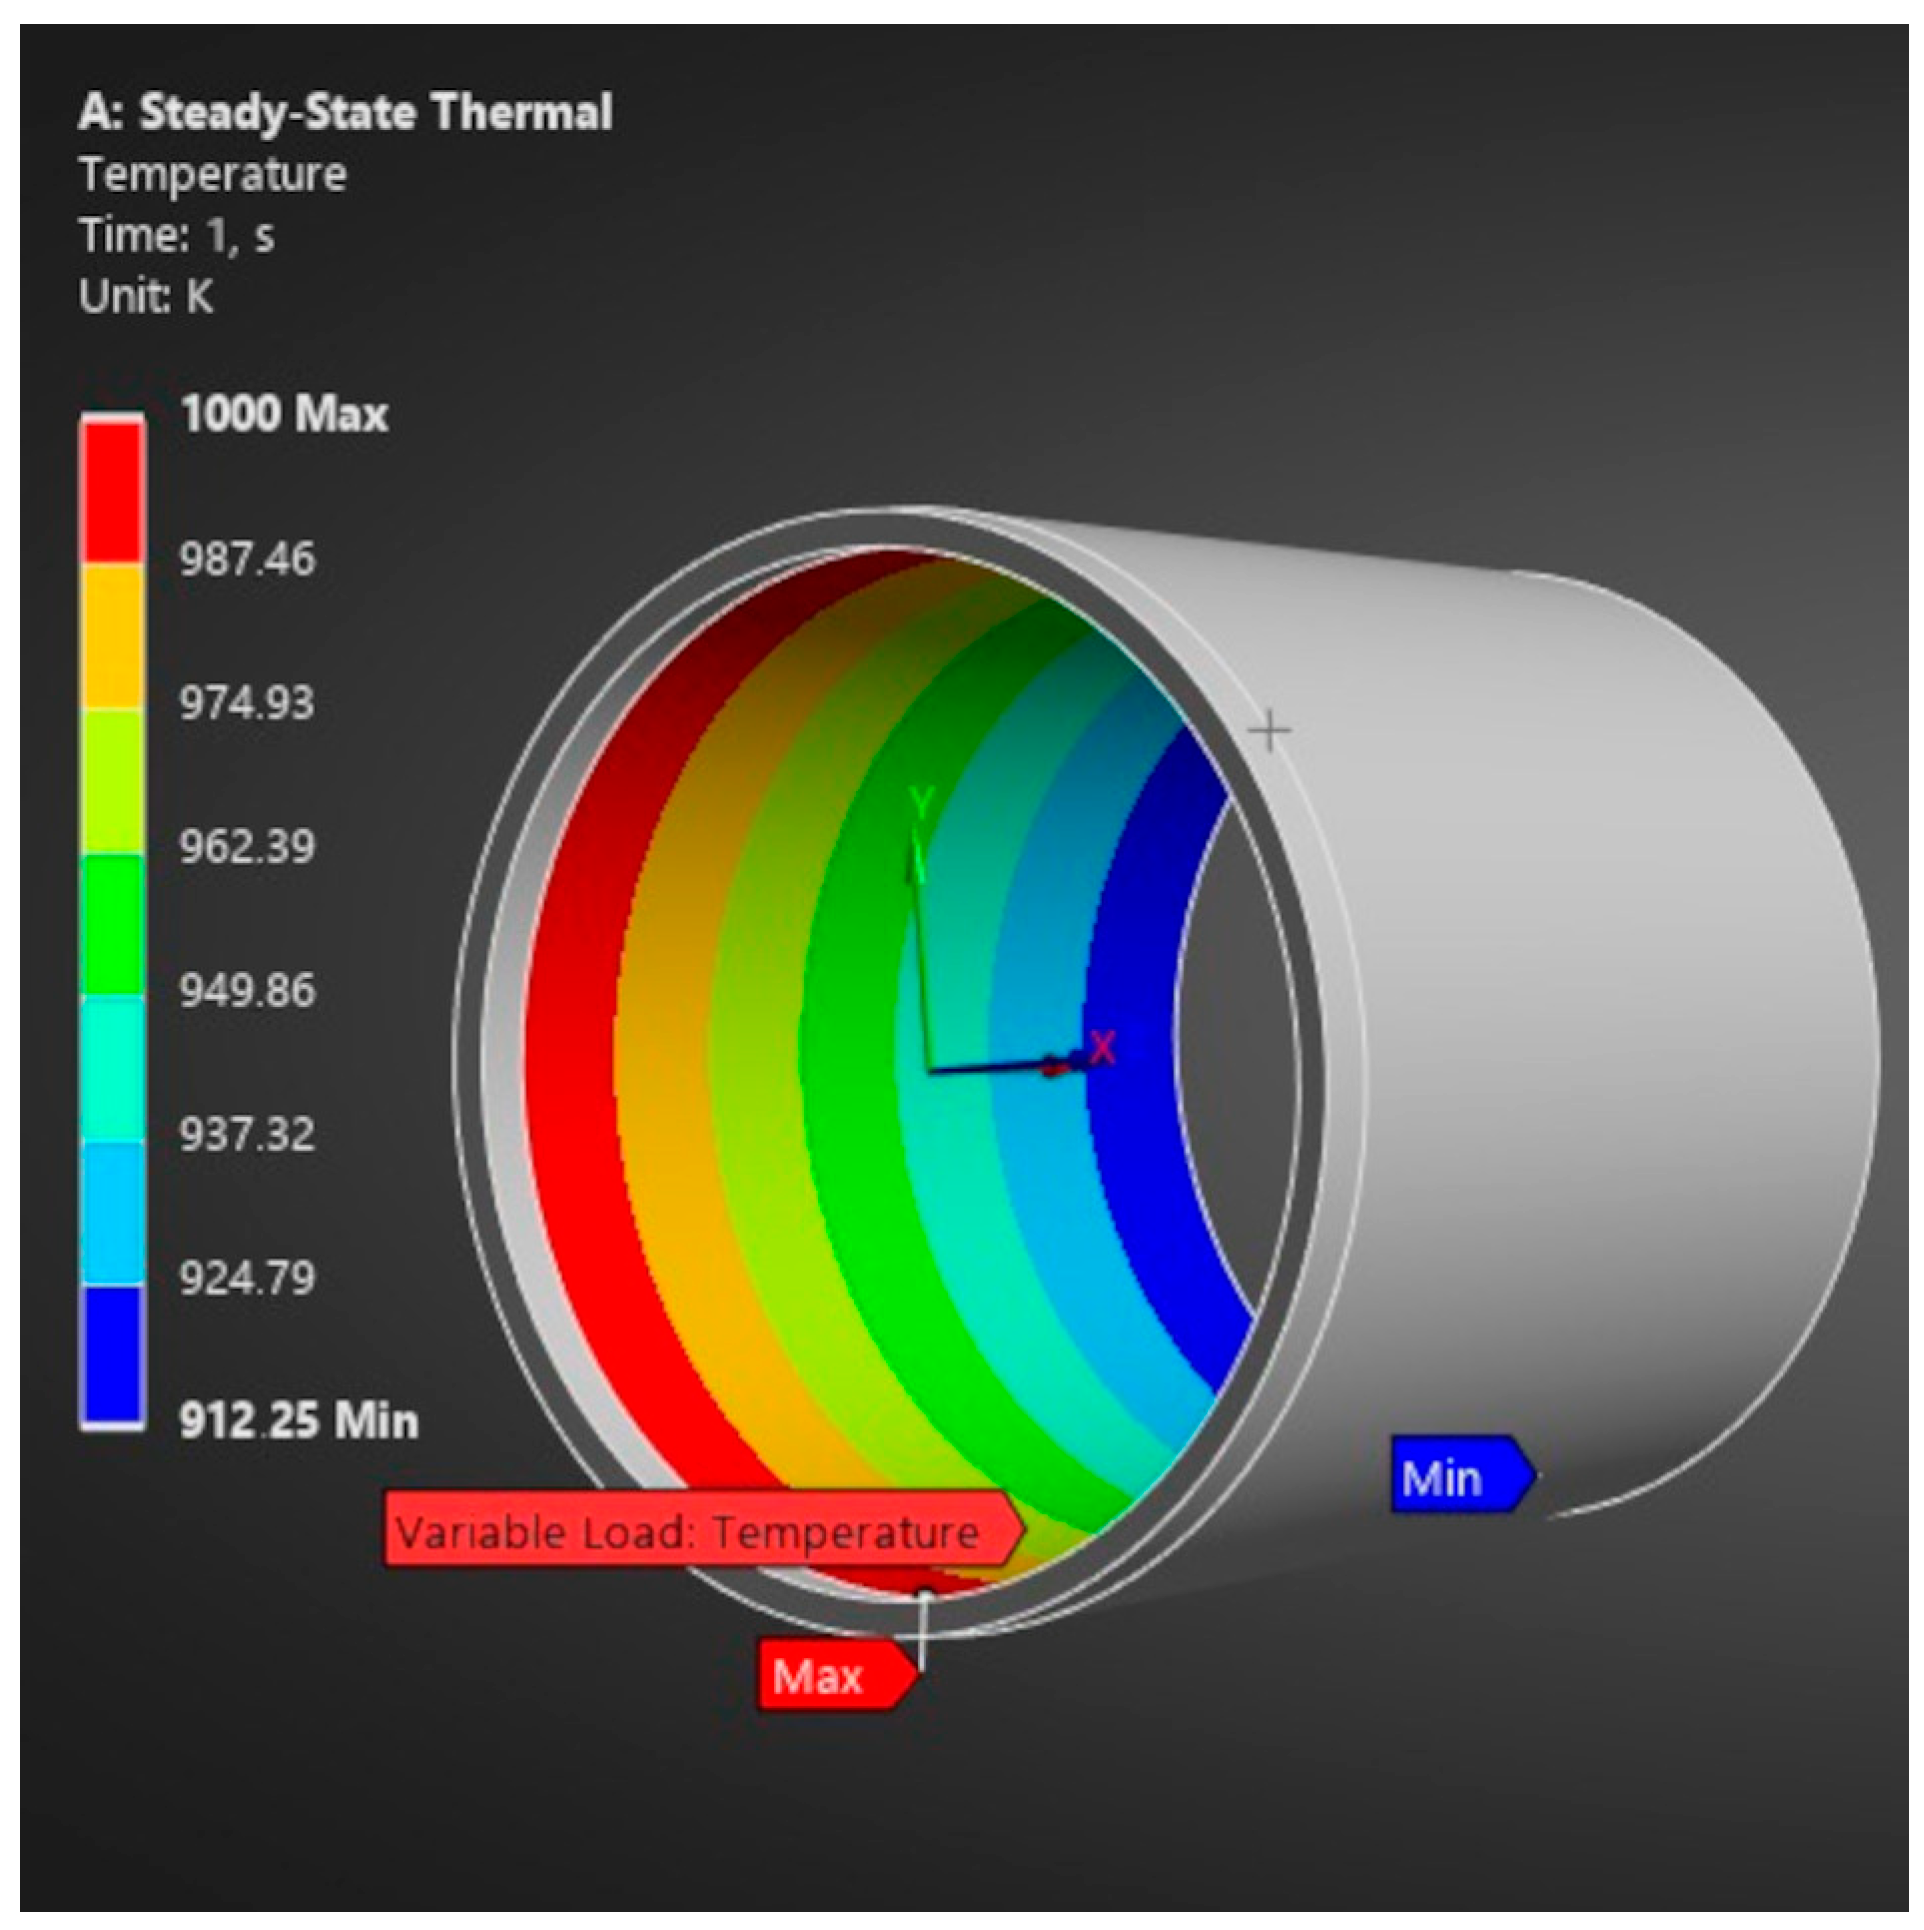
In the third stage of the analysis, the temperature distribution in the entire structure of the outlet nozzle calculated in the second stage was implemented and served as input data for calculations in ANSYS Static Structural,
Figure 3.
In addition, a fixed support boundary condition was applied to the inner wall of the nozzle flange, and an average pressure acting on the inner wall was imposed,
Figure 4. This condition was applied due to the attachment of the remaining part of the engine to the housing at this point.
This pressure was estimated based on flow analysis. The exact input data values are presented in
Table 4. The mechanism of small quasi-static deformations of materials behaving according to Hooke’s law is described by conservative laws, i.e., conservation of mass, momentum, and energy. In addition to conservative laws, a constitutive law is necessary to fully describe the solid-state case under consideration. Using Duhamel–Neumann’s law, the relationship between temperature change and stress in a material can be expressed as follows:
where the Lame constant
the Lame constant
thermoelastic constant
temperature difference
where
is Young’s modulus,
;
is the strain;
is expansion (the first strain invariant);
is stress-free temperature;
is Poisson’s ratio; and
is thermal expansion coefficient,
.
Strength calculations were performed using the finite element method.
The remaining properties of the adopted material, i.e., 316 stainless steel, for the outlet nozzle model are presented below,
Table 5. All described analyses were additionally simplified due to the stationary condition, which means that the parameter values did not change over time.
The basic analysis, described above, was extended with additional calculations and consideration of additional phenomena. Firstly, thermal radiation was included in the gas flow analysis. In ANSYS, the radiative transfer equation was solved using the Discrete Ordinates model. This model assumed a temperature-dependent thermal emissivity coefficient. Secondly, in the analysis of gas flow through the nozzle, the thermal conductivity coefficient was also dependent on temperature. Thirdly, in the strength analysis, the thermal expansion coefficient was dependent on temperature. All these coefficients are presented in
Table 6.
3. Flow Analysis Results in the Nozzle Model
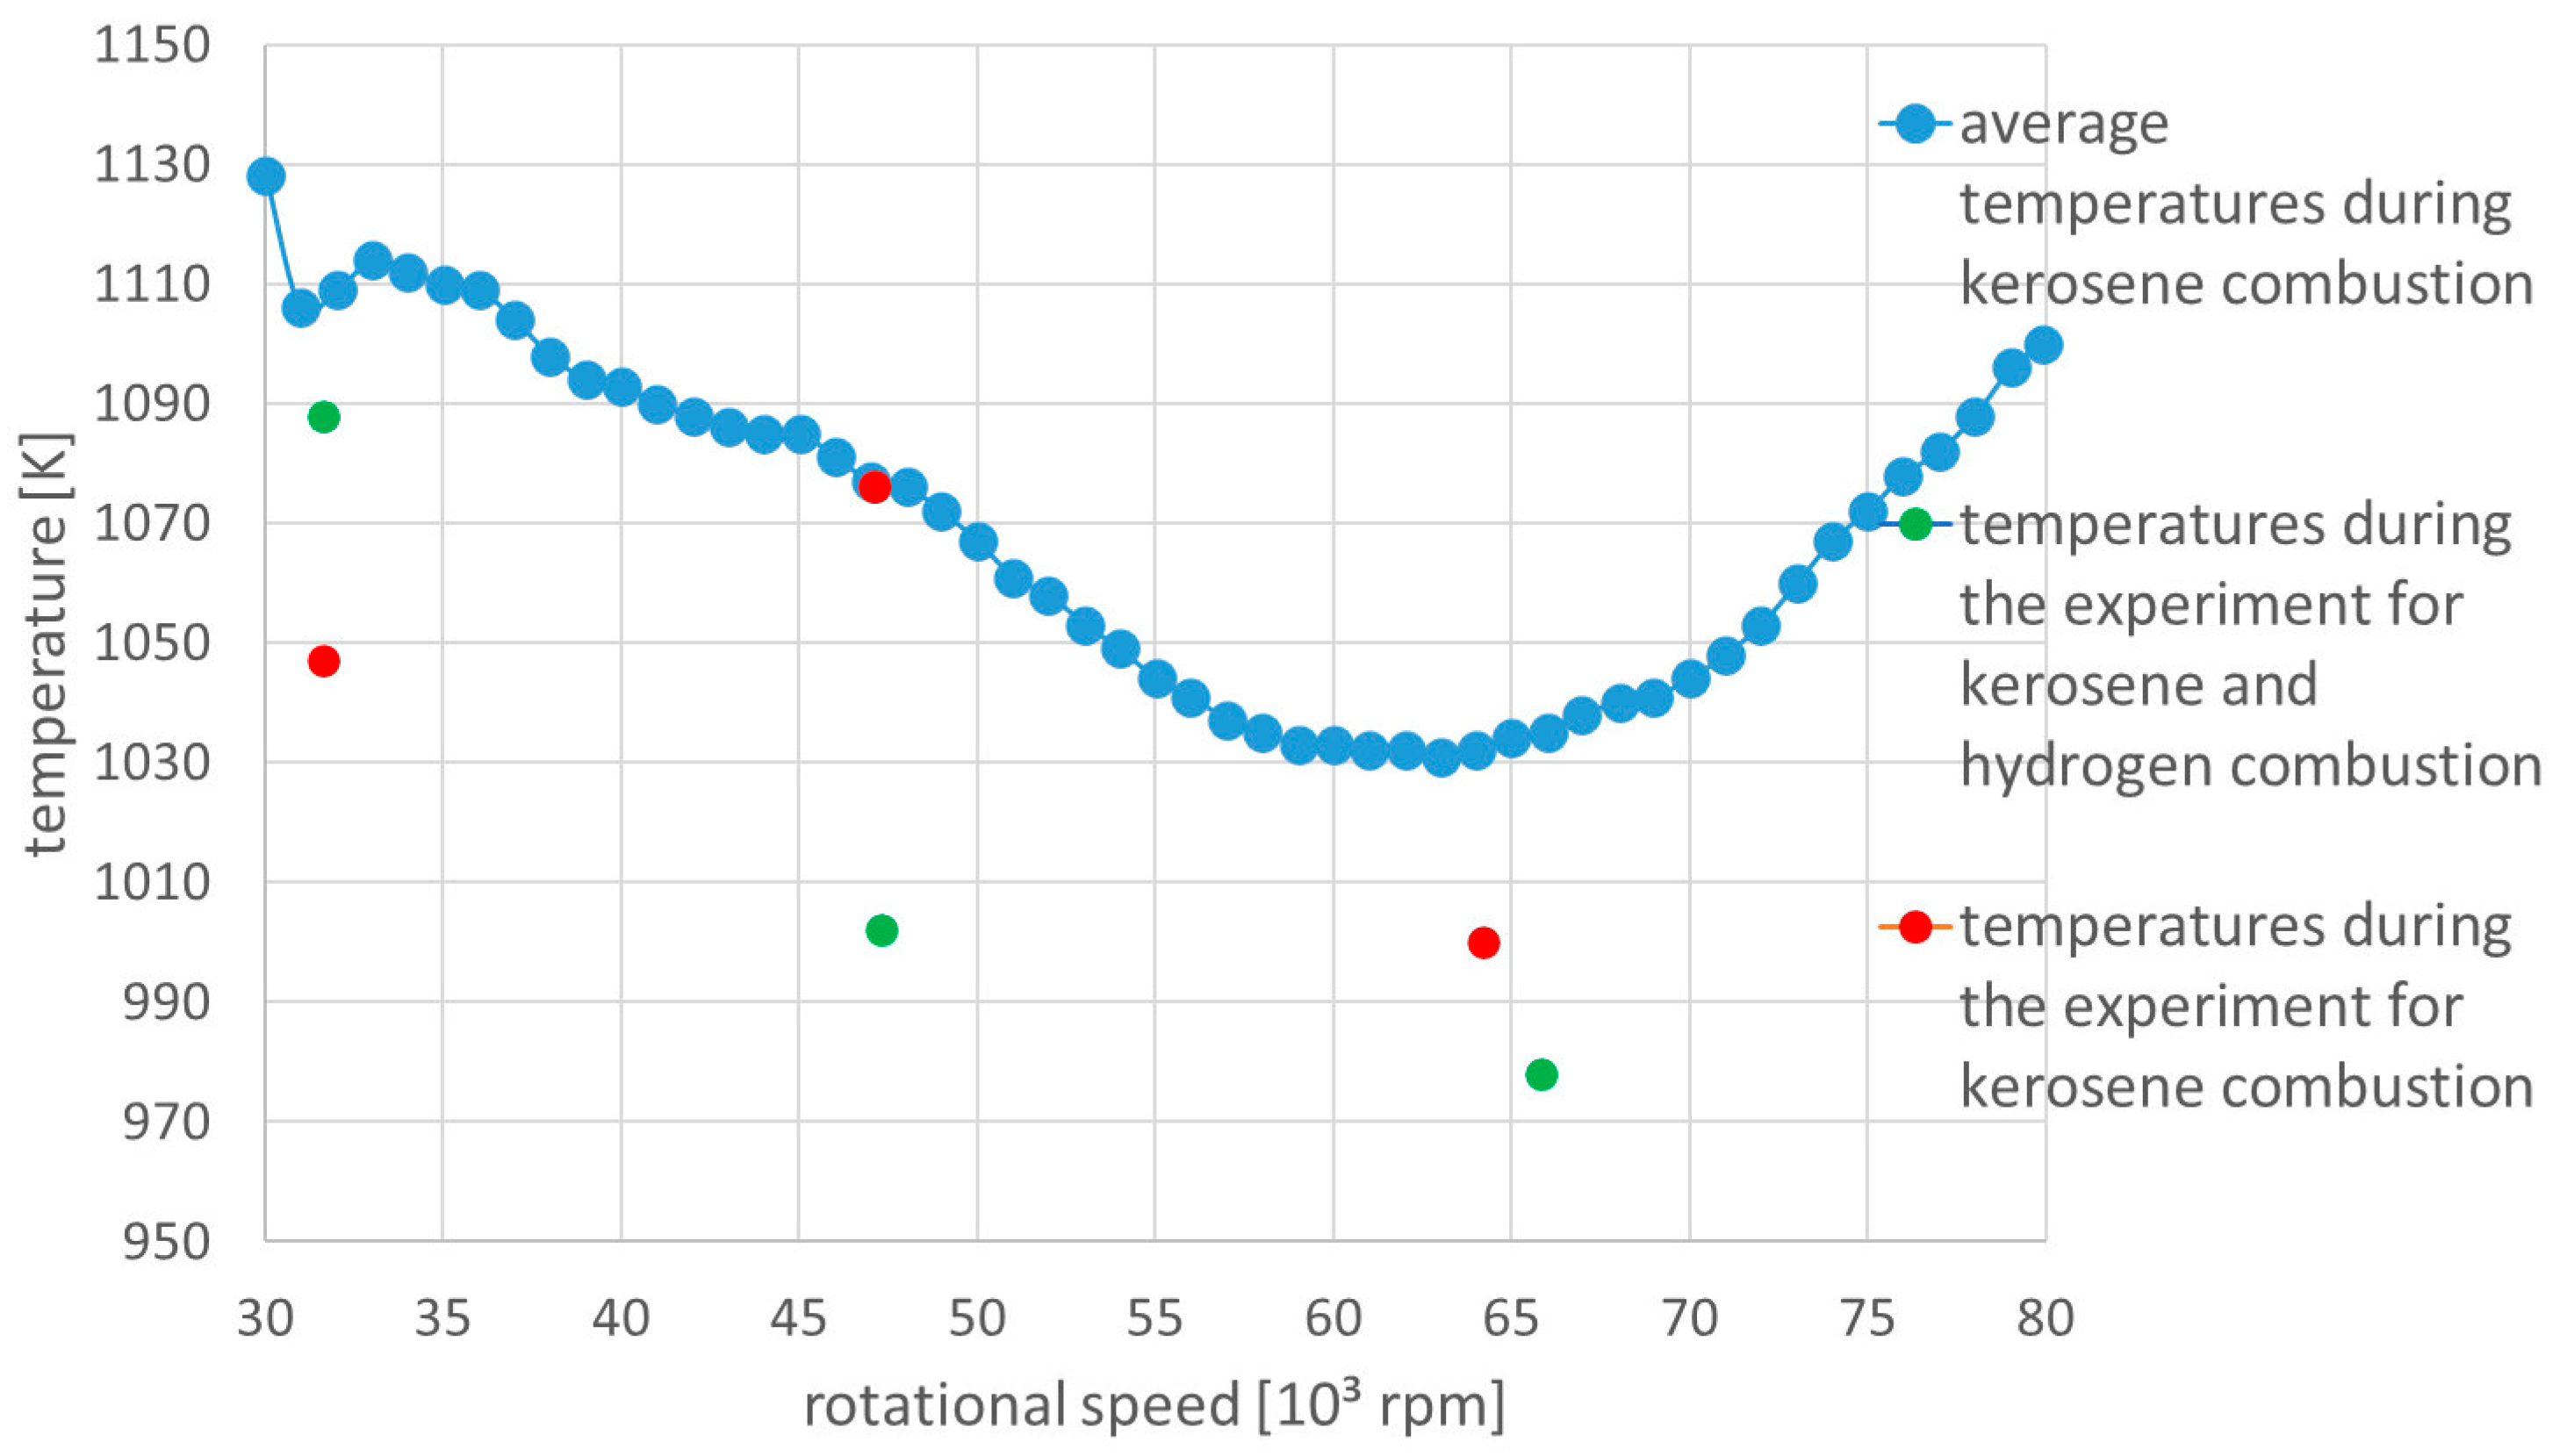
The numerical analysis used the temperature measured during the experimental tests. The temperature was recorded using a thermocouple located near the nozzle outlet,
Figure 5. The graph shows the temperature distribution for kerosene combustion as averaged. The average temperature value was determined based on tests conducted under various ambient conditions.
Figure 5 also presents the values obtained during the experiment on which the numerical analysis was based. Verification of the operating parameters resulted from maintaining the engine speed for a certain period of time to achieve temperature measurement stabilization. For simplicity, this parameter was assumed constant across the entire nozzle outlet cross-section.
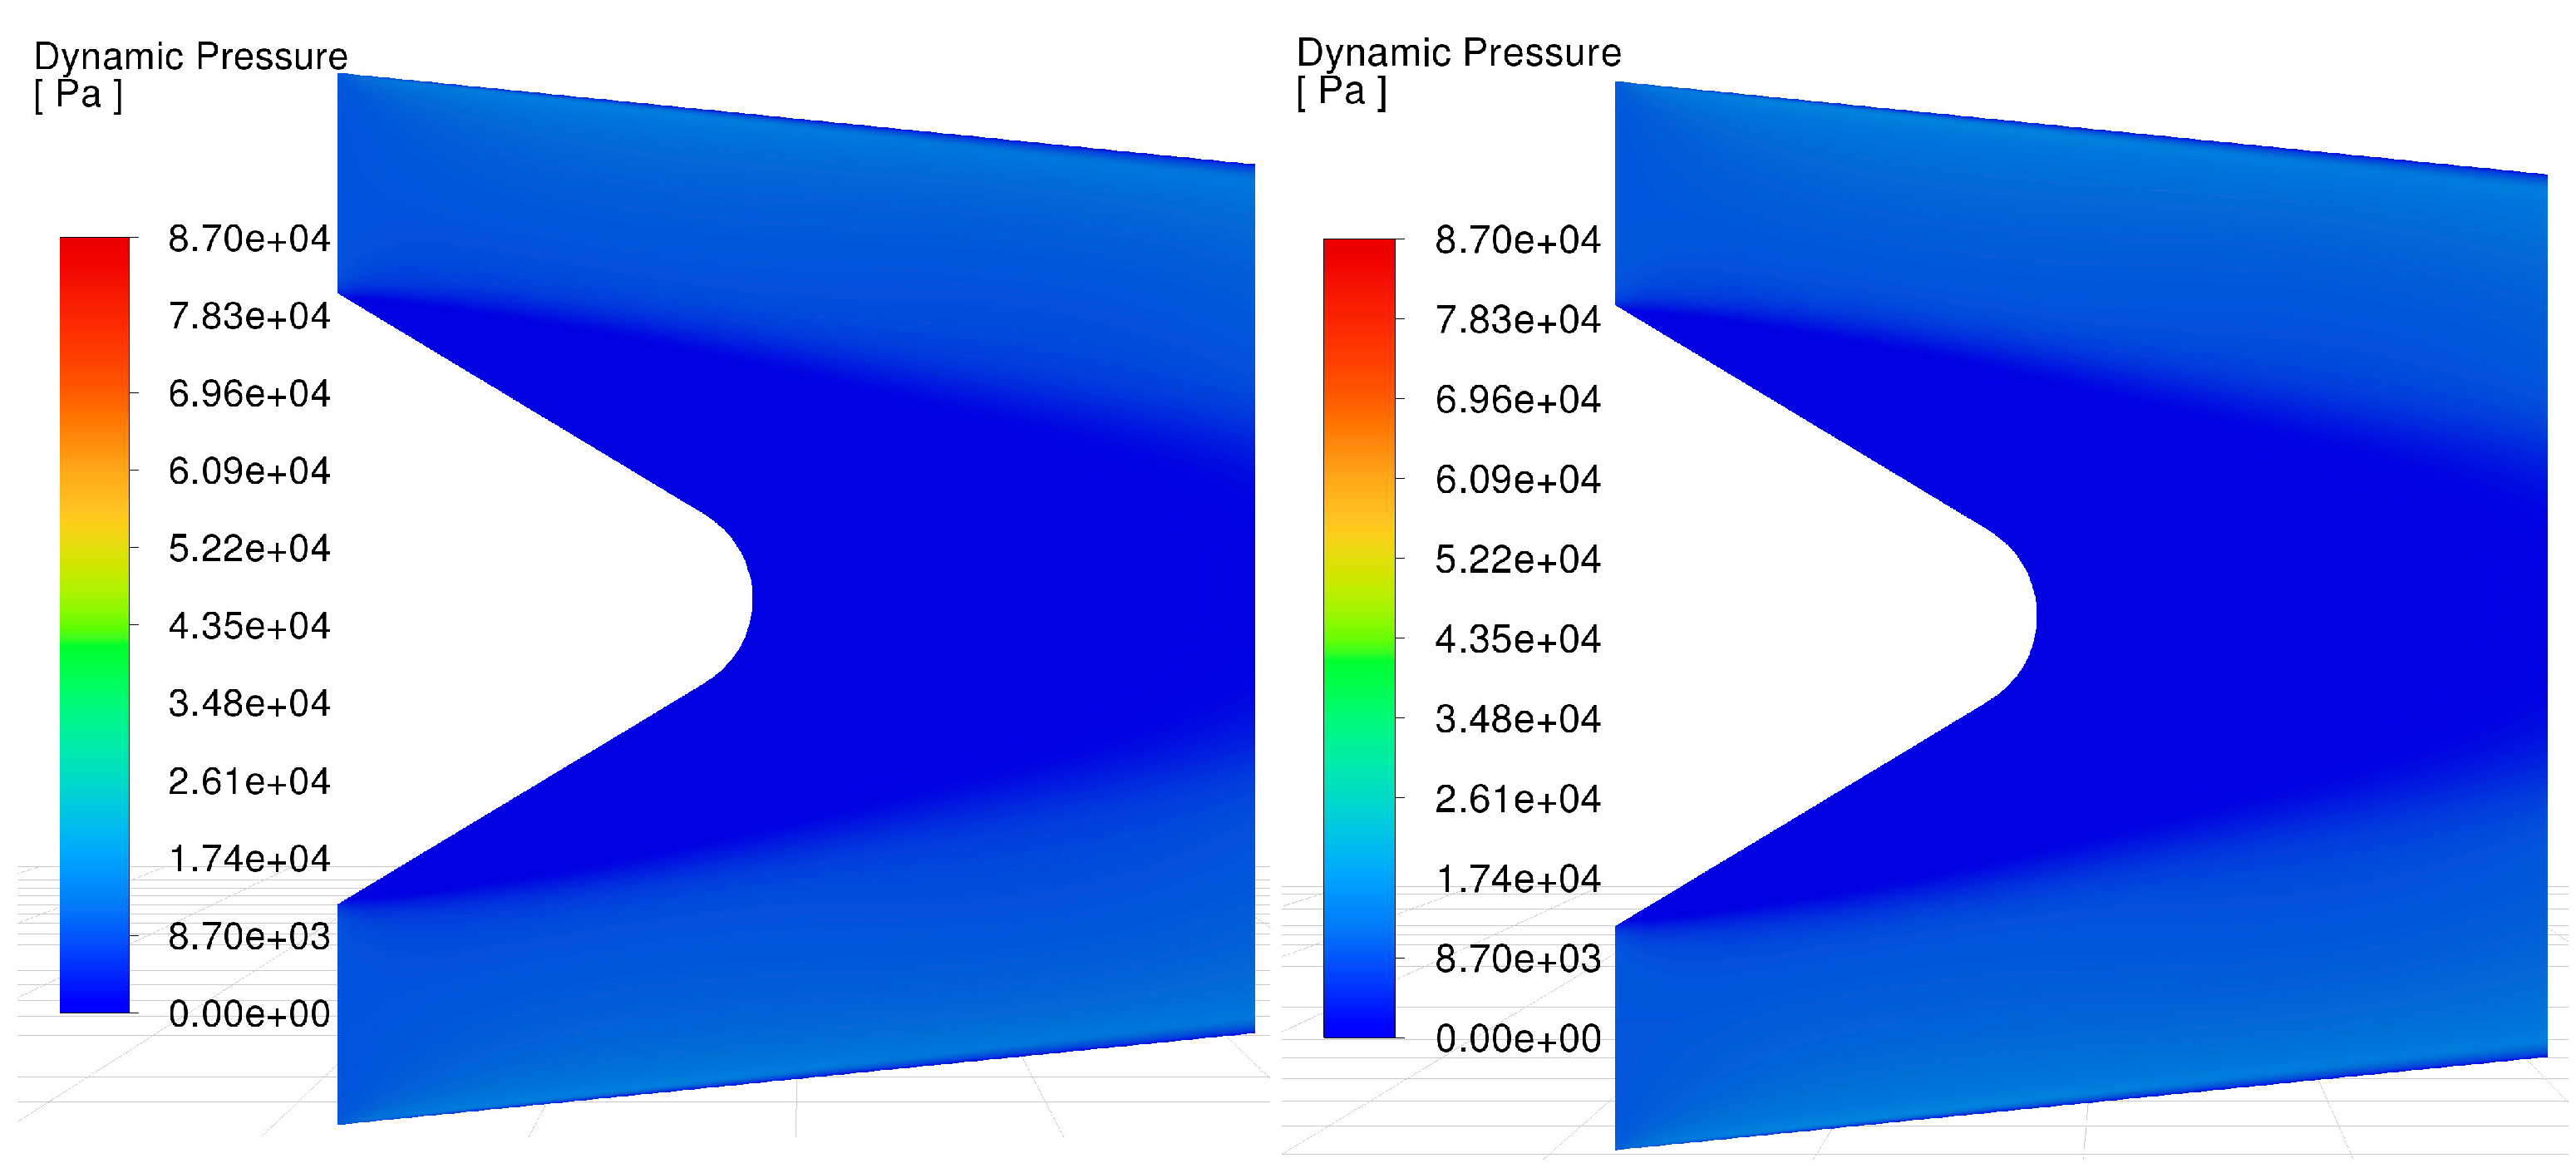
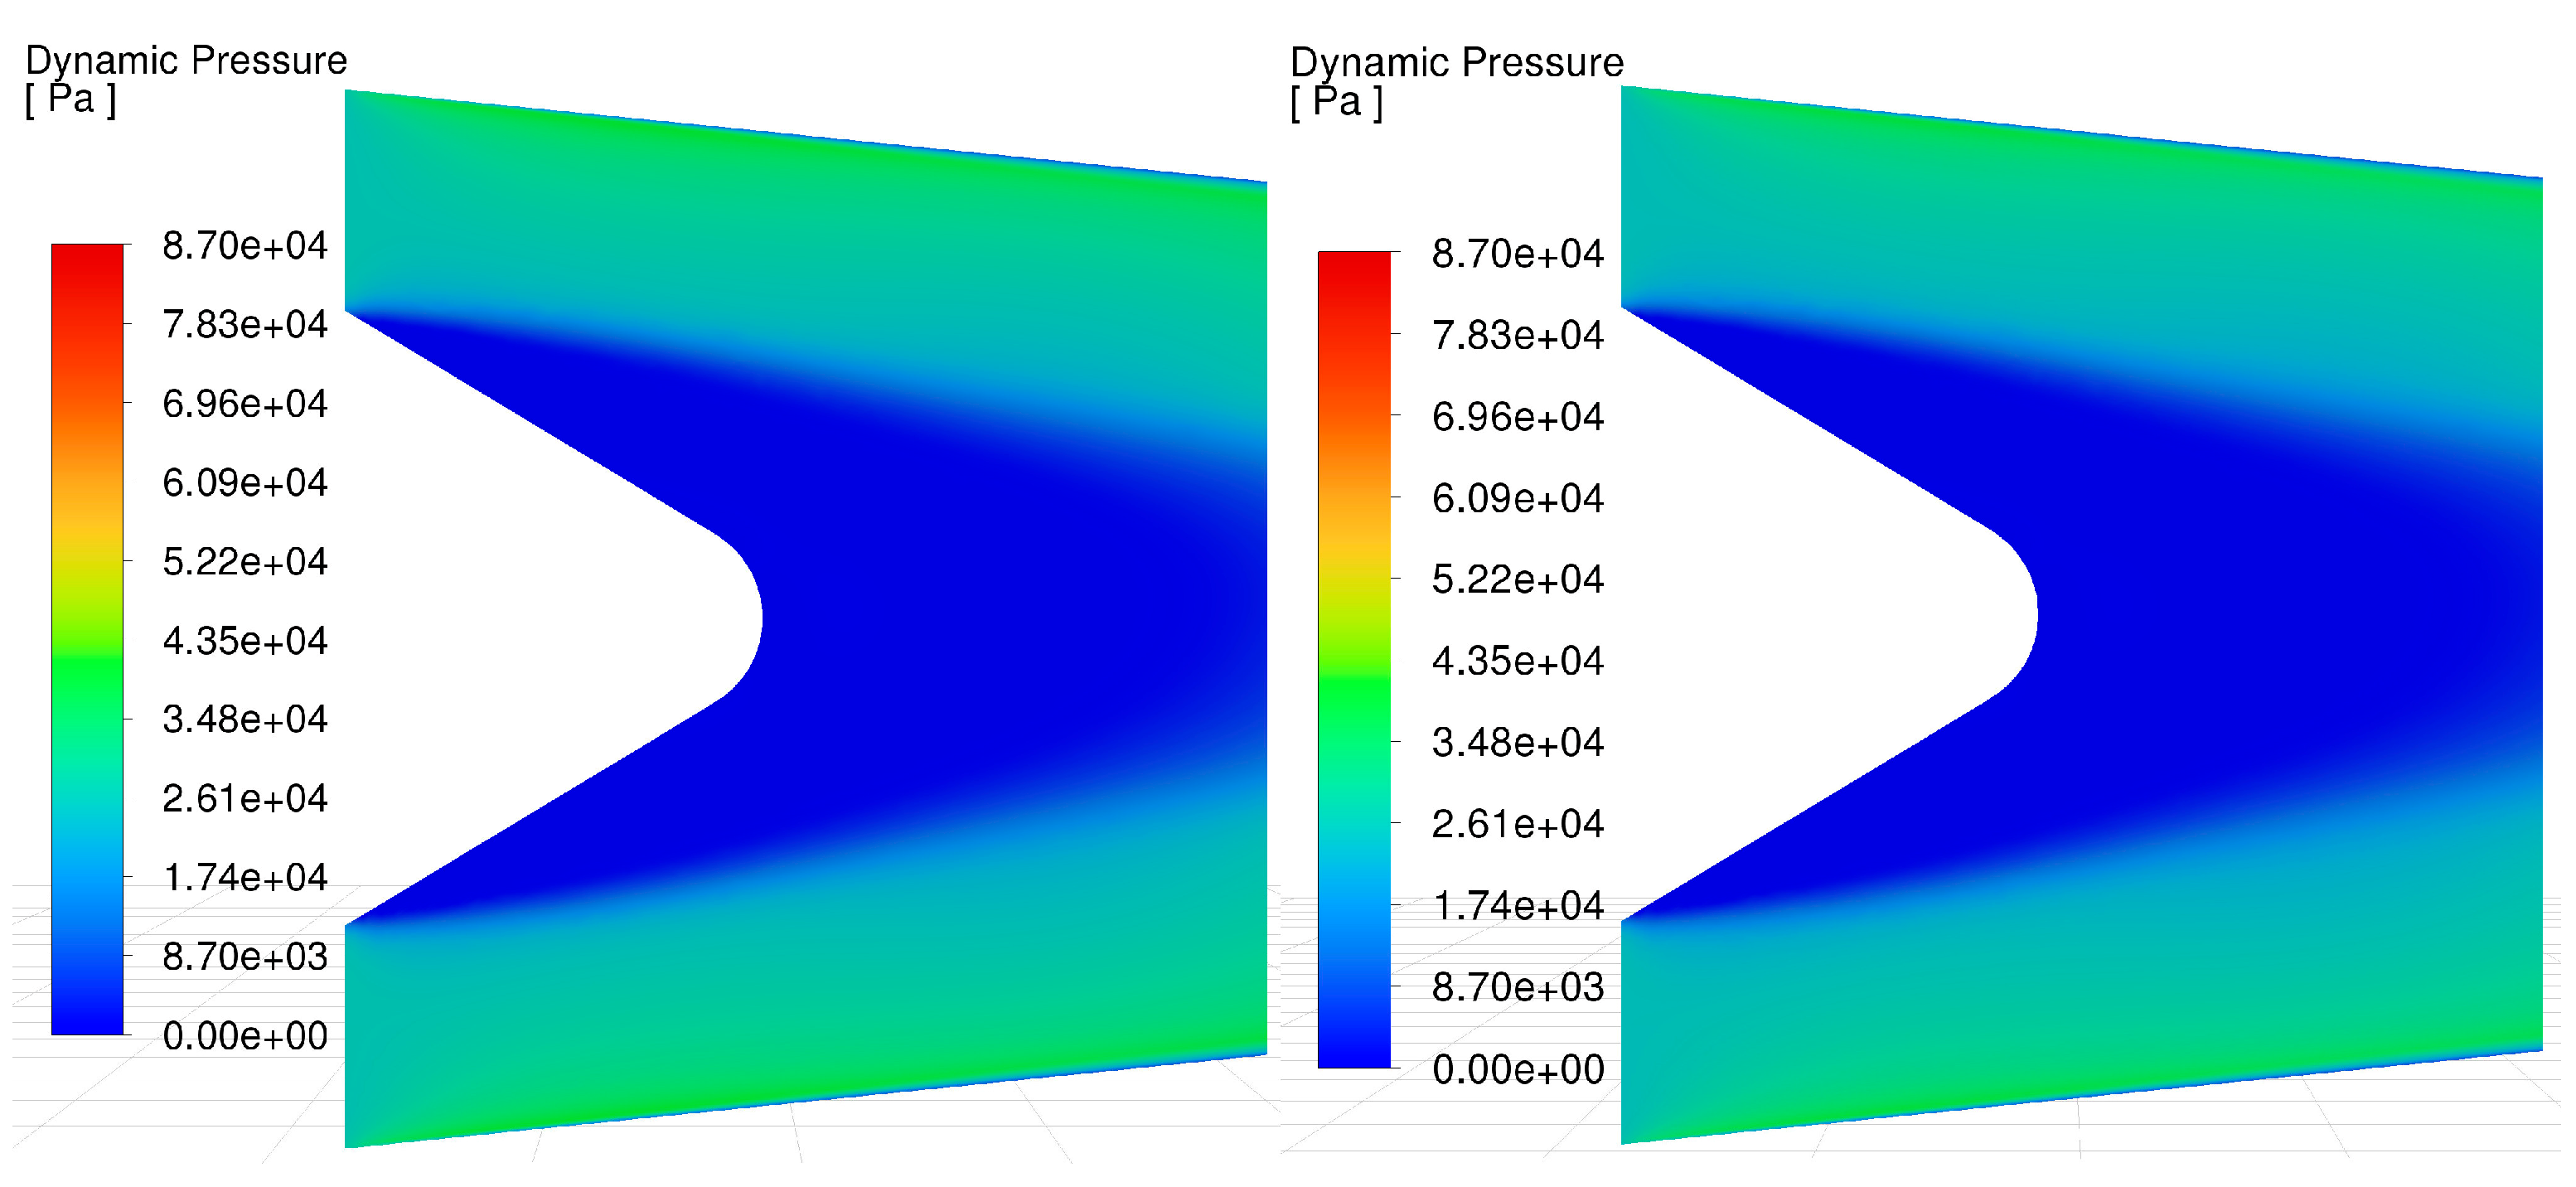
The analysis considered three engine operation cases for kerosene and kerosene with hydrogen combustion. The first case involved a rotational speed of 31,630 rpm in both cases. The second case involved a speed of 47,110 rpm, for which the engine also operated in both combustion modes considered. The third case involved two different rotational speeds, i.e., 64,200 rpm and 65,830 rpm. The lower value concerns kerosene combustion, while the higher value concerns kerosene and hydrogen co-combustion. In this situation, the engine produces almost the same thrust for both different speeds, i.e., 157.9 N for kerosene and 157.0 N for both fuels co-combustion. In the case of kerosene combustion for speeds 31,630 rpm and 47,110 rpm, thrust is 22.6 N and 64.7 N, respectively. In the case of kerosene and hydrogen co-combustion for speeds 31,630 rpm and 47,110 rpm, thrust is 26.5 N and 70,6 N, respectively. The dynamic pressure field for the considered cases is presented in
Figure 6,
Figure 7 and
Figure 8.
Numerical calculations showed that the dynamic pressure, and therefore the speed, increased for kerosene and hydrogen co-combustion at rotational speeds of 31,630 rpm and 65,830 rpm. For a speed of 47,110 rpm in this combustion mode, a reduction in the dynamic pressure was recorded,
Table 7. This direction of change is in contradiction to the thrust, which increased for kerosene and hydrogen co-combustion compared to kerosene combustion alone. It should be remembered that there is a gradient in exhaust gas velocity in the exhaust cross-section, and during the experiment, the static and total pressures were measured at a single point. Adopting the simplification of the analysis, which involves assuming a point-measured value for the entire exhaust cross-section, may sometimes result in an unphysical change in the direction of the dynamic pressure drop due to local flow disturbances during the experiment.
A lower-velocity flow region forms in the central part. This is due to the cone located in the centre of the nozzle, which is swept by gas during engine operation. A lower-velocity region also occurs at the edge of the nozzle wall. Its thickness increases towards the engine’s exhaust cross-section. This is related to the loss of exhaust gas energy, which increases with distance from the turbine section due to friction between fluid particles and the nozzle wall.
In the case of the extended analysis, adding the additional conditions described in the Methods section did not result in a significantly different dynamic pressure distribution,
Table 7. These conditions are related to heat transfer and stresses in the nozzle material; therefore, their impact on the flow character analysis is limited. Due to the very similar results for the considered rotational speeds, the pressure distributions for this analysis are not presented.
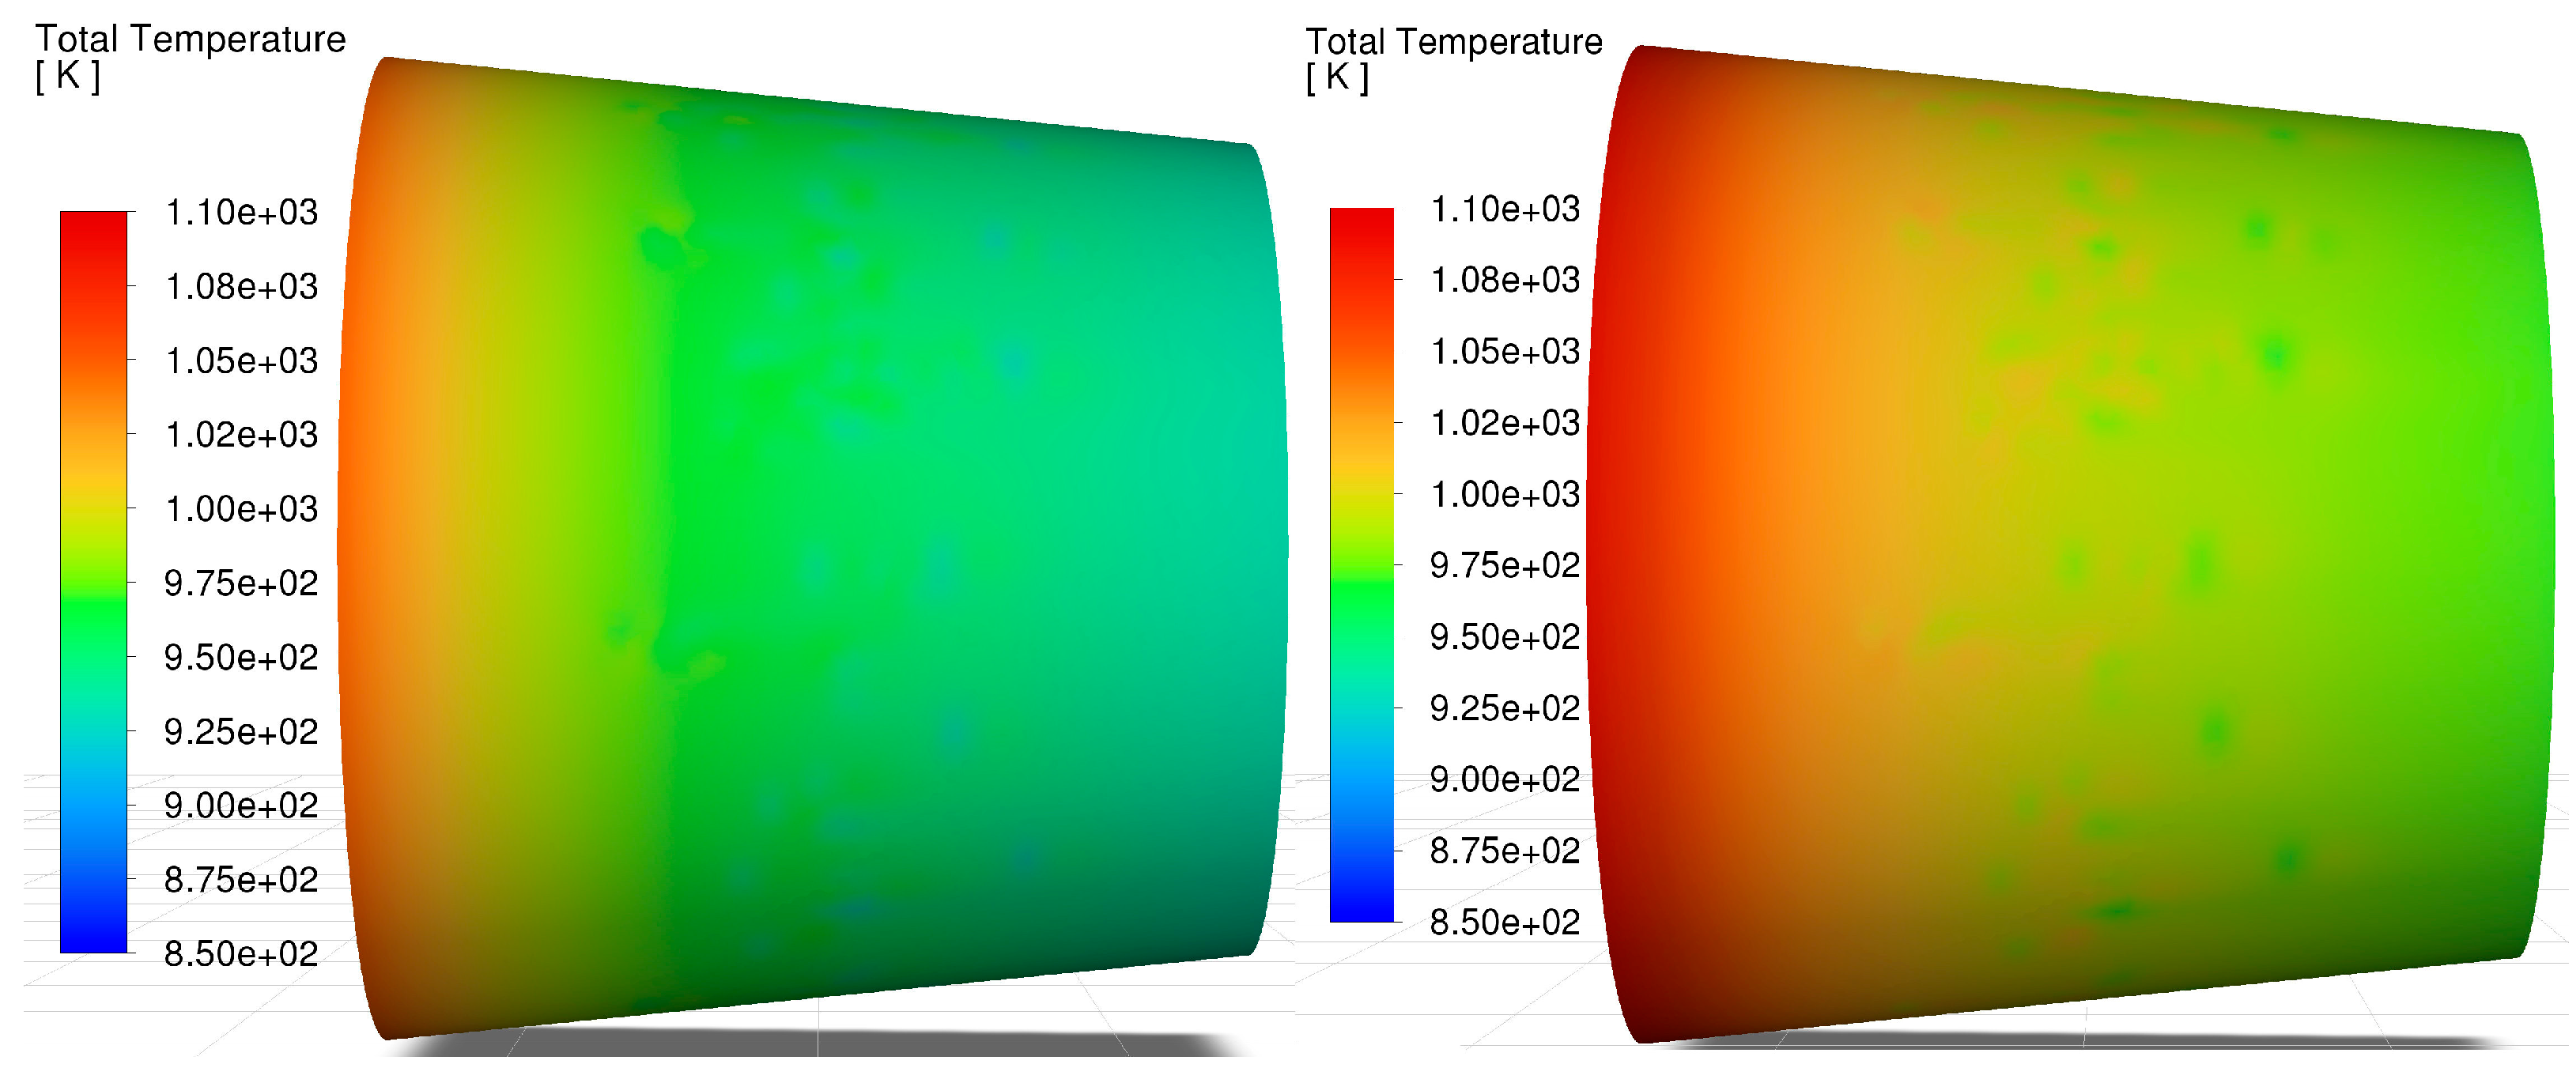
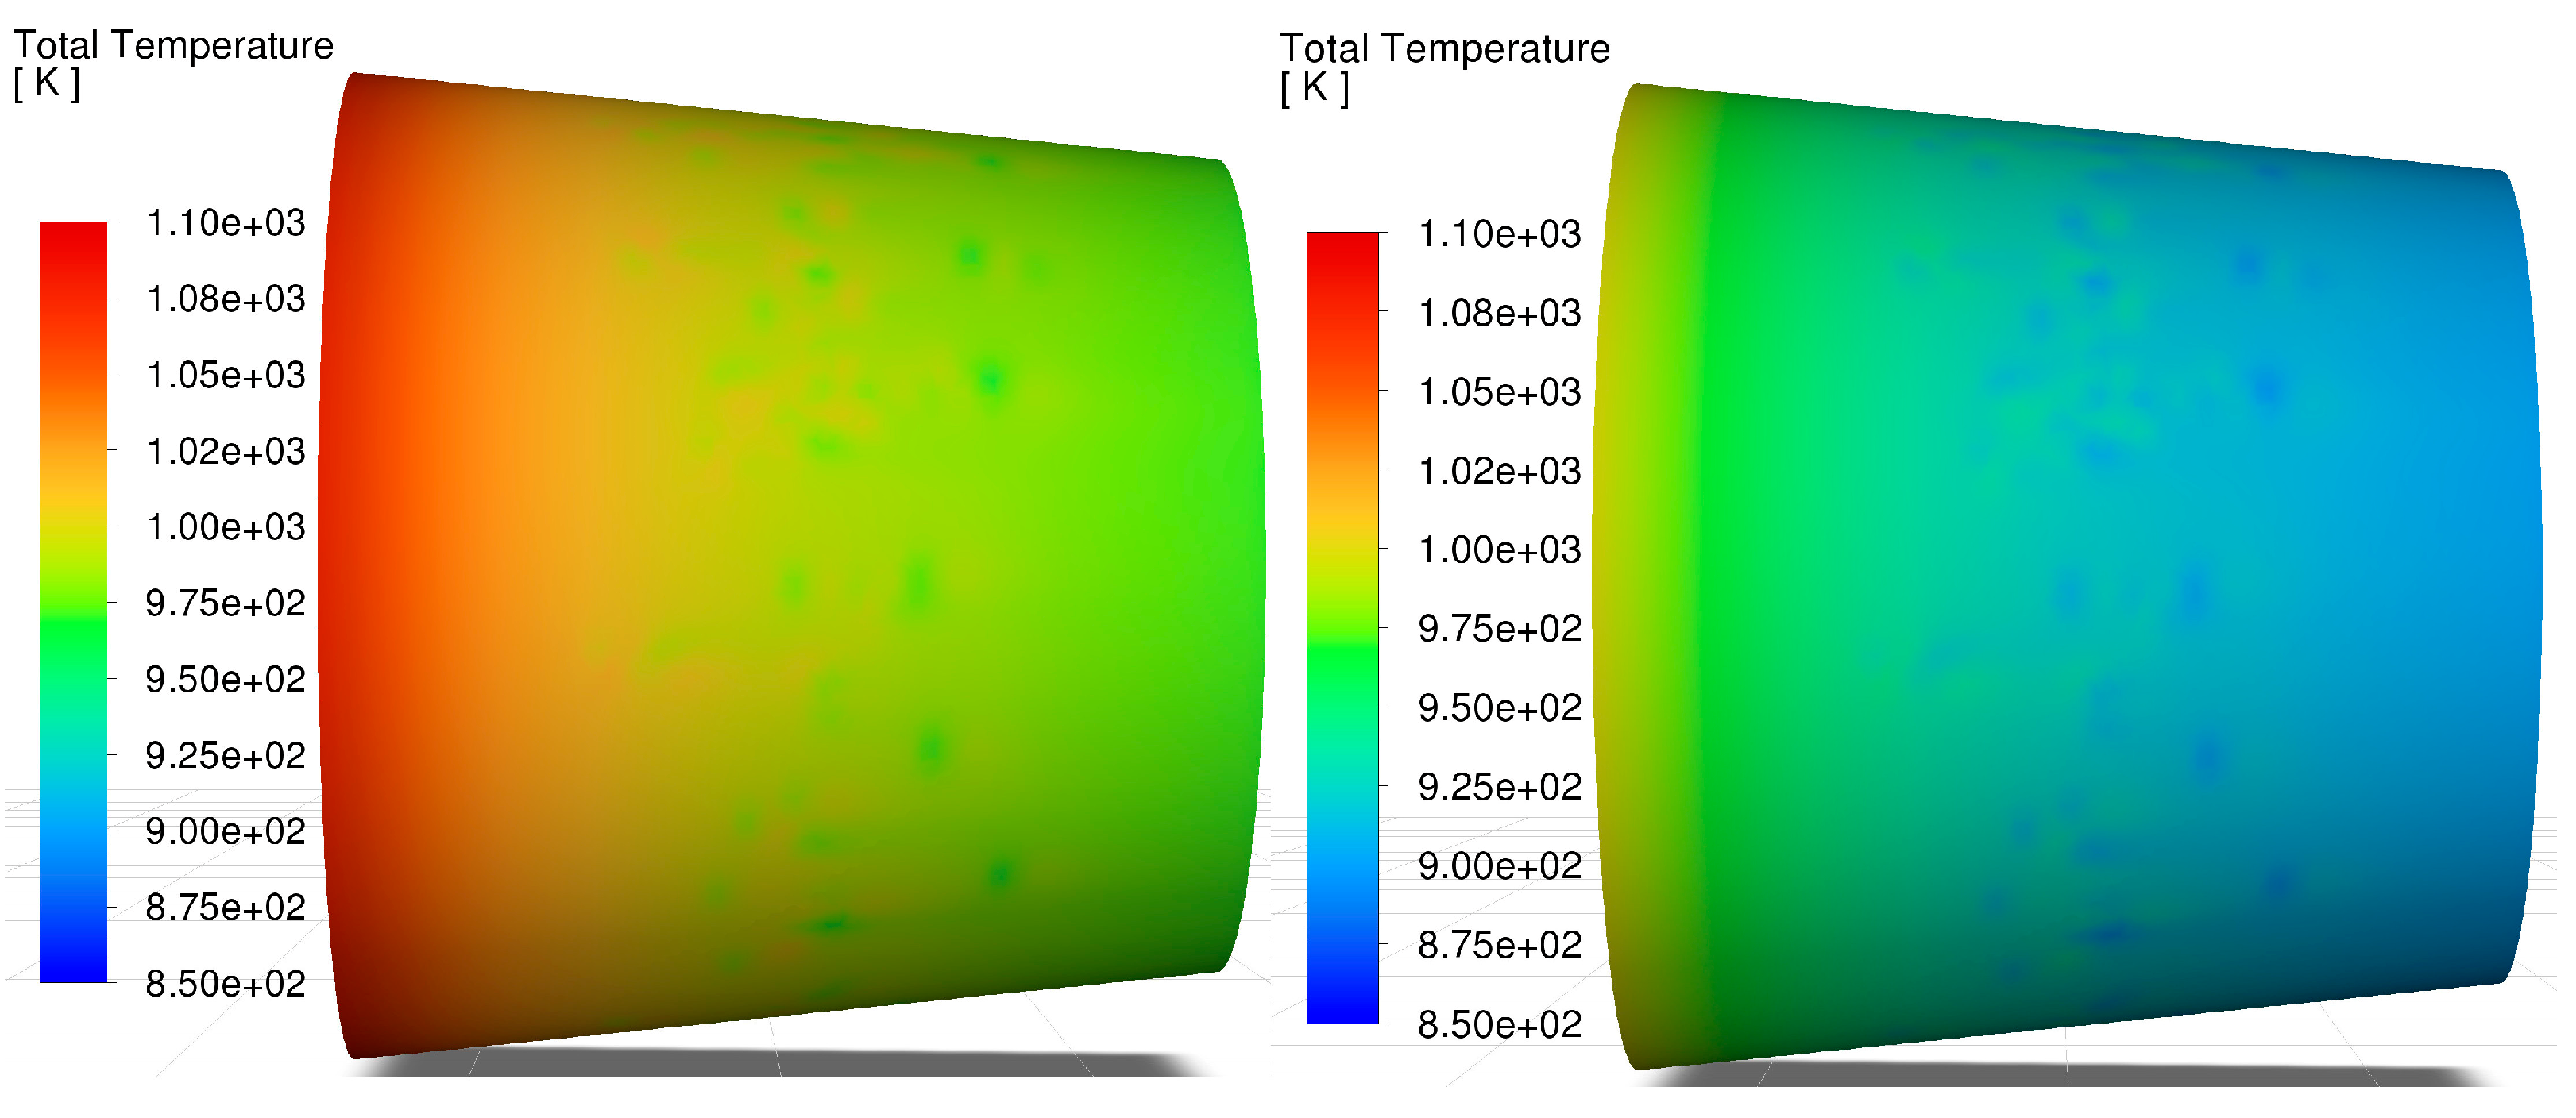
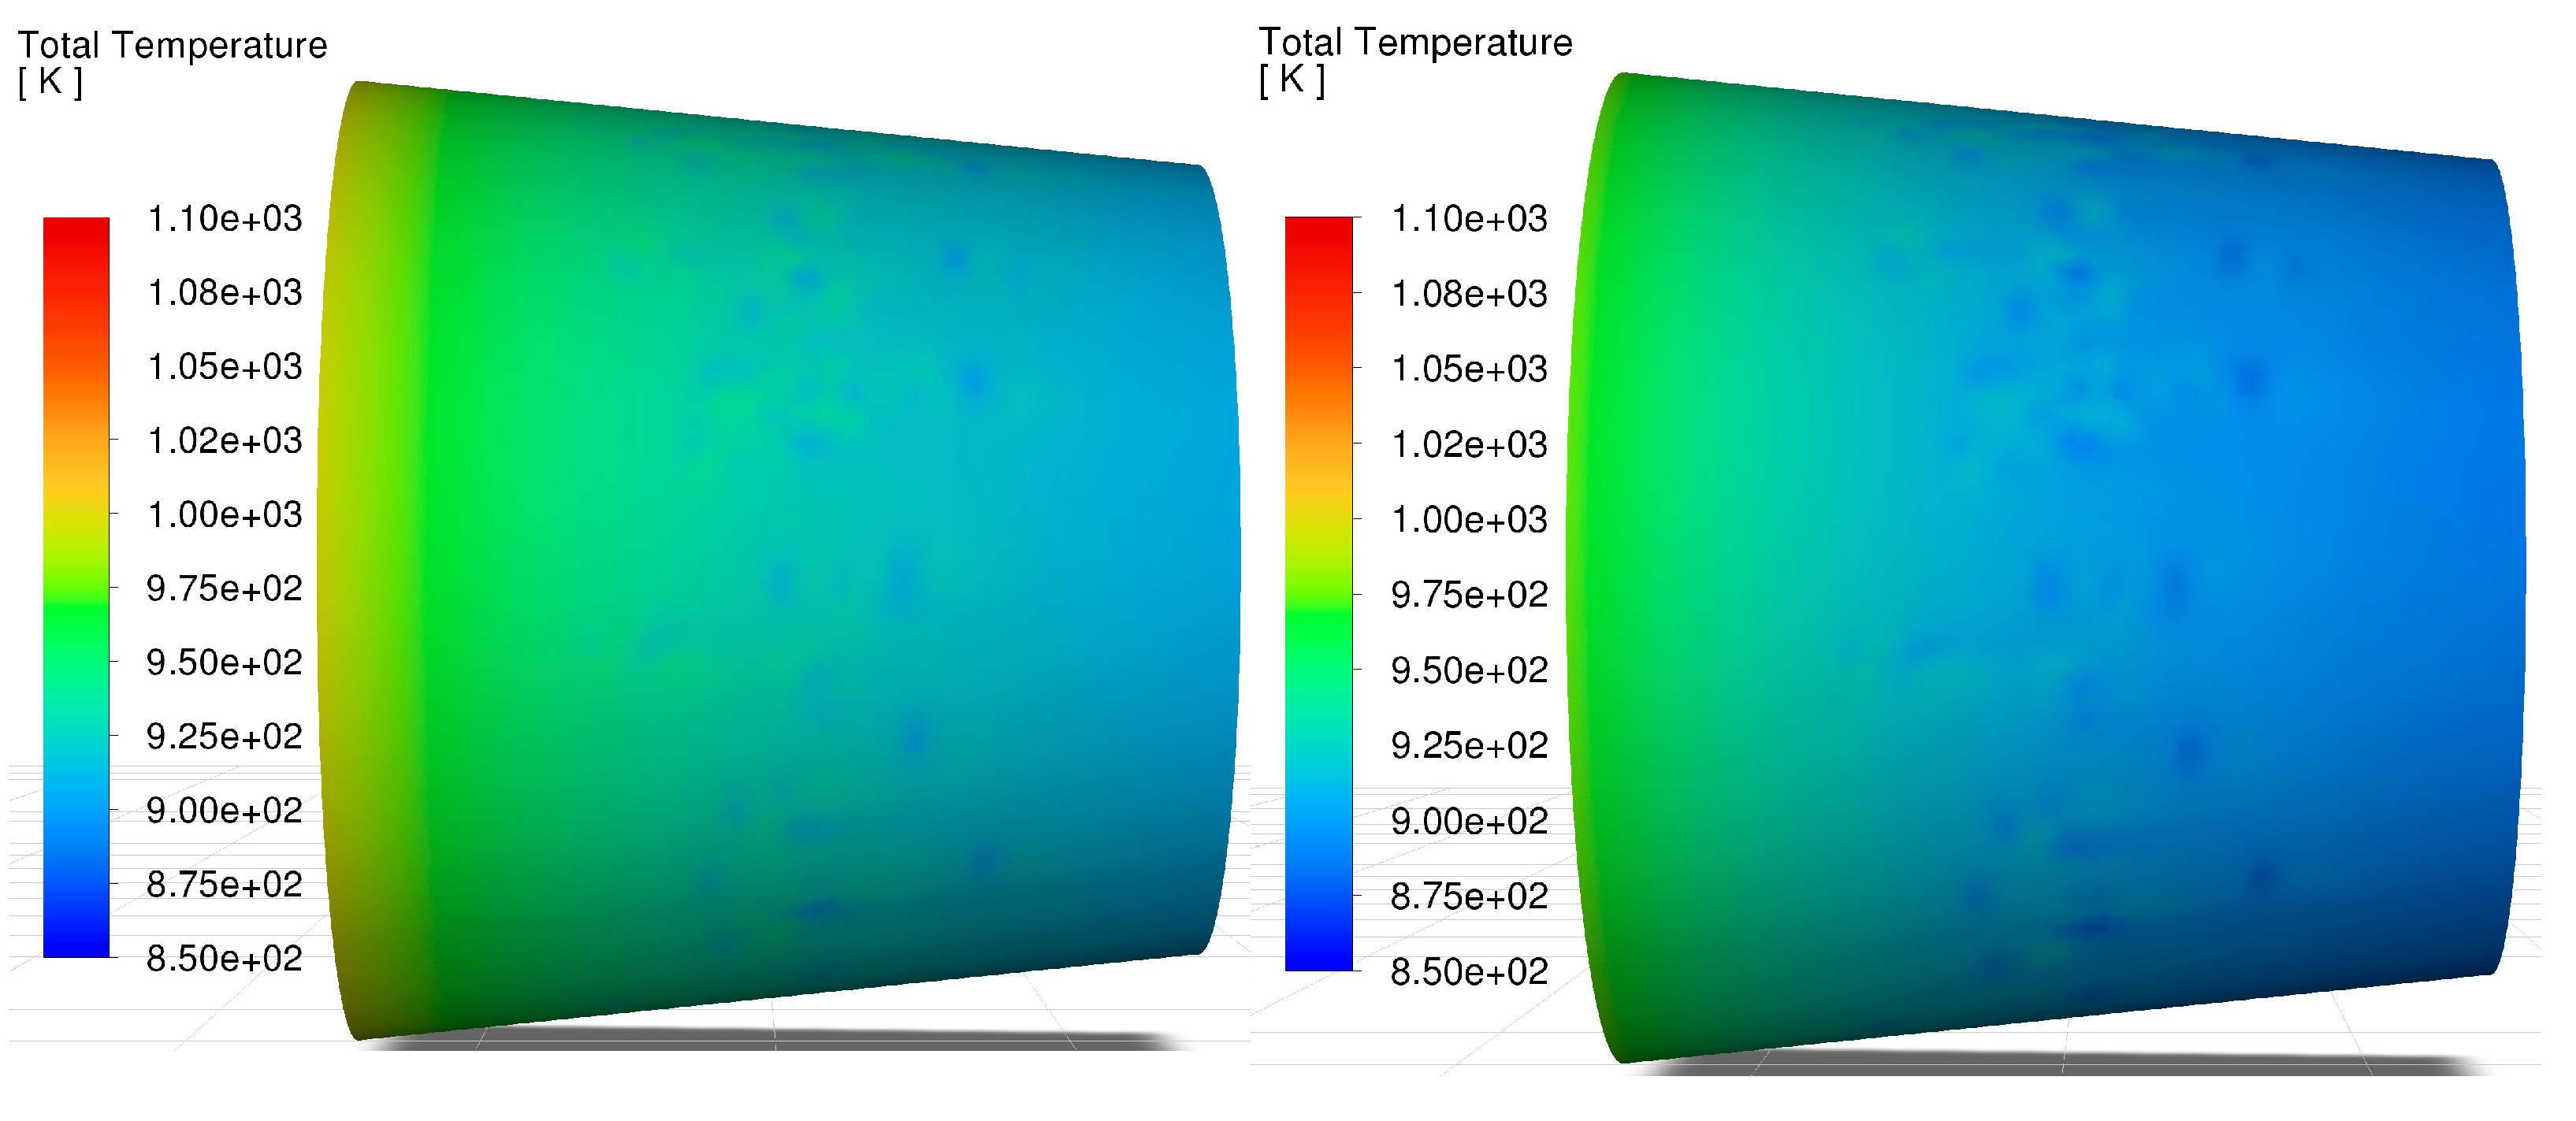
In each case considered, the highest temperature region is located near the turbine. The temperature field is presented in
Figure 9,
Figure 10 and
Figure 11. At higher engine speeds, co-combustion of kerosene and hydrogen resulted in a lower maximum temperature compared to combustion of kerosene alone. For the lowest engine speed, i.e., 31,630 rpm, the situation is reversed. This corresponds to the temperatures measured during the experiment (
Figure 5). This change in the situation may be related to different engine operating settings at minimum engine speeds compared to higher engine speeds. It should be noted that there is a significant reduction in kerosene consumption compared to the situation where kerosene is the fuel source. The same phenomenon also occurs when the engine is fueled solely with kerosene. In this case, this deviates from the general trend of increasing kerosene consumption with decreasing engine speed. In the case of co-combustion, different control settings can be applied for both fuels. It is visible that hydrogen consumption increases significantly with decreasing engine speed.
The application of extended analysis, as with the pressure results, did not result in significant differences in the temperature distributions on the nozzle model wall (
Table 8). The differences in this case reach several degrees Kelvin. This means that for these conditions, convection fully describes the temperature changes in the model domain under consideration. For this reason, the presentation of temperature distributions on the nozzle model wall was also omitted.
4. Results of Strength Analysis in the Nozzle
For the assumed rotational speeds, another strength analysis was performed in Ansys Mechanical. According to the assumptions described in the methods section, the temperature distribution in the nozzle was modelled, and strength calculations were performed. The temperature field was approximated based on the obtained distributions,
Figure 9,
Figure 10 and
Figure 11. Maximum temperature values are presented in
Table 8.
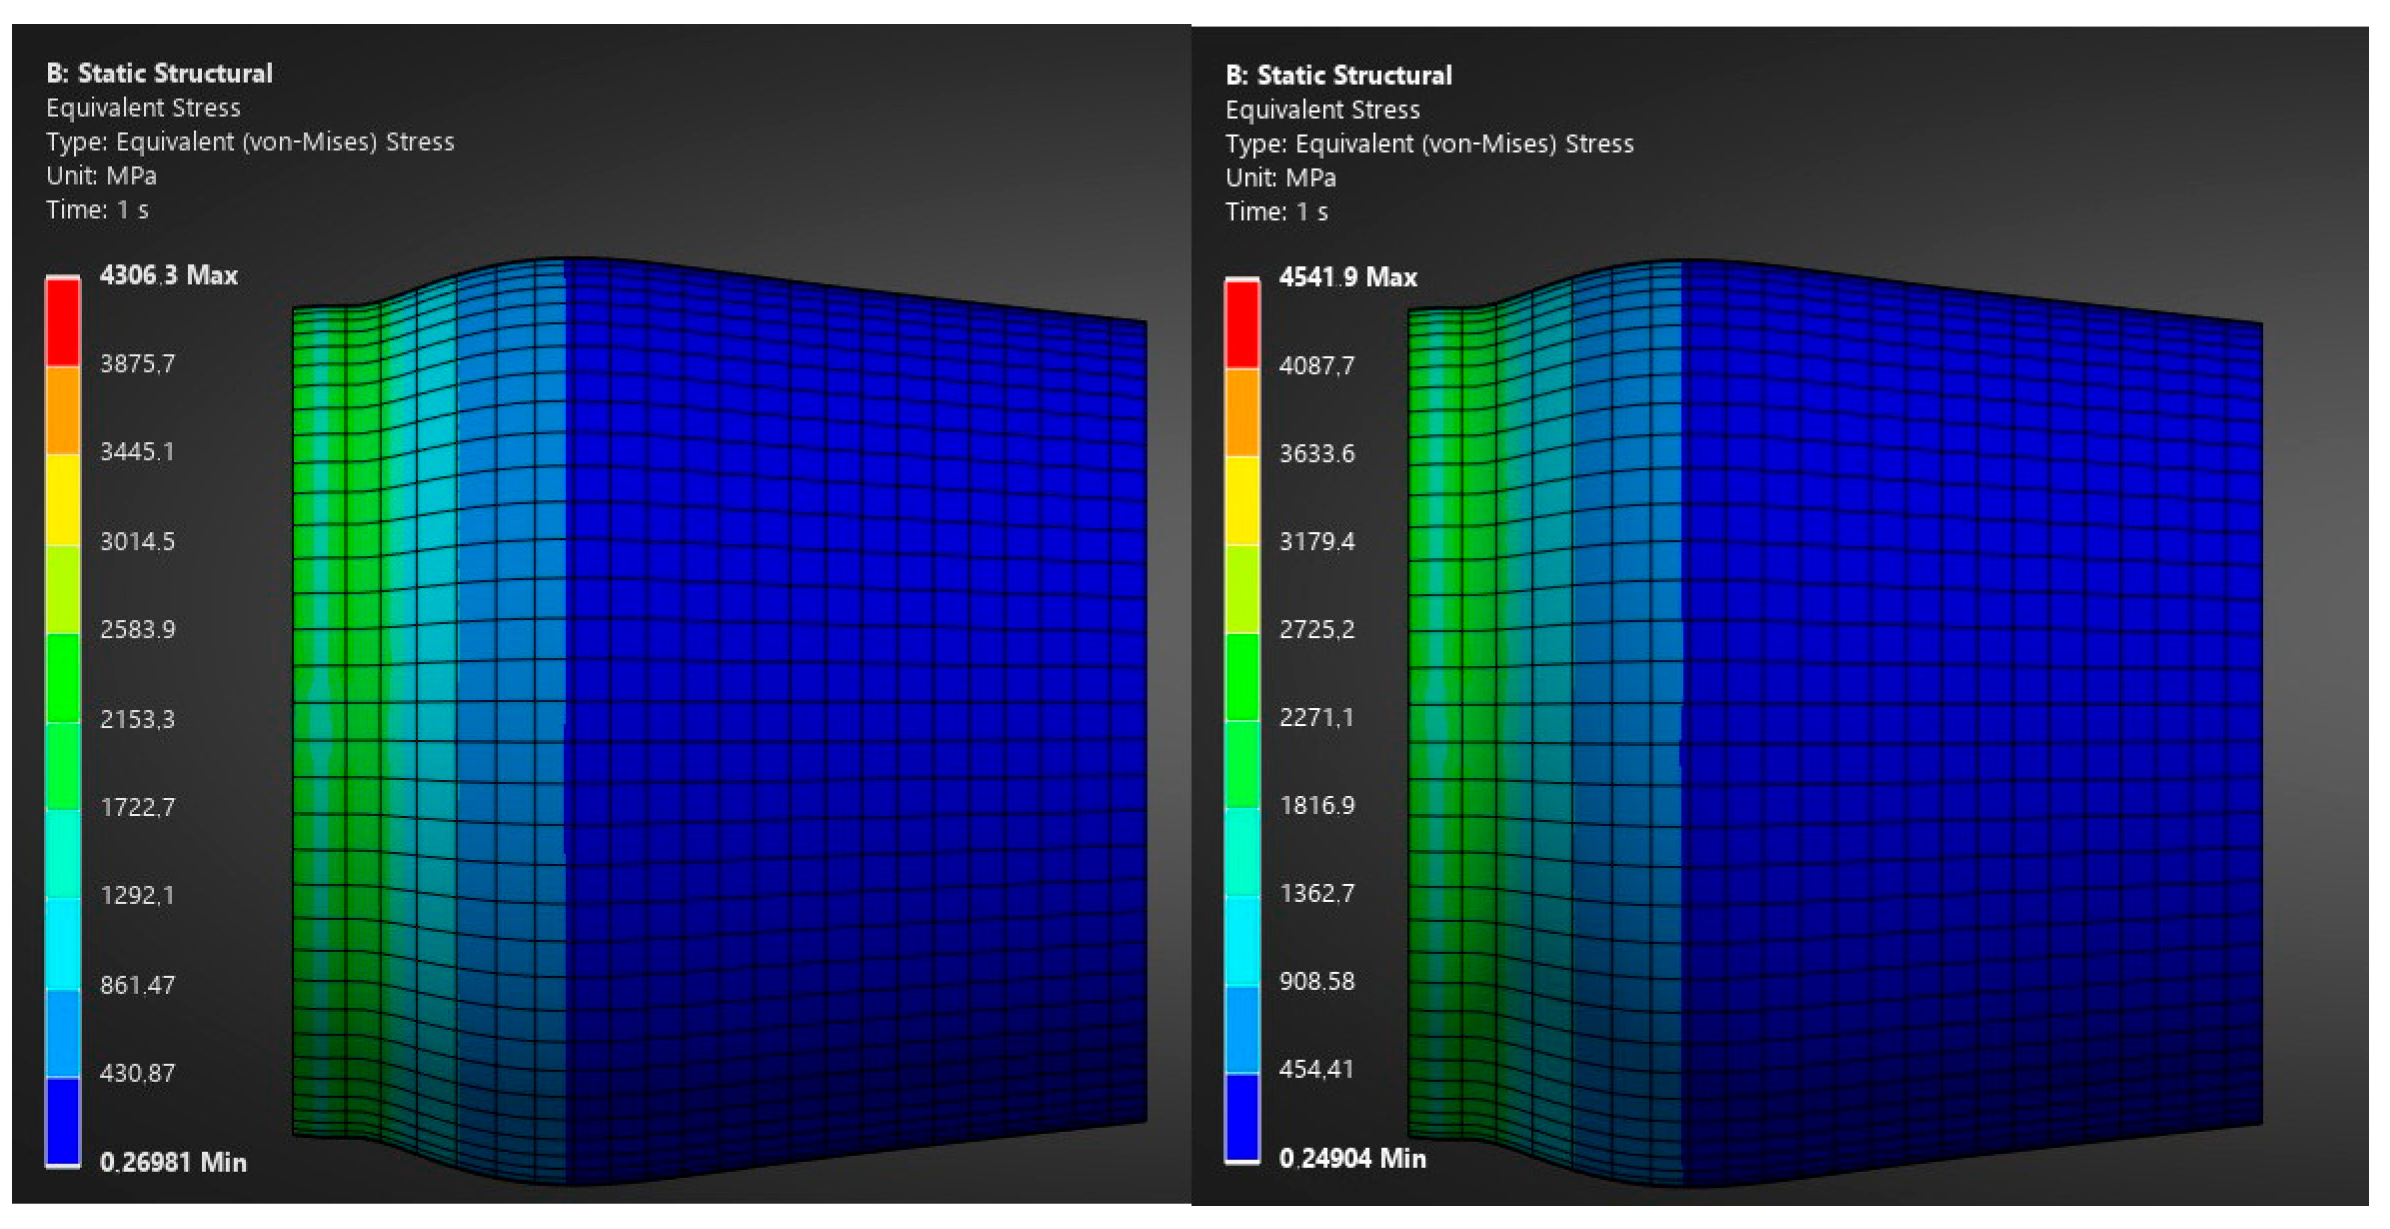
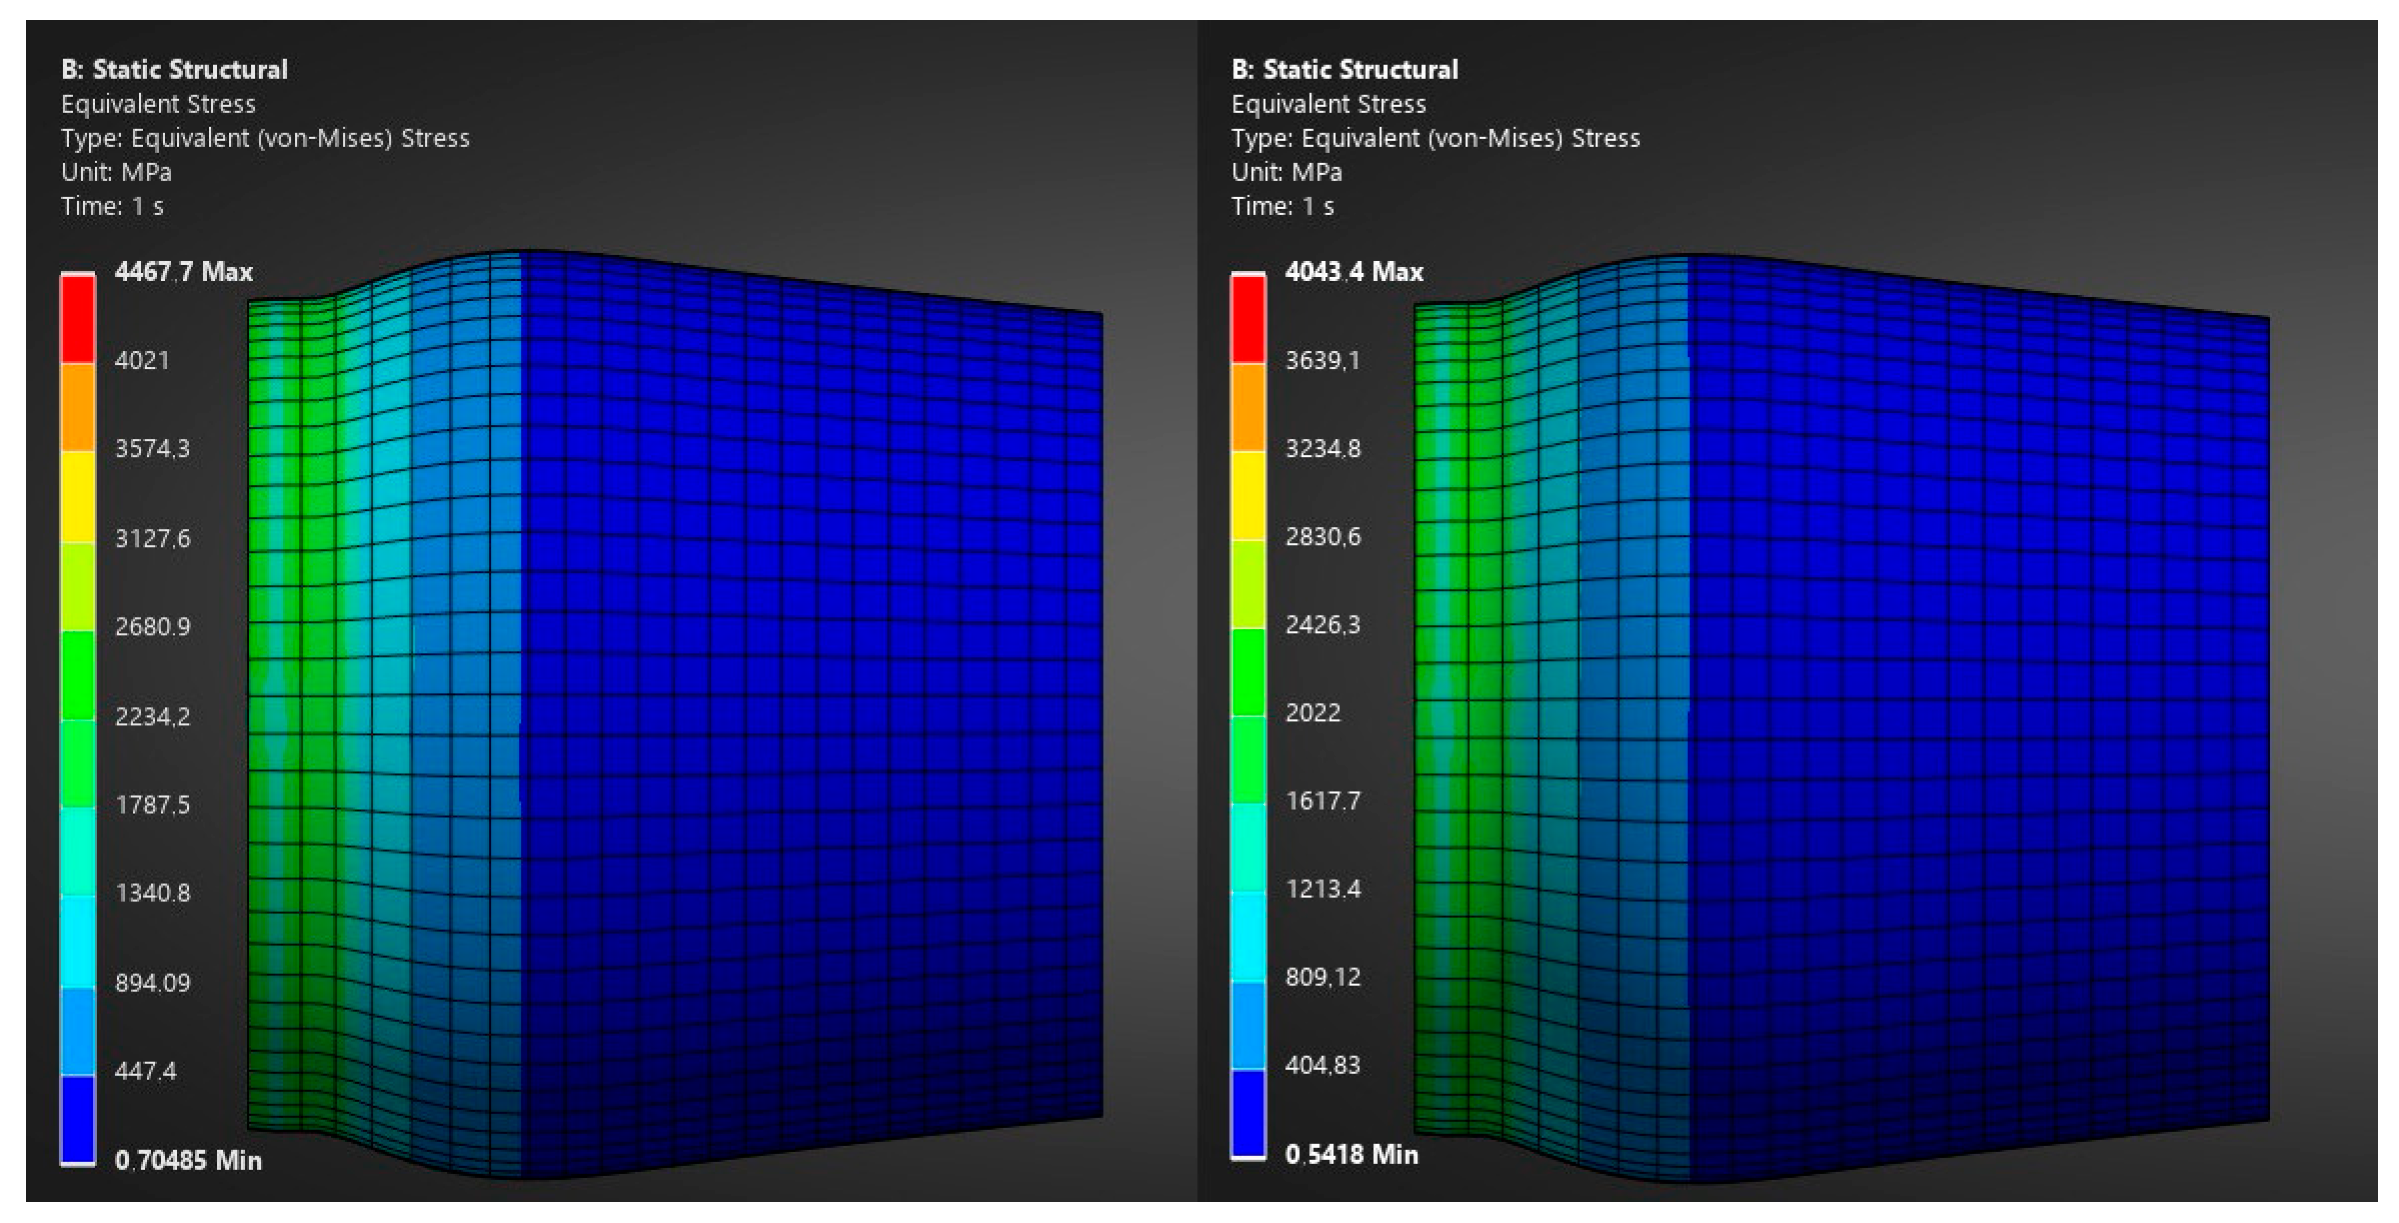
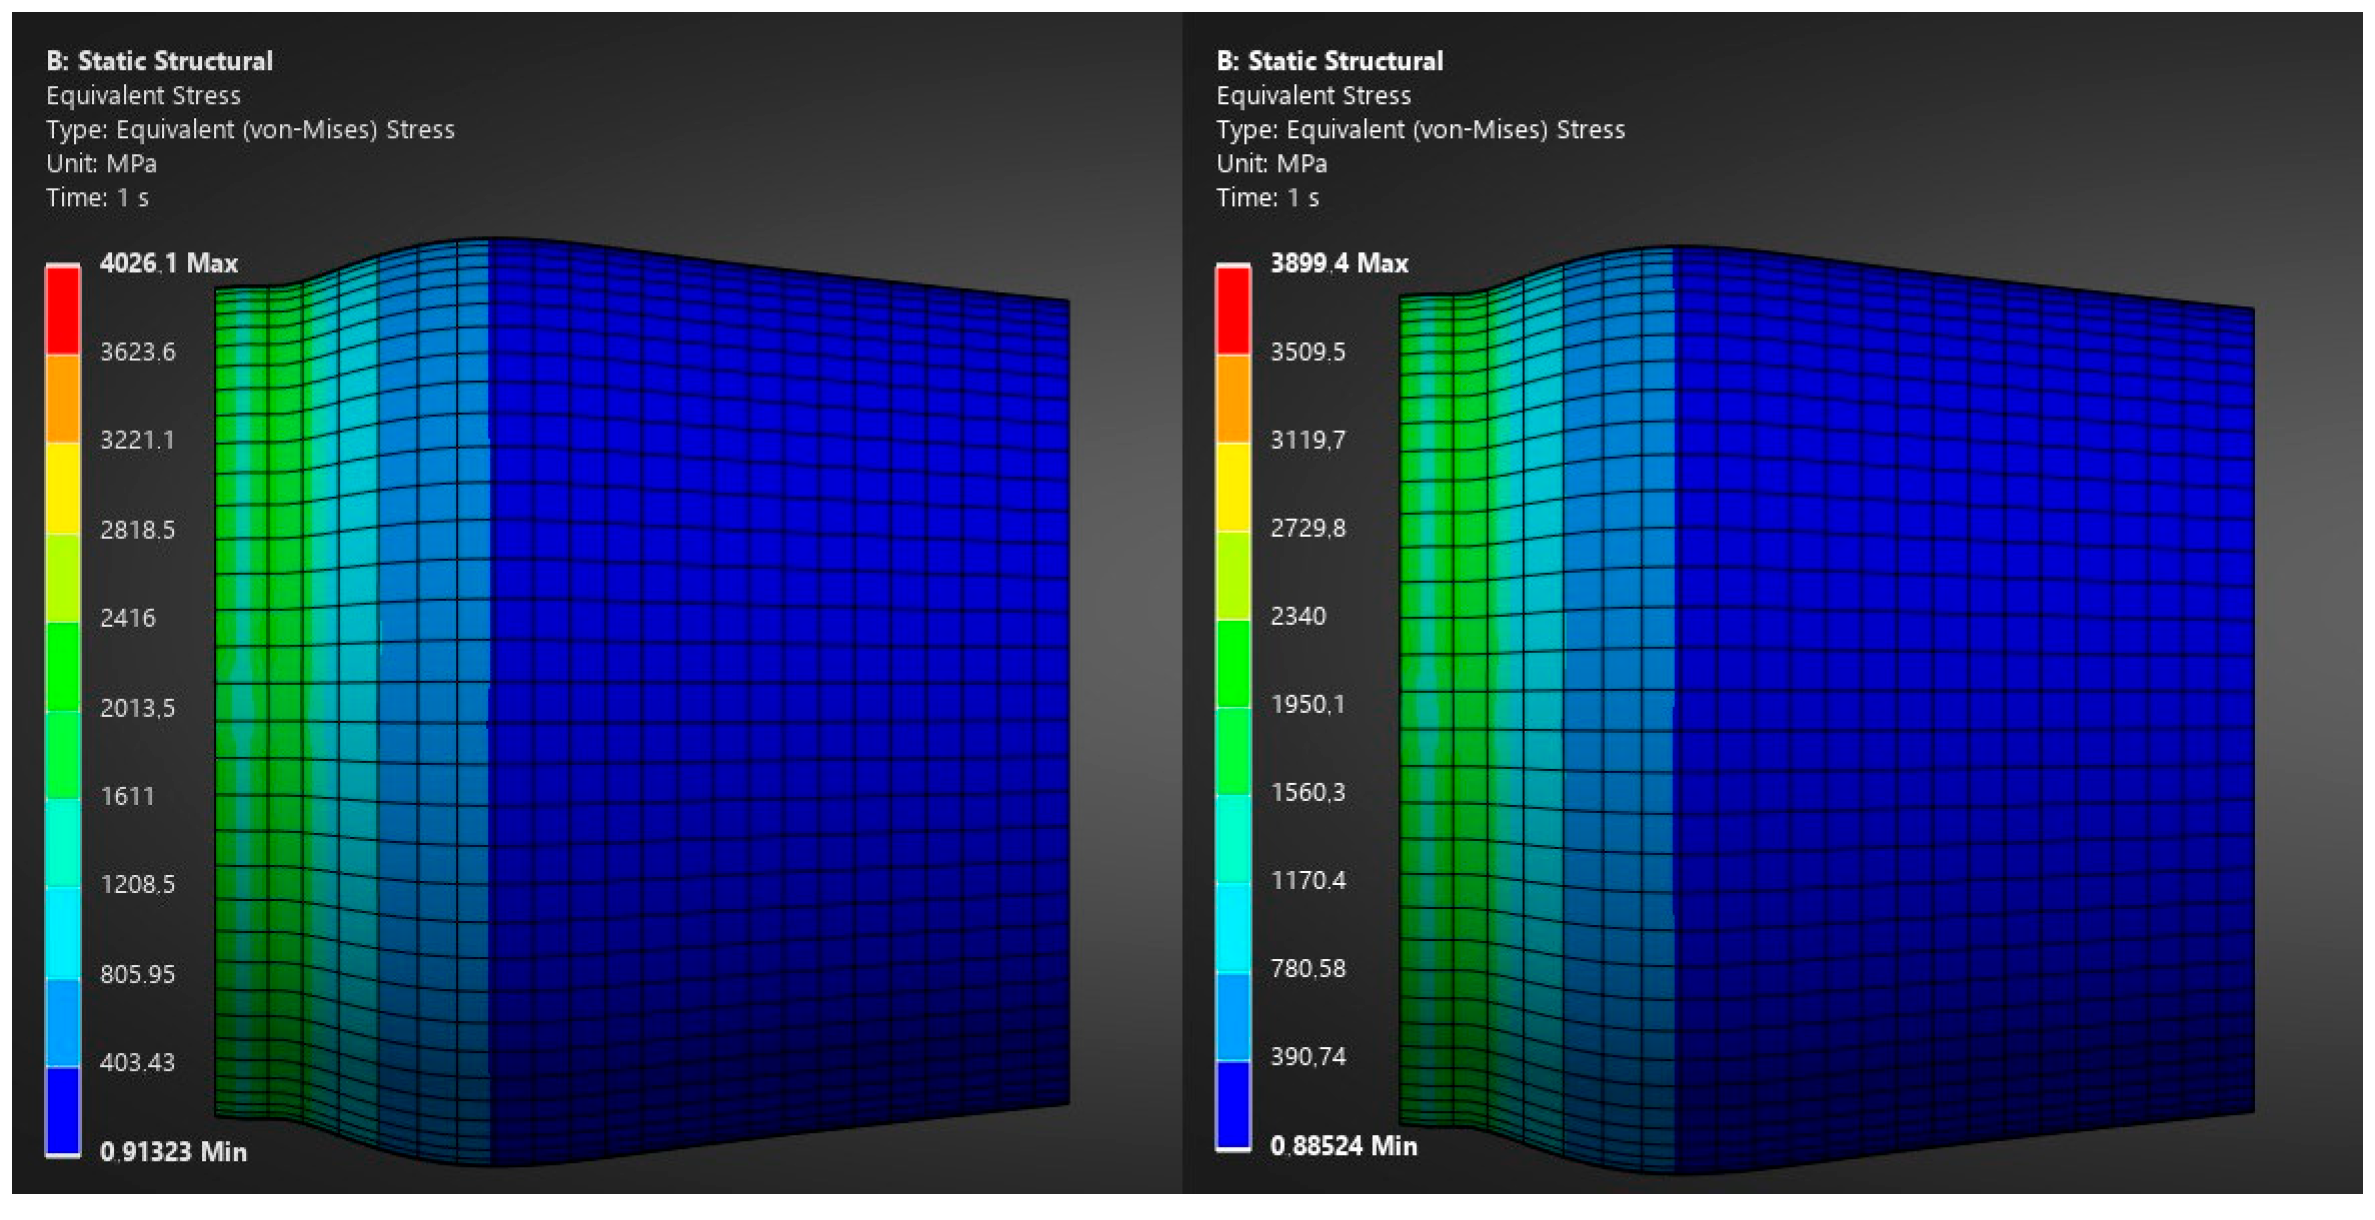
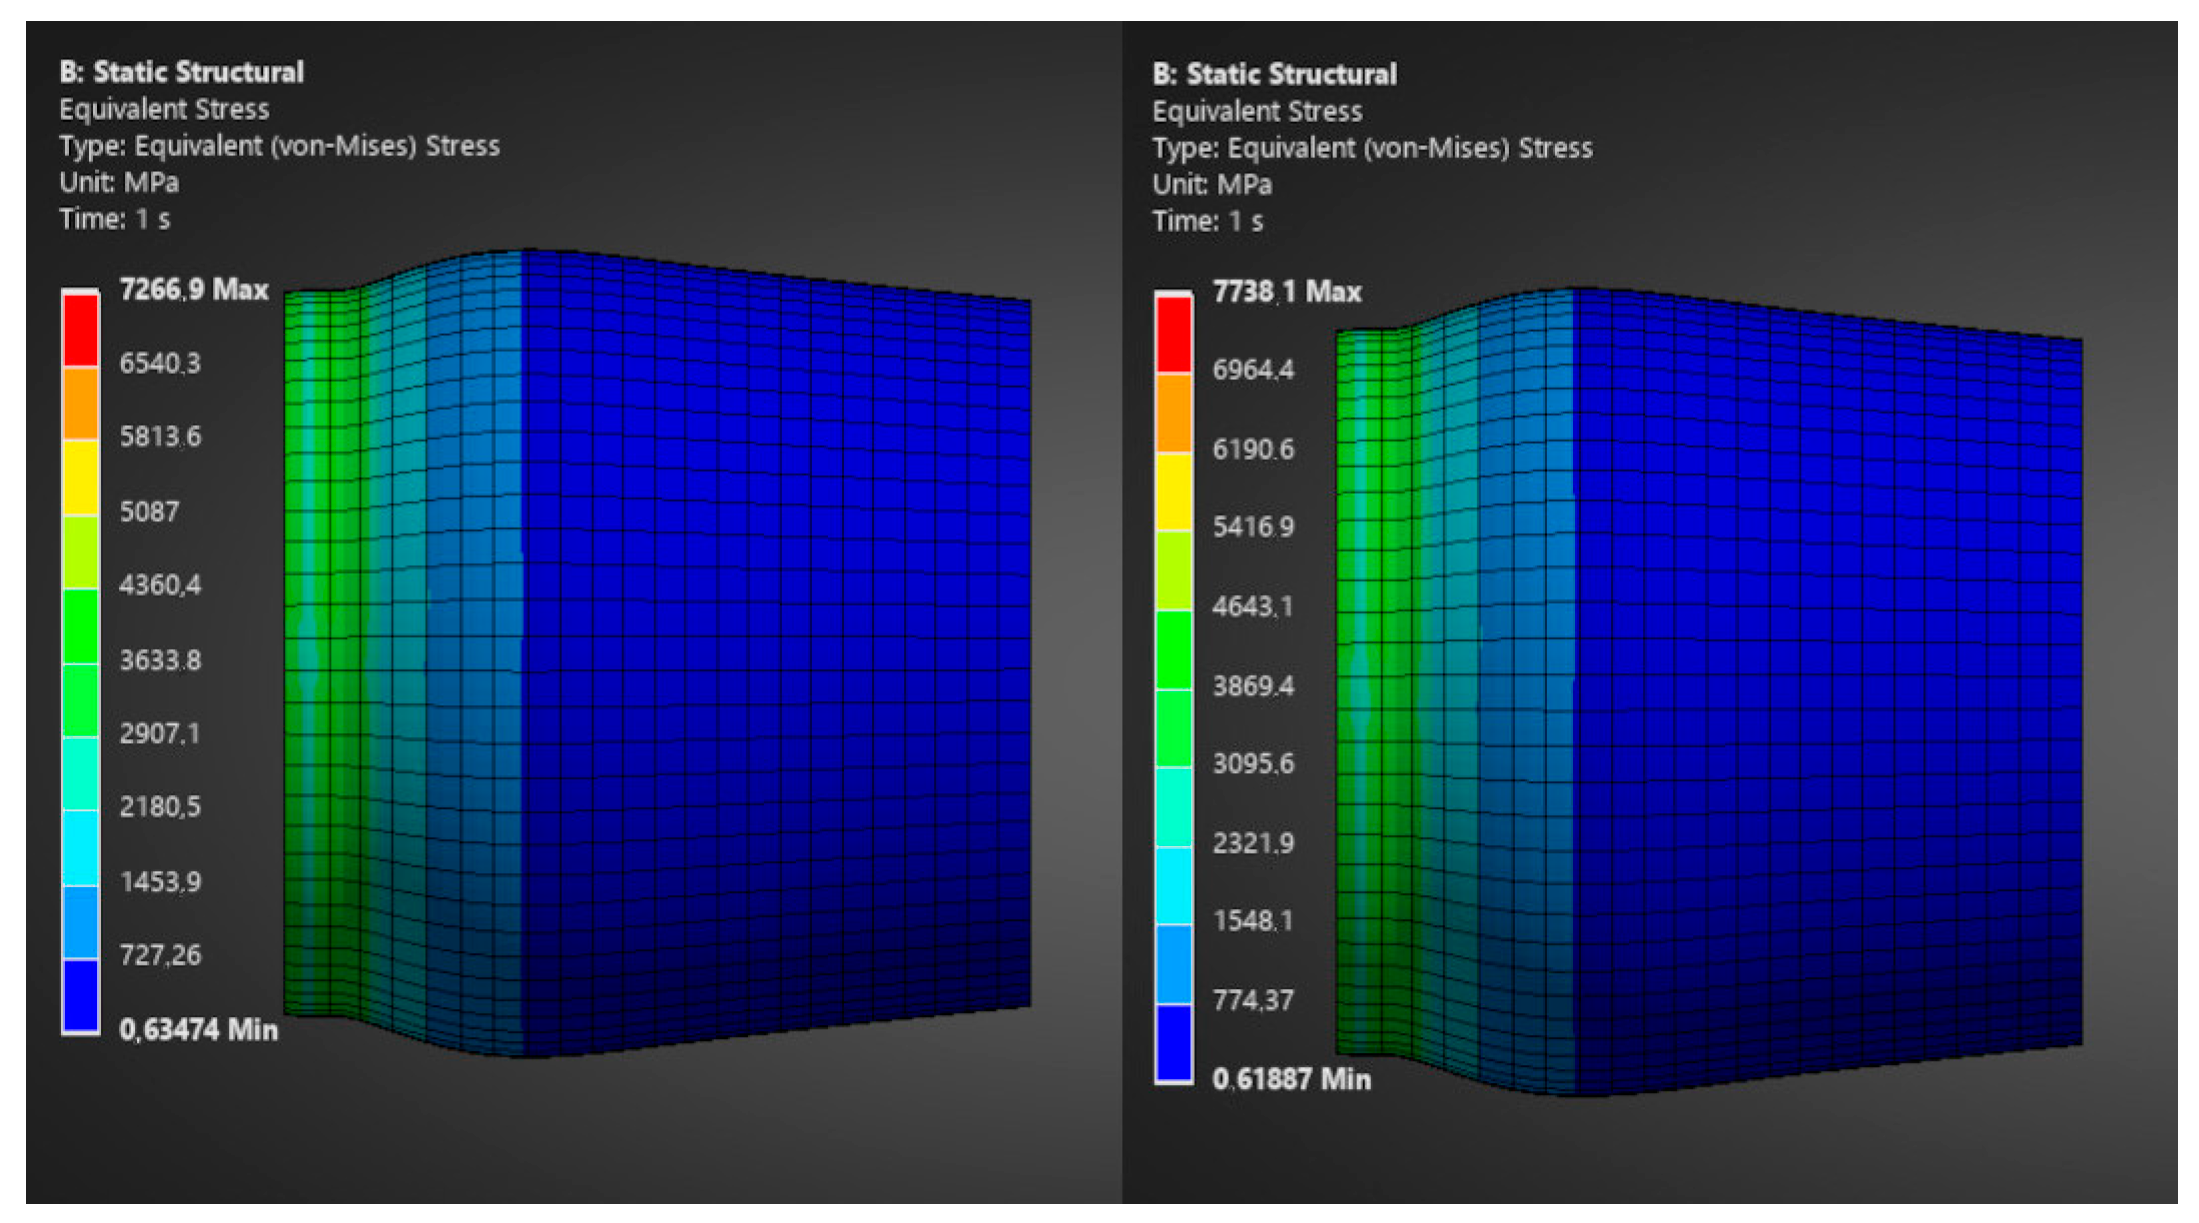
Based on the assumed temperature distribution, the known coefficient of thermal expansion, and the given geometry dimensions, the stresses and strains of the exhaust nozzle model were calculated. The highest stresses in the solid occurred at the highest temperature points and are located near the turbine outlet. In the figures, stress is presented in the form of the equivalent von Mises stress,
Figure 12,
Figure 13 and
Figure 14.
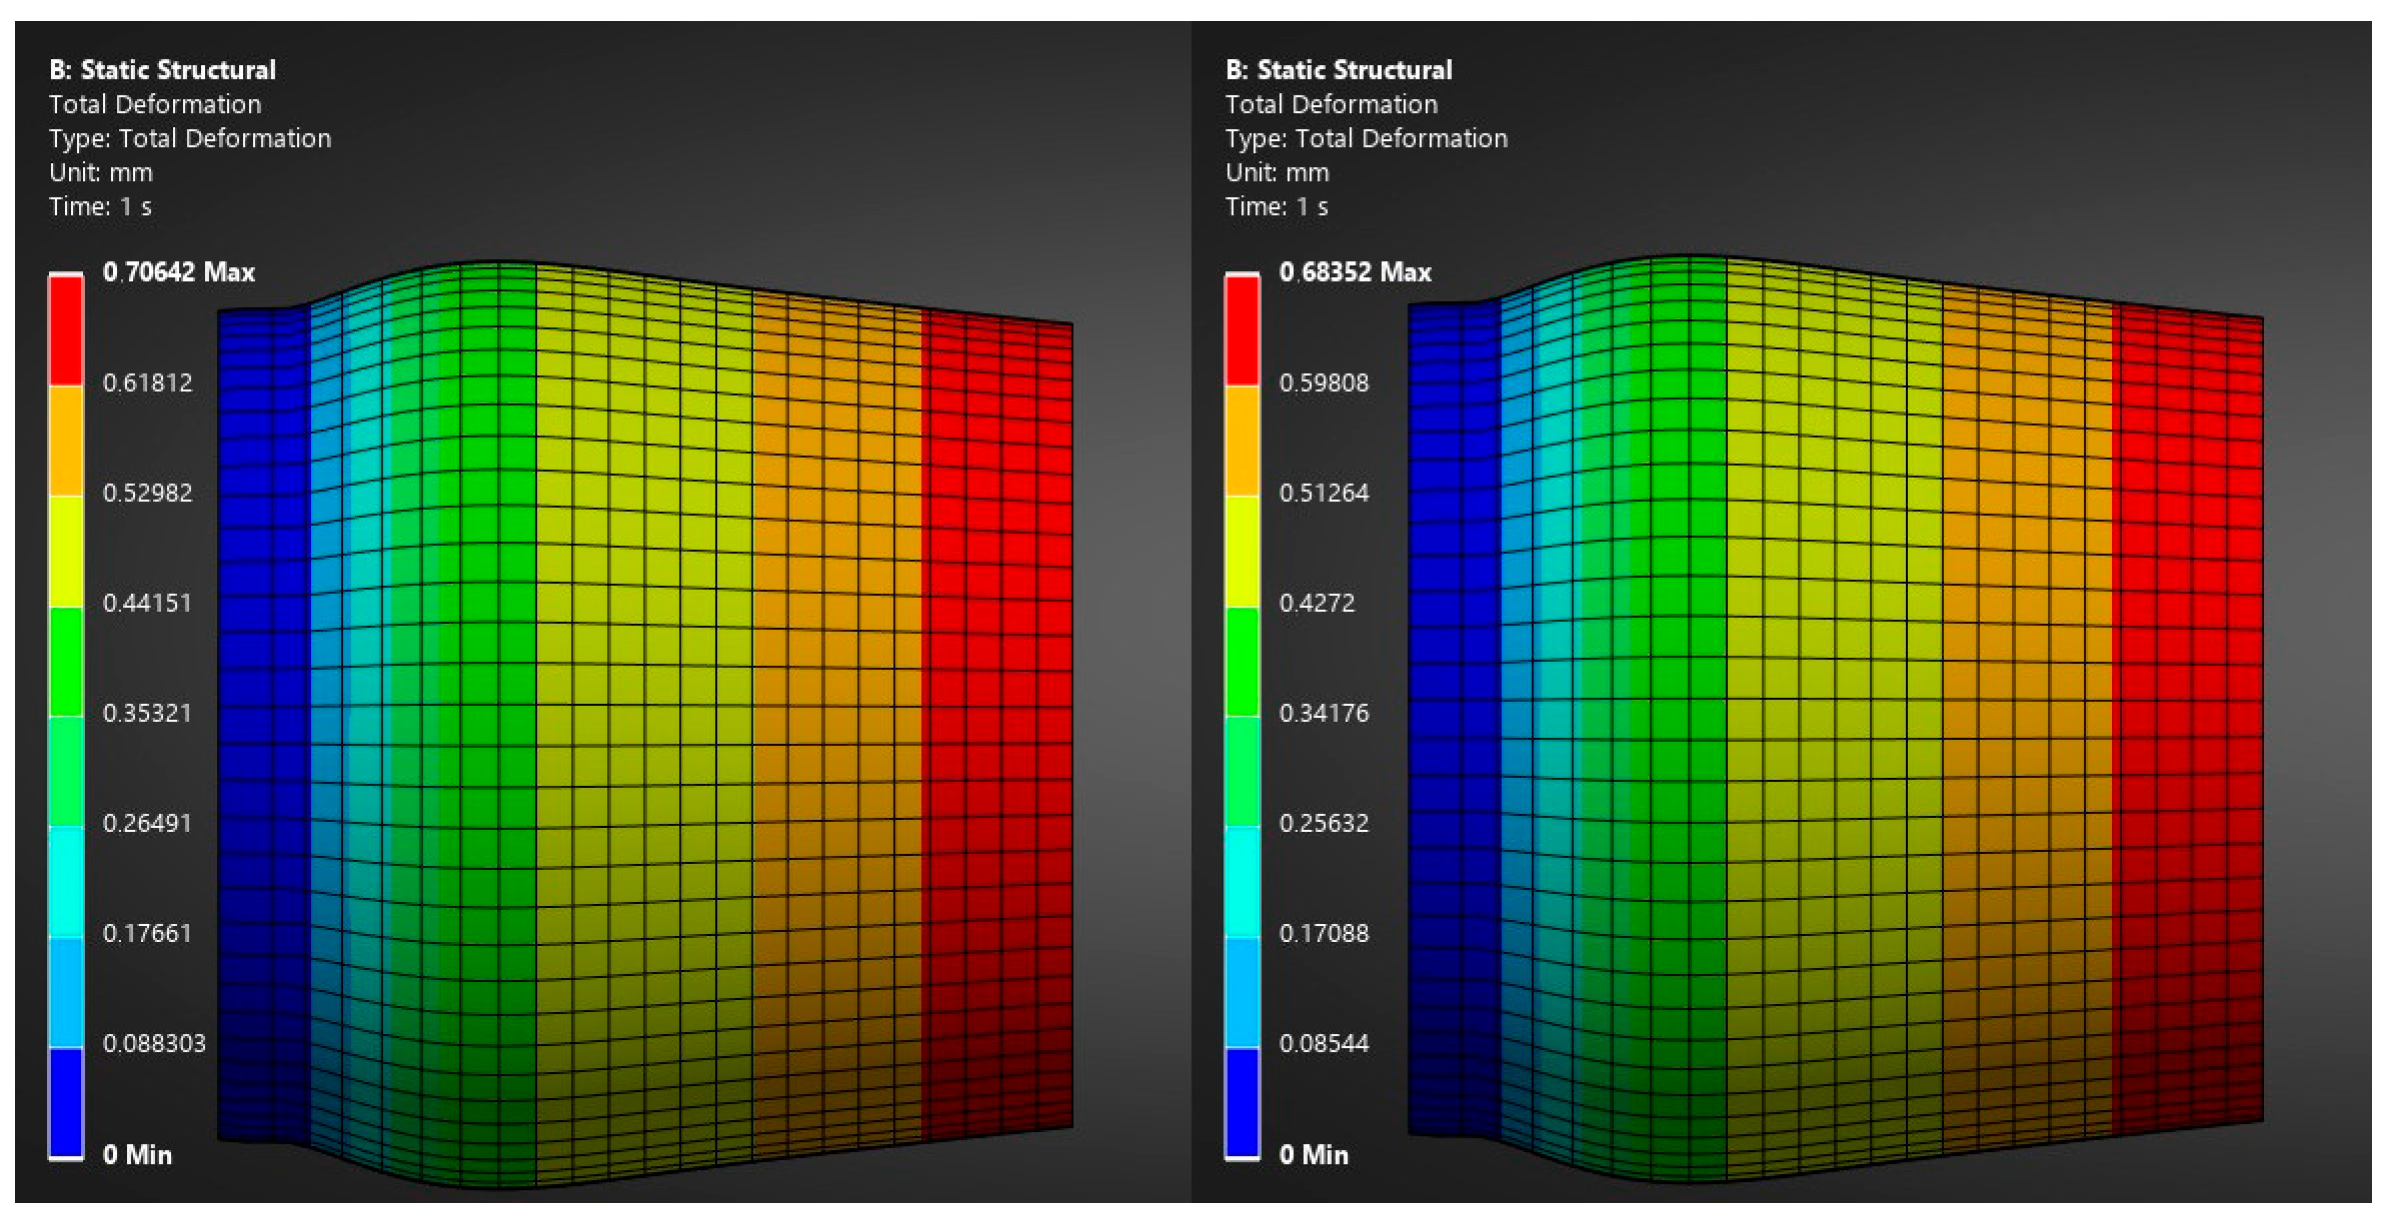
In the nozzle model, the greatest deformation occurs near its outlet cross-section,
Figure 15,
Figure 16 and
Figure 17. As in the previous analyses, the nature of changes during hydrogen and kerosene co-combustion is the same as for kerosene combustion alone. The differences concern the values of the considered rotational speeds. Their magnitudes are not significant, and the deformation distribution is analogous to the stress distribution in the nozzle near the turbine. According to formula (10), the deformation in the unconstrained region changes proportionally to the change in stress at the constraint.
The analysis showed that the maximum stresses in the nozzle model occurred at a rotational speed of 31,630 rpm for kerosene and hydrogen co-combustion and at a speed of 47,110 rpm for kerosene combustion. This stress was approximately 261 MPa. In these same cases, the greatest material deformation occurred, which was less than 0.8 mm. More detailed data on both parameters are provided in
Table 9 and
Table 10.
The extended analysis showed that the maximum stresses that appeared in the nozzle model were 461 MPa. This represents 176.6% of the corresponding value for the basic analysis,
Figure 18. This translated into an increase in deformation, which corresponds to 178.5% of the value obtained in the basic analysis,
Figure 19. Because the maximum temperatures that appeared after the analysis did not exceed the maximum operating temperature, the obtained stress and deformation values are more unsatisfactory and unrealistic. This is primarily because the specified conditions are simplified. First, the set temperature for the flow is the same throughout the cross-section. When significant simplifications are applied, averaged values allow for obtaining results that are closer to those describing the actual phenomena. However, they will not enable a more differentiated presentation of parameter distributions, as would be the case with a larger number of measurement points from the experiment.
