1. Introduction
A literature review shows that many industries, including energy (nuclear, conventional, and renewable), metallurgy, semiconductors, automotive, aerospace, and even medicine, require correct determination of thermal stresses.
In recent years, the finite element method (FEM) has been the most widely described and used method for thermal stress analysis. Tools that also use computational fluid dynamics (CFD) are being improved for determining stresses, including thermal stresses, e.g., in research on additive manufacturing [
1,
2].
Monitoring thermal stress in conventional power generation is important for several reasons. The increasingly rapid development of renewable energy, primarily based on photovoltaics and wind power, characterised by unpredictability in electricity production, is resulting in the need to start up, shut down or change the load of power units more frequently. This, in turn, causes thermo-mechanical fatigue and creep in these units’ equipment components, shortening their lifespan. In addition, older generating units often exceed their design service life. To ensure safe operation of the equipment, it is necessary to monitor the operating conditions of the power plant and assess the remaining service life. Knowledge of thermal stresses is also essential when determining the optimum heating or cooling rate of pressure components [
3], where the condition of not exceeding the permissible stresses must be met.
Much of the work in the field of thermal stress determination concerns nuclear power plants [
4,
5,
6], whose safe operation is particularly important. In [
4,
5], thermal stresses were determined in the corners of pressure vessel nozzles of nuclear reactors. In [
4], this was calculated based on temperature gradients predicted in the cross-section and in [
5], based on simple equations developed to predict the stress intensity factor. In both works, the methods developed were intended to replace FEM for determining thermal stresses due to the high computational costs of FEM in three-dimensional elements. Residual stresses resulting from thermal shocks in pressure components of nuclear power plants are also investigated. For example, in [
6] the relationship between residual stresses and thermal stresses during thermal shock in a nuclear reactor pressure vessel was investigated.
Thermal stresses are also determined in steam turbines [
7,
8,
9]. In [
7], an algorithm was developed to determine stresses in critical turbine components (rotor, shut-off and control valves) and to optimise their start-up. In [
8], thermal stresses were determined in the rotor of combined medium- and high-pressure turbine stages in a common case and compared to stresses in turbine rotors operating in separate cases. In [
9], the existing procedures for starting and stopping steam turbines were evaluated regarding the thermal loads in the high-pressure turbine rotor. Ansys software was used in all studies.
In pressure components, the highest thermal stresses are on the internal surface of the component, being is washed by a working fluid at high pressure and temperature. European Standard EN 12952-3 [
10] and TRD 301 [
11] describe the procedures for determining stresses in thick-walled pressure components. Thermal stresses occurring in thick-walled pressure components not weakened by holes are determined based on the known temperature distribution across the wall thickness. In practice, thick-walled pressure elements have stubs, and the thermal stresses at the edge of the hole made in the shell are much greater. For this location, the thermal stresses calculated for an element not weakened by holes must be multiplied by the stress concentration factor determined based on the heat transfer coefficient on the inner surface [
10], whereby the standard recommends using a constant and specified value for the heat transfer coefficient.
The unsteady temperature distribution and thermal stresses in a thick-walled cylindrical pressure element can be determined by solving a direct heat conduction problem using FEM. An example of such a solution, where the developed model uses the ambient temperature, the external surface temperature and the temperature of the working fluid inside the pipe, is presented in [
12]. A second example, where, in turn, the working fluid temperature measured with a new design thermometer was used in the calculation algorithm and the pipeline was assumed to be thermally insulated, is presented in [
13]. The newly designed thermometer allows for more accurate temperature measurements compared to the classical thermometers used in practice.
Another approach for calculating unsteady thermal stresses in thick-walled components is to determine the temperature distribution using the inverse solution of the heat conduction problem [
14]. The method is based on measuring the temperature at one or more points inside the wall to be analysed. The determination of the temperature distribution in a thermally insulated cylindrical element based on the measurement of the wall temperature at the outer surface is presented by [
15], and near the inner surface is shown by [
16,
17]. This method determines the temperature distribution in the inverse region (between the measurement point and the inner surface) using the finite volume method (FVM).
Inverse methods can also be used to assess the influence of material inhomogeneities on the temperature distribution and stresses occurring in the wall. For example, in [
18], the problem of analysing the temperature and thermal stresses in a multilayered sphere made of a functionally graded material (FGM), when the temperature at the inner surface is unknown, was reduced to an inverse thermoelasticity problem and, using FEM, the temperature distribution in the wall was determined from the known temperature and circumferential strain at the outer surface of the element.
The disadvantage of inverse methods is their sensitivity to random errors in the input data. For example, their impact on the calculation results can be reduced by using regularisation methods such as the Tikhonov method, discrete Fourier transform, energy regularisation method, etc. Research on the stability of inverse problems using selected regularisation methods is presented in articles [
19,
20,
21]. Another effective and simple way to reduce the impact of random errors on the solution of an inverse problem is to smooth the measurement data using digital filters [
22].
The aim of this article is to evaluate the accuracy of the method for determining the unsteady temperature and thermal stresses in a thick-walled cylindrical pressure element weakened by an opening using the inverse method. This method is well known and has been described for cylindrical elements in [
14,
15,
16,
17], while this article investigates the best conditions for its application. It was assumed that the temperature measurement is performed inside the wall of the thermally insulated element; therefore, in the area from the temperature measurement point to the outer surface, the temperature field was determined based on the direct solution of the heat conduction problem, and from the inner surface to the temperature measurement point based on the inverse solution of the heat conduction problem. The inverse problem is solved using the finite volume method (FVM). The accuracy of this method was analysed by determining the most favourable distance of the temperature measurement point from the internal surface, the number of finite volumes (control volumes) in the inverse region, and the time step size. It was performed based on a computational test. For the assumed working fluid temperature rise and heat transfer coefficient on the inner surface of the pipeline with an opening of a specific geometry, the following values were determined: the exact temperature and thermal stress at the inner surface and the “measured data”, i.e., the temperature at a specific distance from the inner surface, which was perturbed by random errors. Based on “measured data” and using the analysed algorithm, the temperature and thermal stresses at the edge of the opening of the inner surface of the element were determined again, and the results were compared with the exact data.
Determining thermal stresses using a tested method has many advantages. It does not require measuring the internal surface temperature, which would be impossible in the case of pressure elements. The actual temperature distribution is calculated across the wall thickness of a thick-walled element, allowing for accurate calculation of the average wall temperature and thermal stresses. The calculation of the heat transfer coefficient on the inner surface of the pressure component does not require the use of Nusselt numbers, which were developed for specific fluid flow conditions and for hydraulically developed flow (due to the fittings and valves used in the pipeline, this condition is sometimes difficult to achieve). The advantage of the described method over others is that it is simple and easy to apply in practice, allows for online calculations and is not computationally expensive (unlike FEM, for example). Although the application of the inverse problem using FVM to determine the temperature distribution in the wall is known [
14,
15,
16,
17], no analysis of the influence of the number of control volumes, the time step and the distance of the measuring point from the inner surface on the accuracy of the calculations has been carried out so far.
2. Determination of Thermal Stress in Pressure Components
The high operating pressure of the working medium used in power plants necessitates the use of thick-walled components. Fatigue analysis may be necessary if pressure parts are subjected to significant variable loads. Examples of variable loads include variable pressures, transient temperature conditions, restrictions on expansion and contraction during normal temperature changes, forced vibrations, or variable external loads. Therefore, one of the necessary steps in fatigue analysis may be determining the thermal stresses caused by temperature differences in the wall. Thermal stresses in pressure components reach their highest values during changes in the load on the device (especially during start-up and shutdown). They are caused by changes in the temperature of the working fluid and, consequently, by uneven temperature distribution across the entire wall thickness.
Calculation procedures for thick-walled pressure components have been standardised, resulting in the European standard EN 12952-3 [
10] and the German standard TRD 301 [
11]. They describe, among other things, the methodology for calculating thermal stresses. These procedures are limited to determining thermal stresses in quasi-steady temperature fields across the thickness of the element wall, which rarely occurs in practice. Furthermore, a parabolic temperature distribution in the wall is assumed, which does not give satisfying results in the case of sudden and rapid temperature changes over time.
The next part of this section describes the determination of total circumferential stresses on the inner surface of a pressure element weakened by an opening, including thermal stresses, using standard [
10]. These equations are commonly used by boiler manufacturers due to their simplicity, despite their approximate nature. However, it is possible to use more complex models to calculate stresses in real time, thanks to the development of Distributed Control Systems (DCS) in power plants.
2.1. Circumferential Thermal and Total Stresses Assuming a Quasi-Steady Temperature Field
On the internal surface of the pressure element, the total circumferential stresses at the edge of the opening (at the P point)
should not exceed the allowable circumferential stresses
[
10]:
This condition forms the basis for determining the permissible heating and cooling rates for thick-walled pressure elements. The total circumferential stresses at the edge of the opening consist of stresses caused by pressure and thermal stresses [
10]:
where
denotes the pressure stress concentration factor,
is the stress caused by pressure,
denotes the thermal stress concentration factor, and
is the thermal stress. Stress caused by both pressure and thermal stress, multiplied by the appropriate concentration factors, occurs at the edge of the opening on the inside of the pressure element. A schematic diagram of a thick-walled pressure component (drum wall) weakened by a hole with the position of point P indicated is shown in
Figure 1.
Circumferential stresses caused by the pressure of the working fluid in a thick-walled element without holes are expressed by the following equation [
10]:
where
is the working fluid pressure,
is the wall thickness, and
is the average radius of the cylindrical pressure element. The radius
is calculated as the arithmetic mean of the inner radius
and the outer radius
of the wall.
Thermal stresses on the internal surface of a cylindrical component are determined by the following formula [
10]:
where
denotes Young’s modulus,
is the coefficient of linear thermal expansion,
is Poisson’s ratio,
denotes the mean temperature across the wall thickness,
is the temperature, and
is the radius.
The mean temperature across the wall thickness of a cylindrical element is determined by the equation:
where
denotes the time variable and
denotes the radial variable.
A quasi-steady state in the wall of a pressure element occurs when the temperature of the working fluid changes at a constant rate and the temperature difference across the wall thickness is constant over time. This means that thermal stresses are also independent of time.
The mean temperature across the wall thickness can be determined by solving Fourier’s heat conduction equation:
where
denotes thermal diffusivity. In a quasi-steady state, where the wall temperature changes at a constant rate
over time, it can be written that:
If it is additionally assumed that heat in the cylindrical wall is transferred only in the radial direction, Fourier’s equation takes the form:
Equation (8) will be solved for a quasi-steady state and a thermally insulated pipeline; therefore, the boundary conditions take the following form:
where
denotes the thermal conductivity coefficient.
Substituting the solution of Equation (8):
into Equation (5) results in:
Next, substituting Equations (11) and (12) into Equation (4) gives [
10]:
where
denotes the shape factor expressed by the equation:
and
.
The pressure stress concentration factor for cylindrical shells is determined using the following formula [
10]:
where
In Equations (16)–(18), is the wall thickness of the stub, is the wall thickness of the shell, is the mean radius of the stub and is the mean radius of the shell.
In turn, the thermal stress concentration factor is determined by the formula [
10]:
where
and
denotes the heat transfer coefficient at the inner surface of the shell.
The analysed case assumes heat transfer in the wall of a cylindrical pressure element only in the radial direction and that the cylindrical element can freely elongate in the axial direction. If heat transfer also occurs in other directions, i.e., circumferential and/or axial, or if the support of the element has changed, the stress concentration factor must be determined using FEM.
The allowable stress
in Equation (1) is determined based on the diagram showing the relationship between the values of stresses destroying a sample of a given material and the number of load cycles of this sample (Wöhler diagram) from [
10]. The procedure described applies to an element that can freely extend and is not affected by significant external forces.
In a quasi-steady state, Equation (1) is sufficiently accurate for determining the permissible heating rates from a cold state. However, when the temperature of the working fluid varies over time, especially during rapid temperature changes, Equation (2) does not give satisfactory results. This occurs when hot water floods the evaporator at the start of the start-up process, in superheated steam temperature controllers when water is injected, or when there is a sudden drop in pressure during a boiler failure. Nevertheless, with time-varying heating or cooling rates of the pressure element, Equation (2) remains valid.
This article focuses on determining transient thermal stresses in a thick-walled element weakened by an opening.
2.2. Unsteady Thermal Stresses in a Cylindrical Element
Transient thermal stresses can be determined using Equation (4), where the temperature distribution as a function of time and space can be achieved by analytical methods or by numerical methods, e.g., FEM or FVM. Using numerical methods, the temperature of the wall is calculated only at discrete points, and the mean temperature is determined using a selected approximation method [
15,
23]. The integral in Equation (3) can be solved, for example, using the trapezoidal rule for
discrete points:
where
is the radius defining the position of node
,
is the temperature at node
, and
is the radial step.
3. Determination of a One-Dimensional Temperature Field in a Cylindrical Wall
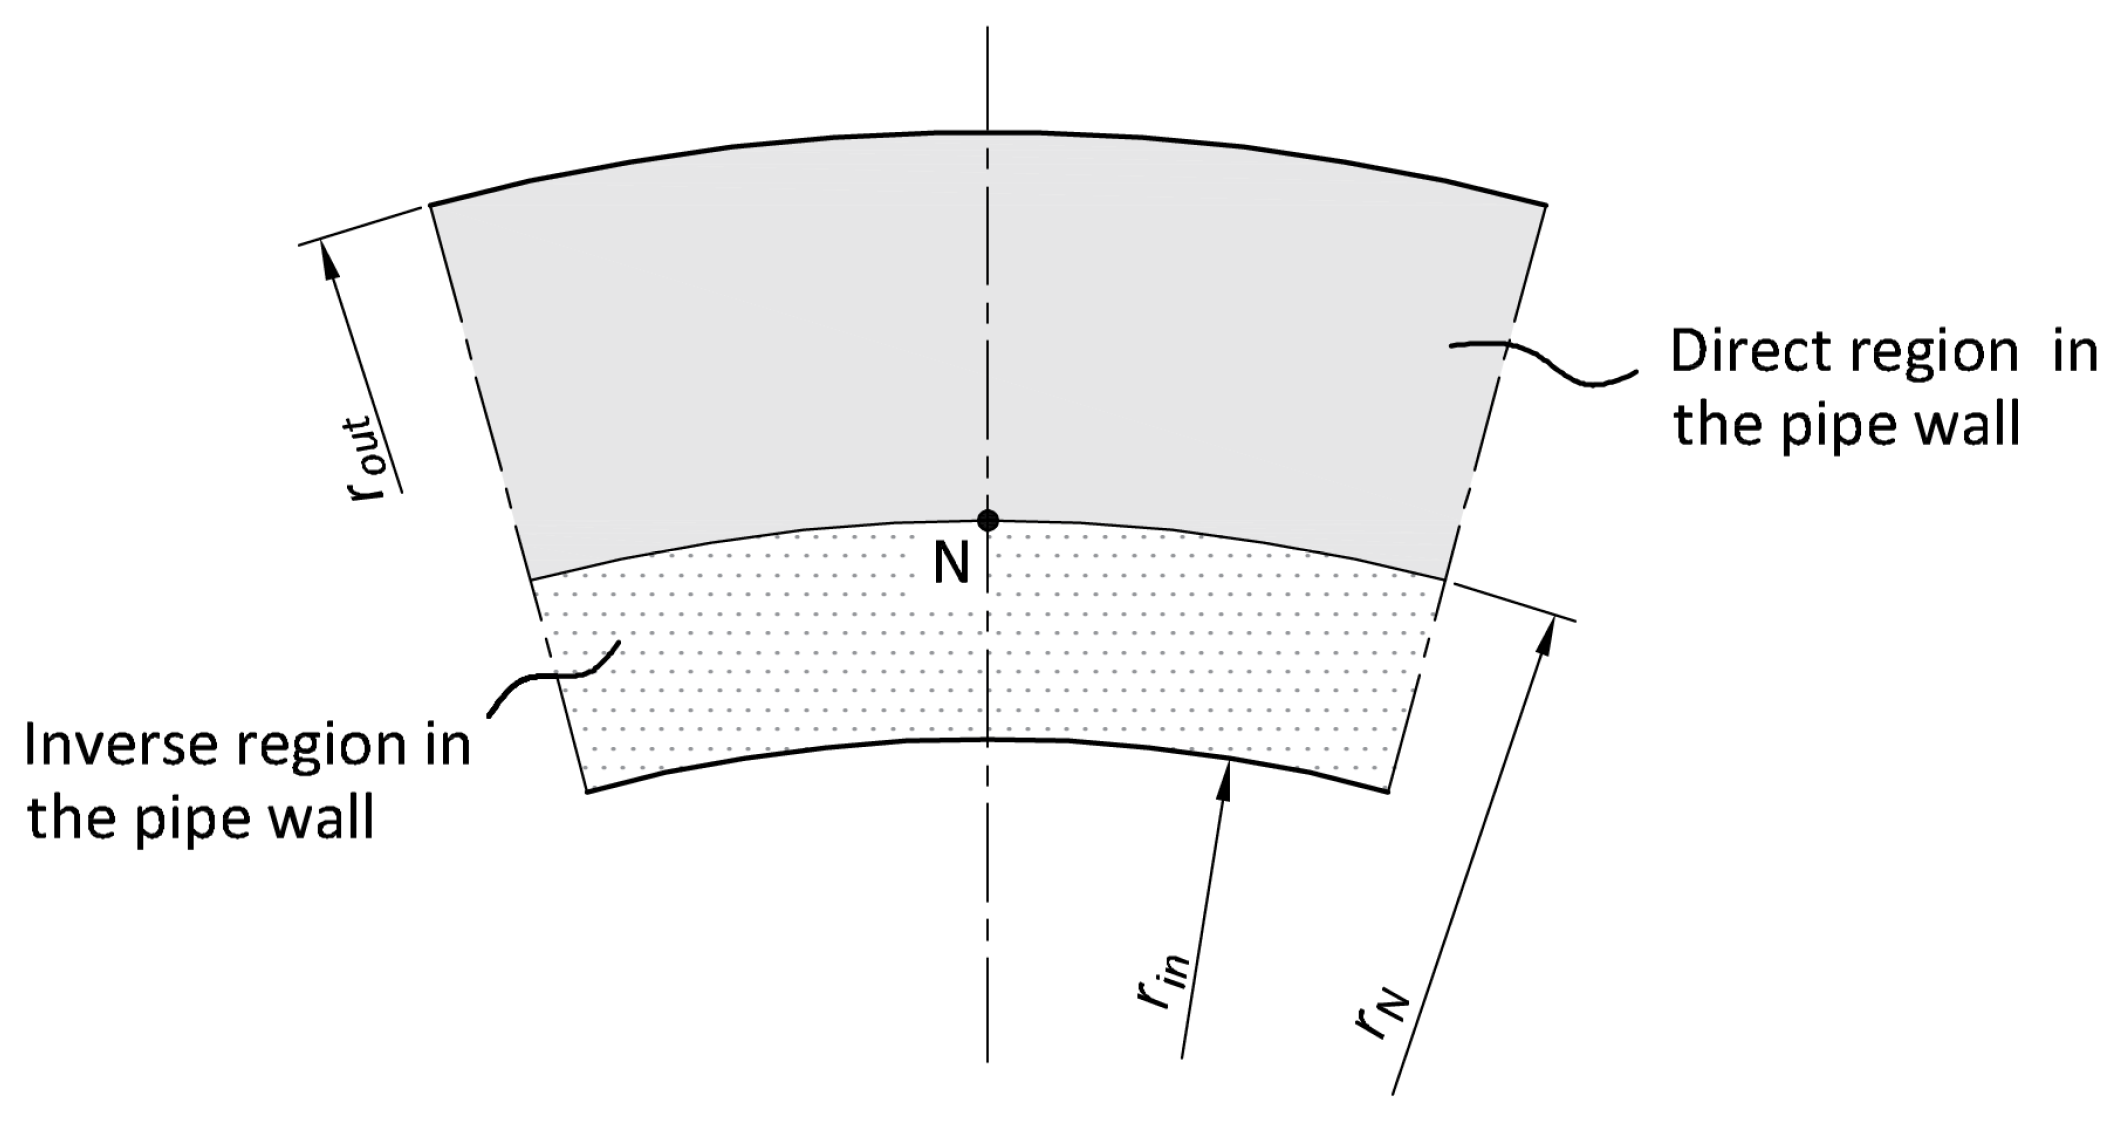
In the case of thick-walled pressure elements, the wall temperature can only be measured inside the wall and/or on its outer surface. In this case, the pipe wall can be divided into a direct and an inverse region (
Figure 2). In
Figure 2, point
indicates the location of the temperature measurement inside the pipeline wall. The unsteady temperature field at the wall thickness is then determined from the solution of the direct and inverse heat conduction problem.
The general formula of the heat conduction equation for anisotropic solids is presented as follows [
24]:
where
denotes the specific heat capacity,
is the density,
is the thermal conductivity tensor, and
is energy generation rate per unit volume.
The solution to the direct heat conduction problem is well known and will not be described in detail here. To solve the inverse problem, the accuracy analysis of which is the subject of this manuscript, the FVM was used [
24]. Assuming that the temperature field is two-dimensional, the physical properties and
are functions of temperature, Equation (22) can be transformed into the following form:
It is assumed that node is located in the centre of the analysed finite volume area surrounded by adjacent finite volumes (in the centre of which node is located). In Equation (22), denotes the heat flux rate transferred from node to node , while denotes the volume of the finite volume with node . This equation allows the temperature distribution to be determined in the case of two-dimensional heat conduction, whereas in the case analysed in this article, it will be used to transfer heat in only one direction (radial).
The proposed solution to the inverse problem is stable and highly accurate if condition [
25]
is satisfied. The Fourier number in Equation (23) is expressed by the formula:
where
denotes the radius at which the temperature is measured inside the wall (at point
), and
denotes the time step.
Nevertheless, this method is sensitive to random temperature measurement errors. To reduce their impact on the calculation results, the temperature measured over time can be smoothed using a selected digital filter [
22]. Digital filters also allow the determination of temperature derivatives over time based on the measured temperature, which is disturbed by random errors.
Detailed Description of the Calculation Algorithm
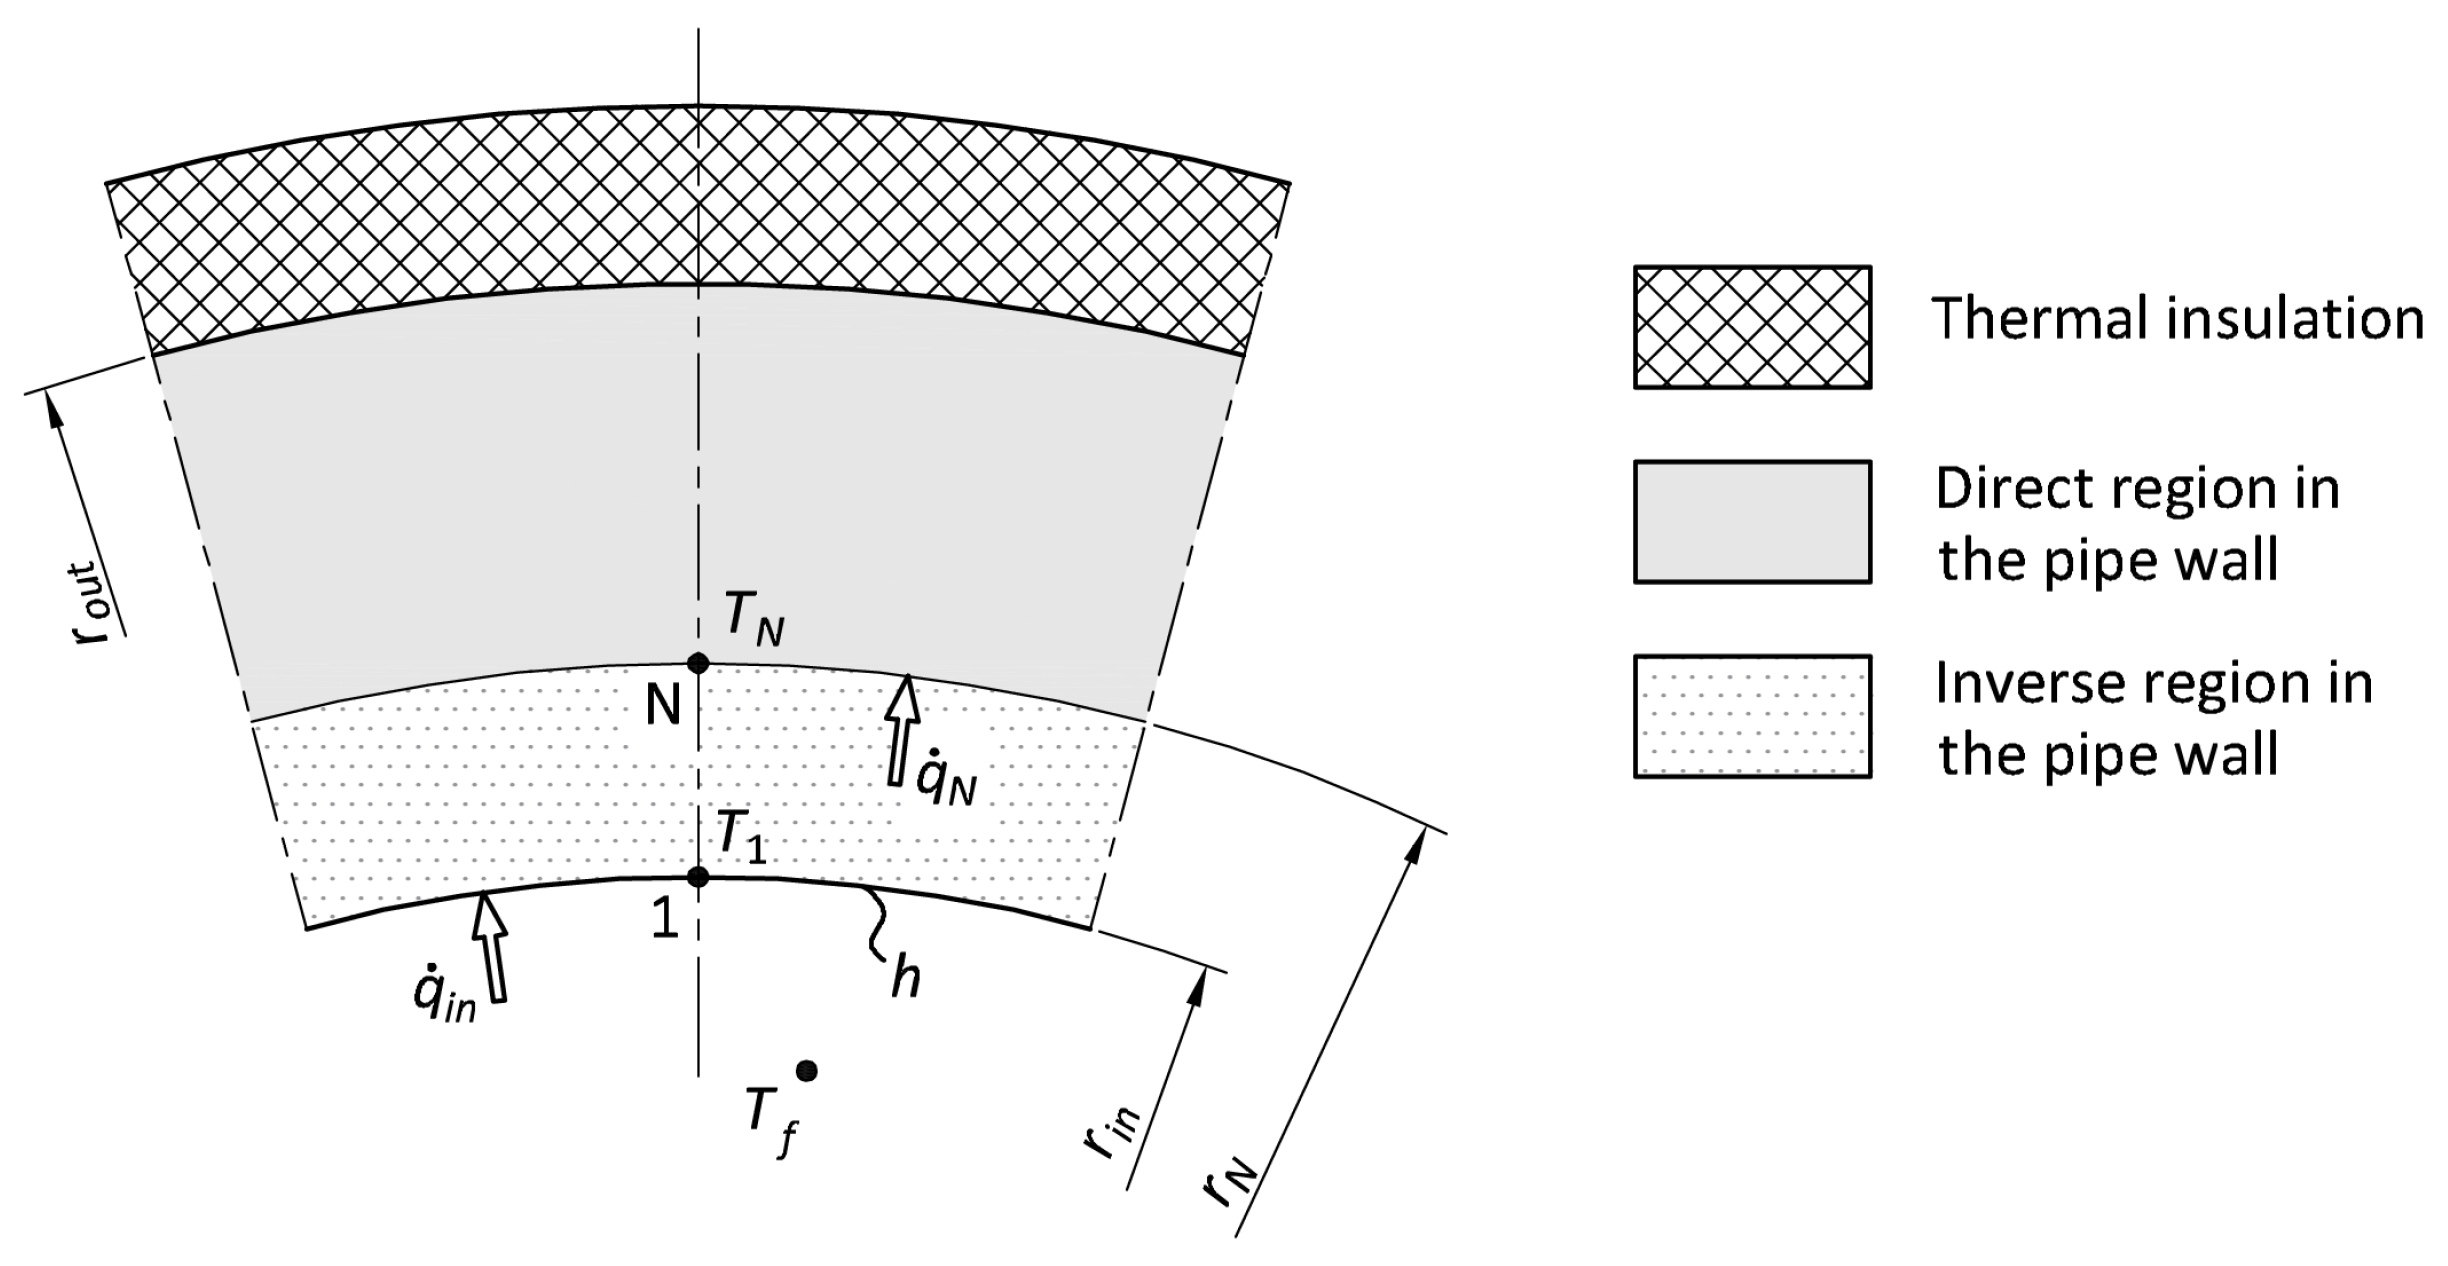
In the presented method, the temperature distribution in the wall of a cylindrical element is determined by a temperature measurement
taken inside the wall at point N (
Figure 3). It is assumed that the pipe is thermally insulated.
The cross-section of the pipeline, as shown in
Figure 3, is divided into a direct and an inverse region, with the boundary between them located at a radius of
.
In the analysed case, it was additionally assumed that the material of the cylindrical element is isotropic, there is no energy generation per unit volume (
), and heat is transferred only in the radial direction. Then, the heat conduction Equation (22) takes the following form [
16,
25]:
First, in the presented method, the heat conduction Equation (26) is solved as a direct problem using boundary conditions:
This allows the temperature distribution in the direct area () and the heat flux density at the boundary between the direct and inverse areas (at point ) to be determined.
Next, it is possible to solve the heat conduction Equation (26) as an inverse problem with boundary conditions defined on the radius
, i.e.,
This solution uses the FVM (Equation (23)), in which temperature derivatives are determined using differential quotients:
The solution to this problem makes it possible to determine the temperature distribution in the inverse region (
).
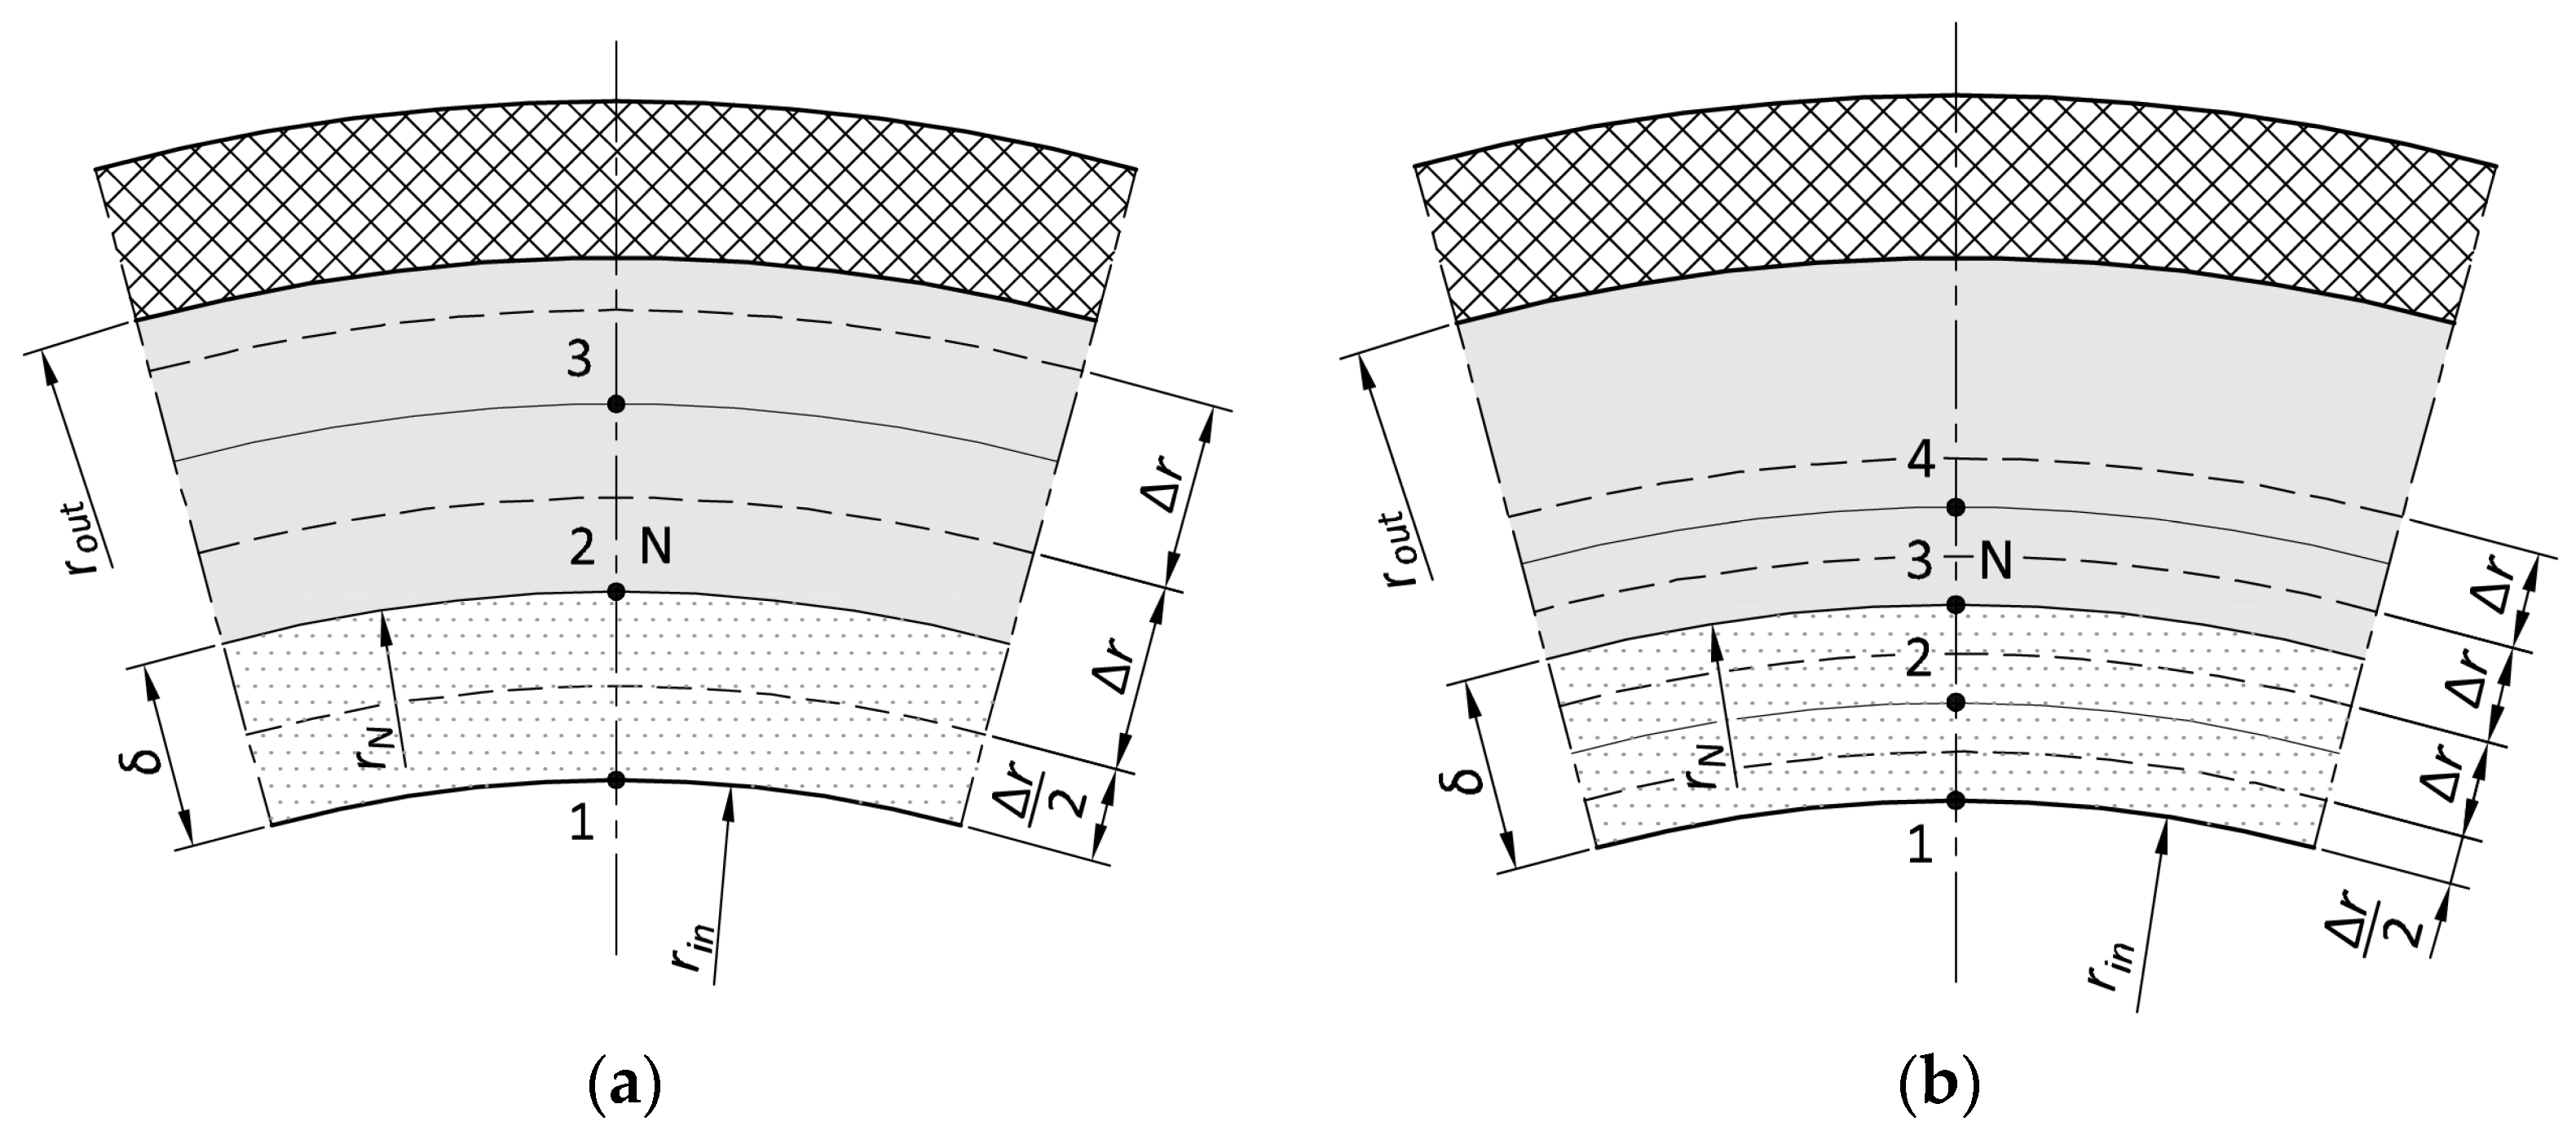
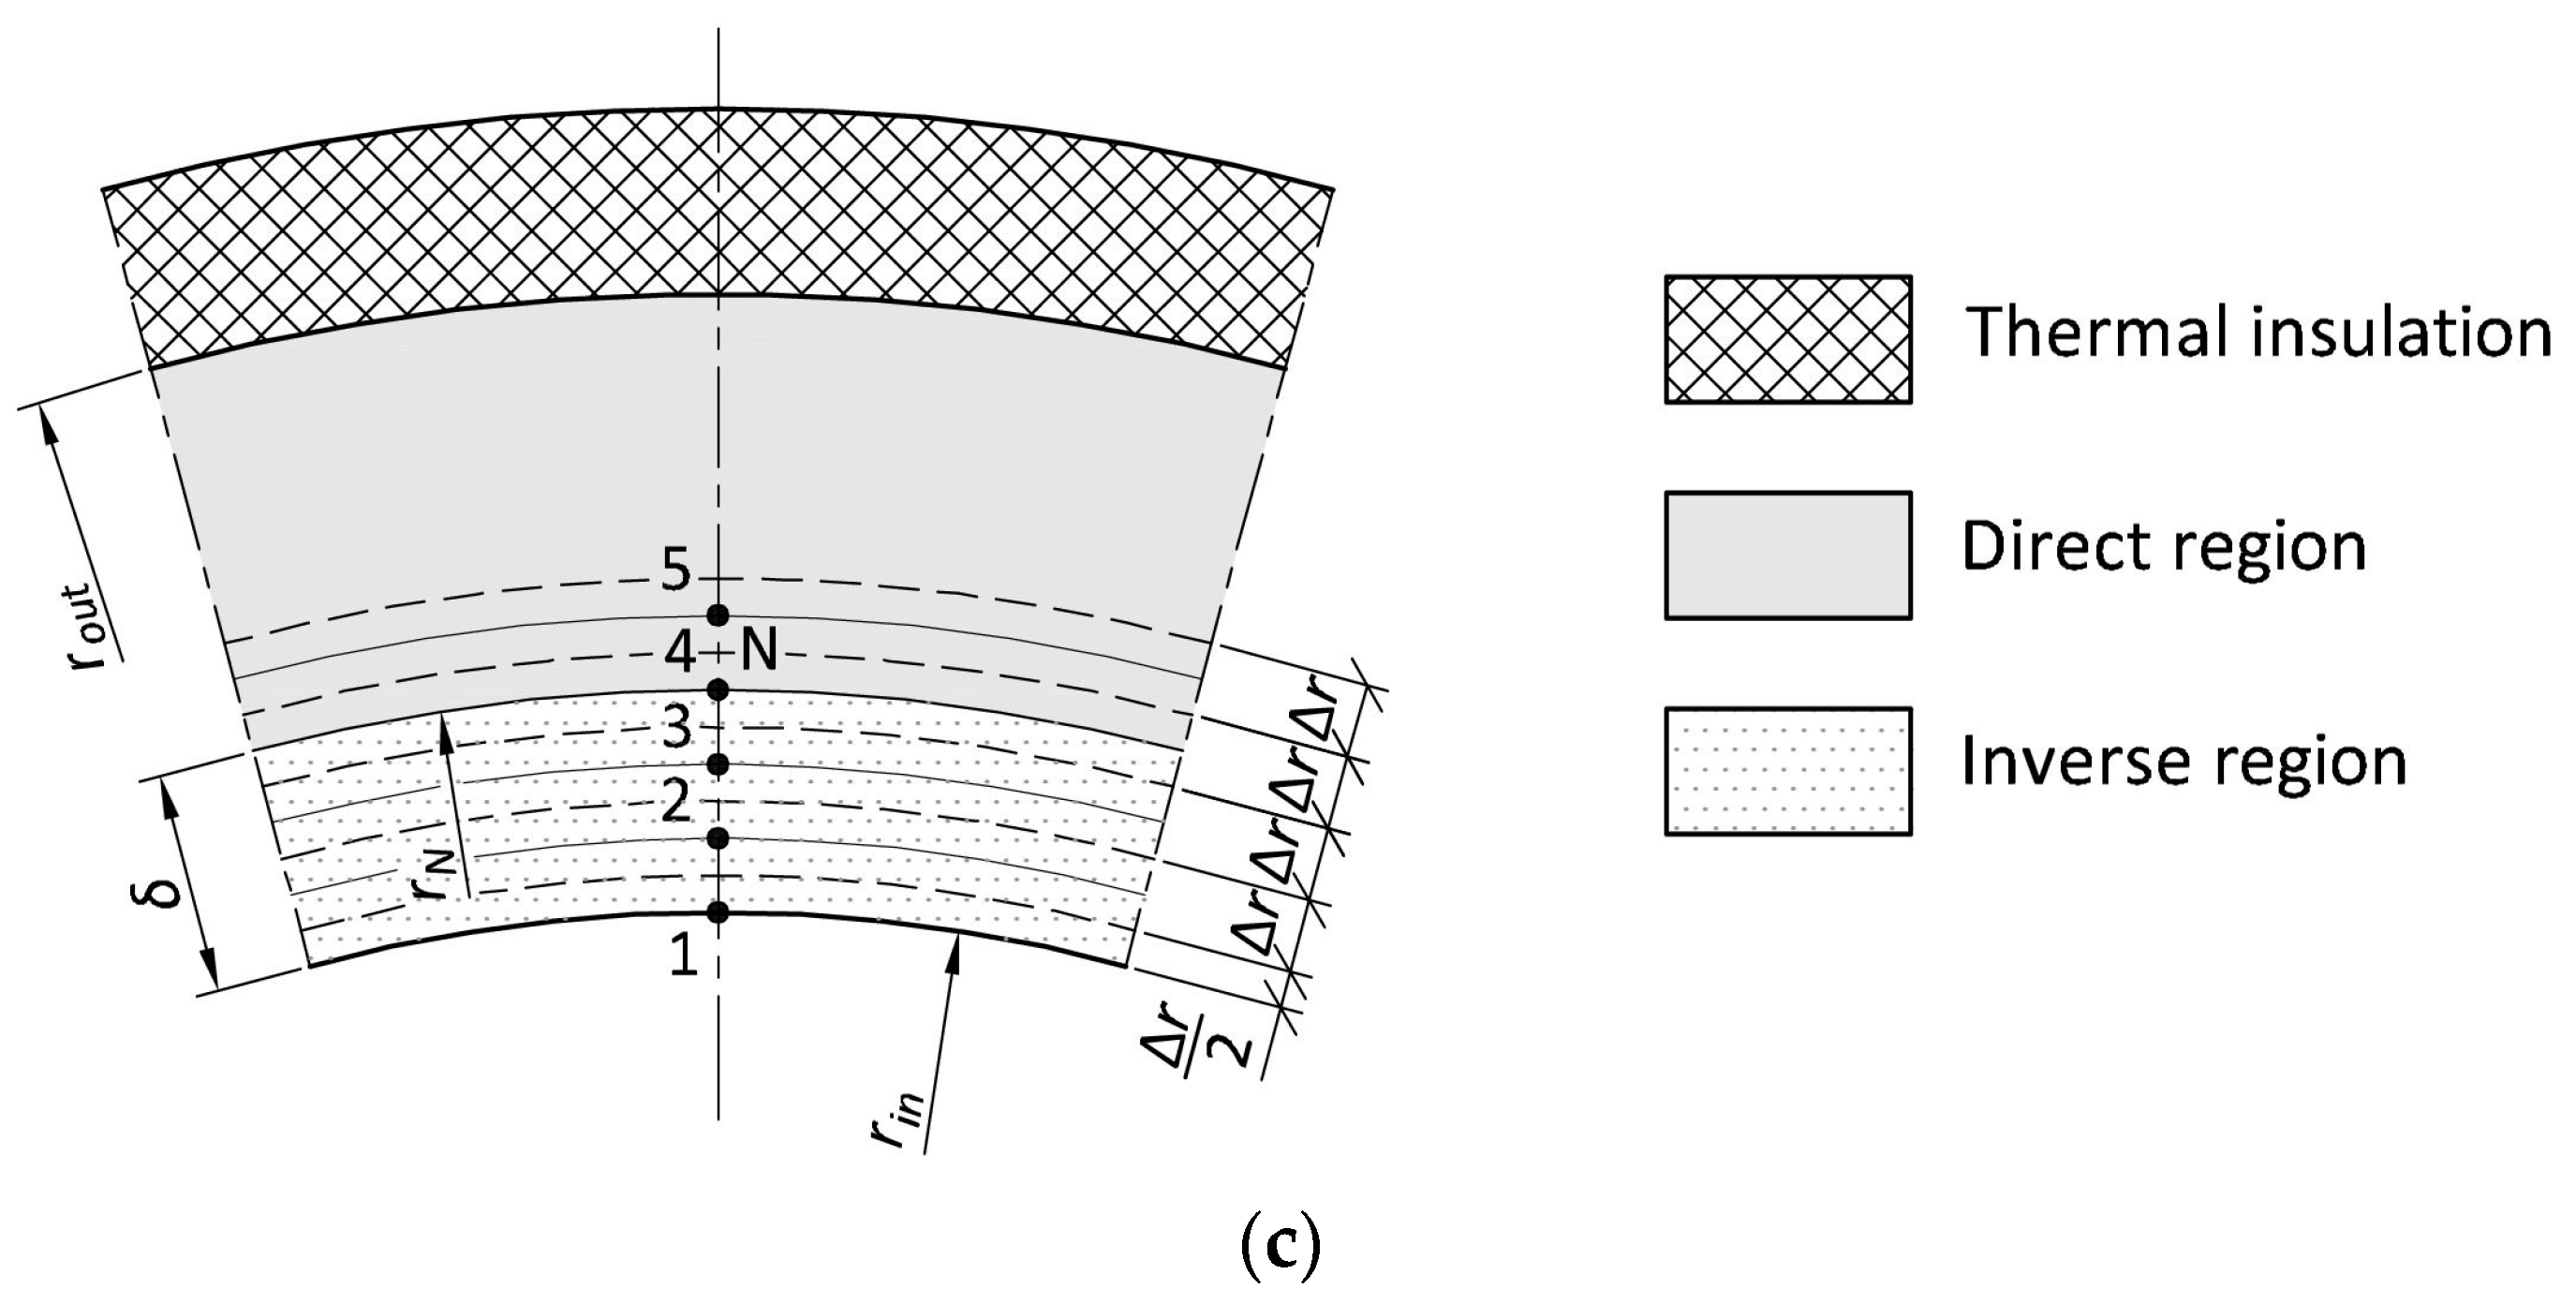
Figure 4 shows the division of the inverse region into finite volumes (three cases with different numbers of finite volumes).
In both the direct and inverse solutions, it was assumed that physical properties, i.e., specific heat , density and thermal conductivity are temperature-dependent.
In the described method, from the energy balance equation for the finite volume in which node N is located, which has the form:
an equation for the temperature at node
is derived:
The energy balance equation for subsequent nodes (in descending order), i.e., from
to
, is as follows:
where
.
Based on this, the formula for the temperature at node
can be determined:
The equation for
(for
) is non-linear, i.e., it contains a heat conduction coefficient
which is unknown. For this reason, iterative calculations are performed, assuming in the first iteration (
) that
is equal to
. The iterations are repeated until the condition:
is met. The tolerance
in condition (36) is approximately 0.00001 K. Of course, the iterative process does not need to be carried out if constant values of physical properties are assumed.
The calculation algorithm is as follows. First, for a given time
, the direct problem is solved to determine the temperature distribution at discrete points on the wall thickness in the area
and the heat flux density
at radius
. Then, marching towards the inner surface, the temperatures are calculated at successive nodes in the inverse area (
). Based on the calculated
and the measured temperature
, the temperature in node
is determined using Equation (33) in an iterative process until condition (36) is satisfied. Based on the calculated
temperature, the
temperature is calculated using Equation (35), again conducting the calculations in
iterations. The procedure for determining the temperatures in the subsequent nodes is repeated until the temperature in node
is determined. At this stage, the algorithm for time
ends and is then repeated for time
and so on. A 9-point digital filter [
22] was used in the calculation algorithm. First, the temperatures (including the temperature at node
, disturbed by random errors) in the direct area, necessary for calculating the heat flux
, were smoothed. Then, the temperatures calculated in the subsequent nodes from
to
in the inverse area were smoothed. The mean temperature across the entire wall thickness for successive time instants can be calculated using Equation (21), which for a wall divided into a direct and an inverse area takes the form:
where
and
is the mean temperature of the inverse and direct area of the wall, respectively.
In order to calculate thermal stresses in a cylindrical element weakened by a hole, it is also necessary to determine the heat transfer coefficient
on its inner surface. In this case, the FVM can also be used. This can be carried out by determining the heat flux on the inner surface of the pipe
and measuring the temperature of the working fluid
. The heat flux density is determined from the energy balance equation for node 1:
from which we obtain:
Then, from the boundary condition:
where
the heat transfer coefficient can be determined:
The heat transfer coefficient is determined as a function of time . In practice, very accurate measurements of the working fluid temperature are necessary to calculate the heat transfer coefficient in this way.
4. Analysis of Algorithm Accuracy Using Computational Tests
The computational validation of the method for determining thermal stresses for a thick-walled cylindrical element weakened by a hole was performed for a steam header with an external diameter of 355 mm and a wall thickness of 50 mm. The header has a stub with an external diameter of 42.4 mm and a wall thickness of 3.2 mm. The pipe is made of P91 steel. Properties of P91 steel as a function of temperature:
The functions of the thermal conductivity coefficient and specific heat capacity with respect to temperature were determined by approximating data taken from [
24]. The coefficient of determination for both determined functions is approximately equal to 1. The density of steel was assumed to be a constant value of
kg/m
3 due to its small variation in the temperature range for which the calculation test was performed.
The calculation test was carried out in such a way that ‘measurement data’ was first generated analytically by solving the direct conduction problem. It was assumed that the pipeline was thermally insulated, the temperature of the working fluid rose suddenly from 20 °C to 170 °C, and the heat transfer coefficient on the surface washed by the fluid was 1500 W/(m2K). For these conditions, temperature profiles over time were determined on the inner and outer surfaces of the pipe and at 49 points inside the wall for time steps of 1, 2, 3, 4 and 5 s. The distances between successive points are the same, i.e., 1 mm. The ‘measurement data’ is the temperature at point located at a distance of 6, 12 or 18 mm from the inner surface, disturbed by random errors with a normal distribution, a mean of zero and a variance of approx. K2 (the exact value depends on the time step and thus the amount of data). The relatively low variance of random errors disturbing the ‘measurement data’ results from the fact that random errors in the measurement of the temperature inside the wall of a thick-walled element are minimal due to the environment in which the thermometer is located and the high thermal inertia of the wall. Besides temperature, the exact thermal stresses on the inner surface of the wall without an opening and weakened by the opening were also calculated.
Next, following the algorithm described in Section Detailed Description of the Calculation Algorithm, the inner surface temperature is determined based on the ‘measured’ temperature at the point in the wall of the thick-walled cylindrical element. In addition, the heat flux, heat transfer coefficient, thermal stresses on the inner surface of the pipe, and thermal stresses at the edge of the opening are determined.
As mentioned, calculations were performed for three different distances of the temperature measurement point
from the internal surface, i.e., 6, 12 and 18 mm. For each of these cases, the inverse region was first split into 2, then into 3, and then into 4 finite volumes. The time steps for which the calculations were carried out are 1, 2, 3, 4, and 5 s.
Figure 4 shows how the inverse region of a cylindrical element is divided into 2, 3 and 4 finite volumes. Due to heat transfer only in the radial direction, the division into finite volumes is only made in the cross-section of the pipe.
The results of the research presented in this manuscript include an analysis of the influence of the number of finite volumes in the inverse area, the distance of the temperature measurement point from the internal surface, and the time step size on the accuracy of the described algorithm and the determination of thermal stresses in elements weakened by an opening.
For the calculated values of temperature, thermal stresses and heat transfer coefficient on the internal surface, root mean square errors were determined, where the exact values of temperature and thermal stresses calculated from the direct heat conduction problem during the generation of ‘measurement data’ were taken as reference values. The equation from which the root mean square error was calculated is as follows:
where
denotes number of measurement points. The general formula for the sum
gives the equation:
where
denotes the exact value and
denotes the value calculated using the presented algorithm. The calculation results are presented in
Table 1 and
Table 2.
The most accurate calculation results were obtained for the case where the measurement point is located at a distance = 6 mm from the inner surface, the time step is 1 s, and the inverse region is divided into two finite volumes. The root mean square error of the internal surface temperature calculation using the described algorithm is 0.365 K, and the error in determining the thermal stresses in the element not weakened by the opening is 1.119 MPa. The root mean square error of thermal stresses at the edge of the opening is also the smallest in this case and amounts to 1.688 MPa, even though for = 6 mm the heat transfer coefficient on the inner surface is determined with the lowest accuracy ( = 208 W/m2K). For a distance of = 12 mm, the smallest root mean square errors were obtained for a time step of 1 s and a division of the inverse region into 4 finite volumes. On the other hand, when the measuring point is located at a distance = 18 mm from the inner surface, the highest accuracy of calculations was obtained for a time step of 1 s and division into 4 finite volumes in the case of temperature, and for a time step of 2 s and division into 4 finite volumes in the case of thermal stresses. It is not possible to determine a rule for the most favourable division into finite volumes for a given time step or a given distance of point from the inner surface.
For the smallest distance of the measuring point from the inner surface, the results of the calculations using the presented algorithm are the most accurate. This is because the surface temperature is reproduced based on the temperature measurement and how it changes at a given time step. The closer the measuring point is to the inner surface, the faster the changes in the measured temperature are recorded and the more accurately it is reproduced on the surface using the solution of the inverse heat conduction problem. For a greater distance of the measuring point from the surface of the element, the thermometer may indicate a change in temperature only after a few or several seconds, despite the change in surface temperature.
The larger the time step for which the calculations are performed, the smaller the root mean square errors of the calculated heat transfer coefficients. When calculating the temperature in successive finite volume nodes towards the inner surface of the inverse area, a random error propagates. The use of a digital filter partially, but not completely, eliminates its influence on the temperature calculation results. The heat transfer coefficient, on the other hand, is determined on the basis of the heat flux calculated from formula (39), where there is a temperature difference between adjacent nodes 2 and 1, which thus reduces the influence of random error. At the same time, in the case of a larger time step, the digital filter better eliminates temperature disturbances caused by random errors that have disturbed the ‘measurement data’. The digital filter used in the algorithm is a 9-point filter, which means that the data is smoothed based on the next 9 temperature values over time, with the smoothed value located at the centre point of the 9-point interval.
The least accurate results were obtained for = 18 mm, a time step of 1 s and division of the inverse area into two finite volumes. Increasing the number of finite volumes in this case increases the accuracy of the calculations of the internal surface temperature and thermal stresses in the pipe wall without holes. Nevertheless, the significant error in determining the heat transfer coefficient and thermal stresses in the element weakened by the hole means that the case where = 18 mm and = 1 s should be rejected entirely. This is because for this distance of the measuring point from the inner surface, condition (24) for stability of the inverse problem solution (which includes the determination of the heat flux density used to calculate the heat transfer coefficient) is satisfied for time steps of 2 s and larger.
It can be seen that the most accurate results of temperature and thermal stress calculations on the inner surface, regardless of the time step, were obtained for a distance = 6 mm.
By analysing the root mean square errors of thermal stresses at the edge of the opening in
Table 2, it can be concluded that slightly larger errors in determining the heat transfer coefficient are acceptable. The criterion for allowing larger errors in determining the heat transfer coefficient should be the accuracy of the calculated thermal stress concentration factor. The reference value of this factor for the analysed case is 1.5056. As already mentioned,
Table 2 shows that the most accurate values of thermal stresses at the edge of the opening for
= 6 mm are obtained for
= 1 s and 2 finite volumes. For this case, the root mean square error of the thermal stress concentration factor is
= 0.0197. For a distance
of 12 mm, the most accurate calculations are for
= 1 s and 4 finite volumes, where
is 0.0461. In contrast, for
= 18 mm, the most favourable case is a division into 4 finite volumes and a time step
of 2 s, where
is 0.08932. Analysis of the remaining results summarised in
Table 2 leads to the conclusion that the root mean square error of the stress concentration factor should not exceed 10% of the reference value.
The thermal stresses at the edge of the opening in the pressure element calculated using the presented algorithm were compared with the stresses obtained using the recommendations of EN 12952-3 [
10]. This standard recommends assuming a constant value for the heat transfer coefficient on the inner surface of the pressure component according to the type of working fluid, i.e.,
= 1000 W/(m
2K) for steam and
= 3000 W/(m
2K) for water. The comparison was made for the most favourable cases in terms of the accuracy of the calculated thermal stresses using a calculation algorithm for the three analysed distances
of 6, 12 and 18 mm. For a distance
of the measuring point
from the inner surface of the pipe of 6 mm,
= 1 s and division into two finite volumes, the root mean square error calculated for thermal stresses at the edge of the opening, where the stress concentration factor is determined in accordance with the standard, is: for steam
= 4.619 MPa, and for water
= 7.497 MPa. For a distance
of 12 mm,
= 1 s and division into 4 finite volumes, these errors are:
= 4.864 MPa and
= 7.625 MPa. In contrast, for
= 18 mm,
= 2 s and division into 4 finite volumes:
= 7.391 MPa and
= 6.895 MPa. In all cases, regardless of the location of the measurement point, the calculations of thermal stresses in the element weakened by the opening are more accurate when using the algorithm presented in the manuscript than those performed in accordance with the recommendations of EN 12952-3.
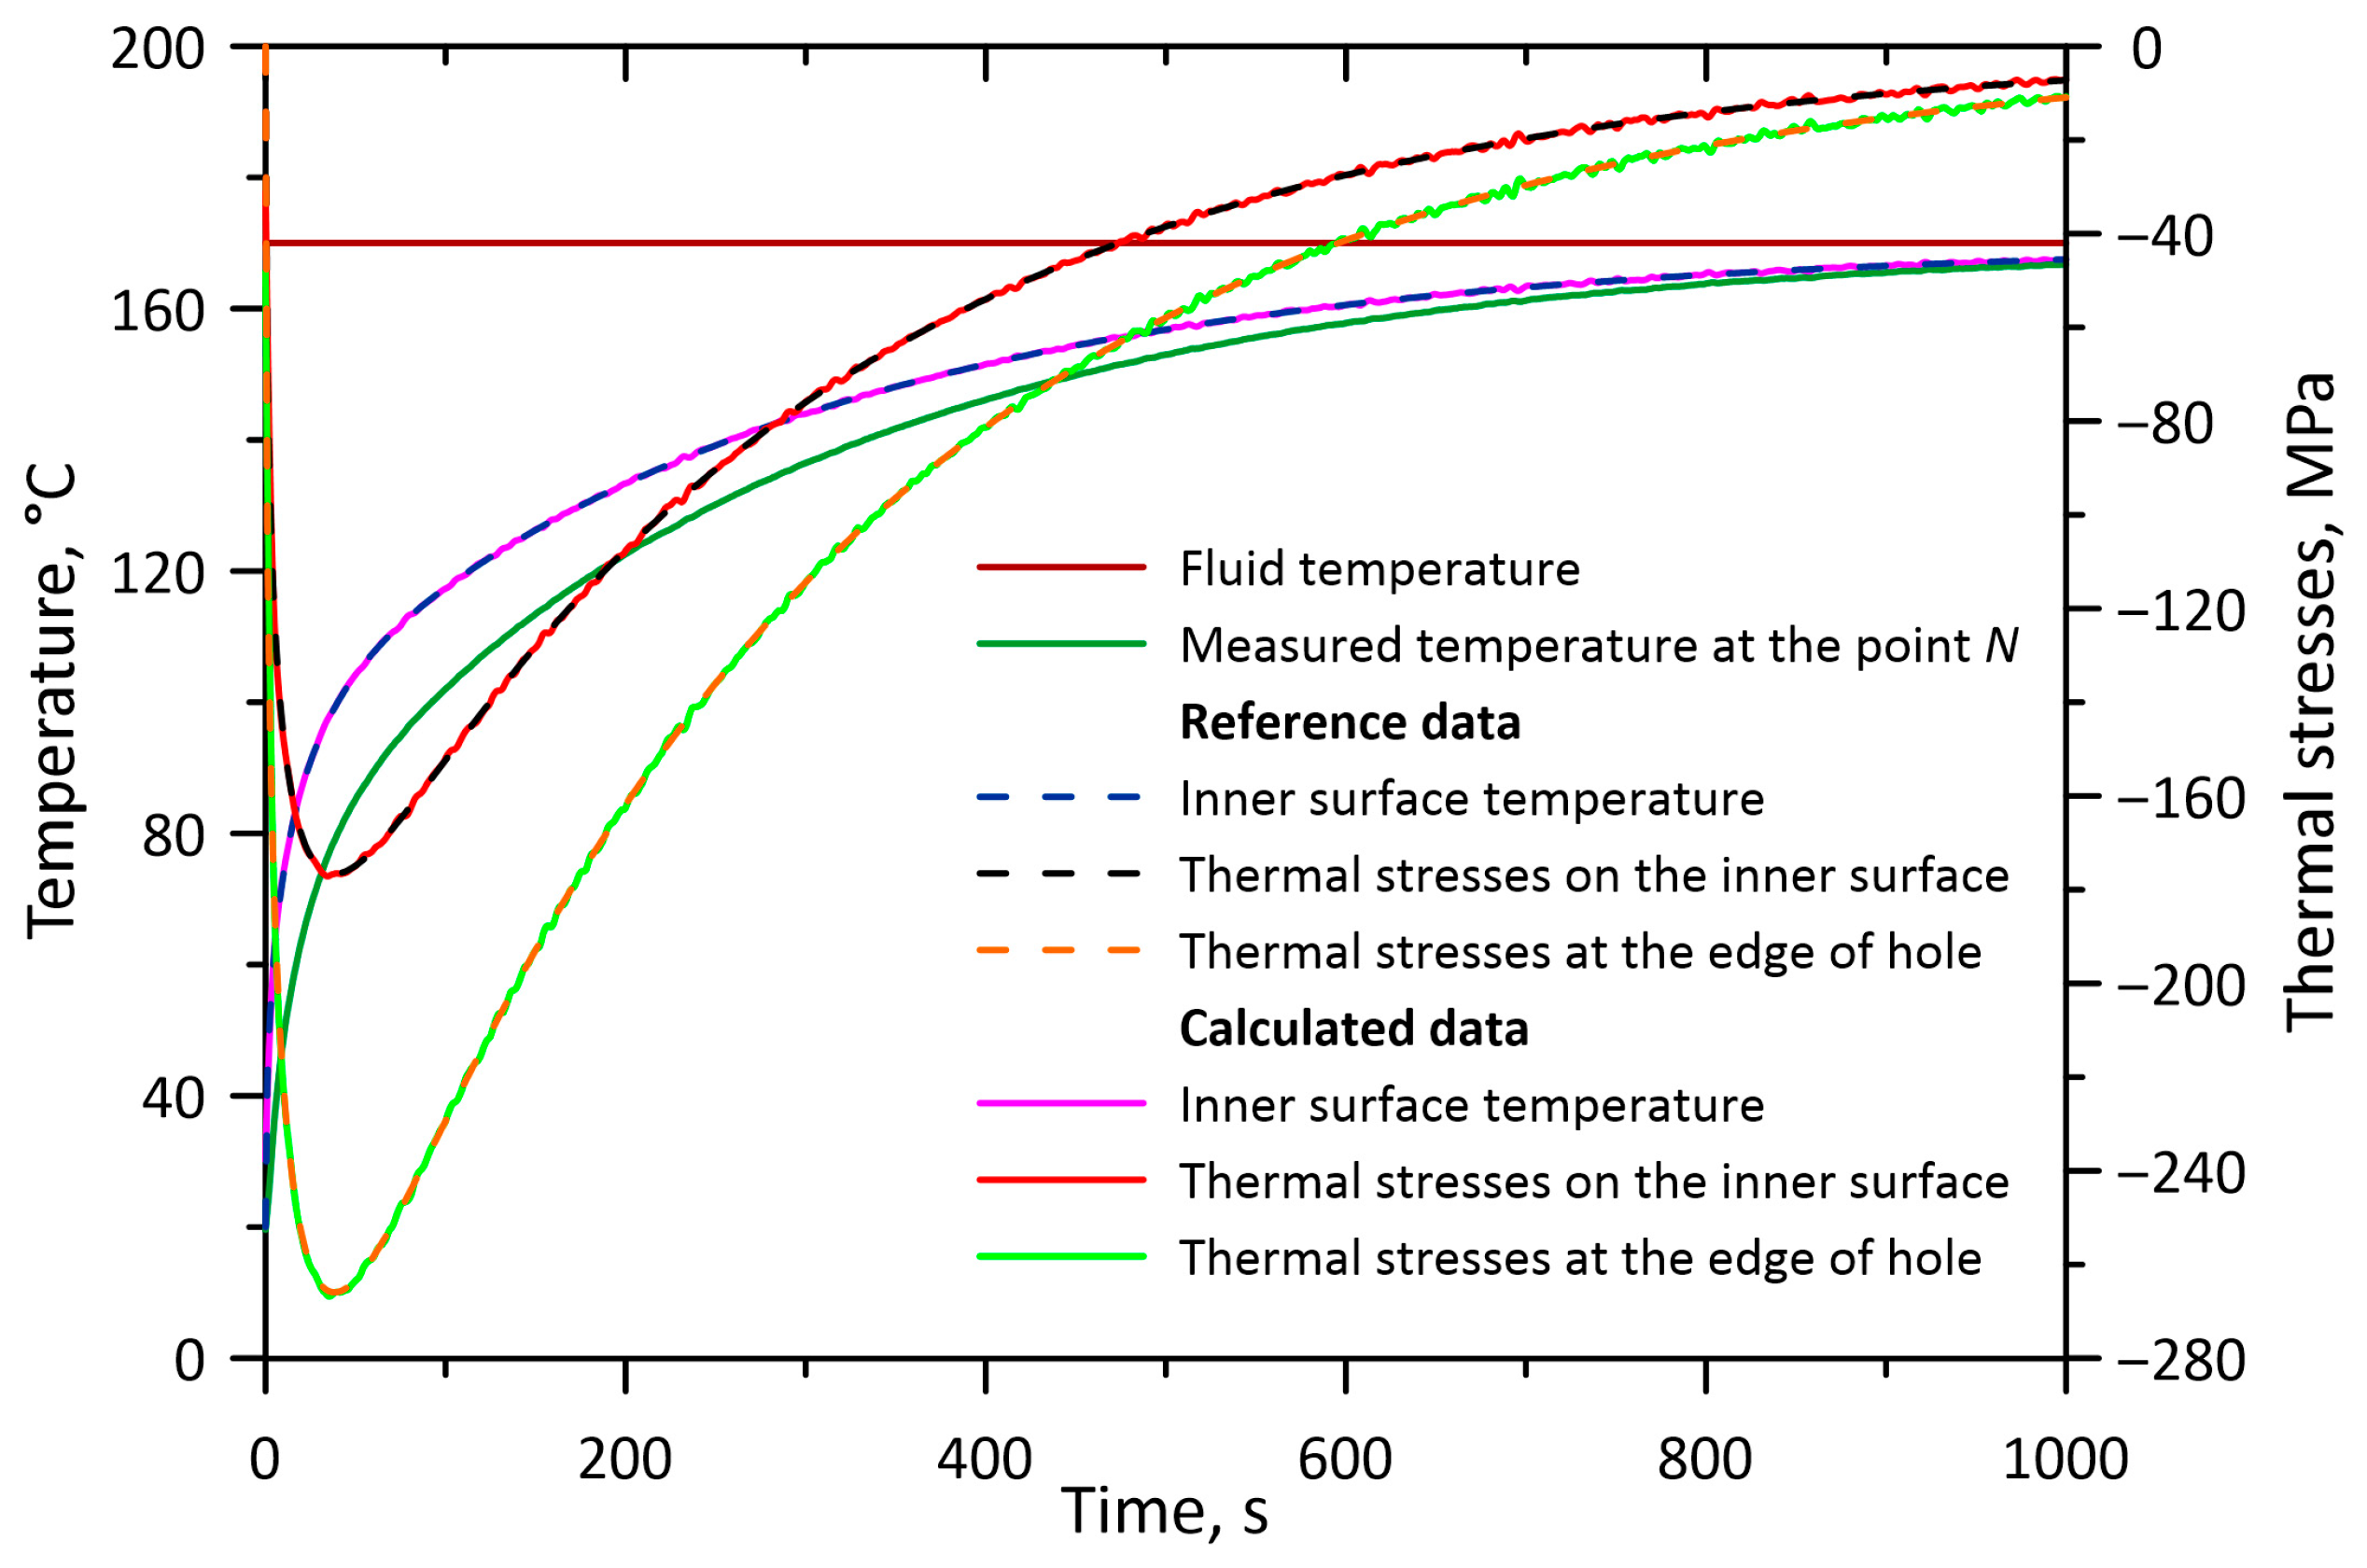
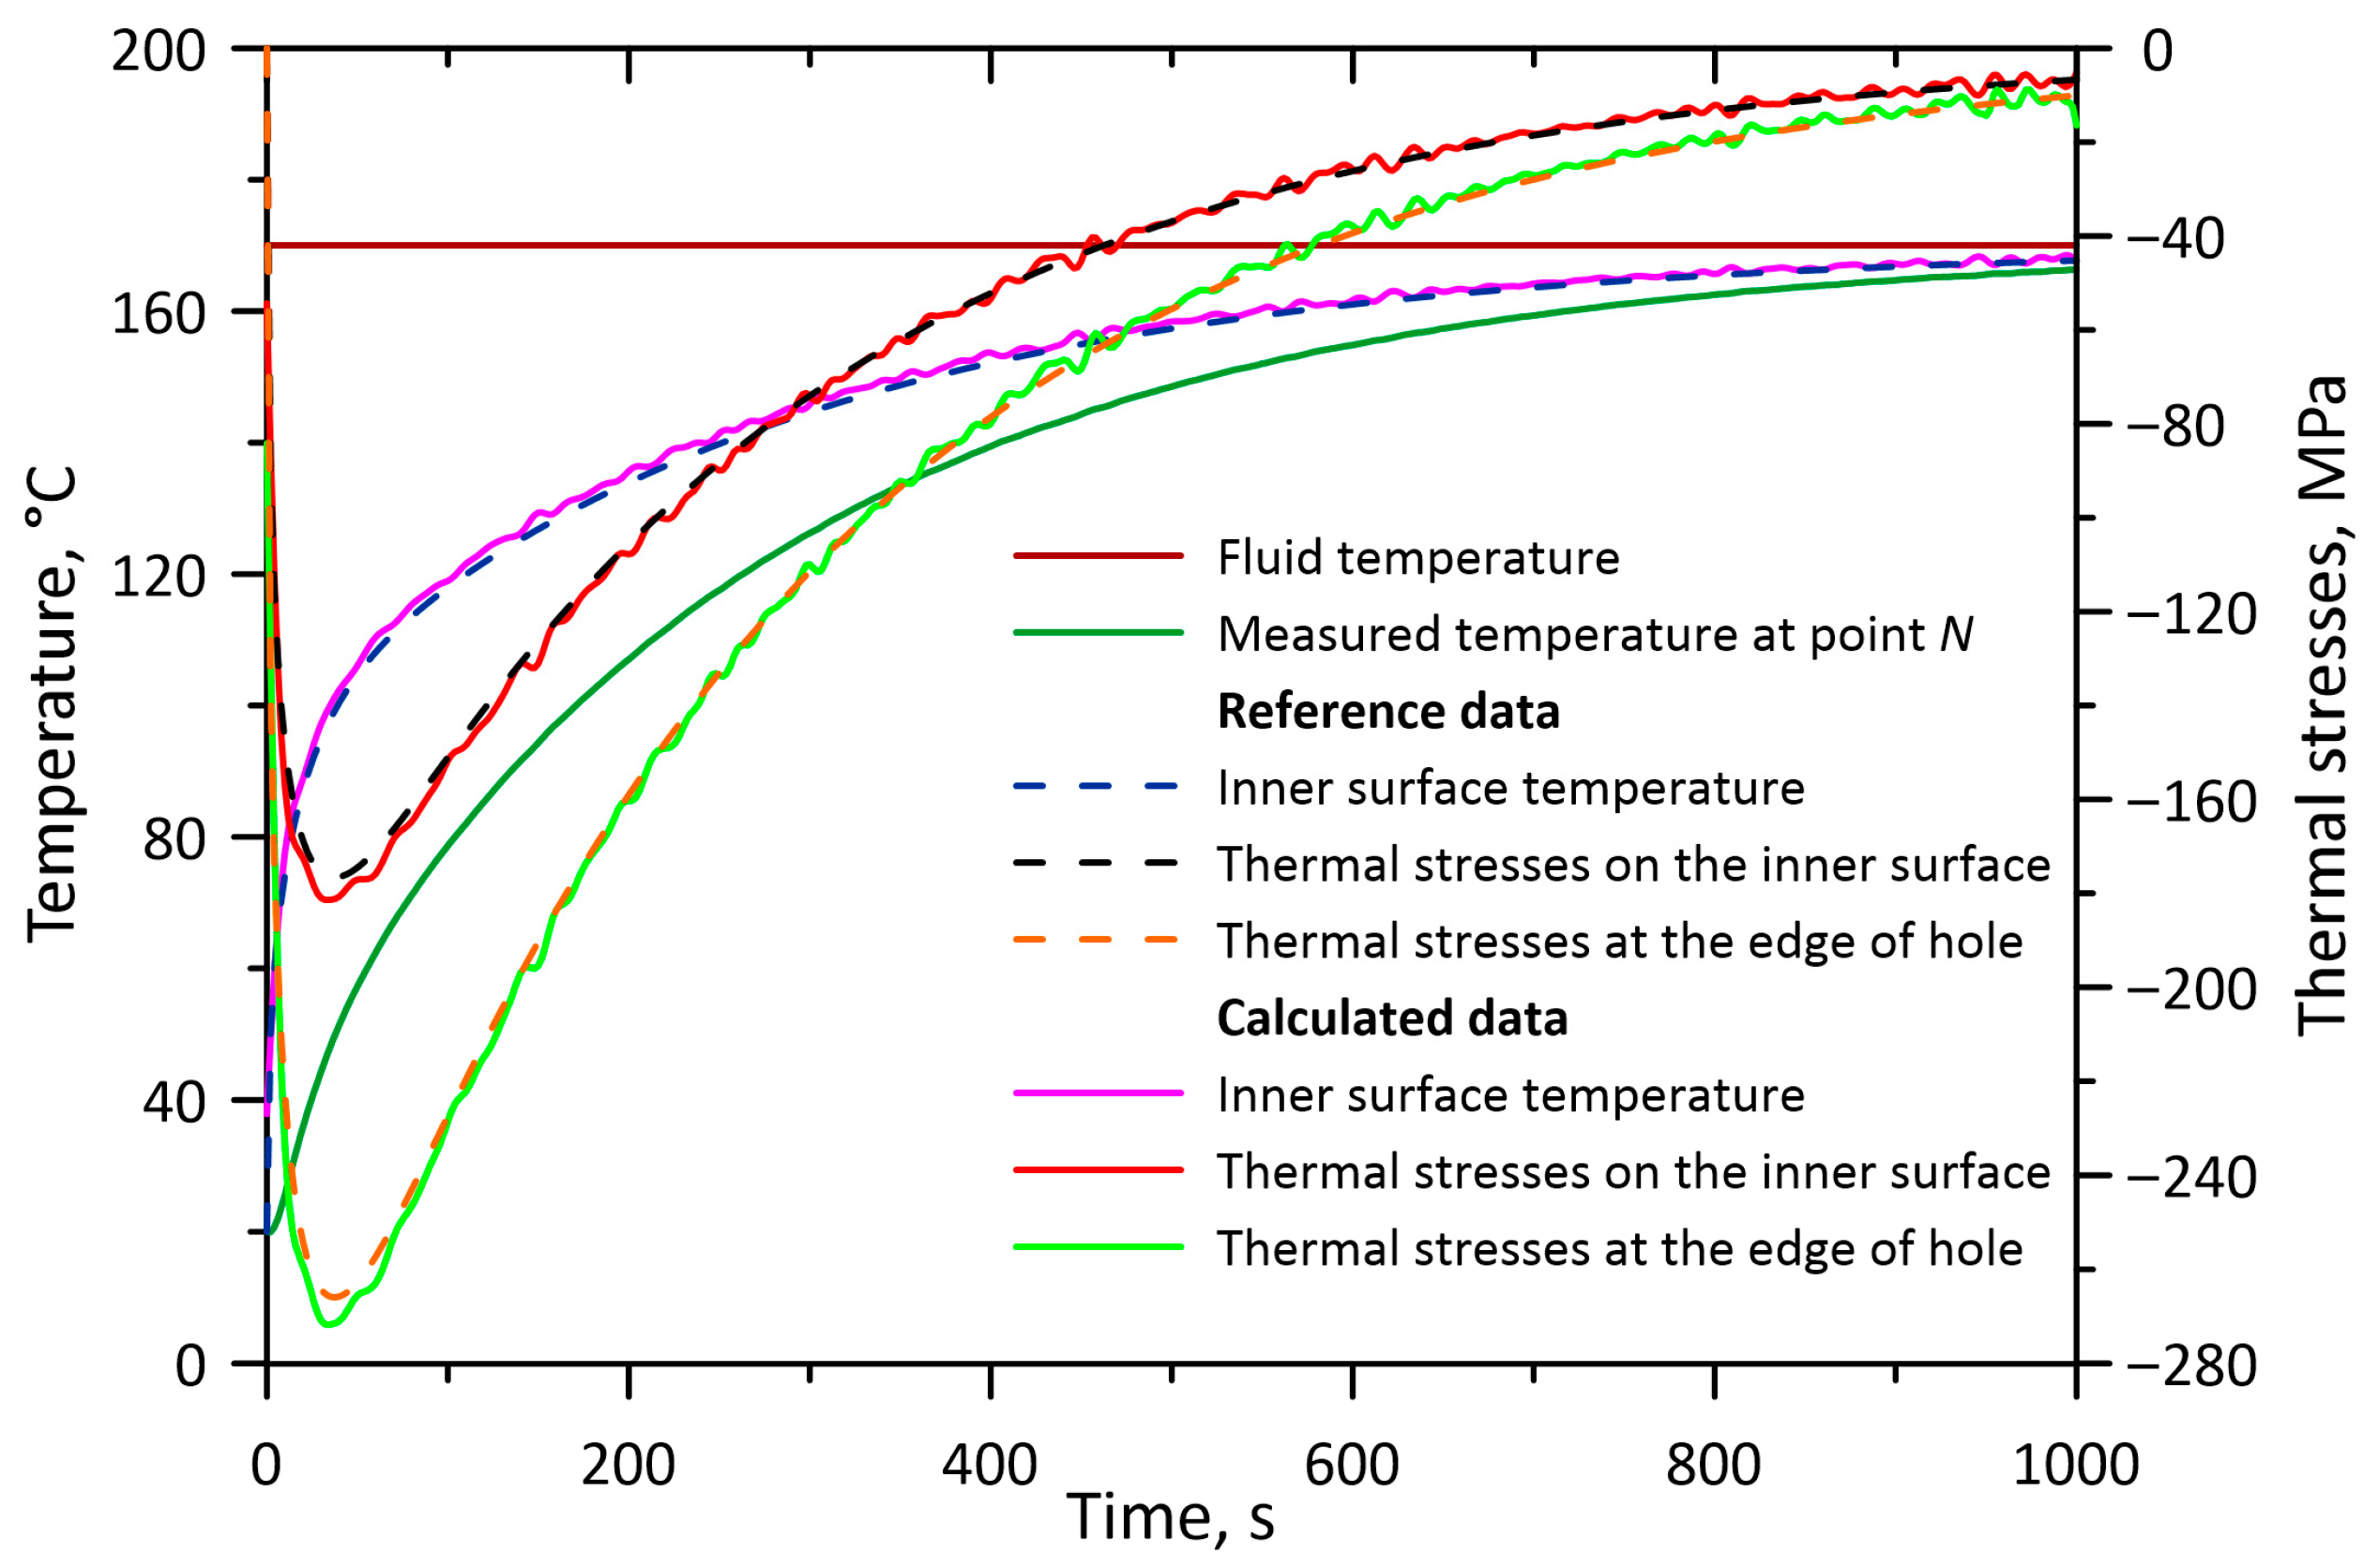
Figure 5 and
Figure 6 present graphs of temperatures and thermal stresses on the inner surface of a thick-walled cylindrical element for selected cases. The most favourable cases regarding the accuracy of the calculated thermal stresses at the edge of the hole were selected for the smallest and largest distance of the measuring point from the inner surface of the pressure element, i.e.,
= 6 mm and
= 18 mm.
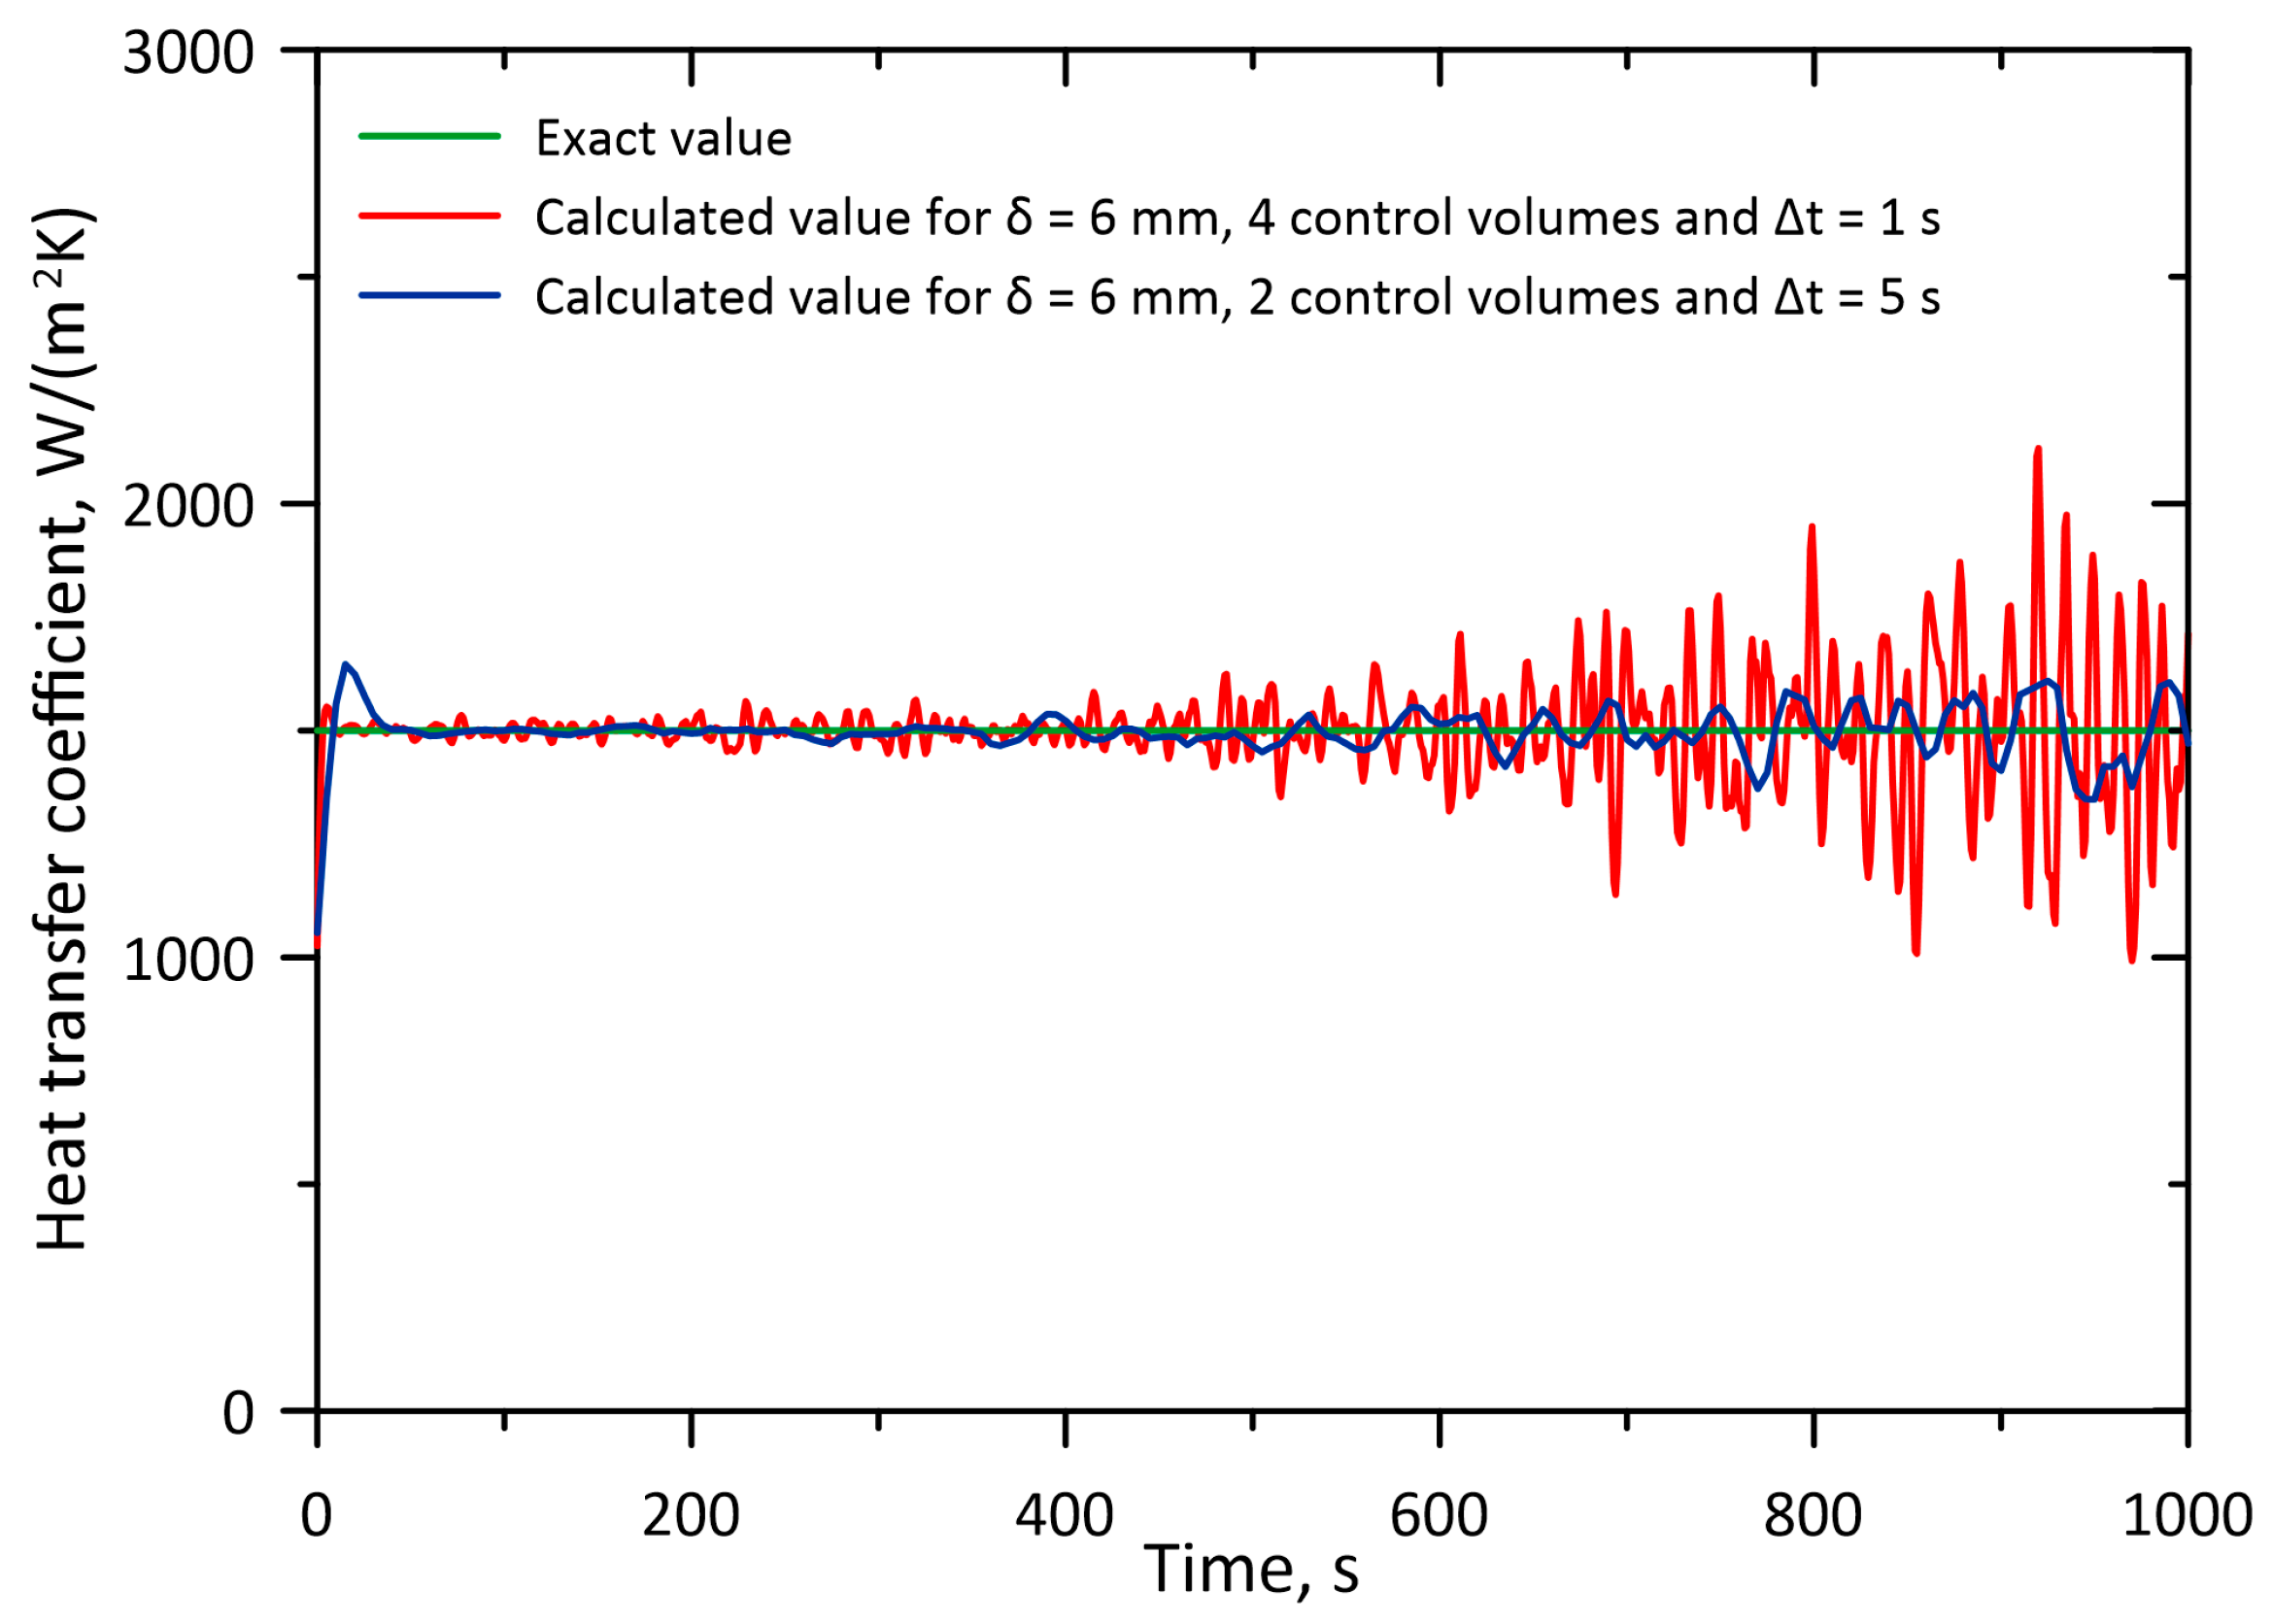
Figure 7 shows the heat transfer coefficient graphs for the case where the temperature measuring point is at a distance
of 6 mm from the inner surface. The most accurate values of heat transfer coefficients were selected for the smallest and largest time step, i.e.,
= 1 s and
= 5 s.
Figure 5,
Figure 6 and
Figure 7 show both graphs of values calculated using the described algorithm and reference values.

