Article

The Role of the Aogula Fault in the Migration of Hydrocarbon Along the Sartu, Putaohua, and Gaotaizi Reservoirs and Its Relationship with Accumulation in the Songliao Basin

1
Exploration and Development Research Institute, Daqing Oilfield Company Ltd., Daqing 163712, China
2
College of Earth Science, Northeast Petroleum University, Daqing 163318, China
*
Author to whom correspondence should be addressed.
Energies 2025, 18(16), 4325; https://doi.org/10.3390/en18164325
Submission received: 1 July 2025 / Revised: 6 August 2025 / Accepted: 12 August 2025 / Published: 14 August 2025
(This article belongs to the Special Issue Petroleum Exploration, Development and Transportation)

Abstract

To elucidate hydrocarbon enrichment characteristics within the Sartu (S), Putaohua (P), and Gaotaizi (G) reservoirs near the Aogula Fault in the northern Songliao Basin, this study systematically analyzes the fault’s influence on hydrocarbon migration and accumulation, based on an investigation of migration pathways along fault zones and sandstone bodies. The results demonstrate that, except at its northern terminus, the Aogula Fault terminates hydrocarbon migration within the S reservoir sandstones, thereby promoting hydrocarbon accumulation near the fault zone. This is a primary reason for the prevalence of productive drilling targets in this region. Six vertical diversion zones are identified along the fault trace, uniformly spaced from southwest to northeast. These zones facilitate vertical migration of hydrocarbons from the G and P reservoirs into the overlying S reservoir, accounting for the significantly greater hydrocarbon enrichment observed in the S reservoir compared to the underlying formations. Furthermore, excluding the eastern and western extremities, lateral diversion zones characterize the remainder of the fault. These zones enhance lateral hydrocarbon migration from the southwestern segment towards the northeastern segment, resulting in significantly higher accumulation in the northeastern section relative to the southwestern section.

1. Introduction

Previous studies on fault-controlled hydrocarbon migration along sand bodies have primarily focused on two aspects: the formation conditions of migration, based on whether fault–caprock assemblages are sealed vertically or laterally. References [1,2,3,4,5] propose that the condition for lateral diversion of hydrocarbons along sand bodies by faults is characterized by vertical sealing of the fault–caprock assemblage, while the fault remains unsealed laterally. Vertical diversion occurs when vertical sealing is absent. Termination of hydrocarbon migration occurs when both vertical and lateral sealing conditions are met. On the other hand, References [6,7,8,9,10] investigate the spatial locations and distribution characteristics of fault-controlled hydrocarbon migration along sand bodies by analyzing the migration pathways in conjunction with the vertically and laterally sealed or open segments of the fault–caprock assemblage. These findings are crucial for understanding the characteristics of hydrocarbon accumulation in fault zones, particularly in the outer slope region. However, the aforementioned studies lack investigation into the locations where faults exert lateral diversion effects on hydrocarbon migration along sand bodies; where such studies do exist, they are limited to analyzing the conditions under which these effects may occur [11]. Moreover, previous research has typically examined the three types of fault-related hydrocarbon migration pathways along sand bodies in isolation, without a comprehensive analysis of their coexistence along a single fault. This fragmented approach hinders a precise understanding of hydrocarbon enrichment characteristics at fault zones on the outer slope of the source area. Using the methods based on hydrocarbon migration pathways along sand bodies, fault–caprock vertical and lateral sealing relationships, sealing properties of mudstone caprocks, development of hydrocarbon potential difference at the basal boundary, and the presence of associated faults, a study was conducted to determine the distribution characteristics of the migration control zones along the S, P, and G reservoir sand bodies influenced by the Aogula Fault. This research holds great significance in revealing the hydrocarbon enrichment characteristics near the Aogula Fault and in guiding future hydrocarbon exploration.
The technology roadmap is as follows (Figure 1):

2. Geological Setting

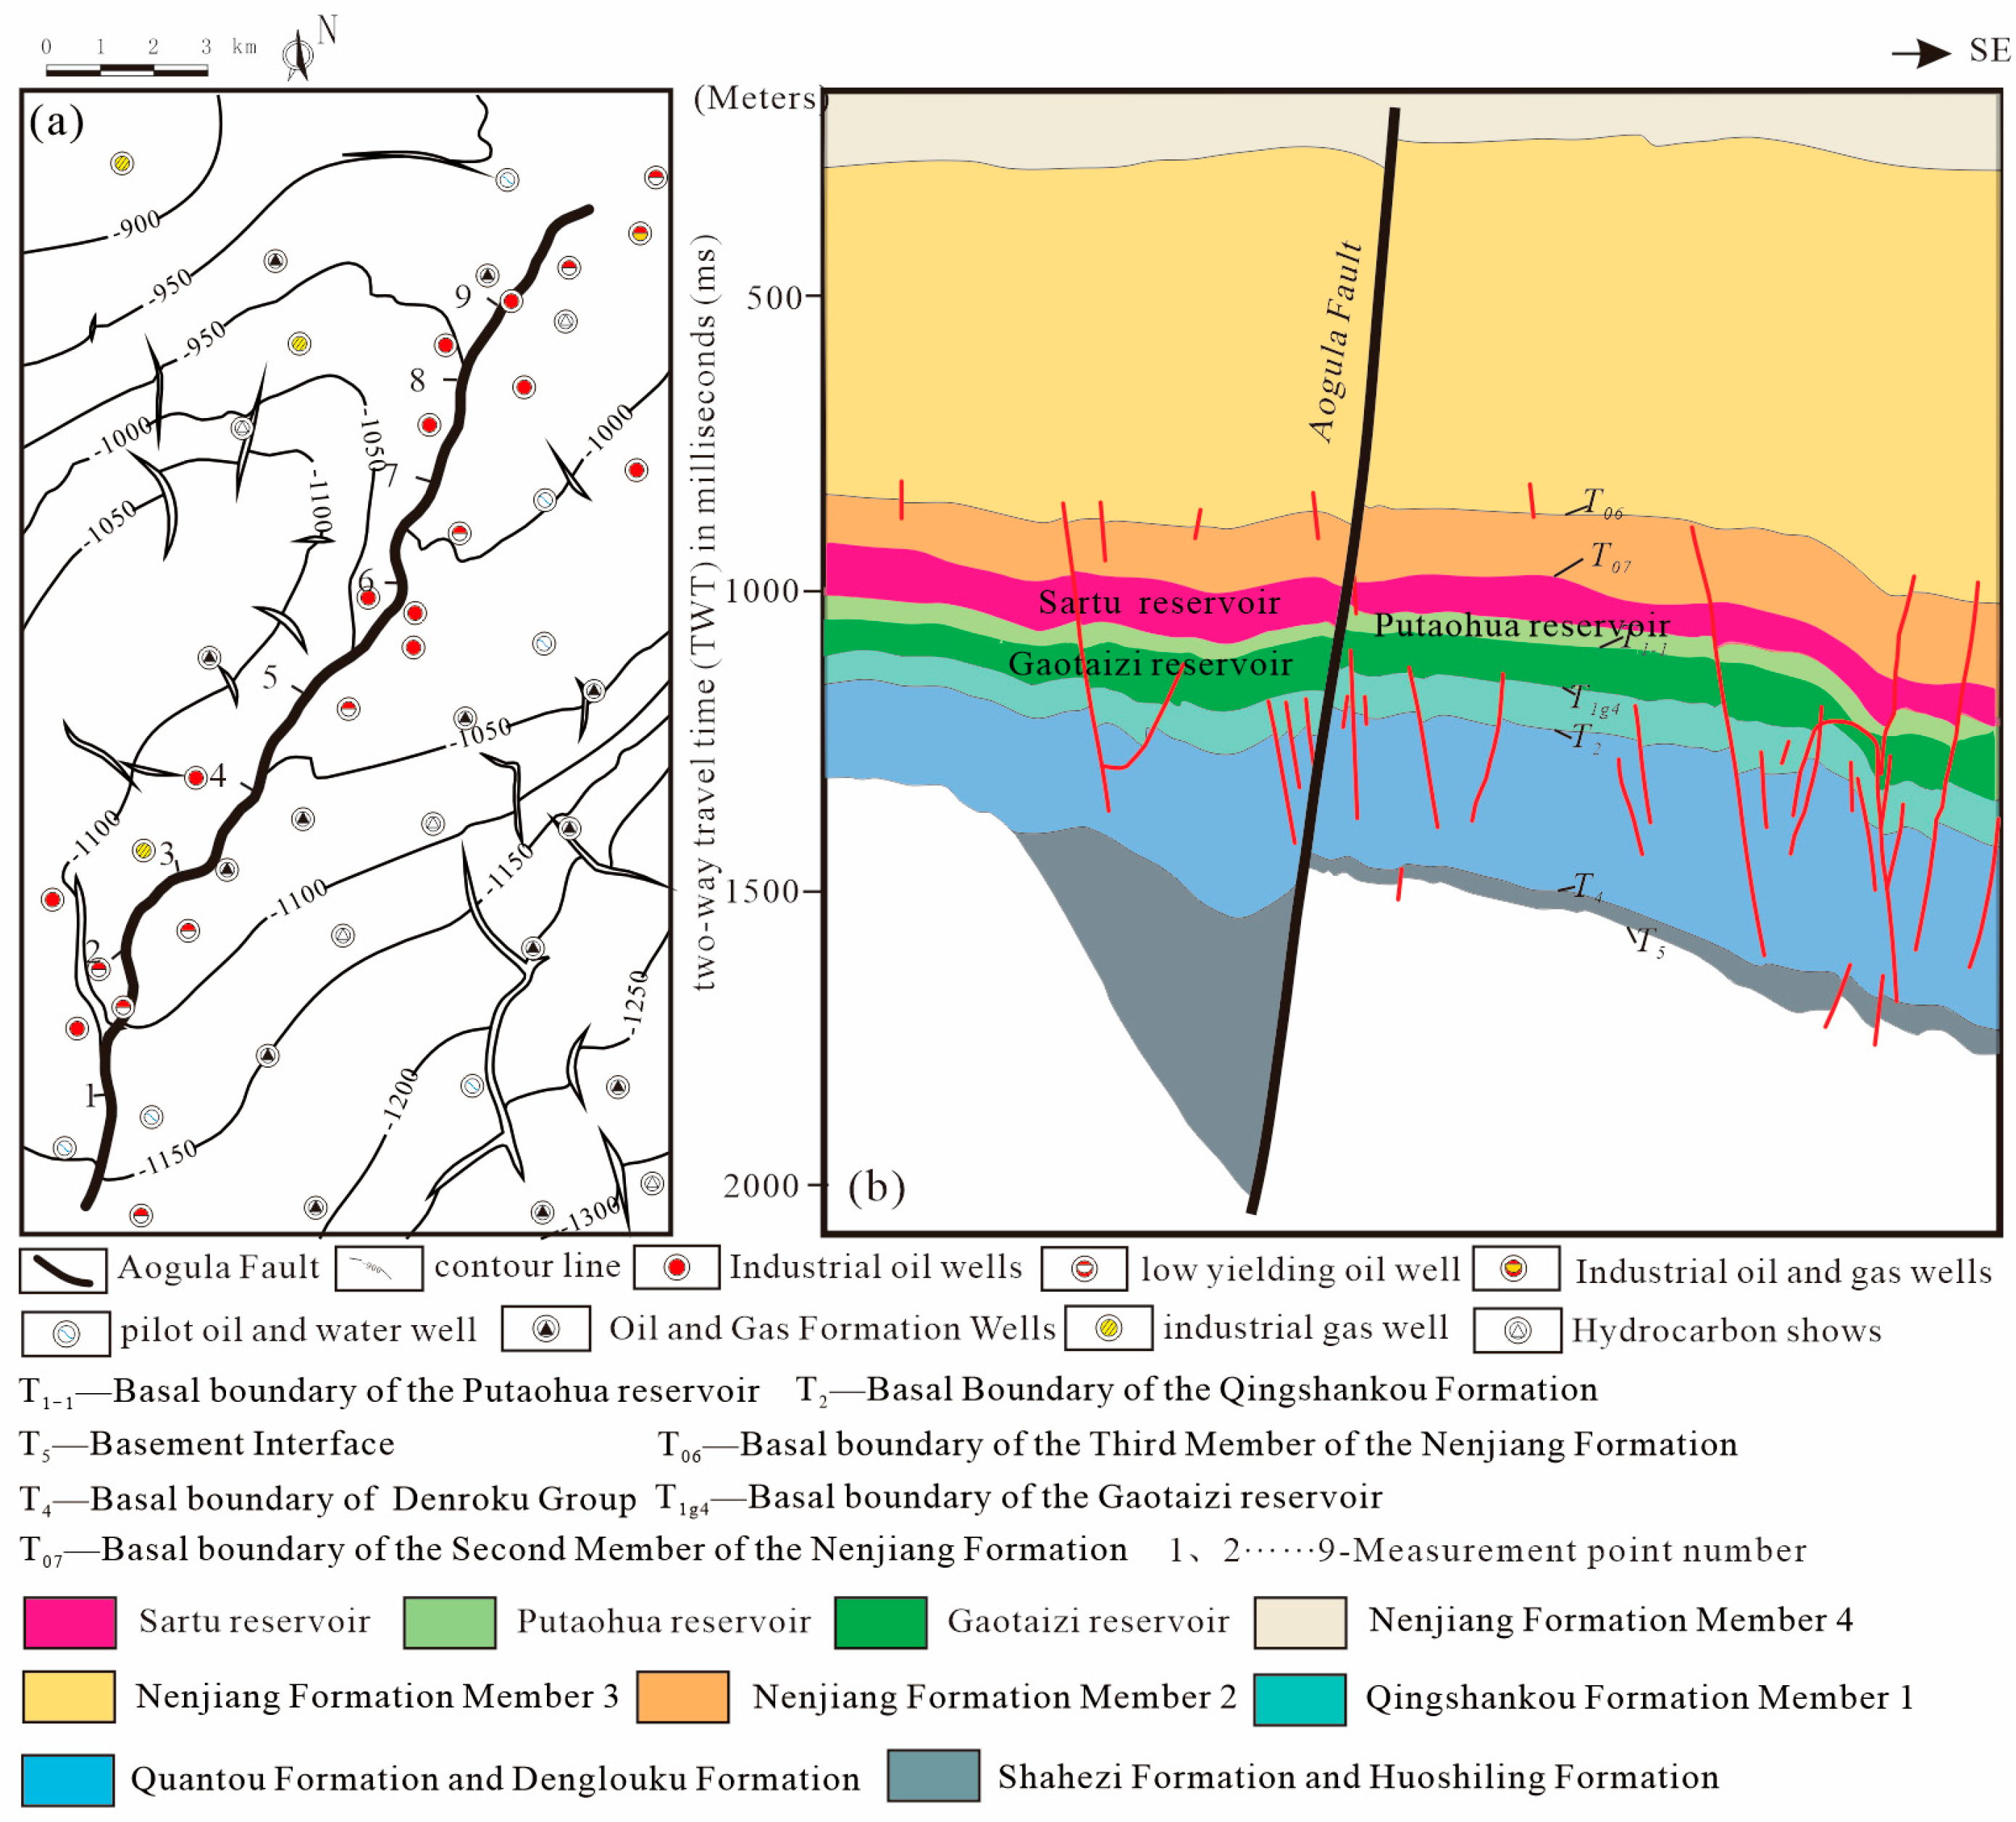
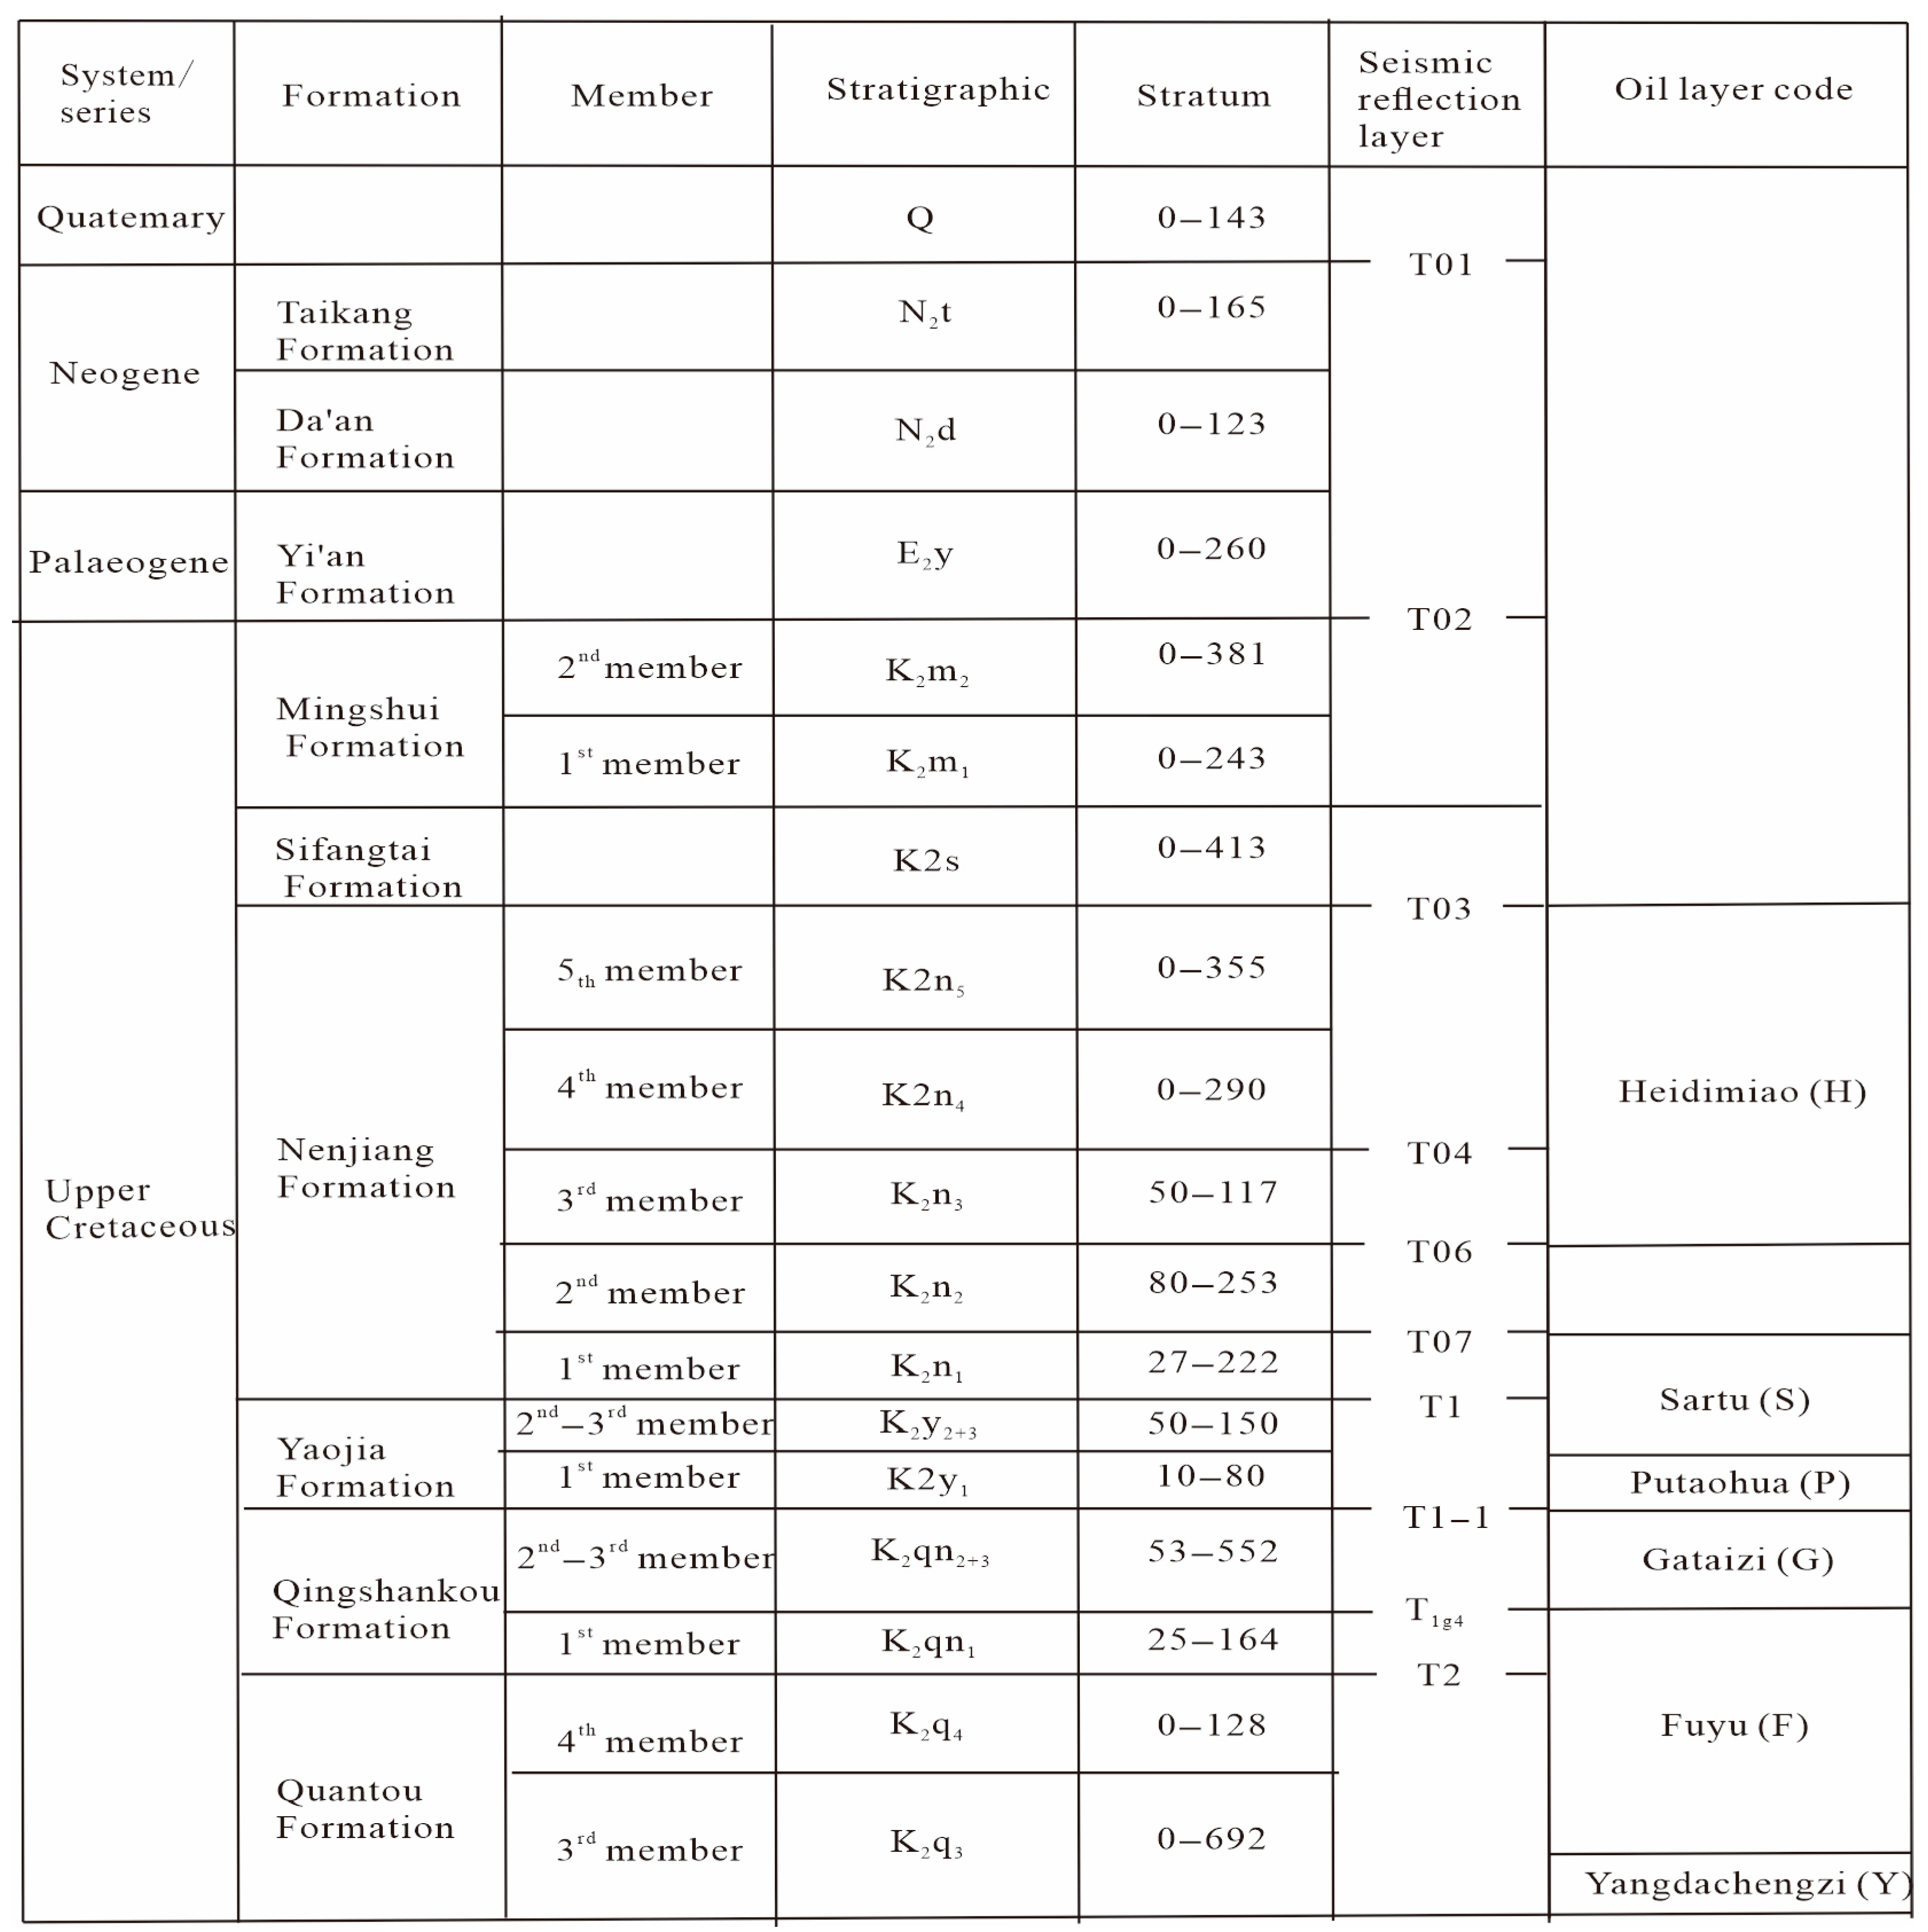
The Aogula Fault, located in the northern Songliao Basin, is a northeast-trending normal fault that extends approximately 26.6 km in length. Shallow drilling in its distribution area has revealed the presence of Upper Cretaceous formations, including the Qingshankou, Yaojia, Nenjiang, Sifangtai, and Mingshui formations, alongside minor Cenozoic strata [12]. The fault extends vertically from the Cenozoic strata down to the basement rock, with a westward dip averaging 30°. Studies [13,14,15,16,17,18,19,20] have confirmed the long-term persistence and active characteristics of the Aogula Fault through displacement–distance curves from different periods, as illustrated in Figure 2. Current hydrocarbon exploration at the Aogula Fault has identified hydrocarbon accumulations primarily within the G reservoir group (K2qn2+3). Figure 3 shows the P reservoir (Yaojia Formation) and the S reservoir (K2n1). These hydrocarbons are genetically sourced from the dark mudstone developed in the K2qn1 on the eastern side of the Gulong Depression, while the regional mudstone cap is a thick mudstone developed in the K2n2. As the Aogula Fault lies outside the source rock area of the K2qn1 in the Gulong Depression, hydrocarbons generated by the dark mudstone of this source rock must encounter the Aogula Fault when migrating westward laterally along the S, P, and G reservoirs [21,22,23,24,25]. This interaction significantly influences the distribution characteristics of hydrocarbons in these layers along the fault zone. Drilling data currently indicates that the S reservoir at the Aogula Fault exhibits significantly higher concentrations of hydrocarbons than the G and P reservoirs. Furthermore, the northeastern section of the S, P, and G reservoirs holds greater hydrocarbon concentrations than the southwestern and central sections. Most areas to the west of the Aogula Fault show no hydrocarbon accumulation. These observations can be attributed to the varying effects of the Aogula Fault on the lateral migration of hydrocarbons along the S, P, and G oil-bearing sand bodies. Such hydrocarbon accumulations are found primarily in regions where the Aogula Fault interacts with the lateral migration paths of hydrocarbons along the P reservoir’s sand body. Therefore, investigating the influence of the Aogula Fault on the lateral migration of hydrocarbons along the S, P, and G oil-bearing sand bodies is crucial for understanding the hydrocarbon enrichment characteristics of these layers within the fault zone.

3. Materials and Methods

3.1. Relevant Materials

(1). A combination of 3D seismic data, drilling and logging data, and well testing results were used to characterize the study area. The 3D seismic data were employed to determine fault burial depth, dip angle, displacement, the burial depth of the S reservoir, and the thickness of the K2n2 mudstone caprock, as well as to analyze seismic volumes of the Aogula Fault and the top of the S reservoir.
(2). Drilling and logging data were used to assess clay content, sand–mud ratios within the S reservoir, and fault rock characteristics. Well testing data from 48 wells were analyzed to determine reservoir pressure and hydrocarbon shows within the S reservoir.

3.2. Method for Determining the Location Where Faults Terminate the Migration of Hydrocarbon Along Sand Bodies

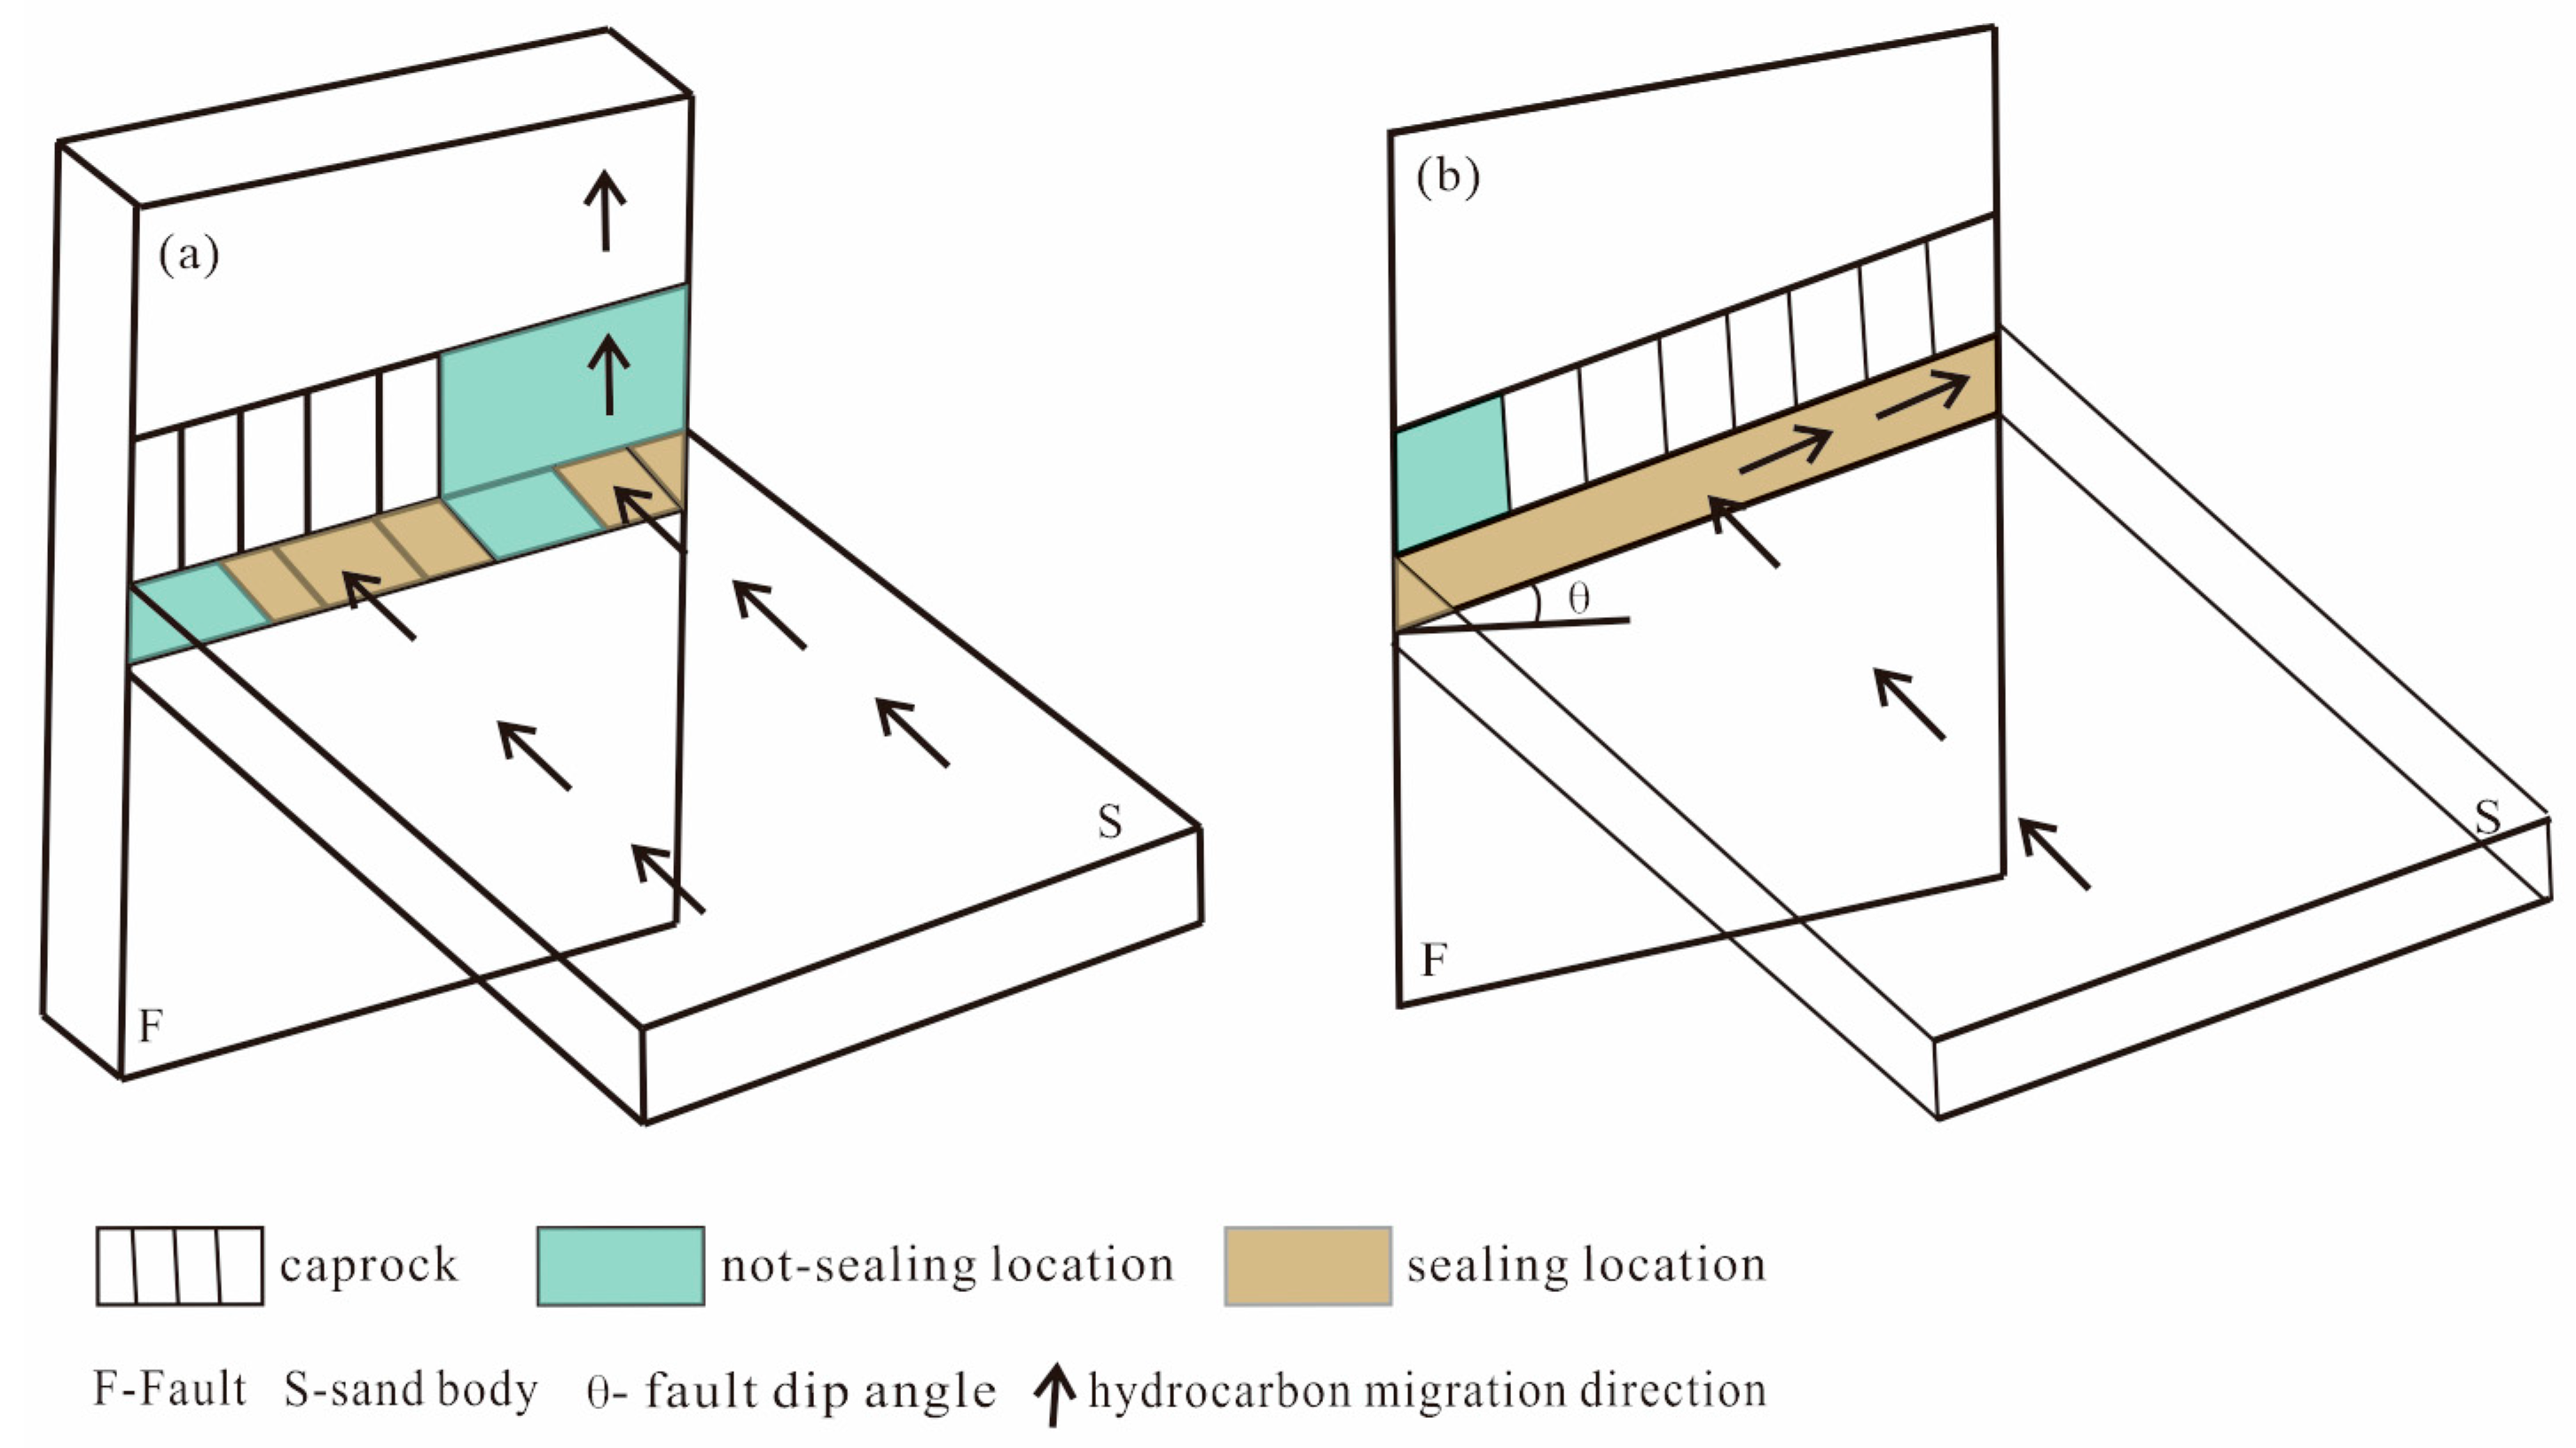
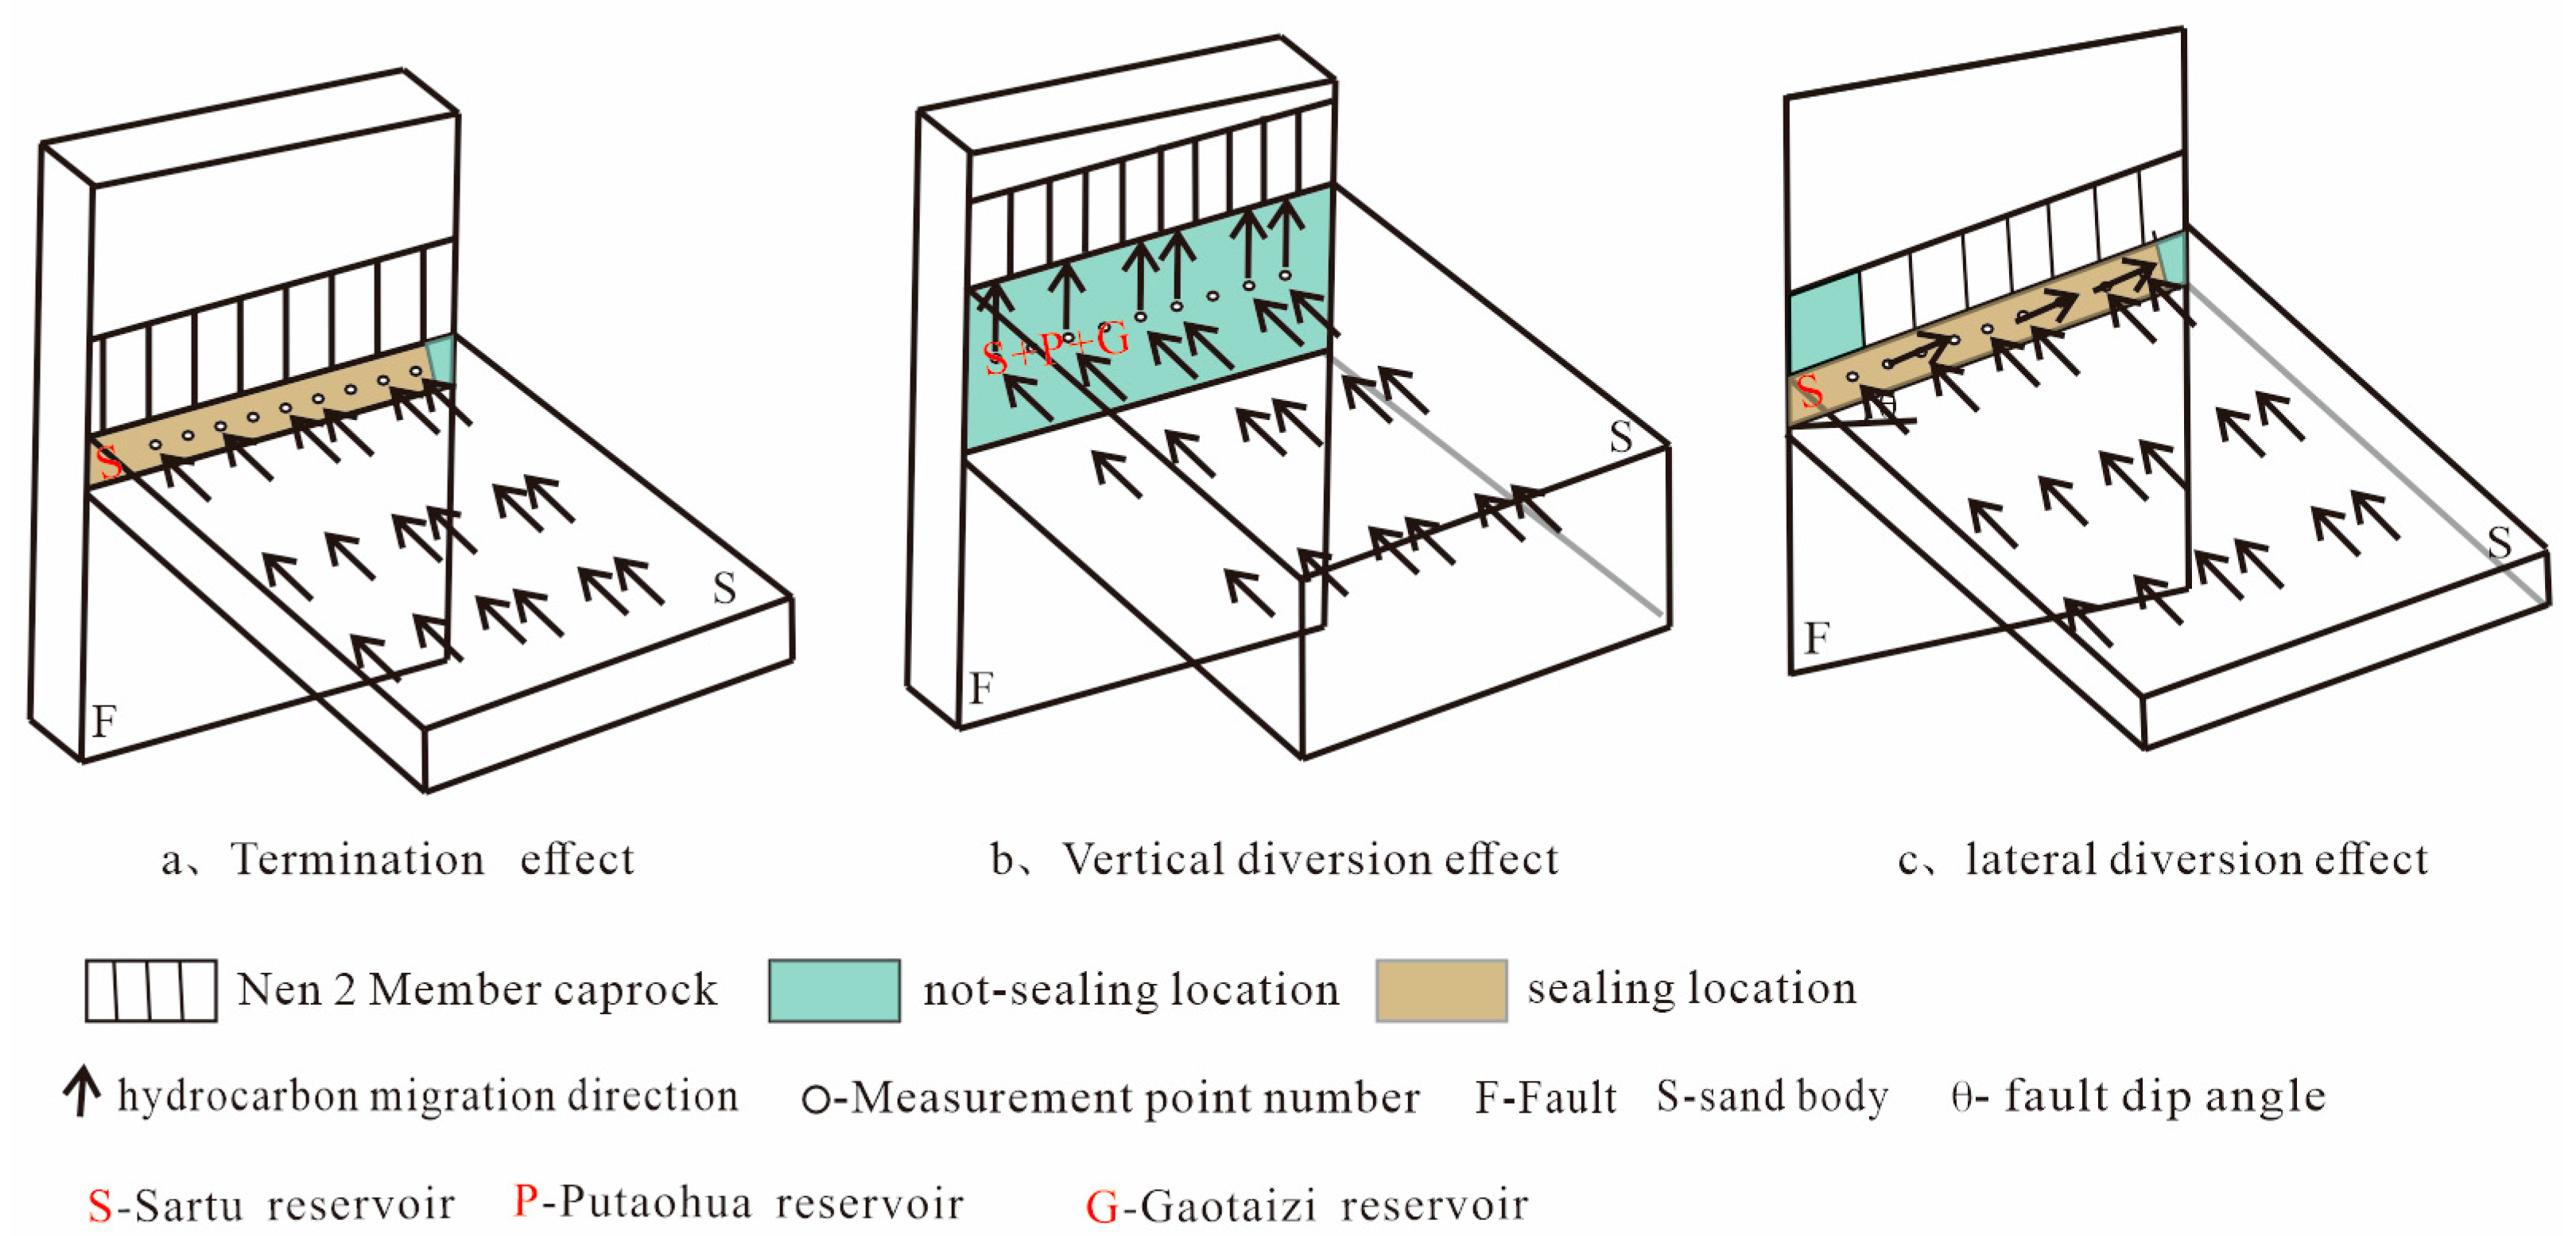
The termination effect of faults on hydrocarbon migration along sand bodies refers to the condition in which both vertical and lateral sealing by the fault halt the migration of hydrocarbons along the sand body. As illustrated in Figure 4a, the termination zone is located where the hydrocarbon migration pathway overlaps with the vertically and laterally sealed segments of the fault–caprock assemblage.
The sand-to-rock ratio of the formation can be determined using lithological logging data. Based on the results of oil testing and logging interpretation for each well, the hydrocarbon display characteristics in the target stratum are obtained. By combining the sand-to-rock ratio with these characteristics, the lower limit of sand body connectivity can be established. A comparison between the sand-to-rock ratio and the lower limit of sand body connectivity is then conducted. If the former exceeds the latter, connectivity is present; otherwise, it is not. This process enables the determination of the sand body connectivity range. Next, using 3D seismic data, the burial depth of the stratigraphic top surface where the sand body is located is determined. Paleohydrocarbon potential energy is defined as the mechanical energy of hydrocarbons during the accumulation period [23]. Employing ancient burial depth restoration methods [26,27], the depth is restored to its ancient burial state during the hydrocarbon accumulation period. This value is then substituted into the ancient hydrocarbon potential energy formula to calculate the ancient hydrocarbon potential energy. A planar distribution map of hydrocarbon potential energy is created, and the ancient structural ridge can be identified from the normal convergence lines on the map. By combining the sand body connectivity range with the hydrocarbon migration path along the sand body, the migration route is accurately determined.
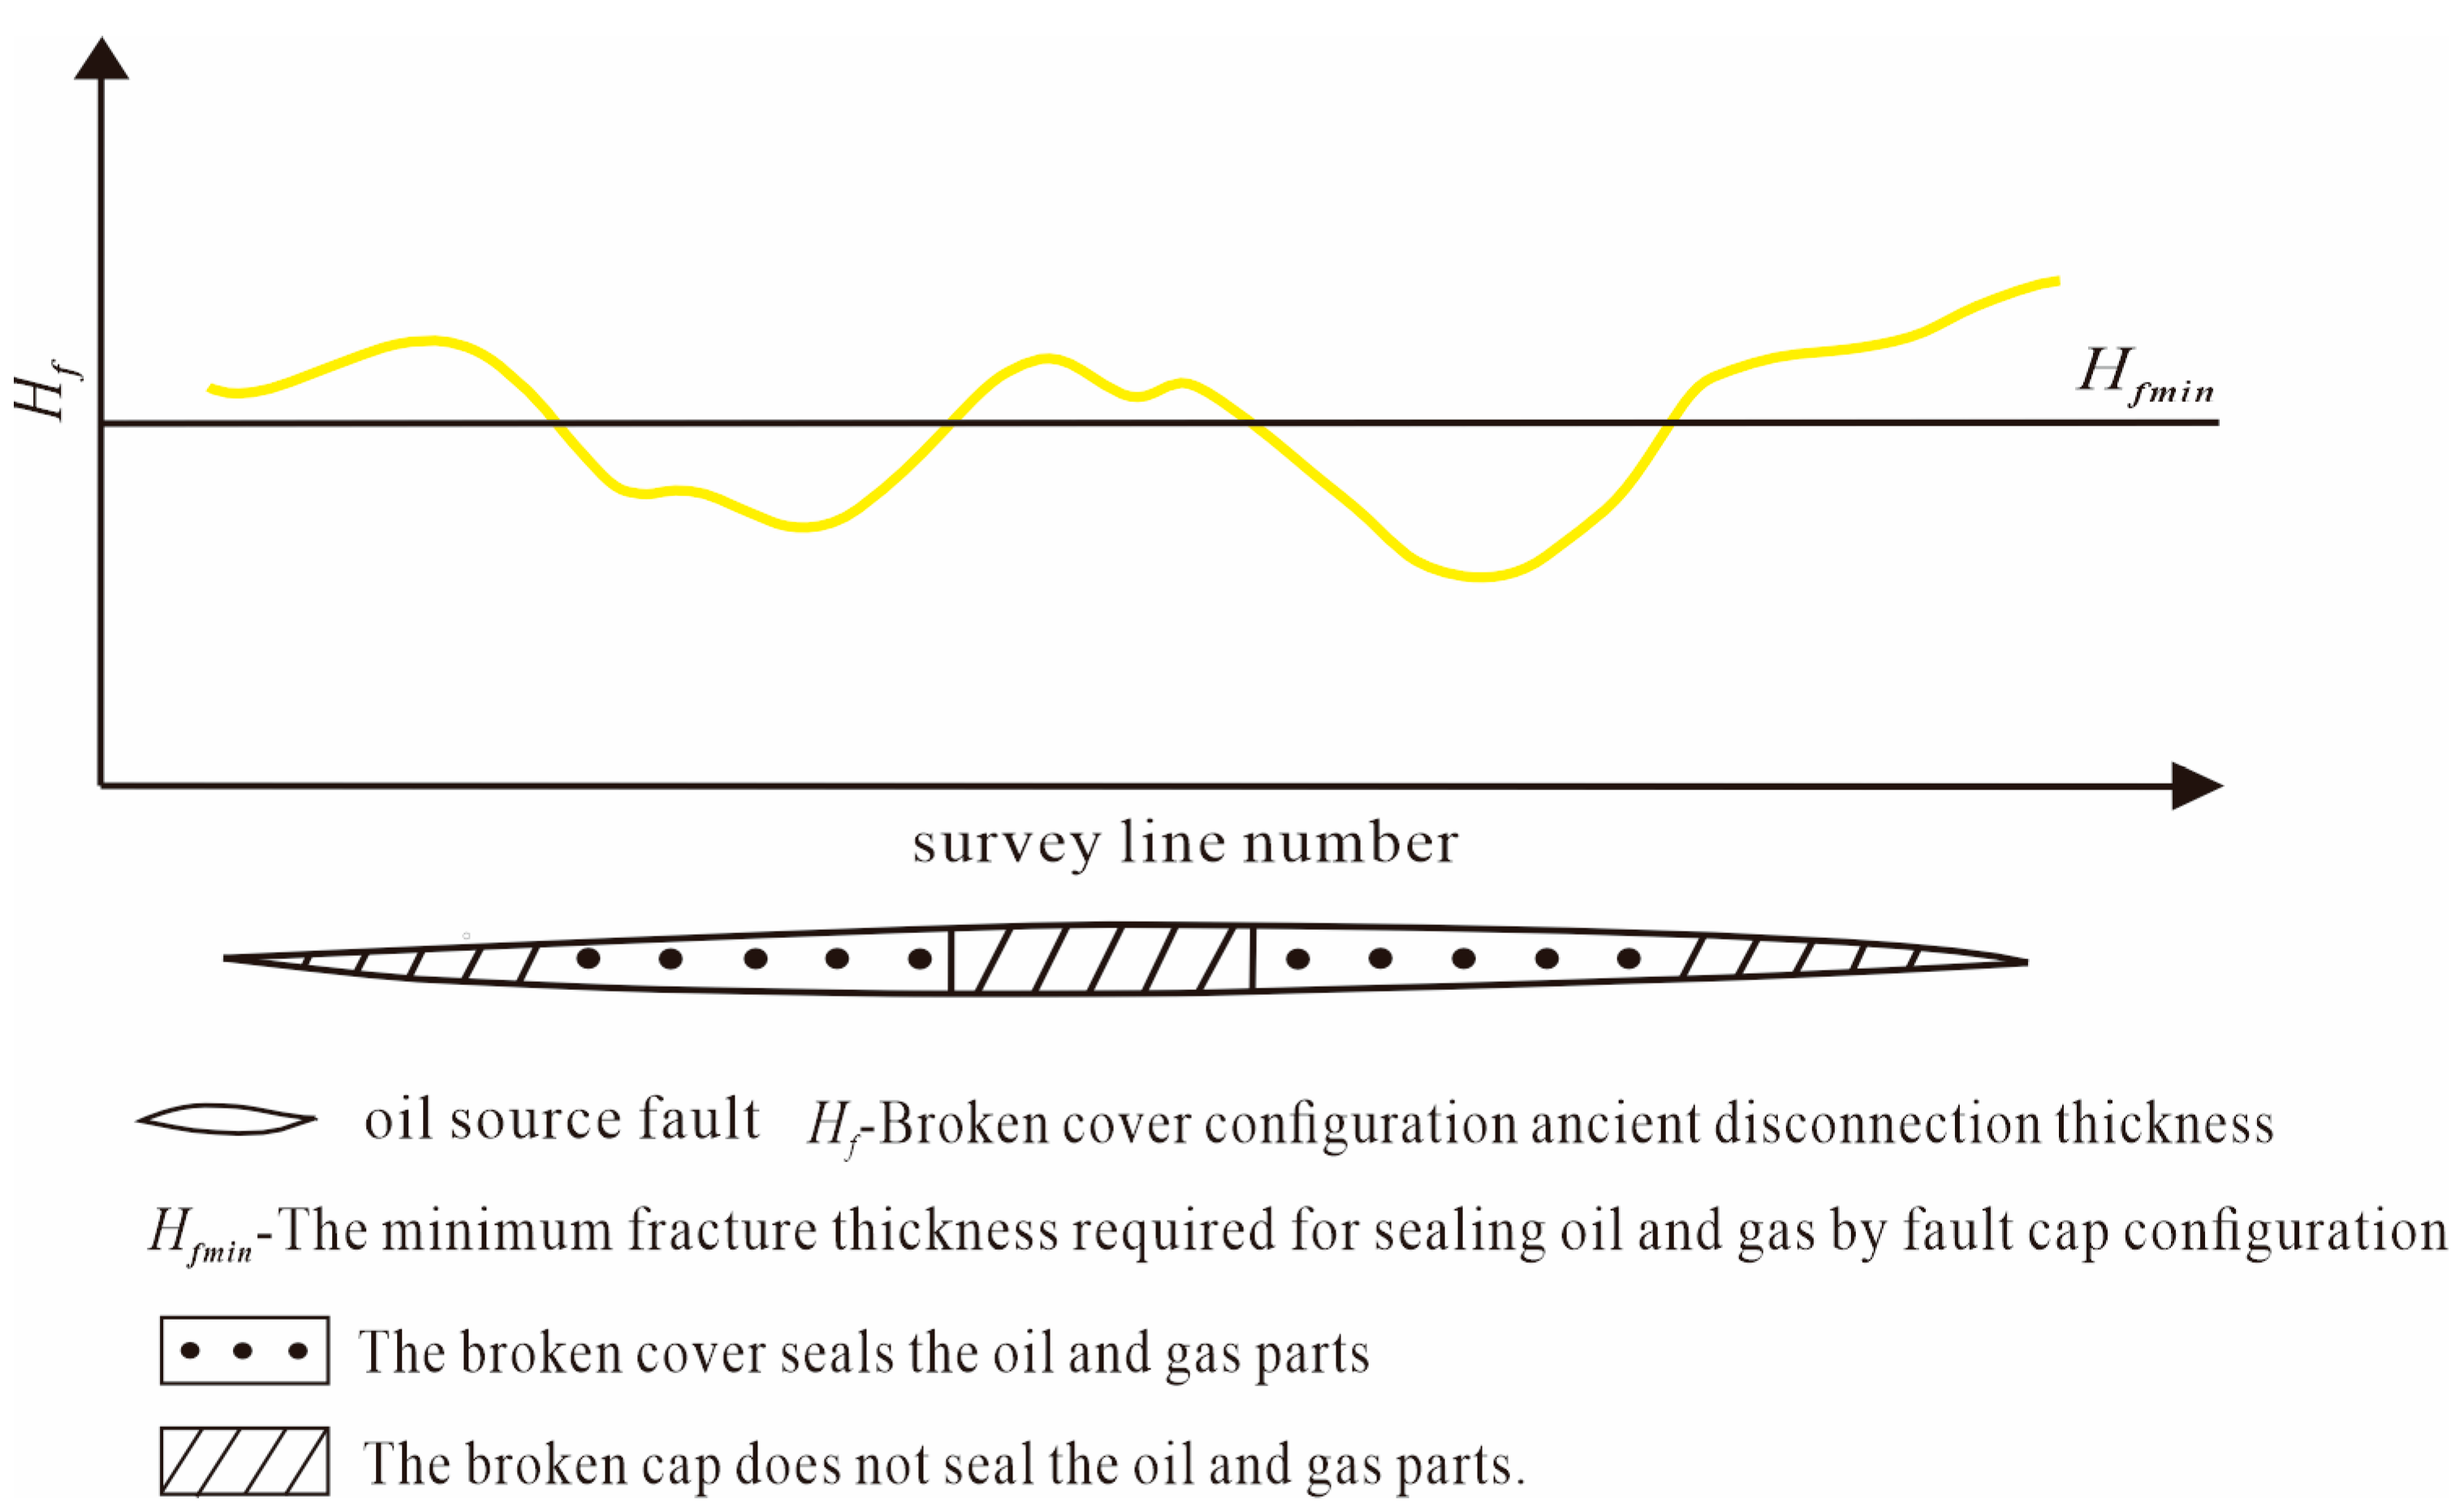
Using 3D seismic and drilling data, the fault distances at various locations of the oil source fault and the thickness of the regional mudstone caprock layer separated by the fault were determined. By applying the fault distance restoration method [28,29,30] and the ancient thickness restoration method for regional mudstone caprock layers from References [31,32], the ancient thickness of the regional mudstone caprock during the hydrocarbon accumulation period was restored. The ancient fault distance and the restored thickness of the regional mudstone caprock were then compared, and the ancient fault thickness at different locations of the fault–cap configuration was calculated by subtracting the latter from the former. A statistical analysis was performed to investigate the relationship between the ancient fault thickness at known well locations within the study area and the hydrocarbon displays both above and below the fault. The minimum ancient fault thickness where hydrocarbons were only present below the fault–cap configuration was considered the minimum fault thickness required for the mudstone to effectively seal hydrocarbons. Locations where the ancient fault thickness of the fault–cap configuration was greater than or equal to this minimum required thickness were identified, thereby pinpointing areas where the mudstone could serve as an effective seal for hydrocarbons (Figure 5).
Calculations based on the paleo-hydrocarbon potential formula identify this zone as a high-potential zone, suggesting the termination of lateral hydrocarbon migration along the sand body due to lateral sealing by the fault.
The locations where hydrocarbon migration along sand bodies terminates can be determined by coupling the sand body migration pathways, lateral sealing segments, and vertical segments where faults and caprocks match.
Based on the burial depths of the S, P, and G reservoir tops at the Aogula Fault, hydrocarbon accumulation timing was determined as the end of the Mingshui Formation deposition period using the methodology from Reference [23]. The original burial depths of the S, P, and G reservoir tops at this timing were employed to calculate the paleo-hydrocarbon potential energy values at the top of the S, P, and G reservoirs using Equation (1).
By coupling the sand migration path with the lateral sealing zones and the vertically sealed fault cap matching zones, the termination zones of hydrocarbon migration along the sand bodies can be identified.
ϕ = g z + p ρ
In Equation (1), ϕ represents the potential energy value of paleo-petroleum and natural gas in the stratum (kJ); z denotes the ancient burial depth of the stratum (m); p is the formation fluid pressure (MPa); ρ is the density of the hydrocarbon (g/cm3); and g is the acceleration due to gravity (m/s2).

3.3. Method for Determining the Location of Vertical Diversion in Hydrocarbon Migration Along Sand Bodies Due to Faults

Fault-induced lateral and vertical flow direction changes in hydrocarbon migration along sand bodies refer to the phenomenon in which faults, being laterally closed but vertically open, halt lateral hydrocarbon migration along sand bodies and redirect the flow vertically along the faults (Figure 4a). This phenomenon occurs at the intersection of the hydrocarbon migration path along the sand body, the laterally closed fault zone, and the vertically open caprock zone.
The locations where the paleo-displacement thickness of the fault–caprock configuration is less than the minimum displacement required for effective vertical sealing represent vertically unsealed segments of the fault–caprock system. By integrating these segments with the previously defined hydrocarbon migration pathways along sandstone bodies and the laterally sealed sections of the fault, the coupled zones can be used to identify the location of vertical diversion.

3.4. Method for Determining the Location of Lateral Diversion in Hydrocarbon Migration Along Sand Bodies Due to Faults

The lateral diversion effect of a fault on hydrocarbon migration along a sand body occurs when the fault exhibits vertical sealing while creating a lateral diversion in hydrocarbon potential, thereby inhibiting vertical hydrocarbon migration along the sand body and redirecting the flow laterally along the fault, as shown in Figure 4b. This lateral diversion effect is conditional and requires the simultaneous fulfillment of three criteria: (1) an overlying mudstone caprock with sealing capacity, preventing vertical migration of hydrocarbons along the fault; (2) the development of fault-associated fractures, which provide conduits for lateral hydrocarbon migration along the fault; (3) an inclined mudstone caprock, with a fluid potential difference at its basal surface, providing the driving force for lateral hydrocarbon migration along the fault. Only when all three conditions are met can a fault exert a lateral diversion effect on hydrocarbon migration along a sand body. If any of these conditions is absent, or if all three conditions are present but not spatially coupled, the lateral diversion effect will not occur. The location where this lateral diversion effect takes place corresponds to the area where the sealing mudstone caprock, fault-associated fractures, and the fluid potential difference at the base of the mudstone caprock coincide.
The development of associated faults is primarily influenced by the fault activity intensity, which can be quantified by the magnitude of fault displacement. Using three-dimensional seismic data, the ancient fault displacements at various survey lines within the study area were statistically determined. These displacements were then ranked in ascending order, from smallest to largest. The smallest ancient fault displacement observed at the oil well location was taken as the minimum threshold. If the fault displacement exceeds this value, the associated faults are considered developed. By combining the aforementioned paleo-hydrocarbon potential values with the method for determining fault–cap configuration, it is possible to identify regions where faults induce lateral diversion effects on hydrocarbon migration along sand bodies.

4. Results and Comparison

4.1. The Role of the Aogula Fault in Terminating the Migration of Hydrocarbon Along the S Reservoir and Its Relationship with Hydrocarbon Accumulation

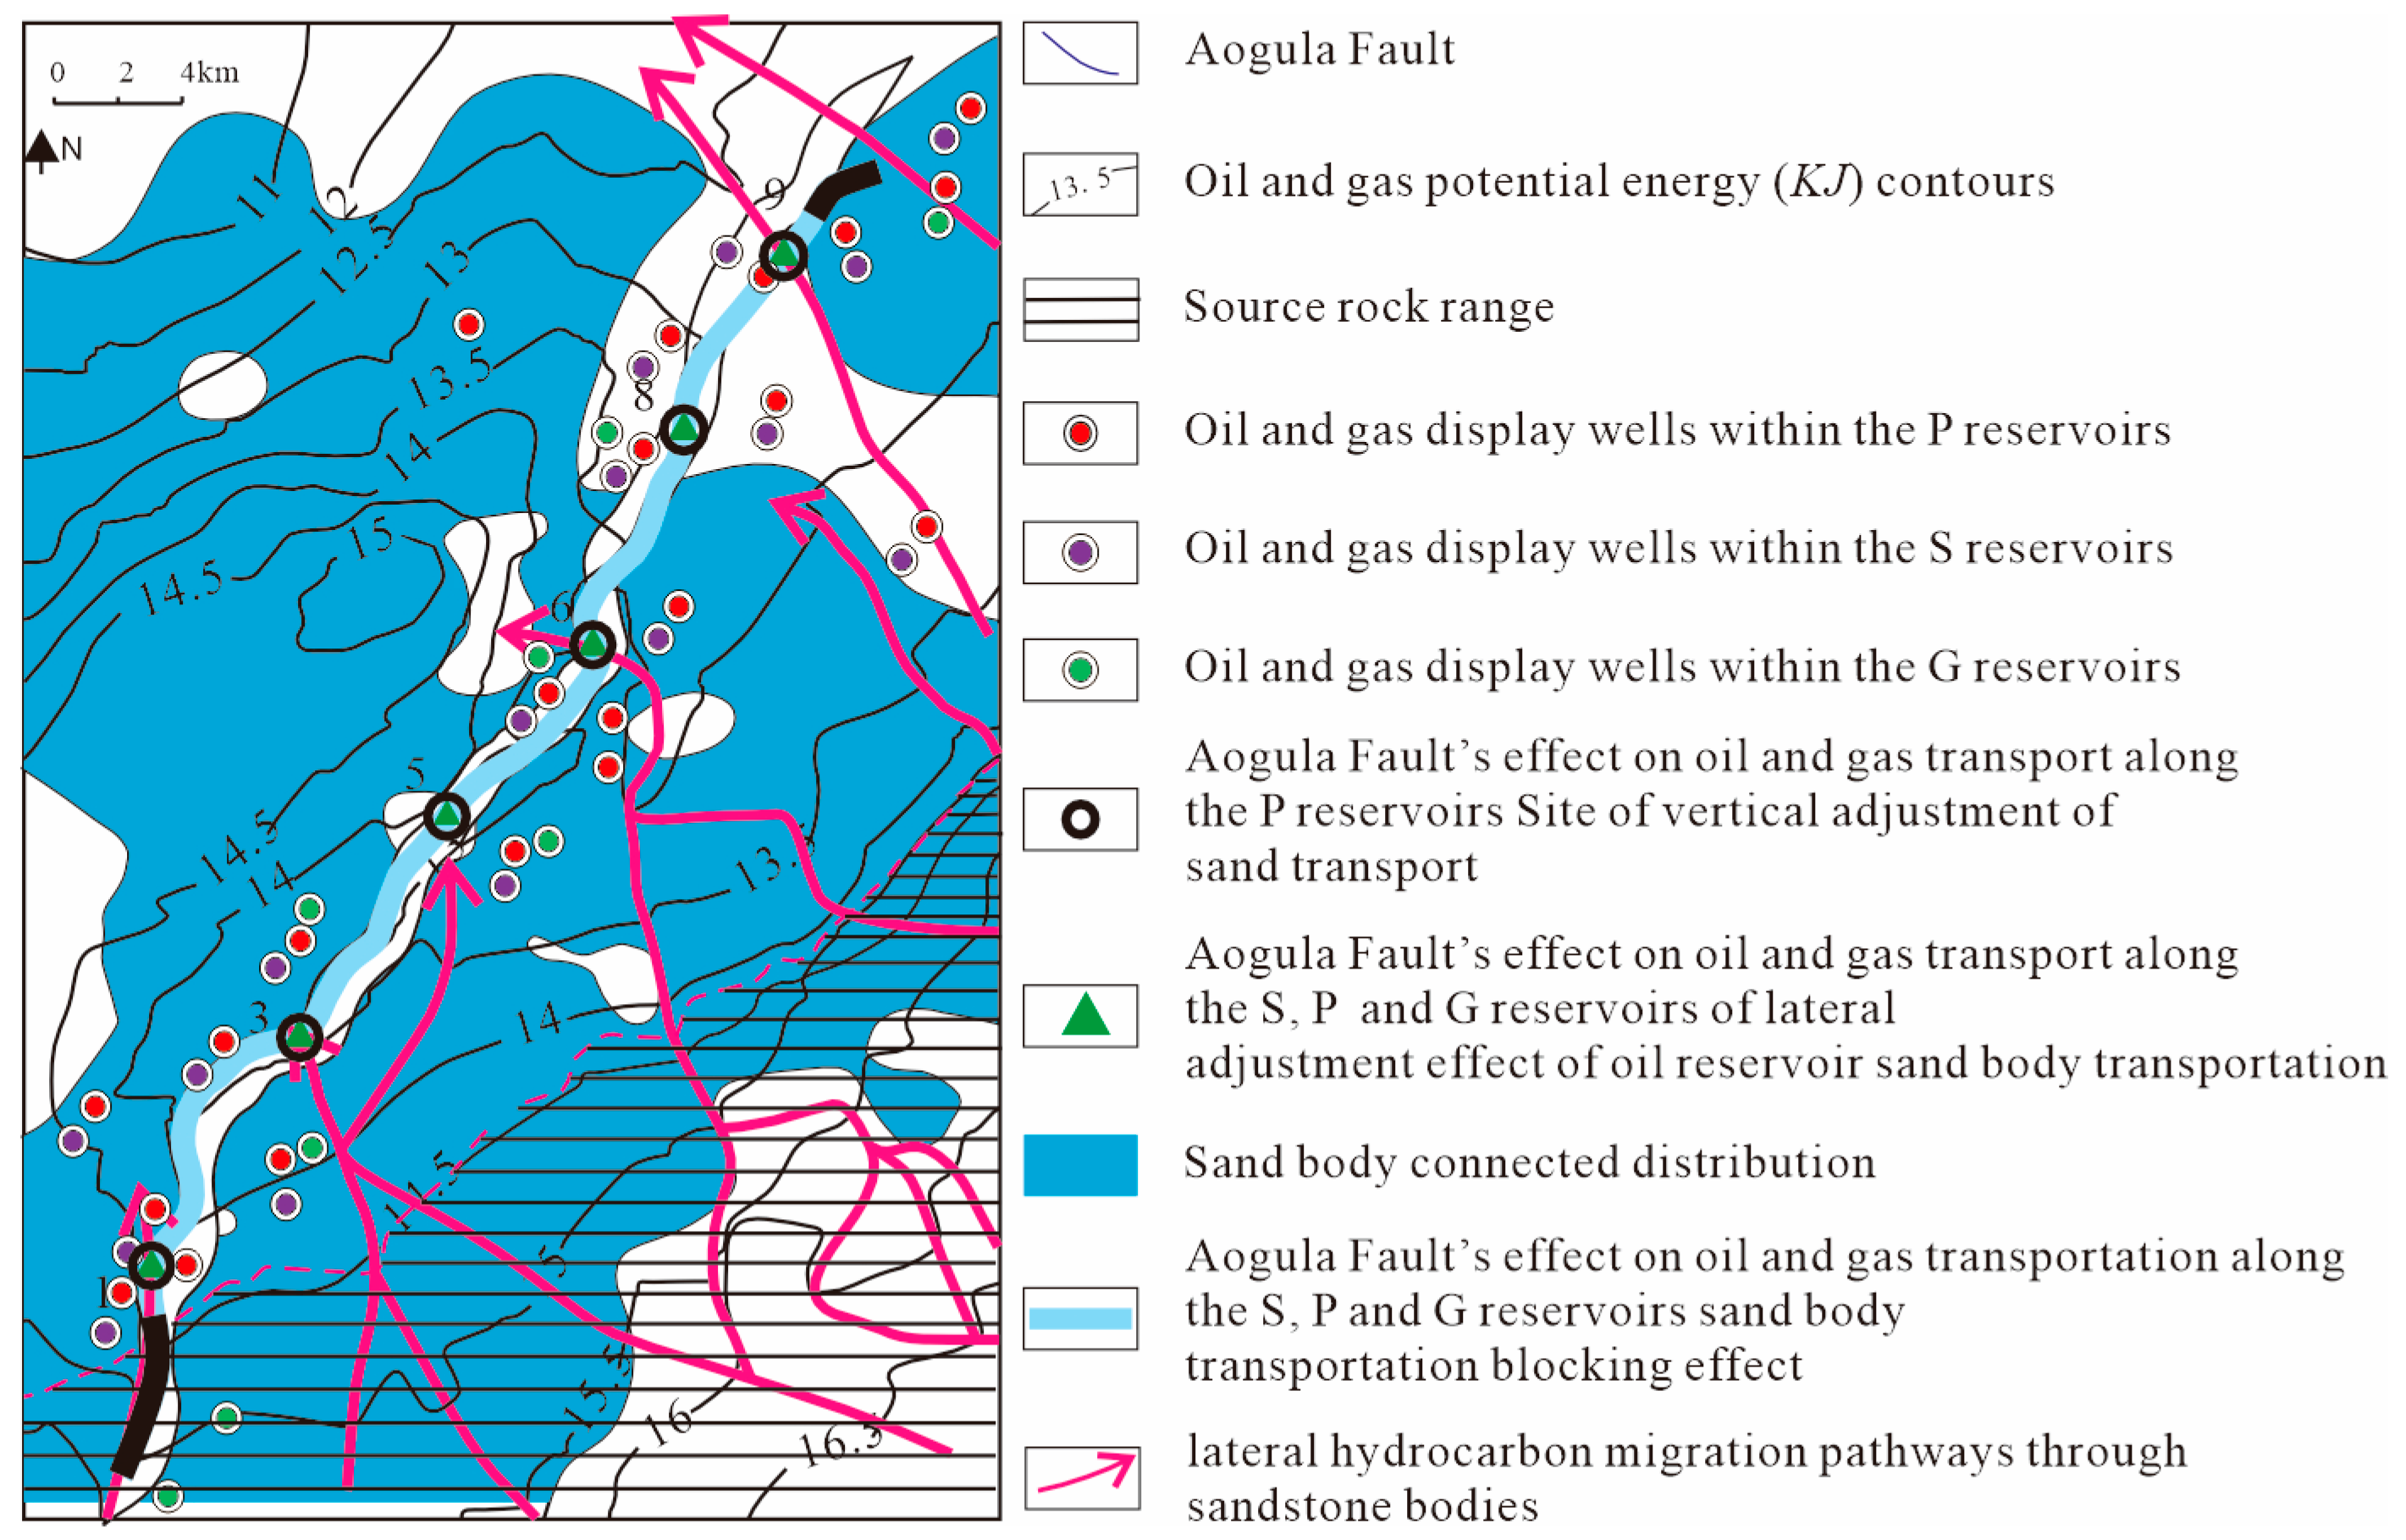
Hydrocarbons generated by the source rock of the K2qn1 in the Gulong Depression (on the eastern side) migrate upward along the oil source fault, connecting the source rock of the K2qn1 with the S reservoir, and the active fault at the termination of the Mingshui Formation deposition. Sealed by the regional mudstone caprock of the K2n2, hydrocarbons then enter the sand bodies of the S reservoir. Under the influence of buoyancy, they migrate laterally along these sand bodies toward the Aogula Fault to the west. Six distinct hydrocarbon migration pathways transport hydrocarbons along the sand bodies to the Aogula Fault in the S reservoir during the hydrocarbon accumulation period at the end of the Mingshui Formation. Figure 6 shows that the six migration pathways are evenly distributed from southwest to northeast.
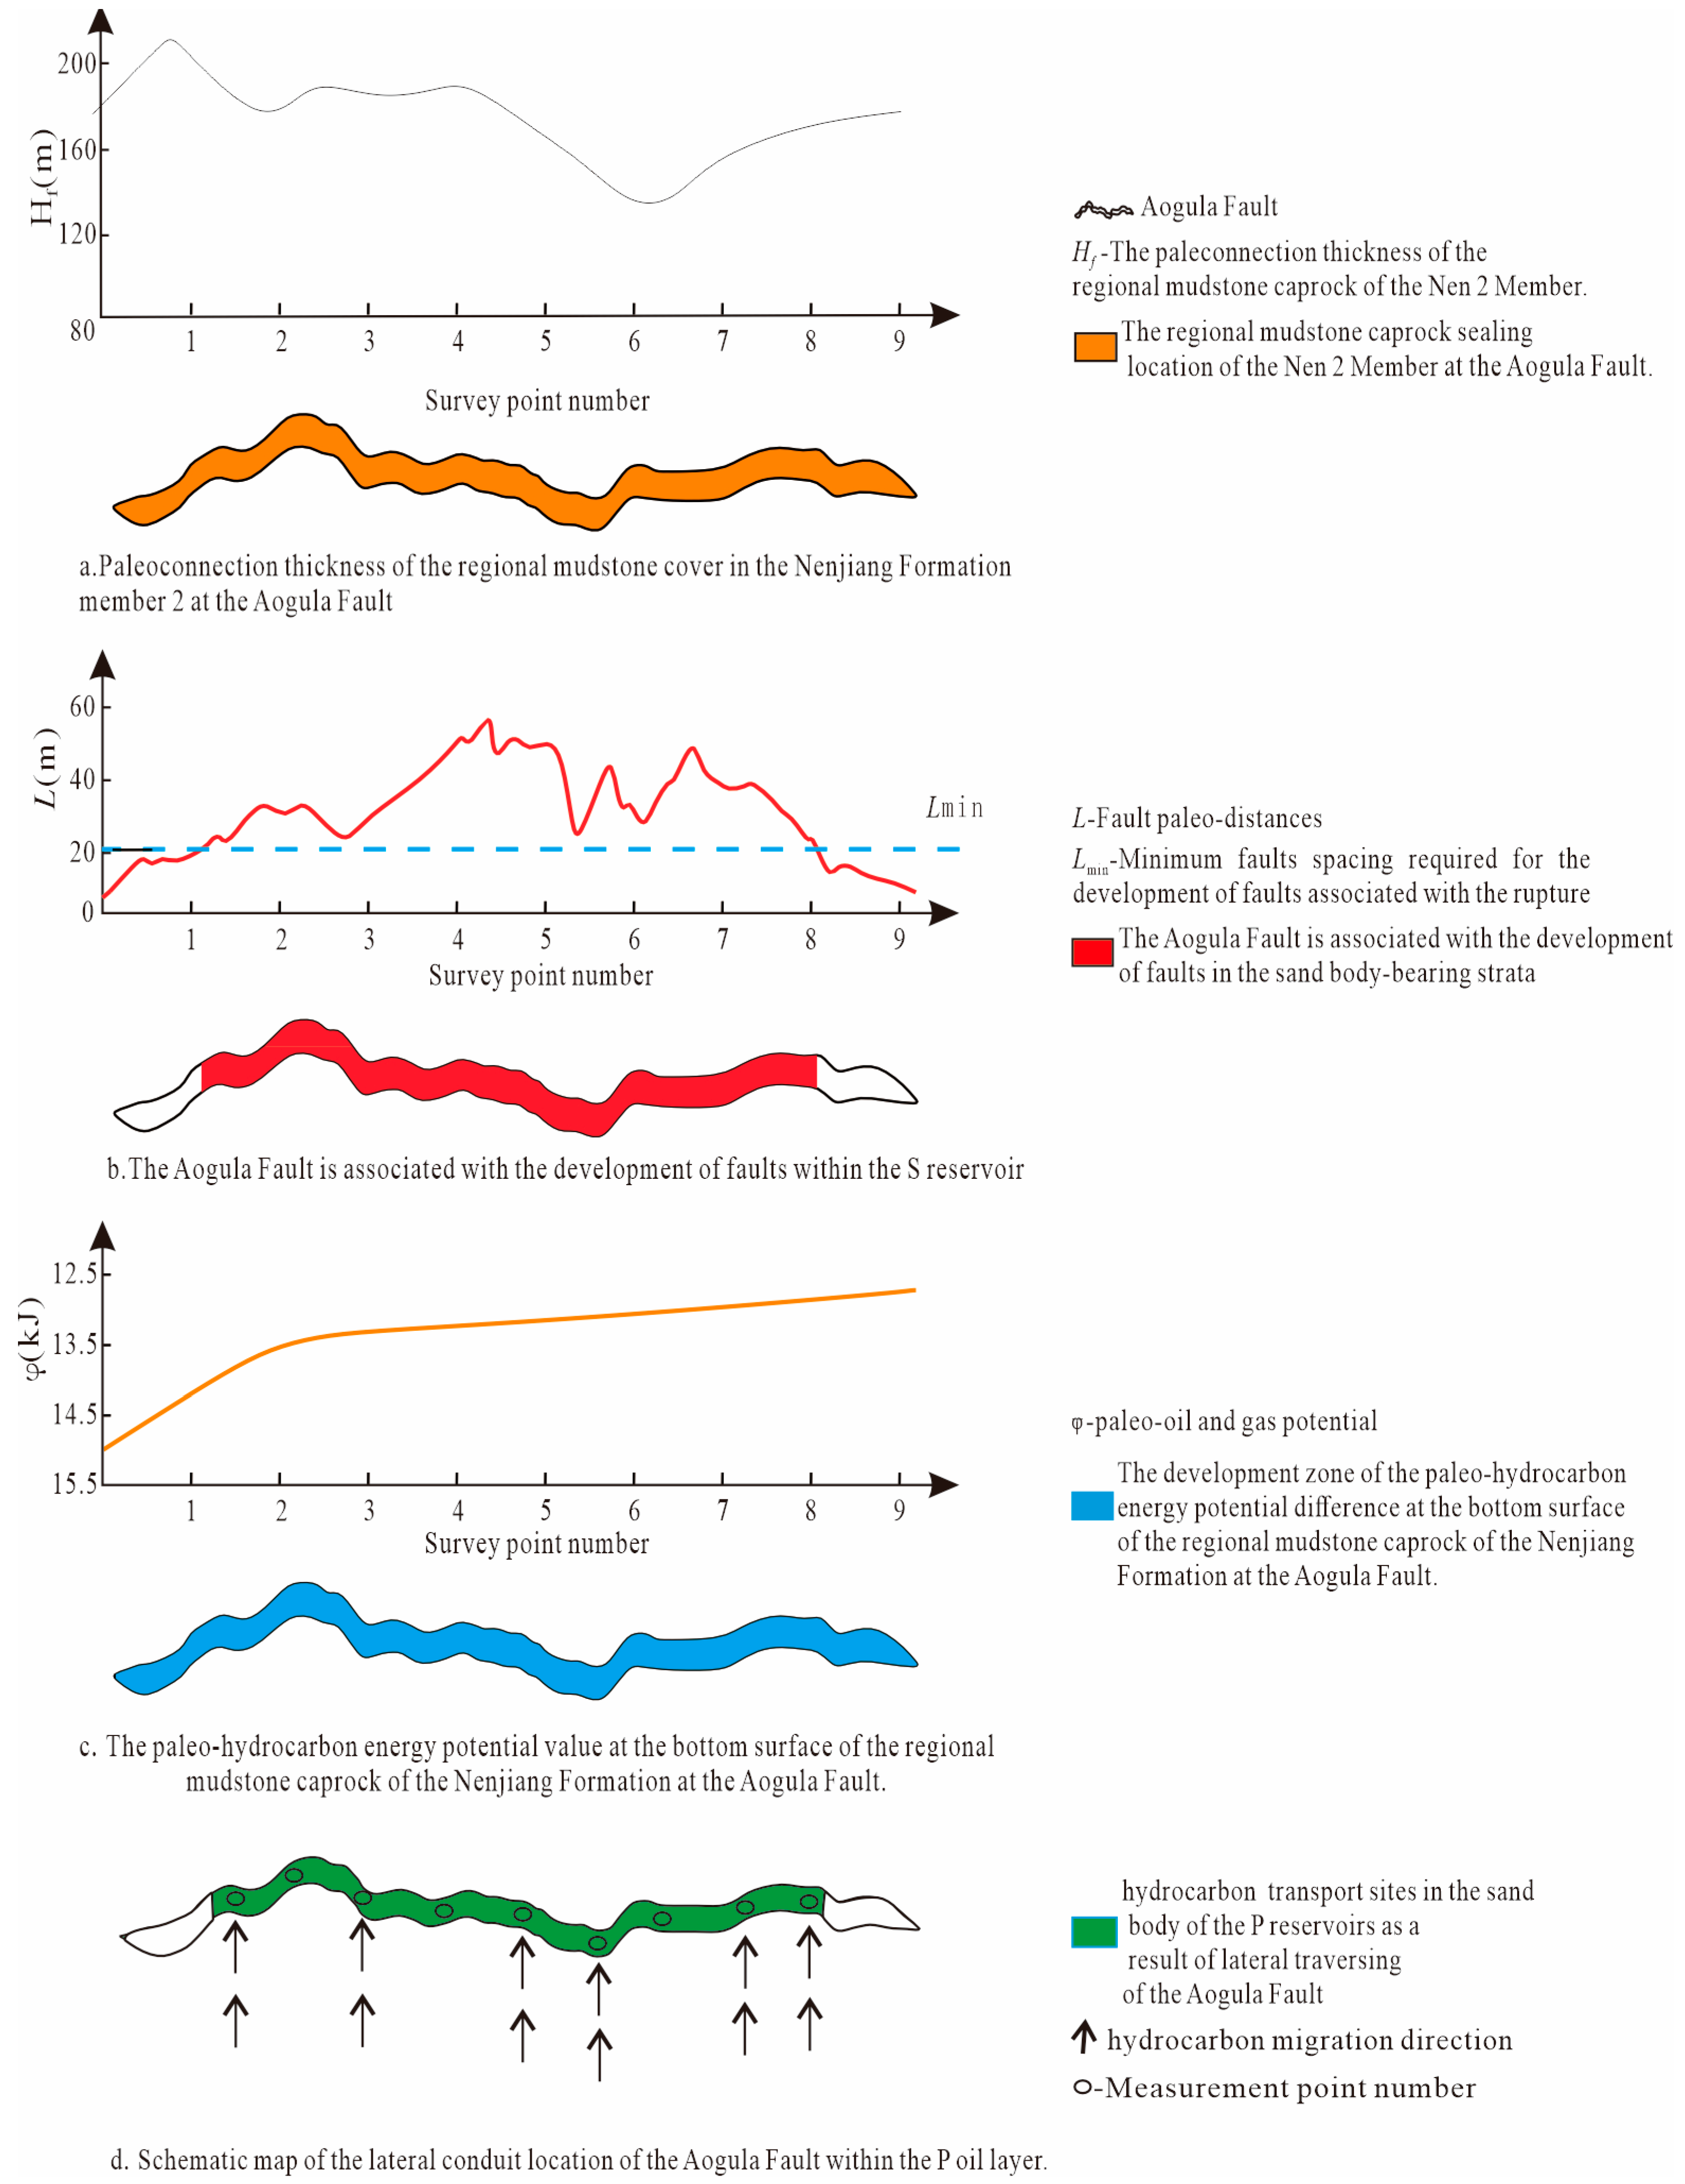
The 3D seismic interpretation shows that the K2n2 mudstone caprock at the Aogula Fault is thick (>150 m generally, >200 m locally), concentrated in the western segment (Figure 7a), while the fault has a small throw (<60 m maximum displacement, Figure 7b). This means the fault does not breach the caprock, leaving the caprock sealed and explaining the absence of hydrocarbons in overlying strata at the fault zone and terminating upward hydrocarbon migration along the fault.
As shown in Figure 6, during the late depositional stage of the Mingshui Formation, the S, P, and G reservoirs on the northwestern side of the Aogula Fault constituted a high paleo-potential zone, effectively terminating the lateral hydrocarbon migration across the fault through the reservoir sand bodies. This indicates that the fault exhibits lateral sealing characteristics across all three reservoirs. By integrating the hydrocarbon migration pathways along the sand bodies, the sealing sections of the K2n2 regional mudstone caprock at the fault, and the identified lateral sealing zones, it is evident that, except for the northernmost tip, the Aogula Fault terminates hydrocarbon migration along the S, P, and G reservoirs, promoting hydrocarbon accumulation. Notably, six eastward hydrocarbon migration pathways are obstructed upon reaching the fault due to the high paleo-potential zone on the northwestern side, leading to the cessation of lateral migration and subsequent hydrocarbon entrapment (Figure 8). This mechanism fundamentally explains the hydrocarbon discoveries encountered in the S, P, and G reservoirs along the fault. Only the northern tip of the fault exhibits lateral diversion characteristics, enabling hydrocarbons to bypass the fault and continue migrating northwestward.

4.2. The Location of Vertical Diversion Effect of the Aogula Fault on the Migration of Hydrocarbon Along the S, P, and G Reservoirs and Its Relationship with Hydrocarbon Accumulation

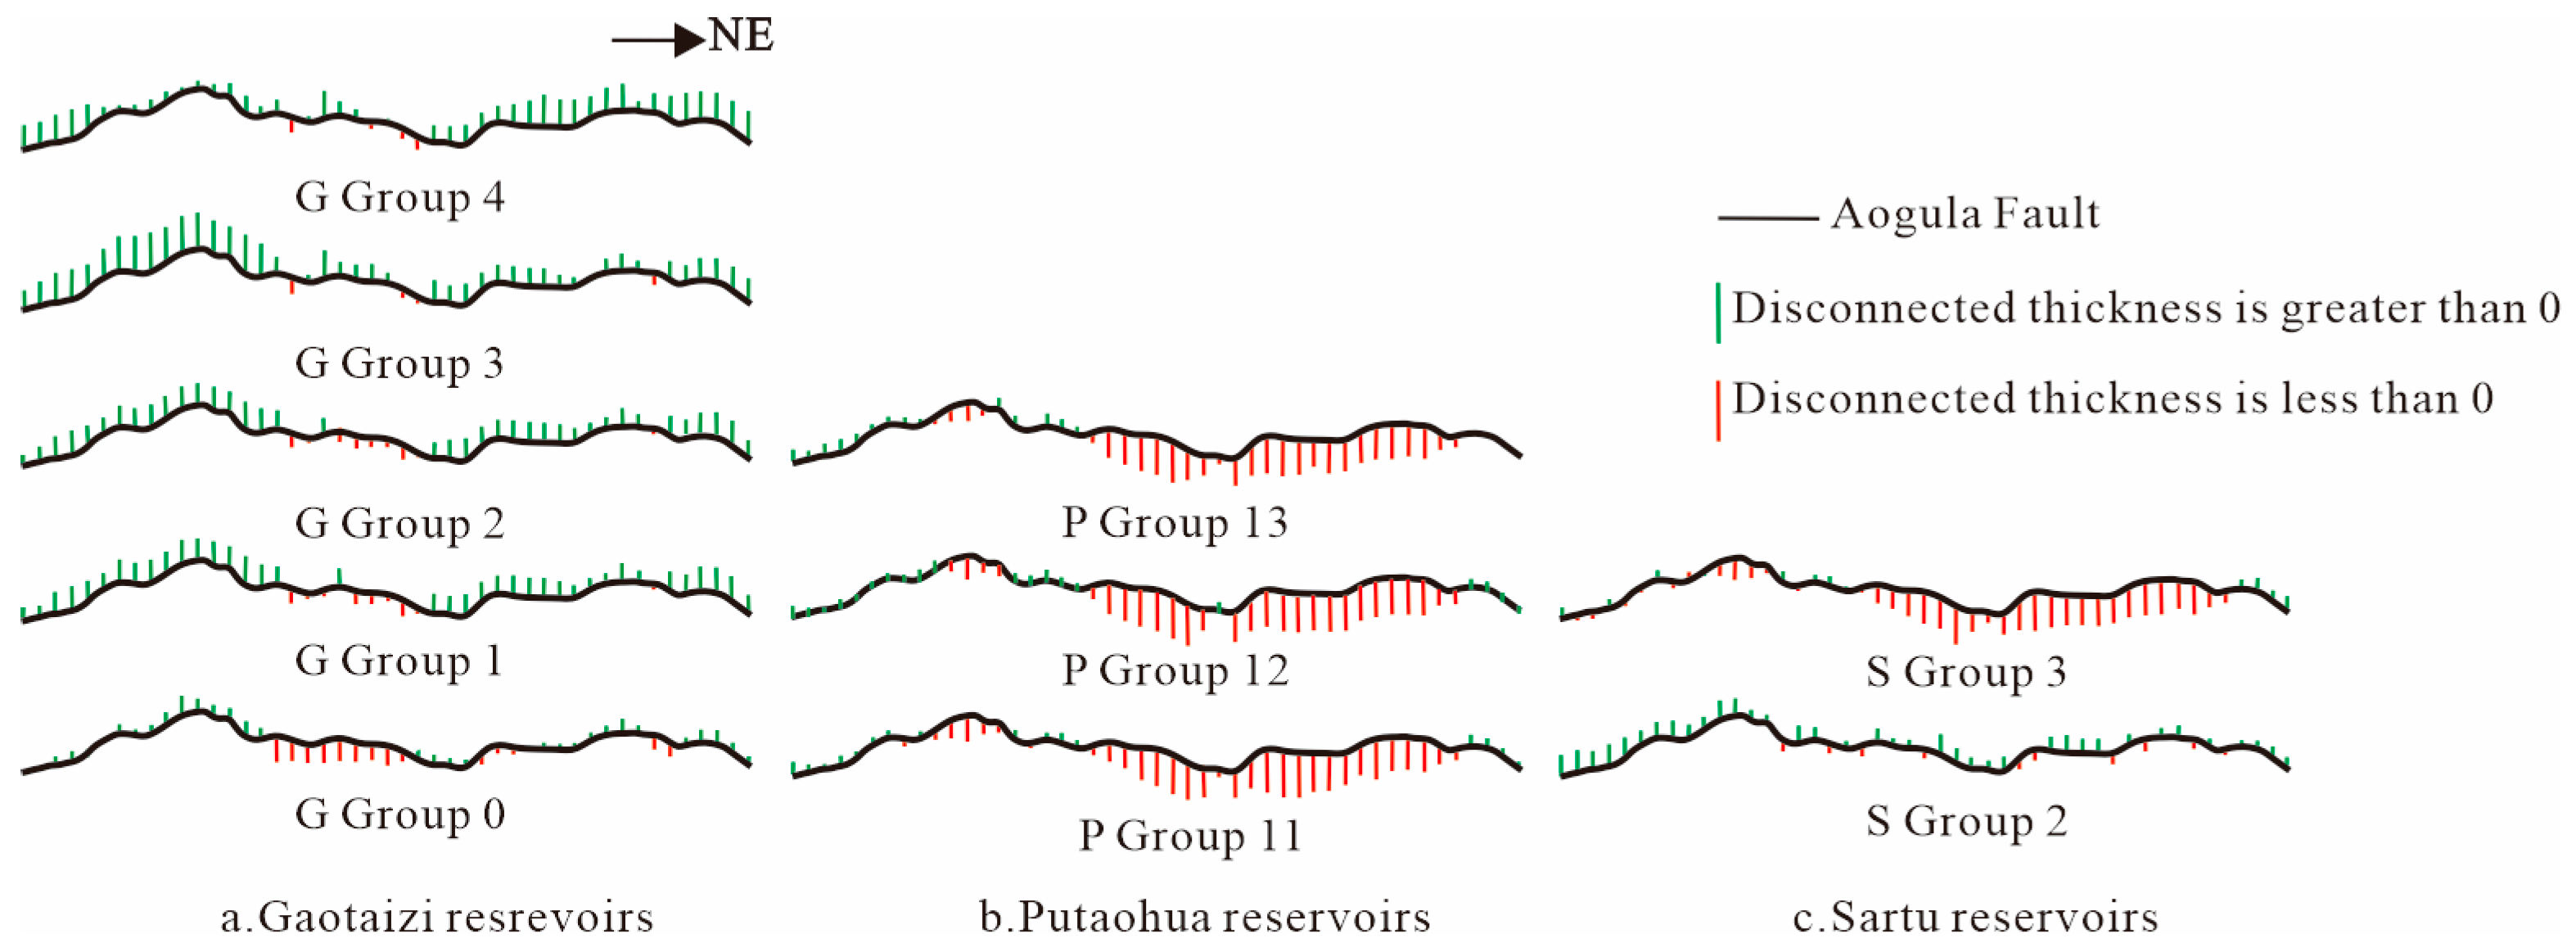
Drilling results indicate that the thickness of the mudstone interlayers in the S, P, and G reservoirs at the Aogula Fault is relatively thin, generally less than 5 m, with some sections reaching up to 10 m. The minimum displacement along the Aogula Fault is 15 m, with maximum displacements exceeding 50 m. These mudstone interlayers in the S, P, and G reservoirs are either completely severed by the fault or connected by relatively thin segments. Figure 9 shows that the mudstone interlayers along the Aogula Fault are not sealed. By overlaying the vertical, non-sealed sections of hydrocarbon migration along the S, P, and G sand bodies with the fault and caprock match, six locations where the Aogula Fault influences the vertical diversion of hydrocarbon migration can be identified. These locations are distributed uniformly from the southwest to the northeast along the fault, as shown in Figure 6.
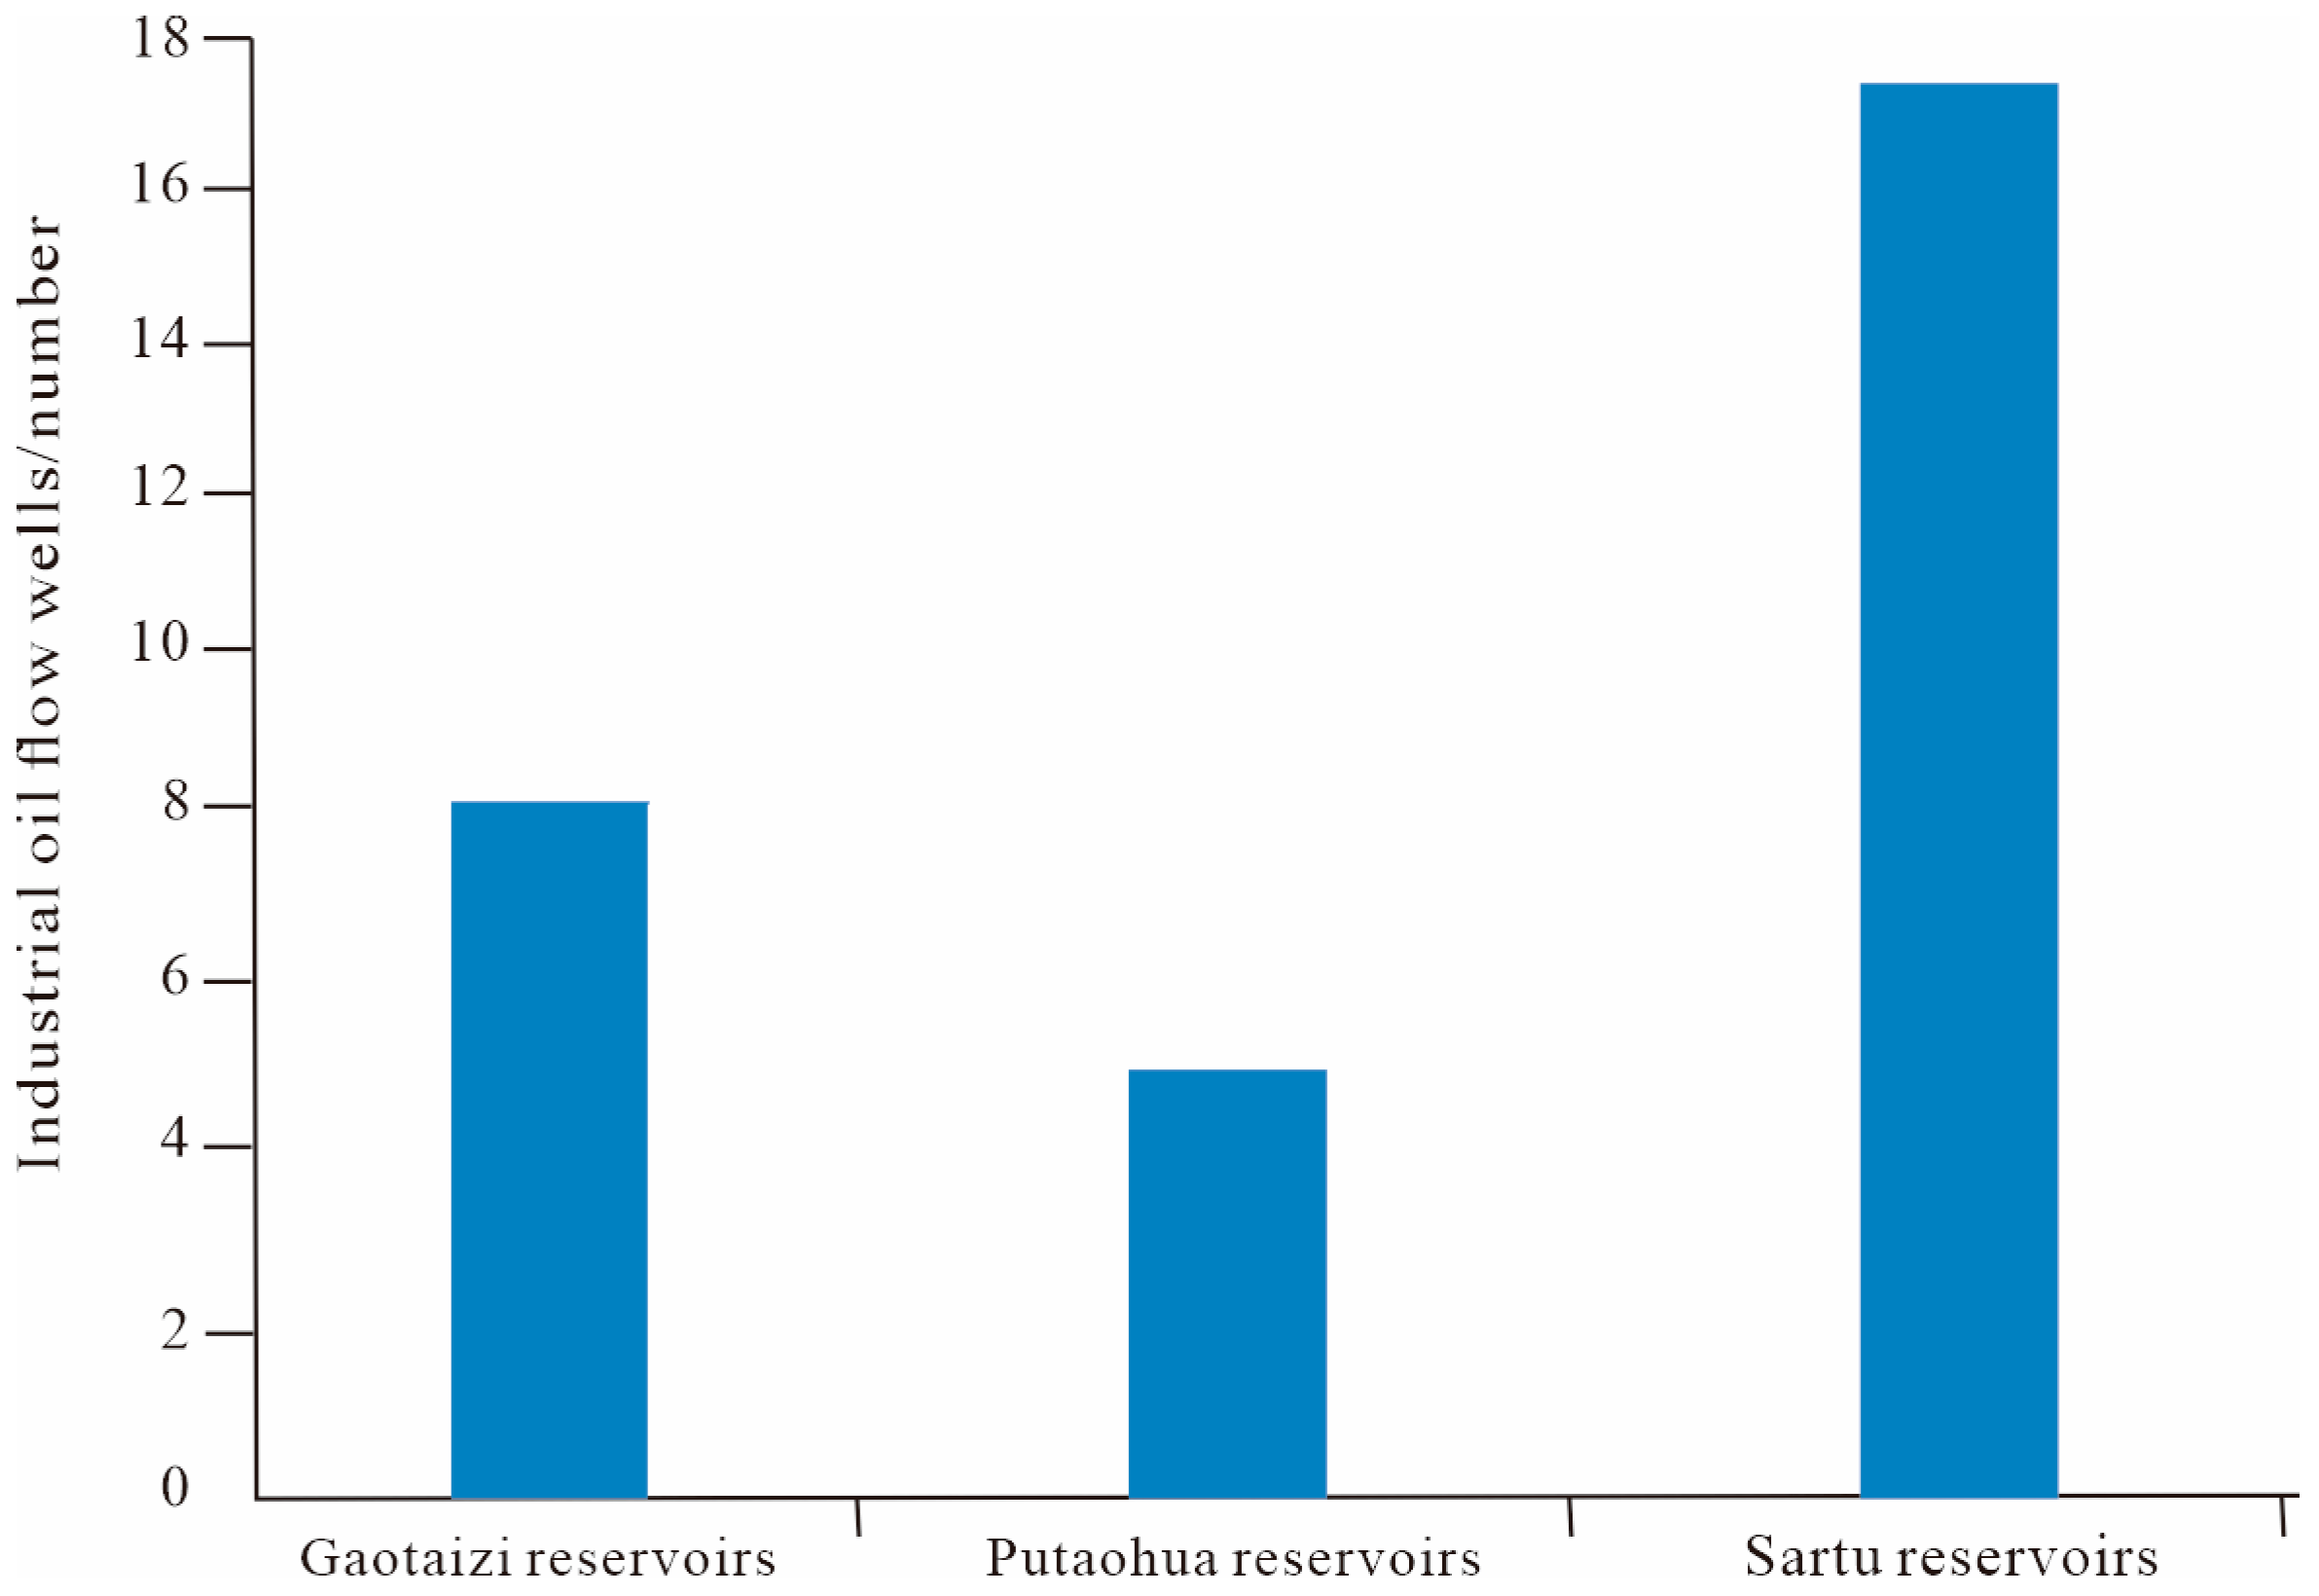
Figure 6 illustrates the six locations along the Aogula Fault where vertical diversion occurs in the migration of hydrocarbons along the sand bodies of the S, P, and G reservoirs. This diversion facilitates the migration of hydrocarbons from the G and P reservoirs to the S reservoir, where they accumulate and are distributed (Figure 10b). This process directly explains why hydrocarbon reserves in the S reservoir at the Aogula Fault are significantly higher than those in the G and P reservoirs (Figure 8).

4.3. The Lateral Diversion Effect of the Aogula Fault on the Migration of Hydrocarbon Along the S, P, and G Reservoirs and Its Relationship with Hydrocarbon Accumulation

As shown in Figure 7b, during the hydrocarbon accumulation period at the end of the Mingshui Formation deposition, the paleo-fault throw of the Aogula Fault within the S, P, and G reservoirs reaches over 50 m, primarily distributed in the central section, while the paleo-throws at the eastern and western ends are minimal, approximately 5 m. Statistical analysis of paleo-fault throw values across different survey lines and their relationship with hydrocarbon shows in the S, P, and G reservoirs indicates that the minimum paleo-throw associated with fracture development and hydrocarbon occurrence near the eastern and western ends of the Aogula Fault in the S reservoir is 21 m. This value is considered the minimum threshold fault throw for fracture development in the study area, as illustrated in Figure 11. This threshold represents the smallest fault throw observed at hydrocarbon-bearing locations and serves as a critical value: faults with throws below this value are insufficiently developed to facilitate hydrocarbon migration and accumulation. Only when the fault throw exceeds this threshold can associated faults develop to sufficiently support hydrocarbon migration and the reservoir. Below this value, no significant hydrocarbon accumulation occurs. By integrating these findings with spatial distribution data, we conclude that, except for the eastern and western termini, the entire Aogula Fault exhibits well-developed associated faults within the reservoir (Figure 7b). These fault-rich zones serve as effective conduits for hydrocarbon migration and accumulation.
The ancient oil potential energy value of the Aogula Fault at the bottom surface of the mudstone caprock of the K2n2 is calculated using Equation (1), as shown in Figure 7c. The ancient hydrocarbon potential energy value of the Aogula Fault increases gradually from southwest to northeast along the fault. The entire fault exhibits a zone of varying hydrocarbon potential energy. The results of this study align with the current structural trend of the Aogula Fault, which shows a gradual increase in potential energy from southwest to northeast. This correlation supports the credibility of the calculated results.
From the overlay analysis, it is evident that the Aogula Fault exhibits three key conditions for hydrocarbon migration along the sand bodies of the S, P, and G reservoirs. As shown in Figure 10c, By superimposing the sealing sections of the mudstone caprock of the K2n2, the associated fault development along the Aogula Fault in the S, P, and G reservoirs, and the potential energy differences at the base of the mudstone caprock, we can identify the location of lateral diversion of the Aogula Fault affecting hydrocarbon migration, as shown in the model in Figure 7. As illustrated in Figure 7d, except for the eastern and western ends, the remaining sections of the Aogula Fault correspond to the location of lateral diversion, where hydrocarbon migration occurs along the sand bodies of the S, P, and G reservoirs.
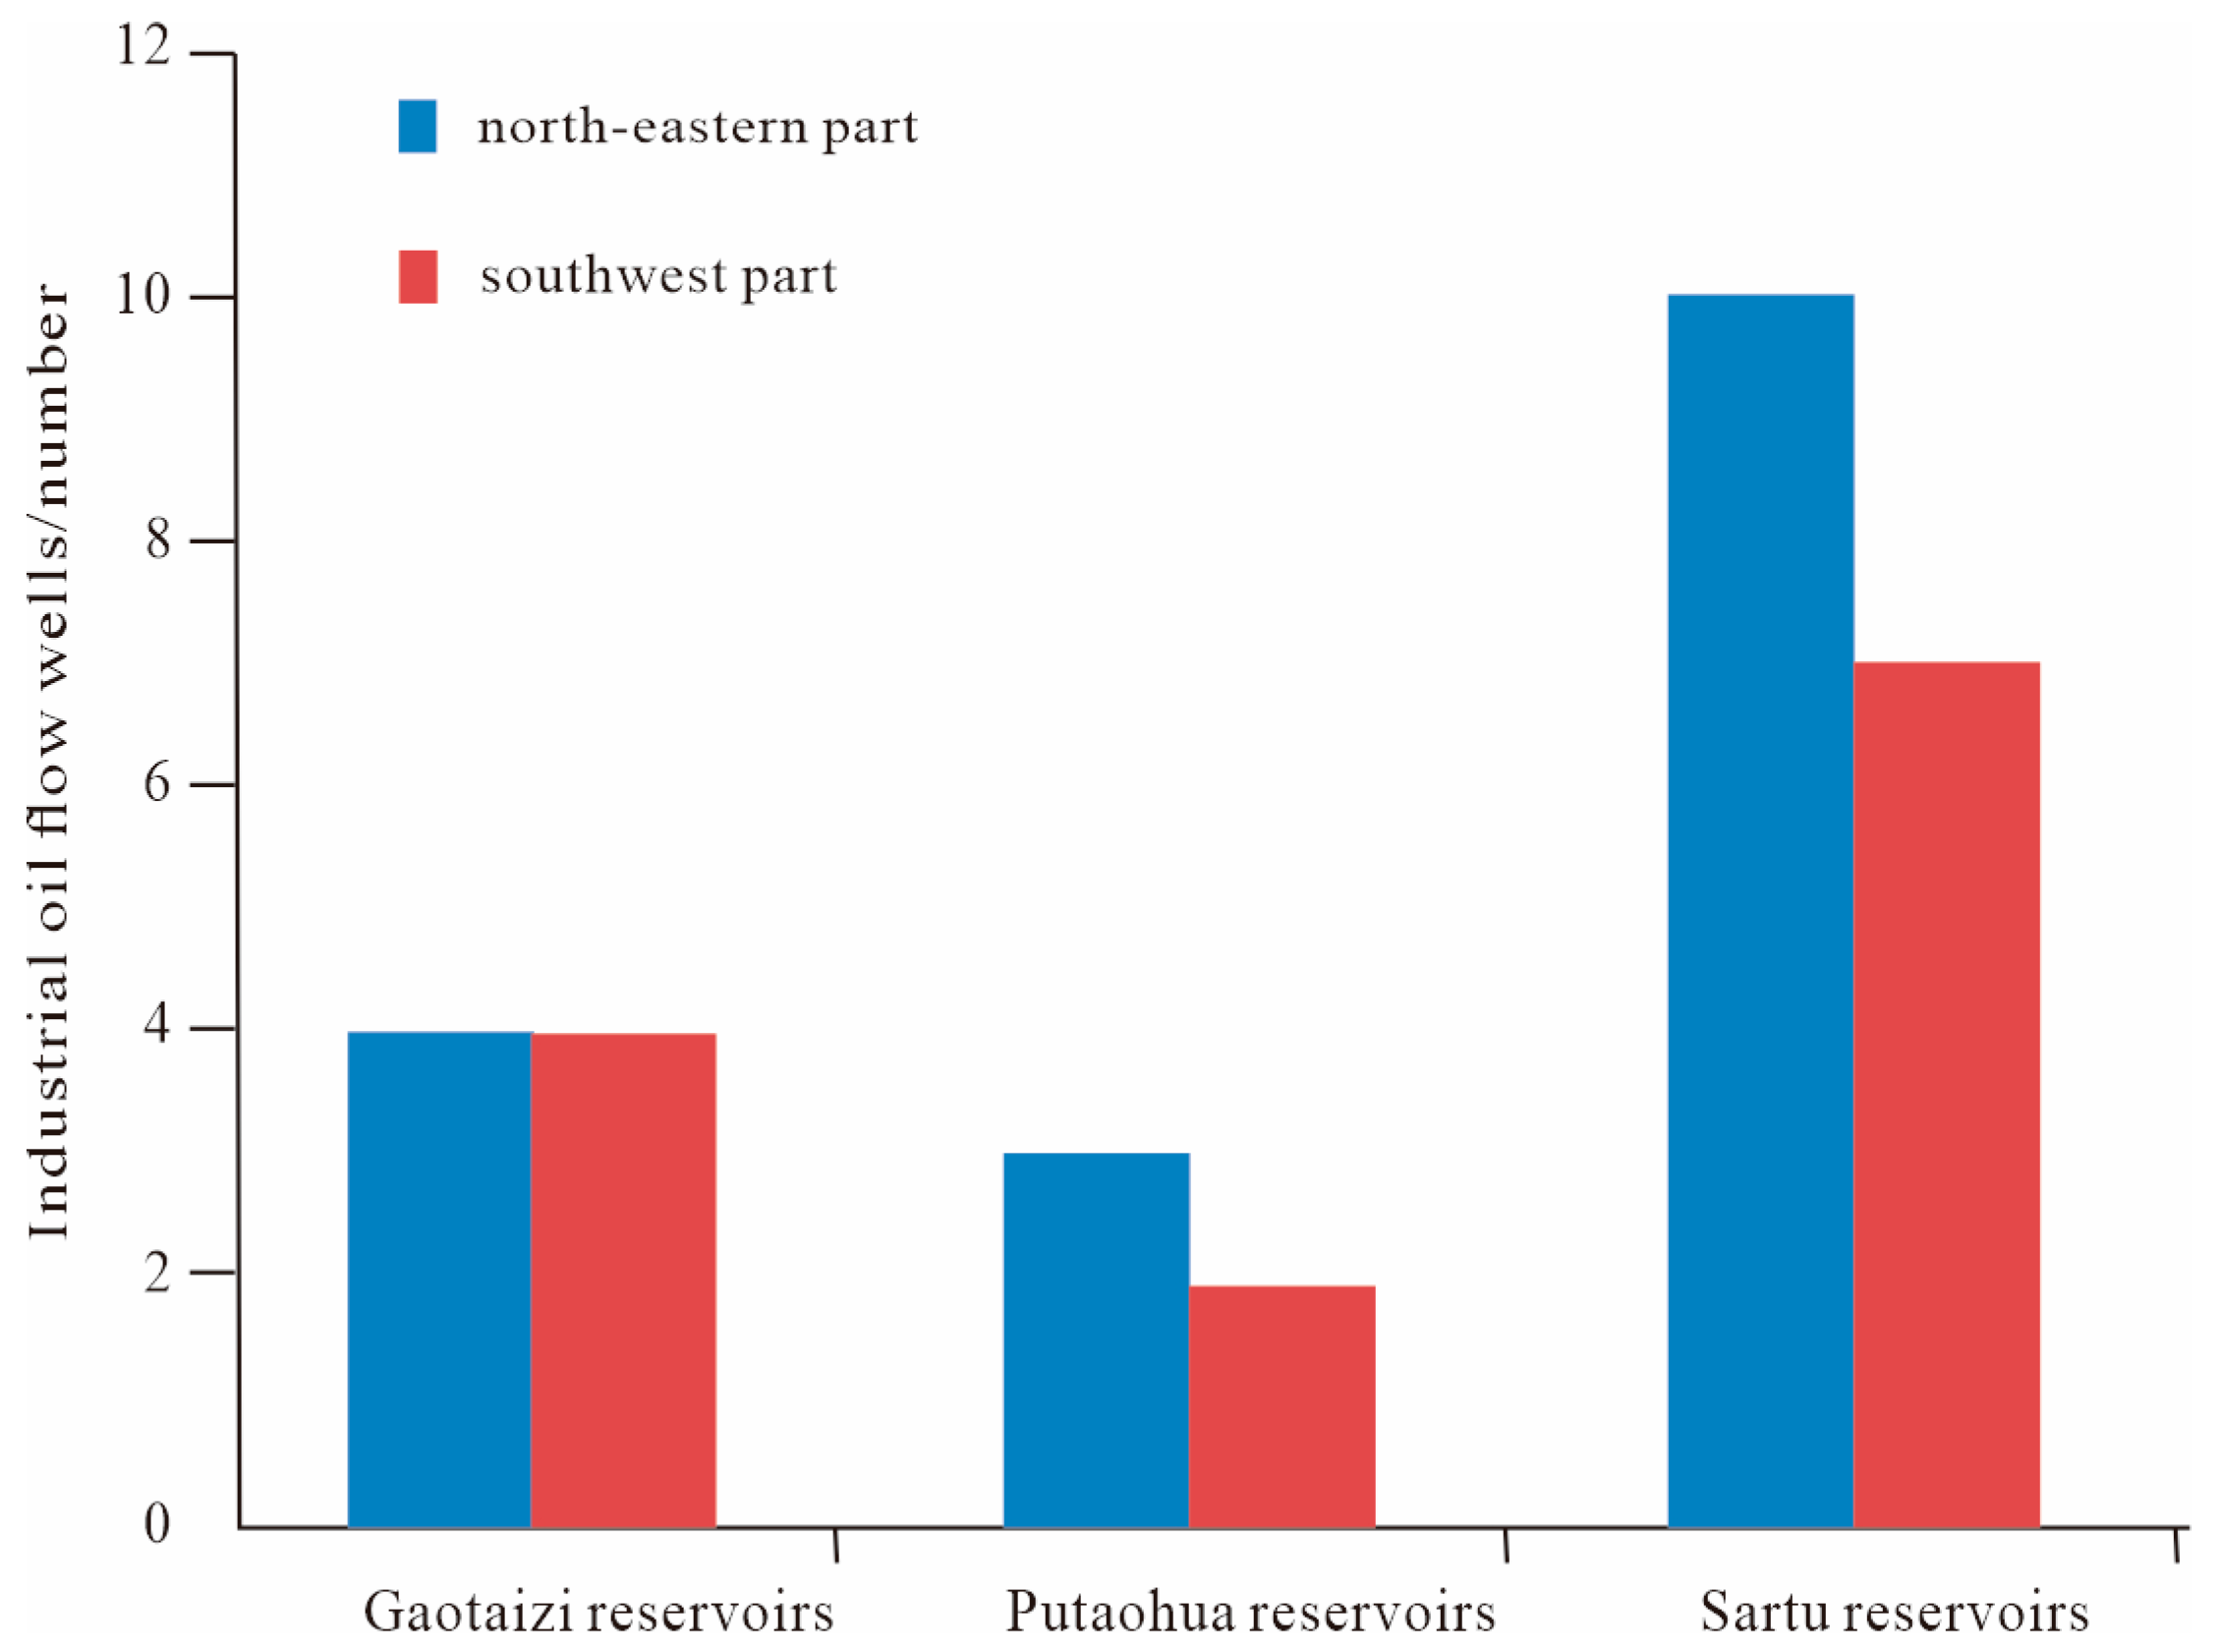
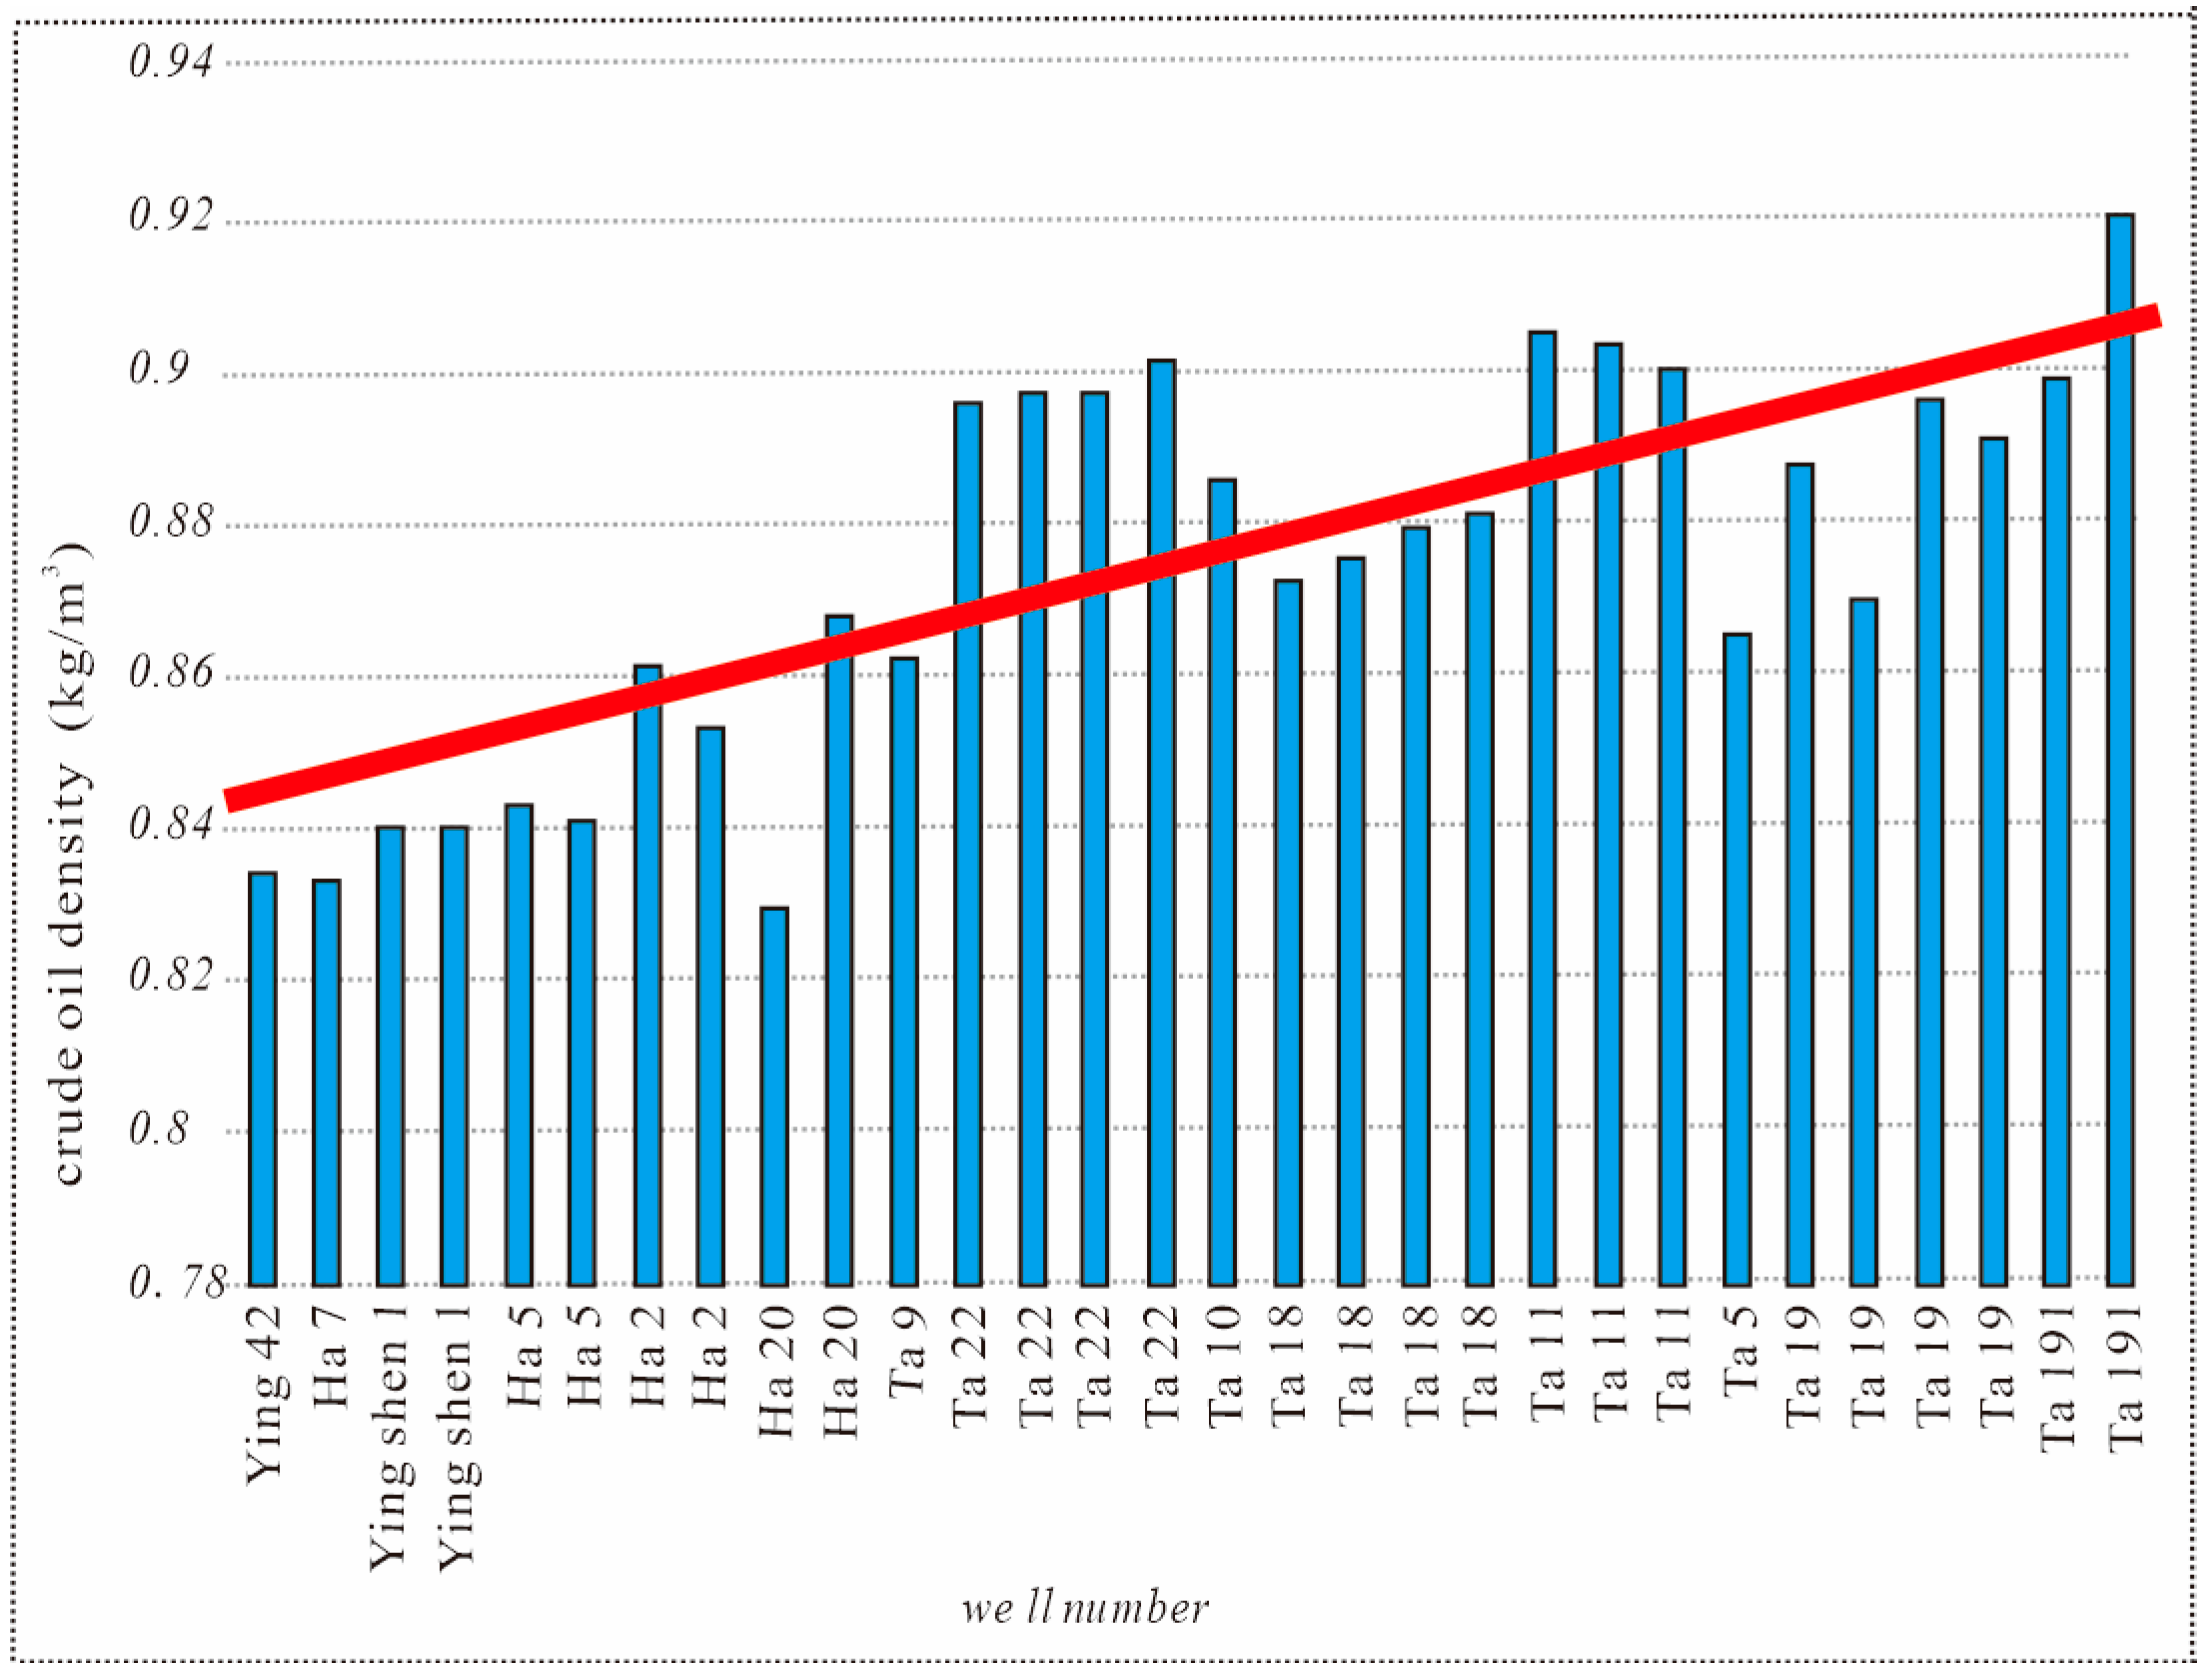
As shown in Figure 7, the development of the lateral diversion zone along the sand bodies of the S, P, and G reservoirs, induced by the Aogula Fault, facilitates the lateral migration of hydrocarbons from the southwestern S, P, and G reservoirs toward the northeastern reservoir. This migration leads to significantly higher hydrocarbon reserves in the northeastern part of the Aogula Fault compared to the southwestern part, as illustrated in Figure 12. Statistical analysis of crude oil density from different wells in the S reservoir along the Aogula Fault reveals that crude oil density increases from southwest to northeast. This gradient indicates that the hydrocarbons in the S reservoir undergo lateral migration in an oxidizing environment, which increases crude oil density (Figure 13). This further confirms that the Aogula Fault exerts a lateral diversion effect on hydrocarbon migration along the S reservoir sand bodies.

5. Discussion

As shown in Figure 6, Figure 8 and Figure 12, the Aogula Fault controls hydrocarbon enrichment through three primary mechanisms: termination, vertical diversion, and lateral diversion. These mechanisms have respectively resulted in hydrocarbon accumulation in the P reservoir, vertical migration of hydrocarbons from the G and P reservoirs into the S reservoir, and lateral migration of hydrocarbons within the S reservoir from the southwest to the northeast, thereby influencing the spatial distribution of hydrocarbon enrichment.
The above analysis unequivocally demonstrates the validity of the identified lateral diversion zones along the P reservoir sand bodies controlled by the Aogula Fault. Compared with conventional approaches, the method employed in this study not only delineates the fault’s influence on hydrocarbon migration pathways along sand bodies and the locations of vertical diversion but also enables the identification of lateral diversion zones. This offers a more comprehensive and accurate representation of the fault’s role in hydrocarbon migration along sand bodies and provides critical insights into the distribution patterns of hydrocarbons around the fault. However, due to current limitations in understanding and the stage of research, the methodologies used in this study have two notable shortcomings: (1) the determination of the connectivity distribution trend of sand bodies is based on the lower limit value of the sand-to-rock ratio required for sand body connectivity. This value is derived through statistical analysis of known wells, and its accuracy is primarily influenced by the level of hydrocarbon exploration. The greater the level of exploration and the number of wells, the more accurate the sand-to-rock ratio will be, thus enhancing the precision of the sand body connectivity distribution. Conversely, in areas with lower exploration activity, this determination may be less accurate. (2) The fault-associated fault development zone is determined by the lower limit of fault spacing required for fault-associated fault development, which is also obtained through statistical analysis of known wells. Similar to the sand body analysis, the accuracy of this determination is influenced by the extent of hydrocarbon exploration. The higher the exploration level and the greater the number of wells, the more accurate the lower limit of fault displacement will be, leading to a more precise determination of the fault-associated fault development zone. In contrast, in areas with less exploration, this analysis may be less accurate.

6. Conclusions

(1) Except for the northernmost segment, the Aogula Fault serves as a termination zone for hydrocarbon migration along the S, P, and G sand bodies, promoting hydrocarbon accumulation at the fault location.
(2) Six vertical diversion zones are identified along the Aogula Fault, evenly distributed from southwest to northeast. These zones facilitate vertical migration of hydrocarbons from the G and P reservoirs into the S reservoir, resulting in a higher degree of hydrocarbon enrichment in the S reservoir compared to the others.
(3) Except for the eastern and western ends, the remaining segments of the Aogula Fault function as lateral diversion zones. These zones enable hydrocarbons from the southwestern portions of the S, P, and G reservoirs to migrate laterally toward the northeast, leading to significantly greater hydrocarbon accumulation in the northeastern part of the study area.

Author Contributions

Conceptualization, X.L. and L.Y.; methodology, X.L. and L.S.; validation, Q.W., G.L., and B.H.; formal analysis, Q.W., J.L. and B.H.; investigation, J.L., Z.C. and Y.D.; resources, B.Z. and J.Z.; data curation, G.L., Z.C. and Y.D.; writing—original draft preparation, X.L. and L.Y.; writing—review and editing, X.L. and L.S.; supervision, B.Z. and J.Z.; project administration, B.Z. and F.J.; funding acquisition, F.J. All authors have read and agreed to the published version of the manuscript.

Funding

This research was funded by the Natural Science Foundation of Heilongjiang Province (Grant No. LH2022D010).

Data Availability Statement

The original contributions presented in the study are included in the article. Further inquiries can be directed to the corresponding author.

Conflicts of Interest

Author Xiaomei Li was employed by the Exploration and Development Research Institute, Daqing Oilfield Company Ltd. The remaining authors declare that the research was conducted in the absence of any commercial or financial relationships that could be construed as a potential conflict of interest.

References

  1. He, C.; Zhang, Y.; Ying, Y.; Hong, Y. A method for predicting fault-induced changes of hydrocarbon migration pathways along sand carrier beds and its application. Oil Gas Geol. 2023, 44, 1300–1307. [Google Scholar]
  2. Fu, G.; Zhao, K.; Han, X. Lateral distributary migration of hydrocarbon from fault to sand body in the Nan 1 formation of the Sudeerte area, and its relationship with hydrocarbon accumulation. Geophys. Prospect. Pet 2022, 61, 564–570. [Google Scholar]
  3. Sun, G. Structural Evolution and Fault-controlled hydrocarbon Accumulation Mechanism of Aogula Fault Zone in Songliao Basin. Spec. Oil Gas Reserv. 2024, 31, 45. [Google Scholar]
  4. Cao, Q.; Yang, J.; Wu, W. Methods of eroded strata thickness restoration in sedimentary basins and its advancement. China Pet. Explor. 2007, 12, 41. [Google Scholar]
  5. Wu, T.; Wu, C.; Qi, Y.; Yao, A.; Zhang, S.; Xu, Y.; Shi, J. Quantitative resumption method of stratum denudation thickness and its application in Junggar Basin: A case study on the Permian Lower Urho Formation in Block 8 of Karamay Oilfield. J. Paleogeogr. 2015, 17, 81–90. [Google Scholar]
  6. Yu, Y. Actions of Aogula Fault on the oil lateral migration in S, P and G oil reservoirs. Pet. Geol. Oilfield Dev. Daqing 2021, 40, 47–54. [Google Scholar]
  7. Fu, G.; Zhou, H.C. Role of Aogula Fault zone in hydrocarbon migration and accumulation in Daqing placanticline and its west. Spec. Oil Gas Reserv. 2006, 13, 40–44. [Google Scholar]
  8. Lei, M.; Cai, L.; Wang, X. Control of Aogula Fault on hydrocarbon migration in Songliao Basin. Pet. Explor. China 1999, 4, 24. [Google Scholar]
  9. Wang, Y. Favorable hydrocarbon transport sites of Aogula Fault and their influence on hydrocarbon accumulation pattern of S, P, and G reservoirss. Spec. Oil Gas Reserv. 2021, 28, 10. [Google Scholar]
  10. Liu, Y.; Lei, L. Hydrocarbon accumulation law of the second and third reservoirs in the western slope of Songliao Basin. Spec. Oil Gas Reserv. 2009, 16, 36–39. [Google Scholar]
  11. Sun, G.; Feng, Z.; Sun, X. Analysis of hydrocarbon accumulation characteristics in the northern section of the western slope of Songliao Basin. Geol. Sci. 2009, 44, 478–489. [Google Scholar]
  12. Meng, Q.; Bai, X.; Zang, W.; Fu, L.; Xue, T.; Bao, L. Accumulation and exploration of petroleum reservoirs in west slope of northern Songliao Basin, China. Pet. Explor. Dev. 2020, 47, 254–265. [Google Scholar] [CrossRef]
  13. Wu, K.; Guo, J.; Yao, W.; Liu, Q.; Liu, Y.; Liu, B. Analysis on the structure and accumulation differences of Hongche fault belt in Junggar Basin. Geol. Resour. 2019, 28, 57–65. [Google Scholar]
  14. Qi, R. Fault characterization and its influences on gas accumulation in the Eastern Haggin Banner of Ordos Basin. Spec. Oil Gas Reserv. 2019, 26, 58–63. [Google Scholar]
  15. Zhong, W.; Jiang, Y.; Zhang, S.; Wang, Y.; Zhang, Y.; Wu, K. Sealing Evaluation of Hongche Fault Zone in Cheguai Area, Junggar Basin, Northwest China. Xinjiang Geol. 2019, 37, 368–372. [Google Scholar]
  16. Yin, J.; Wei, L.; Fan, C.; Xu, C.; Man, Y.; Hu, D.; Hou, D. Oil origin and migration direction in Wushi sag, Beibuwan Basin, South China Sea. Mar. Pet. Geol. 2022, 145, 105848. [Google Scholar] [CrossRef]
  17. Yang, C.; Zhuang, J.; Zhang, R.; Yang, H.; Zhang, S. Quantitative Evaluation of Fault Sealing Property in Kongqueting Area of Xihu Sag, East China Sea. Offshore Oil 2023, 43, 7–11. [Google Scholar]
  18. Jiang, Q.; Yong, L.; Jian, W.; Wan, M.; Qing, H. Controlling factors of multi-source and multi-stage complex hydrocarbon accumulation and favorable exploration area in the Hongche fault zone, Junggar Basin. Nat. Gas Geosci. 2023, 34, 807–820. [Google Scholar]
  19. Fu, X.; Wang, P.; Seng, J.; Fu, G.; Lv, Y. Migration and accumulation of oil and gas in a simple slope area: A case study on the Wastern Slope of the Northern Songliao Basin. Geol. Rev. 2006, 52, 523–531. [Google Scholar]
  20. Zhang, W.; Yang, Y. Study on oil and gas source and migration of Western slope area in northern Songliao Basin. Pet. Geol. Oilfield Dev. Daqing 2005, 24, 17–22. [Google Scholar]
  21. He, X.; Du, Y.; OuYang, J. Study on the controlling effect of faults on natural gas accumulation in the central uplift zone of Qiongdongnan Basin. Fault-Block Oil Amp 2024, 7, 36–50. [Google Scholar]
  22. Cao, L.; Yang, D.; Li, X.; Yu, Z.; Li, J.; Mao, C. Prediction method and application of lateral migration area of hydrocarbon along sandstone about transport fault. Energy Environ. Prot. 2019, 41, 44–50. [Google Scholar]
  23. Fu, G.; Han, X. Methodology for predicting transfer position of hydrocarbon transmission from fault in depression to sand body in slope area. J. China Univ. Pet. Ed. Nat. Sci 2021, 45, 42–50. [Google Scholar]
  24. Fu, Z. Prediction method and its application for active fault preventing locations of hydrocarbon transport in sand bodies during accumulation period. Pet. Geol. Oilfield Dev. Daqing 2023, 42, 37–44. [Google Scholar]
  25. Zhang, J. Prediction Method of the Distribution Position of hydrocarbon Transporting Form from Oil Source Fault to Sand Body:A Case Study of Sha-1 Lower Submember of Gangdong Fault in Qikou Area. J. Jilin Univ. (Earth Sci. Ed.) 2023, 53, 1352–1361. [Google Scholar]
  26. Tan, K.; Wei, P.; Lv, X.; Mou, Z. Research and application of quantitative recovery method of stratigraphic paleo-thickness-Taking Ludong area of Junggar Basin as an example. Nat. Gas Geosci. 2005, 48–50+59+9. [Google Scholar]
  27. Green, F.P.; Duddy, R.I.; Japsen, P. Multiple episodes of regional exhumation and inversion identified in the UK Southern North Sea based on integration of palaeothermal and palaeoburial indicators. In Petroleum Geology Conference Series; Geological Society: London, UK, 2018; pp. 47–65. [Google Scholar]
  28. Shao, X.; Liu, Z.; Cui, W. Restoration of the paleo-burial depth of strata in a sedimentary basin. Pet. Explor. Dev. 1999, 53-55+5+13. [Google Scholar]
  29. Fu, X.; Sun, B.; Wang, H. Quantitative characterization of fault segmentation growth and its application in hydrocarbon accumulation research. J. China Univ. Min. Technol. 2015, 44, 271–281. [Google Scholar]
  30. Fan, Y.; Xiang, C.; Yang, S. Hydrocarbon Accumulation Characteristics of the Perdido Fold Belt, Burgos Basin, Gulf of Mexico—A Comparison Between the Central and Eastern Regions. Energies 2025, 18, 1834. [Google Scholar] [CrossRef]
  31. Fu, G.; Li, S. Restoration Method and Application of the Sealing Evolution History of Mudstone Caprocks Damaged by Faulting. Earth Sci. 2017, 42, 1590–1598. [Google Scholar]
  32. Huang, H.; Luo, Q.; Wang, C.; Jiang, X.; Zhu, Z. Restoration of Mesozoic erosion thickness in the west of northern margin of Qaidam Basin and its geological significance. Pet. Explor. Dev. 2006, 44–48. [Google Scholar]
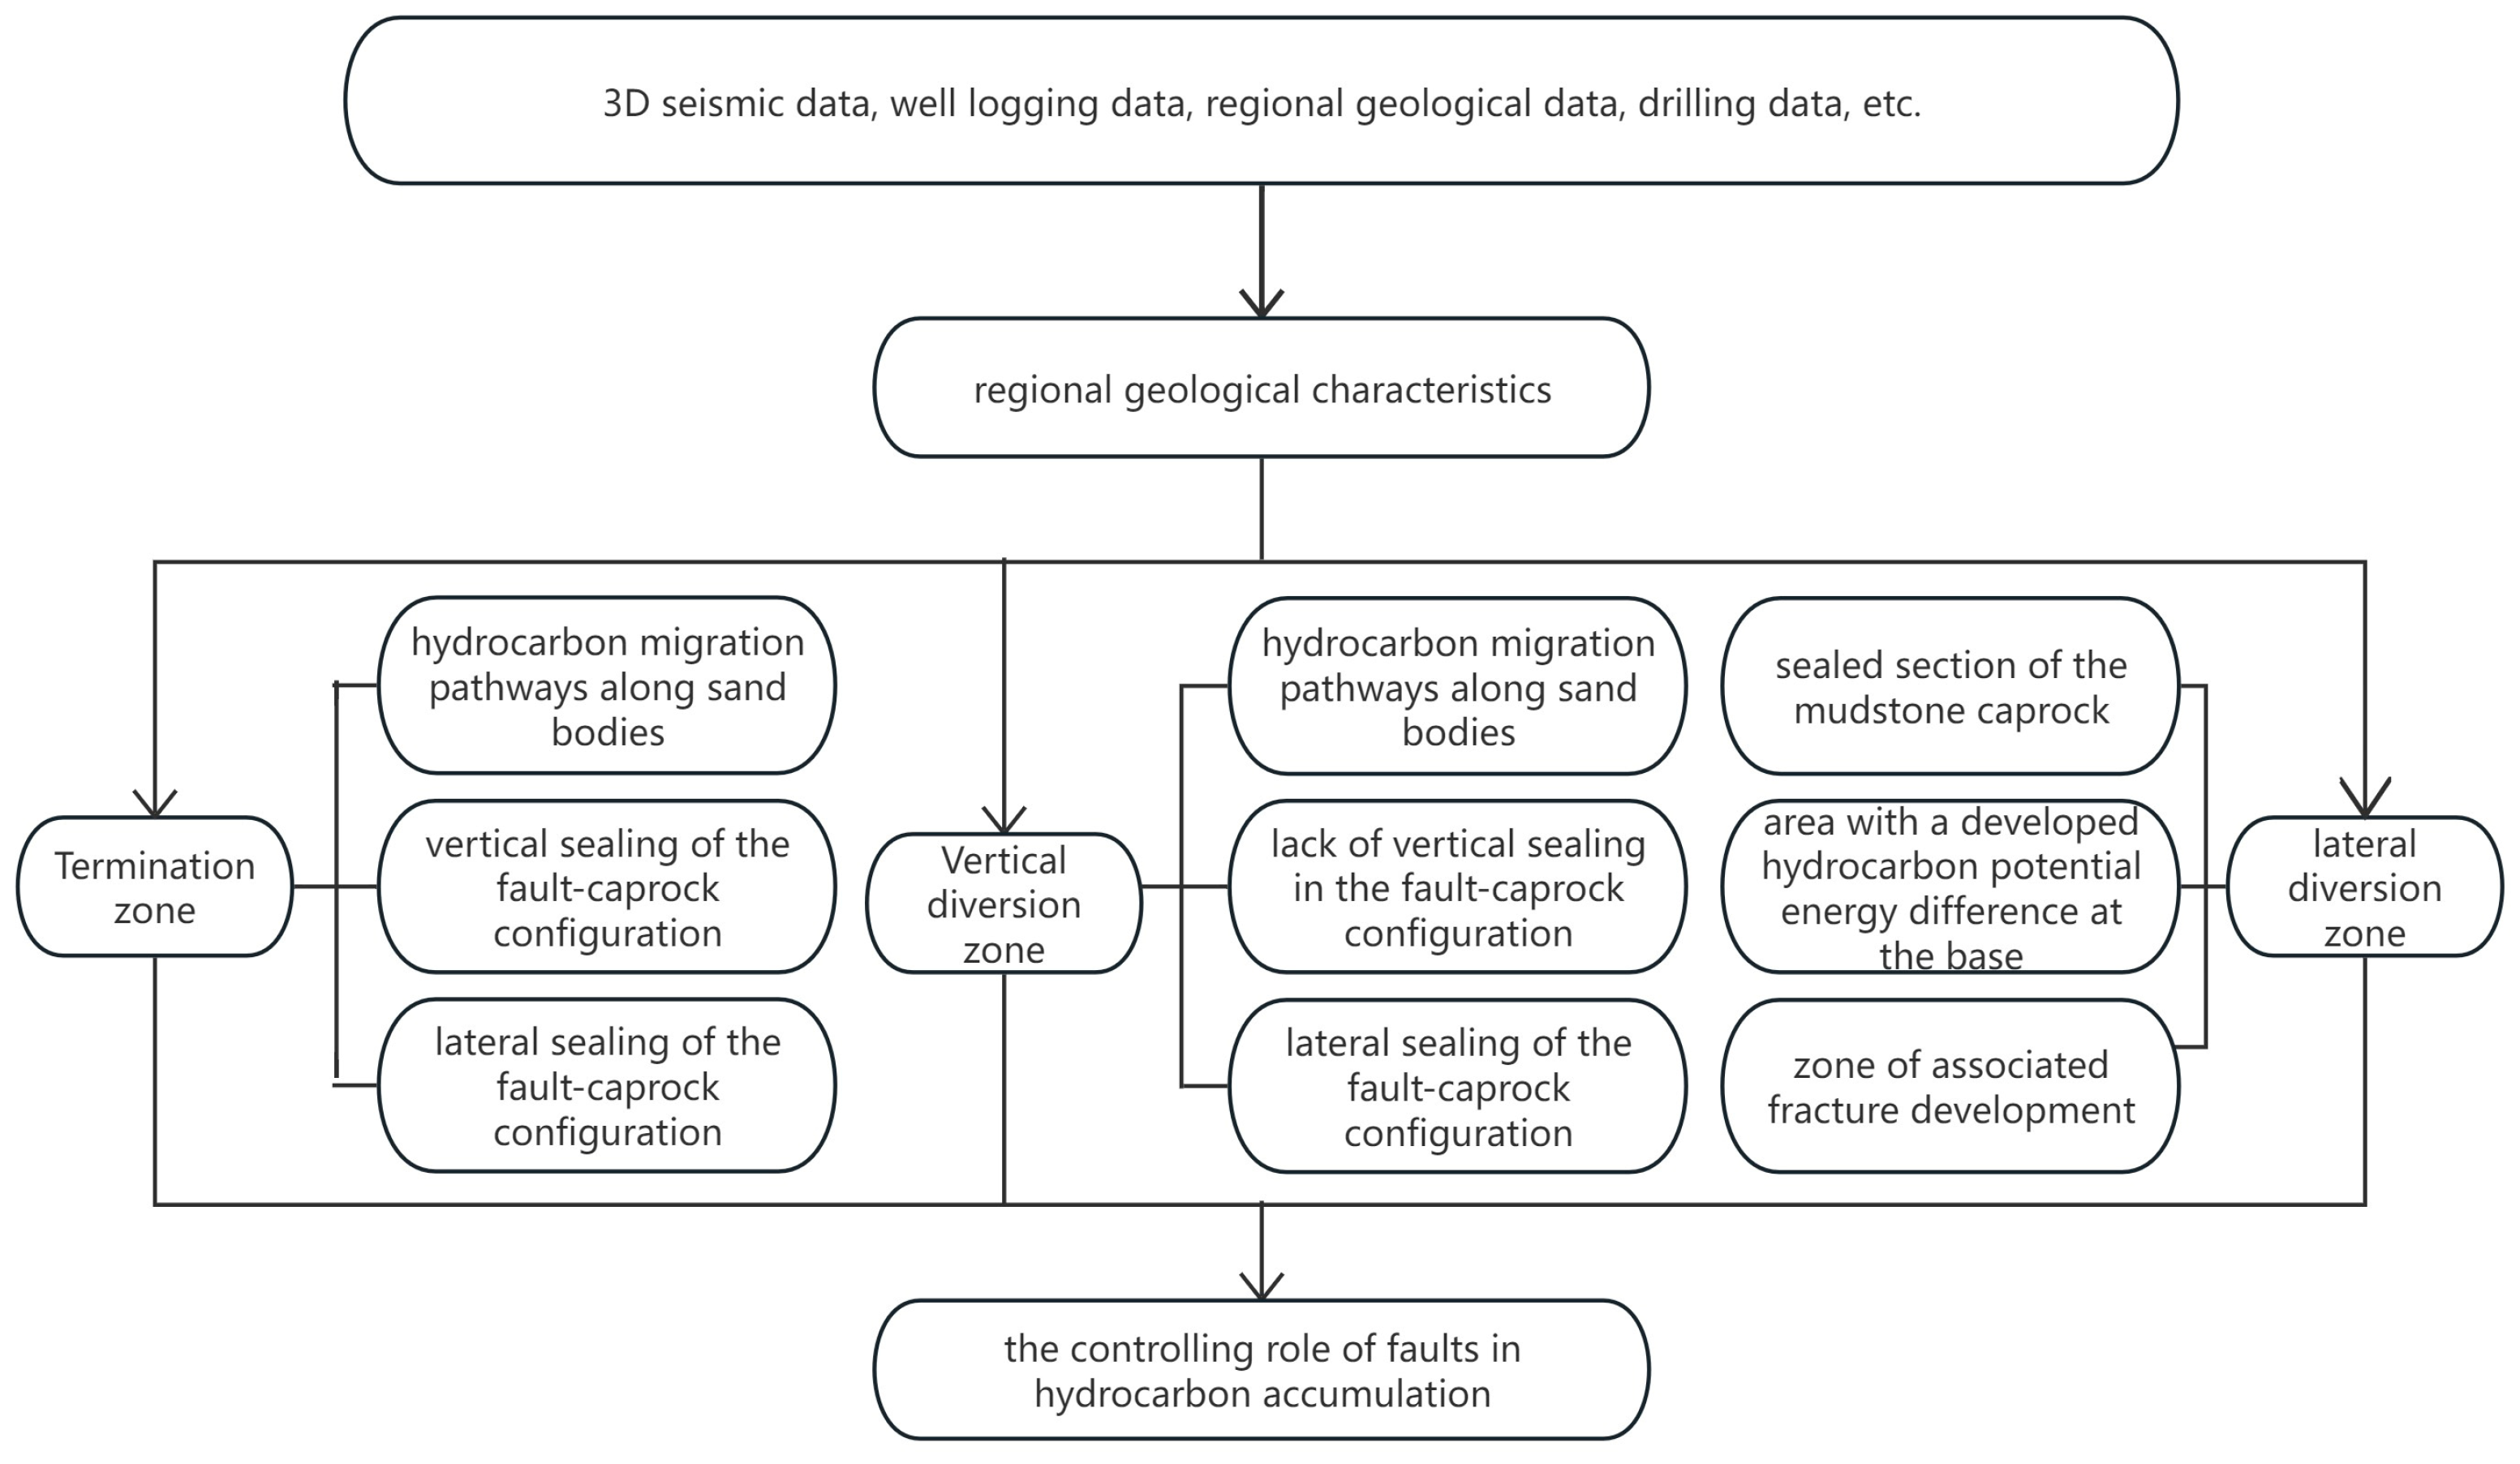
Figure 1. Technology roadmap.
Energies 18 04325 g001
Figure 2. Hydrocarbon distribution associated with the Aogula Fault and the S, P, and G reservoirs: (a) plan view; (b) cross-sectional view.
Energies 18 04325 g002
Figure 3. Composite columnar section of middle and shallow formations in northern Songliao Basin (Revised by MENG Qi’an, 2020 [12]).
Energies 18 04325 g003
Figure 4. Schematic diagram of the influence of the Aogula Fault on hydrocarbon migration along the sand bodies of the S, P, and G reservoirs: (a) termination and vertical diversion effect; (b) lateral diversion effect.
Energies 18 04325 g004
Figure 5. Schematic determination of hydrocarbon sealing location in fault–caprock configuration.
Energies 18 04325 g005
Figure 6. The distribution diagram of the role of the Aogula Fault in transporting hydrocarbon to the sand body of the S, P, and G reservoirs and its relation with hydrocarbon.
Energies 18 04325 g006
Figure 7. Determination map of the location of lateral diversion of the Aogula Fault for transporting hydrocarbon from the sand body of the S, P, and G reservoirs.
Energies 18 04325 g007
Figure 8. Comparative map of hydrocarbon distribution in the S, P, and G reservoirs at the Aogula Fault.
Energies 18 04325 g008
Figure 9. The thickness distribution of the connection between the Aogula Fault and the S, P, and G reservoirs’ mudstone spacer configuration.
Energies 18 04325 g009
Figure 10. Map Delineating the Role of the Aogula Fault in Controlling Hydrocarbon Migration along S, P, and G Reservoir Sand bodies.
Energies 18 04325 g010
Figure 11. Determination of the minimum threshold of fault distance required for developing fault-associated faults in the fault distribution area of Aogula.
Energies 18 04325 g011
Figure 12. Hydrocarbon correlation map of the S, P, and G reservoirs in the southwest and northeast parts of the Aogula Fault.
Energies 18 04325 g012
Figure 13. Crude Oil Density Distribution in Oil Wells along the Aogula Fault.
Energies 18 04325 g013
Disclaimer/Publisher’s Note: The statements, opinions and data contained in all publications are solely those of the individual author(s) and contributor(s) and not of MDPI and/or the editor(s). MDPI and/or the editor(s) disclaim responsibility for any injury to people or property resulting from any ideas, methods, instructions or products referred to in the content.