1. Introduction
Intermediate-temperature solid oxide fuel cells (IT-SOFCs) are a clean and efficient power source that converts the chemical energy of fuel into electrical energy at around 973 K. The huge challenge in the practical application of IT-SOFCs is lowering the high internal resistance and large overpotential on the electrodes at intermediate temperatures (<approx. 1073 K) [
1,
2,
3,
4,
5]. However, the selection of fuel cell materials (i.e., electrolytes and electrodes) in previously published works [
3,
4,
5] lacked an effective material design guiding principle for high-quality fuel cell materials, even if material selection considered advanced microanalysis results. On the other hand, molecular dynamics simulations based on microstructural analysis data also have yet to provide a guiding principle for designing high-quality active sites around the three-phase boundary (TPB) in SOFCs. To minimize the trial and error required to produce “state-of-the-art IT-SOFCs” with quality beyond the limits of conventional IT-SOFCs, a material design guiding principle for the fabrication of high-quality active sites around TPB on anodes should be proposed using both surface first-principles calculations and experimental data (i.e., SOFC performance data and characterization data around the three-phase boundary).
For a hydrogen-based society to become reality, the proposal of a design guiding principle for the surface oxide ion diffusion pathway on anodes in the ‘state-of-the-art IT-SOFCs’ is a pressing issue. Also, the design guiding principle of an active interface on the anode should be proposed to maintain a good balance between high performance and durability. In the case of IT-SOFCs, which can use various kinds of fuels such as hydrogen, combustible fuels, fossil fuels (including mixtures of methanol and water), and hydrocarbons, a multi-functional active site with high anode activity and good tolerance for carbon deposition (commonly referred to as “coking”) should be designed on the anode.
In efforts to simultaneously lower the operating temperature of conventional fuel cells and overcome anodic overpotential, mixed ionic–electronic conductors (MIECs) have been introduced into the anode layer to enhance both electronic and ionic conductivity near the TPB, while microstructural refinement has been employed to increase the TPB density and, thus, lower the activation temperature of the anode.
One representative example of MIECs introduced into the anode layer is CeO
2 doped with Gd [
6] or Y [
6]. In addition, performance enhancement has also been reported by infiltrating Sm
2O
3-doped CeO
x [
7,
8] or CeO
x–Cu into the anode layer [
8].
In addition to the use of CeO
x-based compounds as MIECs, other approaches have been reported to enhance cell performance. One such approach involves replacing Ni in the anode layer with Y-doped SrTiO
3 as the MIEC to form a YSZ–MIEC composite anode, as well as further improving activity by co-infiltrating nanosized CeO
2 and Ru nanoparticles as co-catalysts [
9].
For further performance enhancement, the use of a composite MIEC anode layer comprising Y
0.04Ce
0.48Zr
0.48O
2 (CZY) or La
0.3Sr
0.7TiO
3 (LST) with Y
2O
3 has also been investigated, in combination with the infiltration of 10 wt% CeO
2 and 1 wt% Pd into the composite MIEC anode layer [
10].
As a result, cell performance improvements have been partially observed by incorporating MIEC particles that provide both electronic and ionic conductivity, and the addition of approximately 1 wt% of metal nanoparticles has also been shown to improve resistance to coking and H2S poisoning.
However, the chemical instability at the interface between MIEC particles and the Ni–YSZ cermet electrode, in combination with the rapid grain growth of metallic co-catalysts, often leads to a rapid decline in initial cell performance. As a result, such approaches have rarely been reported in subsequent work.
Subsequent works, recognizing the limitations of using YSZ as a solid electrolyte for achieving high cell performance in the intermediate temperature range, have explored alternative electrolyte systems such as La
0.83Sr
0.17Ga
0.8Mg
0.2O
3−δ and La
0.8Sr
0.2Ga
0.83Mg
0.17O
3−δ (both LSGM-based electrolytes). In this case, a variety of perovskite-based and oxide anode materials have been investigated, including SrMo
0.9Ru
0.1O
4−δ [
11], SrMo
1−xAl
xO
3−δ (x = 0.1, 0.2) [
12], Ba-substituted SrMo
0.9Fe
0.1O
3−δ [
13], or SrMo
1−xMn
xO
3−δ [
14], and they were used as anode components with LSGM-based solid electrolytes.
Other types of approaches have proposed the use of a perovskite-type oxide anode, such as Ba
0.5La
0.5Ti
0.3Mn
0.7O
3 or Ba
0.5La
0.5In
0.3Ti
0.1Mn
0.6O
3, in combination with BaIn
0.3Ti
0.7O
2.85, a novel solid electrolyte [
15].
In addition, efforts have also been made to improve cell performance by employing scandia-stabilized zirconia ((ZrO
2)
0.90(Sc
2O
3)
0.10) as the solid electrolyte and using V
xMo
1−xO
γ (x < 0.13) as the new anode component [
16].
However, the attempts to employ alternative solid electrolytes for IT-SOFC, particularly LSGM-based solid electrolytes, have faced significant challenges. Even with the use of interlayers such as La0.4Ce0.6O2−δ between the anode layer and LSGM, the chemical stability at the electrolyte/anode interface has remained insufficient. In addition, the electrolyte/cathode interface also suffered from chemical instability under the operating conditions of IT-SOFC devices. Moreover, the MIEC anode materials proposed for use with LSGM tended to exhibit high concentrations of oxide ion vacancies, leading to pronounced oxide ion vacancy ordering. These negative factors have hindered improvements in both cell performance and durability at temperatures below 973 K.
In addition, MIEC materials developed for other novel solid electrolytes have also failed to fundamentally resolve issues such as poor chemical stability at the interface with anode components and pronounced ordering of oxide ion vacancies. As a result, no significant progress has yet been made in overcoming the practical implementation challenges.
Generally, improving the elementary anodic reaction rate is required for mitigating the excess overpotential on the anode. Creating new active sites on the anode is a viable approach to improving the elementary reaction rate. Actually, the excess overpotential on the anode has been mitigated by depositing a trace amount of PtO
x (i.e., Pt content: approx. 10 to 100 ppm) to create a new active site on the anode layer (Ni/YSZ) for the promotion of surface oxide ion diffusion [
17]. The current density observed for the SOFC single cell in which the PtO
x was deposited on the anode is 5- to 6-times higher than that of the IT-SOFC single cell without PtO
x at 973 to 1073 K [
17].
In the case of the anode doped with a trace amount of PtO
x, the defect structure located on the Ni surface near TPB consisting of the doped Pt cation and lattice vacancies was clarified using analytical transmission electron microscopy (TEM) and static surface lattice defect simulations [
6]. On the other hand, since the defect structure on the YSZ surface has not been characterized due to the difficulty of observing the defect structure with coherent interface using analytical TEM, the formation of a similar defect structure, which is constructed by the doped Pt cation and lattice defects, has remained only a possibility on the YSZ surface in the cermet-type anode layer. Also, it is relevant to note that Ni cations can diffuse into YSZ grains through the Ni-YSZ interface (i.e., TPB area), as suggested in previously published works [
18]. Therefore, the presence of Ni cations on YSZ is a non-negligible point in the construction of a reasonable guiding principle for active site design on the YSZ surface in the anode.
In the temperature range of IT-SOFC’s application (<approx. 1073 K), oxide ion (O
2−) hopping on the YSZ surface in the anode is reported as the rate-limiting step [
19,
20]. Surface oxide ion diffusion occurs via a hopping mechanism, which utilizes oxide ion vacancy sites on YSZ. It means that the anode reaction rate can be maximized due to the enhancement of the surface diffusion of oxide ions through the design of defect sites on the YSZ surface. Therefore, the implementation of the surface first-principles calculations on the effect of a small amount of cation doping on the formation of the defect structure with an oxide ion vacancy both near the TPB and far from the TPB is essential for drawing conclusions based on experimental results (i.e., SOFC performance data) for proposing a guiding principle for material design.
That is why the initial attention in the present work was directed to the anomalous specific heat data observed at low excitation modes, which have been reported only for the YSZ among all fuel cell materials [
21,
22,
23]. To highlight the usefulness of the unique physical properties of YSZ, which was overshadowed in the development field of SOFC devices, and utilize it for maximizing the performance of IT-SOFC devices, a small amount of trivalent cation Rh
3+ (approx. 130 ppm) or trivalent cation Fe
3+ (approximately 1200 ppm), which is the same as Y
3+ in Y
2O
3, was doped onto the YSZ surface in the anode layer of IT-SOFC devices.
In the present work, as a unique process for doping a small amount of trivalent cations into the anode, an oxide film (RhOx or FeOx) consisting of the trivalent cation was sputtered onto the YSZ in the anode layer, followed by reductive decomposition at 1073 K in a hydrogen atmosphere. This approach aimed to disperse the small amount of trivalent cations along the grain boundaries between Ni and YSZ particles (i.e., the three-phase boundaries) in the porous anode layer of the IT-SOFC.
Figure 1 shows a schematic diagram of the assumed formation process of active TPBs in the anode layer using a thin sputtered MO
x (M: Pt, Rh, or Fe) film. The homogeneity and number of active hopping sites at the functional interface, which was formed by deposition and subsequent reductive decomposition at 1073 K in H
2 gas flow of the MO
x (M: Pt, Rh, or Fe) thin film in the anode layer, are much higher than those achieved by other conventional processes such as the mixing process.
However, when an FeO
x thin film is sputtered onto the anode and dispersed in the anode layer by reductive decomposition in a hydrogen atmosphere at 1073 K, it is possible that two types of Fe cations (i.e., divalent and trivalent) coexist at the grain boundaries in the cermet-type anode. Since it was difficult to evaluate the valence of trace amounts of Fe cations diffused from the real grain boundaries in the anode layer of SOFC devices, FeO
x was deposited on a single-crystal YSZ substrate coated with NiO particle paste under sputtering conditions identical to those used for the real anodes of SOFC devices. And the sputtered FeO
x was reduced by hydrogen at 1073 K on a single-crystal YSZ with model three-phase boundary, followed by the valence of Fe cations at near and far sites from the three-phase boundary, investigated using XPS. For the measurement points of the Fe cation valences, refer to
Figure S1 in the Supplementary Materials.
For comparison, a similar doping process using approximately 91 ppm of Pt2+ was applied to investigate its effect on the power generation performance of IT-SOFCs.
As outlined above, it was first confirmed that doping a small amount of trivalent cations (i.e., Rh3+ or primarily Fe3+) into the anode improves the performance of IT-SOFC devices compared to those with trace Pt2+ doping or without any doping.
Following the SOFC performance measurements and XPS surface analysis, a systematic investigation was conducted to propose a useful guiding principle for material design that leverages the unique physical properties of YSZ in the anode layer of IT-SOFC devices, based on the performance data obtained. The present work focused on defect structures with coherent interfaces created by doping cubic zirconia (ZrO2) (111) with precious metal cations (Pt2+ or Rh3+) and non-precious metal cations (Fe2+ or Fe3+), using surface first-principles calculations. In the present calculations, the charge transfer between the cations and lattice oxygen was quantitatively examined, and the electron distribution was subsequently analyzed. Finally, the relationship between the extent of electron delocalization and the formation energy of defect clusters was investigated both far from the TPB site and in its vicinity.
Also, when discussing the different doping effects of Fe2+ and Fe3+ cations, the analytical data on the surface chemical composition of YSZ single-crystal samples were taken into account.
Finally, the role of the doping of trace amounts of trivalent noble metal cations (Rh3+) and small amounts of trivalent non-precious metal cations (Fe3+) into the anode in improving the performance of IT-SOFC devices was clarified. In addition, a material design guiding principle was proposed for the application of the unique physical property of YSZ to improve the performance of energy-related materials (e.g., fuel cell materials and catalyst materials).
3. Results and Discussion
3.1. Performance of IT-SOFC Single Cells
We hypothesize that the Schottky anomaly, a distinctive low-energy excitation phenomenon in YSZ, can be effectively exploited to enhance IT-SOFC performance by doping trace amounts of trivalent cations into the Schottky sites of the fluorite lattice.
Based on this hypothesis, an initial comparison was made between the anode performance of IT-SOFC single cells doped with trace amounts of Pt2+ (91 ppm, used as a reference) and Rh3+ (131 ppm), in order to evaluate the superiority of trivalent over divalent cation doping.
To dope trace amounts of Pt
2+ or Rh
3+ onto YSZ in the anode layer, PtO
x or RhO
x thin films were deposited onto pre-sintered NiO–8YSZ cermet anodes via magnetron sputtering. The deposition conditions for PtO
x thin films, used to introduce trace amounts of Pt
2+, were investigated previously. It was reported that sputter deposition followed by hydrogen reduction at 1073 K (i.e., the conditioning process) enables homogeneous dispersion of Pt
2+ into the anode layer through reductive decomposition of the film and subsequent interdiffusion along the grain boundaries [
17]. The same conditions were applied for the doping of small amounts of Rh
3+ onto the YSZ surface in the anode layer as those used for Pt
2+ doping.
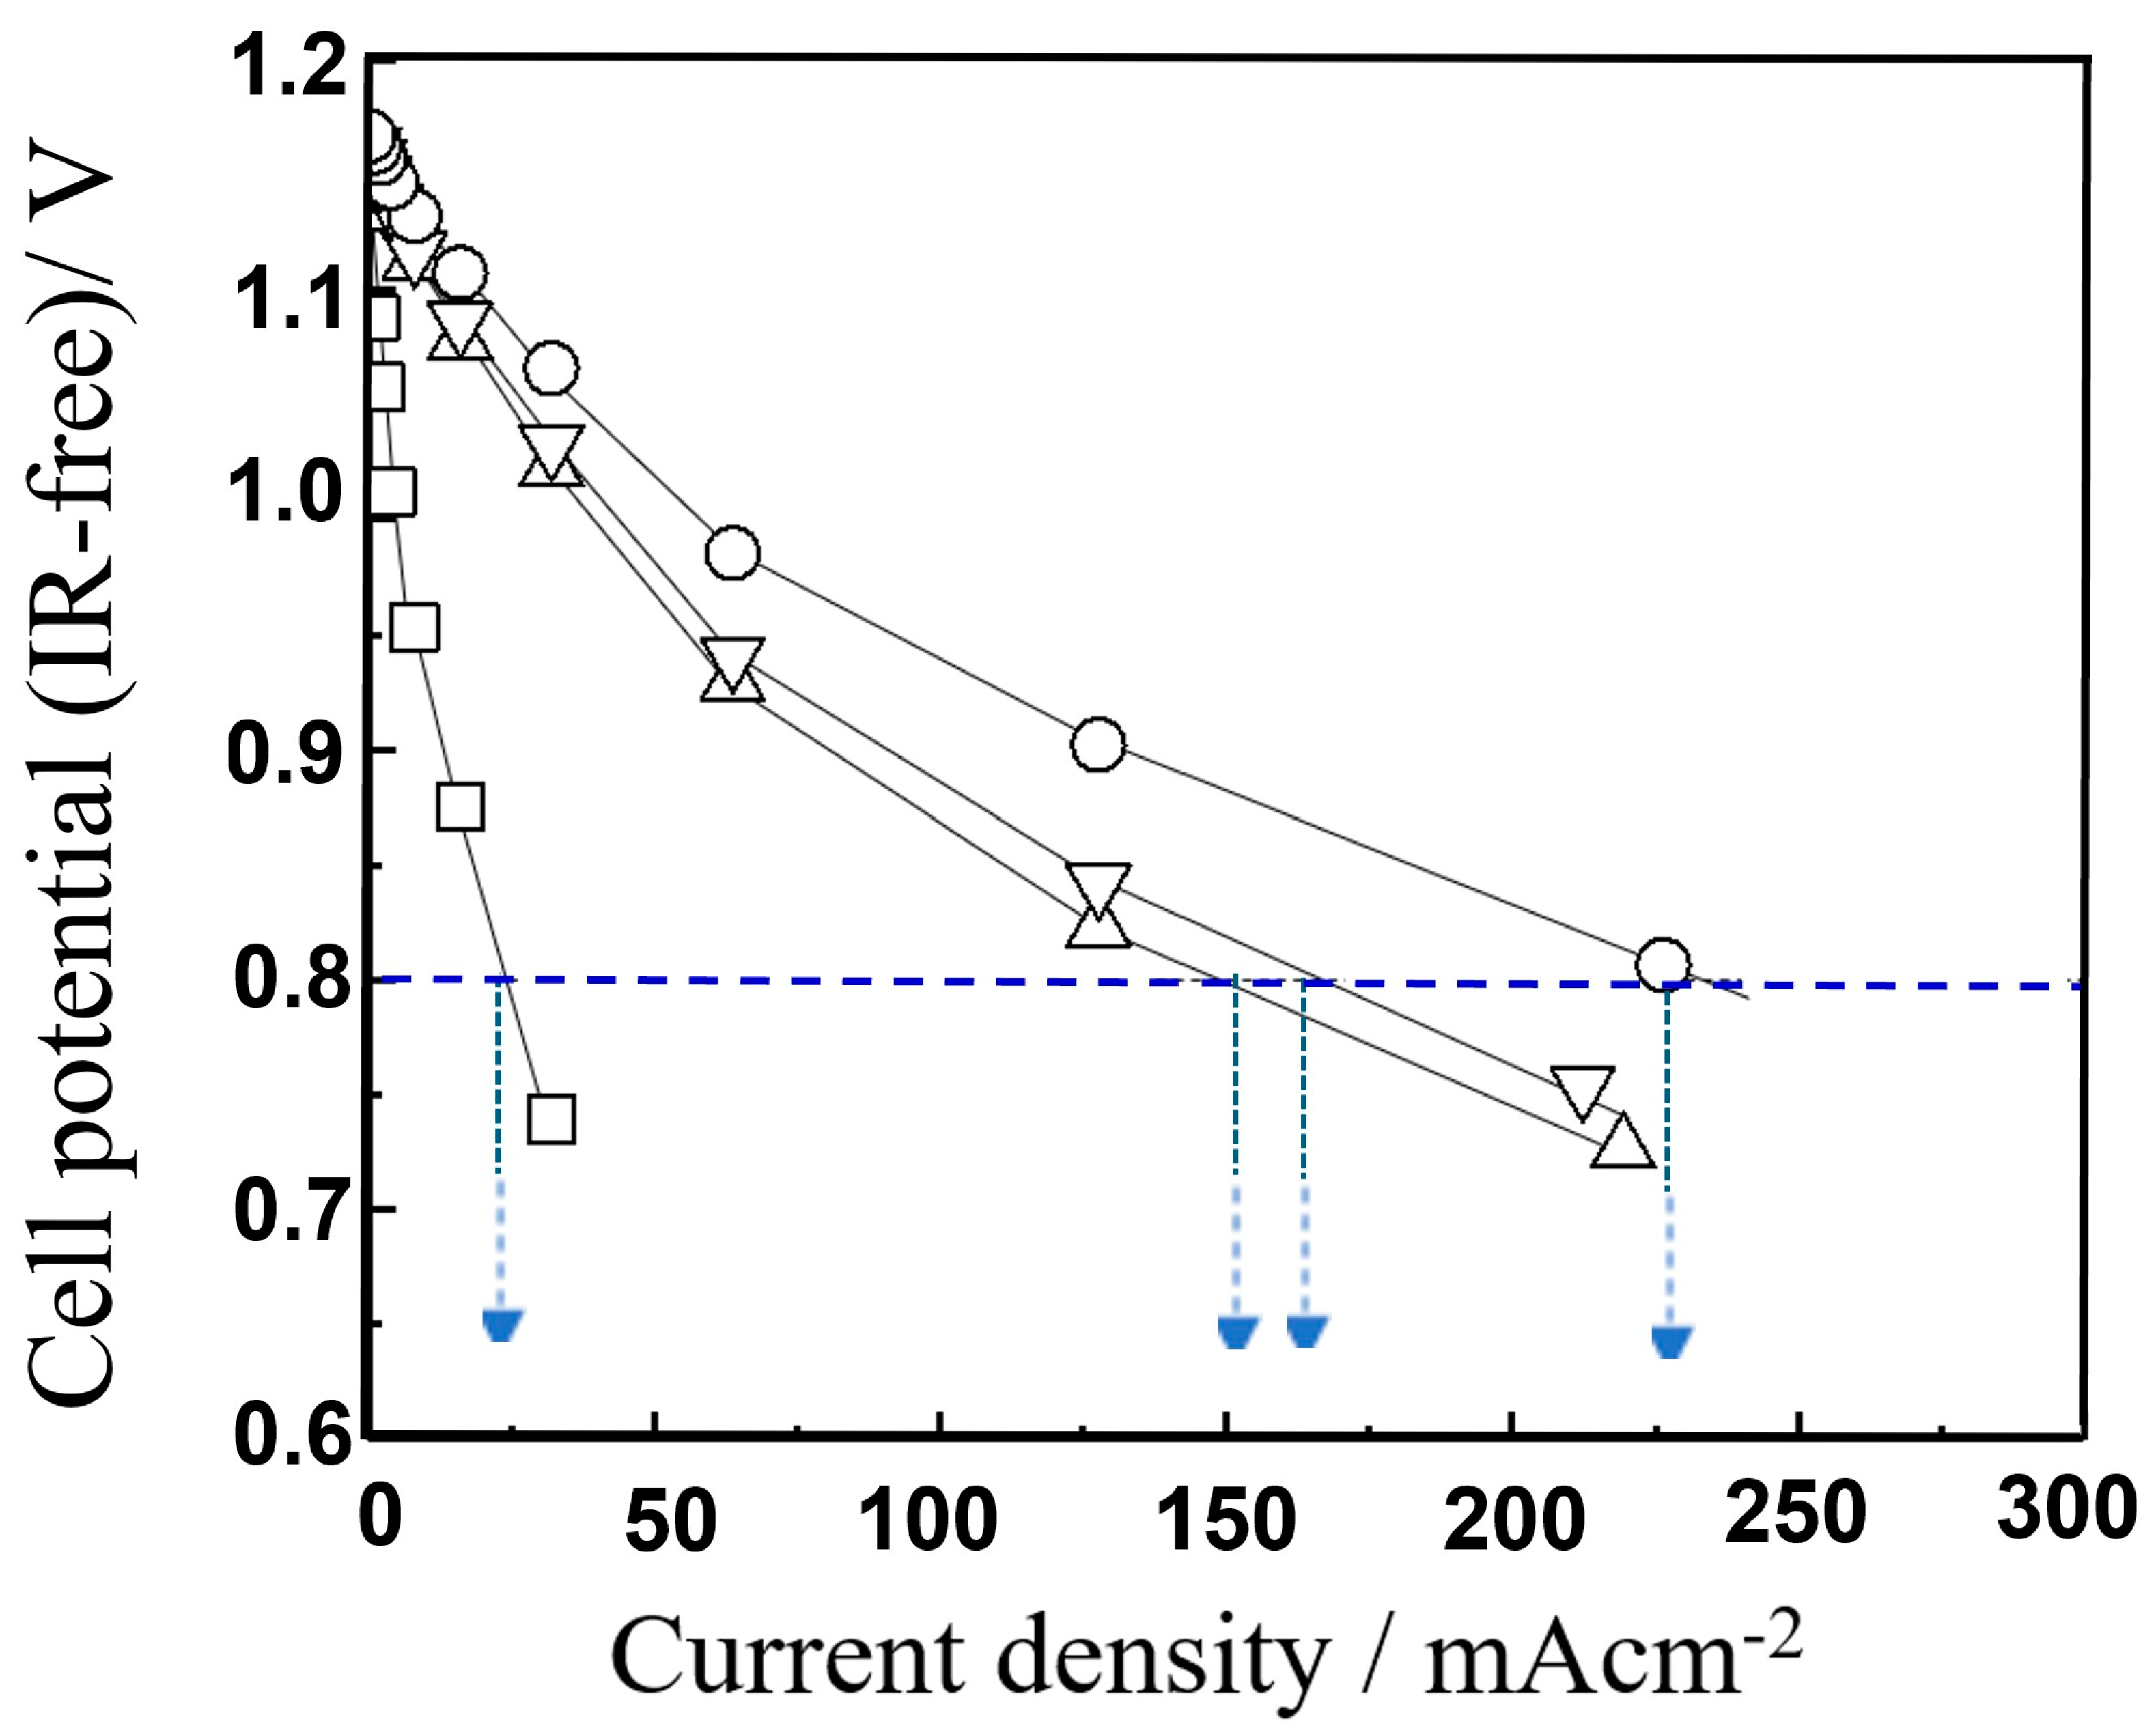
The results are shown in
Figure 2. Consistent with our previously published data [
17], the excess overpotential observed for the conventional anode was markedly reduced by the addition of a small amount of Pt
2+ species onto the anode. Furthermore, the anode doped with a small amount of Rh
3+ (131 ppm) exhibited a current density of 226.5 mA cm
−2 at 0.8 V (IR-free cell potential), which was significantly higher than that of the Pt
2+-doped anode. The current density of the Rh
3+-doped anode was nine-times higher than that of the conventional cermet anode without precious metal cation (i.e., Pt
2+ or Rh
3+) doping. The improvement effect observed for the small amount of Rh
3+ doping onto the anode was greater than that for Pt
2+ doping. These results clearly indicate that enhancing anode performance through trivalent dopant addition is more effective for improving IT-SOFC performance than using a divalent dopant.
In the case of PtO
x doping, a current density of 178 mA cm
−2 at 0.8 V and 973 K was obtained at a doping level of 91 ppm, as shown in
Figure 2. However, increasing the doping level to approximately 300 ppm led to a decrease in current density to around 100 mA cm
−2. This suggests that exceeding the solubility limit of Pt cations in the 8YSZ lattice results in residual metallic Pt aggregating at grain boundaries in the anode layer, thereby suppressing the expected enhancement in cell performance.
In the present work, a similar trend was observed for RhO
x doping. Even at doping levels below 1 ppm, an improvement in cell performance was evident, and at around 30 ppm, a current density of 170 mA cm
−2 was achieved, which is more than six-times that of the undoped anode. The current density continued to improve up to 131 ppm (refer to
Figure 3), but higher concentrations led to a decline in performance. This suggests that, as with Pt, after the solubility limit of Rh in the YSZ lattice is exceeded, the residual metallic Rh particles would aggregate at the grain boundaries in the anode layer, thereby hindering cell performance. These findings reaffirm the critical importance of the solid solubility of trace dopant cations within the YSZ lattice for enhancing fuel cell performance.
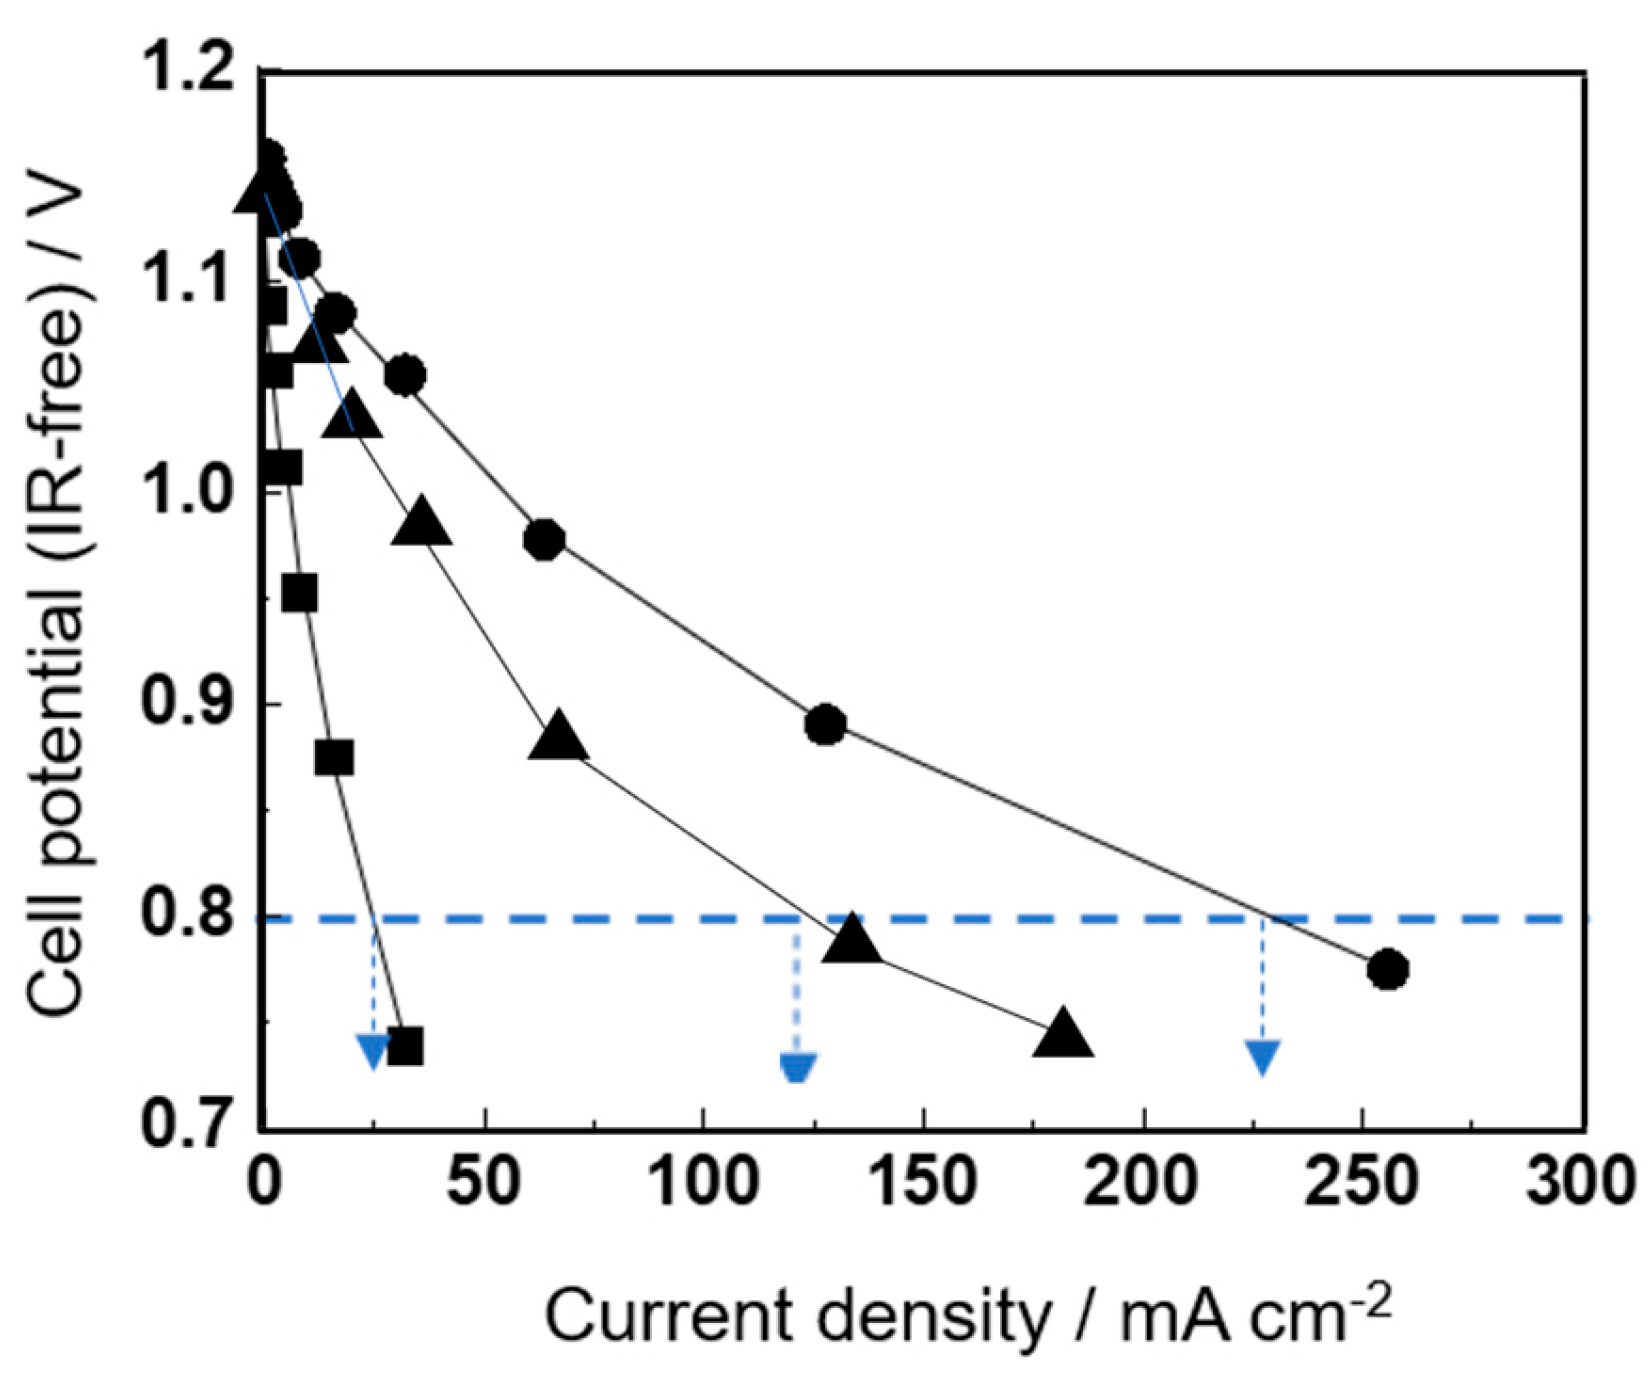
Furthermore, the performance of an IT-SOFC single cell with an anode doped with a small amount of FeOx was evaluated. The results showed that even with an FeOx doping concentration of only approximately 60 ppm, the single cell achieved a current density of 120 mA cm−2 at 0.8 V (IR-free cell potential), which is approximately five-times higher than that of the undoped anode.
At a doping concentration of 1200 ppm, the current density improved to 226.0 mA cm−2, achieving performance comparable to that of IT-SOFC devices with RhOx-doped anodes. Those results clearly demonstrate that a small amount of precious metal (Rh3+) can be replaced by a non-precious metal (Fe3+) without reducing the performance of IT-SOFCs.
However, even with trace amounts of FeOx doping, the improvement in cell performance was suppressed at doping levels over 1200 ppm. This suggests that, in this case as well, exceeding the solid solubility limit of Fe cations in the YSZ lattice inhibits the enhancement in cell performance. Therefore, to further improve performance, it is crucial to accurately determine the solid solubility limit of Fe in the YSZ lattice and to prepare anode samples in which metal particles do not remain at the grain boundaries between 8Y and Ni in the anode layer.
While the performance measurements in
Figure 4 compare the effect of overpotential on the electrodes using IR-free measurements, which exclude the IR loss observed mainly from the solid electrolyte (YSZ),
Figure 5 shows the performance measurement data of the IT-SOFC device, including the IR loss observed for the YSZ solid electrolyte sintered body.
For IT-SOFC devices with conventional cermet anodes, in which the anodes were not doped with a small amount of Fe cations, the maximum power density values at 1073 K and 973 K were approximately 125 mW cm−2 and 45 mW cm−2, respectively. In contrast, for IT-SOFC devices with Fe-cation-doped anodes, the maximum power density values at 1073 K and 973 K were approximately 225 mW cm−2 and 80 mW cm−2, respectively, confirming that the power generation performance, including IR loss, was also clearly improved.
In addition, the dashed blue lines in
Figure 5a,b compare the current density observed at a cell potential of 0.8 V. At 973 K (including IR losses), the current density observed for the IT-SOFC device with Fe-cation-doped anodes was comparable to that observed for the undoped anodes at 1073 K.
This suggests that the smaller improvement in power generation performance observed in
Figure 5 compared with
Figure 4 is mainly due to IR losses. Since the thickness of the solid electrolyte in the IT-SOFC device used in this comparison is 500 μm, it is expected that the power generation performance, including IR loss, could approach that observed in
Figure 4 if the thickness of the solid electrolyte in the IT-SOFC device is reduced.
However, any attempt to improve cell performance must be accompanied by careful consideration of long-term stability under operating conditions.
Previously reported work demonstrated that a cell equipped with a PtO
x-sputtered anode (approximately 91 ppm) exhibited only an 8% performance decline over 74 h at 973 K (refer to reference [
17] in the
Supplementary Materials), with the degradation primarily attributed to Ni particle coarsening.
Building on these results, it is anticipated that, as with Pt2+ trace-doped systems, the suppression of residual metal nanoparticle formation at grain boundaries and optimization of the Ni–YSZ microstructure will lead to excellent long-term stability, even over extended operation periods ranging from 100 to 1000 h, in anodes trace-doped with trivalent cations.
3.2. Evaluation of the Chemical Composition of Fe on the Anode After Fe Species Doping Using XPS
To characterize the active sites (i.e., oxide ion hopping sites) on the cubic ZrO2 surface induced by doping with a small amount of Fe species, the valence state of Fe cations on a YSZ single-crystal surface with a model three-phase boundary (TPB) was examined via XPS analysis. A disk-shaped YSZ single crystal with a model TPB, prepared by applying NiO along the outer perimeter of the YSZ single crystal, was doped with Fe species under the same sputtering conditions as those used for sputtering small amounts of FeOx onto the anodes of actual IT-SOFC devices. The disk-shaped YSZ was then reduced in a hydrogen gas flow at 1073 K, and Fe 2p, O 1s, and Zr 3d XPS profiles were recorded.
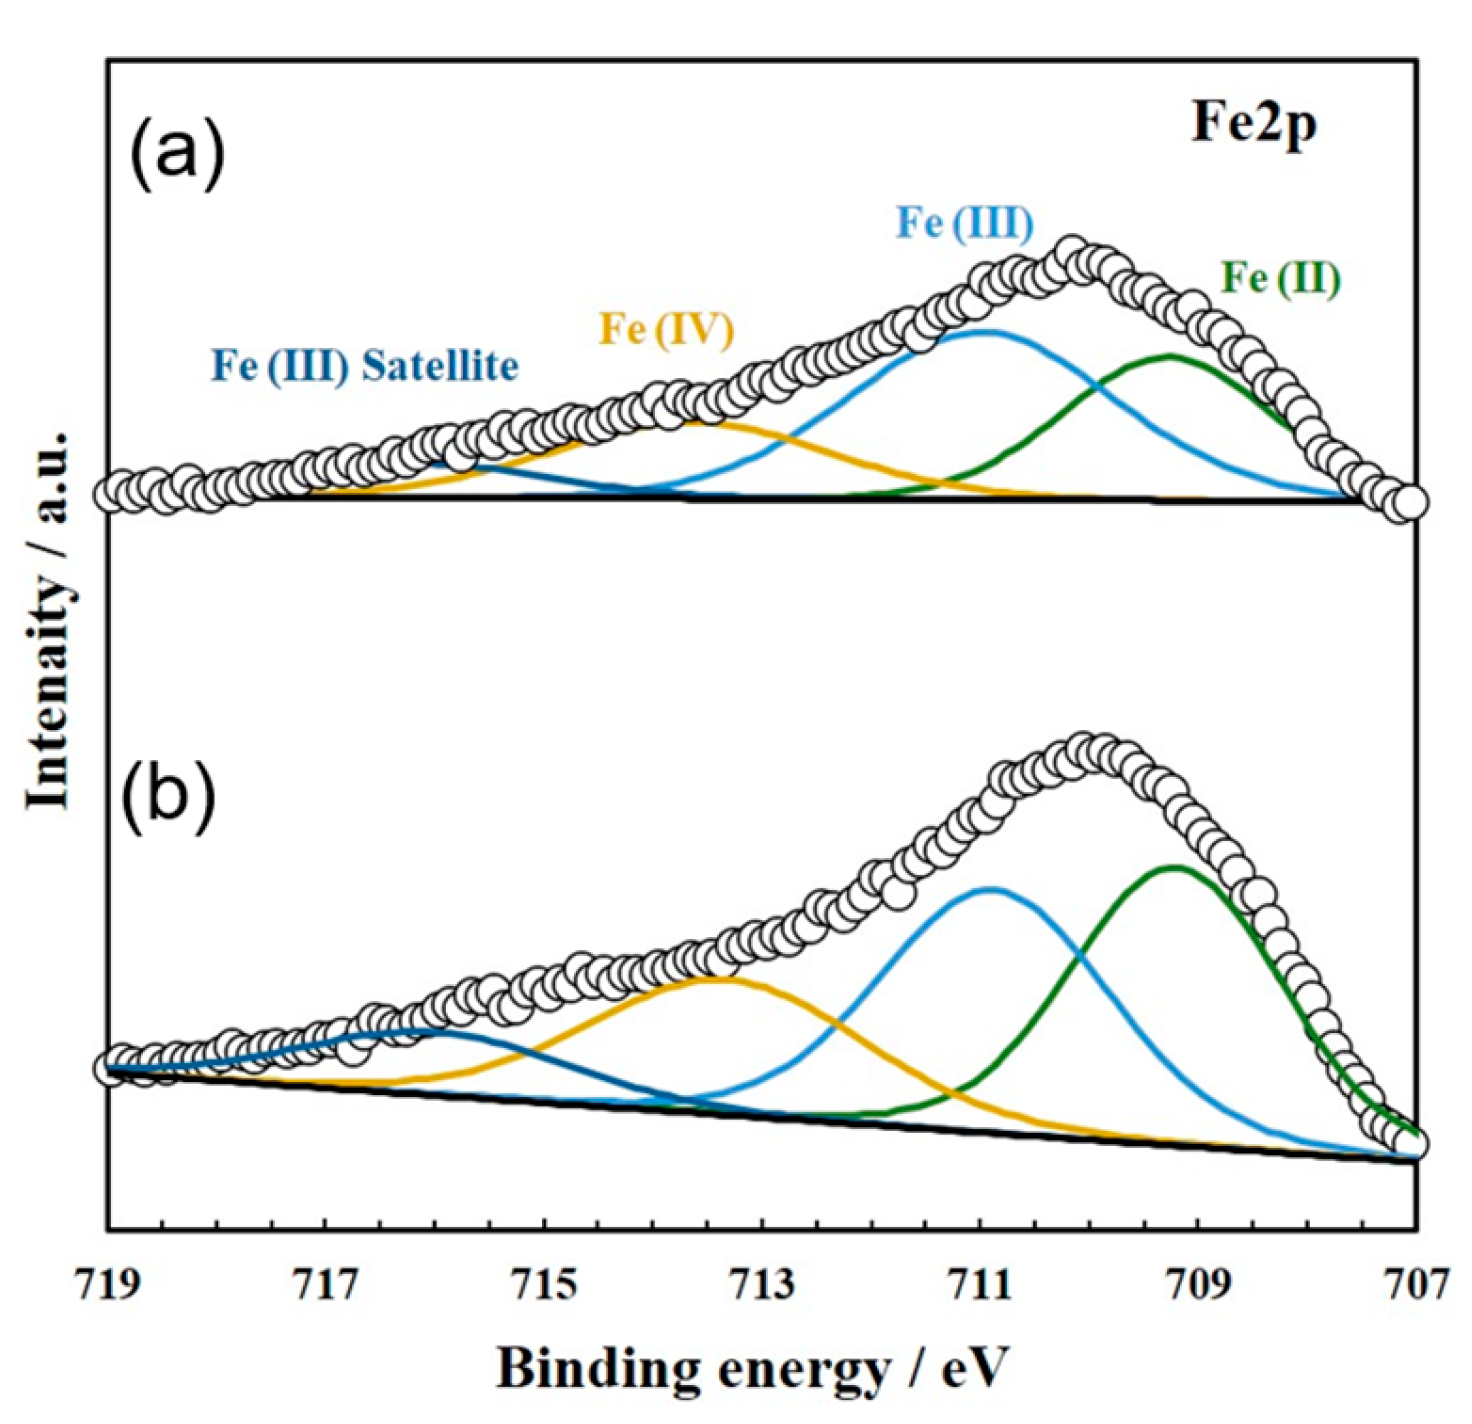
The Fe species were observed as a mixture of Fe
2+ and Fe
3+ cations. Refer to
Figure 6 and
Table 1. The proportion of Fe
3+ observed in the vicinity of the TPB was slightly higher than that of Fe
2+, whereas the opposite trend (i.e., Fe
2+ > Fe
3+) was found at points farther from the TPB.
As the anodic reaction occurs in the vicinity of the TPB, the results of
Figure 6 and
Table 1 suggest that an increased proportion of Fe
3+ is an important factor in enhancing anode activity in IT-SOFC devices and improving power generation performance.
In addition, to examine the differences in the solid solution states of Fe
2+ and Fe
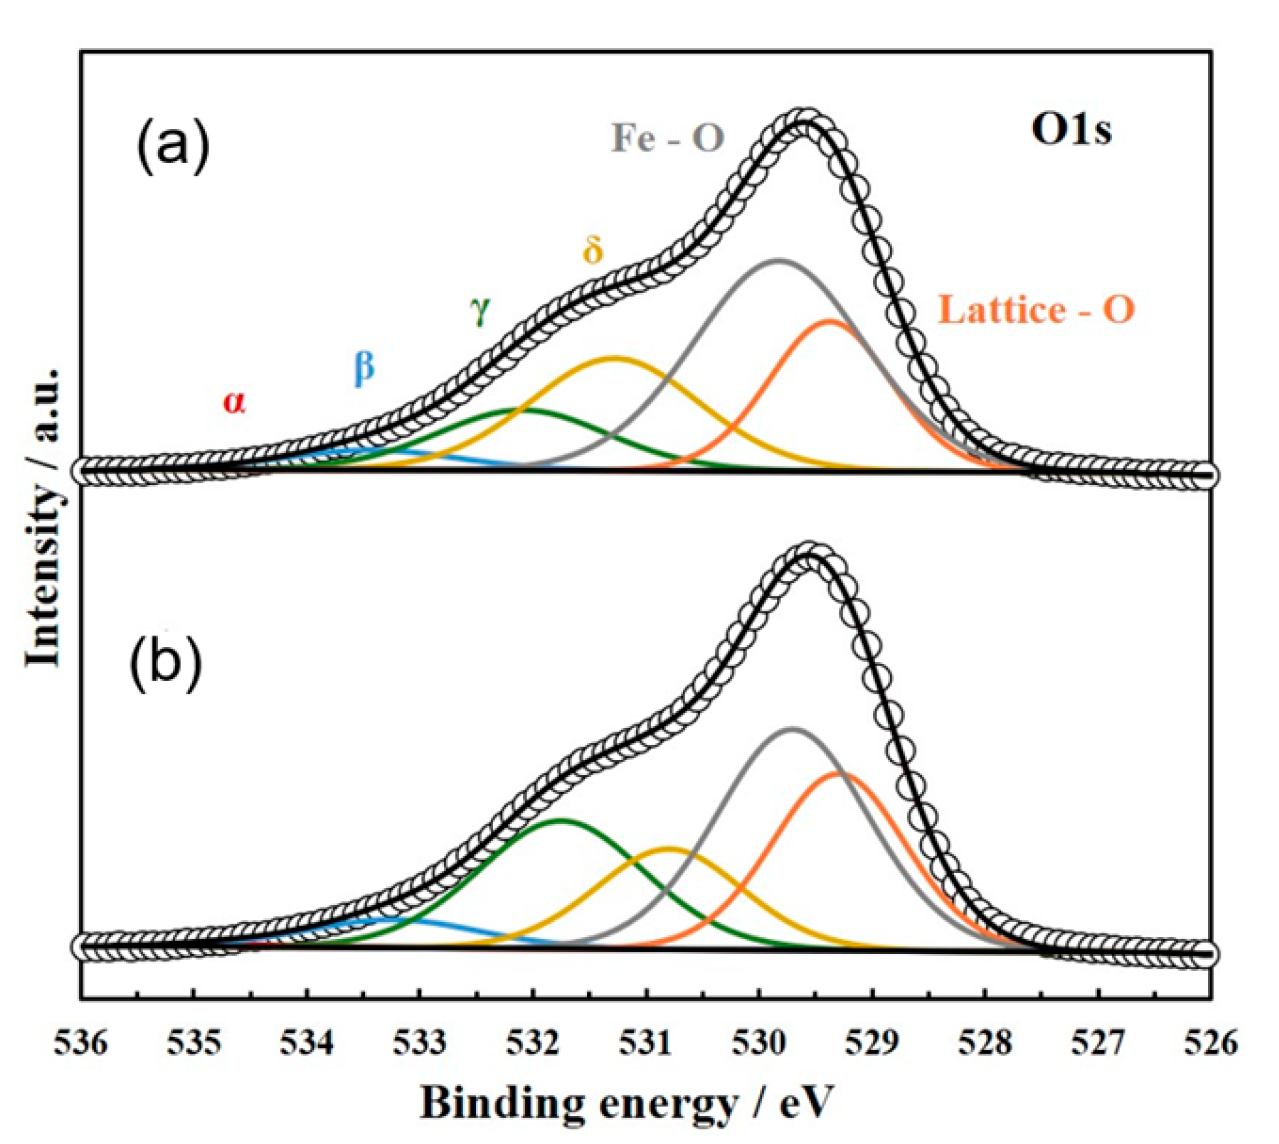
3+ at different measurement points, XPS observations of O 1s were also carried out. Refer to
Figure 6 and
Table 2.
The O 1s spectrum observed for the YSZ single-crystal substrate with a model TPB can be separated into four distinguishable peaks, labeled α, β, γ, and δ, corresponding to Fe–O and lattice O [
32,
33,
34,
35,
36]. The α peak, located at 534.5 eV, and the β peak, located at 533.5 eV, correspond to non-lattice oxygen species. The α state is attributed to adsorbed oxygen and/or hydroxylic species on YSZ, while the β state represents oxygen derived from the YSZ surface. Both the α and β states are also observed on the surface of YSZ without active metal loading. The γ state, located at approximately 532.0 eV, can be attributed to atomically chemisorbed oxygen. Its peak position can be influenced by the presence of surface oxygen on active metals such as Ni in the TPB region. In contrast, the δ peak, located at 531.1 ± 2 eV, is indicative of oxide ion vacancies that appear in YSZ, δ-Bi
2O
3, and at the Ni–YSZ interface [
33,
36]. Because the proportion of the δ state, estimated from its peak intensity, increases with the formation of defect interface structures at the TPB, the δ state fraction can serve as an indicator for characterizing the formation of agglomerated defect clusters on the single-crystal substrate. The δ state percentage near the TPB was higher than that of far from TPB (refer to
Figure 7 and
Table 2).
The observed O 1s spectrum data clearly indicate that the number of oxide ion vacancy sites was increased on the YSZ single crystal due to the formation of Fe3+ defect clusters (i.e., NiZr″ + 2FeZr′ + 2VO˙˙) and Fe2+ clusters (i.e., NiZr″ + FeZr″ + 2VO˙˙) in the vicinity of the model TPB on the disk-shaped YSZ single crystal.
On the other hand, Zr 3d spectra taken from the center part (i.e., far side from TPB) and near side of TPB on the YSZ single-crystal substrate showed two spin−orbital splitting doublets, Zr 3d
3/2−3d
5/2. According to previously reported works [
30,
34], the doublets at 182.4 eV (Zr 3d
5/2) and 184.8 eV (Zr 3d
3/2) are observed on the oxidized ZrO
2 surface, whereas on reduced ZrO
2−x surfaces, the doublets appear at 182.0 eV (Zr 3d
5/2) and 184.2 eV (Zr 3d
3/2). In the case of YSZ particles in conventional Ni-YSZ cermet anodes, where many interfaces exist between Ni and YSZ, the shift in the peaks observed in the Zr 3d doublet can be a useful indicator for characterizing the formation of defect interfaces. However, in the present work, the difference in peak shift between positions near the TPB and far from the TPB was negligible. Refer to
Supplemental Information Figure S4. Since the NiO-coated YSZ single-crystal surface along the outer perimeter of the disk-shaped YSZ single crystal was reduced at 1073 K in a hydrogen gas flow to form a model TPB, the number of TPBs on single-crystal YSZ was much lower than that in practical particulate Ni-YSZ in the anode layer. This difference is considered to explain the observed peak shift toward reduced ZrO
x at both observation points near and far from the TPB.
Based on the XPS observation data of O 1s and Fe 2p, it is considered that an increased proportion of Fe3+ in the vicinity of the TPB is important for promoting the formation of agglomerated defect clusters, thereby enhancing anode activity in IT-SOFC devices and improving power generation performance.
3.3. Surface First-Principles Calculations to Create Material Design Guiding Principle for Fabrication of High-Performance IT-SOFC Device
3.3.1. Effect of Doping at the Far Away Site from TPB
Within the anode layer in IT-SOFC devices, the presence of Ni cations (i.e., Ni2+) on the YSZ surface, caused by the diffusion of neighboring Ni into YSZ, is considered negligible on the side far away from the TPB. Therefore, the effect of dopants on the formation of defect clusters with oxide ion vacancies at the YSZ surface in the anode layer of IT-SOFC single cells was first investigated on the side far from the TPB using surface first-principles calculations.
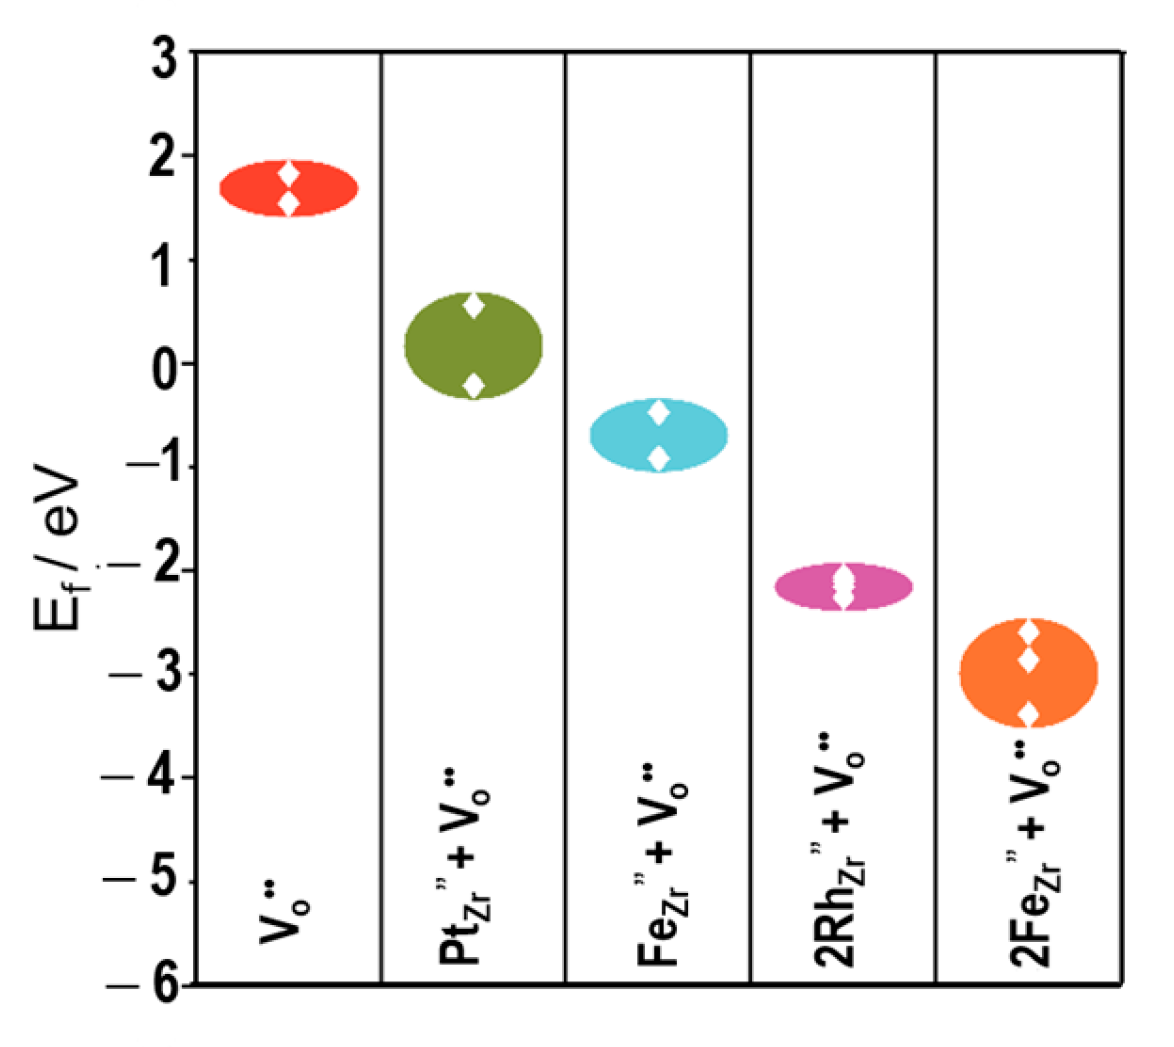
The formation energies of Schottky-type defect clusters are shown in
Figure 8. In this figure, the ratio of the number of dopant cations to that of oxide ion vacancies is fixed to maintain charge neutrality around the dopant cation. This means that the ratio between Pt
Zr″ (or Fe
Zr″) and V
O˙˙ is 1:1, while the ratio between Rh
Zr′ (or Fe
Zr′) and V
O˙˙ becomes 2:1. Accordingly, defect clusters with divalent dopants can be denoted as Pt
Zr″ + V
O˙˙ or Fe
Zr″ + V
O˙˙. Similarly, defect clusters with trivalent dopants can be denoted as 2Rh
Zr′ + V
O˙˙ or 2Fe
Zr′ + V
O˙˙. The formation energy of a mono-vacancy (i.e., only V
O˙˙) was approximately 1.54–1.82 eV, which is much higher than that of a defect structure containing a dopant. This indicates that the formation of a mono-vacancy can be facilitated by the formation of a Schottky defect cluster with a dopant.
Furthermore, taking into account the difference in dopant valence, the formation energy of defect clusters with a trivalent dopant was lower than that of clusters with a divalent dopant. This result clearly indicates that the presence of trivalent dopant cations is favorable for promoting the formation of oxide ion vacancies.
When the divalent Fe cation (Fe2+) was used as a dopant, the formation energy of defect clusters containing Fe2+ was approximately −0.47 to −0.92 eV, which was lower than that for clusters containing Pt cations (Pt2+). In addition, for trivalent dopants, the formation energy of clusters containing Fe3+ was approximately −2.59 to −3.39 eV, which was lower than that for clusters containing Rh cations (Rh3+).
Moreover, in proposing a material design guiding principle, the influence of dopants on the formation of defect clusters and active sites (i.e., oxide ion hopping sites) at points away from the TPBs needs to be considered from the viewpoint of charge transfer.
Zr is less electronegative than Fe and significantly less so than Pt or Rh. Thus, the charge transfer from Zr to lattice oxygen is expected to be more pronounced compared with charge transfer from a dopant to lattice oxygen. The quantitative analysis of the charge transfer was performed using the Hirshfeld charge analysis [
37]. Refer to
Table 3. As shown in the agglomerated defect cluster equation in
Table 3, for trivalent dopants, two trivalent dopant cations are located around one oxygen vacancy to maintain charge neutrality, whereas for divalent dopants, only one divalent dopant cation is located around one oxide ion vacancy. In addition, since several Zr, oxygen and dopant cations are present on the surface, the average charges of Zr, oxygen and dopant cations are summarized in
Table 3.
The charge transferred from Zr is nearly 2.5-times greater than that from the divalent dopant and approximately 1.5-times greater than that from the trivalent dopant. This difference indicates that the ionic bond strength between Zr and lattice oxygen is stronger than that between a dopant and lattice oxygen. In other words, oxygen vacancy formation can be facilitated by the dopant, as the ionic bond between the dopant and lattice oxygen is more easily broken.
As shown in
Table 3, the average transferred charge of oxygen in the divalent dopant case is essentially the same as that in the trivalent dopant case. In addition, the transferred charge of Fe (0.34 e) is higher than that of Pt (0.28 e) in the divalent dopant case, suggesting that the ionic bond between Fe
2+ and lattice oxygen is stronger than that between Pt
2+ and lattice oxygen. In contrast, the formation energy of the defect cluster with Fe
2+ (−0.47 to −0.92 eV) is more negative than that of the defect cluster with Pt
2+ (−0.2 to 0.5 eV), as presented in
Figure 8. This indicates that the defect cluster with Fe
2+ cations is more readily formed on the cubic ZrO
2 surface compared to that with Pt
2+ cations. Since an inconsistency was observed between the trends in
Figure 8 and
Table 3, it is considered necessary to investigate the distribution of electrons around the dopants in greater depth.
The distribution of electrons was investigated by examining the charge density difference. This difference was obtained by comparing the calculated charge densities of the cubic ZrO
2 surface containing the agglomerated defect cluster, the pure cubic ZrO
2 matrix, and the free solute (i.e., dopant cation). The iso-surface of the calculated charge density difference, modelled on the agglomerated defect cluster with the lowest formation energy, is shown in
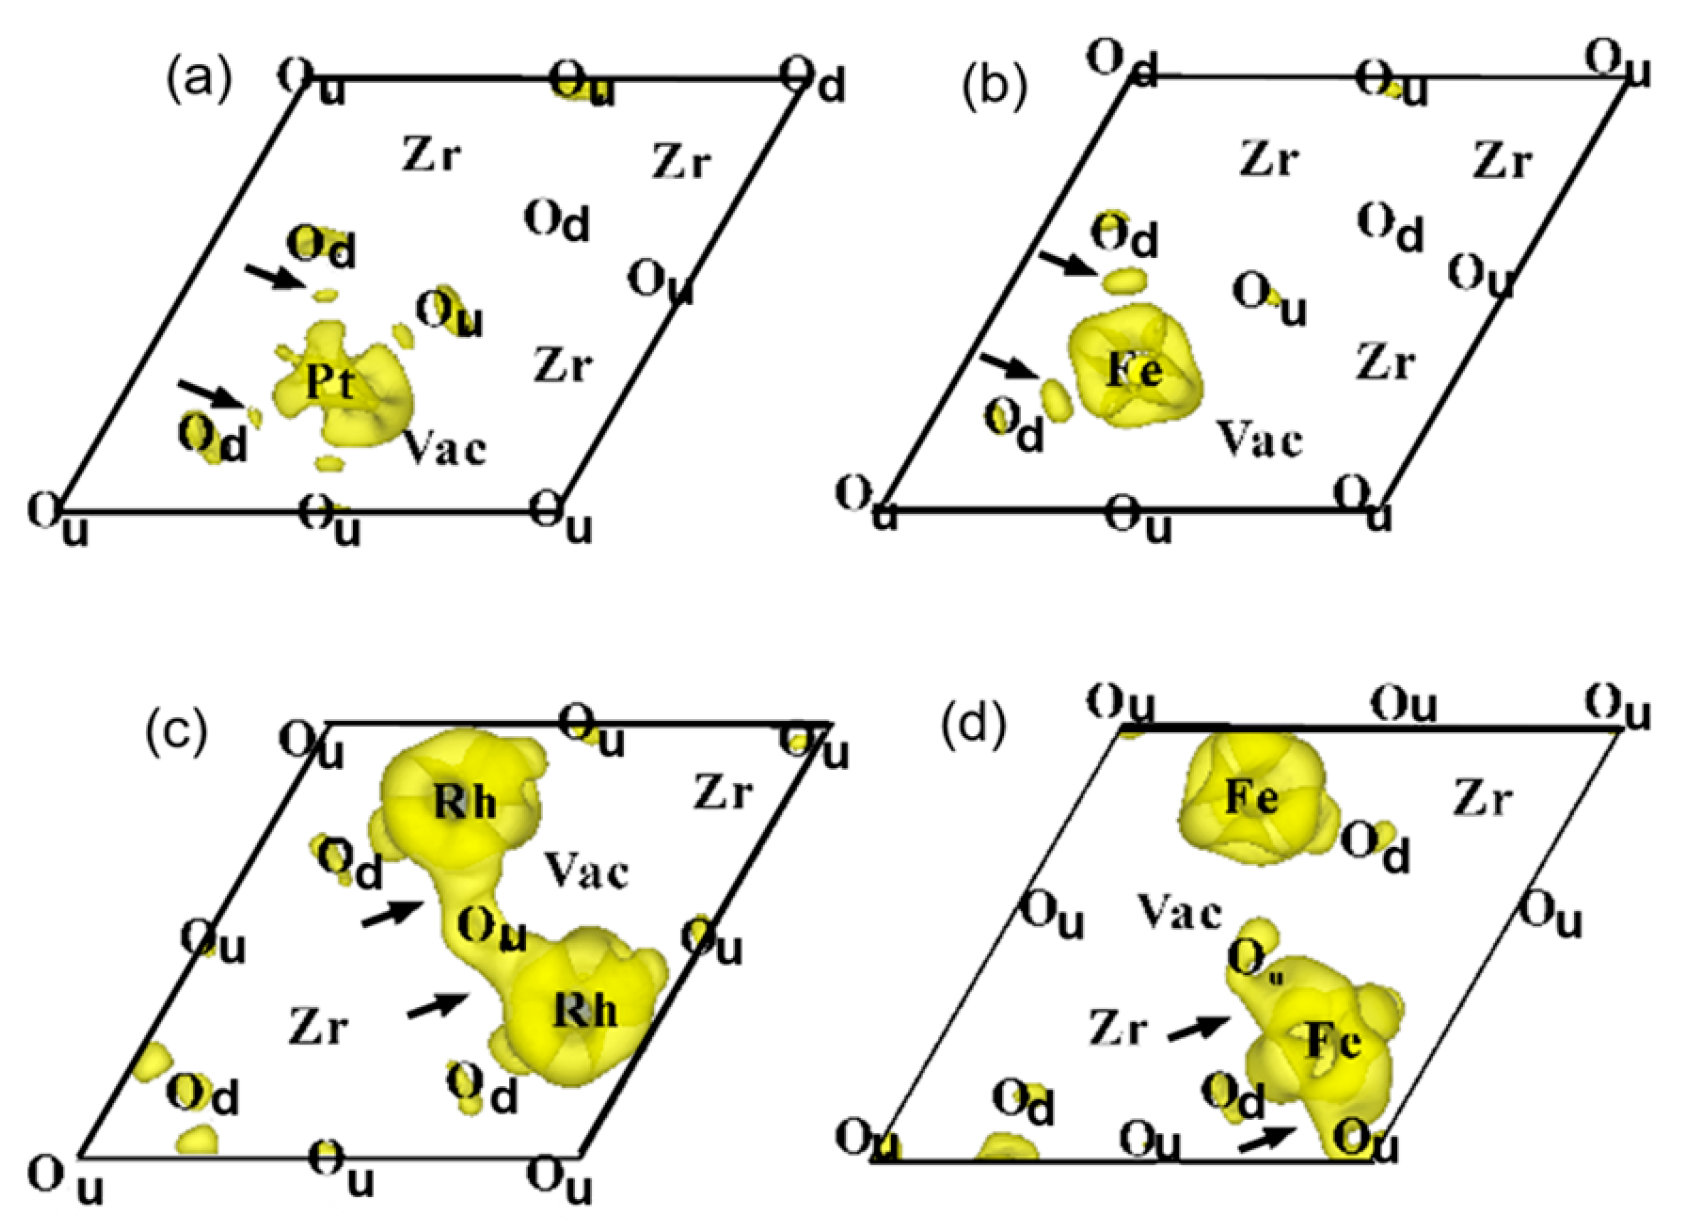
Figure 9.
The iso-surfaces in
Figure 9 show the positions of Zr, lattice oxygen, and dopants on the cubic ZrO
2 surface, along with the degree of electron accumulation. An accumulation of electrons around the dopant cations can be found on the cubic ZrO
2 surface. In other words,
Figure 9 demonstrates that the dopant can significantly influence the electron distribution. The electron accumulation around the trivalent dopant is more pronounced compared with that around the divalent dopant. Therefore, the results in
Figure 9 indicate that, as in
Figure 8, doping with a trivalent cation is favorable for promoting the formation of an agglomerated defect cluster with oxide ion vacancies.
In addition, the charge density difference between the Fe cations (i.e., Fe
2+ or Fe
3+) and the precious metal cations (i.e., Pt
2+ or Rh
3+) is compared in
Figure 9. Beyond electron accumulation, this figure clearly illustrates the presence of delocalized electrons around the cations, as indicated by small arrows. As shown in
Figure 9a,b, a small amount of delocalized electrons appears between the divalent dopant (i.e., Pt
2+ or Fe
2+) and the lattice oxygen. In contrast, the delocalized electron phenomenon becomes more pronounced between the trivalent dopant cations and the lattice oxygen, as seen in
Figure 9c,d.
In the case of the Rh
3+-doped cubic ZrO
2 surface (i.e.,
Figure 9c), the delocalized electrons were primarily distributed between Rh
3+ species and a single nearest-neighbor lattice oxygen. In contrast, for the Fe
3+-doped cubic ZrO
2 surface (i.e.,
Figure 9d), the delocalized electrons were mainly distributed among the trivalent Fe cation and two nearest-neighbor lattice oxygens. This finding suggests that the charge density level of the delocalized electron between the Fe
3+ cation and the lattice oxygens is consistently high across all calculated agglomerated defect clusters.
The results in
Figure 9 suggest that delocalized electrons promote the formation of agglomerated defect clusters with oxide ion vacancies on the cubic ZrO
2 surface and may soften the ZrO
2 surface lattice, thereby lowering the energy barrier between hopping sites required for the promotion of oxide ion diffusion.
In general, it is well known that oxide ion diffusion on ionic crystal surfaces is facilitated by soft local lattice vibrations in the vicinity of dopants. As noted in the Introduction, Atake et al. observed an unusual and large heat capacity signal in YSZ powder samples [
21] and YSZ-sintered pellets [
22,
23] that deviated markedly from the Debye model at cryogenic temperatures ranging from 2 K to 75 K. Refer to
Figure S5 in the Supplementary Materials. They concluded that the excess and unusually large heat capacity observed for YSZ is an extremely rare case among fuel cell materials and is attributable to the appearance of soft local vibrations around Y dopants, associated with the “Schottky anomaly” in the YSZ lattice.
According to the Debye model, the heat capacity at cryogenic temperature is expressed by Equation (2).
where C
el (=γT) is the electronic specific heat, and C
ph (=AT
3) is the lattice-specific heat. Here, γ and A are constants.
Low-temperature excitation of heat capacity is thought to be influenced by changes in the electron distribution around dopants in the cubic ZrO2 lattice at low temperatures. However, no published experimental or modelling data in the field of engineering applications of YSZ above room temperature have been reported to support the pronounced appearance of soft local lattice vibrations in YSZ caused by changes in electron distribution (i.e., electron delocalization) around dopants, other than Y3+ in YSZ, prior to this work.
Therefore, the present first-principles calculations on changes in electron distribution at the cubic ZrO2 surface are considered to theoretically demonstrate, for the first time, the appearance of soft local lattice vibrations near dopant sites in YSZ. In addition, these calculations suggest that an active site (i.e., hopping site) for surface oxide ion diffusion can be induced by doping a single di- or trivalent cation at locations distant from the TPB on YSZ in the anode layer. Notably, it is concluded that hopping site formation is facilitated around trivalent dopants, such as Rh3+ or Fe3+, on the cubic ZrO2 surface.
3.3.2. Effect of Doping in the Vicinity of TPB
Figure 10 presents the formation energies of defect clusters at the near side of the TPB. All calculated values in
Figure 10 are negative, indicating that agglomerated defect clusters composed of Ni cations, dopant cations, and oxide ion vacancies can form spontaneously in the vicinity of TPB. Compared with
Figure 8, the formation energies of these agglomerated defect clusters are markedly lower than those of defect clusters located far from the TPB. In particular, the formation energy of the cluster Ni
Zr″ + 2Rh
Zr′ + 2V
O˙˙ is much lower than that of Ni
Zr″ + Pt
Zr″ + 2V
O˙˙ or Ni
Zr″ + V
O˙˙. These results clearly indicate that the presence of Ni cations near the side of TPB facilitates the formation of agglomerated defect clusters with oxide ion vacancies. In other words, the enhancement of oxide ion vacancy formation by trace trivalent cation doping is significantly amplified in the YSZ near the TPB due to Ni diffusion (so-called “mutual diffusion” [
18]) from the Ni particles adjacent to YSZ particles in the anode layer.
Next, the average transferred charges of Zr, O and the dopants (i.e., Pt
2+, Rh
3+, Fe
2+ and Fe
3+) in the vicinity of the TPB were calculated and compared with those at locations far from the TPB (
Table 4). Since the electronegativity of Zr is lower than that of Ni, the charge transfer from Zr to lattice oxygen is more active than that from Ni to lattice oxygen. Furthermore,
Table 4 shows that the average transferred charge of Zr is approximately 2.5–3.0-times higher than that of Ni. This indicates that the presence of Ni further weakens the ionic bond strength between the dopant and lattice oxygen, thereby facilitating the spontaneous formation of oxide ion vacancies in the vicinity of the TPB.
This interpretation based on
Table 4 is consistent with the consideration drawn from the results in
Figure 10.
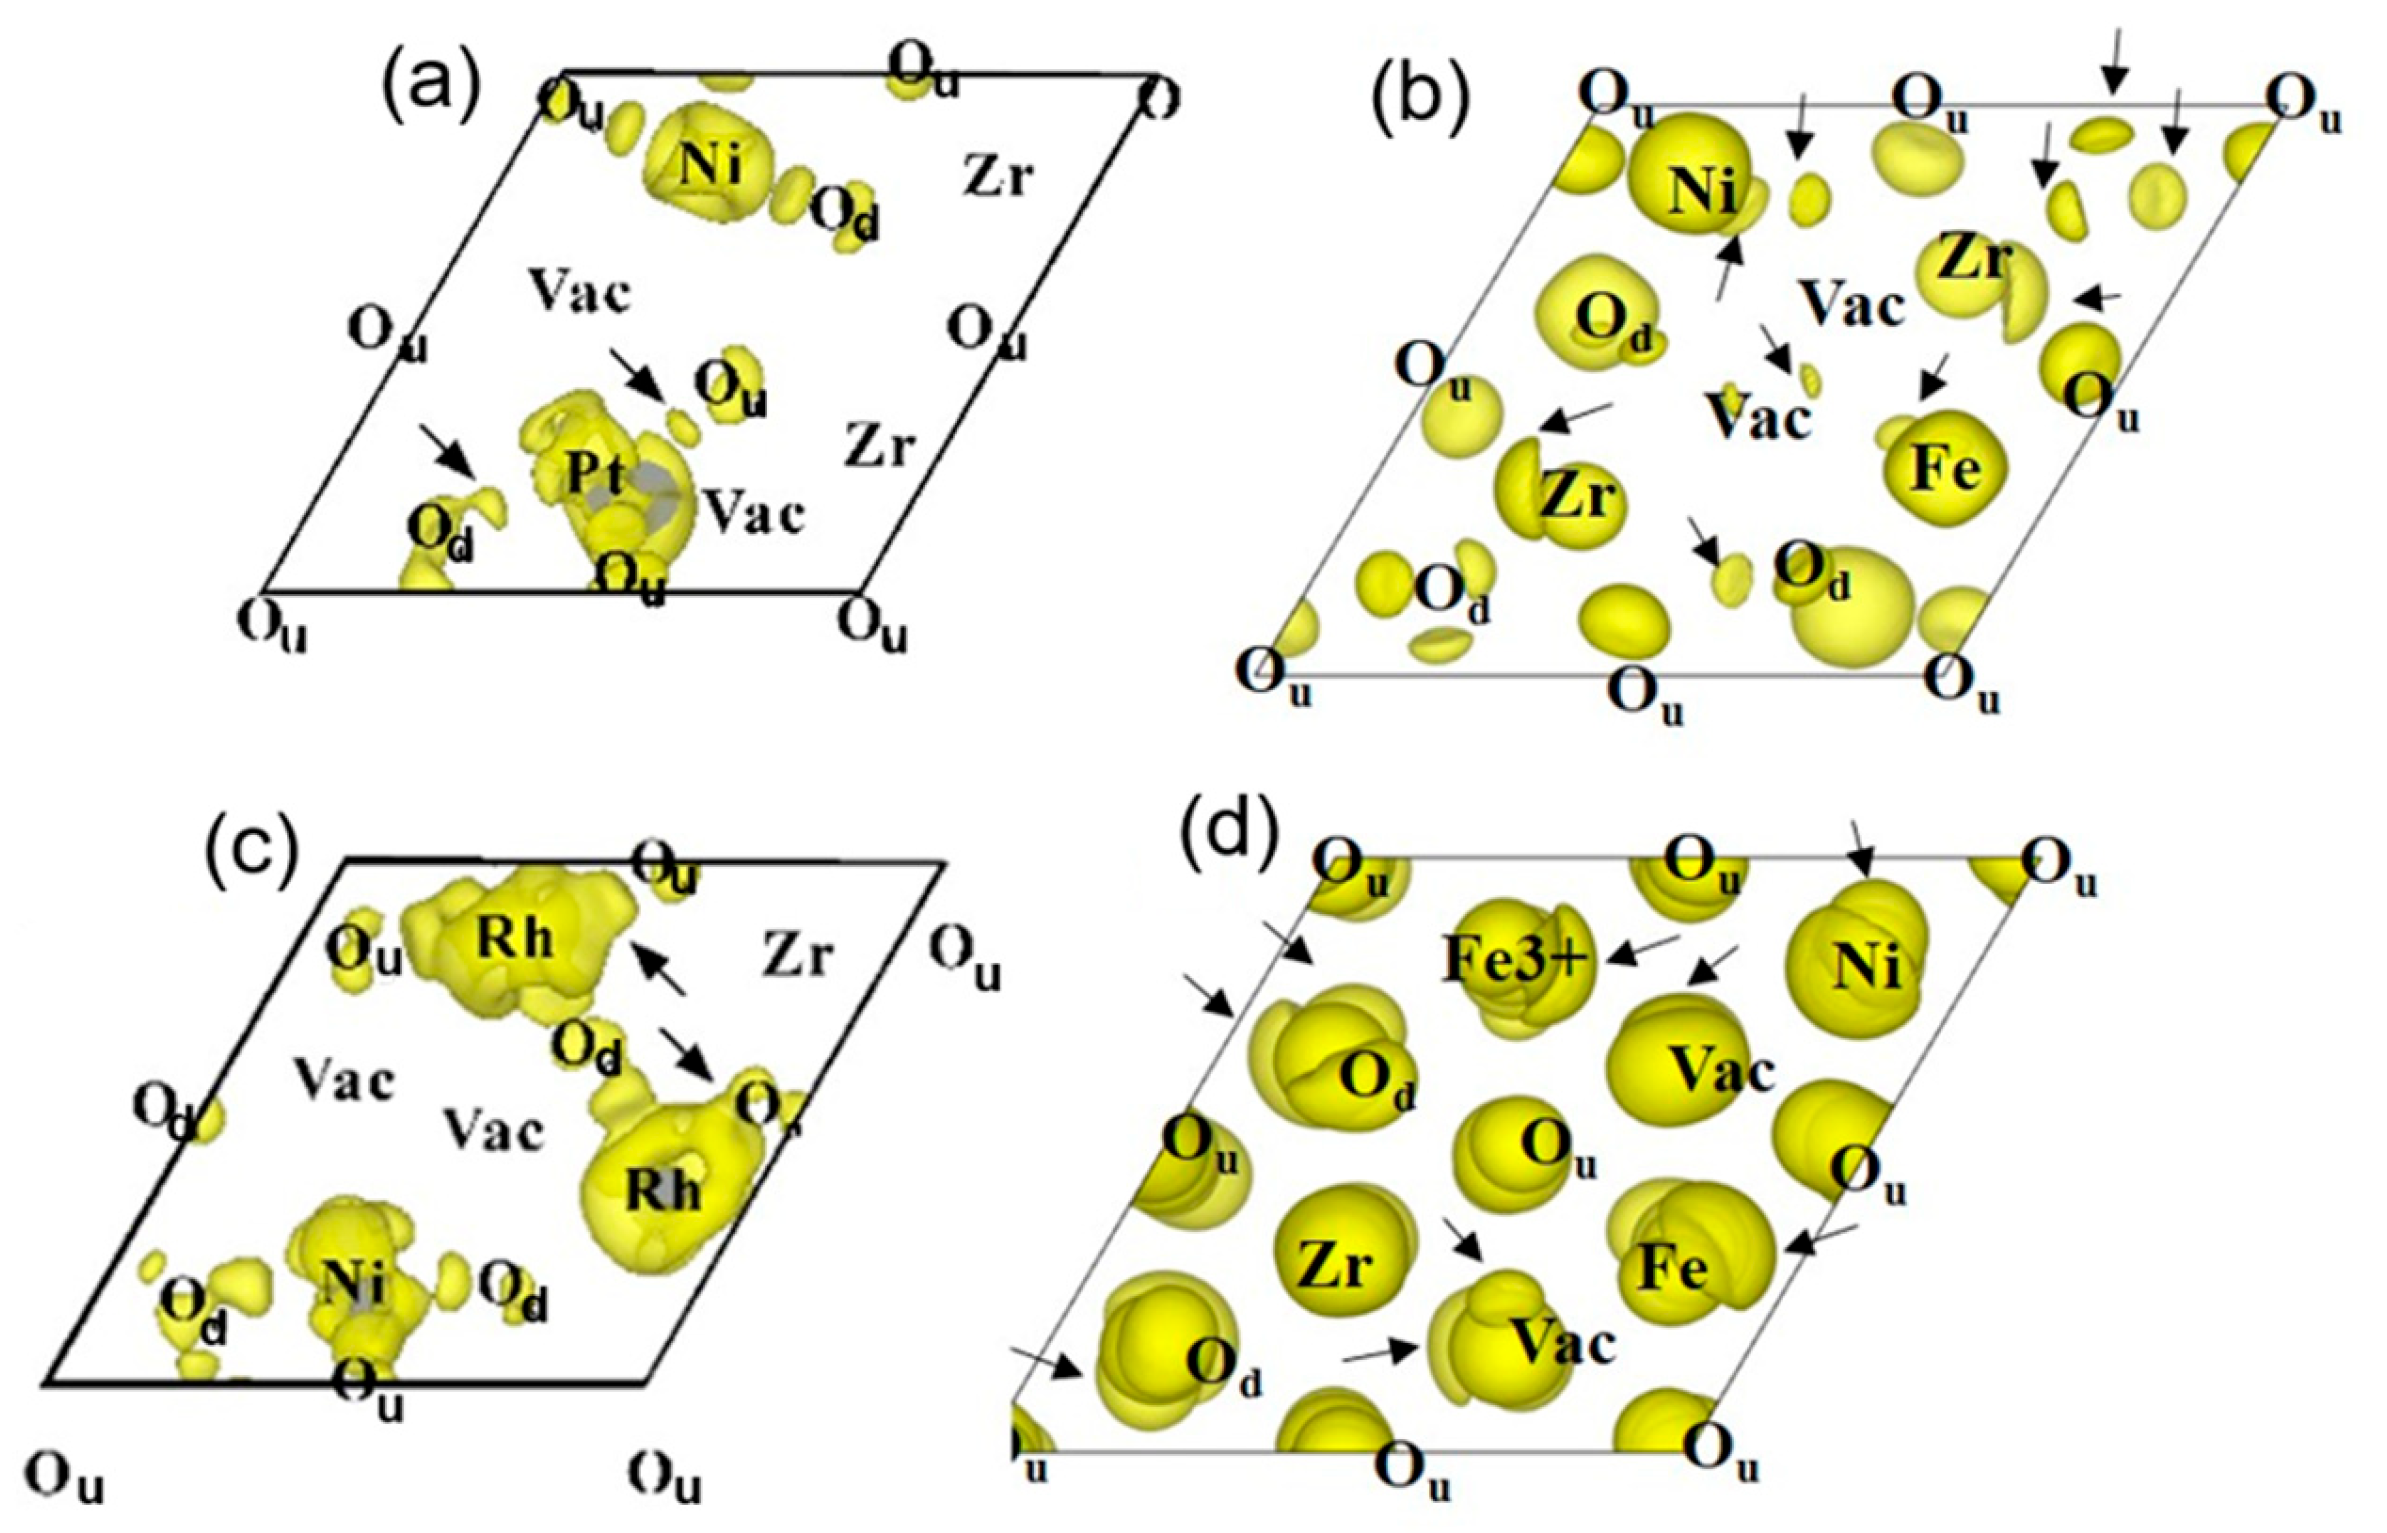
To examine electron delocalization around dopants on the near side of TPB, the calculated electron distribution is shown in
Figure 11. In
Figure 11, electron accumulation and electron delocalization are more clearly visible around the dopant cations compared to
Figure 9, which shows these features at positions far from the TPB. As shown in
Figure 11c, the delocalized electrons, indicated by small arrows, are clearly found between Rh cations and their nearest-neighbor lattice oxygen atoms. The delocalization effect seen in
Figure 11c is more pronounced than that in
Figure 11a and is also consistent with the calculated data in
Figure 10 and
Table 4. Notably, as seen in
Figure 11b,d, electron accumulation and electron delocalization phenomena are even more pronounced in the vicinity of the TPB for samples doped with small amounts of Fe
2+ and Fe
3+ cations compared to those shown in
Figure 11a,b.
3.4. Proposal of Guiding Principle for Design of Active Hopping Site on the Anode
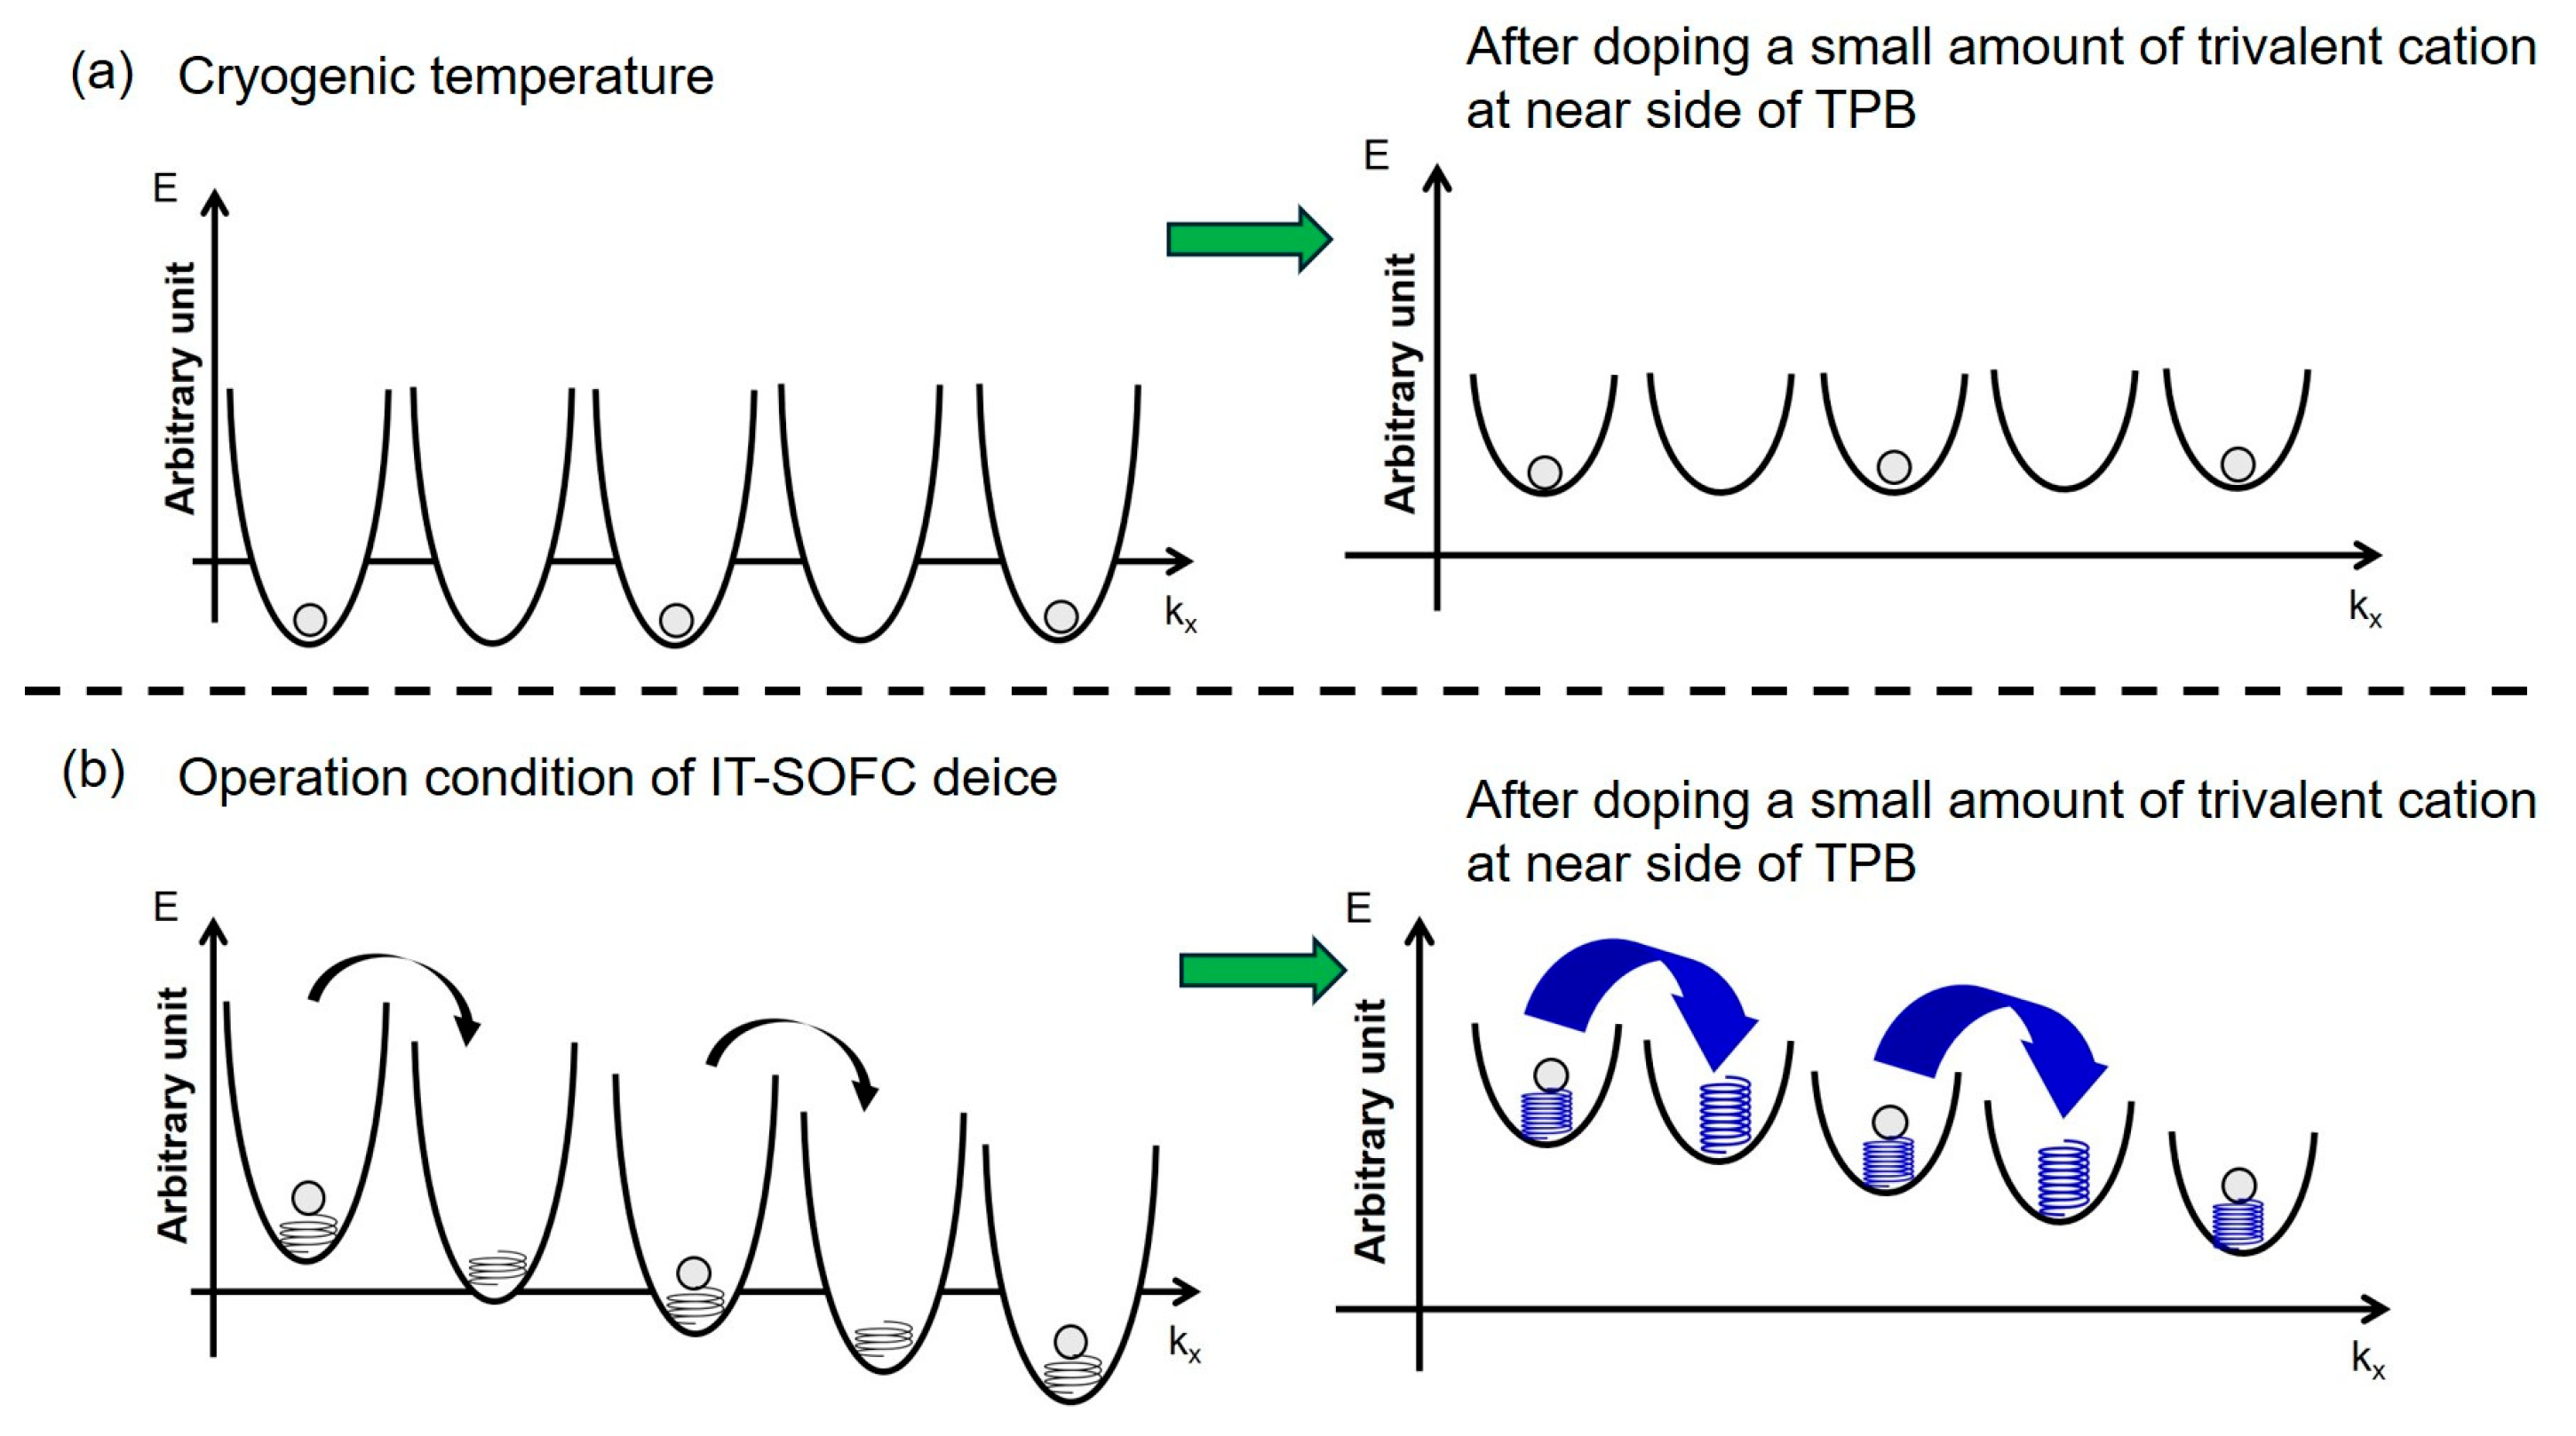
Based on the combined results from the IT-SOFC performance measurements, XPS characterization, and surface first-principles calculations, it can be concluded that single doping with a small amount of trivalent cations on the YSZ surface in the anode layer activates the hopping sites in the vicinity of the TPB on the YSZ surface. Refer to
Figure 12.
To further understand the mechanism behind this activation, it is important to consider how the local microstructure near the TPB is modified by such doping. In this context, insights from previous studies provide a valuable perspective.
In the present work, based on previously published reports describing Ni diffusion from Ni particles to the doped ceria surface with fluorite-related structures near the TPB, observed by analytical TEM of IT-SOFC anodes, and the formation of hetero-interfacial defect structures at sites close to TPB [
18], it was assumed that such hetero-interfacial defect structures containing Ni are can also be readily formed by doping a small amount of trivalent cations into YSZ in the anode layer.
Surface first-principles calculations in the present work also indicated that doping a small amount of trivalent cation promotes the formation of defect clusters containing Ni, along with the lattice softening resulting from electron delocalization and electron accumulation at both oxygen sites and oxide ion vacancy sites in the vicinity of TPB on the YSZ surface at cryogenic temperature. This suggests that such doping reduces the depth of the potential well at lattice sites for oxygen and oxide ion vacancies on the YSZ surface near the TPB, thereby enabling the formation of surface defect structures that facilitate oxide ion hopping on the YSZ. Refer to
Figure 12a.
On the other hand, under the operating conditions of the IT-SOFC device (i.e., below 973 K) and under bias application, the features of the YSZ surface shown in
Figure 12b are utilized. The oxide ion vacancy sites formed in the vicinity of TPB on YSZ are considered to act as active hopping sites for the rapid surface diffusion of oxide ions, facilitated by a lowered energy barrier during hopping and by lattice vibration activation through YSZ lattice softening. Refer to
Figure 12b.
The formation of the active hopping site shown in
Figure 12b is believed to be achievable by doping a small amount of Fe
3+ in the vicinity of the TPB; however, Fe cations tend to form a mixed-valent states of Fe
2+ and Fe
3+.
Therefore, by depositing a small amount of oxide, such as Sc2O3 or In2O3, onto the anode surface, followed by reductive decomposition at 1073 K under a hydrogen gas flow and subsequent homogeneous diffusion of Sc3+ or In3+ into the anode layer, using the same doping process demonstrated in the present work, it should be possible to more effectively design active hopping sites by doping a small amount of trivalent cations onto the YSZ surface in the anode layer of an IT-SOFC device.
The design guiding principle proposed in the present work can be applied not only to the activation of IT-SOFC device anodes but also to the activation of Cu-loaded YSZ catalysts for methanol synthesis using both CO
2, a greenhouse gas, and H
2, a clean energy source, as starting materials [
38]. Therefore, the proposed design guiding principle is expected to contribute to the development of various low-environmental-impact technologies that leverage the unique physical property of YSZ in the near future.
4. Conclusions
To enhance the performance of IT-SOFC devices by leveraging the specific heat excitation phenomenon at cryogenic temperatures (i.e., the “Schottky anomaly”), which is known to deviate significantly from the Debye model only for YSZ among conventional fuel cell materials, and to propose a design guiding principle for maximizing the physical properties of YSZ, RhOx or FeOx was deposited on the YSZ surface in the anode layer of IT-SOFC devices. Subsequent reduction treatment doped a small amount (≤1200 ppm) of trivalent cations onto the YSZ surface. As a result of IT-SOFC performance evaluation, the current densities observed at 973 K were approximately nine-times higher than those of IT-SOFC devices with anode lacking trivalent cation doping on YSZ.
Using a disk-shaped single-crystal YSZ surface with a model TPB, the proportion of Fe3+ introduced by FeOx deposition was estimated. Furthermore, the effect of trace trivalent cation doping on IT-SOFC performance was evaluated using surface first-principles calculations, under the assumption that Ni diffusion also occurs through the TPB on the YSZ in the actual anode of the IT-SOFC device.
The surface first-principles calculations in the present work indicated that, when a trivalent cation, particularly Fe3+, was doped in the vicinity of TPB, agglomerated defect clusters formed spontaneously, accompanied by electron accumulation and delocalization at the sites of the cation, oxygen, and oxide ion vacancy within the clusters.
Based on all experimental data and calculation results, it is concluded that the oxide ion vacancy sites formed in the vicinity of TPB on YSZ through Fe3+ doping play a key role as active hopping sites for the high-speed diffusion of oxide ions, facilitated by a lowering of the energy barrier during hopping and by activation of lattice vibrations through lattice softening on the YSZ surface.
However, because Fe cations tend to form a mixed-valence state of Fe2+ and Fe3+, the trace doping of Sc3+ or In3+ is proposed as a design guiding principle for creating active hopping sites on the YSZ surface in the anode layer of IT-SOFC devices. The present design guiding principle, which leverages the unique physical properties of YSZ, is also expected to contribute to the development of various low-environmental-impact technologies in the near future.


