Article

Study of the Thermal Performance of Oil-Cooled Electric Motor with Different Oil-Jet Ring Configurations

1
Vehicle Engineering Institute, Chongqing University of Technology, Chongqing 400054, China
2
College of Mechanical and Vehicle Engineering, Hunan University, Changsha 410082, China
*
Authors to whom correspondence should be addressed.
Energies 2025, 18(16), 4302; https://doi.org/10.3390/en18164302
Submission received: 19 July 2025 / Revised: 9 August 2025 / Accepted: 10 August 2025 / Published: 13 August 2025

Abstract

This study investigates the thermal performance of an oil-jet-cooled permanent magnet synchronous motor (PMSM), with a particular focus on end-winding heat dissipation. A high-fidelity numerical model that preserves the full geometric complexity of the end-winding is developed and validated against experimental temperature data, achieving average deviations below 7%. To facilitate efficient parametric analysis, a simplified equivalent model is constructed by replacing the complex geometry with a thermally equivalent annular region characterized by calibrated radial conductivity. Based on this model, the effects of key spray ring parameters—including orifice diameter, number of nozzles, inlet oil temperature, and flow rate—are systematically evaluated. The results indicate that reducing the orifice diameter from 4 mm to 2 mm lowers the maximum winding temperature from 162 °C to 153 °C but increases the pressure drop from 205 Pa to 913 Pa. An optimal nozzle number of 12 decreases the peak winding temperature to 155 °C compared with 162 °C for 8 nozzles, while increasing the oil flow rate from 2 L/min to 6 L/min reduces the peak winding temperature from 162 °C to 142 °C. Furthermore, a non-uniform spray ring configuration decreases maximum stator, winding, spray ring, and shaft temperatures by 5.6–9.2% relative to the baseline, albeit with a pressure drop increase from 907 Pa to 1410 Pa. These findings provide quantitative guidance for optimizing oil-jet cooling designs for PMSMs under engineering constraints.

1. Introduction

With the rapid advancement of new energy vehicles (NEVs), thermal management of powertrain components has become increasingly critical, particularly for traction motors operating under high-speed and high-load conditions [1,2]. Among them, permanent magnet synchronous motors (PMSMs) are widely adopted in electric drivetrains due to their high efficiency and power density [3]. However, the end-winding region—characterized by its intricate geometry and limited spatial availability—is prone to heat accumulation, becoming a key thermal hotspot [4]. Such localized overheating not only compromises motor performance but also threatens the integrity of the insulation system and shortens the overall service life [5,6,7].
Electric motor cooling methods can be categorized based on the cooling medium into air cooling [8,9,10], liquid cooling [11,12,13], and special media cooling [14], including hydrogen [15,16,17] and refrigerants [18,19]. Among various cooling strategies, oil-jet cooling has emerged as an effective and compact method, particularly suited for high-power-density motors [20,21,22]. Compared with traditional water cooling, oil cooling offers better dielectric safety, enables direct-contact cooling of windings, and facilitates a more compact system layout, making it ideal for spatially constrained PMSM applications [23,24]. In such systems, the performance of the cooling mechanism is highly sensitive to the design of spray structures—including nozzle arrangement, orifice diameter, and the number of injection holes—which determine the oil distribution and convective efficiency within the end-winding region.
In recent years, extensive research has been conducted on the thermal optimization of PMSMs through both numerical simulations and experimental validation. For example, Beom et al. [25] used a Lagrangian approach to analyze oil flow characteristics and found that increasing inlet oil velocity from 2 m/s to 4 m/s improved the flow field coefficient by approximately 30%, indicating that optimizing oil flow is essential for enhancing thermal performance. Jiang et al. [26] applied the Taguchi method and grey fuzzy logic to optimize the cooling system of a hybrid oil-cooled PMSM; under high-load conditions, the optimized motor maintained winding temperatures around 100 °C during two hours of continuous operation. Thangaraju et al. [27] numerically studied the effect of vertical straight fins on PMSM jacket cooling performance, showing that jackets with fins achieved a ~40% increase in heat transfer coefficient compared to those without. Feng et al. [28] conducted experiments on various nozzle configurations and observed that increasing the oil flow rate from 3 L/min to 6 L/min reduced the average end-winding temperature by approximately 18 °C.
Despite these advancements, most existing models adopt geometric simplifications for the end-winding region, often neglecting localized fluid–thermal interactions and thus limiting the accuracy of thermal predictions [29]. Gundabattini et al. [30] reviewed multiphysics models of PMSMs and emphasized the importance of enhanced coupling between electromagnetic and thermal domains, which simplified geometries fail to support. Han et al. [31] investigated the thermal effects of oil agitation through combined experiments and simulations, revealing that agitation could elevate winding temperature by as much as 124 °C under certain conditions—an effect not accounted for in conventional simplified models. Rocca et al. [32] used CFD simulations to assess the impact of geometric fidelity on heat dissipation in totally enclosed fan-cooled (TEFC) motors, finding that the difference in heat loss predictions between simplified and realistic end-winding geometries could reach up to 45%.
To address these issues, this study proposes a high-fidelity modeling method that fully retains the three-dimensional geometric features of the end-winding structure. The model is validated against temperature measurements obtained under industrial operating conditions. For improved computational efficiency in subsequent parametric studies, a simplified equivalent model is employed to investigate the influence of key spray ring parameters—including orifice diameter, hole number, and injection angle—on winding temperature distribution and system pressure drop. Furthermore, a non-symmetric spray ring configuration is introduced to accommodate asymmetric heat flux between the welding-side and terminal-side windings. This research provides theoretical guidance and engineering insights for the structural design and spray optimization of oil-cooled PMSMs.

2. High-Fidelity Modeling Approach and Experimental Validation

2.1. High-Fidelity Geometric Modeling Approach

The original geometric model of the motor was provided by an industrial partner, as shown in Figure 1. Since this study focuses primarily on the end-winding region, components such as the rotor were omitted from the simulation domain. The main modeled parts include the motor housing, stator, in-slot windings, welding-side end windings, terminal-side end windings, and the central shaft. The outer surface of the stator is designed with protrusions that, together with the motor housing, form cooling oil channels.
Cooling oil enters from the inlet and is partially injected by the spray ring into the welding-side end winding, before exiting through outlet 1. The majority of the oil, however, flows along the oil passages on the stator surface and is then sprayed onto the terminal-side end winding by another spray ring, finally exiting through outlet 2, thus completing the entire cooling cycle.
The studied motor is a commercial PMSM provided by an industrial partner. Due to confidentiality constraints, the specific model number is not disclosed. The rated power is 38 kW, with a maximum rotational speed of 12,000 rpm and a nominal voltage of 380 V. The stator features 48 slots and 8 poles, and the winding adopts an 8-layer hairpin structure. The key dimensions and electrical specifications are summarized in Table 1.
The key structural dimensions of the permanent magnet synchronous motor (PMSM) used in this study are illustrated in Figure 2a,b. The stator has an outer diameter of 212 mm and an inner diameter of 150 mm. The end-windings extend axially by 37 mm on the welding side and 24 mm on the terminal side. The oil-jet ring is positioned 4 mm above the surface of the end-windings, with 8 nozzles uniformly distributed along the circumferential direction. These geometric parameters were defined based on a CAD model provided by an industrial partner and validated against physical hardware measurements to ensure geometric fidelity.
To overcome this, we developed a high-fidelity geometric modeling method in which the intricate structure of the end windings is fully preserved. The winding region was extracted using a surface-wrapping technique, and only minor features like chamfers were removed to facilitate meshing. The simplified but high-fidelity geometry is illustrated in Figure 2c. Due to Fluent Meshing’s requirement that the wrapping domain be a closed shell with thickness, a shell volume enclosing the end-winding region was created. After meshing the winding region and surrounding fluid domains separately, the components were assembled in ANSYS Fluent 2024 R1 for coupled simulation, as shown in Figure 2d.
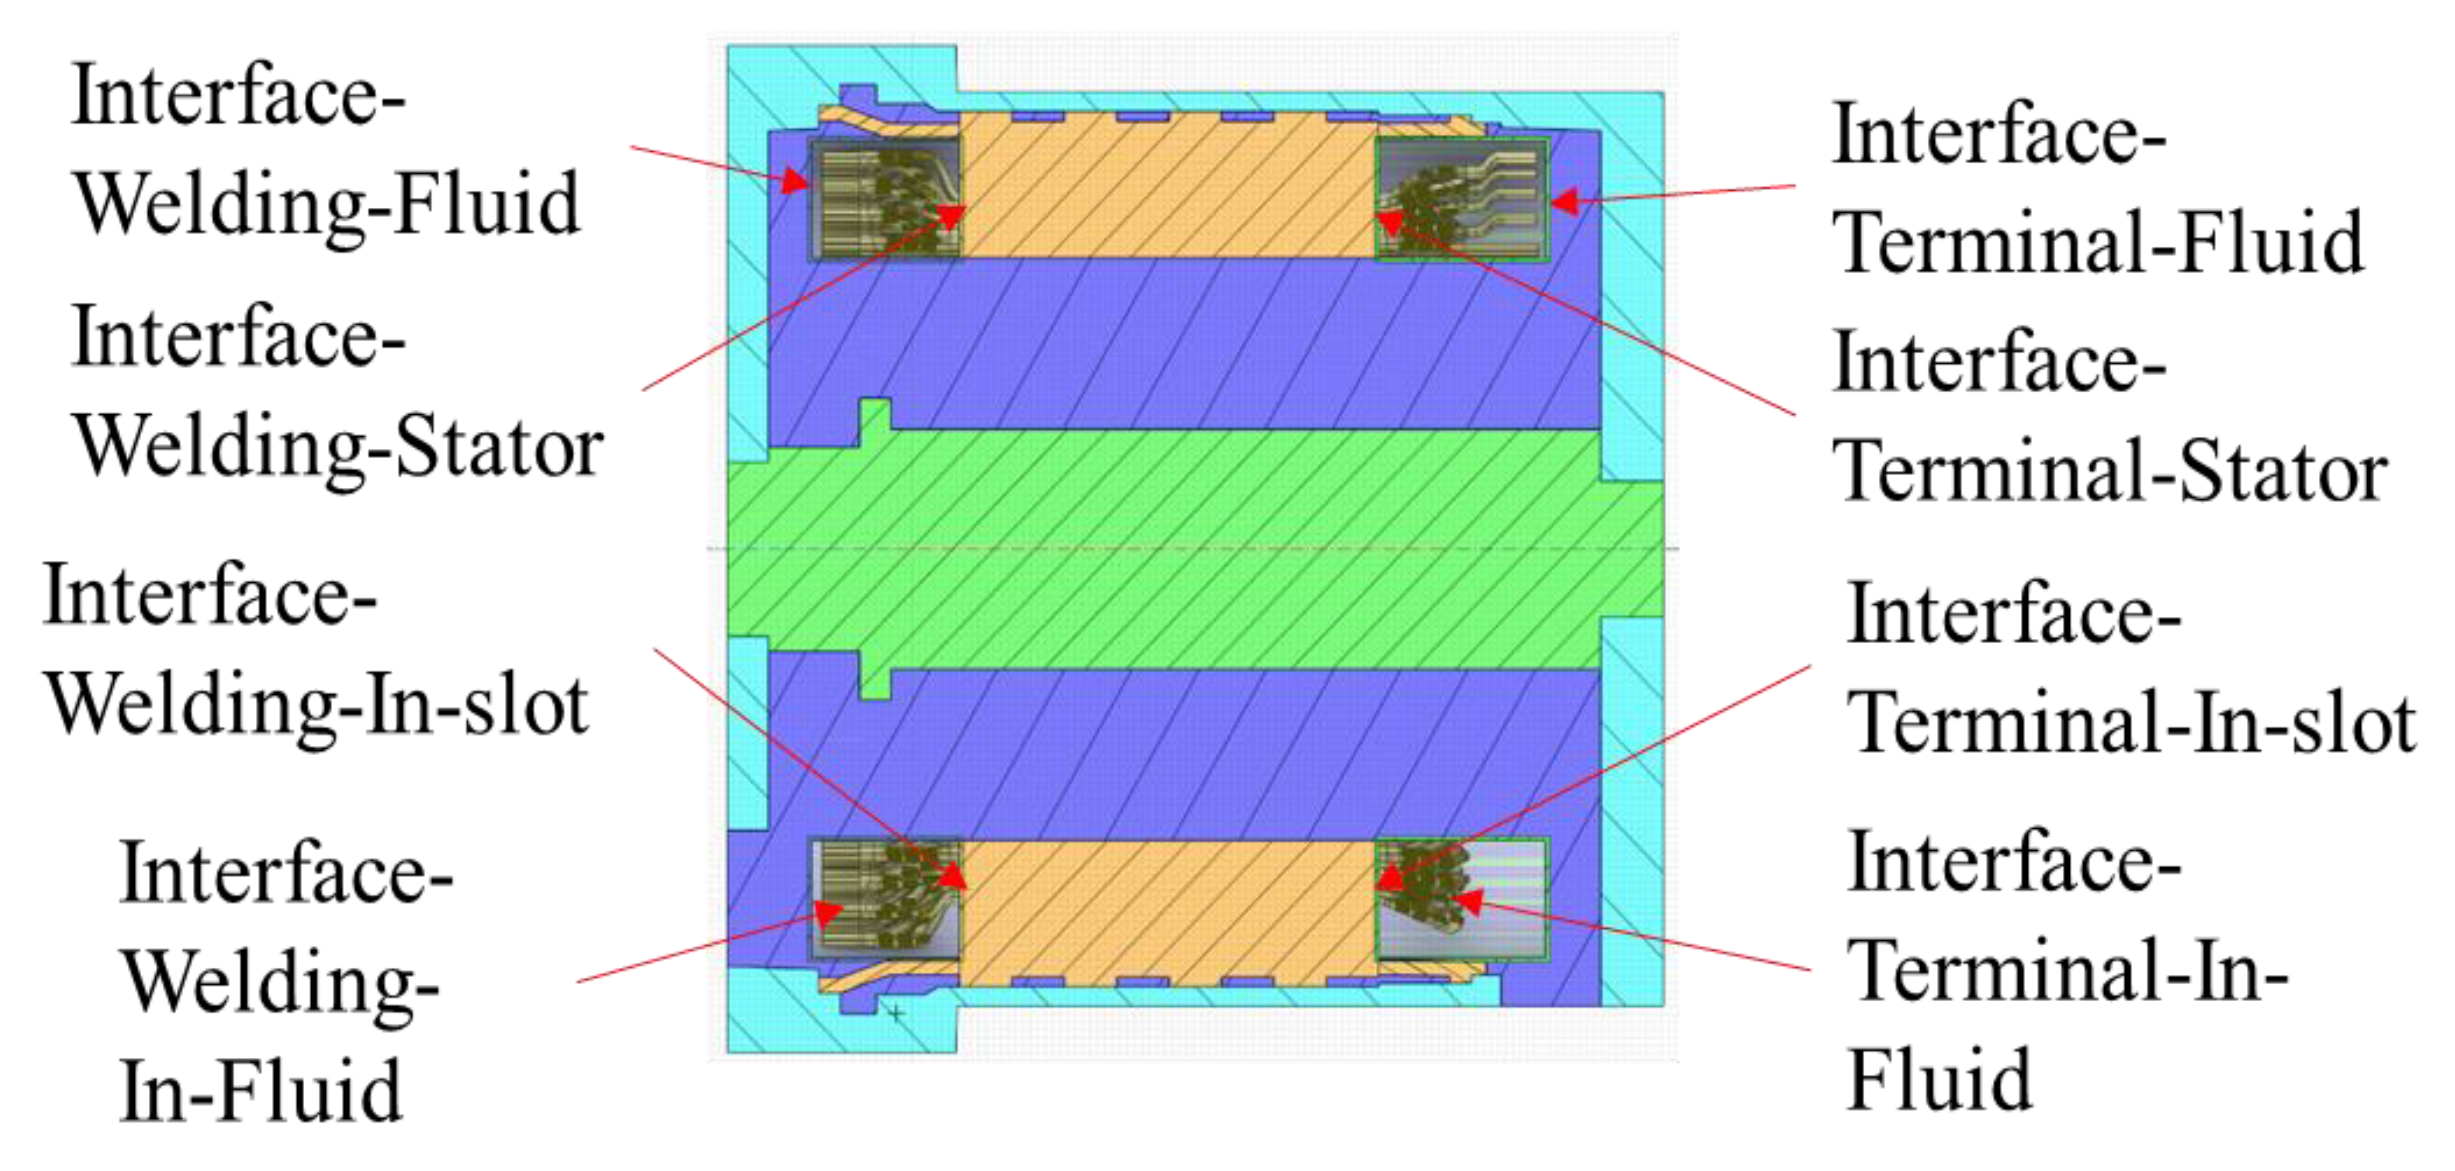
Once the end-winding was separately wrapped and meshed, interface boundaries were defined in the Fluent geometry to allow data transfer between solid and fluid domains during simulation. As illustrated in Figure 3, these include the following:
(1)
The interfaces between the fluid and the terminal-side/welding-side end windings.
(2)
The interface between the in-slot winding and adjacent end windings.
(3)
The inner/outer fluid interfaces of the spray ring.
(4)
The interface between the spray-ring fluid and the stator surface.

2.2. Governing Equations and Heat Source Specification

In this study, a multiphase CFD framework is developed to investigate the oil jet impingement cooling performance in a motor. The oil–air two-phase flow and the heat transfer in the winding-end region are simulated using the Volume of Fluid (VOF) method, coupled with the Shear Stress Transport SST k-ω turbulence model to resolve the complex interactions between impinging jets, air entrainment, and thermally active solid boundaries. The multiphase flow and turbulence models adopted in this study are consistent with those commonly used in jet cooling simulations of electric machines [21].
The oil and air phases are modeled using a shared computational domain, where the volume fraction of oil, denoted by α, is governed by a conservative transport equation:
α t + 𝛻 ( u α ) = 0
Here, α ∈ [0, 1] defines the local fluid state, where α = 1 represents pure oil, α = 0 indicates pure air, and intermediate values denote mixed cells at the interface. The effective material properties are determined using phase-weighted linear blending:
ρ = α ρ o + ( 1 α ) ρ a
μ = α μ o + ( 1 α ) μ a
where ρ and μ denote the local mixture density and viscosity, and the subscripts o and a represent oil and air, respectively. Surface tension effects at the oil–air interface are modeled using the Continuum Surface Force (CSF) approach, in which the body force due to surface tension is expressed as
F σ = σ κ 𝛻 α
With σ being the surface tension coefficient and κ representing the curvature of the interface, calculated from the divergence of the unit normal vector field.
The governing momentum equation for the multiphase system incorporates both gravitational acceleration and surface tension effects, as shown below:
ρ u t + ( u 𝛻 ) u = 𝛻 p + 𝛻 [ μ ( 𝛻 u + 𝛻 u T ) ] + ρ g + F σ
where u is the velocity vector, p is the pressure, and g is the gravitational acceleration vector. Equation (5) describes the flow behavior of the oil–air mixture. In this study, the momentum equations apply to the entire shared domain containing both air and oil phases, with effective properties determined by phase-weighted averaging based on the local oil volume fraction α.
The heat transfer within the domain is governed by the energy equation, which accounts for convective and conductive effects within both fluid phases:
( ρ E ) t + 𝛻 [ u ( ρ E + p ) ] = 𝛻 ( k eff 𝛻 T ) + S h
The effective thermal conductivity is similarly phase-averaged:
k e = α k o + ( 1 α ) k a
where kₒ and kₐ denote the thermal conductivity of oil and air, respectively, and Sₕ is the internal heat generation term, representing volumetric heat sources within the winding.
To accurately resolve the turbulent behavior of the impinging oil jet, particularly in near-wall and free-shear regions, the SST k-ω turbulence model proposed by Menter [33] was employed in this study. This model combines the advantages of both the standard k-ω and k-ε models by using a blending function (F1) that applies the k-ω formulation near the wall, where accurate resolution of the viscous sublayer is critical, and gradually transitions to the k-ε model in the free stream to improve prediction of separated flows and jet-induced vortices.
The governing equations for the SST k-ω model consist of the transport equations for turbulent kinetic energy and specific dissipation rate, given as follows:
Transport equation for turbulent kinetic energy:
( ρ k ) t + ( ρ u j k ) x j = P k β ρ k ω + x j μ + σ k μ t k x j
Transport equation for specific dissipation rate:
( ρ ω ) t + ( ρ u j ω ) x j = α ω k P k β ρ ω 2 + x j μ + σ ω μ t ω x j + 2 ( 1 F 1 ) ρ σ ω 2 1 ω k x j ω x j
where μ t is the eddy viscosity, P k represents the production of turbulent kinetic energy, and F 1 is the blending function ensuring smooth transition between k-ω and k-ε models. Model constants such as α , β , β , σ k , σ ω , and σ ω 2 are assigned based on the standard values recommended in the original formulation by Menter [33].
To avoid the computational burden of full electromagnetic–thermal coupling, this study bypasses direct electromagnetic field simulation. Instead, heat generation rates provided by the industrial partner—derived from a proprietary electromagnetic design tool—are used as inputs for thermal modeling. These loss values are converted into equivalent volumetric heat sources and uniformly applied to the corresponding motor components. The data are summarized in Table 2.

2.3. Boundary Conditions

In the actual motor design, a metallic sleeve is employed to prevent cooling oil from entering the air gap and to physically isolate the rotor from the stator housing. Consequently, no significant fluid-structure interaction occurs between the shaft and the surrounding oil. Based on this structural constraint, the rotor was excluded from the computational domain, and the oil flow was assumed to be stationary. This simplification reduces computational cost while still capturing the dominant cooling phenomena in the end-winding region.
To accurately simulate the steady-state thermal behavior of an oil-cooled PMSM, a three-dimensional steady compressible flow–thermal coupling model is developed. The following assumptions are applied:
(1)
The influence of electromagnetic field transients is neglected; the motor operates under steady-state conditions.
(2)
The lubricating oil is modeled as an incompressible, single-phase continuous medium. Phase change phenomena such as evaporation and cavitation are ignored.
(3)
Thermophysical properties of all materials are considered constant and evaluated at room temperature.
(4)
Internal heat sources in the windings are treated as uniformly distributed volumetric heat sources derived from electromagnetic losses.
All boundary conditions and material properties are set based on enterprise-provided specifications and actual operating parameters. The inlet flow rate is set to 8 L/min, and the inlet oil temperature is 80 °C. The thermophysical properties used in the simulation are listed in Table 3 and Table 4.

2.4. Mesh Generation and Grid Independence Verification

Due to the complexity of the motor geometry, mesh generation is performed in two stages: The main motor structure, excluding the end-winding and its adjacent fluid region, is meshed using Fluent Meshing’s Watertight Geometry workflow (Figure 4a). The end-winding region and internal oil flow are meshed separately using the Fault-Tolerant Wrapping method (Figure 4b). After meshing, the domains are assembled in ANSYS Fluent, and appropriate interfaces are defined.
To evaluate mesh independence, five different mesh densities are examined (ranging from 1.2 million to 4.8 million elements). Average temperatures of the total winding and stator core are used as evaluation metrics. As shown in Figure 5, the results converge progressively with mesh refinement. Beyond 3.52 million elements, temperature variation falls below 1 °C, confirming grid independence. The mesh with 3.52 million elements is selected for subsequent analyses as it balances accuracy and computational efficiency.

2.5. Numerical Validation

To validate the accuracy of the high-fidelity thermal model developed in this study, experimental data were obtained from a dedicated motor test platform established by an original equipment manufacturer of the driving motor. The test object is a PMSM, operated under a steady-state and thermally conservative condition at rated power (38 kW) and maximum speed (12,000 rpm) until thermal equilibrium was reached. Although this condition is non-standard compared to typical drive cycles, it was intentionally selected to simulate near-peak thermal load and to expose worst-case heat accumulation in the end-winding region. The steady operation ensures repeatable measurements and aligns with common industrial validation practices. Therefore, the obtained data are considered suitable and conservative for evaluating the accuracy of the high-fidelity CFD model. Input current was monitored via a high-precision clamp meter with a range of 0–300 A and an accuracy of ±0.2%.
As shown in Figure 6, a total of 30 thermocouples were deployed on the end-windings to capture spatially distributed temperatures. Five circumferential locations were selected on each of the welding and terminal sides, and at each location, sensors were placed at the inner, middle, and outer radial layers. T-type thermocouples (0–400 °C, ±0.5% accuracy) were used for winding temperature measurements, while Pt100 sensors (0–850 °C, ±0.5% accuracy) were installed at the oil inlet and outlet to record fluid temperatures. The oil injection pressure was measured using a pressure transducer with a range of 1–50 bar and ±0.25% accuracy.
All temperature, current, and pressure data were recorded using a multi-channel data acquisition system at a sampling rate of 1 Hz, with a resolution of ±0.1%. The ambient temperature during testing was maintained at 25 °C ± 0.5 °C in a temperature chamber. A disc brake dynamometer was employed to apply an external load to the motor.
To assess the accuracy of the experimental measurements, an uncertainty analysis was performed using the linearized propagation method. The total uncertainty in a derived parameter Y, as a function of independent variables X1, X2,…, Xn, was calculated by [6]
U Y = Y X 1 U X 1 2 + Y X 2 U X 2 2 + + Y X n U X n 2
where UY is the combined uncertainty of the dependent variable Y, and UX represents the uncertainty in each independent parameter.
Based on the rated accuracies of the thermocouples (±0.5%), pressure sensors (±0.25%), current probes (±0.2%), flow meters (±5%), and data acquisition system (±0.1%), the total uncertainties associated with temperature, pressure, current, and flow rate were estimated to be ±1.85%, ±2.93%, ±2.34%, and ±3.78%, respectively.
Simulation probes are placed at identical geometric positions, and the motor is simulated under the same thermal load conditions. A detailed comparison is shown in Table 5. The results indicate good agreement at the middle and outer layers, with relative errors mostly within 10%, meeting engineering design requirements. Inner-layer errors are larger due to neglecting oil splash cooling from the rotating shaft. The relatively larger temperature deviations in the inner-layer regions are attributed to the neglect of shaft-induced oil splashing effects. While this mechanism may provide additional local convection, it is absent under the current sealed-shaft configuration. Future studies will explore more complex multiphase interactions involving rotating shaft spray for improved accuracy.
Figure 7 presents the average temperature comparisons for each measuring position. The average deviation is less than 6% on the welding side and less than 7% on the terminal side, demonstrating good predictive accuracy.
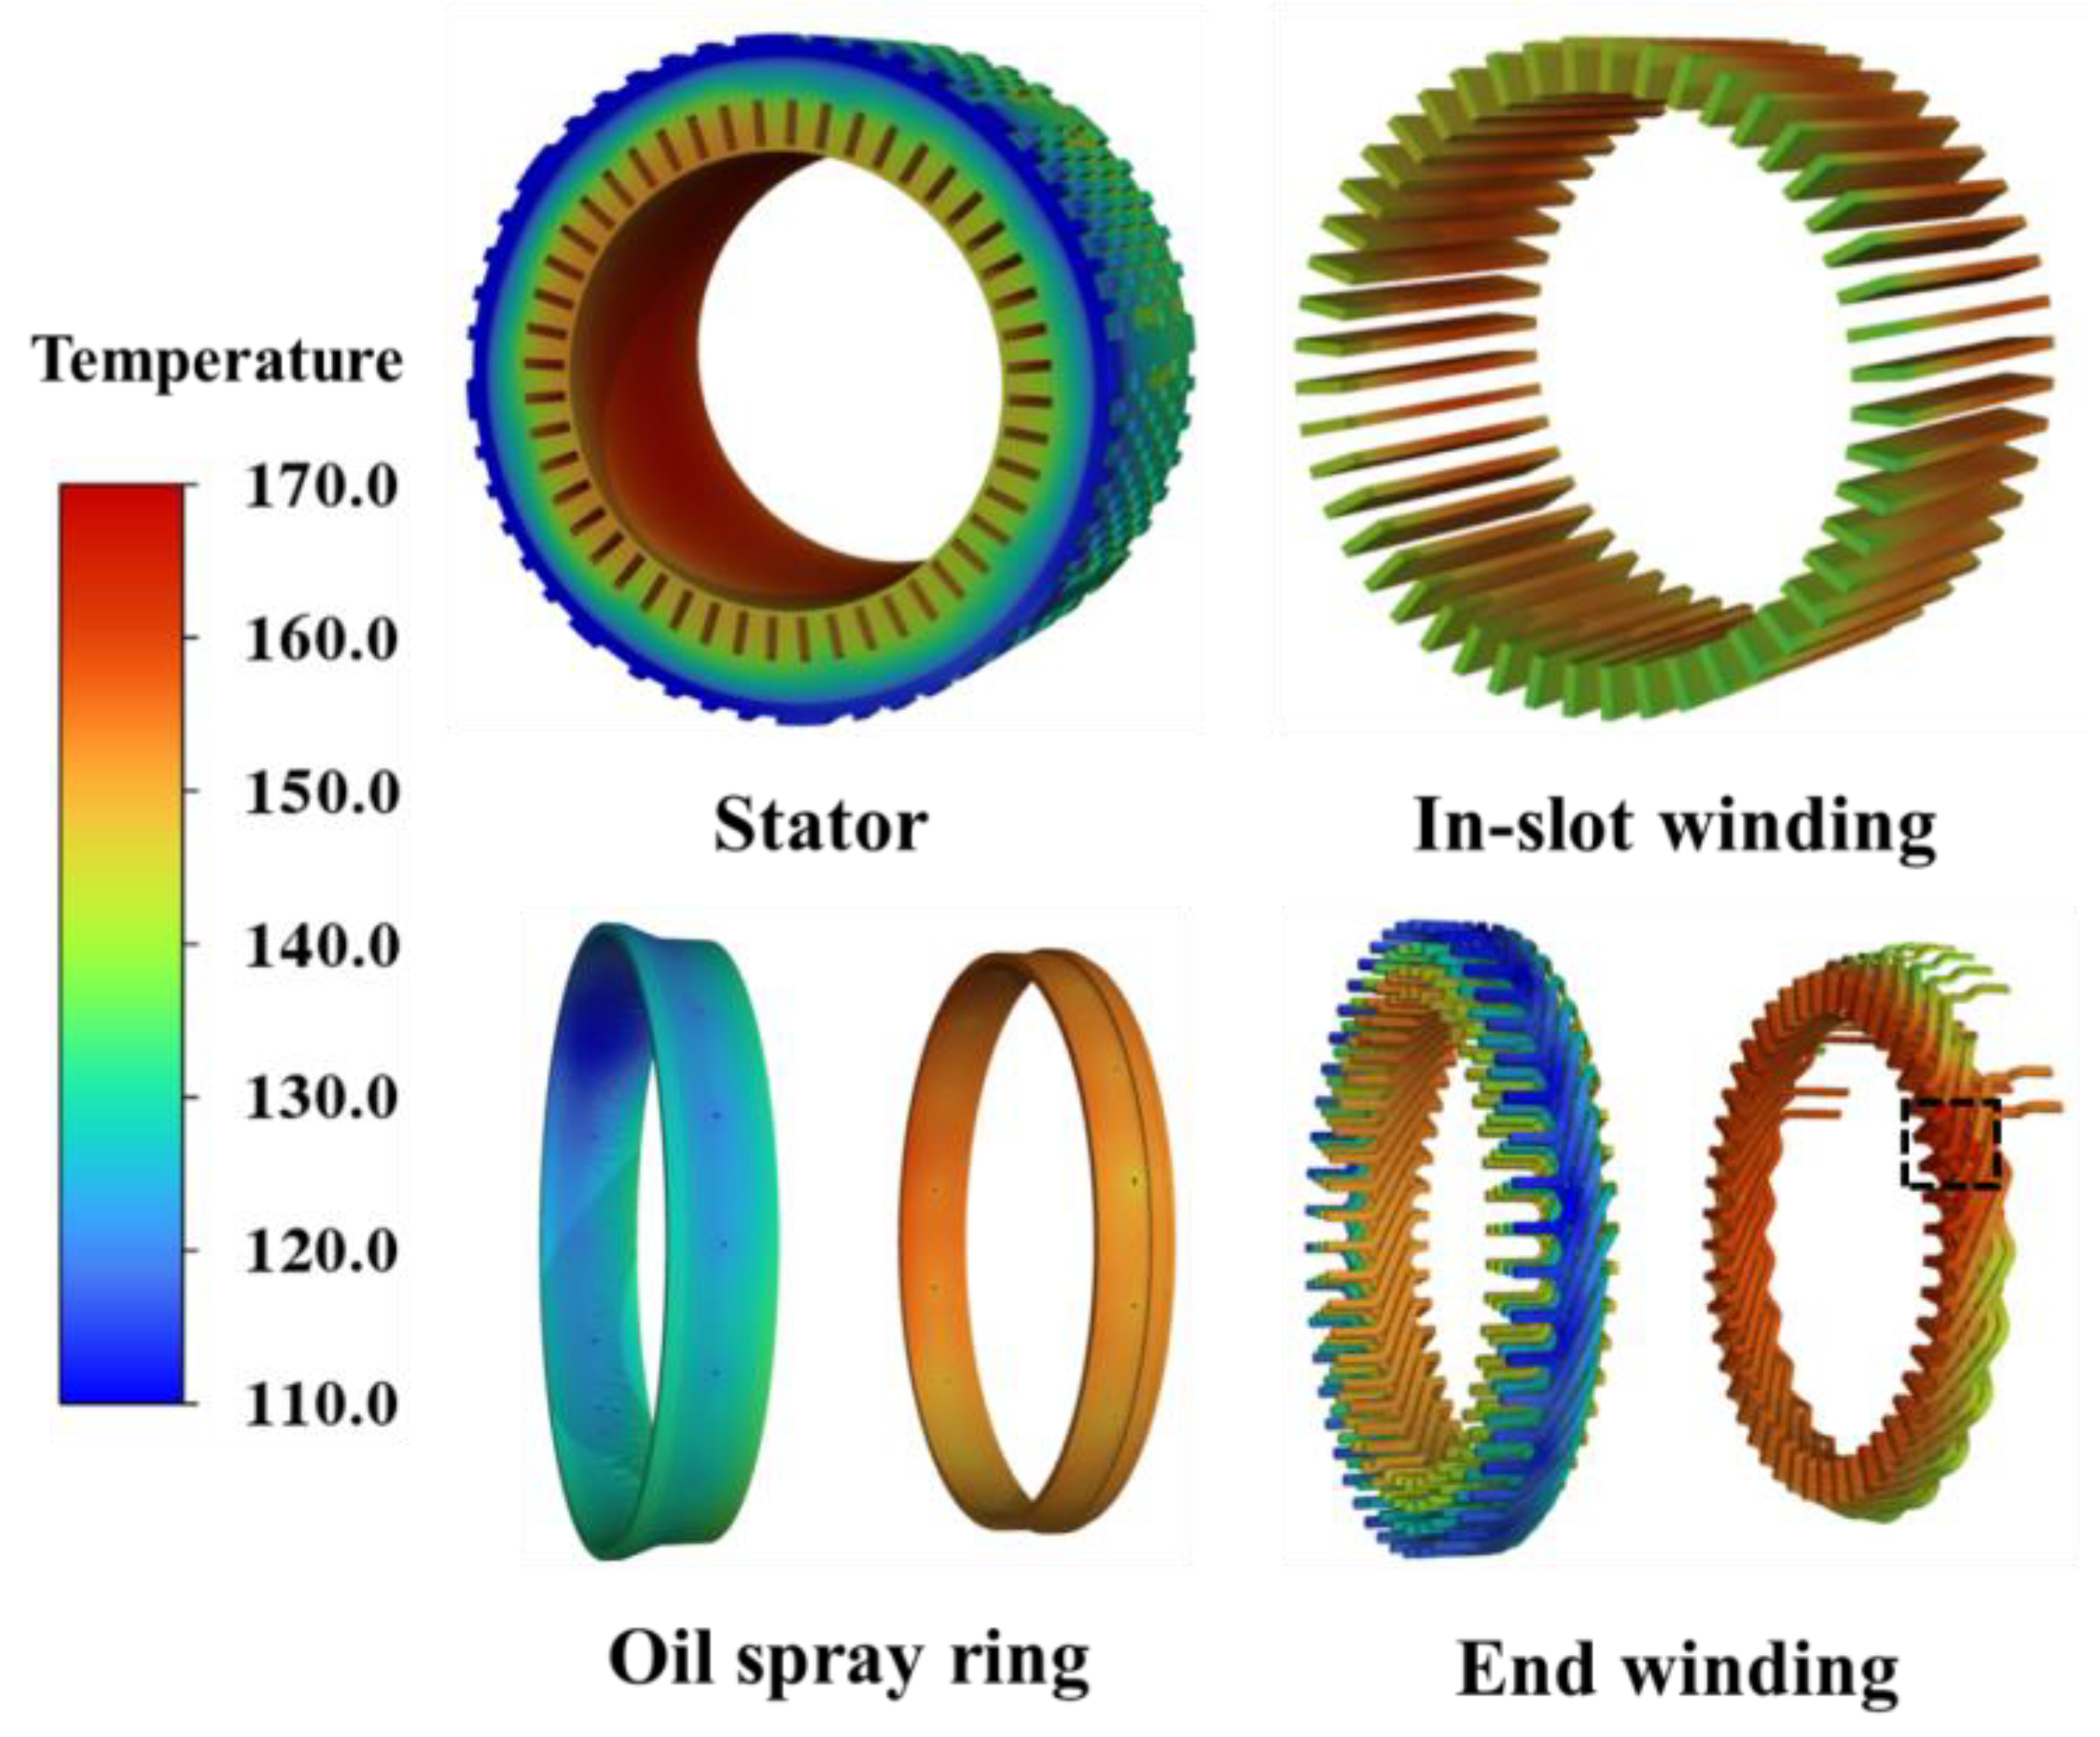
Figure 8 visualizes the temperature field of key components, highlighting high-temperature regions consistent with experimental observations. This confirms that the proposed high-fidelity model captures both thermal conduction paths and spatial flow behavior with high physical realism. In summary, the proposed high-fidelity thermal modeling approach demonstrates satisfactory accuracy and applicability in predicting the thermal behavior of oil-cooled electric machines, providing a reliable foundation for subsequent spray structure optimization and engineering design.

3. Results and Discussion

3.1. Effect of Nozzle Diameter on Winding Thermal Performance

To improve computational efficiency in the parametric study while maintaining overall thermal accuracy, a simplified model was developed based on the previously validated high-fidelity simulation framework. In this simplified model, the complex three-dimensional end-winding geometry was replaced with an equivalent annular region characterized by a calibrated radial thermal conductivity. This substitution preserves the primary conductive heat transfer characteristics while significantly reducing geometric complexity and computational cost. Although the simplified model cannot capture the detailed flow features of the cooling oil near the windings, it offers a more streamlined setup suitable for systematically analyzing the influence of spray nozzle design parameters on thermal behavior. Specifically, both the original and simplified models were subjected to identical thermal boundary conditions and uniform volumetric heat generation.
The calibration involved iteratively adjusting λr until the radial temperature difference (ΔT) between the two models was minimized. The process was considered complete when the maximum deviation in radial temperature profiles was less than 1 °C. The overall calibration procedure is illustrated in Figure 9, which outlines the key steps in achieving thermal equivalence through conductivity adjustment.
To investigate the effect of nozzle diameter on the cooling performance of the end-winding region, three representative diameters—2 mm, 3 mm, and 4 mm—were selected for comparative analysis, with all other structural parameters held constant. These values were chosen based on practical engineering constraints: a smaller diameter may lead to excessive pressure drop, whereas a larger diameter can result in premature oil leakage or uneven spray distribution, both of which would deteriorate cooling effectiveness.
The influence of nozzle diameter on the end-winding temperature distribution is illustrated in Figure 10. The enlarged nozzle diameter reduces jet velocity under constant flow conditions, leading to weaker local impingement and thus lower convective heat transfer coefficients. As the orifice diameter increases from 2 mm to 4 mm, a distinct change in the thermal field is observed. At D = 2 mm, the high-velocity jet enhances convective heat transfer, resulting in lower winding surface temperatures and a more pronounced thermal gradient. In contrast, for larger diameters (e.g., D = 4 mm), despite unchanged flow rate, the increased orifice size reduces velocity, the reduced jet velocity leads to weaker impingement cooling, causing elevated peak temperatures and a more uniform yet higher-temperature distribution.
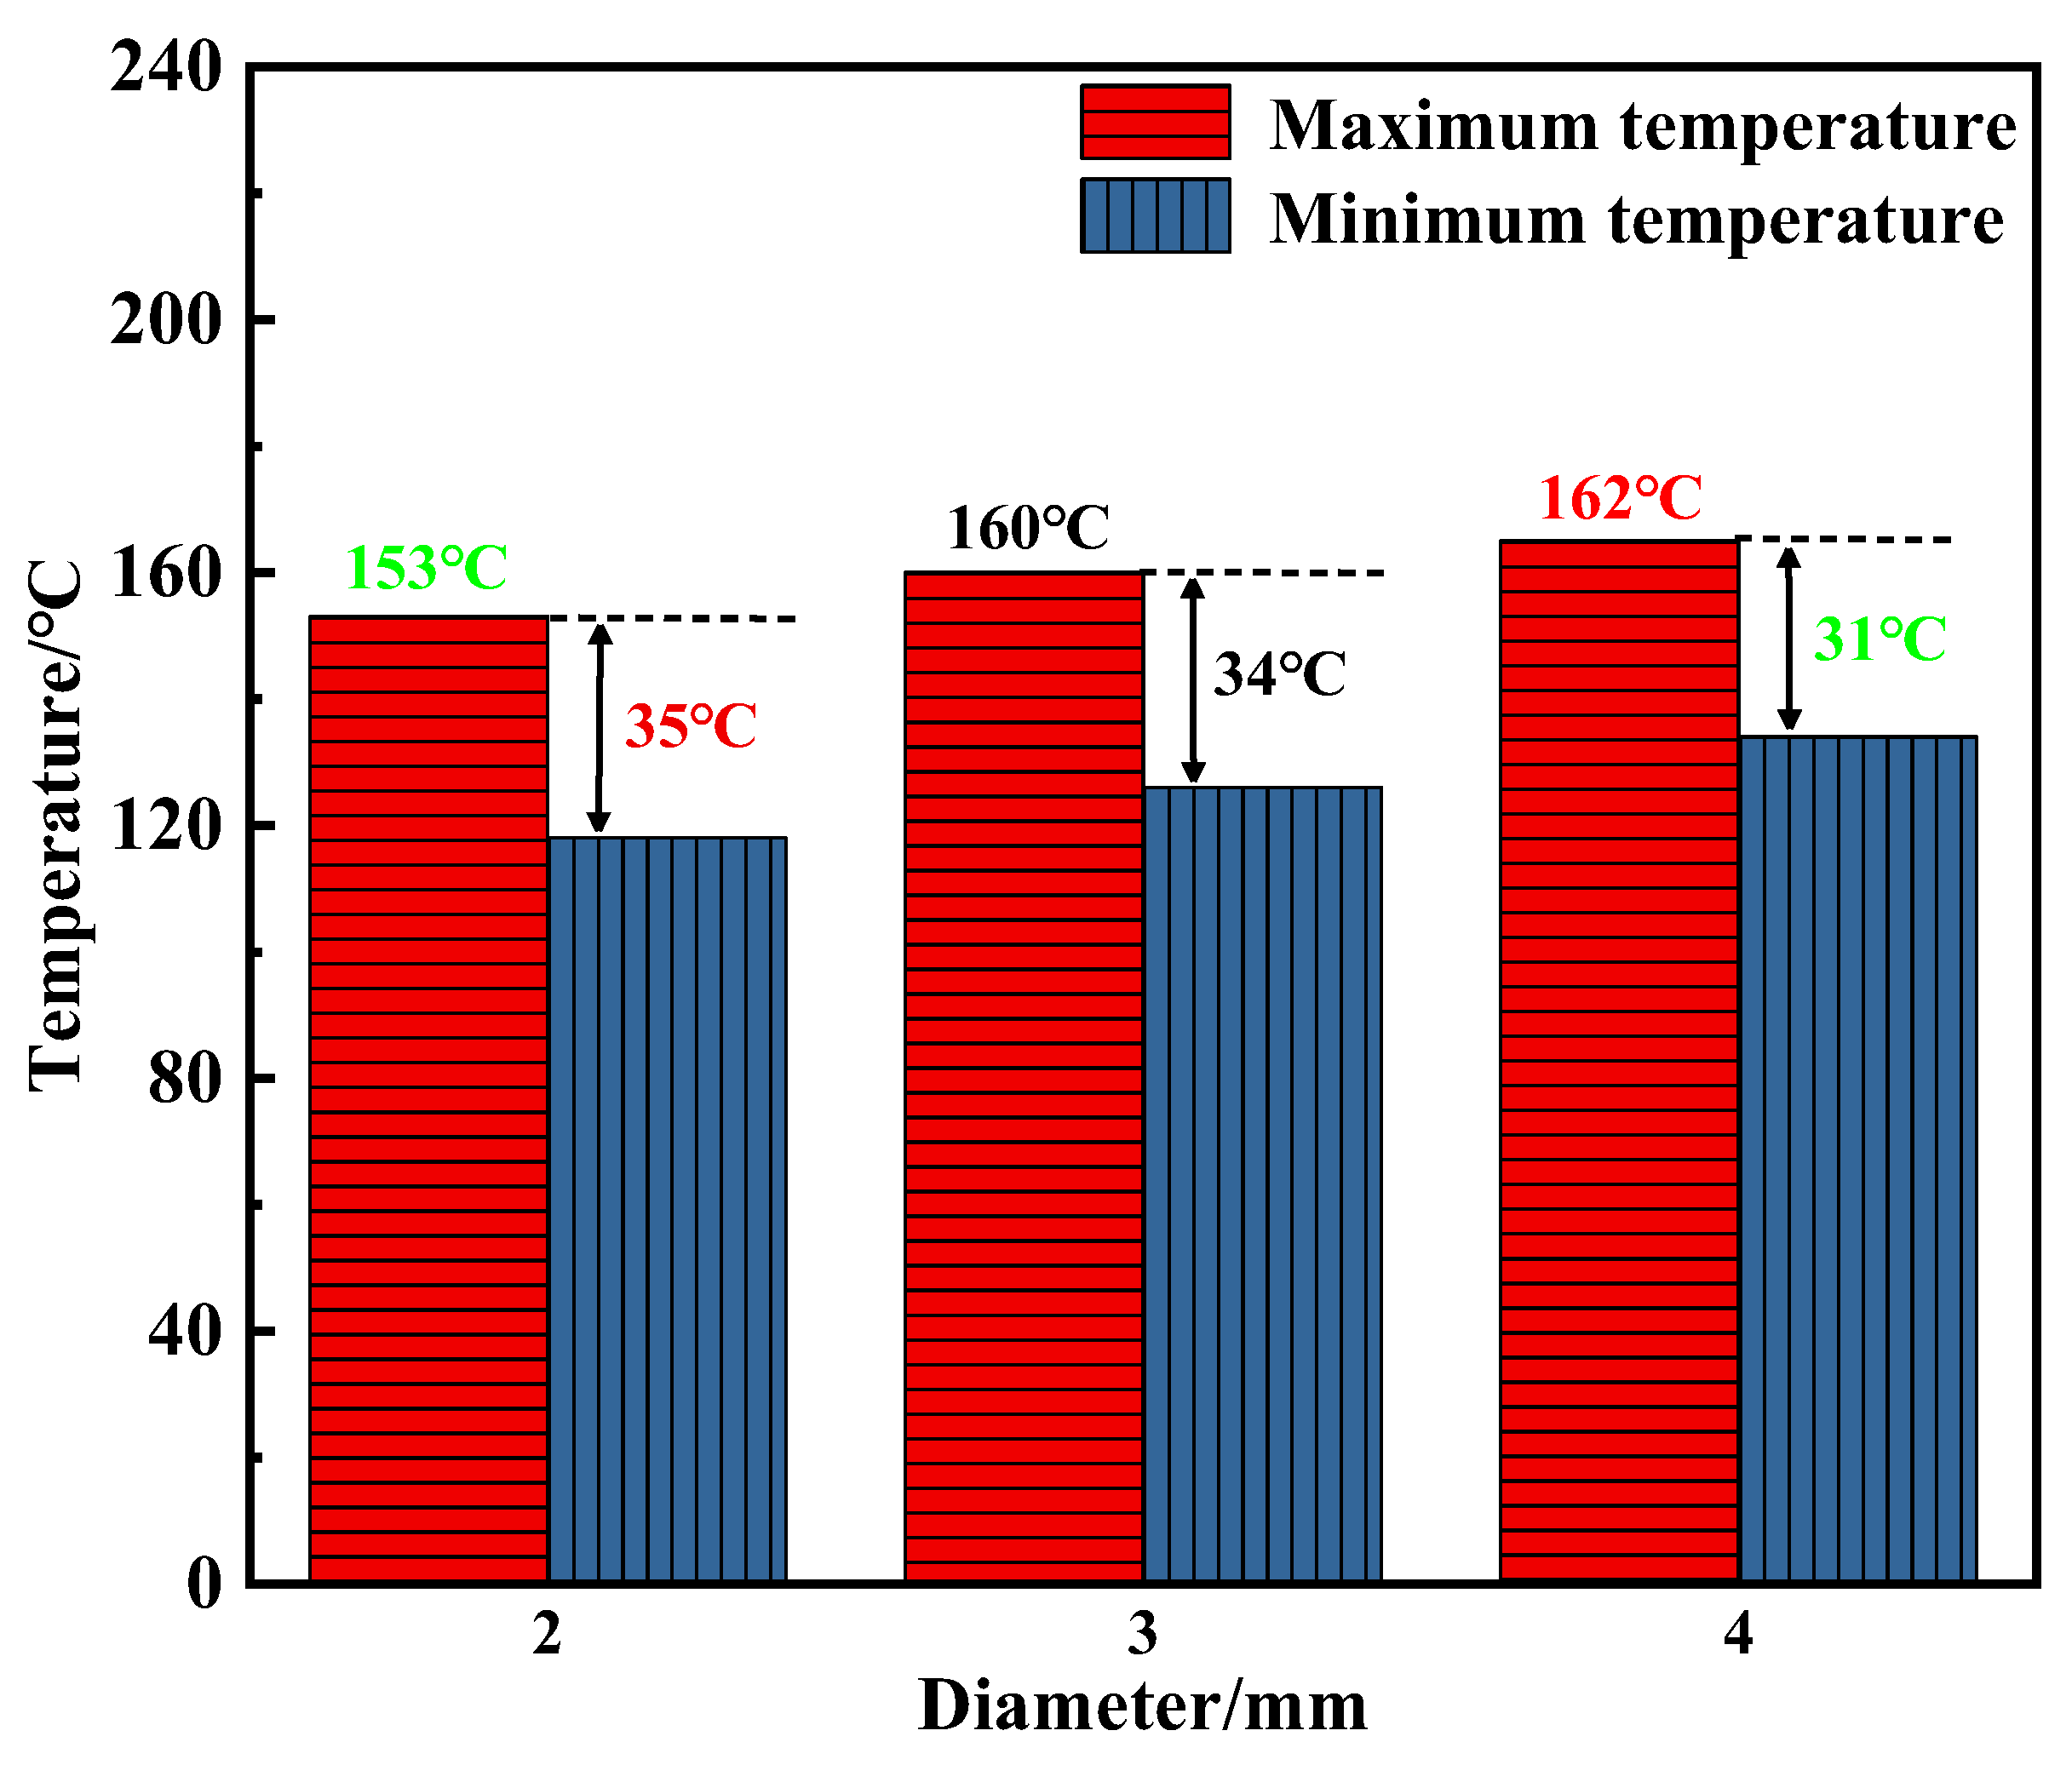
The temperature variation in the winding region as a function of nozzle diameter is quantitatively illustrated in Figure 11. As the orifice diameter increases from 2 mm to 4 mm, the maximum winding temperature rises from 153 °C to 162 °C, while the minimum temperature increases from 118 °C to 134 °C. This trend confirms that larger nozzles result in higher overall winding temperatures due to reduced jet velocity and weakened impingement cooling. Notably, ΔT across the winding region gradually decreases with increasing nozzle diameter: 35 °C at 2 mm, 34 °C at 3 mm, and 31 °C at 4 mm. This implies a more uniform temperature distribution at larger diameters, albeit at the cost of elevated peak temperatures. The reduction in thermal gradient suggests improved oil coverage but diminished local heat extraction.
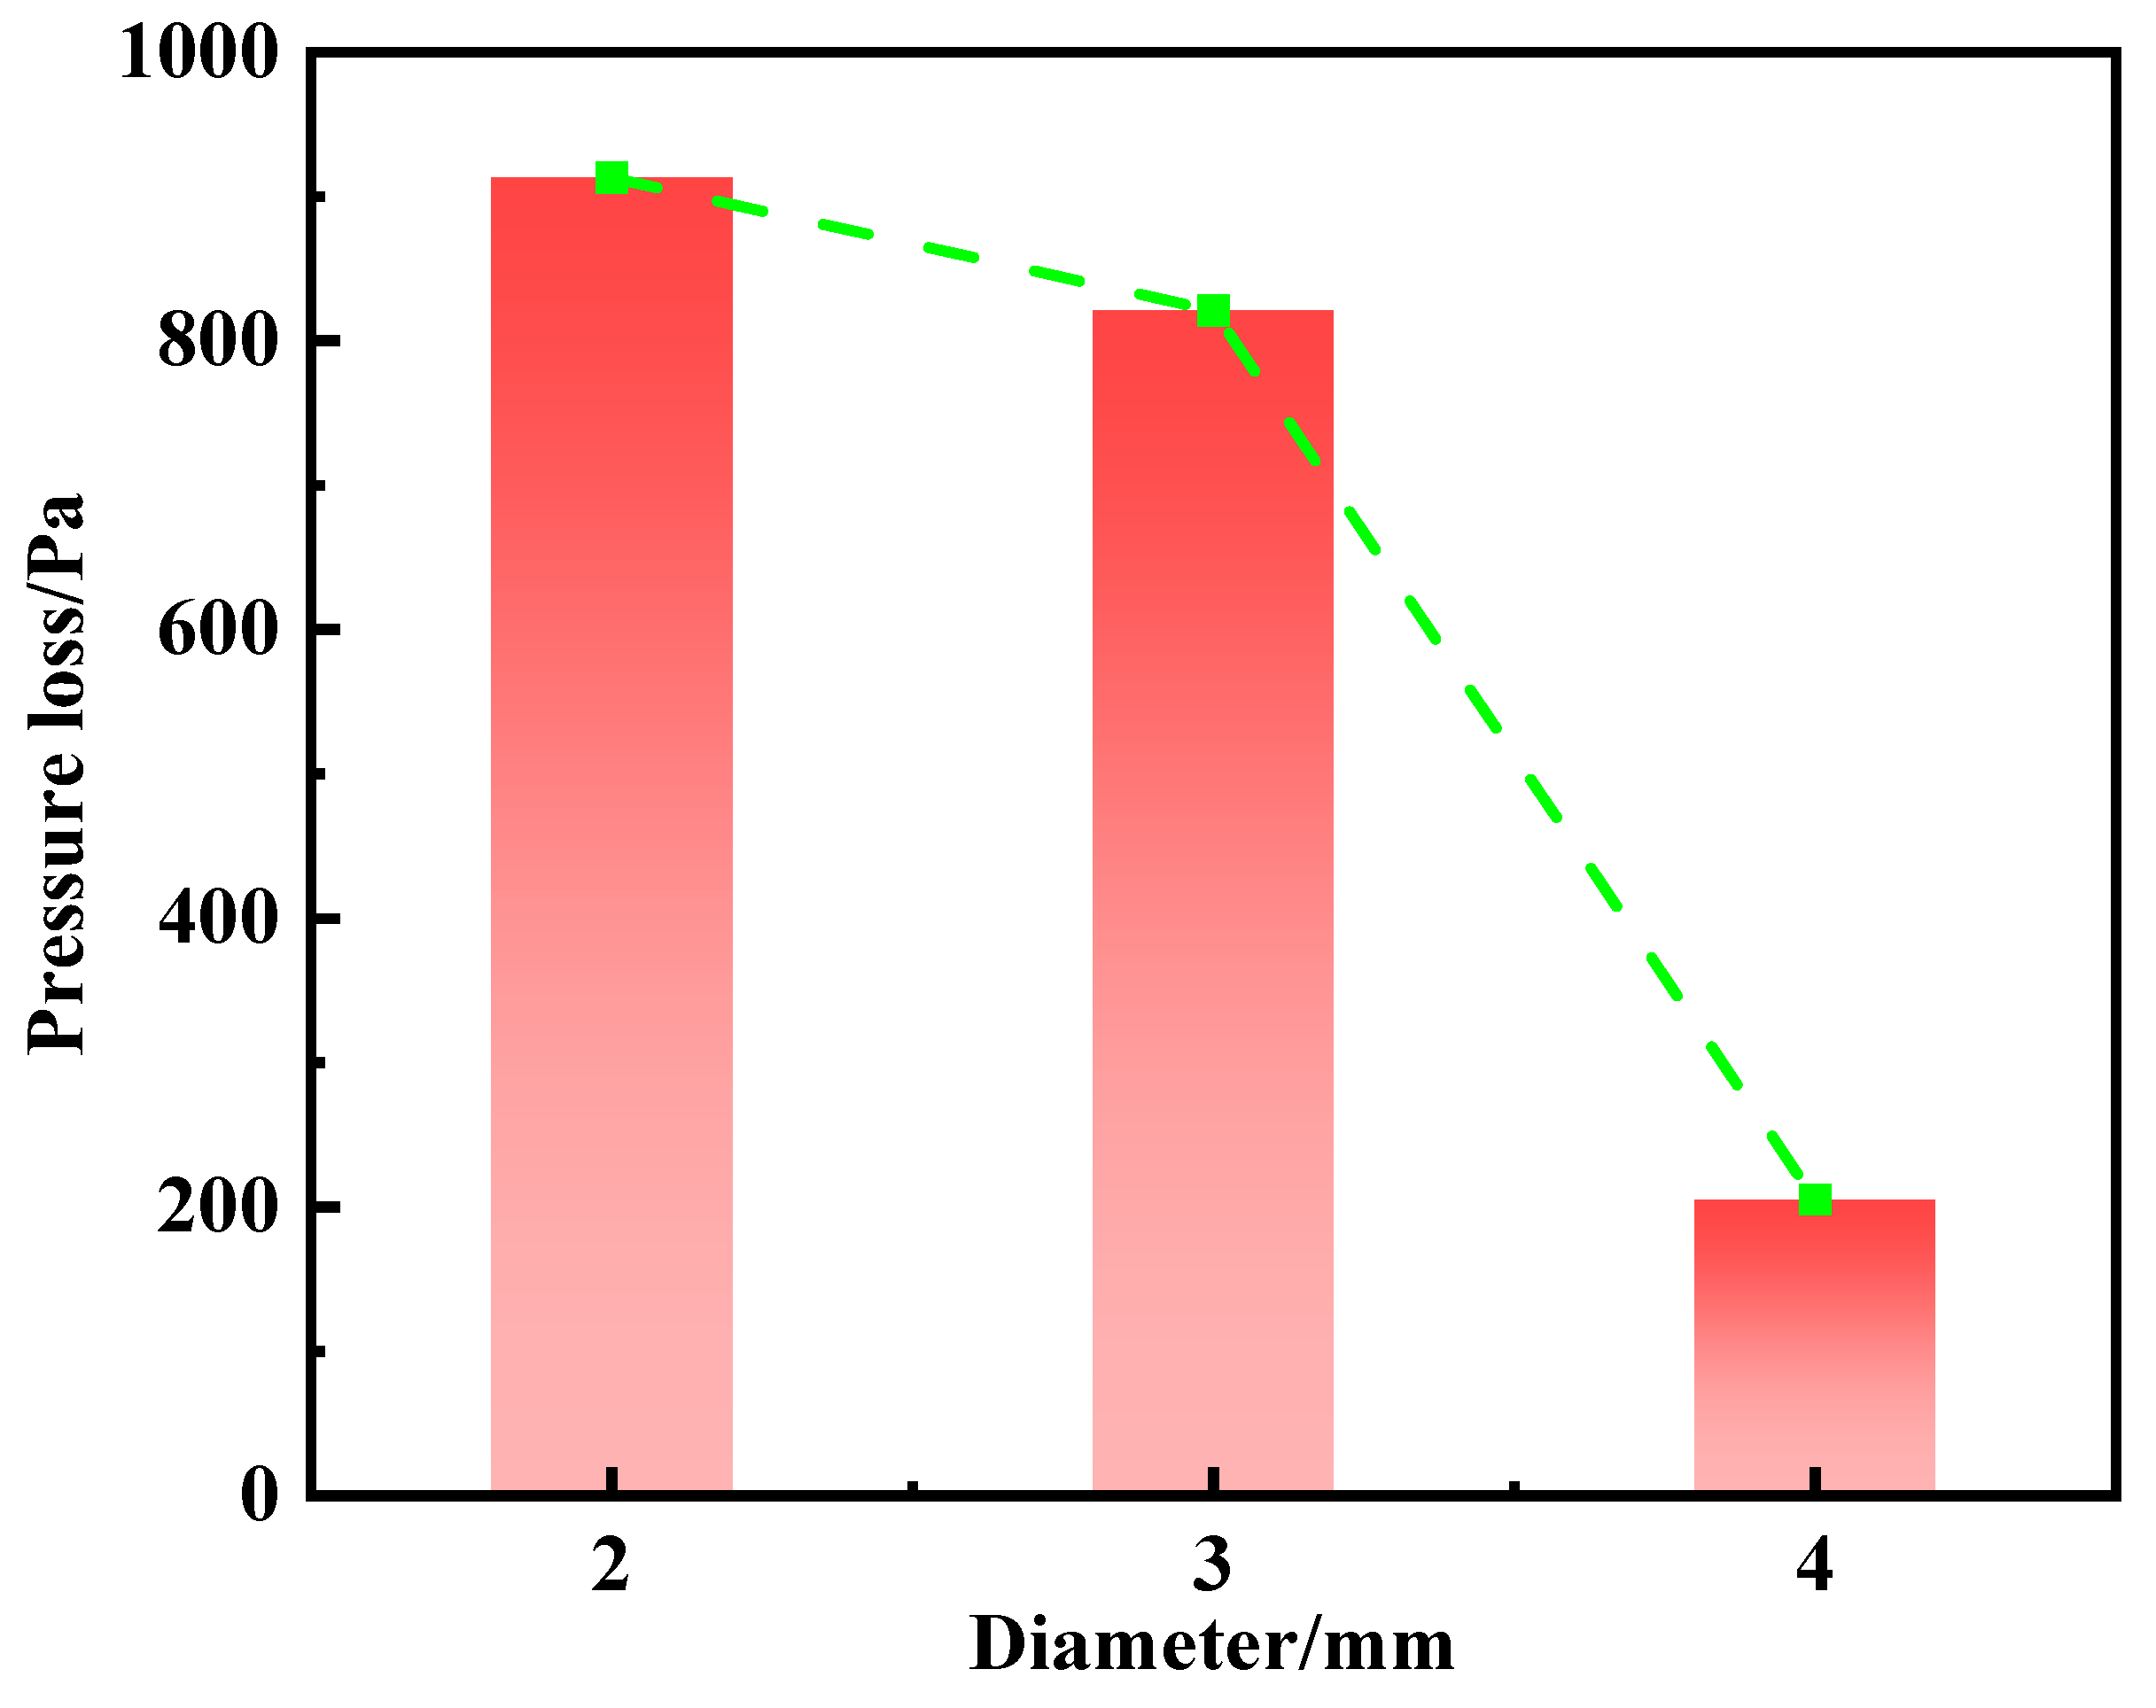
As illustrated in Figure 12, the pressure drop corresponding to different spray hole diameters shows a clear decreasing trend. As the diameter increases from D = 2 mm to D = 4 mm, the pressure drop decreases significantly from 913 Pa to 205 Pa. This trend can be attributed to the reduced flow resistance in larger orifices, which allows the cooling oil to pass through more easily, thereby lowering the system pressure loss. Specifically, a smaller nozzle enhances local cooling effectiveness but may induce pressure losses, while a larger diameter improves coverage but diminishes localized heat extraction efficiency. The selection of nozzle diameter should thus balance thermal performance and system-level pressure drop.

3.2. Effect of Spray Hole Number on Winding Thermal Performance

The number of spray holes is a critical design parameter in spray ring systems, as it directly influences the spatial distribution of cooling oil and the overall heat exchange efficiency. A well-designed number of holes ensures more uniform oil film coverage, effectively suppresses local hotspots, and enhances the overall cooling performance of the motor. In this section, numerical simulations are conducted to analyze how variations in spray hole quantity affect the temperature and flow fields in the end-winding region. The cooling effectiveness on key components such as the stator and total winding is quantitatively evaluated. To isolate the effect of hole number, all other geometric and operating parameters are held constant. Three configurations with 8, 12, and 14 spray holes are compared, with a fixed orifice diameter of 4 mm. The total coolant flow rate is set to 2 L/min, and the inlet oil temperature is maintained at 80 °C.
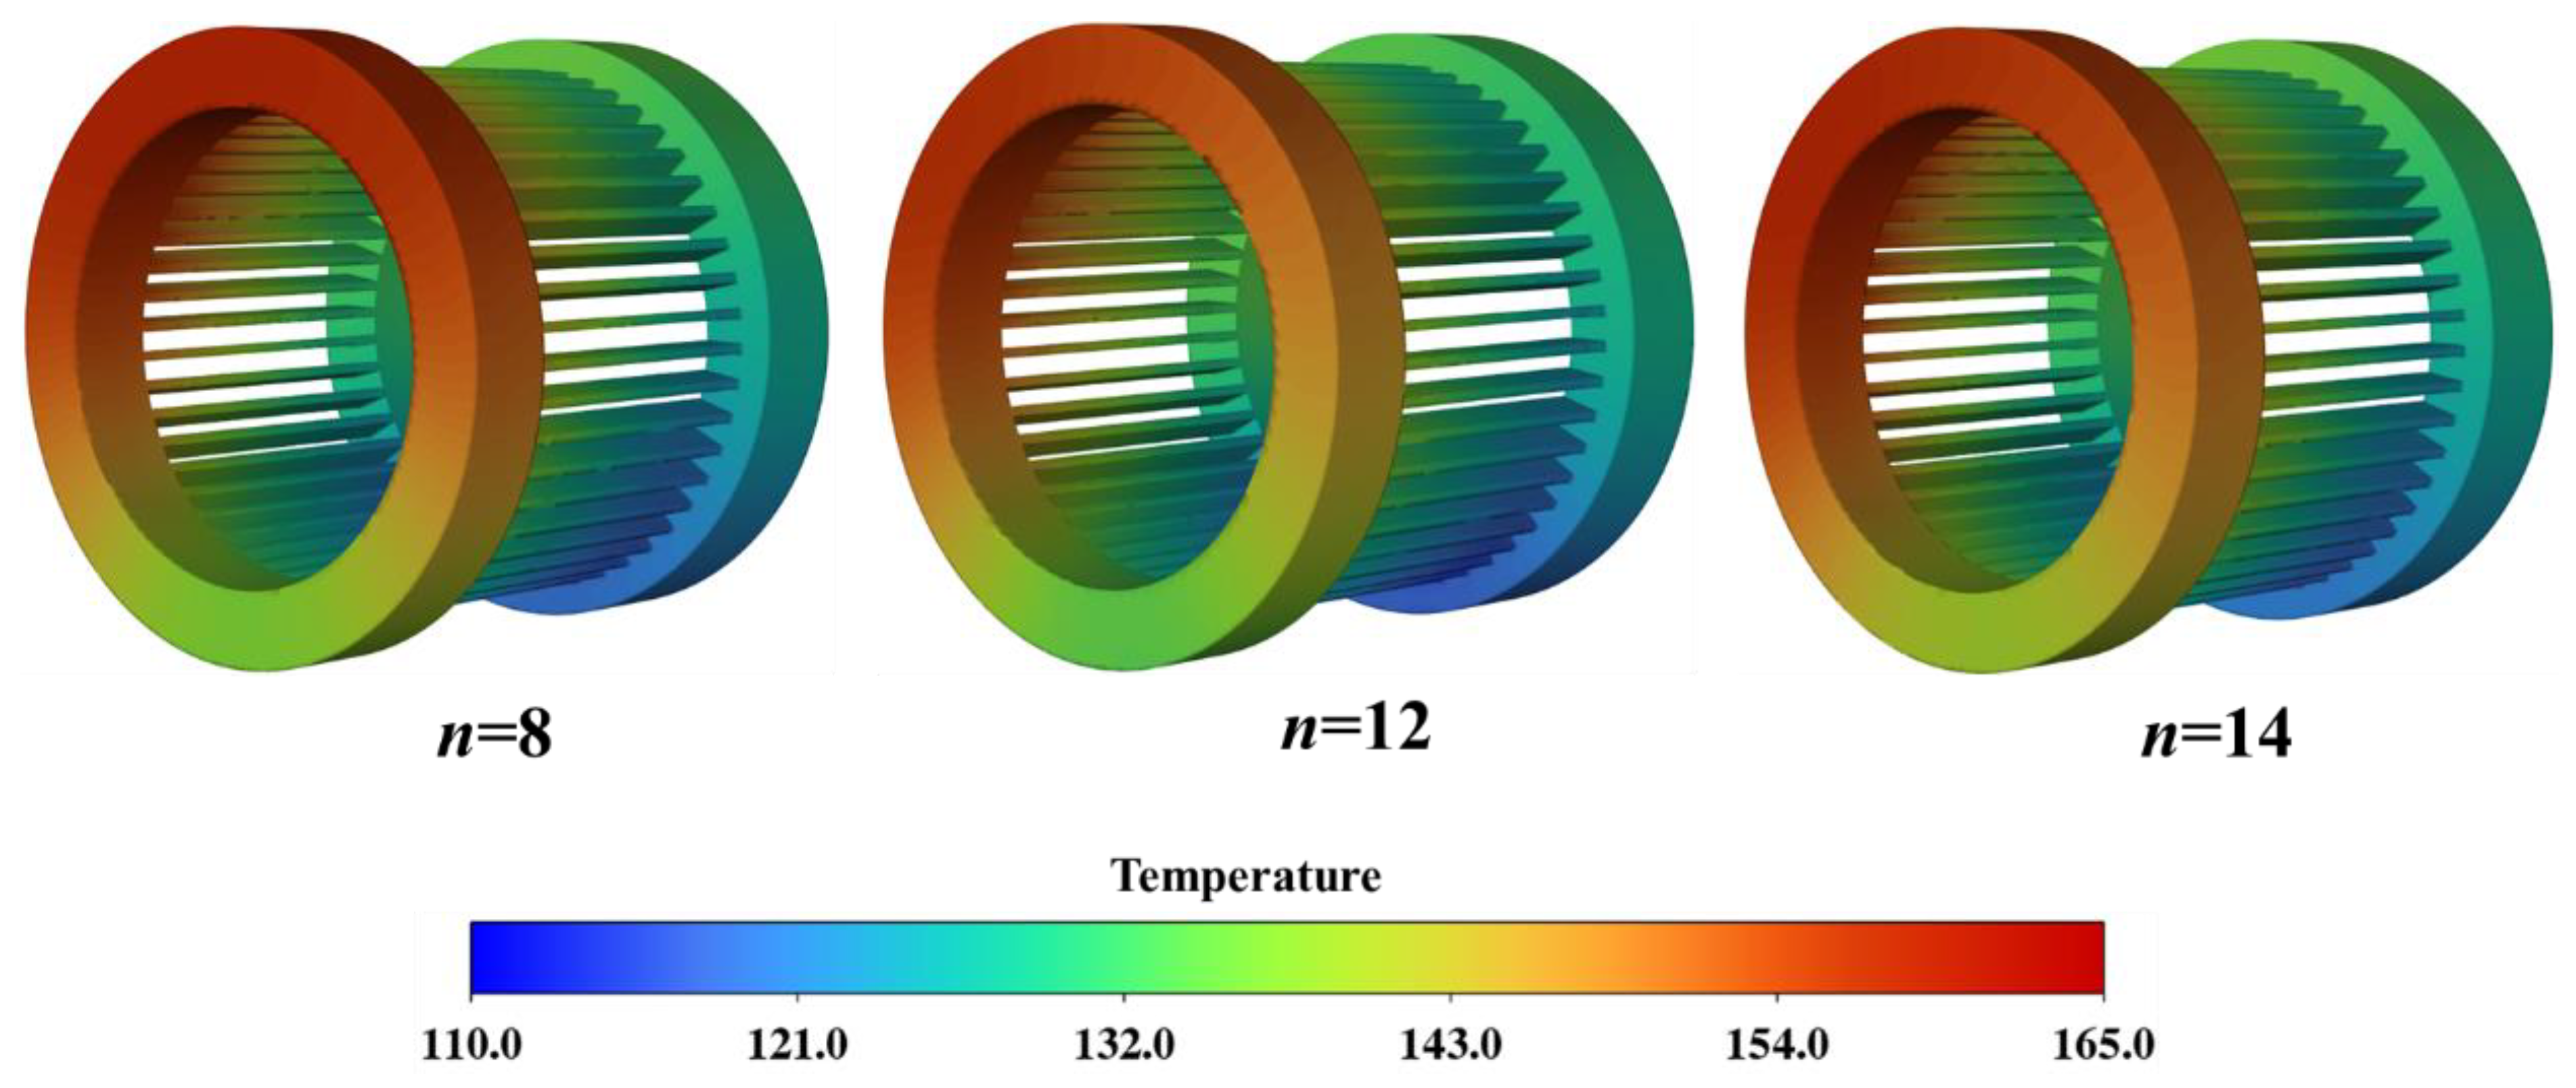
Figure 13 shows that as the number of spray holes increases from n = 8 to n = 12, the temperature gradient decreases and the high-temperature region becomes smaller. However, when n = 14, the overall temperature rises slightly, and the high-temperature area expands. This is because increasing n improves oil distribution and enhances temperature uniformity. But beyond a certain point, further division of the total flow reduces the jet velocity and impingement intensity per hole, weakening local convective heat transfer.
Figure 14 presents the variation in winding temperatures with different numbers of spray nozzles. As the nozzle count increases from 8 to 14, the peak temperature initially decreases from 162 °C (8 nozzles) to 155 °C (12 nozzles), but then slightly rises to 158 °C at 14 nozzles. Excessive subdivision of flow among too many nozzles results in insufficient velocity per jet, thereby compromising impingement strength. In contrast, the minimum temperature remains relatively stable at approximately 120 °C across all cases. Notably, the temperature difference (ΔT) across the winding region narrows with increasing nozzle number—from 42 °C at n = 8 to 34 °C at n = 12, and further to 32 °C at n = 14. This indicates improved thermal uniformity as more spray jets contribute to broader oil coverage, though the localized cooling intensity may be reduced.
Therefore, an optimal nozzle count requires balancing peak temperature suppression and thermal uniformity. While 12 nozzles yield the lowest maximum temperature, further increasing to 14 enhances uniformity but may compromise local cooling strength, leading to a modest rebound in hotspot temperatures.

3.3. Effect of Cooling Oil Parameters on Winding Thermal Performance

The inlet temperature and flow rate of the cooling oil are critical control parameters in the thermal management of oil-cooled PMSMs. These factors significantly influence the flow characteristics of the coolant, heat transfer capacity, and the resulting temperature distribution within the motor. To investigate their effects, a series of comparative simulations was conducted under fixed geometric and boundary conditions. The aim was to systematically evaluate how variations in oil temperature and flow rate affect the heat dissipation performance of the end-winding regions.

3.3.1. Influence of Inlet Oil Temperature

Five groups of working conditions with different inlet temperatures (40 °C, 50 °C, 60 °C, 70 °C, 80 °C) were set for comparative analysis. The flow rate of the cooling oil was uniformly 2 L/min, the diameter of the oil injection hole was 2 mm, and the number of oil injection holes was 8.
Figure 15 illustrates the influence of inlet oil temperature on the temperature distribution at the end-winding region. A clear trend is observed: as the inlet temperature increases, the overall temperature of the end-winding rises accordingly. This is attributed to the reduced temperature gradient between the coolant and the winding surface at higher inlet temperatures, which weakens the driving force for heat transfer and reduces the cooling effectiveness. In contrast, lower inlet temperatures enhance the thermal gradient and promote more efficient heat removal from the winding.
Figure 16 illustrates the variations in the maximum temperature and temperature difference of the end-windings under different inlet oil temperatures. It is quite evident that as the inlet oil temperature increases, the maximum temperature of the windings rises gradually, from 139.1 °C to 162.4 °C. However, the temperature difference narrows gradually, decreasing from 27.2 °C to 17.8 °C. From a practical application perspective, if the equipment aims to suppress the maximum temperature of the windings, it is necessary to strictly control the inlet oil temperature at a relatively low level. If more attention is paid to the uniformity of the temperature field, the inlet oil temperature can be increased within a certain range, but one should be vigilant about the maximum temperature exceeding the limit.

3.3.2. Influence of Inlet Oil Flow Rate

Five flow rate conditions (2, 3, 4, 5, 6 L/min) were set, with other parameters kept consistent for comparative analysis.
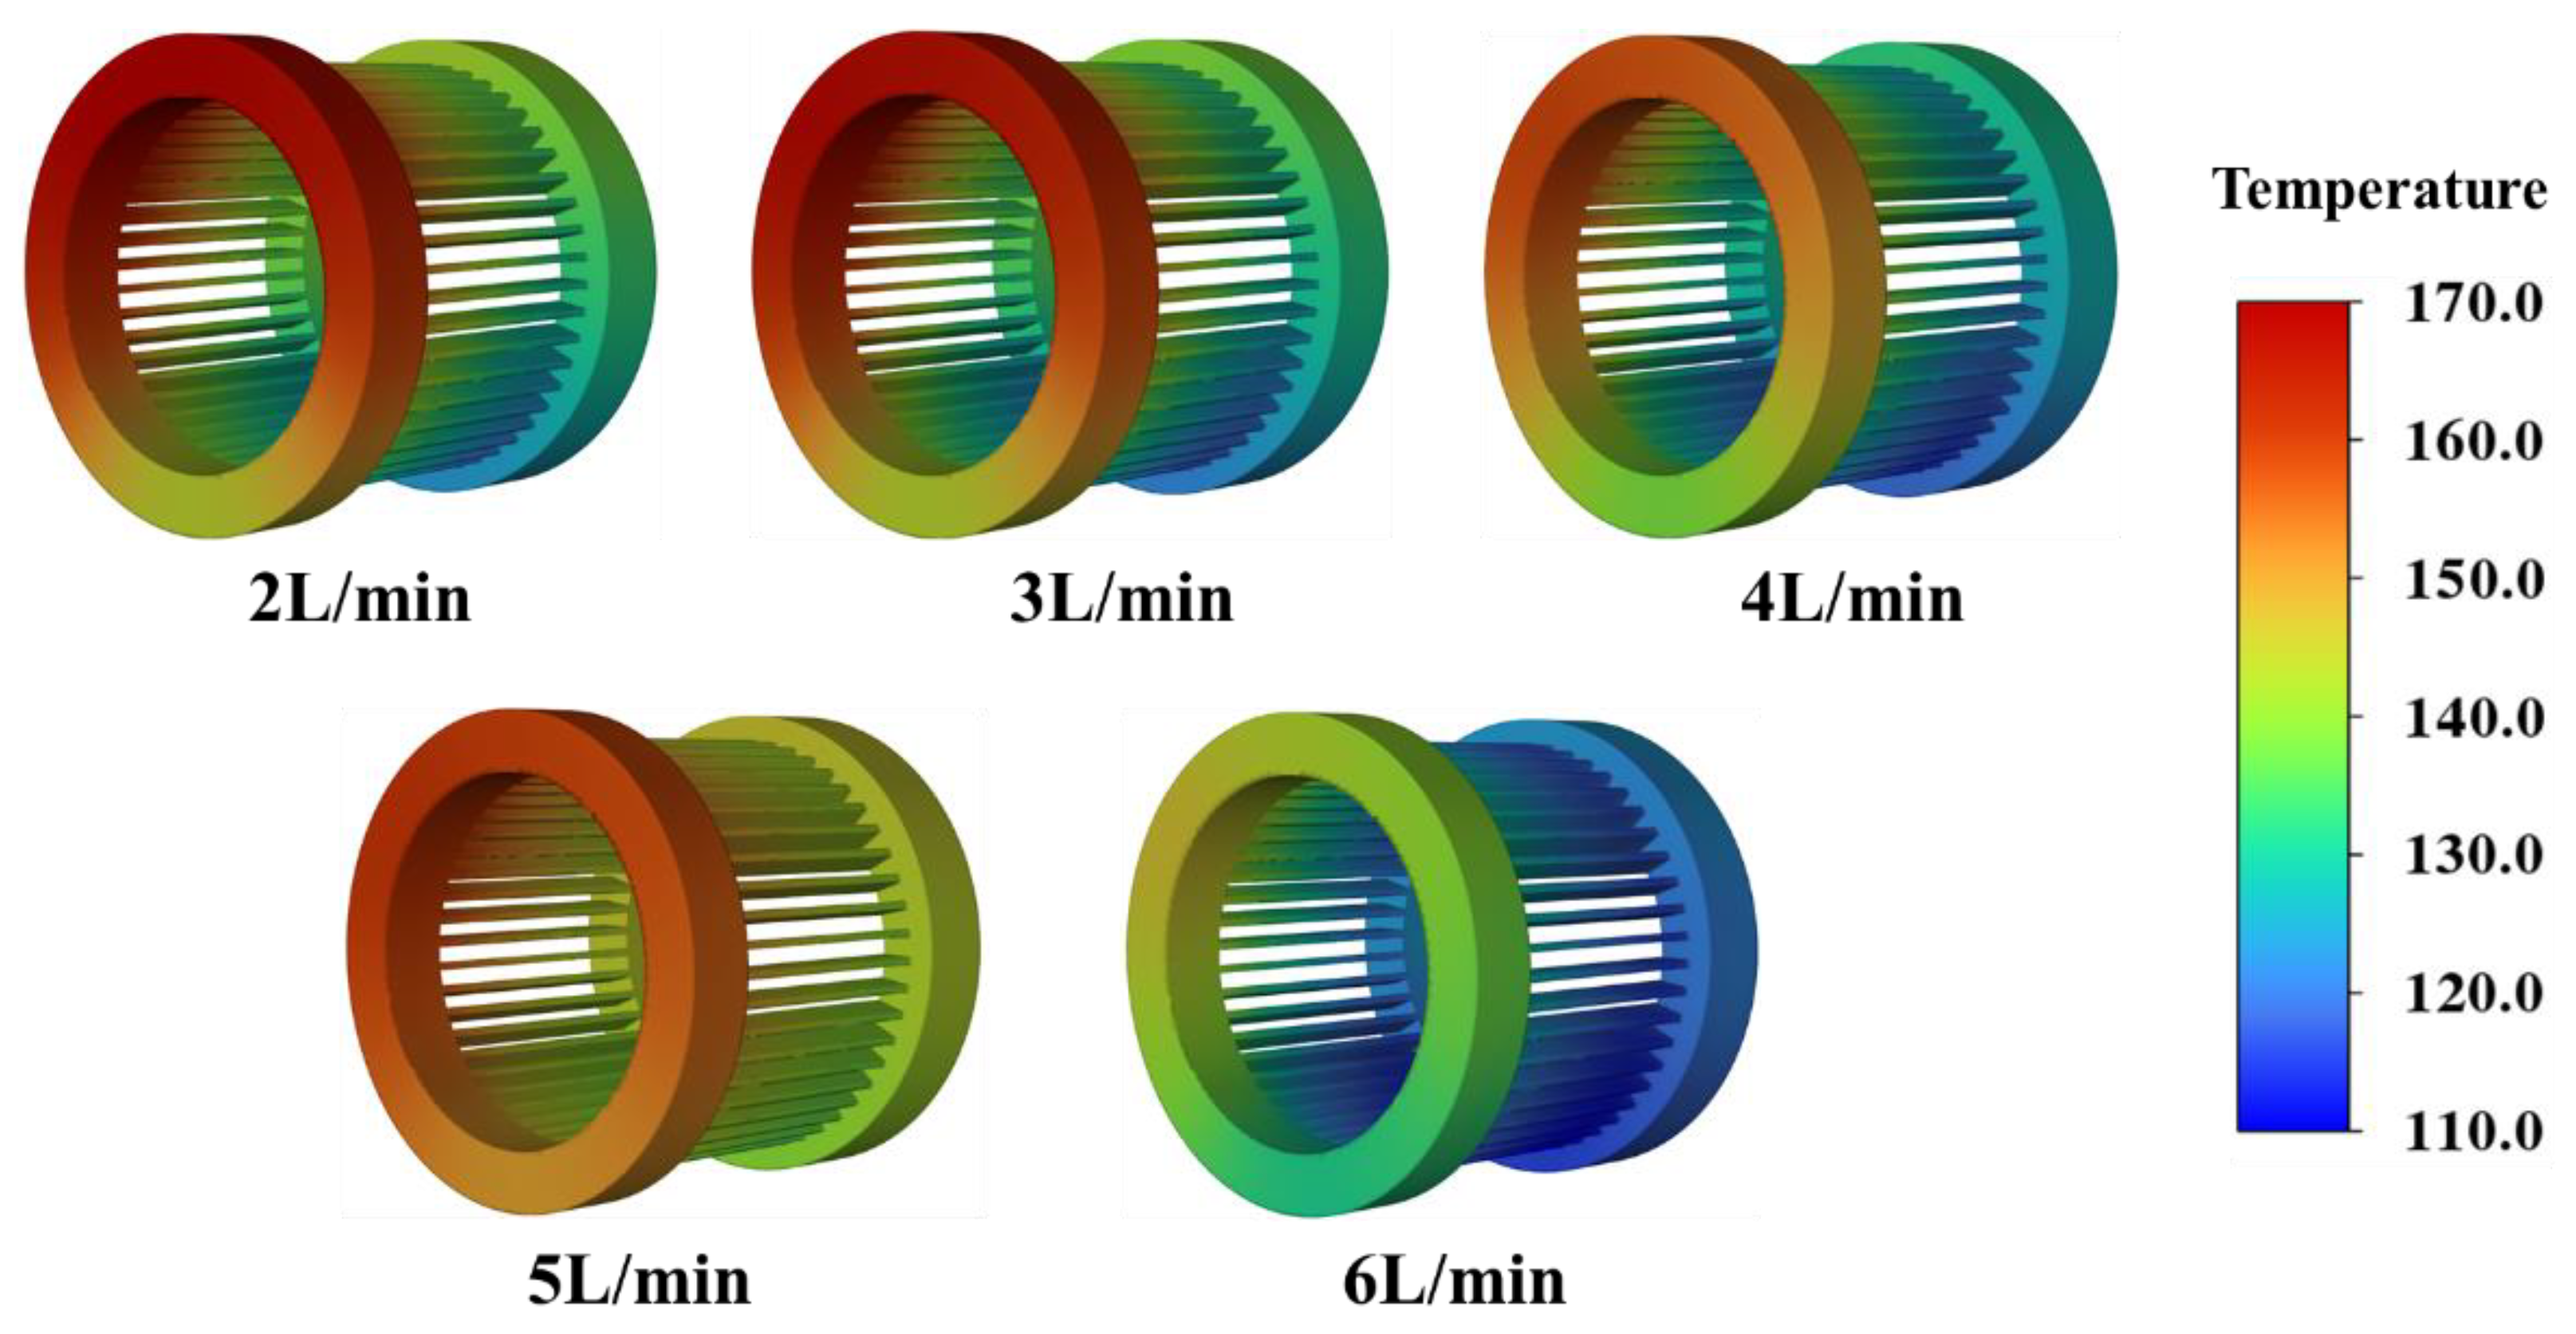
Figure 17 shows the temperature distribution of the end-winding region under different inlet oil flow rates. As the flow rate increases from 2 L/min to 6 L/min, the overall winding temperature exhibits a decreasing trend. At a low flow rate of 2 L/min, a relatively large high-temperature zone is observed in the end-winding region. This occurs because a higher oil flow rate enhances convective heat transfer, allowing more heat to be carried away from the winding surface, thereby lowering its temperature.
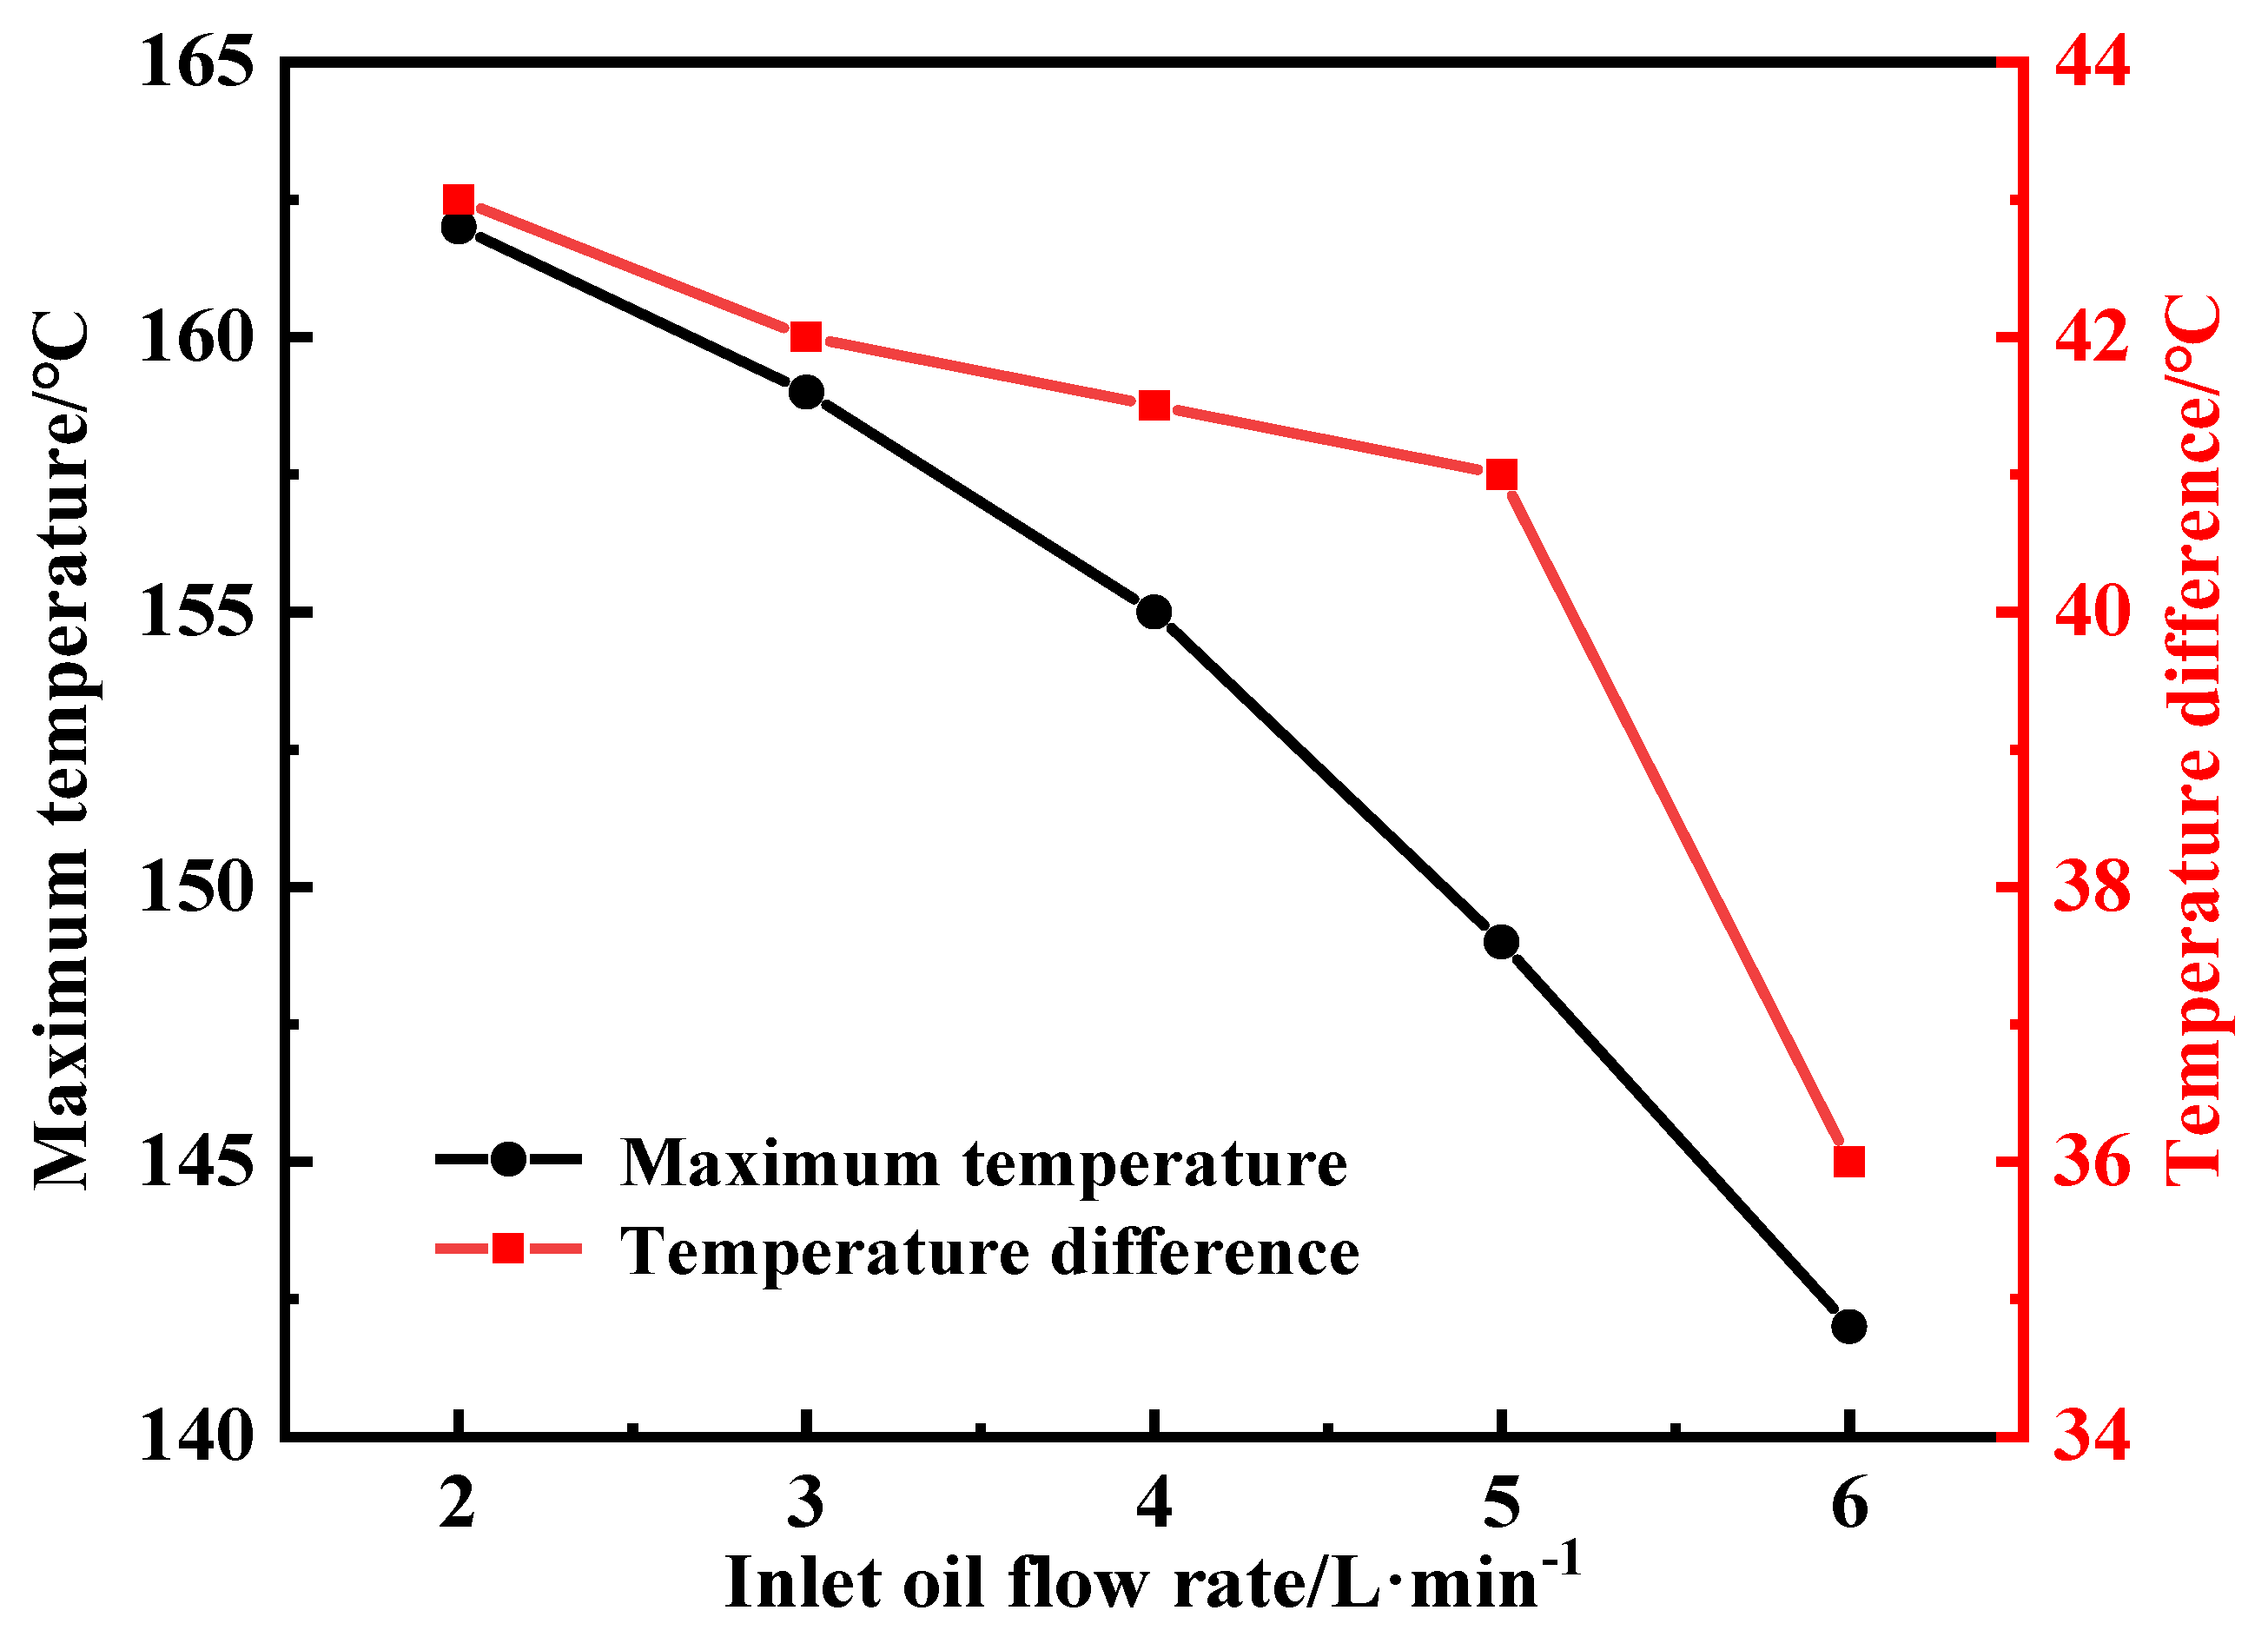
Figure 18 presents the variation in winding region temperature as a function of inlet oil flow rate. As the flow rate increases from 2 L/min to 6 L/min, the peak winding temperature decreases significantly—from approximately 162.4 °C to around 142.2 °C—indicating that greater oil flow enhances convective heat transfer and improves overall cooling performance.
Notably, the temperature difference across the winding region gradually narrows with increasing flow rate. At 2 L/min, ΔT reaches 43 °C; it remains around 42 °C at 3–4 L/min, and then continuously decreases to 36 °C at 6 L/min. This trend suggests that higher flow rates lead to a more uniform temperature distribution, as the cooling oil covers a larger surface area. However, the reduction in ΔT also implies a weakening of localized high-heat dissipation, which may affect the thermal gradient needed for efficient spot cooling. Moreover, the flow rate increment must be balanced against system energy consumption and cost constraints.

3.4. Improved Design of Spray Ring Structures

To further reduce the peak temperatures of critical components and improve temperature uniformity, this section explores an enhanced spray ring layout based on the findings from Section 3.1, Section 3.2, Section 3.3. Specifically, a non-uniform orifice arrangement is introduced to address the asymmetric heat loads between the welding-side and terminal-side windings. The coupled thermal–fluid simulations are conducted to assess the cooling performance under different nozzle configurations.
As illustrated in Figure 19, the cooling oil enters the system through a single inlet. Part of the oil first passes through the welding-side spray ring and directly cools the welding-side end windings before exiting through Outlet 1. The remaining oil flows along specially designed surface channels on the stator, reaches the terminal-side spray ring, and cools the terminal-side windings before leaving through Outlet 2. This staged distribution indicates that differentiating the spray ring designs at both ends may contribute to more balanced temperature control. To evaluate this concept, two modified designs (Case 2 and Case 3) are proposed and compared with the baseline uniform configuration (Case 1). The design parameters are listed in Table 5. All cases use eight spray holes per ring, with an oil inlet temperature of 80 °C and a total flow rate of 2 L/min.
Although the 12-nozzle configuration demonstrated the best thermal performance in earlier simulations, it was not selected as the baseline for the subsequent parametric study due to practical engineering considerations. Specifically, implementing 12 uniformly distributed spray nozzles requires high machining precision, complex oil supply manifold design, and increased cost, which may limit its industrial applicability. In contrast, the 8-nozzle configuration provides a more balanced solution between cooling effectiveness and manufacturing feasibility. This configuration also matches the actual prototype design used in our validation tests, making it a suitable and realistic baseline for further analysis. The key structural parameters, including the oil injection hole diameters at the welding and outlet ends, are summarized in Table 6.
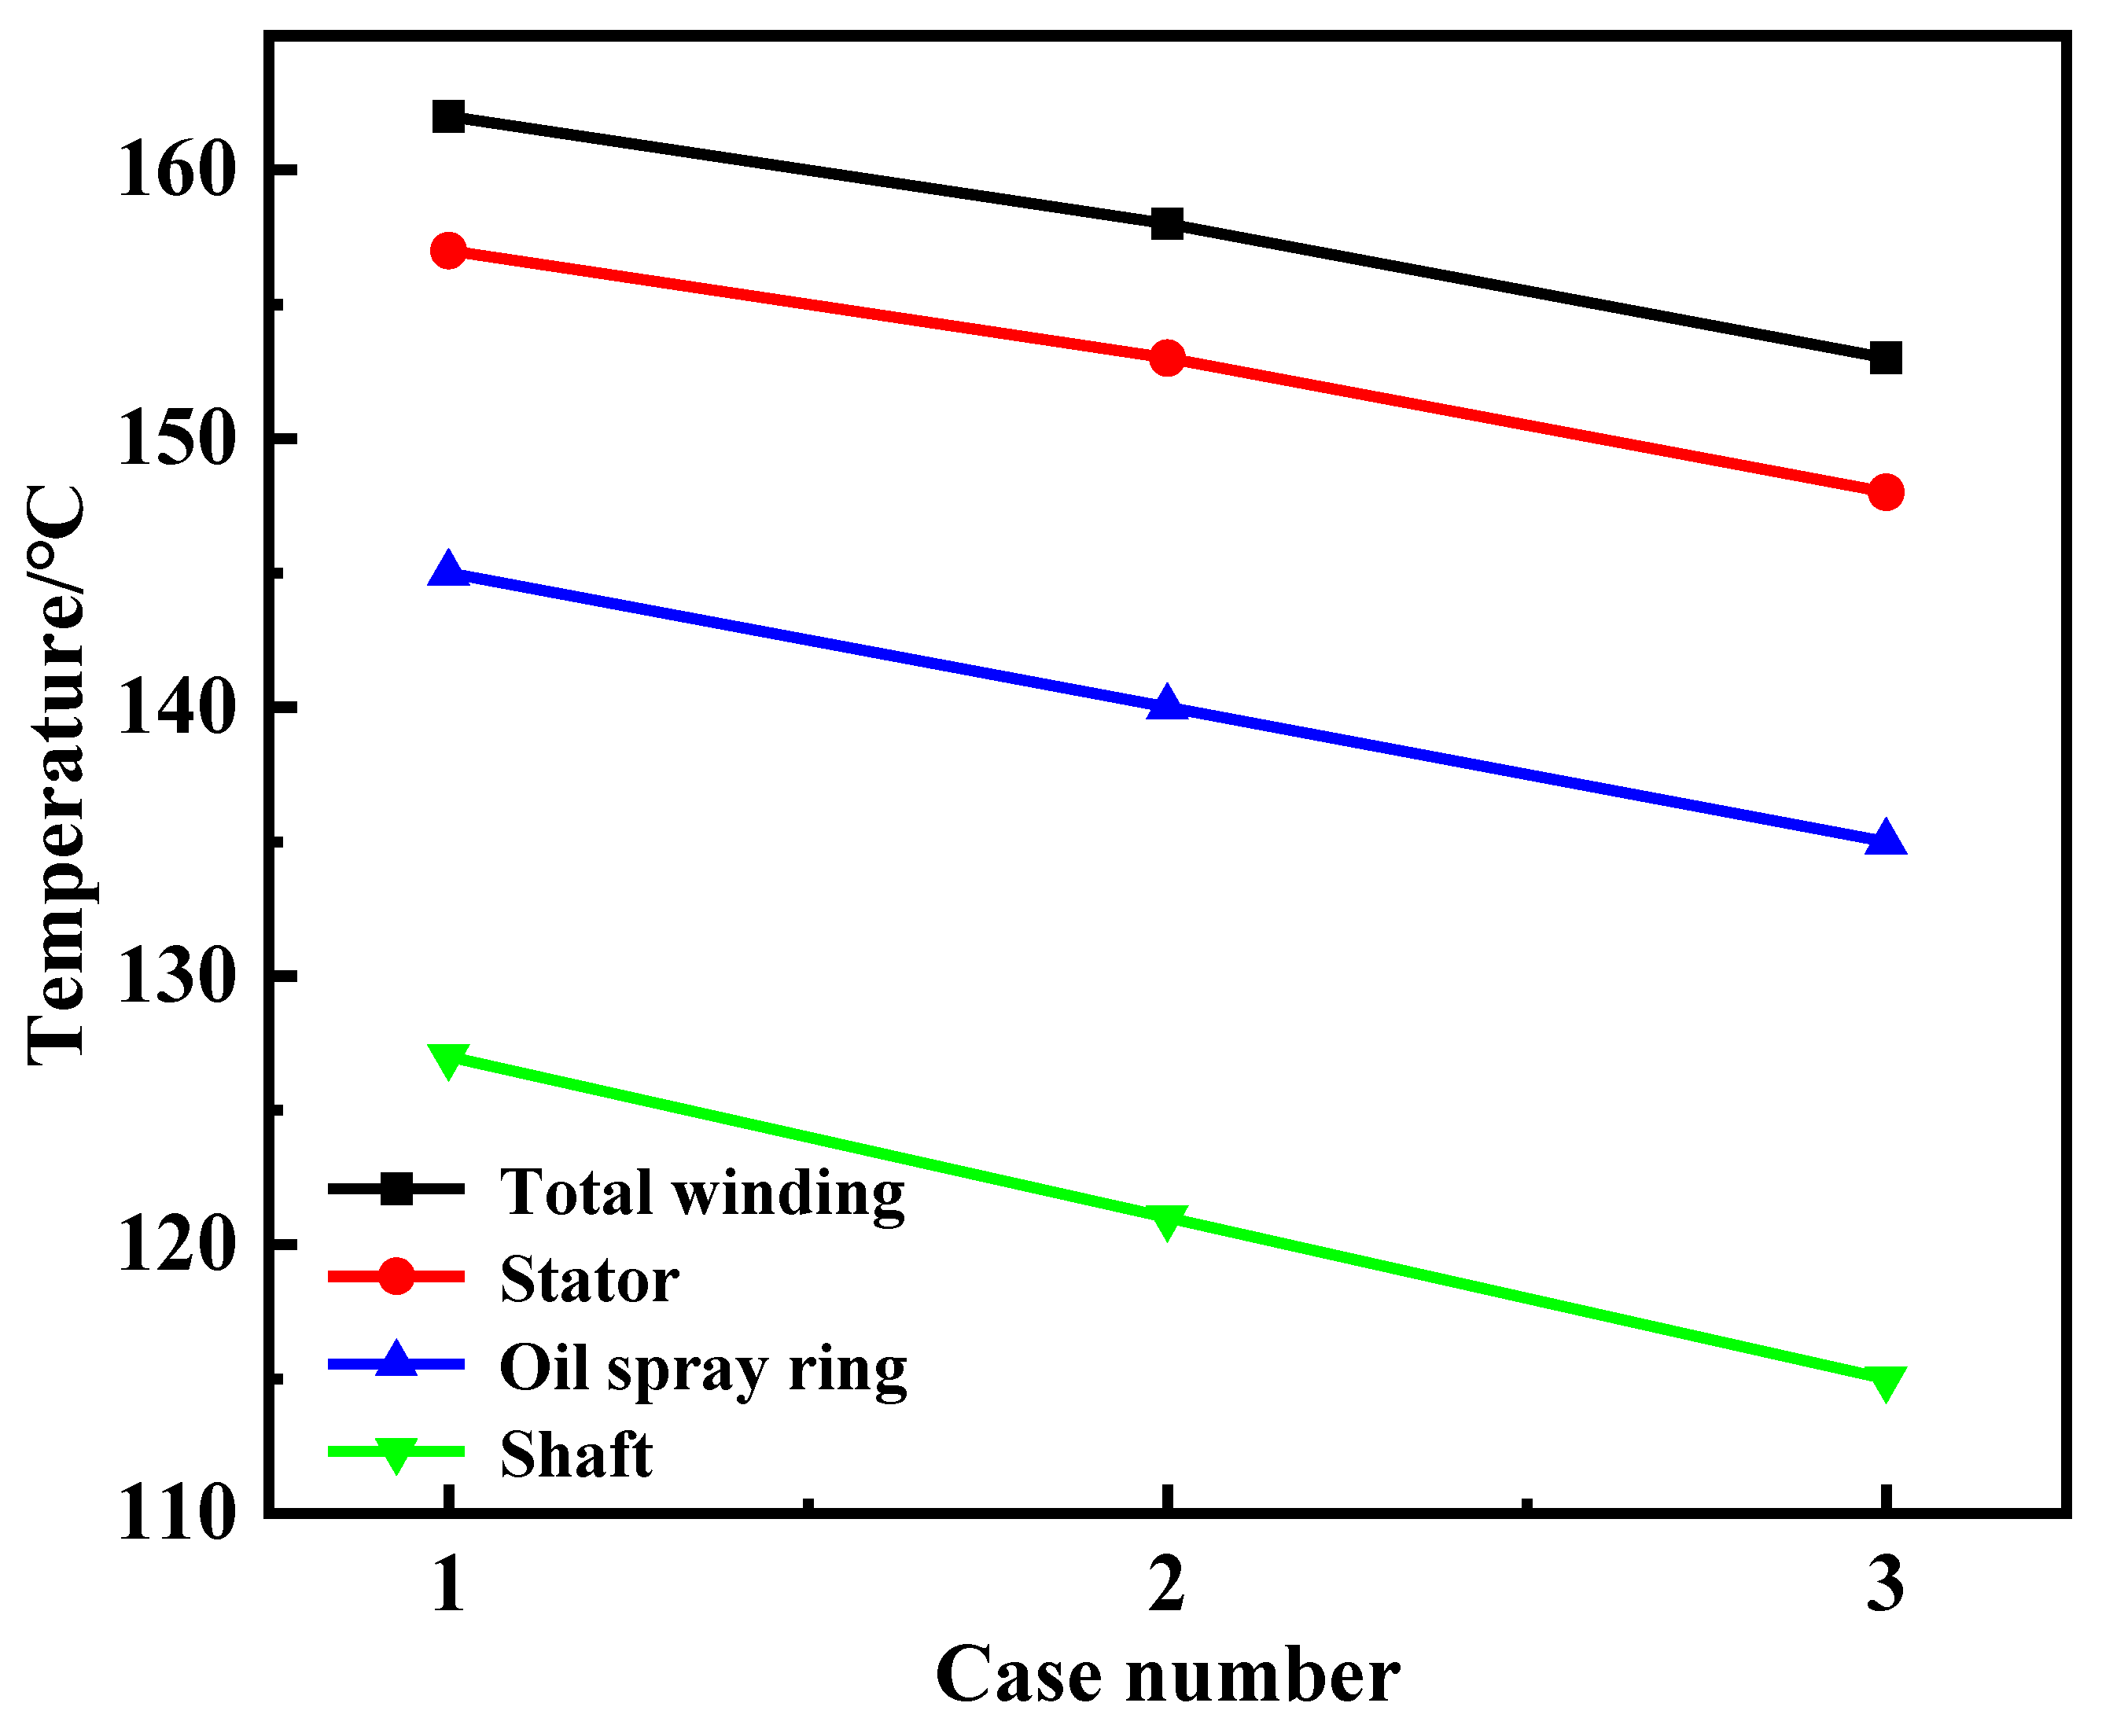
As shown in Figure 20, the non-uniform configurations (Case 2 and Case 3) exhibit significantly better thermal performance compared to the baseline. In particular, Case 3 demonstrates the most effective cooling, with the maximum stator temperature reduced from 157.5 °C to 148.7 °C, and the maximum end-winding temperature lowered from 162.4 °C to 153.6 °C. Similar reductions are observed for the spray ring (145.5 °C to 140.6 °C) and shaft (127.3 °C to 115.6 °C), confirming that asymmetric spray ring designs can effectively match cooling flow distribution to heat generation zones, thereby improving the overall thermal response.
Figure 21 shows the temperature contour plots for the three cases. Case 1 exhibits noticeable hot spots in the end-winding region, particularly due to the uniform orifice sizing failing to match local heat flux demands. In contrast, Case 3 delivers a more uniform temperature field with lower overall thermal levels. This improvement is mainly due to the larger terminal-side orifices providing greater local oil flow and enhanced heat removal, while the smaller welding-side orifices reduce oil leakage and improve coverage over the targeted components. Although cooling is slightly limited at the welding side, the flow utilization is optimized across the motor.
Figure 22 compares the pressure drops among the three cases. As expected, Case 1 yields the lowest pressure drop at 907 Pa, owing to the moderate orifice sizing and smoother oil paths. In contrast, Case 3 reaches a pressure drop of 1410 Pa, which is primarily due to the reduced orifice diameter on the welding side increasing local flow resistance. This highlights a trade-off between cooling performance and hydraulic losses.
In summary, the asymmetric orifice configuration (e.g., Case 3) significantly enhances thermal management by lowering peak temperatures of the stator, windings, spray ring, and shaft while improving temperature uniformity. However, this improvement comes at the cost of a higher pressure drop. While Case 3 offers the best thermal performance, Case 2 achieves a reasonable compromise between cooling efficiency and pressure drop, making it a potentially preferable design in practice. Therefore, the choice of spray ring configuration must balance thermal benefits with system energy efficiency and flow resistance constraints in practical engineering applications.

4. Conclusions

This study presents a comprehensive thermal analysis of oil-jet cooled PMSMs, with an emphasis on end-winding heat dissipation. A high-fidelity thermal model was developed, incorporating the detailed three-dimensional geometry of end-windings. Validation against experimental measurements under industrial conditions confirmed its predictive accuracy, with average deviations below 7% for terminal-side and below 6% for welding-side monitoring points. This confirms the model’s applicability for engineering evaluation and design refinement. Using a simplified equivalent model, a series of parametric investigations were conducted to quantify the impact of spray ring configurations and inlet oil parameters on thermal performance:
(1)
Smaller nozzles (2 mm) enhance local impingement cooling, effectively reducing peak winding temperatures, albeit at the cost of increased system pressure drop. Larger diameters (4 mm) promote better temperature uniformity but compromise local heat extraction efficiency.
(2)
A configuration with 12 holes was found to yield the best trade-off between thermal uniformity and maximum temperature control (155 °C), outperforming both the under-designed (8 holes) and over-designed (14 holes) cases.
(3)
Lower inlet temperatures improve peak heat removal but increase temperature gradients; higher flow rates (6 L/min) significantly reduce overall temperatures and improve spatial uniformity, though with greater energy consumption due to flow resistance.
(4)
A non-uniform orifice distribution (Case 3) tailored to the asymmetric heat flux between terminal and welding sides further reduced maximum component temperatures by 5.6–9.2% compared to the baseline symmetric layout. While pressure drop increased from 907 Pa to 1410 Pa, the design achieved superior cooling balance and thermal consistency.
In summary, this work establishes a validated and physically consistent modeling framework for PMSM thermal analysis and provides actionable insights for optimizing oil-jet cooling systems.

Author Contributions

Conceptualization, J.Z.; methodology, F.W.; software, J.F.; validation, X.F.; formal analysis, G.Z.; investigation, H.Y.; resources, F.Z.; data curation, H.Y.; writing—original draft preparation, H.Y.; writing—review and editing, J.Z.; supervision, J.Z.; project administration, F.Z.; funding acquisition, J.Z. and X.F. All authors have read and agreed to the published version of the manuscript.

Funding

This research was funded by the Science and Technology Research Program of Chong-qing Municipal Education Commission (Grant No. KJQN202201120, Grant No. KJQN202401122) and Chongqing Provincial Natural Science Foundation (Grant No. CSTB2024NSCQ-MSX0313).

Data Availability Statement

The original contributions presented in this study are included in this article; further inquiries can be directed to the corresponding author.

Conflicts of Interest

The authors declare no conflicts of interest.

References

  1. Huang, J.; Naini, S.S.; Miller, R.; Rizzo, D.; Sebeck, K.; Shurin, S.; Wagner, J. A Hybrid Electric Vehicle Motor Cooling System—Design, Model, and Control. IEEE Trans. Veh. Technol. 2019, 68, 4467–4478. [Google Scholar] [CrossRef]
  2. Dai, H.; Yang, C.; Zhang, F.; Liao, G.; Zhang, B.; E, J. Transient heat dissipation performance investigation on the battery thermal management system based on S-CO2 immersion cooling. Energy 2025, 318, 13465. [Google Scholar] [CrossRef]
  3. Hou, J.; Xie, B. Present Situation and Future Prospects of Motor Cooling System. Recent Pat. Eng. 2024, 18, 103–115. [Google Scholar]
  4. Gronwald, P.-O.; Kern, T.A. Traction Motor Cooling Systems: A Literature Review and Comparative Study. IEEE Trans. Transp. Electrif. 2021, 7, 2892–2913. [Google Scholar] [CrossRef]
  5. Akawung, A.F.; Fujimoto, Y. Design and Thermal Analysis of Cooling System for High-Power Density Motor Based on Air-Flow. In Proceedings of the 2019 IEEE 28th International Symposium on Industrial Electronics (ISIE), Vancouver, BC, Canada, 12–14 June 2019. [Google Scholar]
  6. Garud; Sandip, K.; Hwang, S.-G.; Han, J.-W.; Lee, M.-Y. Performance Characteristics of the Direct Spray Oil Cooling System for a Driving Motor of an Electric Vehicle. Int. J. Heat Mass Transf. 2022, 196, 123228. [Google Scholar] [CrossRef]
  7. Gundabattini, E.; Mystkowski, A.; Idzkowski, A.; Singh, R.R.; Solomon, D.G. Thermal Mapping of a High-Speed Electric Motor Used for Traction Applications and Analysis of Various Cooling Methods—A Review. Energies 2021, 14, 1472. [Google Scholar]
  8. Chang, C.-C.; Cheng, C.-H.; Ke, M.-T.; Chen, S.-L. Experimental and Numerical Investigations of Air Cooling for a Large-Scale Motor. Int. J. Rotating Mach. 2009, 2009, 612723. [Google Scholar]
  9. Dong, H.; Ruan, L.; Wang, Y.; Yang, J.; Liu, F.; Guo, S. Performance of Air/Spray Cooling System for Large-Capacity and High-Power-Density Motors. Appl. Therm. Eng. 2021, 192, 116925. [Google Scholar] [CrossRef]
  10. Hyeon, S.; Kim, C.; Lee, K.-S. Thermal Enhancement of an Air-Cooled Motor with a Flow Guide. Int. J. Heat Mass Transf. 2022, 183, 122228. [Google Scholar] [CrossRef]
  11. Madhavan, S.; PB, R.D.; Konda, Y.R.; Gundabattini, E.; Mystkowski, A.; Palka, R.; Wardach, M.; Prajzendanc, P. Thermal Management Analyses of Induction Motor through the Combination of Air-Cooling and an Integrated Water-Cooling System. Sci. Rep. 2023, 13, 10125. [Google Scholar]
  12. Keuter; Johannes, R.; Niebuhr, F.; Nozinski, M.; Krüger, E.; Kabelac, S.; Ponick, B. Design of a Direct-Liquid-Cooled Motor and Operation Strategy for the Cooling System. Energies 2023, 16, 5319. [Google Scholar] [CrossRef]
  13. Geng, W.; Zhu, T.; Li, Q.; Zhang, Z. Windings Indirect Liquid Cooling Method for a Compact Outer-Rotor Pm Starter/Generator with Concentrated Windings. IEEE Trans. Energy Convers. 2021, 36, 3282–3293. [Google Scholar]
  14. Chen, A.; Xu, F.; Liu, X.; He, Y.; Wu, Z.; Zhu, Y.; Han, Z.; Li, L. Sub-Cooled Liquid Nitrogen Test System for Cooling Hts Synchronous Motor. IEEE Trans. Appl. Supercond. 2011, 22, 4701304. [Google Scholar] [CrossRef]
  15. Baeten, A.; Barm, S.; Reitenberger, J.; Fackler, M. Parameterized Pre-Dimensioning of a Winding-Integrated Cryogenic Hydrogen Cooling System in an Axial Flux Motor for Ship Propulsion Systems. In Proceedings of the ISOPE International Ocean and Polar Engineering Conference, Ottawa, ON, Canada, 19–23 June 2023. [Google Scholar]
  16. Hara, S.; Iwami, Y.; Kawasaki, R.; Matsumoto, T.; Shirai, Y.; Shiotsu, M.; Kobayashi, H.; Naruo, Y.; Nonaka, S.; Inatani, Y.; et al. Development of Liquid Hydrogen Cooling System for a Rotor of Superconducting Generator. IEEE Trans. Appl. Supercond. 2021, 31, 1–5. [Google Scholar] [CrossRef]
  17. Kim, K.; Hahn, S.; Min, B.; Sim, K.-D.; Kim, Y.; Kim, S. Liquid Hydrogen Cooling System for 100 Kw-Class Hts Rotor Thermal Design. IEEE Trans. Appl. Supercond. 2024, 34, 1–5. [Google Scholar]
  18. Fujita, H.; Itoh, A.; Urano, T. Newly Developed Motor Cooling Method Using Refrigerant. World Electr. Veh. J. 2019, 10, 38. [Google Scholar] [CrossRef]
  19. Liu, Y.; Li, Y.; Chen, Z.; Wang, C.; Xing, Z. Numerical Research on Refrigerant Injection for Motor Cooling of Screw Compressor for Heat Pump with Large Temperature Lift. Appl. Therm. Eng. 2024, 253, 123837. [Google Scholar] [CrossRef]
  20. Ghahfarokhi, P.S.; Podgornovs, A.; Kallaste, A.; Cardoso, A.J.M.; Belahcen, A.; Vaimann, T. The Oil Spray Cooling System of Automotive Traction Motors: The State of the Art. IEEE Trans. Transp. Electrif. 2022, 9, 428–451. [Google Scholar]
  21. Maddumage, W.; Ouenzerfi, S.; Harmand, S.; Cairns, A.; Paykani, A. Thermal Management of Hairpin Winding Traction Motors in Electric Vehicles: Parametric Evaluation of Impinging Oil Jet Cooling Using Cfd Simulations. Appl. Therm. Eng. 2025, 273, 126414. [Google Scholar] [CrossRef]
  22. Shewalkar, A.G.; Dhoble, A.S.; Thawkar, V.P. Review on Cooling Techniques and Analysis Methods of an Electric Vehicle Motor. J. Therm. Anal. Calorim. 2024, 149, 5919–5947. [Google Scholar] [CrossRef]
  23. Karim, A.; Ambri, Z.; Mohd Yusoff, A.H. Cooling System for Electric Motor of an Electric Vehicle Propulsion. Adv. Mater. Res. 2014, 903, 209–214. [Google Scholar] [CrossRef]
  24. Konovalov, D.; Tolstorebrov, I.; Eikevik, T.M.; Kobalava, H.; Radchenko, M.; Hafner, A.; Radchenko, A. Recent Developments in Cooling Systems and Cooling Management for Electric Motors. Energies 2023, 16, 7006. [Google Scholar] [CrossRef]
  25. Beom, T.; Kim, Y.; Ha, T.W.; Lee, S.W.; Hwang, I.G.; Kim, D.K. Development of a Coefficient of Performance to Evaluate the Oil Cooling Methods in Electric Vehicle Motors. Case Stud. Therm. Eng. 2025, 71, 106194. [Google Scholar] [CrossRef]
  26. Jiang, Y.; Lu, Y.; Chen, L.; Zheng, E.; Wang, C.; Luo, Z.; Shi, Y.; Wang, X.; Hu, L.; Zhao, S. Modeling, Analysis, and Optimization of the Asymmetric Cooling System for a Hybrid Oil-Cooled Motor. Appl. Therm. Eng. 2025, 270, 126215. [Google Scholar] [CrossRef]
  27. Thangaraju, S.K.; Munisamy, K.M.; Rajoo, S. Numerical Investigation on Cooling Performance of Oil Cooled Pmsm Jacket Design with Vertical Straight Fin Design. Int. J. Thermofluids 2022, 16, 100209. [Google Scholar] [CrossRef]
  28. Feng, J.; Sun, P.; Wei, D.; Shi, W.; Yang, S.; Zhao, Z. Study on Radial Oil Spray Cooling of End Windings with Hairpin Motors. Case Stud. Therm. Eng. 2025, 65, 105675. [Google Scholar]
  29. Rocca, L.; Salvatore; Pickering, S.J.; Eastwick, C.N.; Gerada, C.; Ronnberg, K. Numerical Study on the Impact of End Windings Porosity on the Fluid Flow and Heat Transfer in a Totally Enclosed Fan-Cooled Electrical Machine. In Proceedings of the 2019 IEEE International Electric Machines & Drives Conference (IEMDC), San Diego, CA, USA, 12–15 May 2019. [Google Scholar]
  30. Gundabattini, E.; Mystkowski, A. Combinations and Thermal Analysis (Experimental and Analytical) of a Permanent Magnet Synchronous Motor. Proc. Inst. Mech. Eng. Part C J. Mech. Eng. Sci. 2022, 236, 655–668. [Google Scholar] [CrossRef]
  31. Han; Gu, N.; Lee, H.L.; Kim, R.H.; Beom, T.Y.; Kim, Y.K.; Ha, T.W.; Lee, S.W.; Kim, D.K. Thermal Analysis of the Oil Cooling Motor According to the Churning Phenomenon. Appl. Therm. Eng. 2023, 220, 119791. [Google Scholar]
  32. Rocca, L.; Salvatore; Pickering, S.J.; Eastwick, C.N.; Gerada, C.; Rönnberg, K. Fluid Flow and Heat Transfer Analysis of Tefc Machine End Regions Using More Realistic End-Winding Geometry. J. Eng. 2019, 2019, 3831–3835. [Google Scholar] [CrossRef]
  33. Menter, F.R. Two-Equation Eddy-Viscosity Turbulence Models for Engineering Applications. AIAA J. 1994, 32, 1598–1605. [Google Scholar]
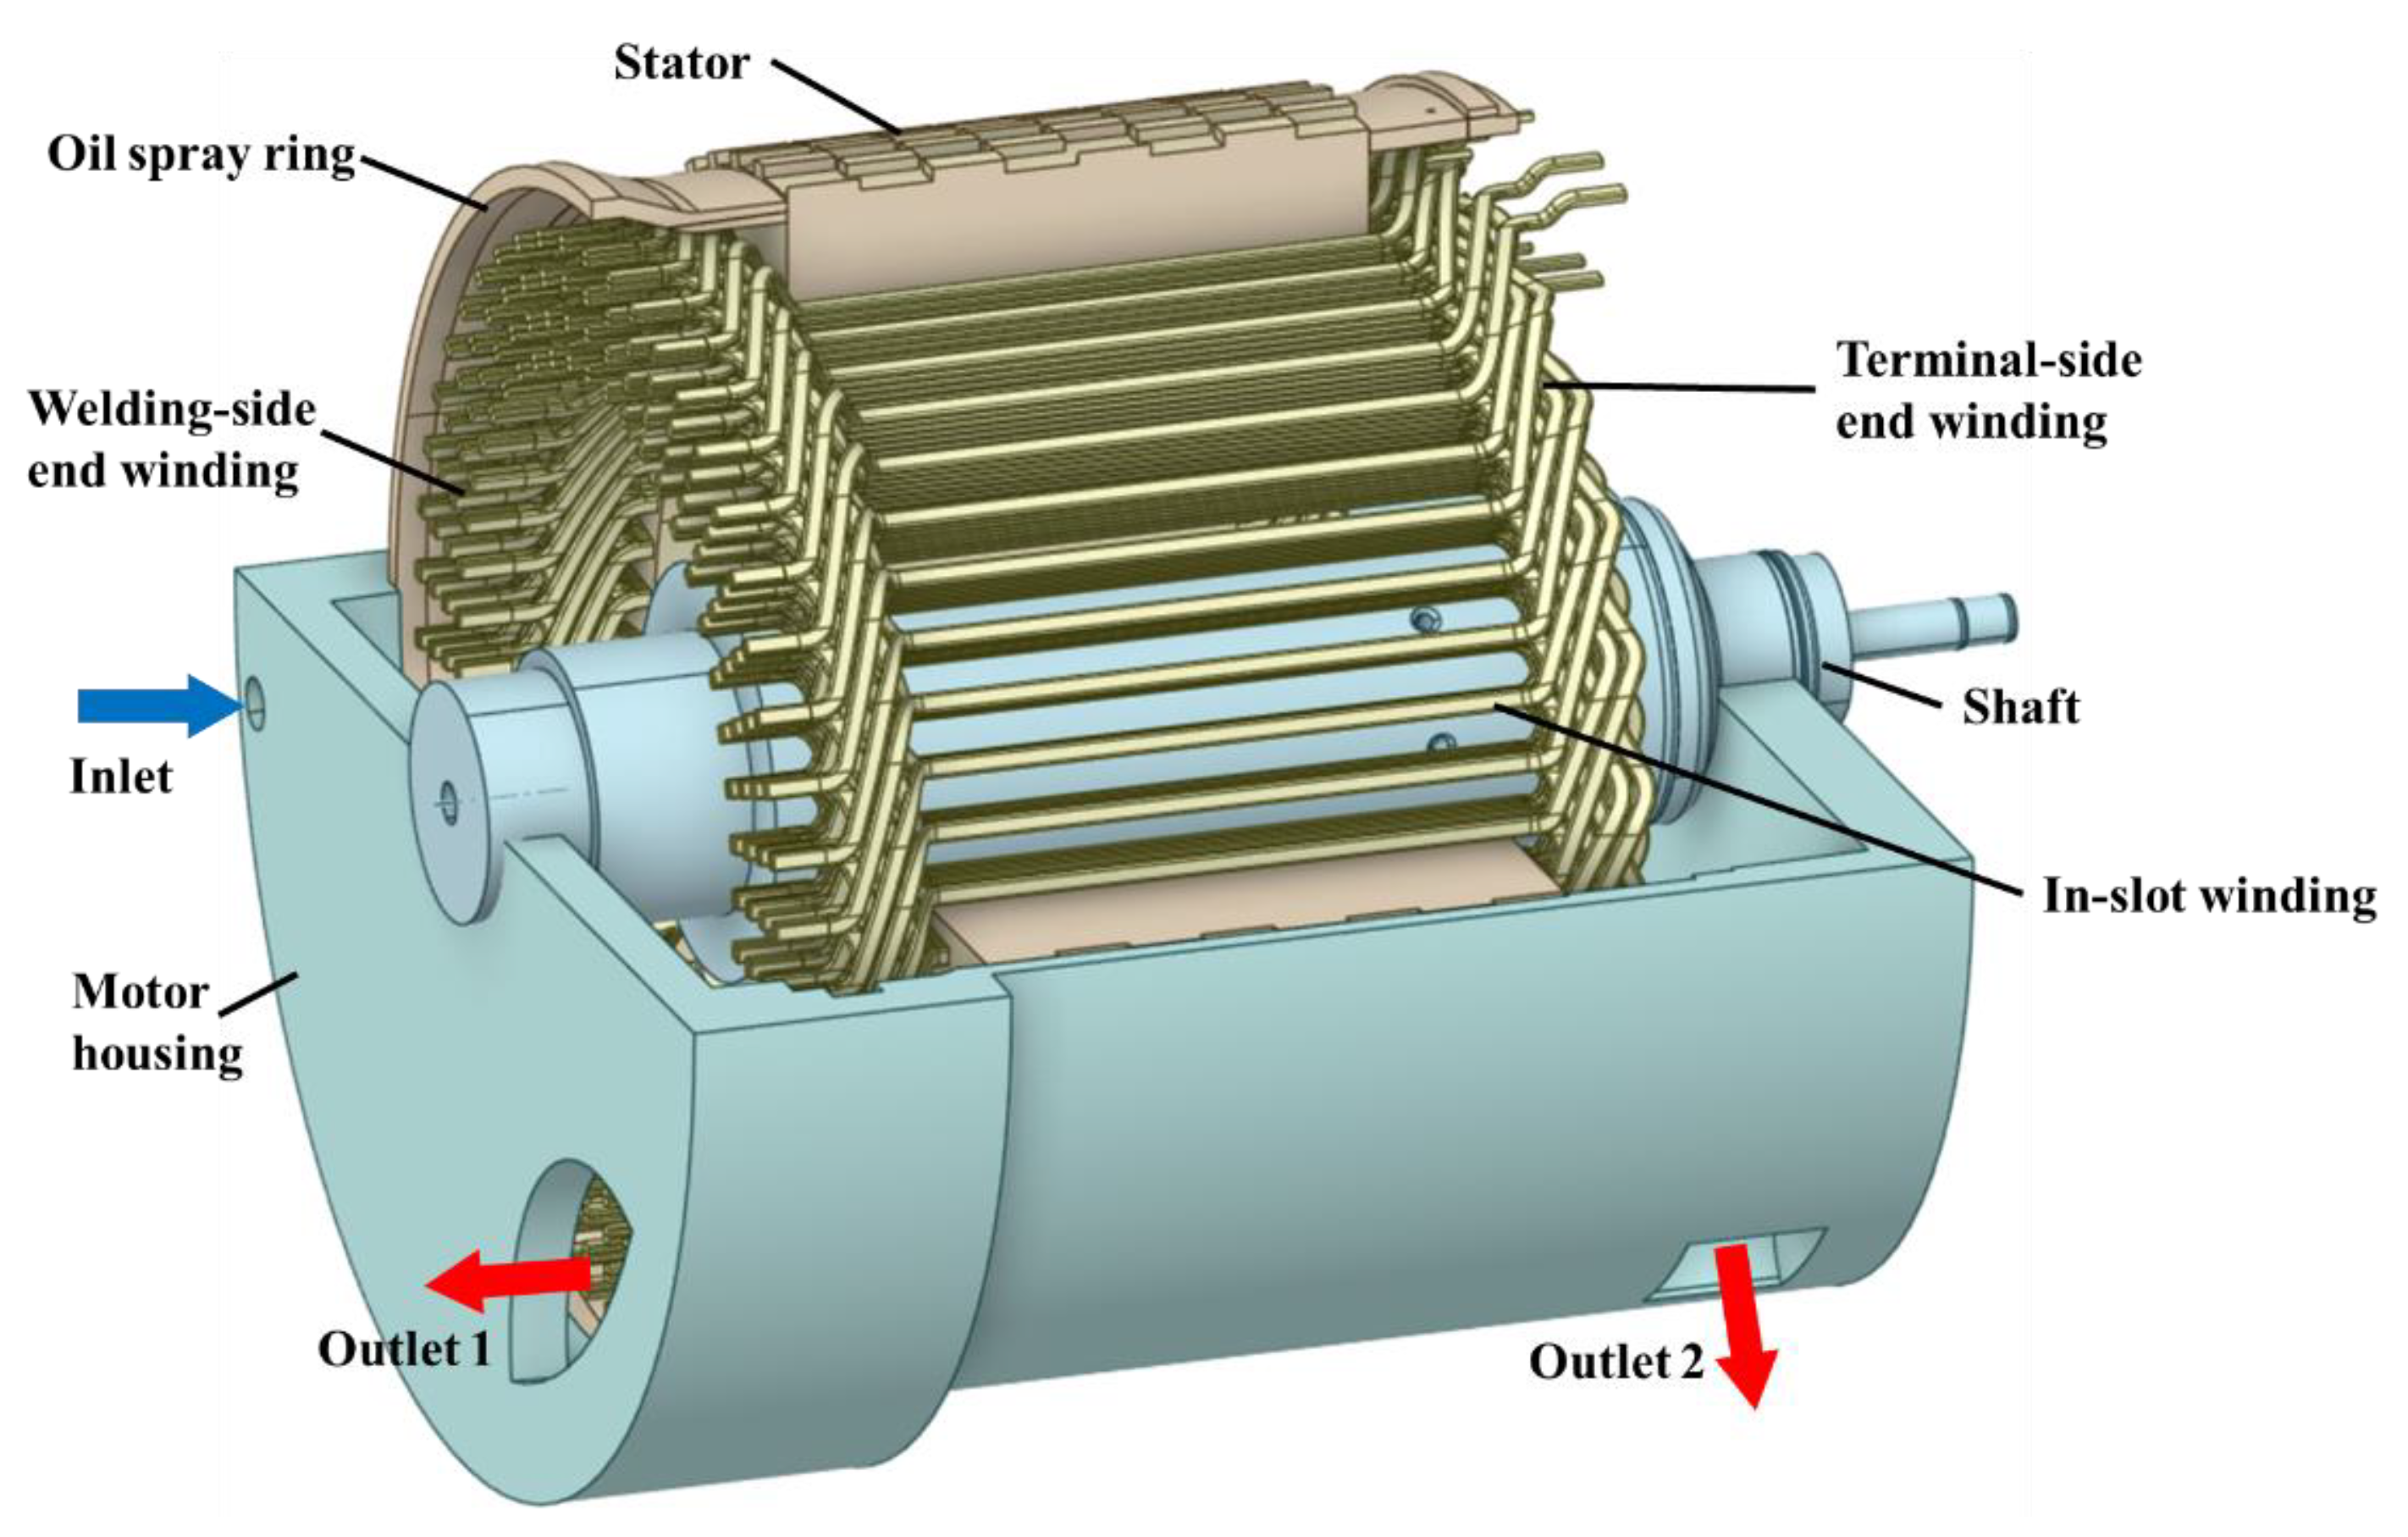
Figure 1. Original geometric model of the motor.
Energies 18 04302 g001
Figure 2. (a) Motor geometry in the x–z plane, (b) motor geometry in the y–z plane, (c) overall simplified motor model, and (d) wrapped end-winding region.
Energies 18 04302 g002
Figure 3. Interface definition between fluid and solid regions.
Energies 18 04302 g003
Figure 4. (a) Mesh of the full model; (b) Mesh of the end-winding subdomain.
Energies 18 04302 g004
Figure 5. Grid independence verification.
Energies 18 04302 g005
Figure 6. Thermocouple placement on end windings.
Energies 18 04302 g006
Figure 7. Comparison of measured average temperatures in different regions: (a) Welding side; (b) Terminal side.
Energies 18 04302 g007
Figure 8. Temperature distribution of components.
Energies 18 04302 g008
Figure 9. Schematic of calibration process for radial thermal conductivity in annular model.
Energies 18 04302 g009
Figure 10. Temperature distributions of end-windings under different nozzle diameters.
Energies 18 04302 g010
Figure 11. Comparison of maximum and minimum temperatures in the winding region under different nozzle diameters.
Energies 18 04302 g011
Figure 12. Pressure loss under different nozzle diameters.
Energies 18 04302 g012
Figure 13. Temperature distributions of end-windings under different nozzle numbers.
Energies 18 04302 g013
Figure 14. Comparison of maximum and minimum temperatures in the winding region under different nozzle numbers.
Energies 18 04302 g014
Figure 15. Temperature distributions of end-windings under different inlet oil temperatures.
Energies 18 04302 g015
Figure 16. Impact of inlet oil temperature on maximum temperature and temperature difference of the end-windings.
Energies 18 04302 g016
Figure 17. Temperature distributions of end-windings under different inlet oil flow rates.
Energies 18 04302 g017
Figure 18. Impact of inlet oil flow rate on maximum temperature and temperature difference.
Energies 18 04302 g018
Figure 19. Cooling Oil Flow Path Distribution Map.
Energies 18 04302 g019
Figure 20. Comparison of Component Temperatures under Different Cases.
Energies 18 04302 g020
Figure 21. Temperature Contour Plots of Key Components under Different Cases.
Energies 18 04302 g021
Figure 22. Comparison of Pressure Drop under Different Cases.
Energies 18 04302 g022
Table 1. Specifications of the motor.
ParameterSpecification
Motor TypePMSM
Number of Slots/Poles48/8
Rated Power38 kW
Max. Power/Max. Torque75 kW/120 Nm
Base Speed/Max. Speed4400 rpm/12,000 rpm
Nominal Voltage380 V
Winding Type8-layer hairpin
Cooling TypeRotational oil-spray cooling
Table 2. Heat generation and volumetric source intensity.
RegionTotal Heat Loss (W)DistributionVolumetric Heat Source (W/m3)
Stator1281Uniform600,415.8
Welding-Side Winding823Uniform663,502.6
Terminal-Side Winding687Uniform553,859.4
Slot Winding1708Uniform1,376,989.6
Permanent Magnets77Neglected-
Table 3. Solid and fluid material properties.
ComponentDensity (kg/m3)Specific Heat (J/kg·K)Thermal Conductivity (W/m·K)
Housing2700900201
Stator7600450λx = 6, λy = λz = 19.6
Spray Ring2719871202.4
Windings8933385390
Shaft780047046
Table 4. Fluid properties.
FluidDensity
(kg/m3)
Specific Heat
(J/kg·K)
Thermal Conductivity (W/m·K)Viscosity
(Pa·s)
Air1.2251066.430.02421.7894 × 10−5
Cooling Oil803.7421400.1326.4 × 10−3
Table 5. Comparison of experimental and simulated temperatures.
RegionLocationDepthTexp (°C)Tsim (°C)ΔT (°C)Error (%)
Welding1Outer135.8139.43.62.6
Welding1Middle151.0152.31.30.9
Welding1Inner154.4154.3−0.1−0.1
Welding2Outer117.0117.30.30.2
Welding2Middle136.6135.0−1.6−1.2
Welding2Inner121.1139.518.415.2
Welding3Outer112.9115.52.62.3
Welding3Middle124.0125.71.71.4
Welding3Inner119.7135.816.113.4
Welding4Outer121.4119.9−1.5−1.3
Welding4Middle159.1145.8−13.2−8.3
Welding4Inner157.0150.2−6.8−4.3
Welding5Outer131.0129.7−1.3−1.0
Welding5Middle129.6128.8−0.9−0.7
Welding5Inner124.6135.410.88.7
Terminal1Outer126.7132.66.04.7
Terminal1Middle132.9136.43.52.6
Terminal1Inner131.1147.916.812.8
Terminal2Outer132.2135.83.62.7
Terminal2Middle133.3138.14.93.6
Terminal2Inner130.8146.215.411.7
Terminal3Outer133.9134.91.00.8
Terminal3Middle132.3139.57.25.4
Terminal3Inner129.6145.616.012.4
Terminal4Outer134.6136.51.91.4
Terminal4Middle134.8139.44.63.4
Terminal4Inner129.5143.714.211.0
Terminal5Outer133.6143.49.87.3
Terminal5Middle134.5134.60.10.1
Terminal5Inner130.5145.515.011.5
Table 6. Structural Parameters of the Improved Design.
Design ParameterValue Range (mm)Case 1Case 2Case 3
Oil Injection Hole Diameter at Welding End1 ≤ d1 ≤ 42 mm1.5 mm1 mm
Oil Injection Hole Diameter at Outlet End1 ≤ d2 ≤ 42 mm3 mm4 mm
Disclaimer/Publisher’s Note: The statements, opinions and data contained in all publications are solely those of the individual author(s) and contributor(s) and not of MDPI and/or the editor(s). MDPI and/or the editor(s) disclaim responsibility for any injury to people or property resulting from any ideas, methods, instructions or products referred to in the content.