Article

Study on the Width of a Narrow Coal Pillar for Gob-Side Entry Driving near an Advancing Working Face in a Shallow Coal Seam

1
Wangwa Coal Mine, Ningxia Wangwa Coal Industry Co., Ltd., Guyuan 756505, China
2
Ningxia Yinxing Coal Mining Co., Ltd., Yinchuan 750408, China
3
College of Mining Engineering, Taiyuan University of Technology, Taiyuan 030024, China
4
Xuzhou Coal Mining Group Co., Ltd., Xuzhou 221116, China
5
Key Laboratory of Shanxi Province for Mine Rock Strata Control and Disaster Prevention, Taiyuan 030024, China
*
Author to whom correspondence should be addressed.
Energies 2025, 18(16), 4303; https://doi.org/10.3390/en18164303
Submission received: 14 July 2025 / Revised: 6 August 2025 / Accepted: 7 August 2025 / Published: 13 August 2025

Abstract

In response to the challenges of controlling surrounding rock deformation in gob-side entry driving towards the advancing working face, a systematic study on the stability of the headgate# 15107 and coal pillar section was conducted, using a combination of theoretical analysis, numerical simulation, and field testing. First, based on the theory of internal and external stress fields, the range of the internal stress field was determined to be 9.83~11.43 m, and combined with the limit equilibrium theory, the most reasonable width of the narrow coal pillar was found to be 6 m. Secondly, the stability of the surrounding rock and coal pillars of the headgate# 15107 under different coal pillar widths during roadway excavation and working face mining was simulated, respectively. The simulation results show that during the head-on mining and driving period, when the coal pillar width is 4 m or 5 m, the plastic zone in the coal pillar is completely damaged and loses its bearing capacity; when the coal pillar width is 6 m, an elastic zone appears in the coal pillar, and the area of the elastic zone increases with the increase in the coal pillar width. During the excavation along the goaf, when the coal pillar width is 4, 5, 6, 8, or 10 m, the stress curve inside the coal pillar shows a single-peak distribution, and the stress peak of the coal pillar increases with the increase in the coal pillar width, with the stress peaks being 7.66, 9.74, 12.32, 16.02, and 27.05 MPa, respectively. When the coal pillar width is 25 m, the stress curve inside the coal pillar shows a double-peak distribution. During the advancement of the 15107 working face, the stress peaks corresponding to the 4, 5, 6, 8, 10, and 25 m coal pillars are 29.8, 27.5, 26.8, 27.2, 33.7, and 24.3 MPa, respectively. Throughout the entire simulation process, when the coal pillar width is 6 m, the coal pillar has good bearing capacity and a low degree of stress concentration. Finally, based on this, the support scheme for the headgate# 15107 was optimized, and industrial experiments were conducted. Field testing showed that a 6 m narrow coal pillar for roadway protection and an optimized roadway support can effectively control the deformation of the surrounding rock of the roadway.

1. Introduction

In order to reduce coal resource loss and improve recovery rates, gob-side entry driving with a narrow coal pillar has been widely applied [1], as shown in Figure 1a. However, as the mining intensity continues to increase, difficulties in the succession of mining and excavation occur, leading to a reduction in the mine production profits [2,3]. To alleviate the issue of tight mining succession, entries are often driven along the edge of the unstable gob during the upper working face recovery process, as shown in Figure 1b.
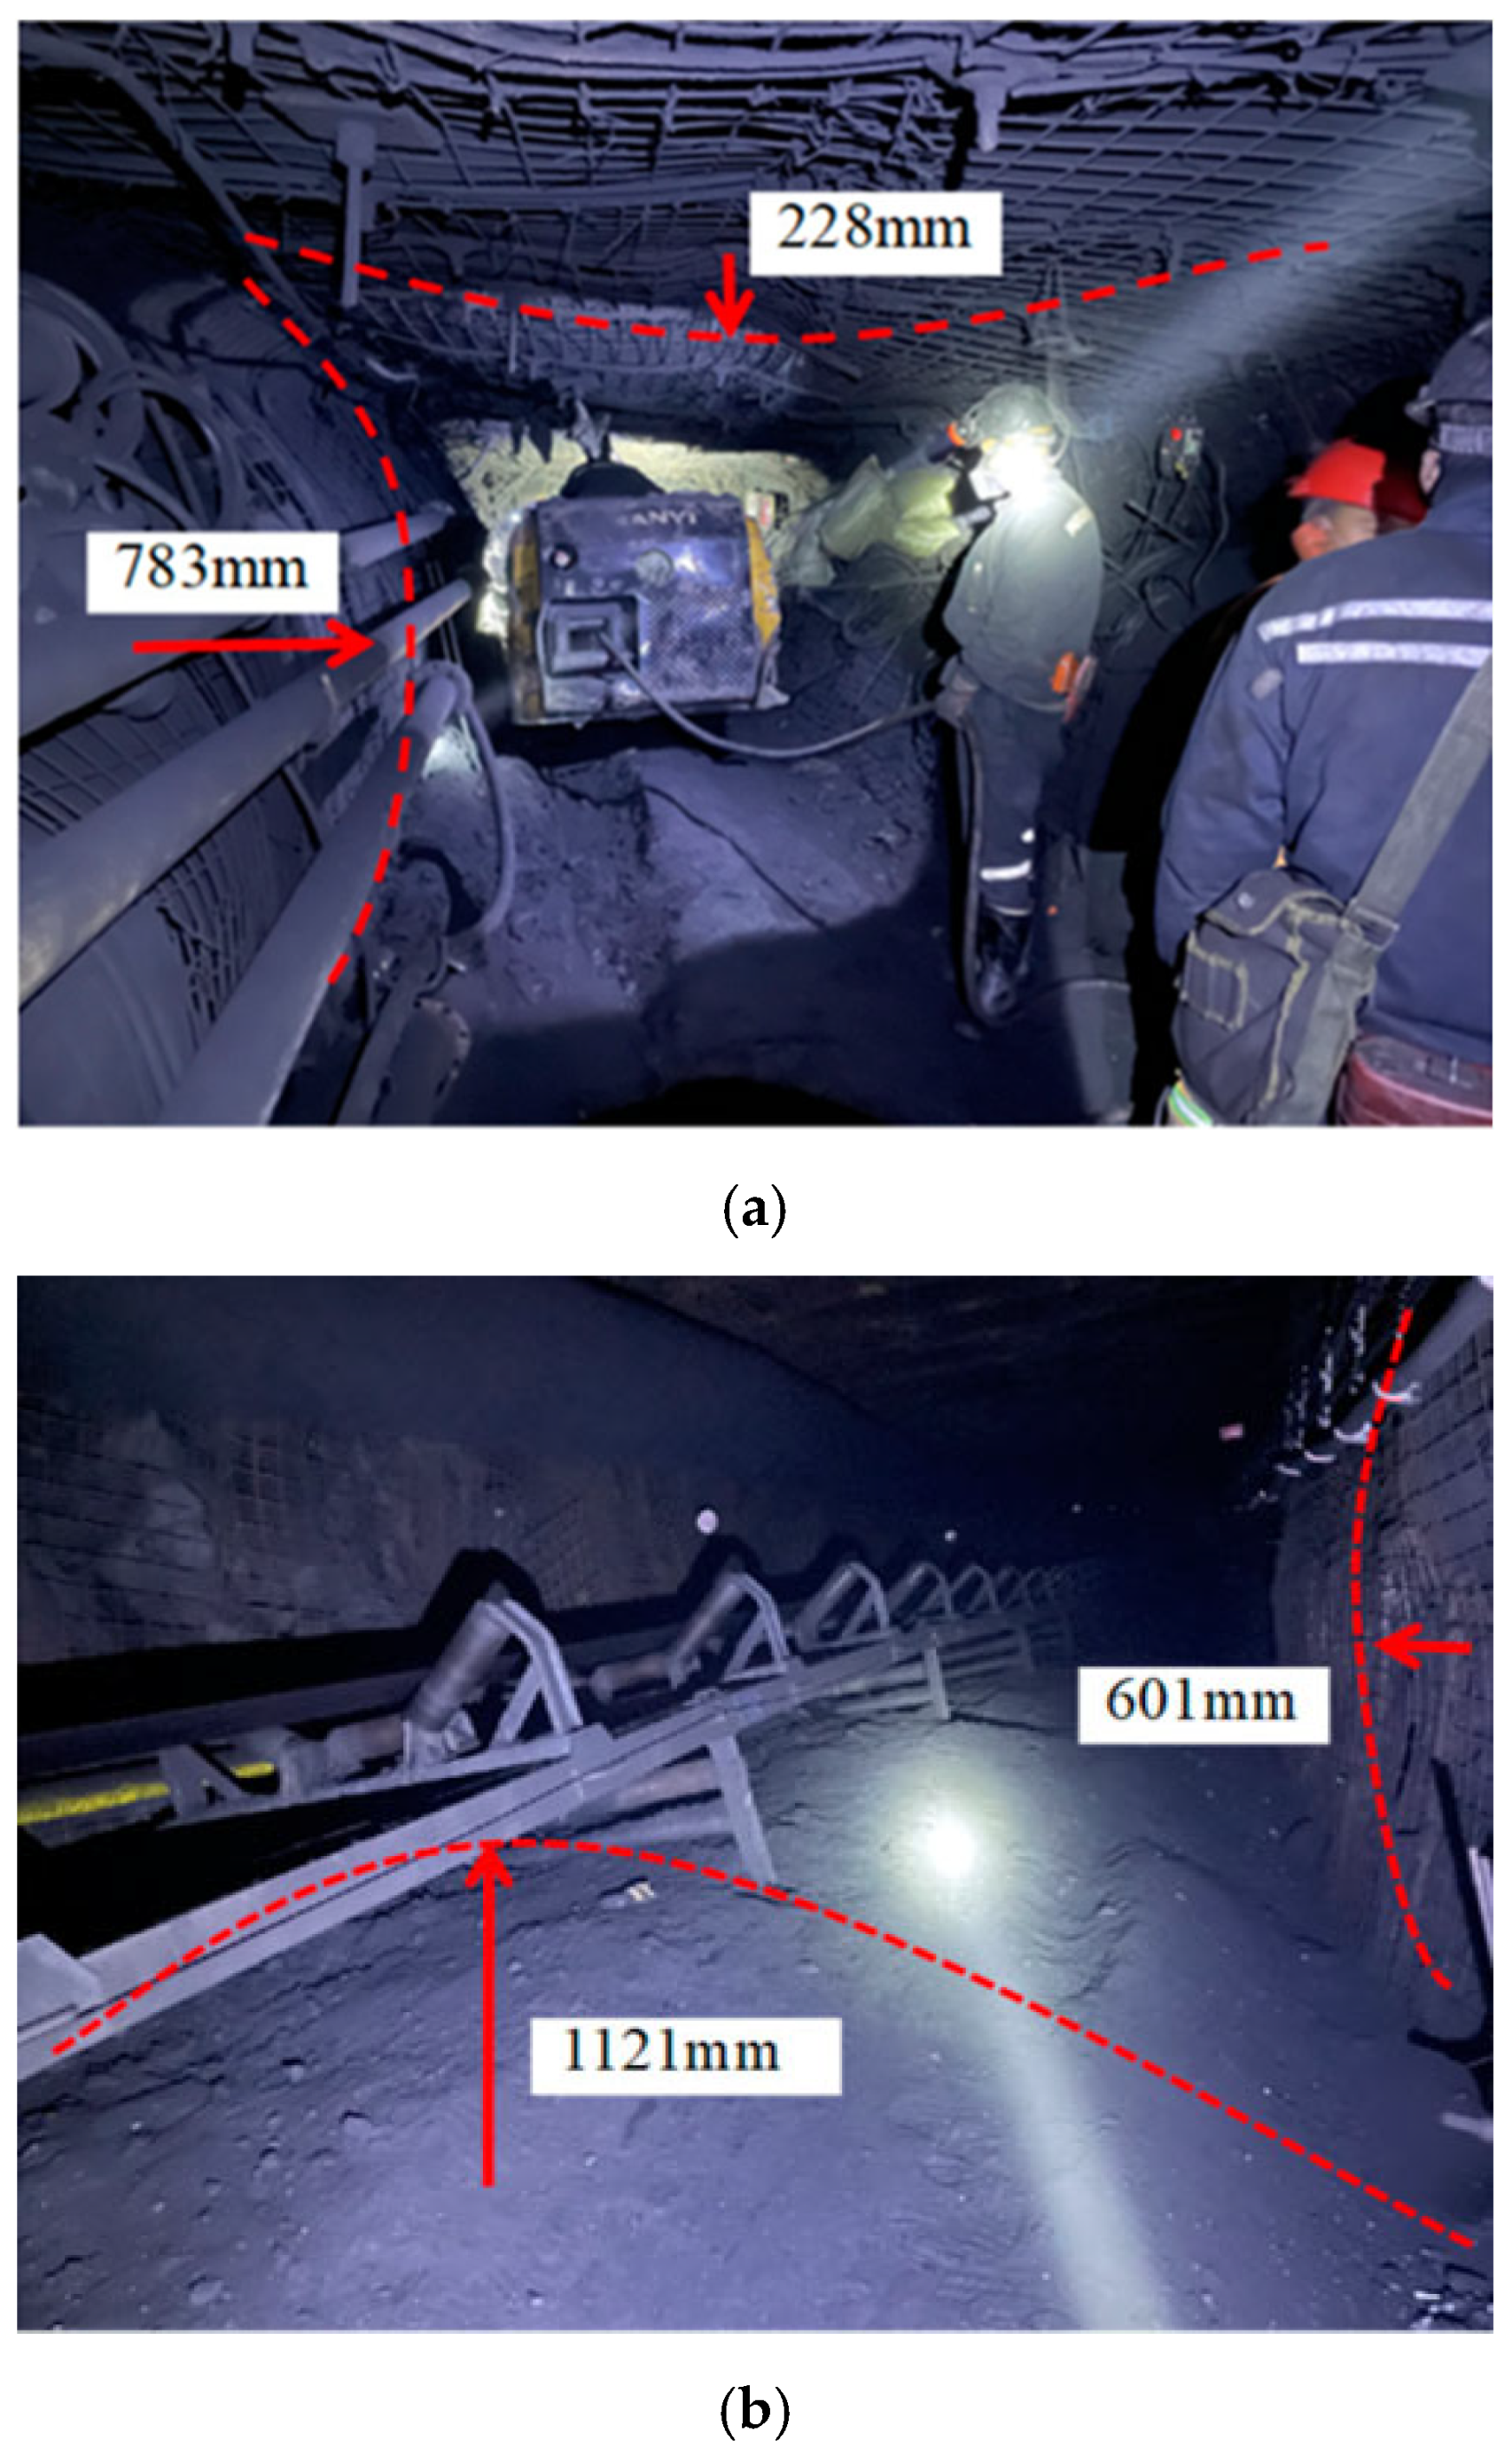
While this approach resolves the problem of mining succession, compared to traditional gob-side entry driving, entry driving toward the adjacent working face with an unstable gob leads to a combined pressure effect from both the entry excavation and the mining operation of the advancing working face, resulting in a significant increase in surrounding rock stress [4]. Such roadways undergo severe deformation under high stress, as shown in Figure 2. It can be seen from Figure 2 that the roof, floor and both sides of the roadway have all experienced significant deformation, which in turn affects the needs of transportation, ventilation and pedestrian passage, and reduces the mining efficiency of the working face.
As a result, such roadways experience large deformation and are extremely difficult to maintain, requiring research into the surrounding rock deformation patterns in gob-side entry driving towards an advancing working face (TAWF), the width of the section-protecting coal pillars, and the roadway support parameters [6,7,8,9]. Currently, numerous studies have been conducted by scholars both domestically and internationally to control the stability of surrounding rock in such high mining pressure recovery roadways.
Yu et al. [10] used field observation and numerical calculation methods to study the spatiotemporal effects of overlying strata movement and surrounding rock deformation in gob-side entry driving TAWF. They determined the excavation timing and support parameters for each section of the roadway and proposed a dynamic segmentation control principle and support technology. Hui et al. [11] studied the entire process of surrounding rock deformation, failure, and instability in dynamic pressure gob-side roadways under three different support methods: no support, anchor beam mesh and rope support, and frame support. They suggested that anchor beam mesh and rope support is more suitable for gob-side entries with significant surrounding rock deformation. Wang et al. [12] used theoretical analysis, numerical calculations, and field tests to reveal the asymmetric deformation pattern of surrounding rock in gob-side entry driving TAWF under the influence of nearby mining activities. He proposed measures such as the use of high-strength, large-extension anchor support and enhanced roof support. Zhang et al. [13] analyzed the factors influencing the stability of surrounding rock during gob-side entry driving TAWF and proposed the use of a new high-performance, pre-tensioned composite anchor support technology to effectively control the surrounding rock deformation in such roadways. However, there is limited research on determining reasonable narrow coal pillar widths in shallow-buried coal seam gob-side entry driving TAWF under the influence of multiple mining disturbances.
The Wangwa Coal Mine is currently recovering its 15106 working face. To alleviate the tight mining succession, it is necessary to advance the headgate# 15107 while mining the 15106 working face in order to complete the layout of the 15107 working face. Therefore, this study takes the gob-side entry driving near an advancing working face problem for the 15106 working face recovery and the headgate# 15107 advance in the Wangwa Coal Mine as its case study. It uses methods such as theoretical analysis, numerical simulation, and field tests to analyze the surrounding rock and coal pillar stability under different section-protecting coal pillars widths, to determine a reasonable width for the section-protecting coal pillar, and to propose an effective roadway support scheme to ensure the stability and safety of the gob-side entry driving TAWF.

2. Case Study

2.1. Field Background

The Wangwa Coal Mine has a designed production capacity of 120 Mt/a. The main coal seam being mined is the No. 15 coal seam, with a thickness ranging from 3.8 to 4.6 m, averaging 4.2 m. The coal seam has a dip angle of 3–5°, making it a nearly horizontal seam, with a burial depth of 236 to 290 m. The mine uses a full-height, full-fall method for roof management, and the complex production conditions result in tight mining succession. Currently, to alleviate the issue of tight mining succession, while recovering the 15106 working face, the headgate# 15107 is being excavated with a 25 m section-protecting coal pillar left in between. The layout of the working face roadways is shown in Figure 3.
The roof above the working face is mostly sandstone, while the floor is composed of mudstone or sandstone. The No. 15 coal seam is black and powdery, mainly consisting of bright coal with some inclusions of mirror coal. It is characterized by developed joints and fissures, is fragile, has a glassy to weakly glassy luster, and is relatively light in weight. It is classified as a non-explosive coal seam. The comprehensive columnar diagram of the coal seam roof and floor is shown in Figure 4.

2.2. Roadway Support

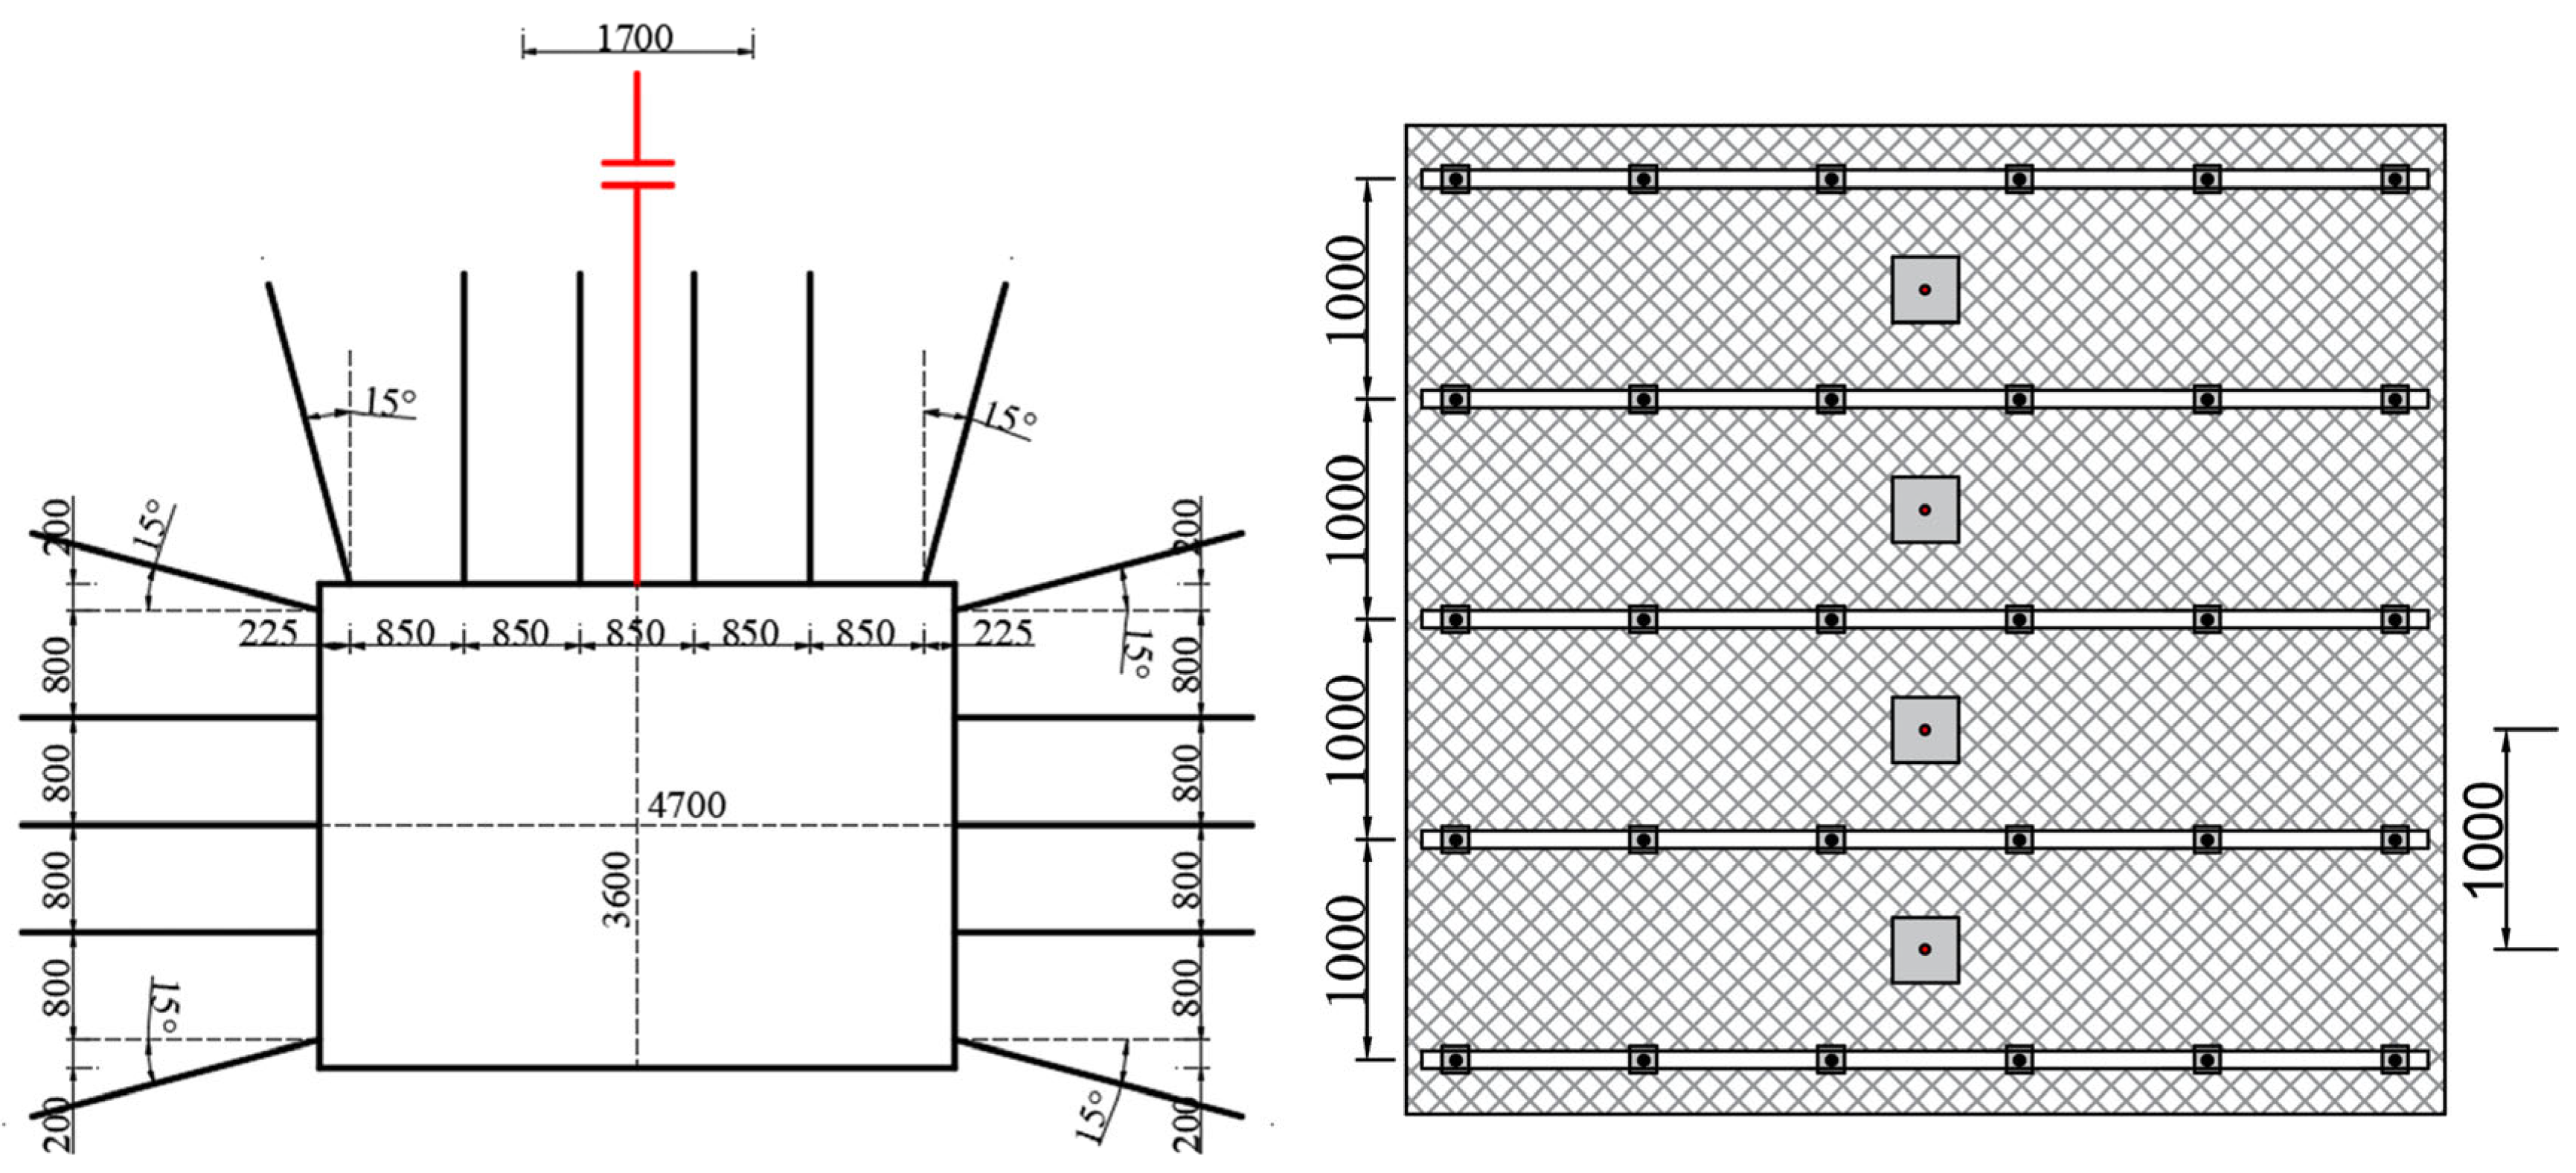
The cross-sectional dimensions of the headgate# 15107 are 4700 mm in width and 3600 mm in height. The support conditions of the headgate# 15107 are shown in Figure 5. The roof anchor cables used are φ 18.9 × 6300 mm mining anchor cables, arranged along the centerline of the roadway, with one cable per row and a spacing of 1000 mm between rows. The roof anchor rods used are φ 22 × 2400 threaded high-strength anchor rods, with a spacing of 850 × 1000 mm between rows. The two sides use φ 22 × 2000 threaded high-strength anchor rods, with a spacing of 800 × 1000 mm between rows. Adjacent anchor rods are interconnected using steel bar ladder beams.

3. The Theoretical Determination of Coal Pillar Width

During the advancement of the working face and the excavation of the roadway, both front abutment pressure and lateral abutment pressure are generated. In the environment of the gob-side entry driving TAWF, the section-protecting coal pillar will be affected by the combined stress from both pressures, leading to greater stress concentration in the coal pillar, which is more prone to severe damage and loss of bearing capacity. Therefore, selecting an appropriate coal pillar width is of great significance.
Based on the geological conditions of the working face, on-site investigations, and laboratory test results, the relevant physical and mechanical parameters, as well as the geometric parameters of the coal and rock mass, are obtained, as shown in Table 1.

3.1. Coal Pillar Stress Analysis

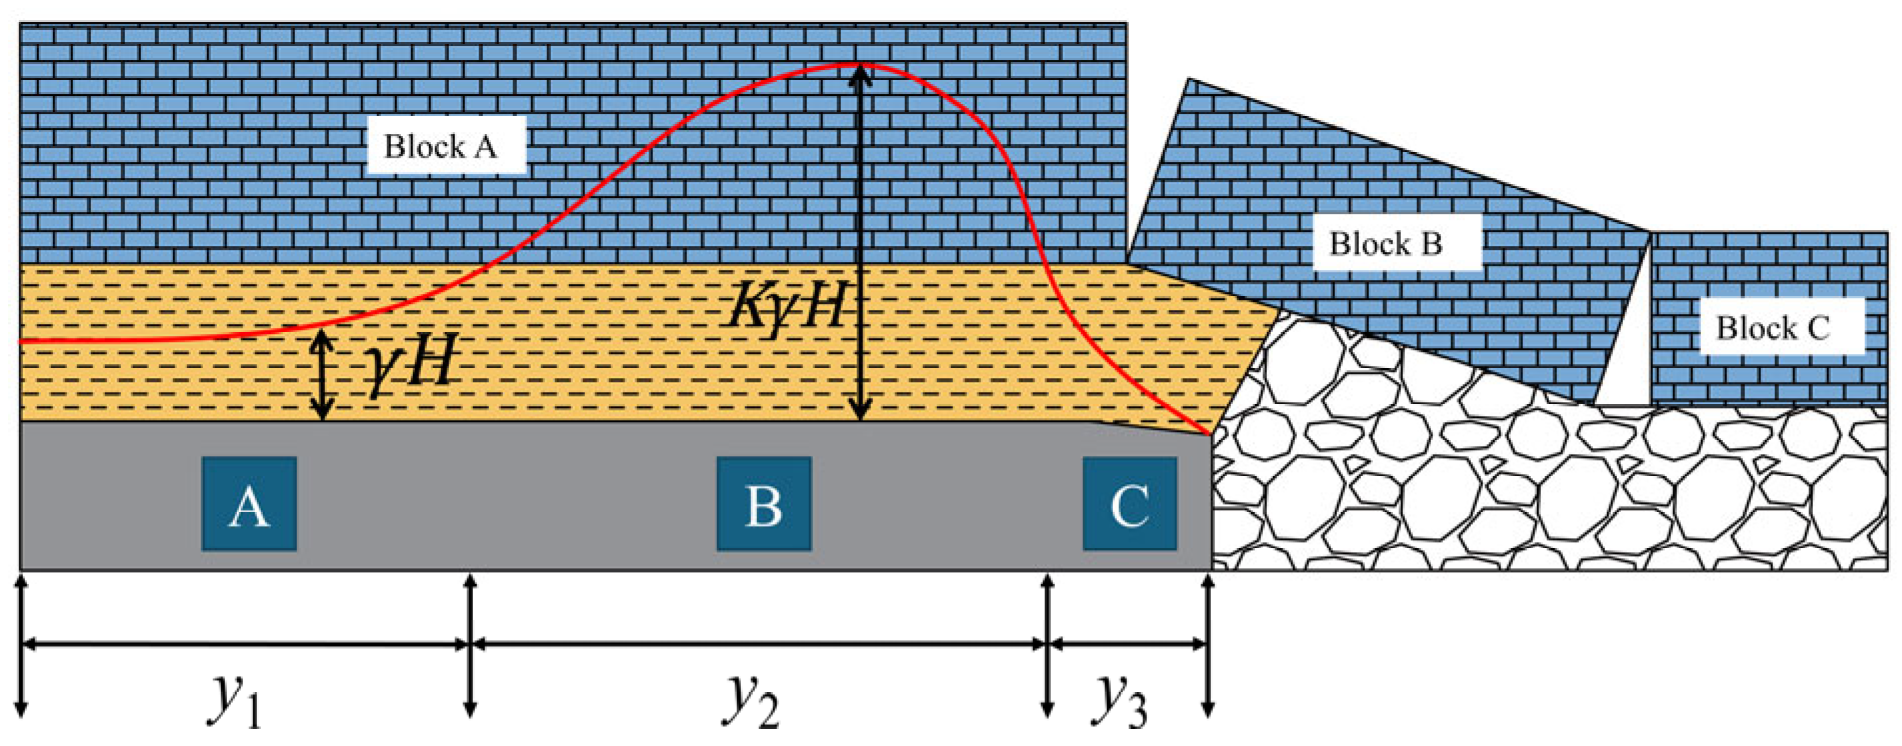
When the upper section is mined, as the working face continues to advance, the main roof breaks at the connection between its lateral side and the lower working face, forming an arc-triangular block B. One end of block B rotates and comes into contact with the gangue in the goaf, while the other end breaks inside the coal wall of the lower section. Although Block B has a certain degree of rotational subsidence, it interlocks with block C and rock mass A to form an articulated structure, as shown in Figure 6.
As shown in Figure 6, the entry can be arranged at positions A, B, and C. Based on the lateral stress influence range of the gob, it is known that A, B, and C are located in the original rock stress zone, stress increase zone, and stress decrease zone, respectively. When the gob-side entry is arranged at position A, the entry is in the original rock stress zone, where the pressure it bears is low, making it easier to maintain. However, this results in a significant waste of coal resources due to the excessively wide coal pillar left. When the gob-side entry is arranged at position B, the entry is in the stress increase zone, making maintenance difficult. When the gob-side entry is arranged at position C, it is in the stress decrease zone, which not only reduces coal resource loss but also facilitates roadway maintenance.

3.2. The Theory of Internal and External Stress Fields

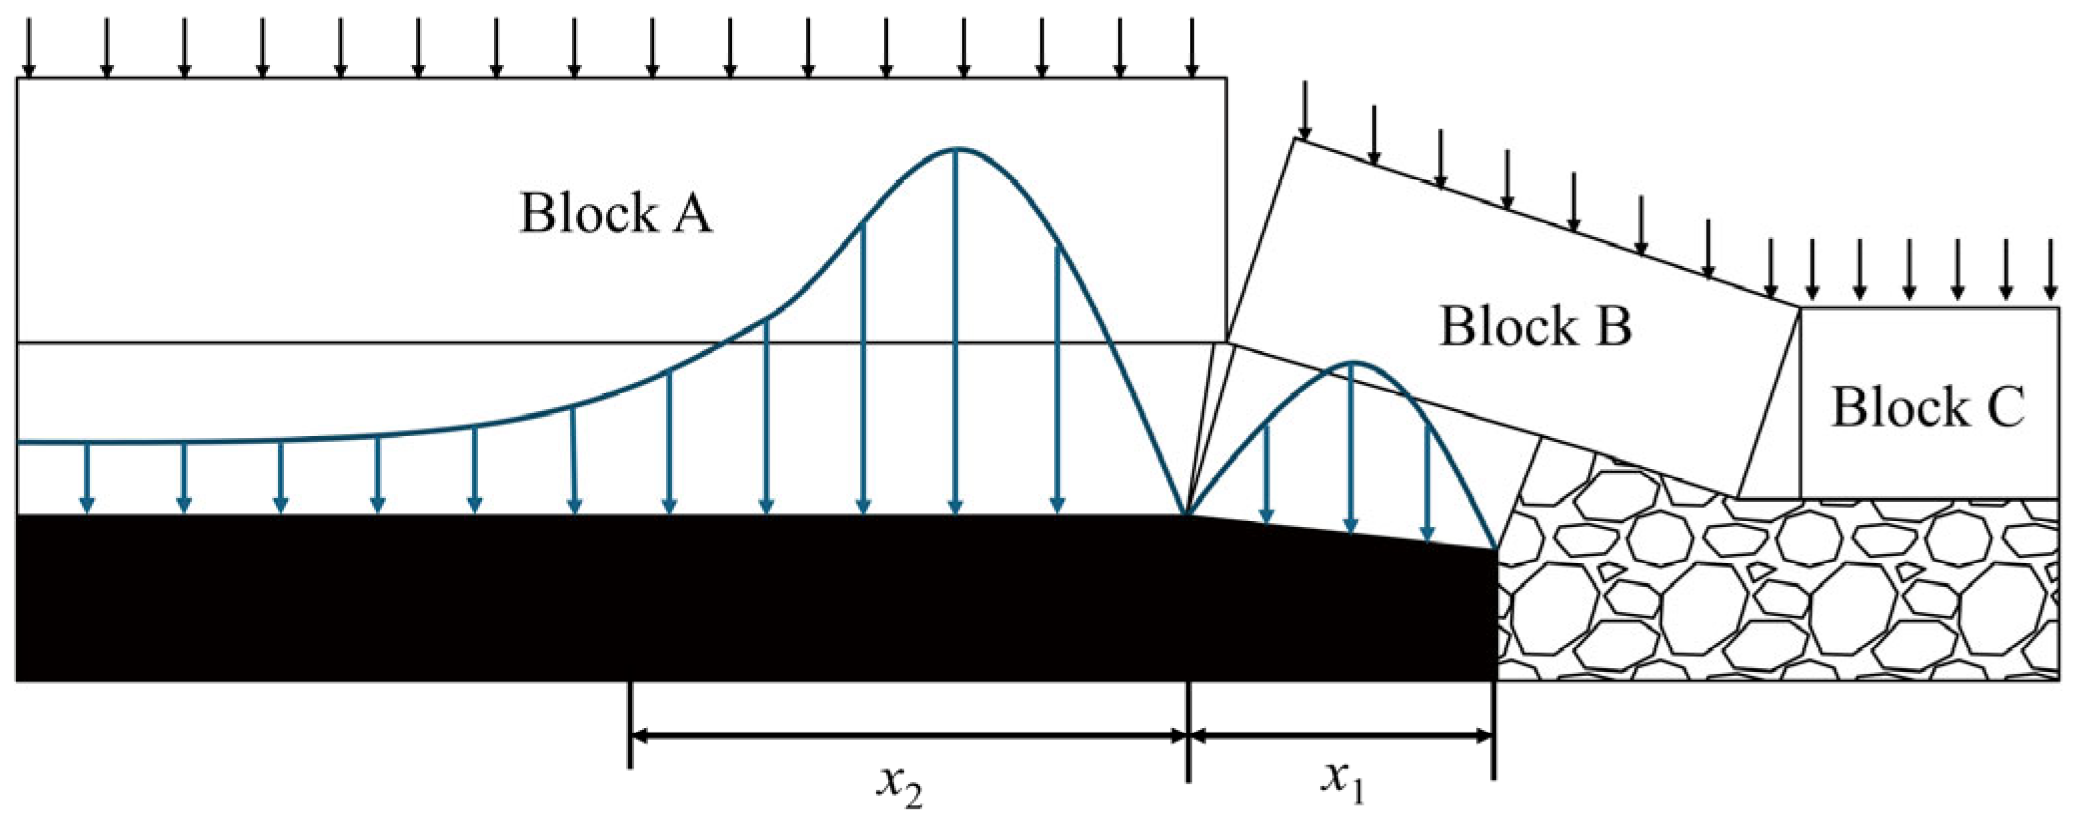
As the previous section of the working face advances, the immediate roof collapse fills the gob, causing the main roof to fracture, rotate, and subside. The fractured rock blocks hinge together, forming a masonry beam structure. If the main roof fractures, the stress is divided into two regions at the fracture point, namely, the internal and external stress fields. As shown in Figure 7, x1 represents the internal stress field, and x2 represents the external stress field. At this point, rock block B is subjected to a horizontal leftward thrust from rock block C, as well as vertical upward support from the gob’s waste rock. Therefore, the internal stress field mainly carries stress from part of the weight of the fractured rock block B, while the external stress field primarily carries stress from the self-weight of rock block A and the weight of the overlying strata.
To ensure the stability of the surrounding rock in the roadway, the roadway should be located in the stress reduction zone. Therefore, studying the distribution range of the internal stress field is of great significance. The self-weight w of the main roof plate when the working face is initially subjected to pressure is equal to the vertical supporting pressure F distributed within the range of the “internal stress field” along the surrounding coal body of the gob [14].
According to study [15], the following can be obtained:
σ y = G x y x
In the equation, Gx is the coal mass stiffness at a distance x from the coal rib, Pa; and yx is the deformation of the coal mass at a distance x from the coal rib, m.
To simplify the analysis, a linear treatment is applied to the distributions Gx and yx:
G x = G 0 x 1 x , y x = y 0 x 1 ( x 1 x )
In the equation, x1 is the width of the internal stress field, m; G0 is the maximum stiffness of the coal body within the internal stress field, Pa; and y0 is the maximum deformation of the coal body within the internal stress field, m.
By combining Equations (1) and (2), the following can be obtained:
0 x 1 σ y d x = G 0 y 0 x 1 6
According to study [15], the following can be obtained:
G 0 y 0 x 1 6 = L B 1 h j γ
In the equation, L is the length of the working face, m; B1 is the first weighting interval of the previous working face, m; hj is the thickness of the main roof, m; and γ is the specific weight of the main roof, kN/m3.
According to the geometric relationship [16], the following can be obtained:
y 0 x 0 = M h 0 ( k p 1 ) L 0
In the equation, M is the mining thickness of the coal seam, m; h0 is the thickness of the immediate roof rock, m; KP is the coefficient of the immediate roof rock; and L0 is the span of the overhanging beam, m.
The stiffness G0 of the coal body in the plastic state can be expressed by the following Equation [17]:
G 0 = E 2 ( 1 + υ ) ξ
In the equation, E is the elastic modulus of the coal body, Pa; υ is the Poisson’s ratio; and ξ is the influence coefficient.
By solving the above equations simultaneously, the expression for the width of the internal stress field x1 can be obtained by
x 1 = 12 γ h j L B 1 L 0 ξ ( 1 + υ ) E M h 0 ( k p 1 )
According to the geological conditions of the 15107 working face, the main roof density γ is 25 kN/m3, the working face length L is 175 m, the span of the overhanging beam L0 is 18.3~22.3 m, the thickness of the main roof rock layer hj is 8.1 m, the first weighting interval B1 of the previous working face is 41.8~46.4 m, the Poisson’s ratio υ is 0.3, the influence coefficient ξ is 0.8, the coal body elastic modulus E is 2.5 GPa, the mining thickness of the coal seam M is 4.2 m, the thickness of the immediate roof layer h0 is 7 m, and the swelling coefficient KP is 1.4. Substituting the data into the formula, the range of the internal stress field is obtained as 9.83~11.43 m.

3.3. Theoretical Calculation of Reasonable Coal Pillar Width

If the coal pillar is too wide, it will lead to significant waste of coal resources; if it is too narrow, the pillar is highly prone to fracturing after roadway excavation. To minimize coal loss caused by excessively wide pillars and to avoid placing the roadway in a high-stress zone, a narrow coal pillar of appropriate width should be reserved. The reasonable width is shown in Figure 8.
According to the limit equilibrium theory [18], the empirical formula for determining the reasonable width B of a narrow coal pillar is as follows:
B = 1.15 ( X 1 + X 2 )
In the equation, B is the reasonable width of the narrow coal pillar, m; X1 is the effective length of the anchor bolts in the coal pillar rib of the roadway, m; X2 is the width of the fractured zone on the gob side of the coal pillar caused by mining in the upper section, m.
The calculation method for X2 is as follows [19]:
X 2 = m A 2 tan φ 0 ln ( k γ H + C 0 / tan φ 0 C 0 / tan φ 0 + P x / A )
In the equation, m is the mining height of the coal seam, m; A is the lateral pressure coefficient, where A = υ/(1 − υ), and υ is Poisson’s ratio; φ0 is the internal friction angle of the coal seam (°); C0 is the cohesion of the coal seam, MPa; k is the stress concentration factor, taken as 2.5; γ is the average bulk density of the rock, 25 kN/m3; H is the burial depth of the roadway, m; and px is the support resistance on the coal rib—if the side support of the gob in the upper section has been removed, px may be taken as 0, MPa.
According to the geological conditions of the mine, the coal seam thickness of the 15107 working face is 4.2 m, Poisson’s ratio is 0.3, internal friction angle at the coal seam interface is 32°, cohesion is 1.78 MPa, stress concentration factor is 2.5, average rock density is 25 kN/m3, roadway depth is 236 m, and support resistance is 0.2 MPa. The effective length of the anchor bolts is 2 m. Substituting the values into the formula, X2 is obtained as 2.42 m. Substituting X2 and X1 into the formula, the reasonable width of the coal pillar B is obtained as 5.08 m. To ensure the anchor bolts on the coal pillar side of the roadway can be reliably anchored in the coal body, the final reasonable narrow coal pillar width is determined to be 6 m.
According to the above theoretical analysis, setting the coal pillar width to 6 m and placing the roadway within the internal stress field range x1 = 9.83~11.43 m makes the roadway easier to maintain.

4. Establishment and Calibration of the Numerical Model

4.1. Numerical Model

A FLAC3D numerical model [20] was constructed according to the mine’s geological conditions, as illustrated in Figure 9a. The model dimensions are 300 m (length) × 175 m (width) × 48.2 m (height). The strain-softening model was used to simulate the coal pillar, the Mohr–Coulomb model was used for other rock layers, and the double-yield model was applied to simulate the gradual compaction of the caving zone in the gob. The model base was fixed, normal displacements around the model were constrained, and an equivalent vertical stress load of 5.9 MPa (corresponding to a depth of 236 m) was applied at the top to simulate the overburden, as shown in Figure 9b. The mechanical parameters of each rock stratum in the model are listed in Table 2.

4.2. Calibration of the Double-Yield Model for the Gob

4.2.1. Characteristics of Roof Rock

As the working face advances, the immediate roof collapses and fills the gob, and the collapsed roof strata are referred to as the caving zone. The height of the caving zone is related to the mining height and roof lithology [21], and can be calculated using the following:
H k = 100 M S 1 M + S 2
In the equation, Hk is the height of the caving zone, m; M is the mining height of the coal seam, m; S1 and S2 are correction coefficients, with parameter values shown in Table 3.
According to the roof lithology observed at the 15106 working face, the uniaxial compressive strength of the roof exceeds 40 MPa. Therefore, S1 and S2 are taken as 2.1 and 16, respectively. With a mining height M of 4.2 m, substituting the above values into Equation (10) yields a caving zone height of 16.9 m.
After the working face is mined, the overlying strata collapse, and the caved rock mass gradually becomes compacted. The compaction mechanism of the collapsed rock is closely related to the stability of the gob [22]. Studies by domestic and international scholars [23,24] indicate that the Salamon equation provides a reasonable description of the stress–strain relationship of caved rock in the gob and has been widely adopted.
The vertical stress borne by the caved rock mass in the gob can be expressed as follows:
σ = E 0 ε g 1 ε g / ε g m a x
In the equation, σ is the vertical stress acting on the caved rock mass in the gob, MPa; E0 is the initial tangent modulus of the caved rock mass, GPa; εg is the strain induced under vertical stress; and εgmax is the maximum strain under vertical stress.
The maximum strain of the caved rock mass in the gob is as follows:
ε g m a x = k g 1 k g
In the equation, kg is the bulking factor of the caved rock mass in the gob.
The bulking factor of the caved rock mass in the gob can be obtained using Equation (13)
k g = H k + M H k
According to reference [25], the initial tangent modulus is expressed as follows:
E 0 = 10.39 σ c 1.04 k g 7.7
In the equation, σc is the uniaxial compressive strength of the caved rock mass, MPa.
Simultaneously solving Equations (11), (12) and (14) yields the stress–strain expression for the rock mass under the double-yield model
σ = 10.39 ( k g 1 ) ε g σ c 1.04 ( k g 1 k g ε g ) k g 7.7
According to laboratory tests, the average uniaxial compressive strength of the siltstone roof is 43.7 MPa. Based on the height of the caving zone and the coal seam, the bulking factor of the caved rock mass is calculated as 1.248. Substituting this into the above equation yields a maximum strain of 0.198. By inputting the relevant parameters, the stress–strain values for the caved rock in the gob under the double-yield model can be obtained. The stress–strain parameters for the caved rock under the double-yield model are listed in Table 4.

4.2.2. Determination of Model Parameters

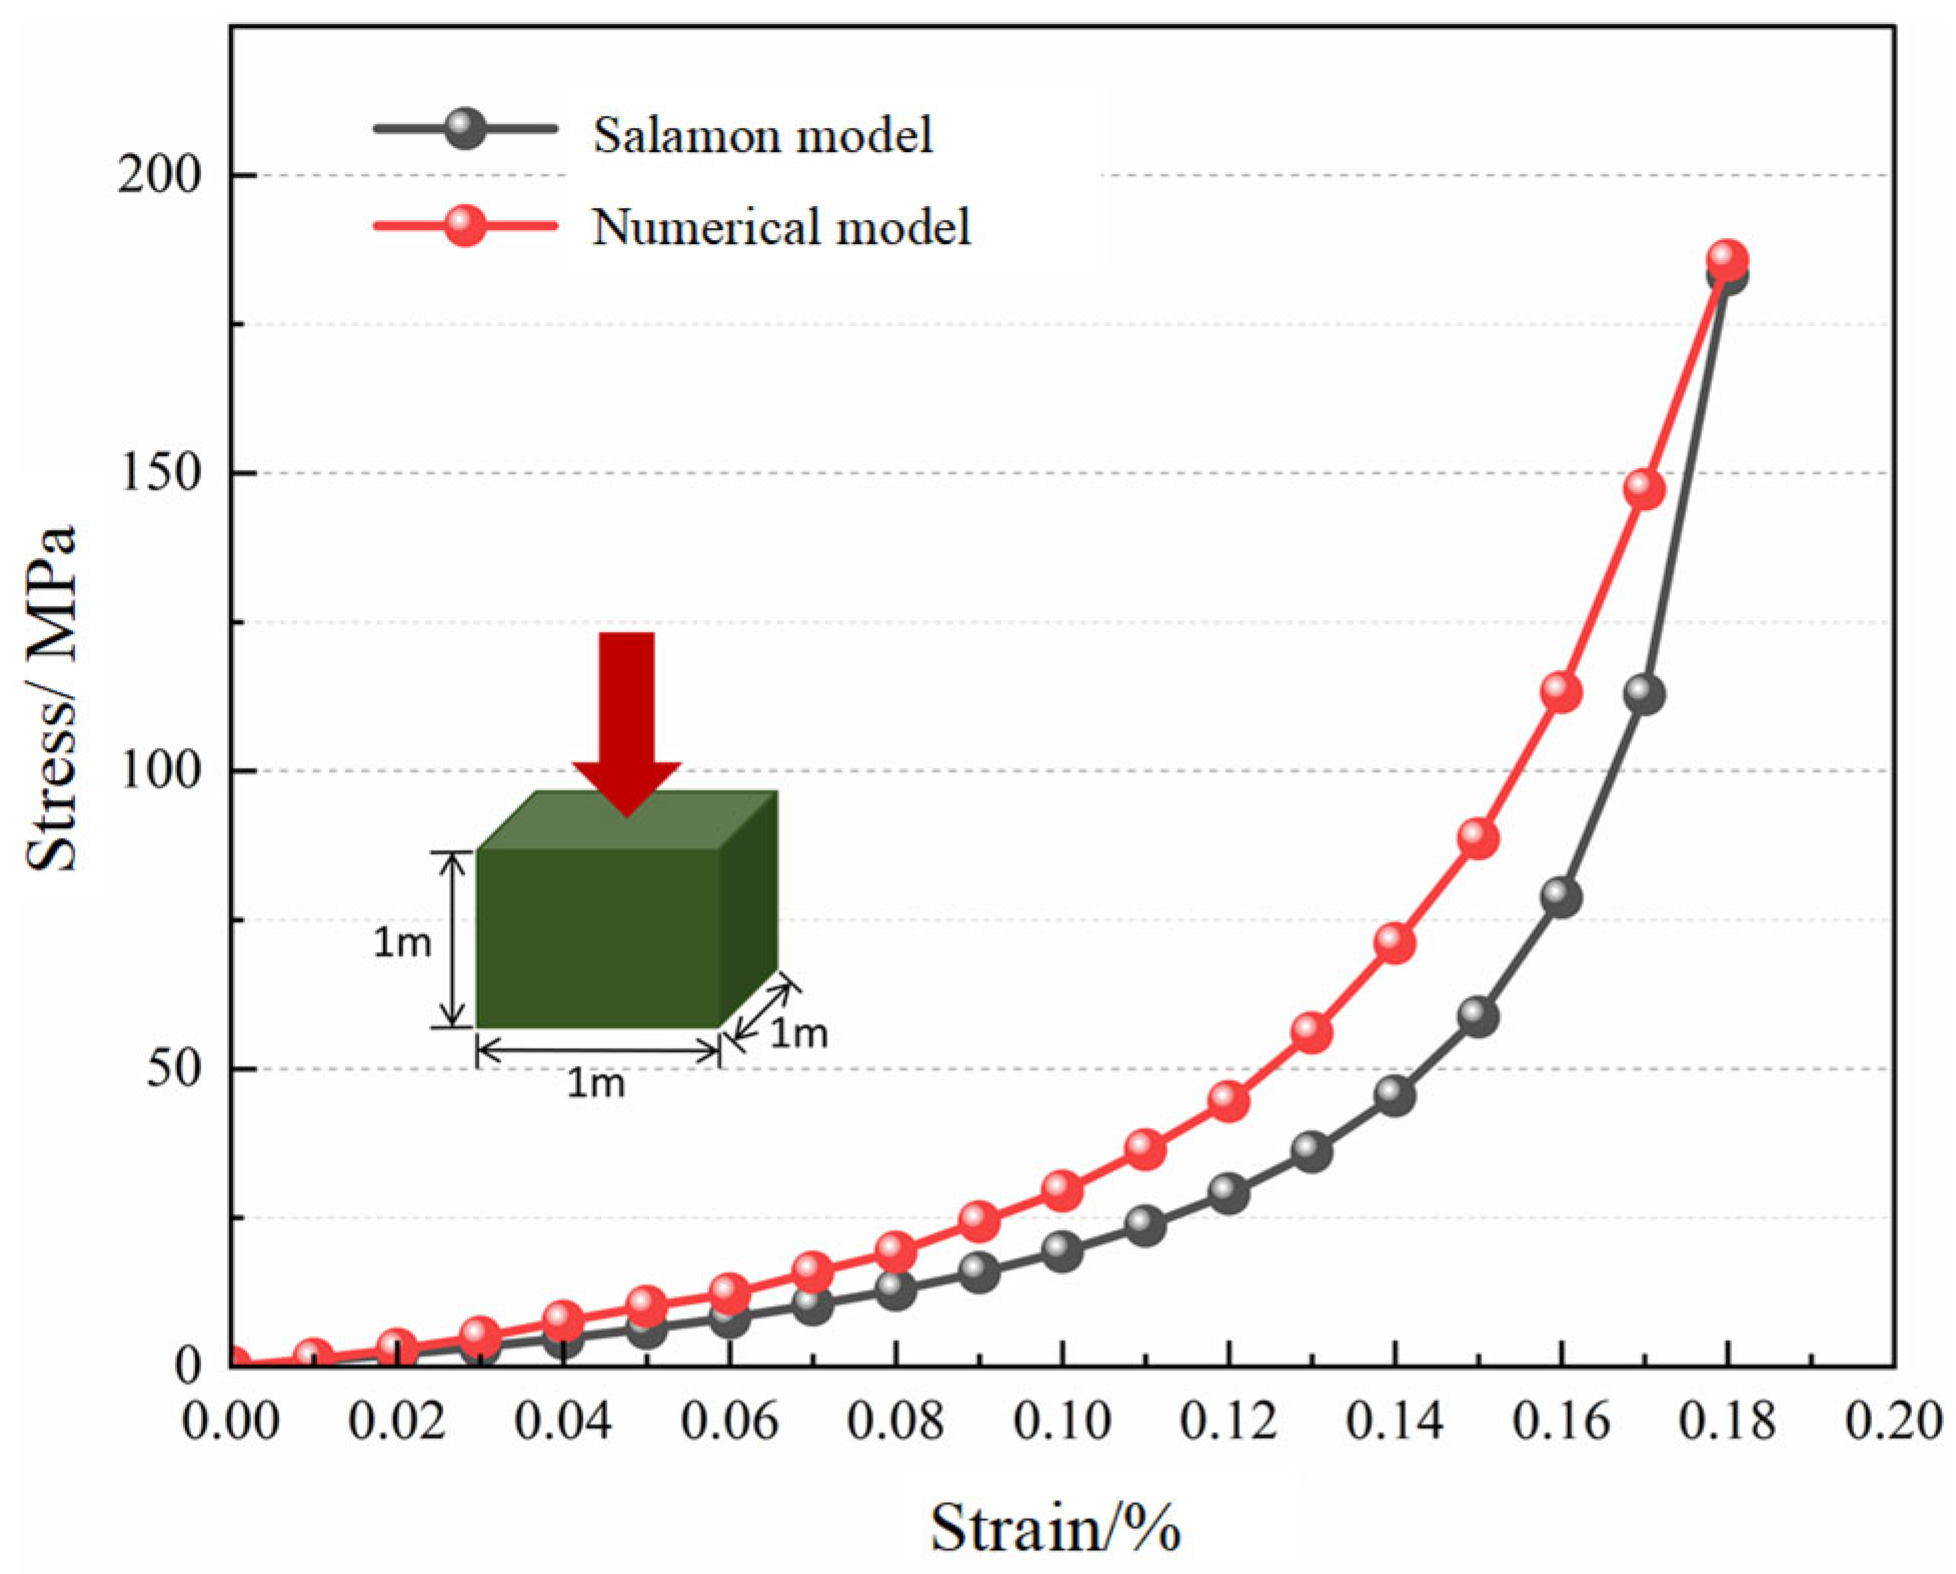
The double-yield model is commonly assigned to simulate the gradual stress recovery process in the caved rock mass of the gob [26]. A calibration model with dimensions of 1 m × 1 m × 1 m was constructed in FLAC3D 7.0 version. The bottom was fixed, the sides were constrained, and a vertical displacement load of 10−5 m/step was applied at the top. The model parameters were calibrated through repeated adjustments. As shown in Figure 10, the resulting stress–strain curve of the numerical model closely matches the theoretical calculation. The final mechanical parameters of the caved rock mass in the gob are listed in Table 5.

4.2.3. Validation of the Double-Yield Model for the Gob

To verify the rationality of the stress environment in the gob, the 15106 working face was mined using the double-yield model. The simulation was run to equilibrium, and a monitoring line was set at y = 150 m to record vertical stress. The monitoring results are shown in Figure 11. As shown in the figure, the vertical stress in the gob initially decreases, then gradually increases as compaction progresses, eventually recovering to the original in situ stress level. The maximum vertical stress occurs 7 m from the edge of the gob, with a peak value of 21.6 MPa. The simulation results show high consistency with previous studies [5,27,28], confirming the validity of the double-yield model and the mechanical parameters assigned to the gob material.

4.3. Calibration of the Strain-Softening Model for Coal Pillars

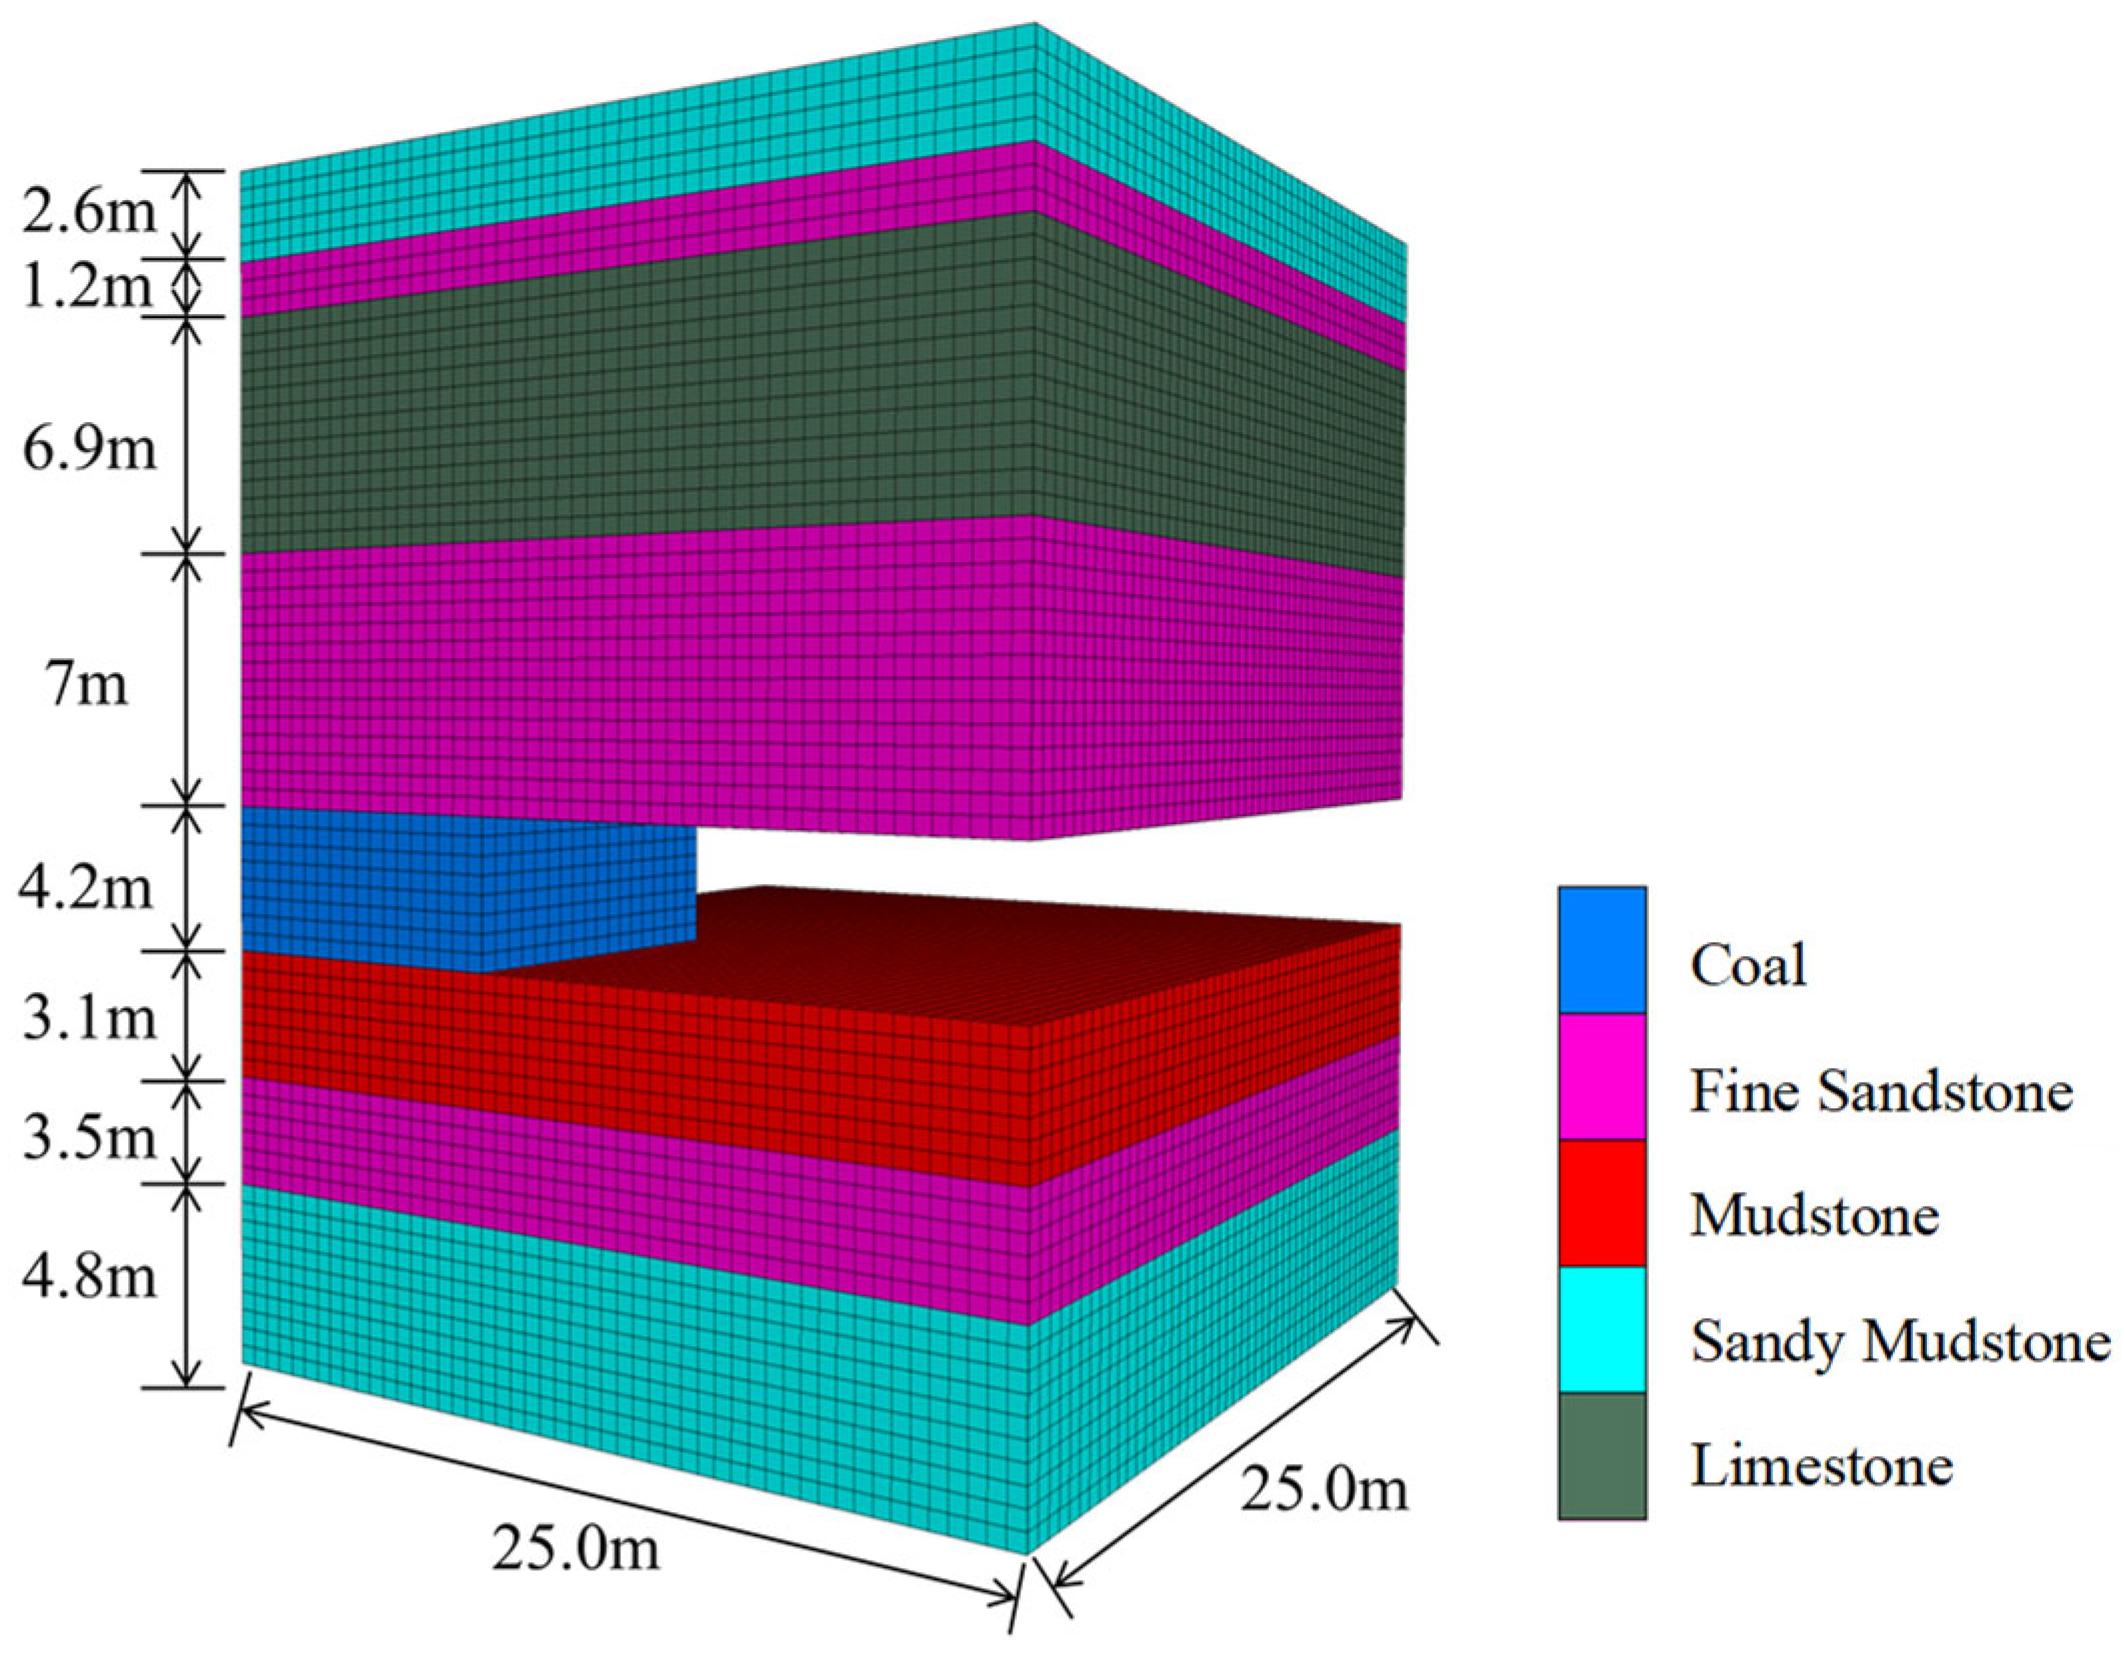
The strain-softening model is widely used by researchers to characterize the deformation and failure behavior of yielded coal pillars under the influence of mining-induced stresses [29,30,31]. A model with dimensions 25 m × 25 m × 33.3 m was built in FLAC3D, with roof and floor heights of 17.7 m and 11.4 m, respectively, and a coal pillar height of 4.2 m, as shown in Figure 12. The mesh elements for the roof, floor, and coal pillar were defined as 0.5 m × 0.5 m × 0.5 m. The bottom and sides of the model were fixed in displacement, and a constant loading rate of 1 × 10⁻⁵ m/step was applied at the top. By varying the coal pillar width, the bearing behavior under different width-to-height ratios was simulated. The coal seam was assigned a strain-softening constitutive model, while the roof and floor strata were modeled using the Mohr–Coulomb constitutive model.
In the strain-softening model, the cohesion and internal friction angle of the coal pillar change with deformation, which more accurately reflects the actual mechanical behavior of the pillar [31,32,33]. The mechanical parameters adopted in the model are shown in Table 6. At a strain level of 1%, the cohesion of the coal pillar degrades to 0.68 MPa, and the internal friction angle drops to 19°.
The strain-softening model parameters for the coal pillar are shown in the table below.
The results calculated using the Salamon formula closely match the measured average strength of coal pillars, and the formula has been widely applied for calibrating coal pillar strength. The Salamon formula is expressed as follows:
S = 7.716 W 0.46 H 0.66
In the equation, S is the coal pillar strength, MPa; W is the width of the coal pillar, m; and H is the height of the coal pillar, m.
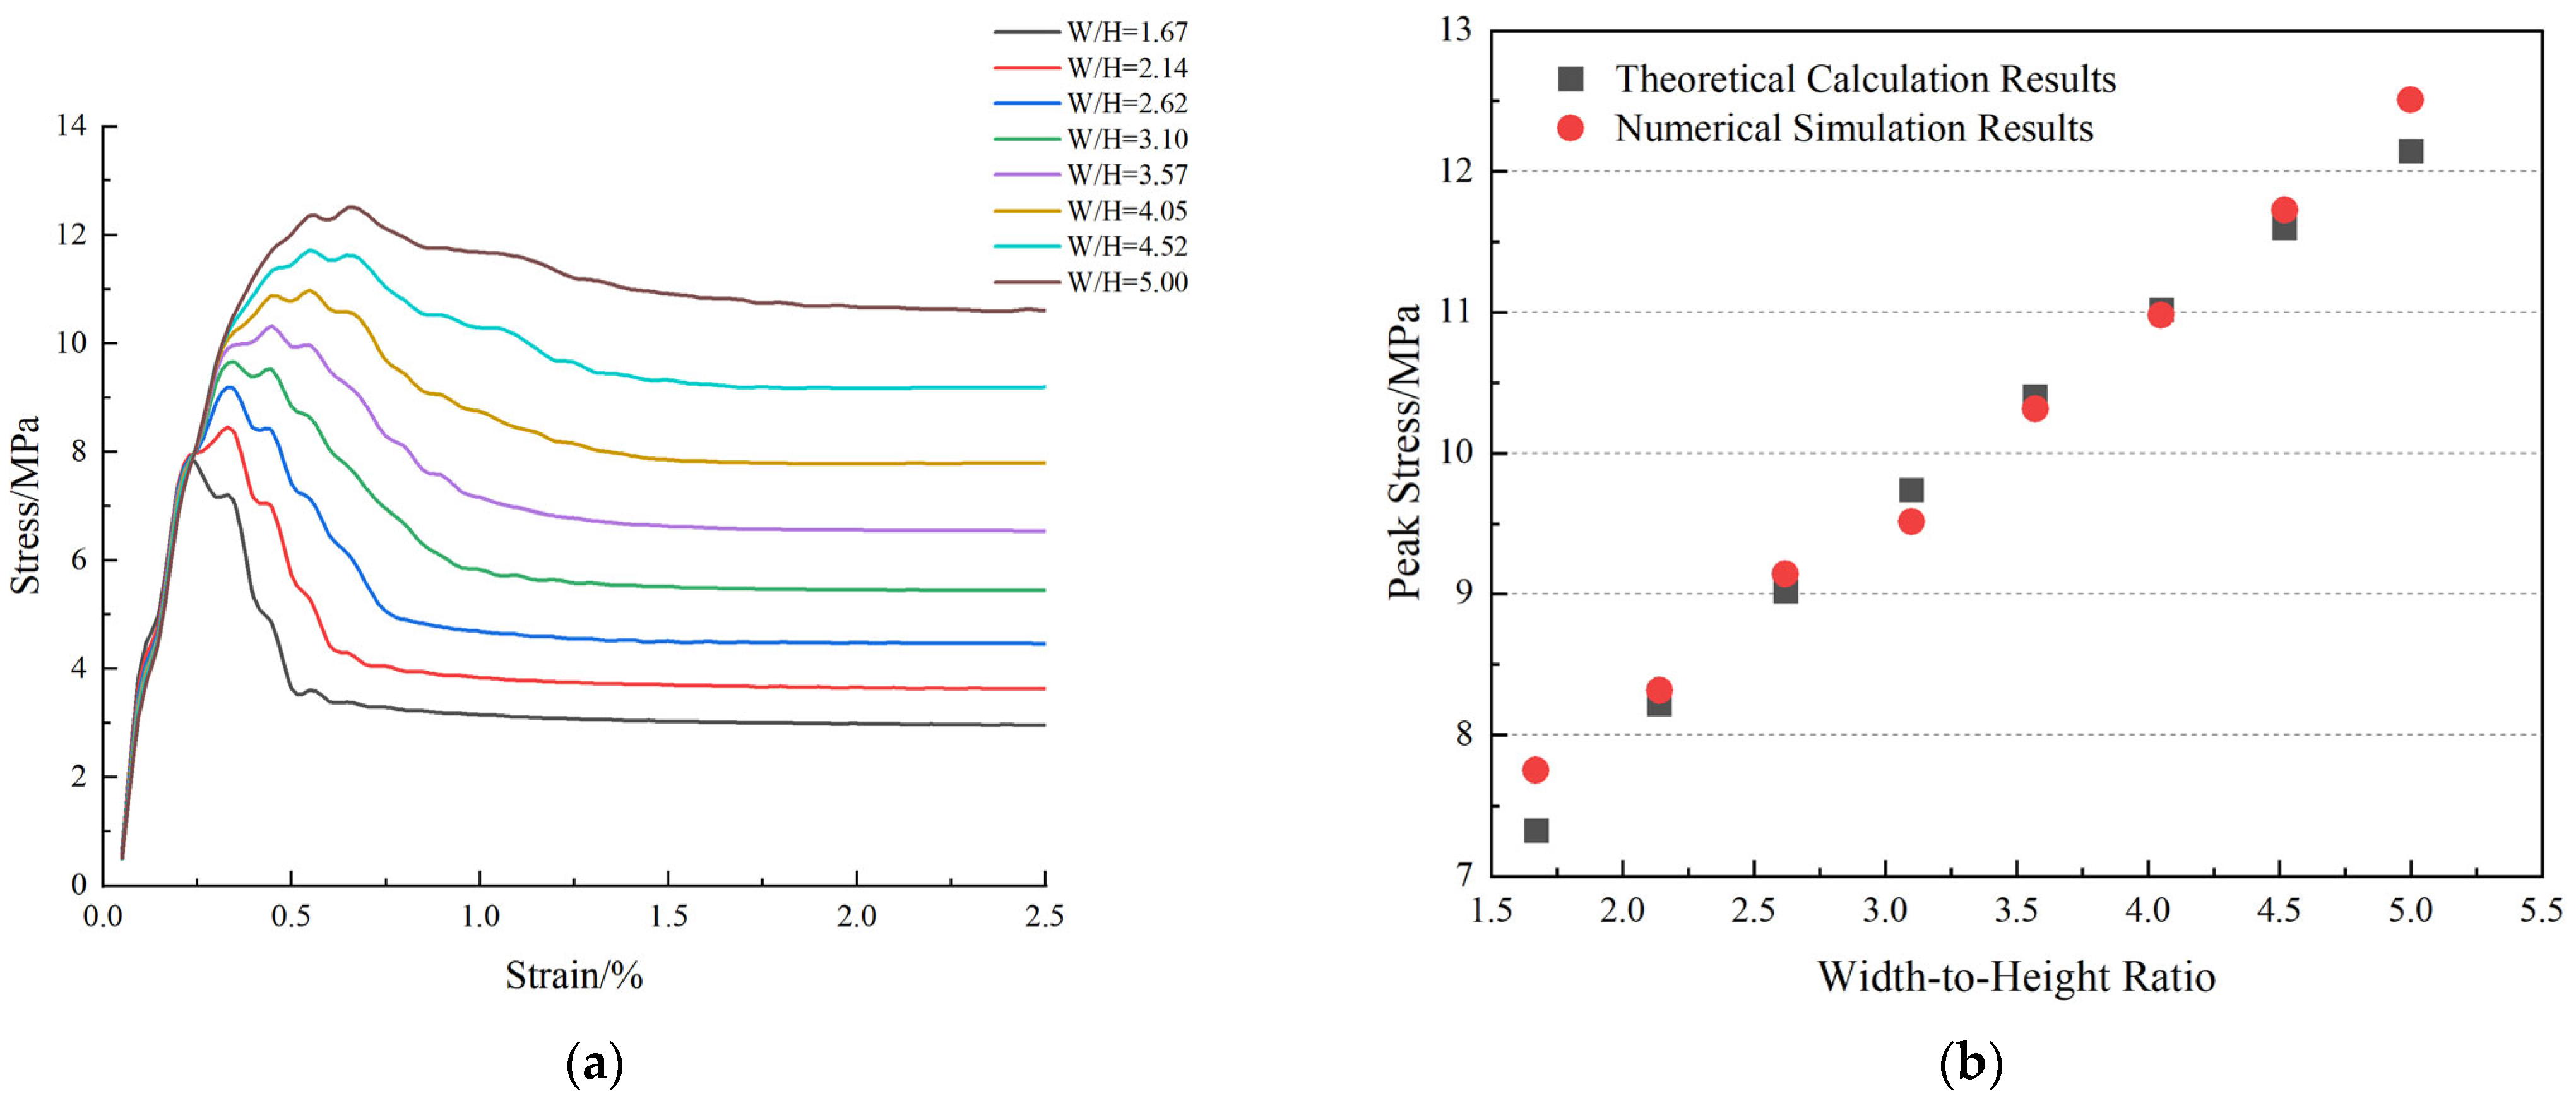
As shown in Figure 13a, simulations were conducted for coal pillars with width-to-height ratios of 1.67, 2.41, 2.62, 3.10, 3.57, 4.05, 4.52, and 5.00. The figure shows that the stress–strain curves for coal pillars with different width-to-height ratios exhibit similar patterns—stress increases with strain, then decreases, and finally stabilizes. This behavior corresponds to three stages: the elastic phase, the yield deformation phase, and the failure phase. As the width-to-height ratio increases, both the peak stress and residual strength of the coal pillar increase. The peak stresses corresponding to different width-to-height ratios are 7.75, 8.32, 9.14, 9.52, 10.31, 10.98, 11.73, and 12.51 MPa. Curve fitting was performed between the peak stresses from the numerical simulations and those calculated using the Salamon formula. As shown in Figure 13b, the numerical results closely match the theoretical values, validating the accuracy of the model.

4.4. Validation of Global Model

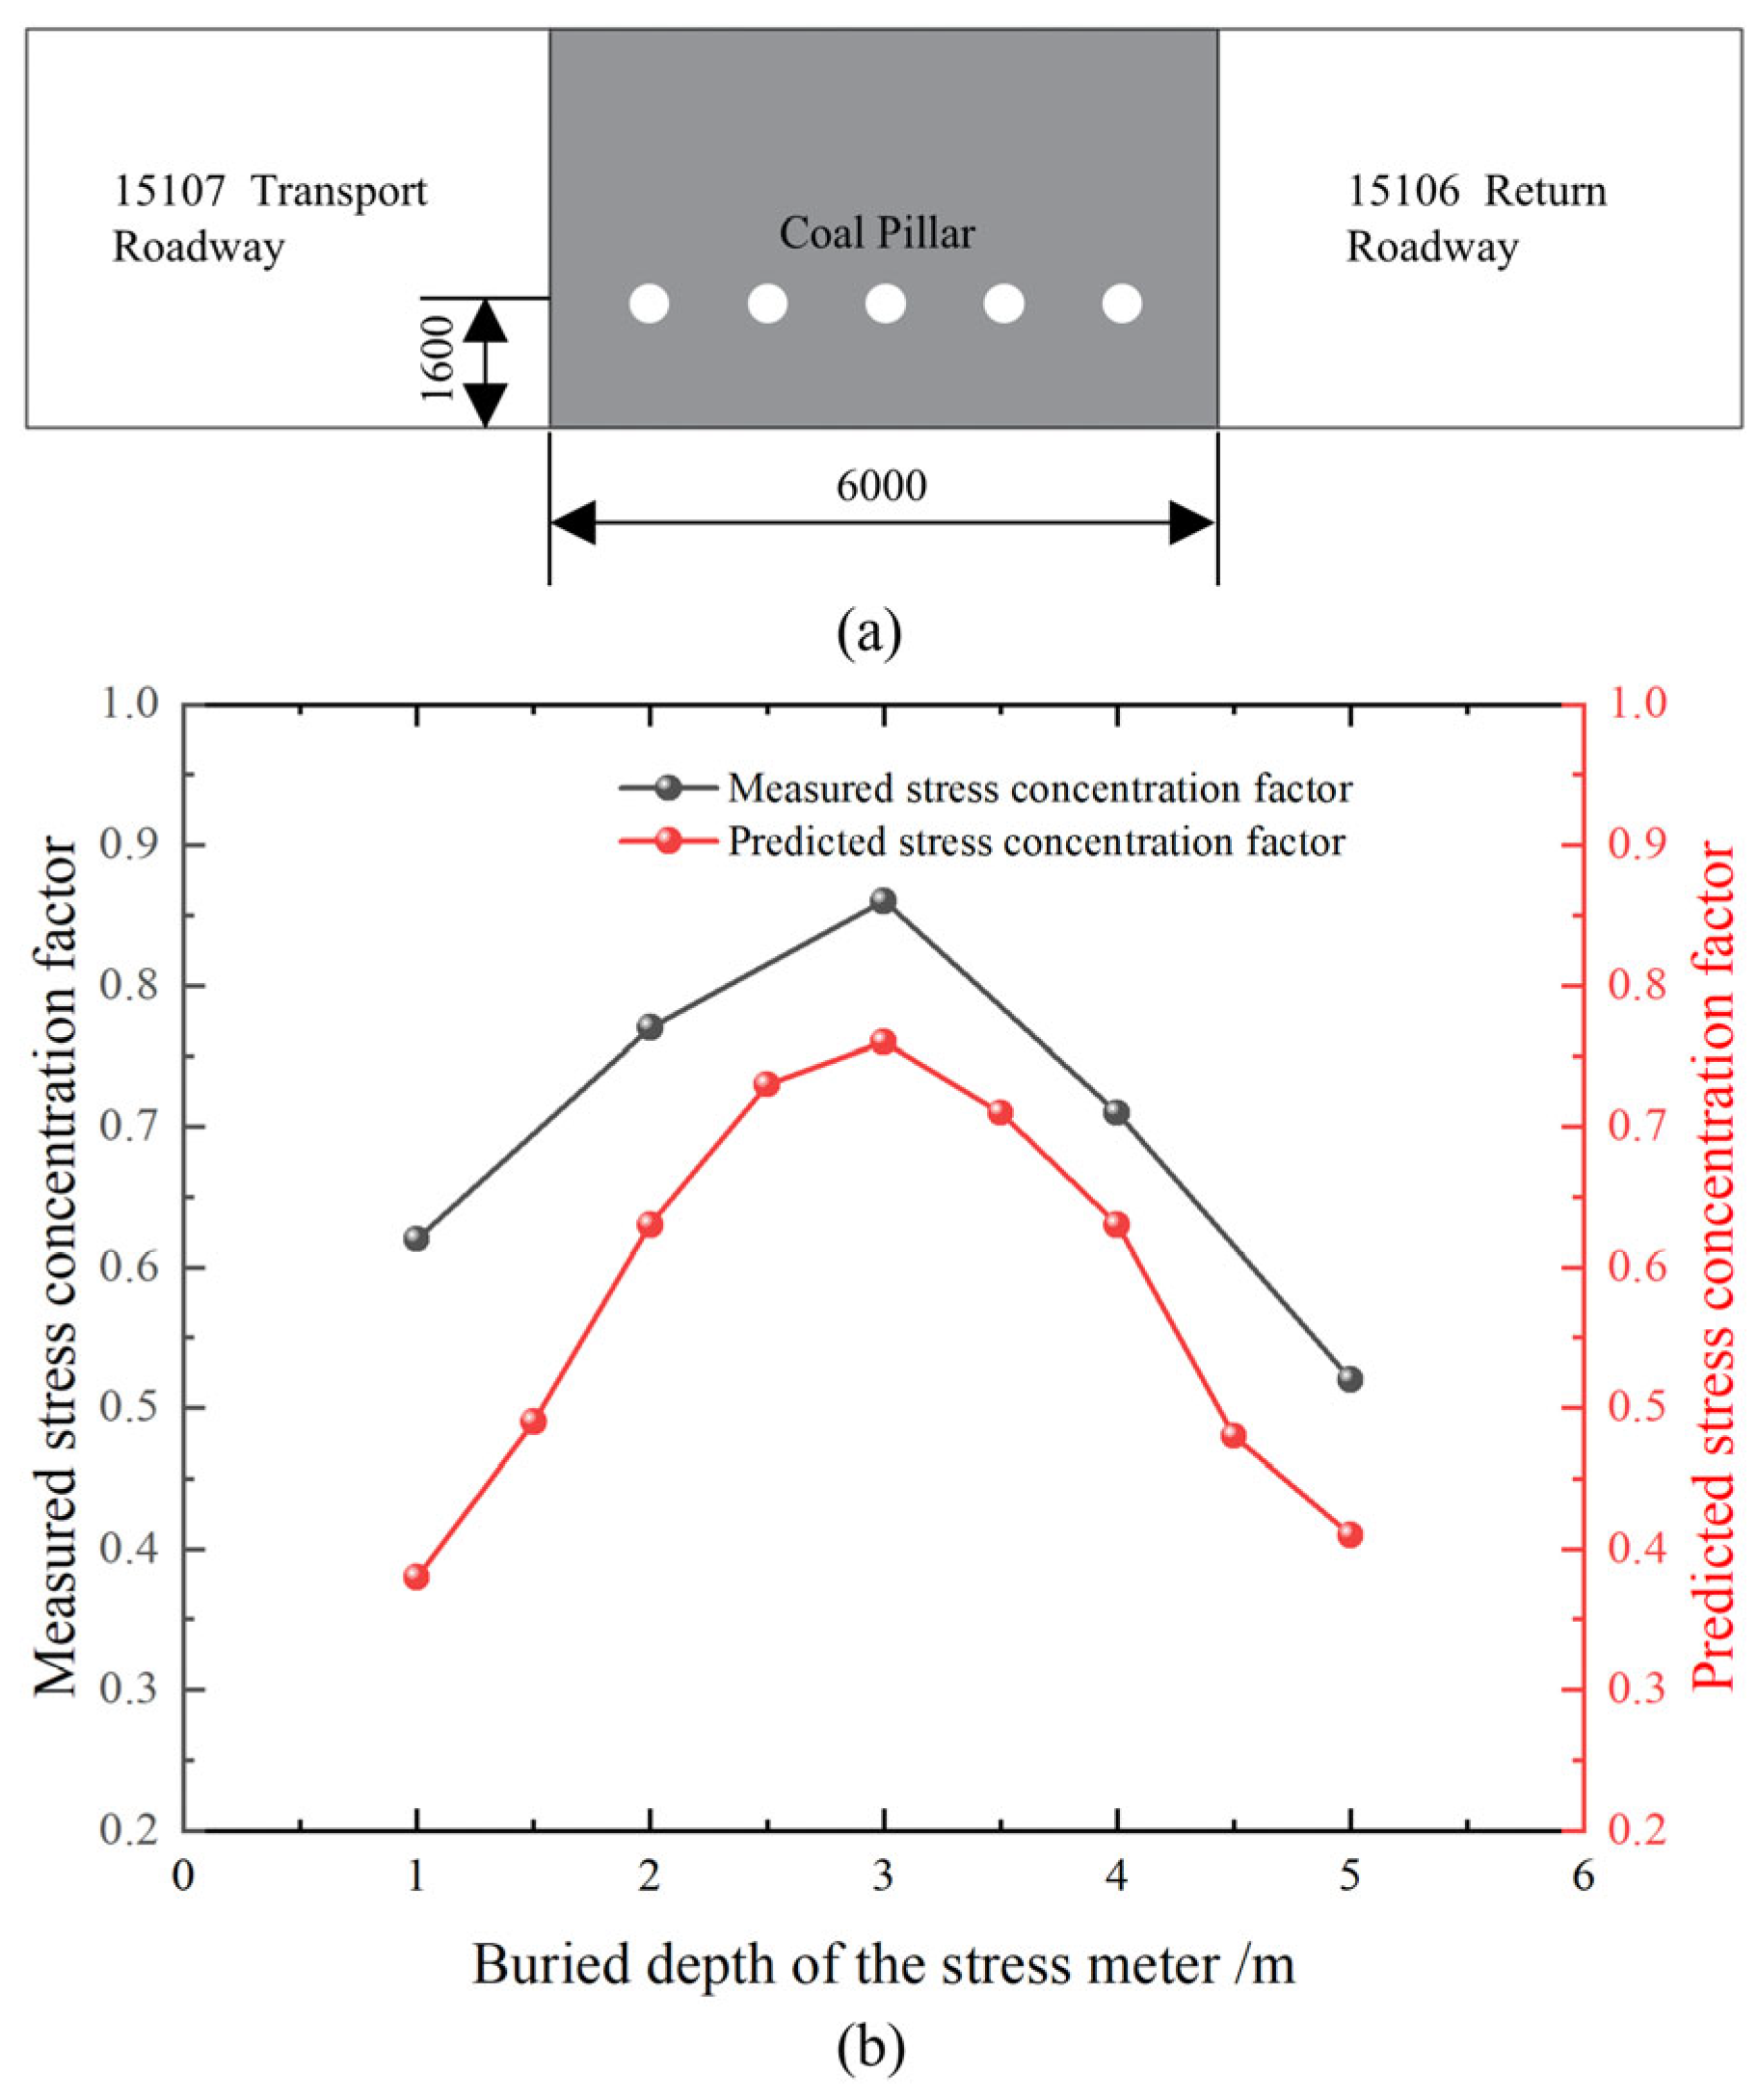
To verify the rationality of the global model, the numerical simulation data were compared with the on-site measured data. Stress meters were installed at five different positions of the coal pillar, 100 m away from the open-off cut of the 15106 working face, to obtain the vertical stress distribution. Along the horizontal direction of the coal pillar, the buried depth of each stress meter gradually increased from 1 m to 5 m, while the horizontal spacing of these sensors along the roadway was 1000 mm, as shown in Figure 14a. The field monitoring results were compared with the numerical simulation results, as shown in Figure 14b. It can be seen from the figure that the numerical simulation results are roughly consistent with the field monitoring results. The stress concentration factor gradually increases from the surface to the interior of the coal pillar. The consistency between the simulation results and the measured results confirms the reliability of the established numerical model.

5. Simulation Results and Analysis

The stability of the headgate# 15107 is primarily influenced by the excavation period facing the 15106 working face, the tunneling period along the gob, and the advancement of the 15107 working face itself. Based on the above analysis, a coal pillar width of 6 m is deemed reasonable. Therefore, this study simulates coal pillar widths of 4, 5, 6, 8, 10, and 25 m. This study investigates the stress evolution of the coal pillar and deformation characteristics of the surrounding rock under different widths during various periods to determine the most appropriate coal pillar width.

5.1. During the Roadway Driving near the Advancing 15106 Working Face

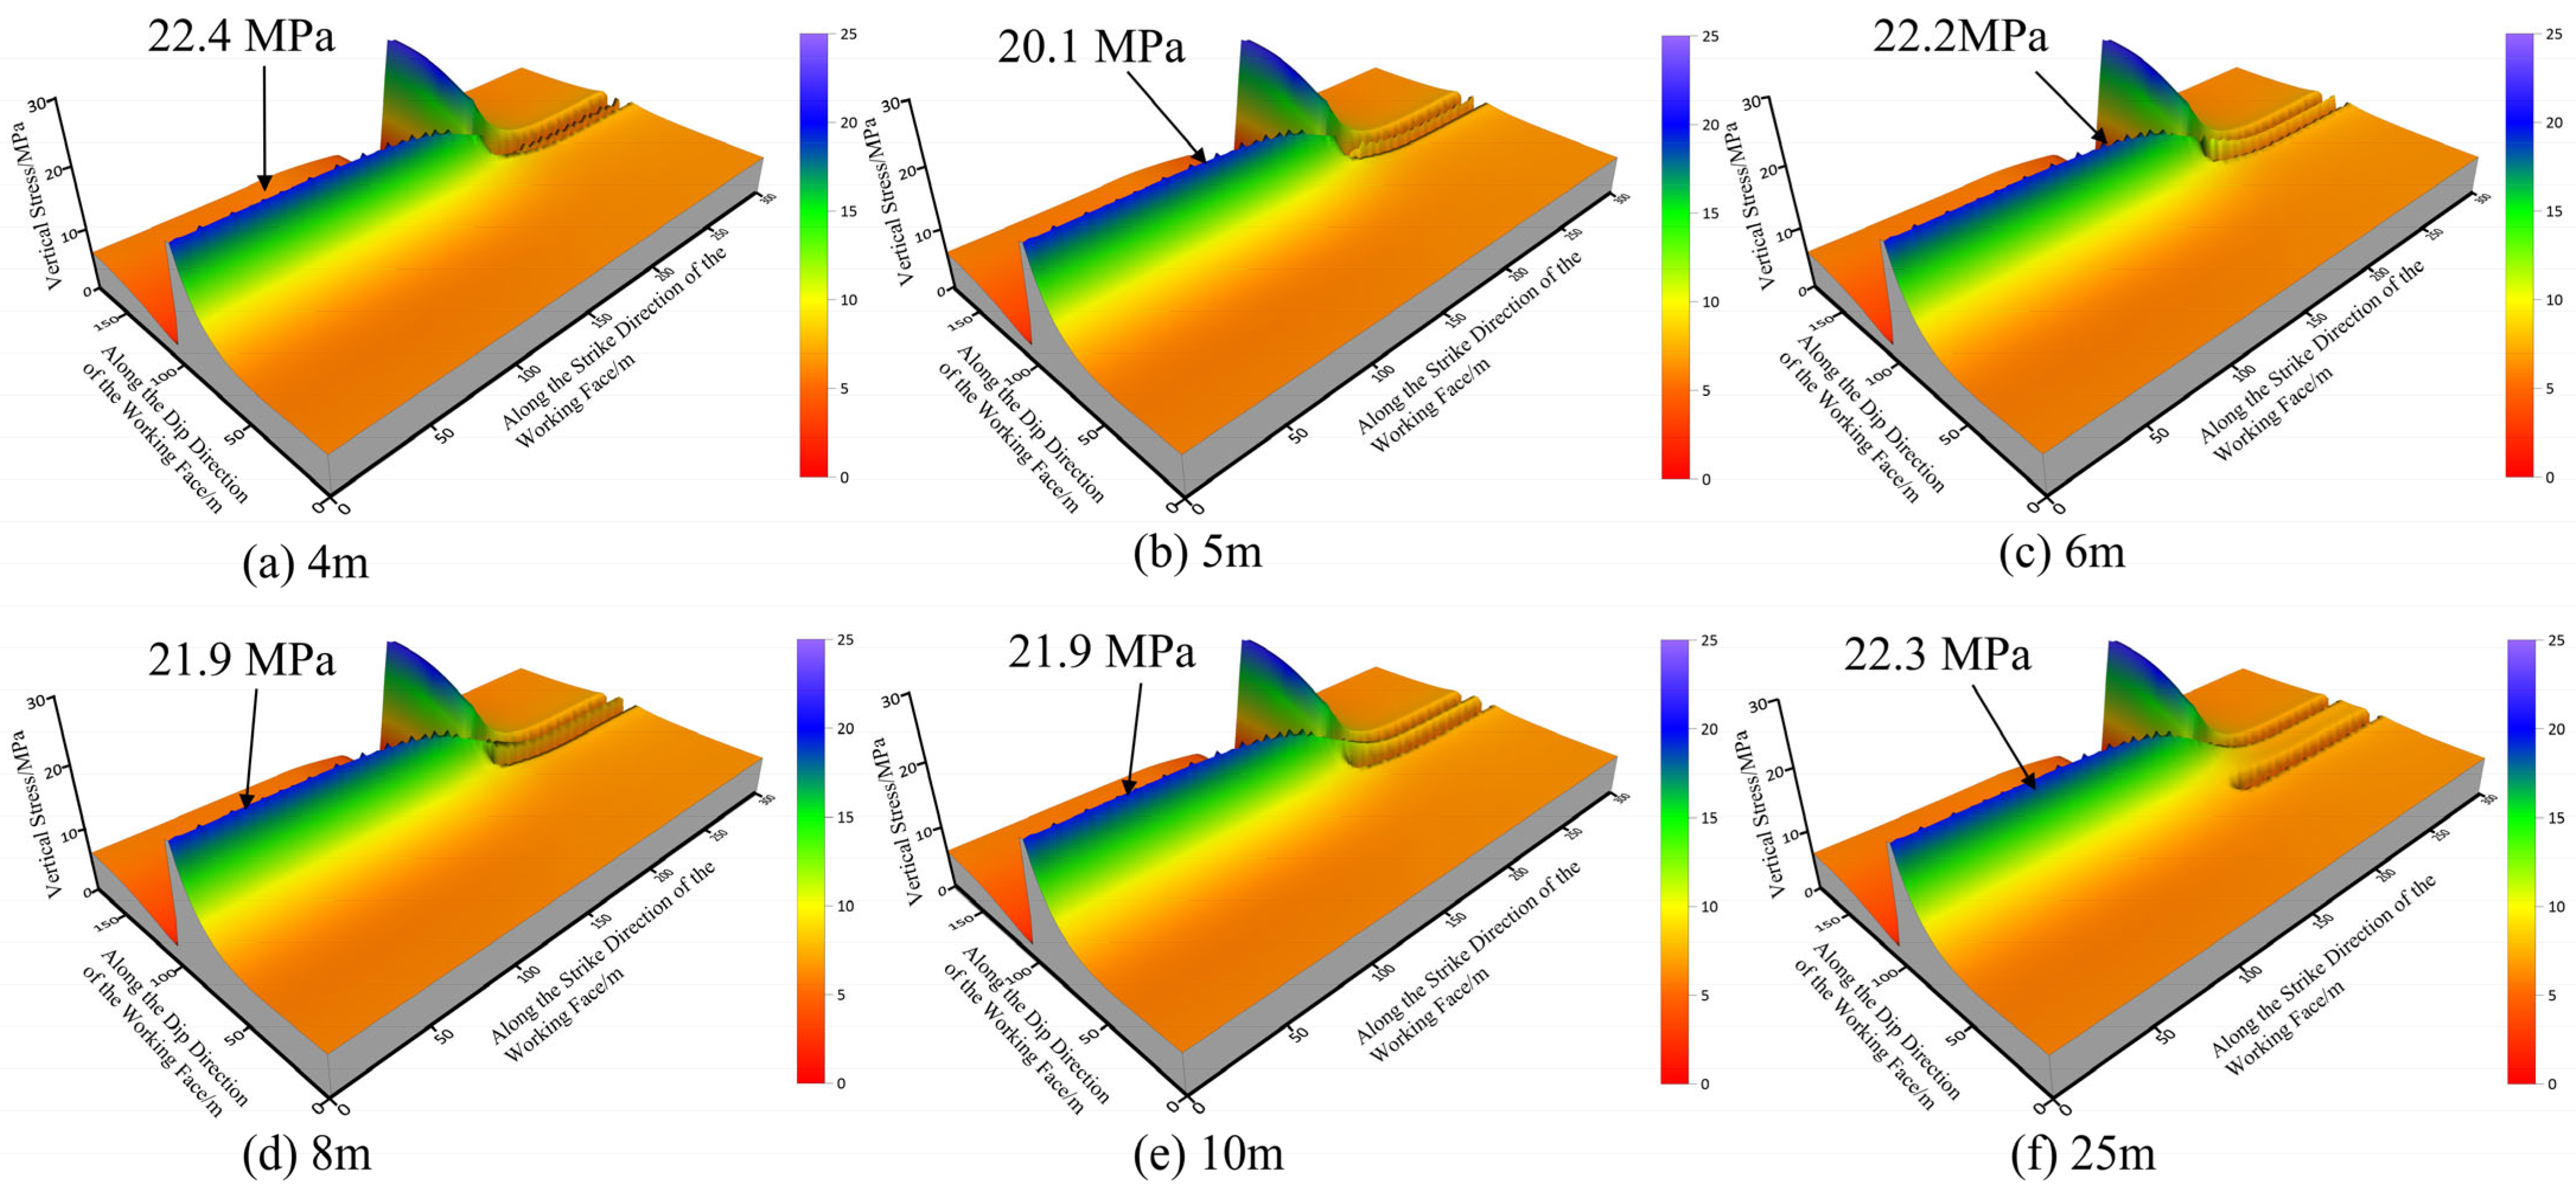
When the 15106 working face and the headgate# 15107 had each advanced 120 m, leaving a 60 m separation, the excavation of the headgate# 15107 was halted, while the working face continued to advance. When the working face advanced to 180 m, it intersected with the headgate# 15107. The stress distribution of the surrounding rock at the point of mining–excavation intersection is shown in Figure 15. As shown in Figure 15, stress concentration zones are located in front and to the sides of the working face. The stress peaks occur on the solid coal side adjacent to the gob. The corresponding peak stress values are 22.4, 20.1, 22.2, 21, 21.7, and 22.3 MPa, respectively.
A monitoring section was set up at the intersection of mining and excavation to obtain the vertical stress distribution on the roadway and coal pillar under different pillar widths, as shown in Figure 16.
As shown in Figure 16, due to the lateral abutment pressure induced by working face advancement and roadway excavation, stress concentration occurs around the roadway and coal pillar, while the roof and floor of the headgate# 15107 are subject to minimal stress. With increasing coal pillar width, the vertical stress concentration zone gradually shifts from the 15107 working face side to the gob-side of the coal pillar. When the coal pillar is 4 m wide, stress is mainly concentrated on the working face side, with a small concentration zone, indicating that the pillar is likely damaged and incapable of bearing the overlying strata load effectively. When the pillar width is 5 m, stress concentration occurs, but the range is not significantly larger than that of the 4 m pillar, indicating limited load-bearing capacity. When the pillar width exceeds 5 m, the internal stress concentration area increases with width, peak stress gradually decreases, and the pillar stability improves accordingly. To ensure roadway stability, the width of the sectional coal pillar should be greater than 5 m.
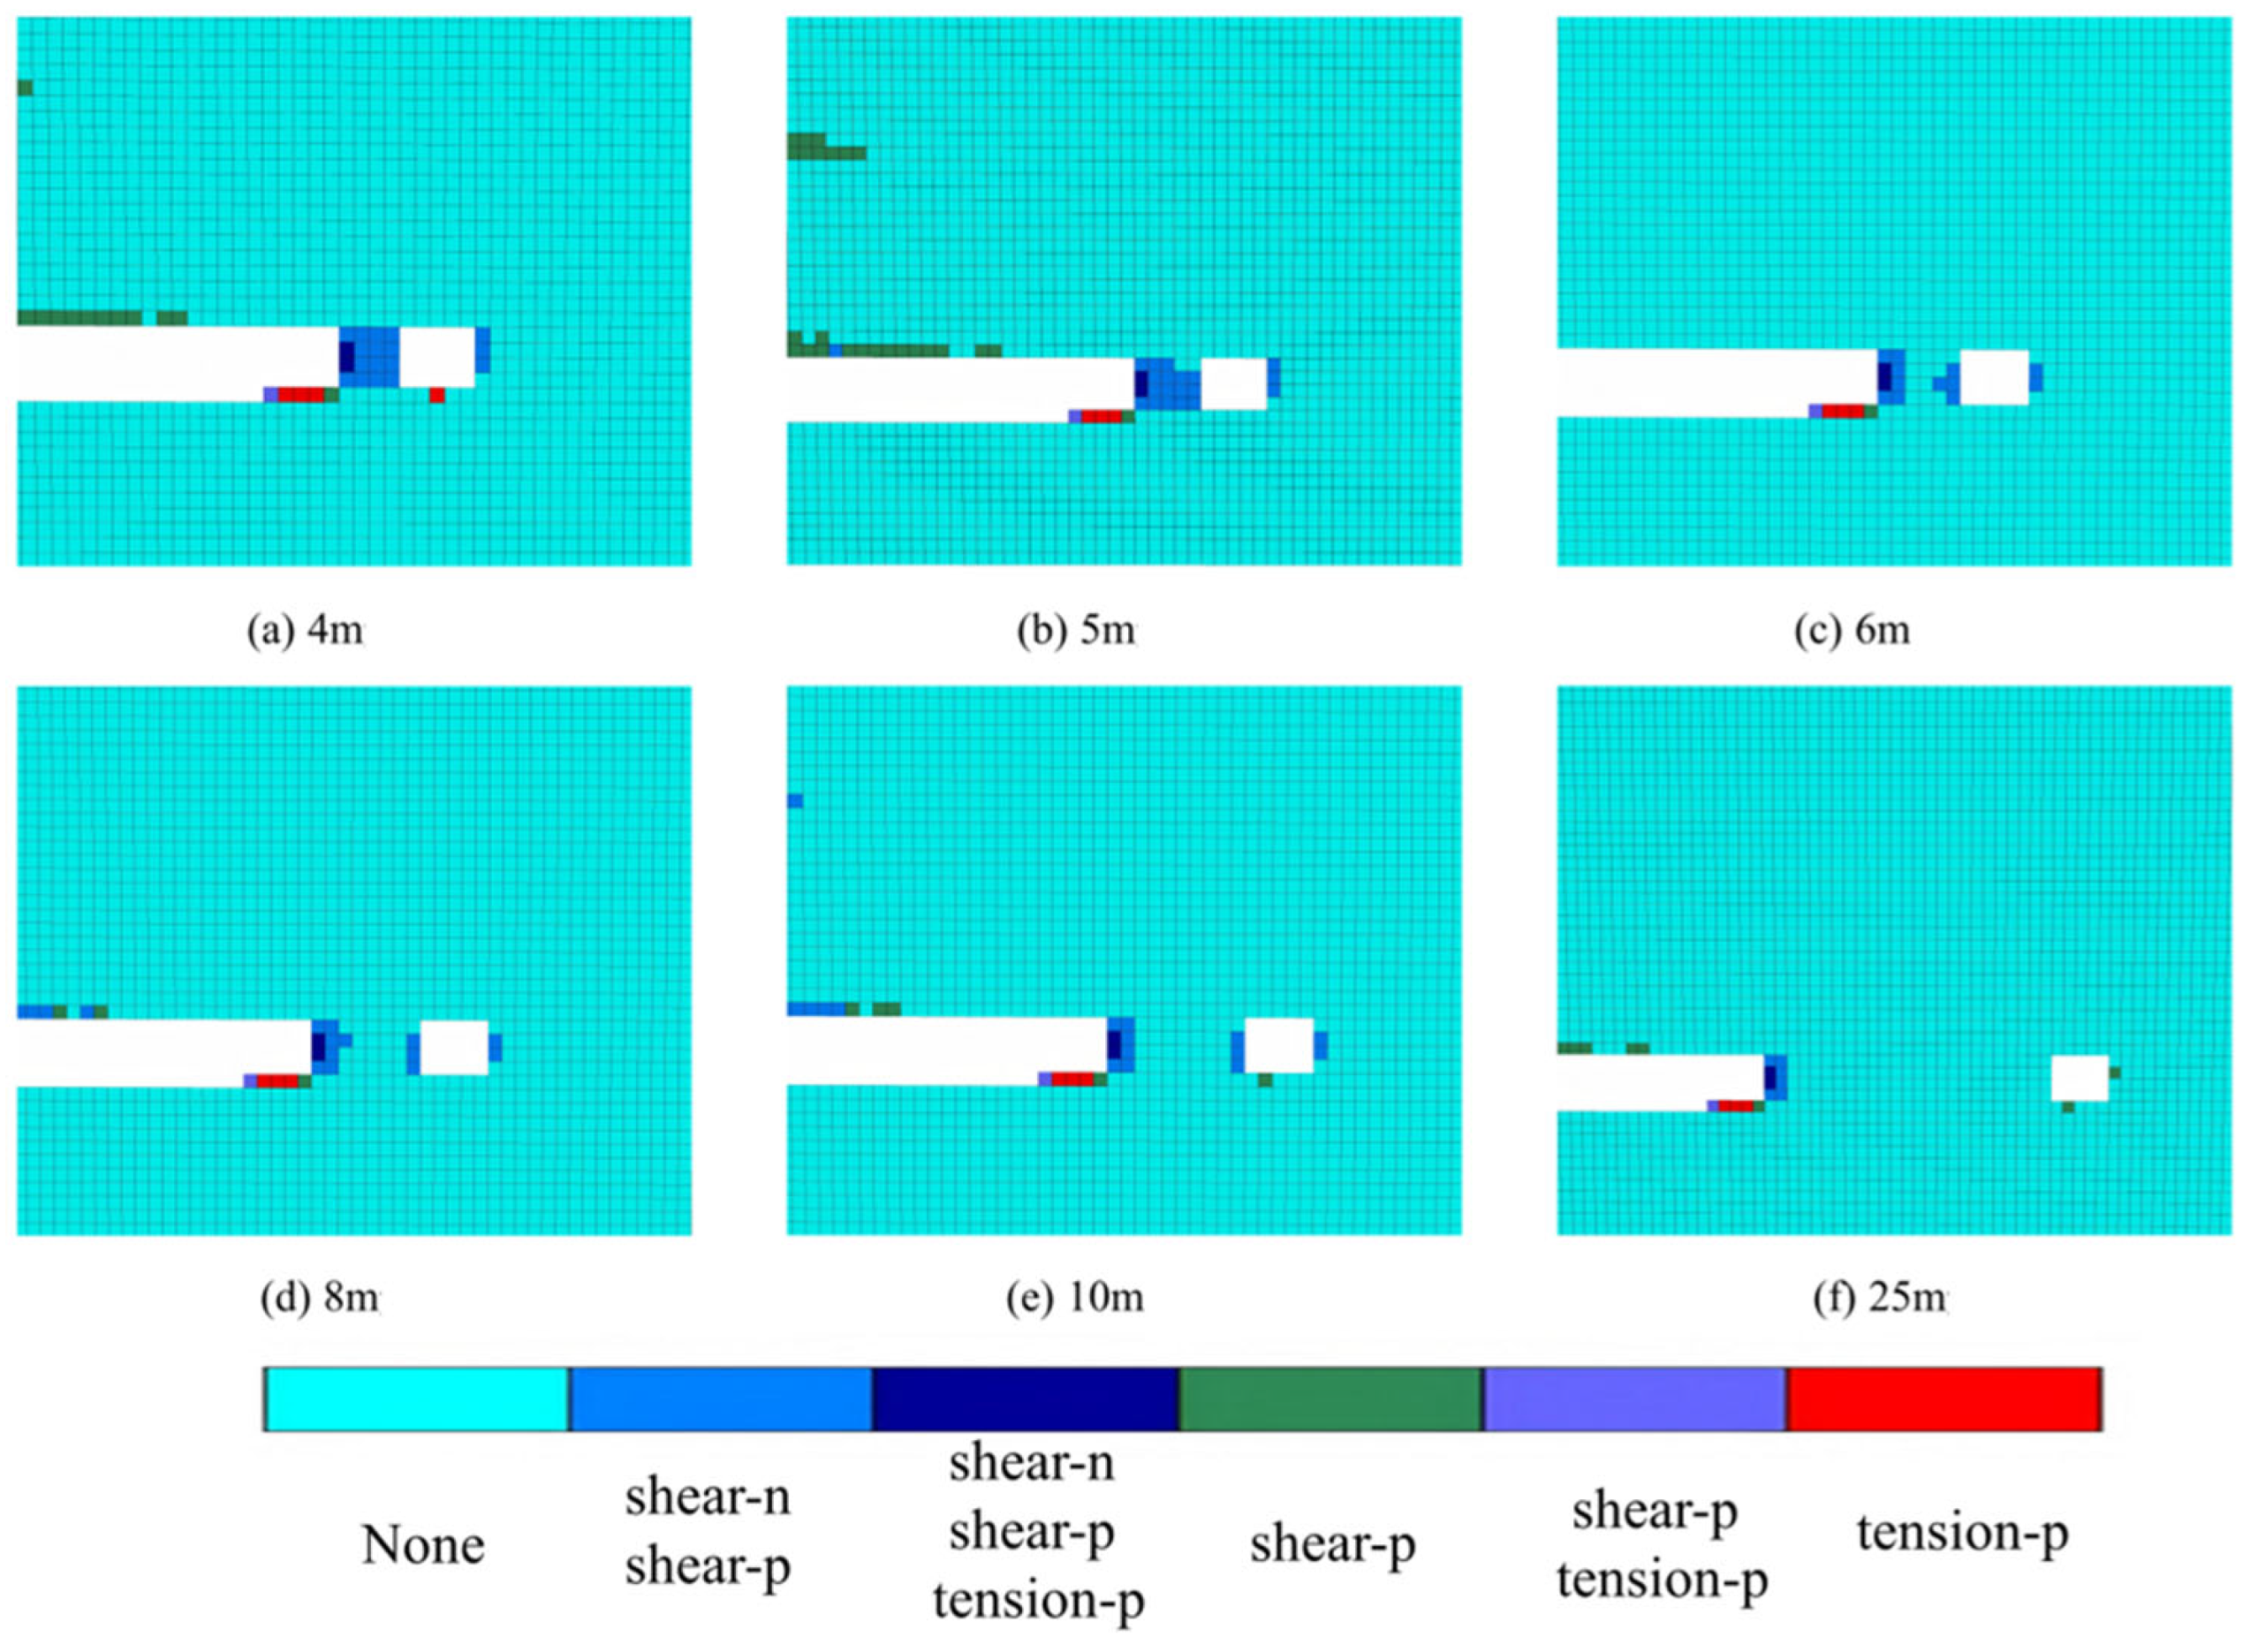
The above section analyzed the stress evolution of coal pillars at the mining–excavation intersection. The following section evaluates pillar loading behavior from the perspective of plastic failure zones. The distribution characteristics of plastic zones under different coal pillar widths at the mining–excavation intersection are shown in Figure 17.
As shown in Figure 17, with the increase in coal pillar width, the extent of the plastic failure zone gradually decreases, and the failure zone shifts toward the gob side. When the coal pillar is 4 m wide, shear and tensile failure zones occupy 100% of the pillar area, indicating full penetration and severe damage, rendering the pillar incapable of effectively bearing load. At a width of 5 m, the extent of the plastic failure zone is somewhat reduced compared to the 4 m pillar, but shear and tensile failure still cover 86% of the area, indicating limited load-bearing capacity. When the pillar width is 6, 8, 10, or 25 m, an elastic zone appears in the center of the pillar, indicating that the pillar has developed a certain load-bearing capacity. As the width increases, the elastic zone expands and the pillar’s load-bearing capacity improves, reaching its maximum at a width of 25 m. Considering both pillar stability and minimizing coal resource loss, a sectional protective coal pillar width of 6 m is recommended.

5.2. During the Tunneling Period Along the Gob

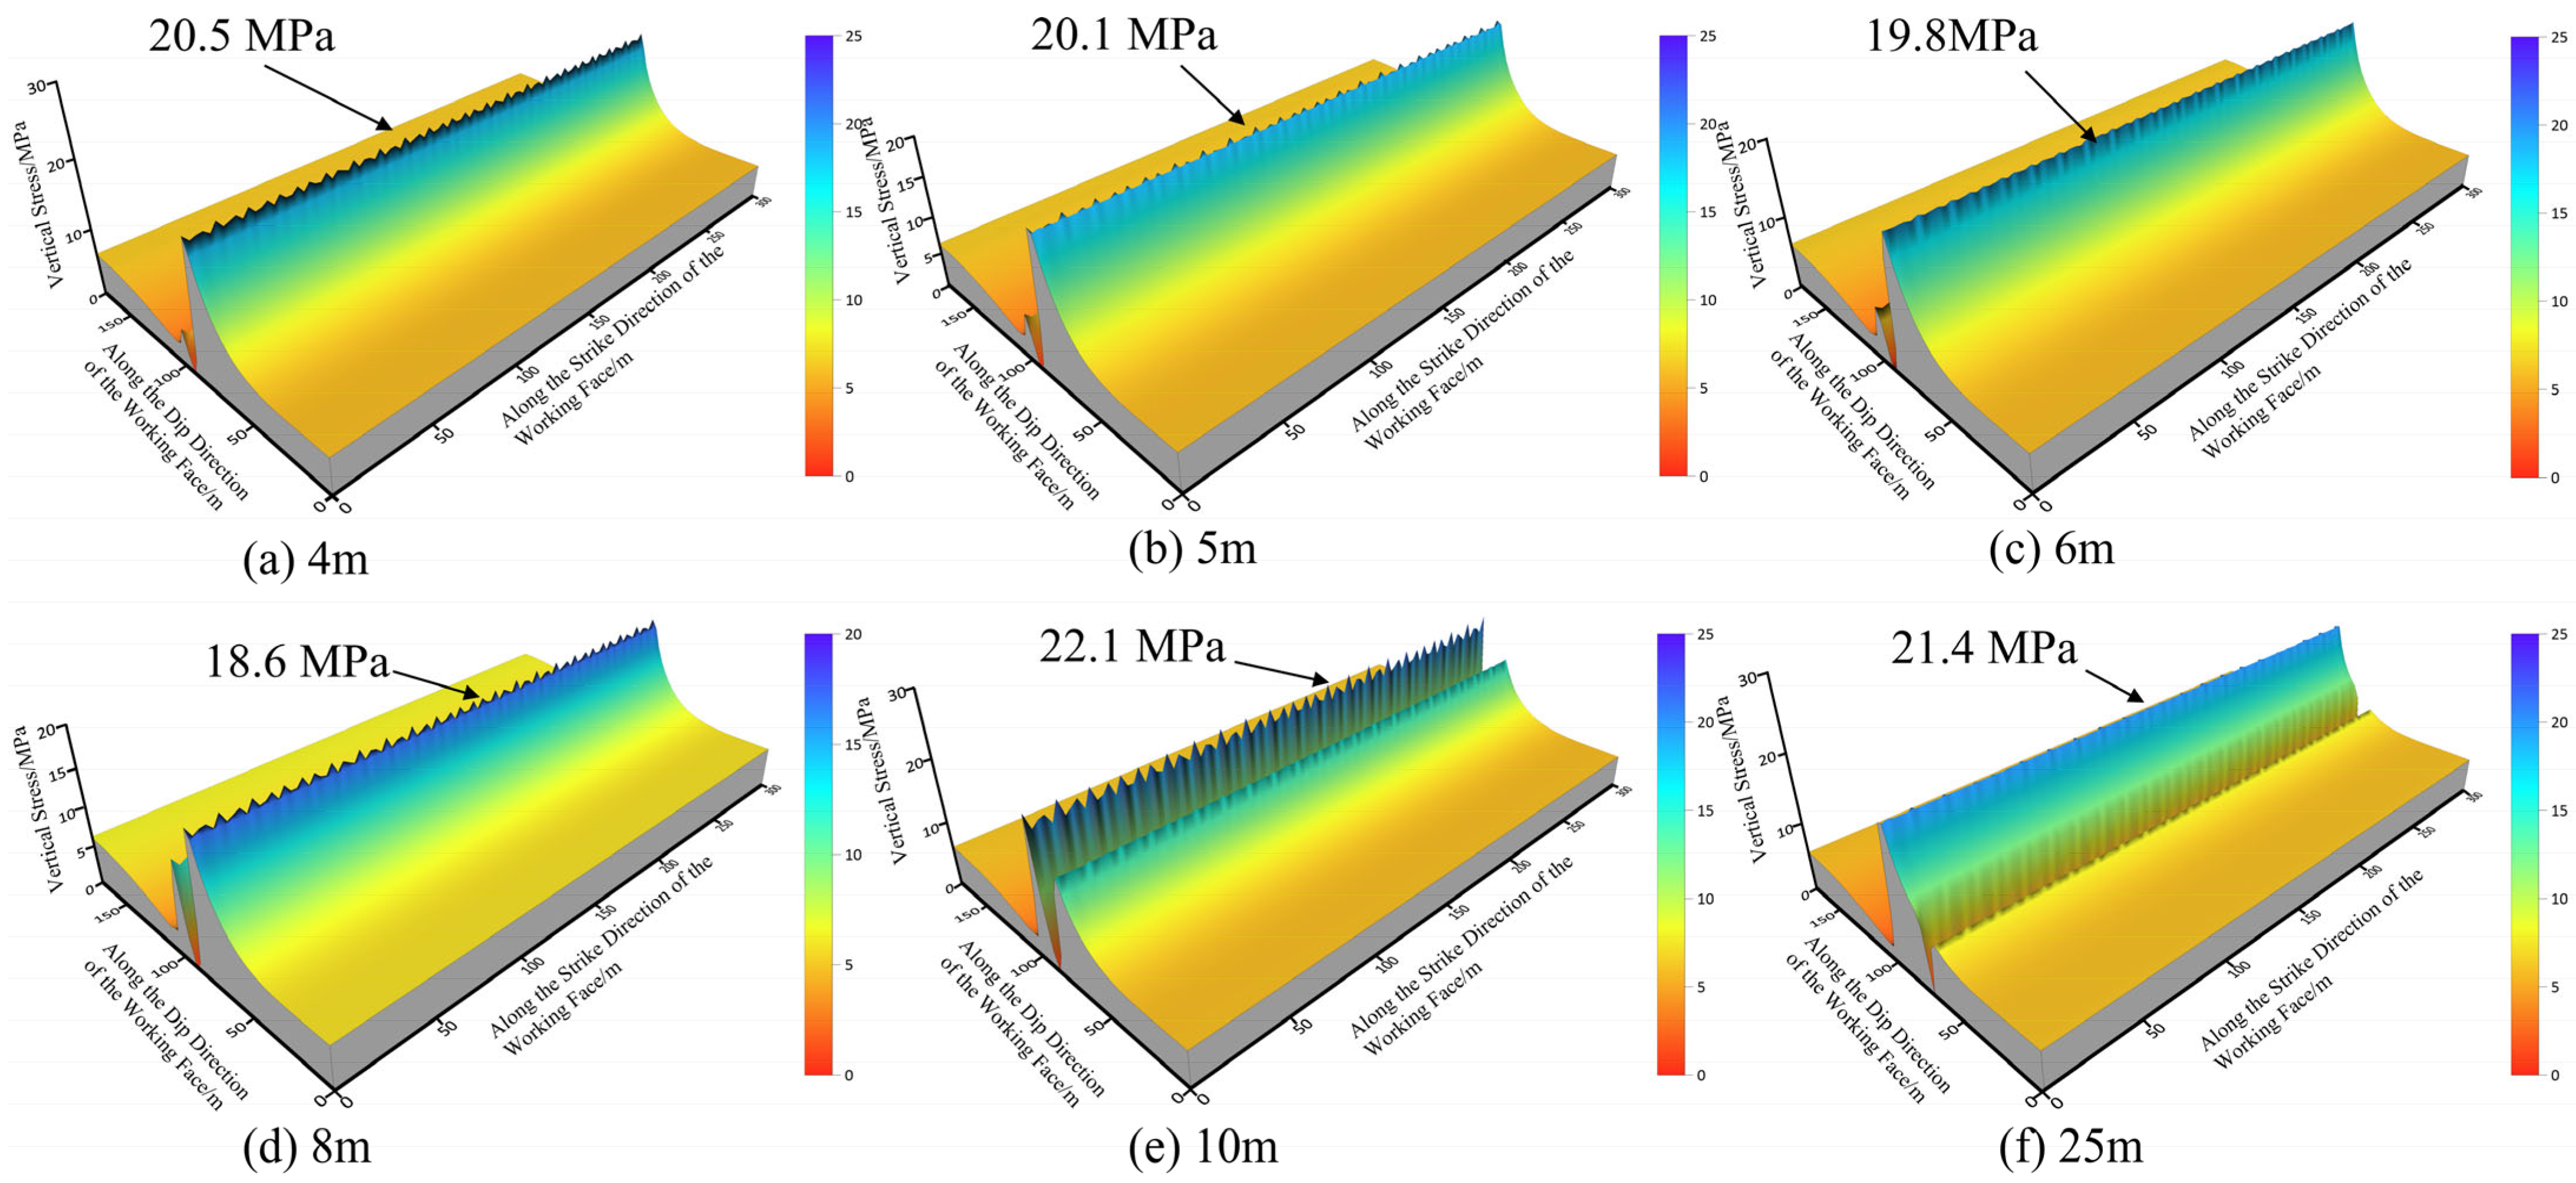
After the roadway excavation is completed, the vertical stress distribution of the surrounding rock is shown in Figure 18. As shown in Figure 18, the distribution of peak stress varies with the coal pillar width.
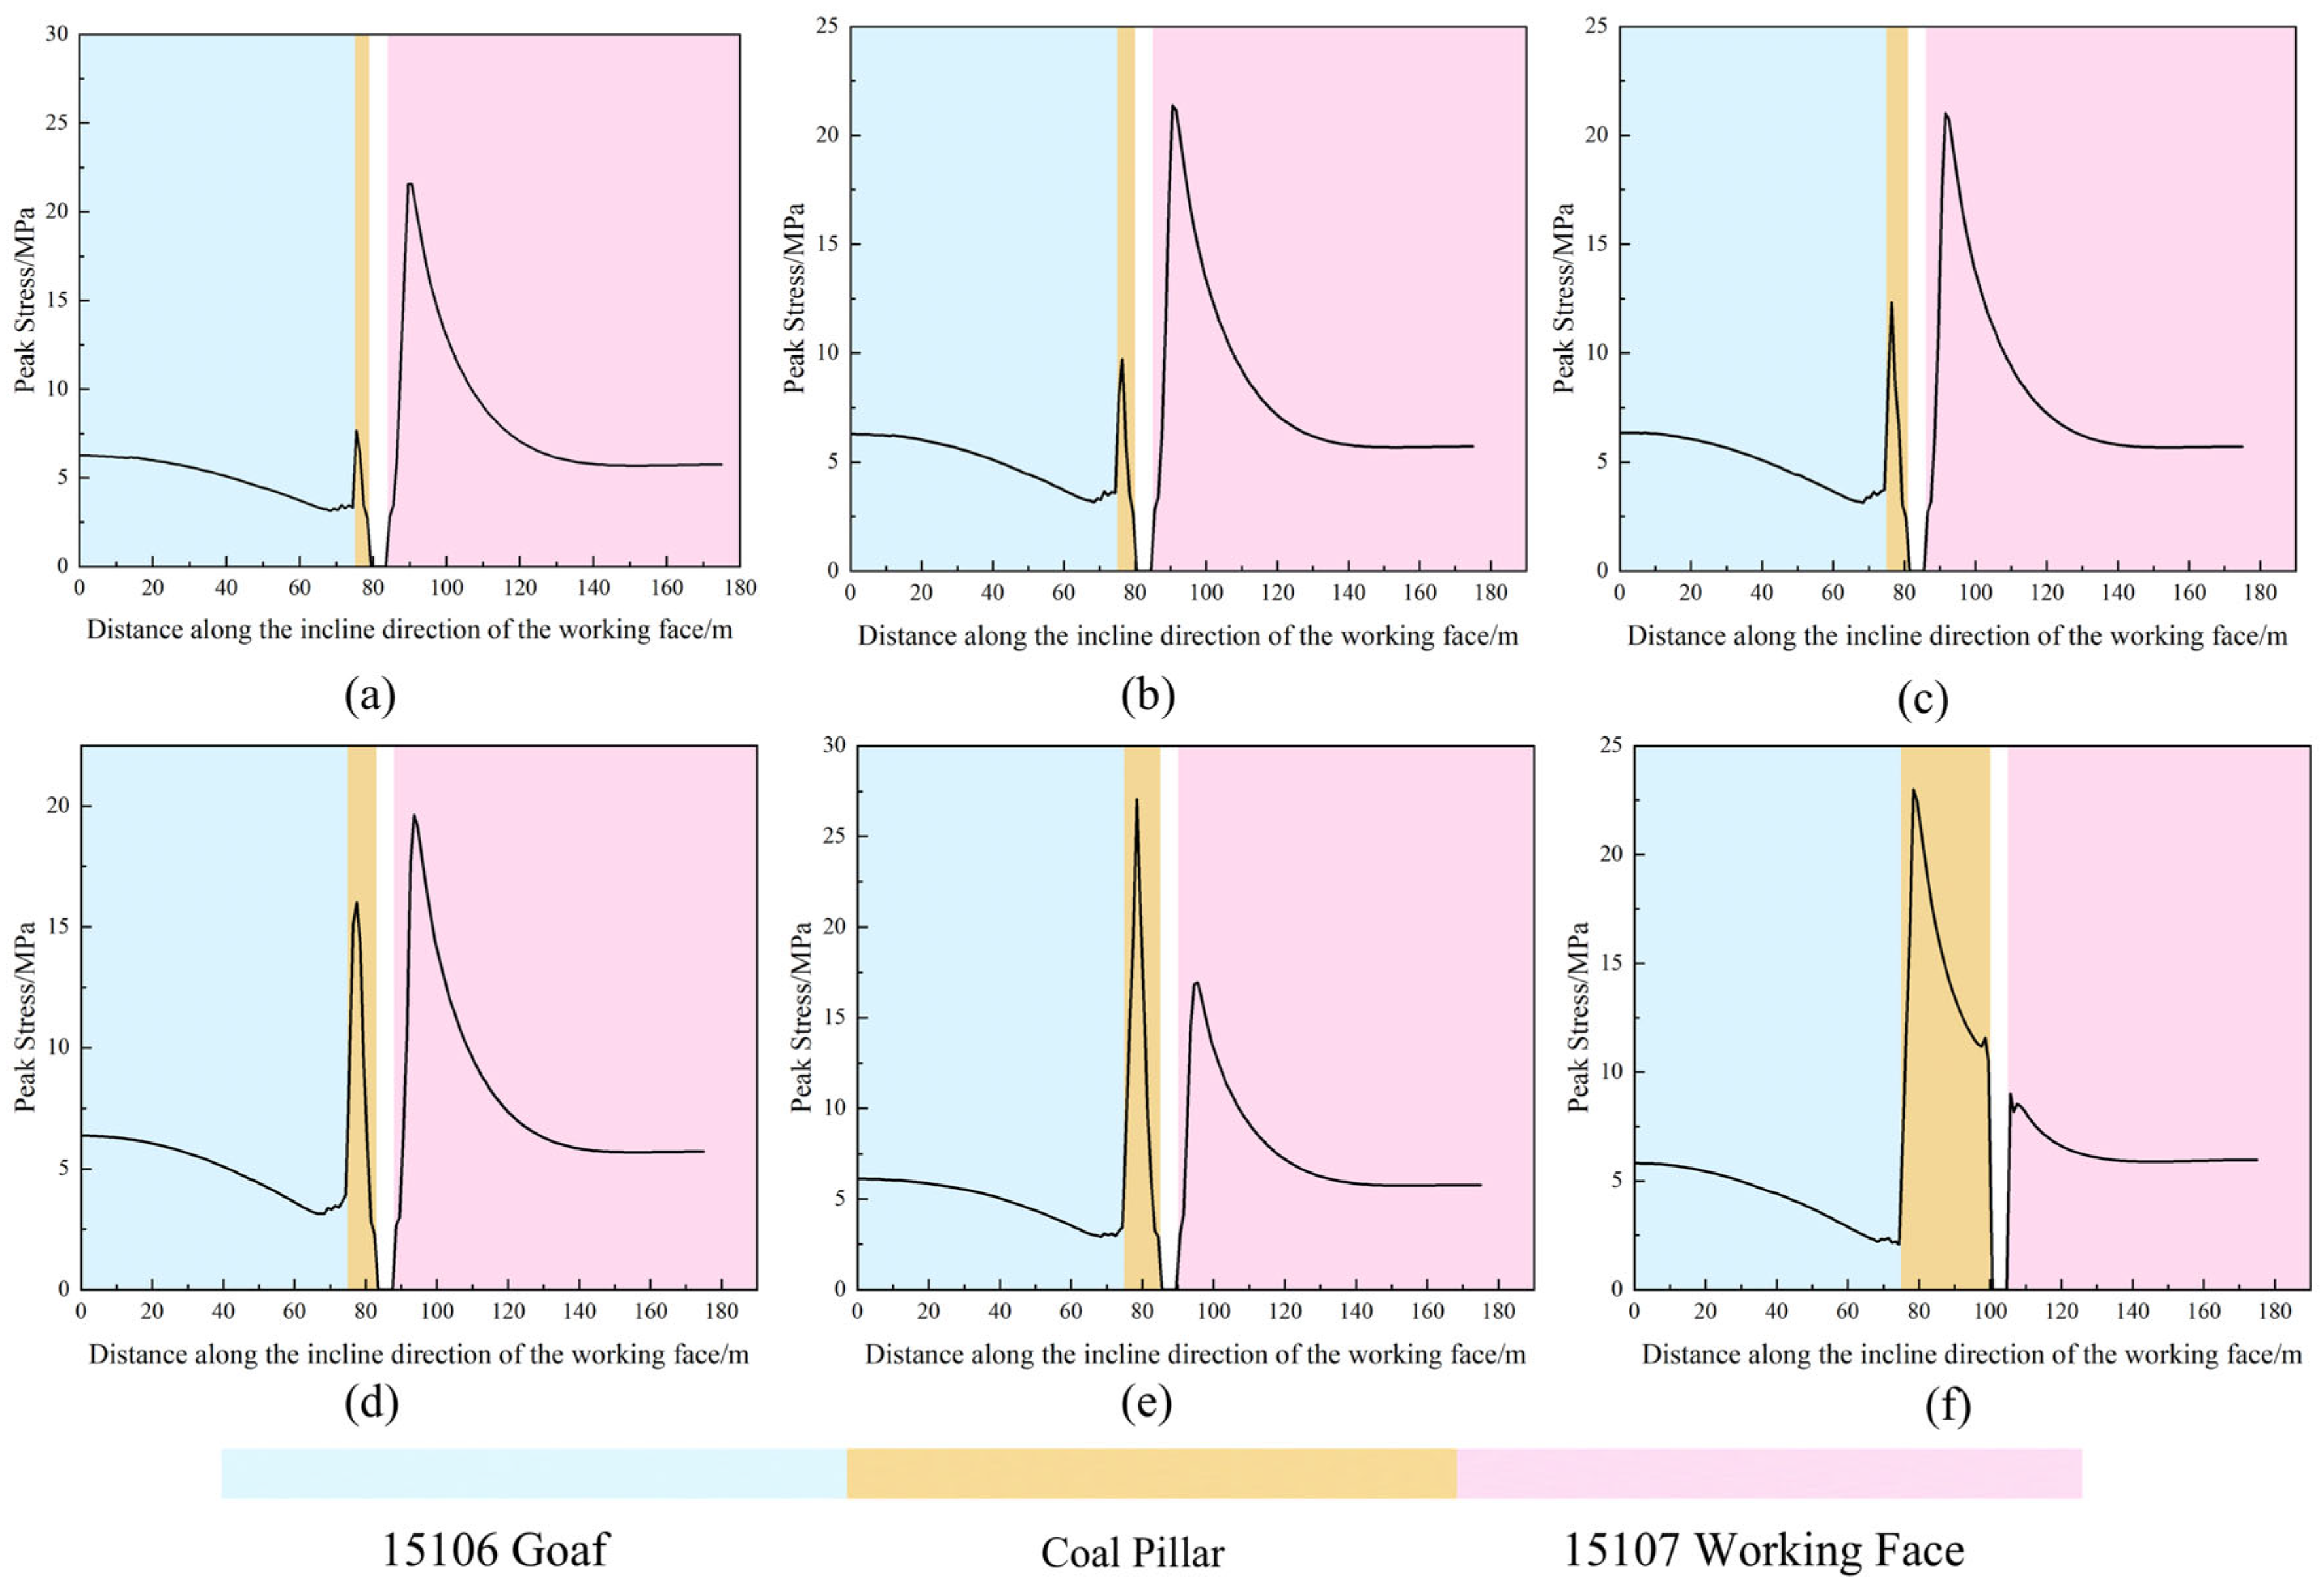
To more accurately analyze the vertical stress of the roadway surrounding rock, a monitoring line was arranged along the dip direction of the working face at x = 120 m to monitor vertical stress after roadway excavation. Figure 19 shows that for coal pillar widths of 4, 5, 6, 8, 10, and 25 m, vertical stress on the side of the 15106 gob initially decreases and then rises, recovering to in situ levels near the gob edge adjacent to the coal pillar. For the coal pillar itself, Figure 19 indicates that when the widths are 4, 5, 6, 8, and 10 m, the stress peak increases with pillar width, and the stress curve shows a single-peak distribution, with corresponding peak values of 7.66, 9.74, 12.32, 16.02, and 27.05 MPa. When the coal pillar width is 25 m, its peak vertical stress is lower than that of the 10 m pillar, and the internal stress curve exhibits a “saddle-shaped” double-peak distribution, with peaks near the 15106 gob and the newly excavated headgate# 15107 side. On the side near the gob, the higher peak stress reaches 23 MPa; on the side near the newly excavated 15107 roadway, the lower peak stress is 11.77 MPa. In the 15107 working face, the post-excavation stress trends for coal pillars of 4 m to 25 m are similar—stress rises initially, then falls, and eventually returns to the in situ stress level. With sectional coal pillar widths of 4, 5, 6, 8, 10, and 25 m, the corresponding peak stress values in the 15107 working face are 21.01, 20.43, 19.63, 18.49, 16.93, and 9.04 MPa, respectively. It can be seen that as the coal pillar width increases, the peak stress in the 15107 working face gradually decreases. When a 25 m sectional protective coal pillar is used, the peak stress in the 15107 working face reaches its minimum. Although this is favorable for roadway stability in the next working face, it leads to significant coal resource loss.
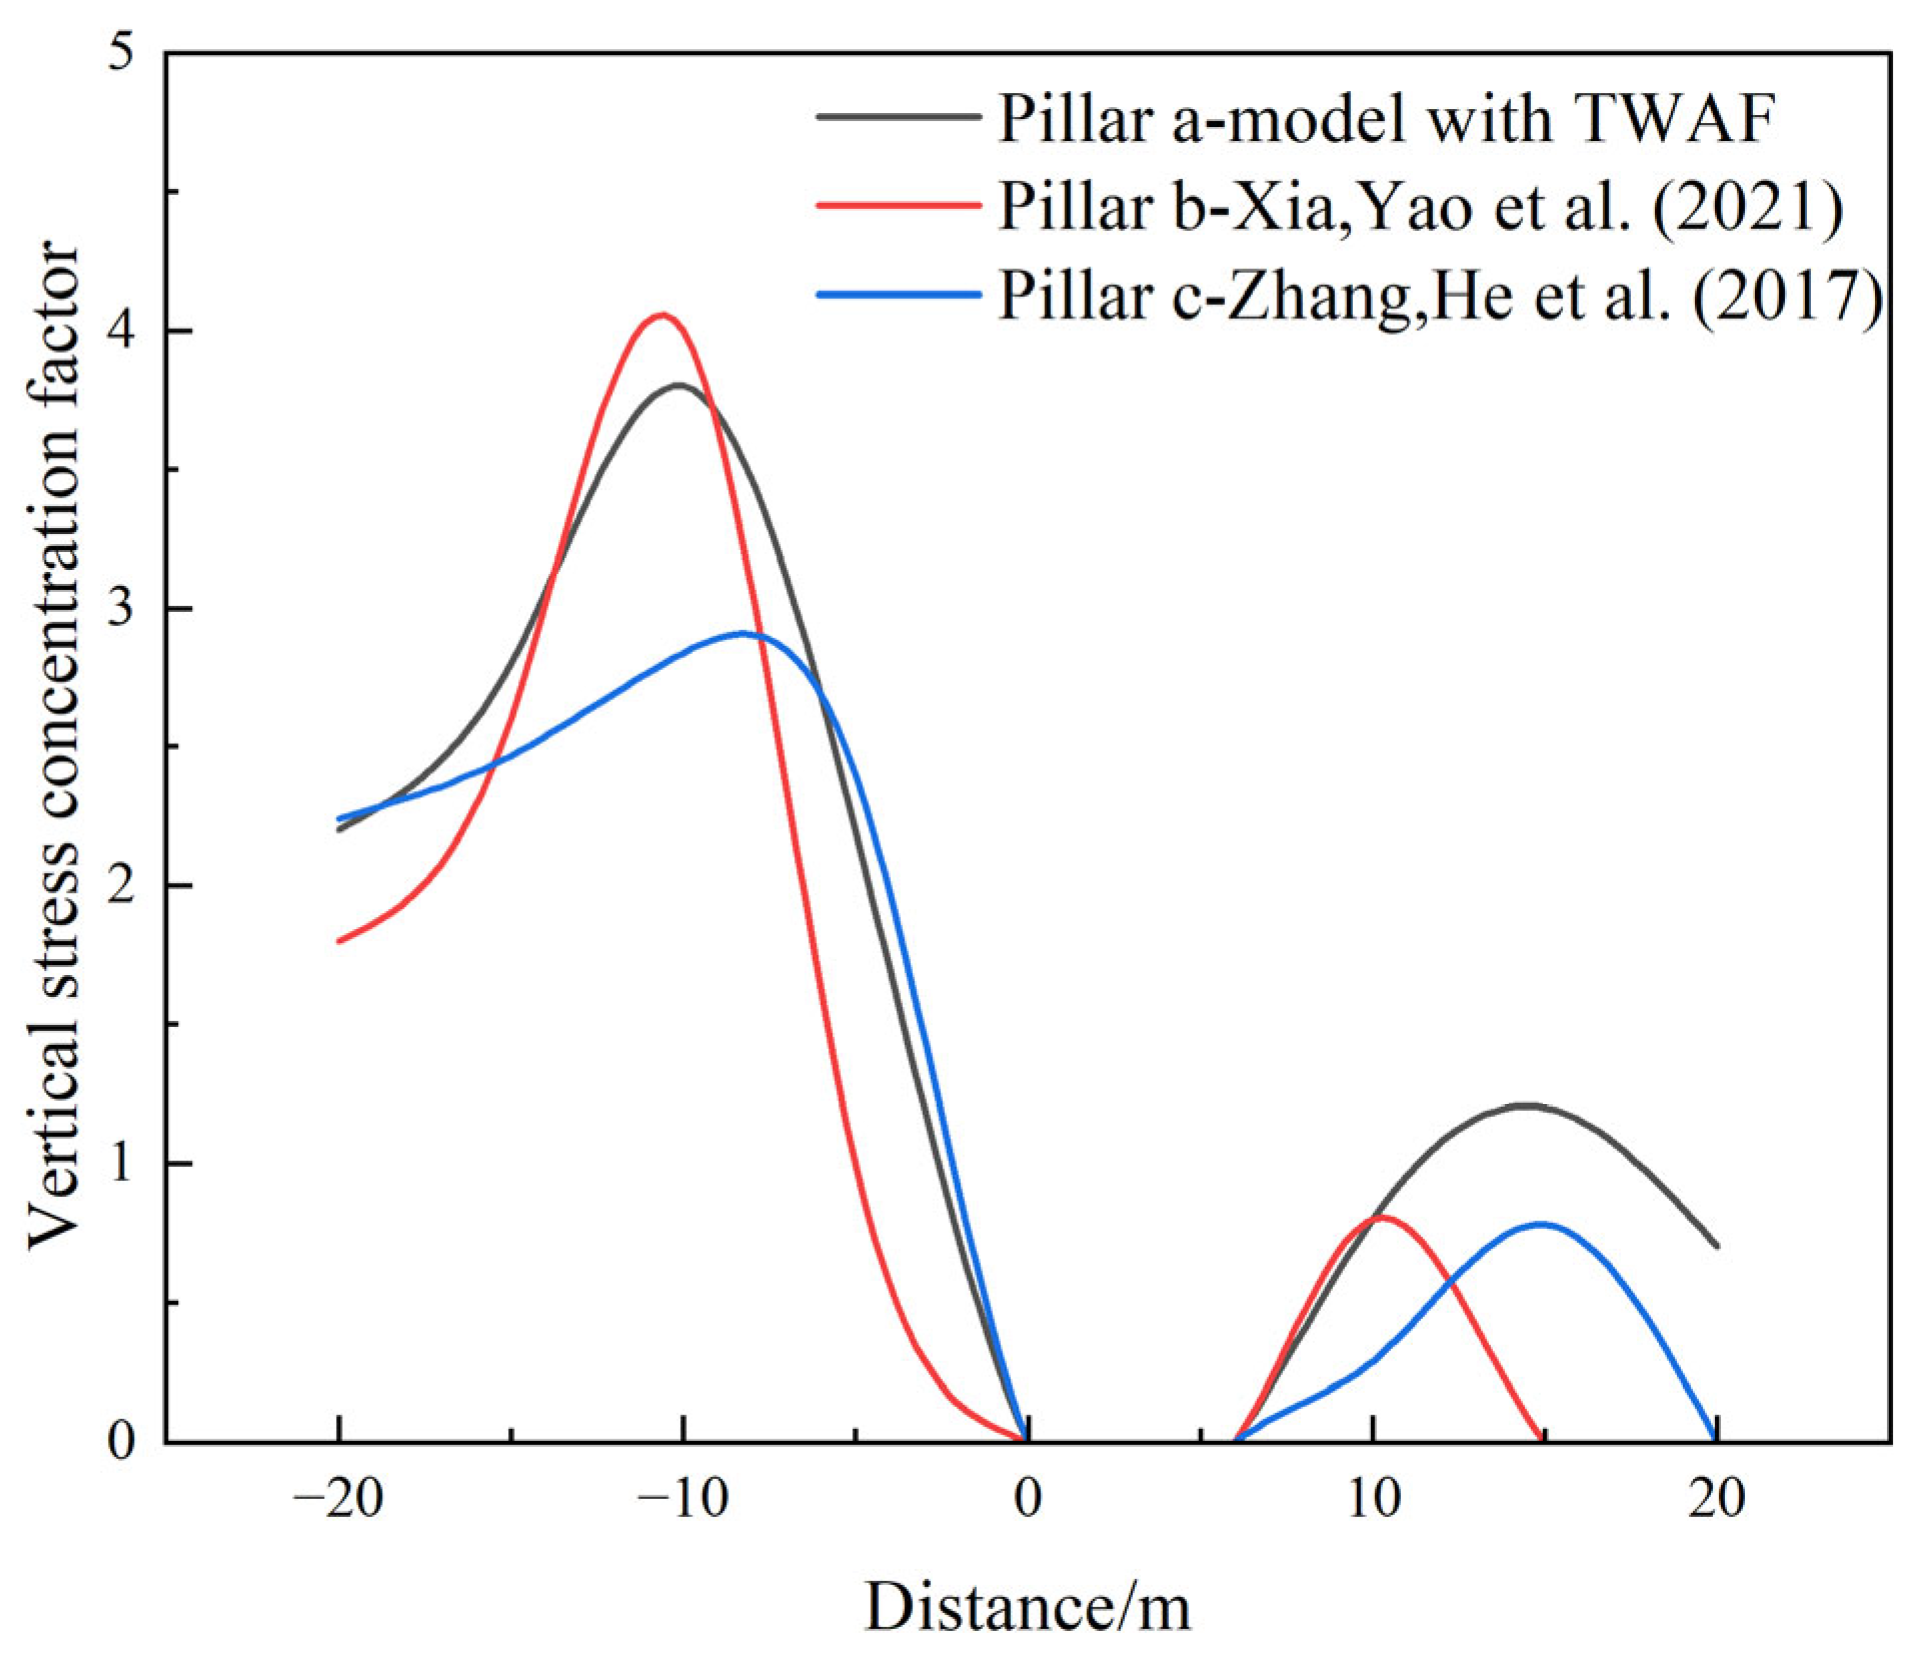
The numerical calculation results of the TAWF small coal pillar model were compared with the research results of Xia et al. [29] (double roadway layout) and Zhang et al. [34] on gob-side entry driving (GED), and a qualitative analysis was conducted on the vertical stress concentration factor around the roadway. The comparison results are shown in Figure 20. It can be seen from Figure 20 that the vertical stress distribution laws of TAWF, the double roadway excavation method, and the gob-side entry driving (GED) method are obviously consistent: most of the supporting load is borne by the solid coal rib, and the load borne by the coal pillar is small.
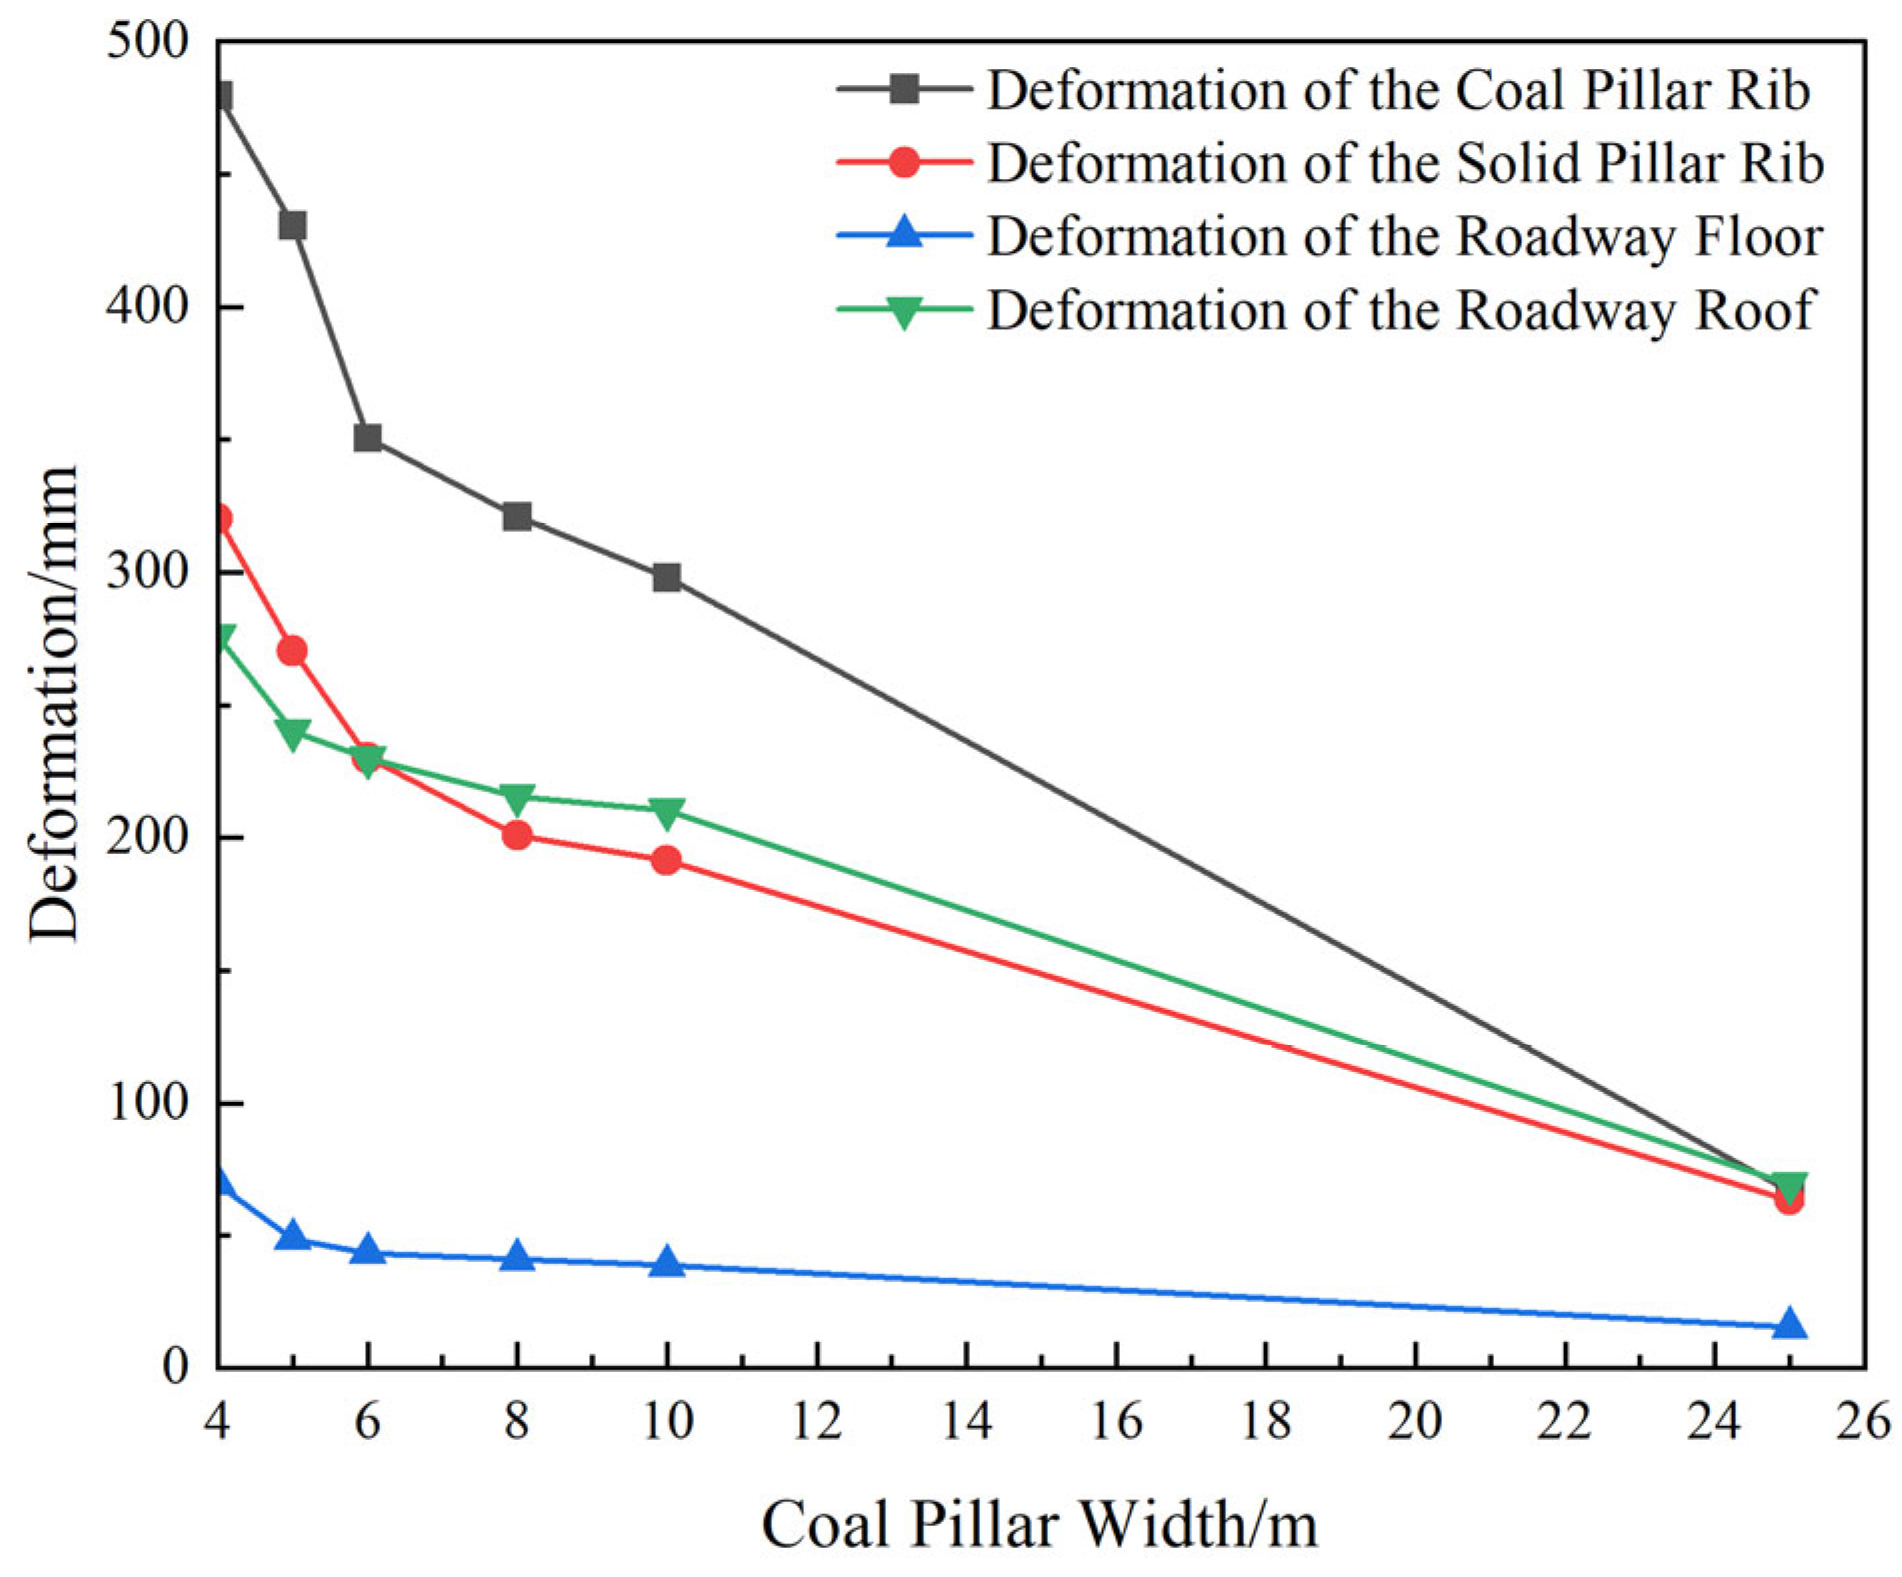
After the excavation of the headgate# 15107, the deformation of the surrounding rock is shown in Figure 21. As shown in Figure 21, the deformation of the roadway roof, floor, and ribs decreases with increasing coal pillar width. When the coal pillar width is 4 m, roadway deformation is at its maximum, the roadway becomes unstable, difficult to maintain, and impedes normal working face mining. When the coal pillar width reaches 25 m, the deformation of the roof, floor, and ribs is minimal; however, such a wide pillar causes significant coal resource loss. Increasing the coal pillar width from 4 m to 6 m markedly reduces roadway deformation by 27% in the coal pillar rib, 28% in the solid coal rib, and 18% and 37% in the roof and floor, respectively. As the coal pillar widens from 6 m to 10 m, deformation further declines by 14%, 16%, 11%, and 8%, suggesting that the roadway has reached a relatively stable state. Balancing coal recovery with roadway stability, a 6 m wide coal pillar is the optimal choice.

5.3. During the Mining of the 15107 Working Face

Stress contour maps at 120 m advancement of the 15107 working face under coal pillar widths of 4, 5, 6, 8, 10, and 25 m are shown in Figure 22.
During the advancement of the working face, when the coal pillar widths are 10 m and 25 m, although the stress peaks are both concentrated within the pillars and located behind the 15107 working face, their stress distributions differ. When the coal pillar is 10 m wide, the stress concentration zone is approximately located in the middle of the pillar. When the coal pillar is 25 m wide, during mining, the vertical stress peaks concentrate on both sides of the pillar; as the working face advances, the stress peak on the 15106 gob-side gradually shifts toward the 15107 working face side, and the internal stress distribution changes from “higher on the left, lower on the right” to “lower on the left, higher on the right.” When the coal pillar width is 8 m, significant vertical stress peaks exist both within the pillar and at the 15107 working face. When the coal pillar width is 4 m, 5 m, or 6 m, during face advancement, the stress peaks are located at the 15107 working face, and the coal pillar remains in a stress-relief zone, providing a favorable stress environment for roadway maintenance. However, as previously analyzed, the 4 m and 5 m coal pillars had already experienced plastic failure during roadway excavation, and during face mining, the 6 m pillar had a lower stress peak than the 4 m and 5 m ones; thus, a 6 m wide protective coal pillar should be adopted.
For the convenience of comparative analysis, the peak stress of the roadway surrounding rock and the roadway deformation under coal pillars of different widths in different periods are summarized in a table, as shown in Table 7. It can be seen from Table 7 that when the coal pillar width is 4~10 m, the deformation of the roadway surrounding rock decreases with the increase in the coal pillar width. When the coal pillar width increases from 4 m to 6 m, the deformation of the roadway surrounding rock decreases significantly. When the coal pillar width increases from 6 m to 10 m, although the deformation of the roadway surrounding rock also decreases, the decreasing rate gradually slows down, indicating that the roadway has tended to be stable at this time. Considering the overall deformation of the roadway, when the coal pillar width is 25 m, the deformation of the roadway surrounding rock is the smallest, but a large amount of coal resources will be lost. When the coal pillar widths are 6 m, 8 m, and 10 m, the deformation of the roadway surrounding rock is relatively small, and the coal pillars themselves can be kept stable. From the perspective of reducing coal resource loss, a 6 m coal pillar is better than 8 m and 10 m coal pillars. An analysis of the stress data in the table shows that when the coal pillar width is 6 m, while reducing resources, the peak stress is relatively low, which is beneficial to the stability of the roadway.
Based on the above theoretical analysis and numerical simulation results, a 6 m wide protective coal pillar should be adopted for the 15107 working face of the coal mine.

6. Field Test

6.1. Optimization of Roadway Support Scheme

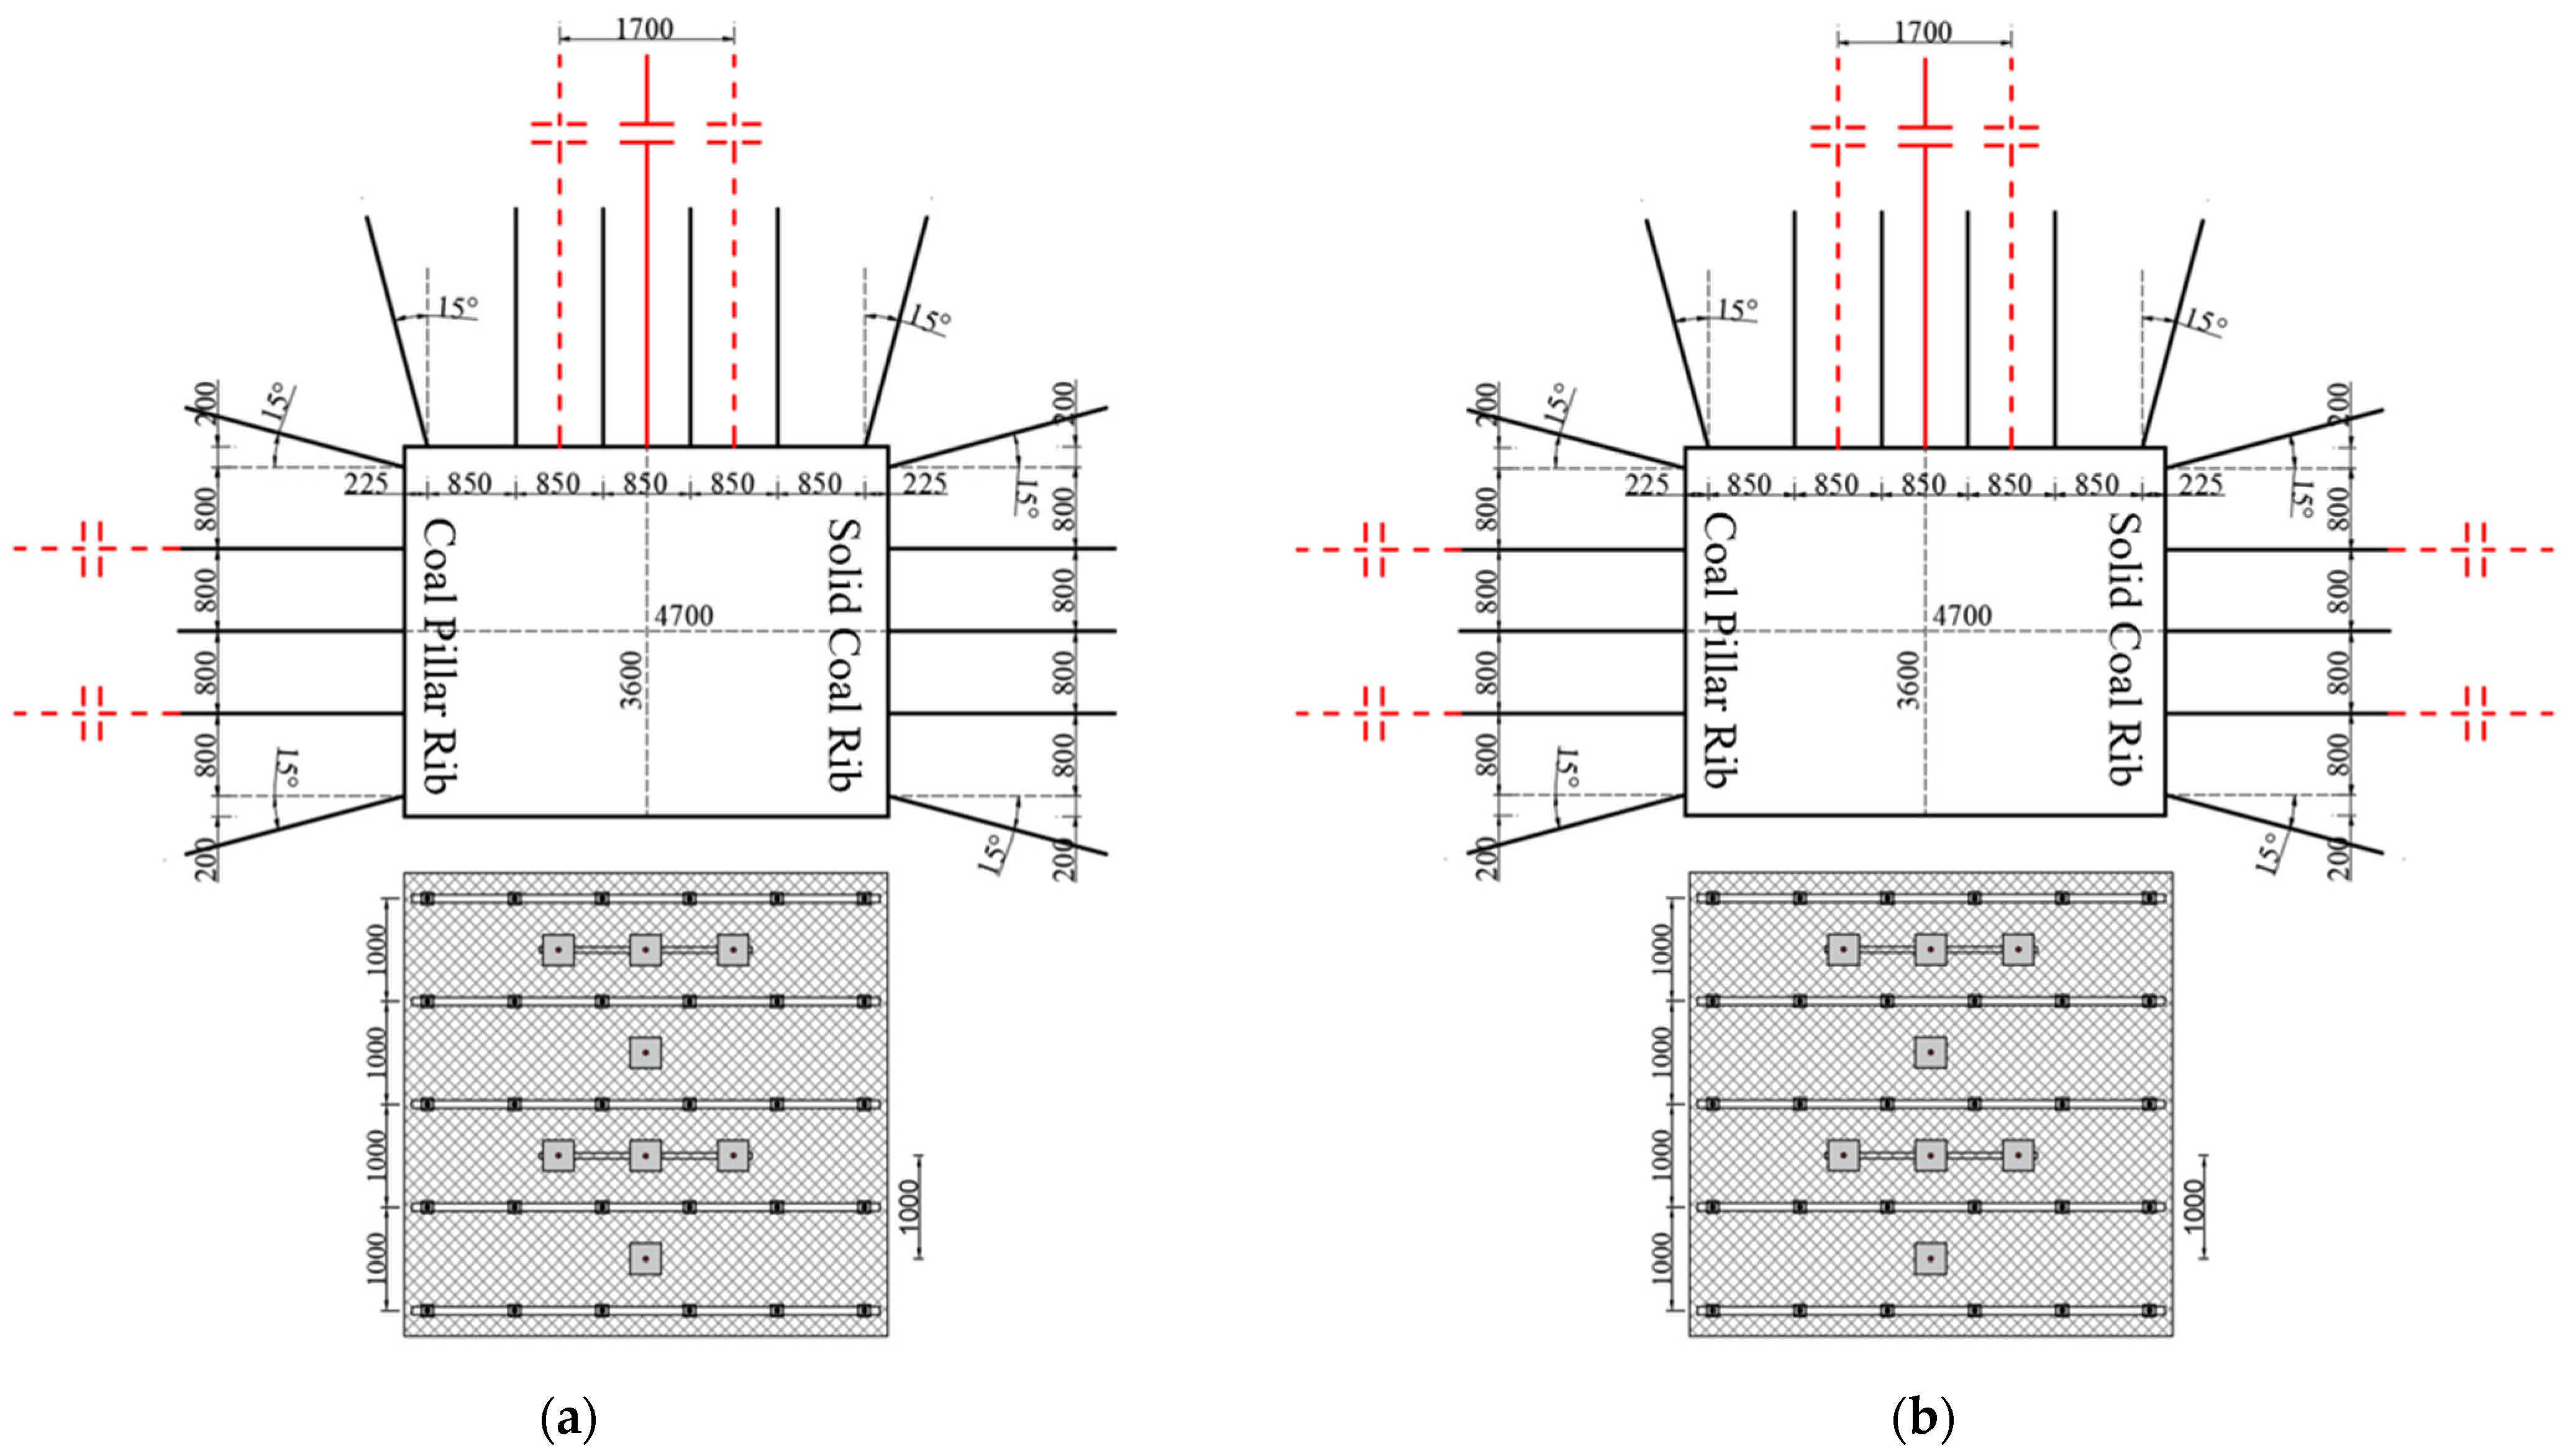
Based on the above research and in consideration of the geological and operational conditions at the coal mine, the width of the protective coal pillar was finally determined to be 6 m. The headgate# 15107 was studied under two different conditions: during the advance toward the 15106 working face and during excavation along the gob. During the driving near the 15106 working face, the analysis shows that when the coal pillar width is 6 m, a stress concentration zone forms within the pillar and a plastic zone appears, indicating that the support for the roof and pillar side of the roadway should be reinforced. Two additional anchor cables should be installed in every other row on the roof, and two more anchor cables should be added on the pillar-side wall of the roadway, as shown in Figure 23a. When excavating along the gob, the analysis indicates that the deformation on the pillar-side of the roadway is significant, and the stress concentration shifts toward the working face side. Thus, reinforcement of the roof and both sidewalls of the roadway is necessary. Two additional anchor cables should be installed every other row on the roof, and two more should be installed on each of the two sidewalls, as shown in Figure 23b.

6.2. Ground Pressure Measurement

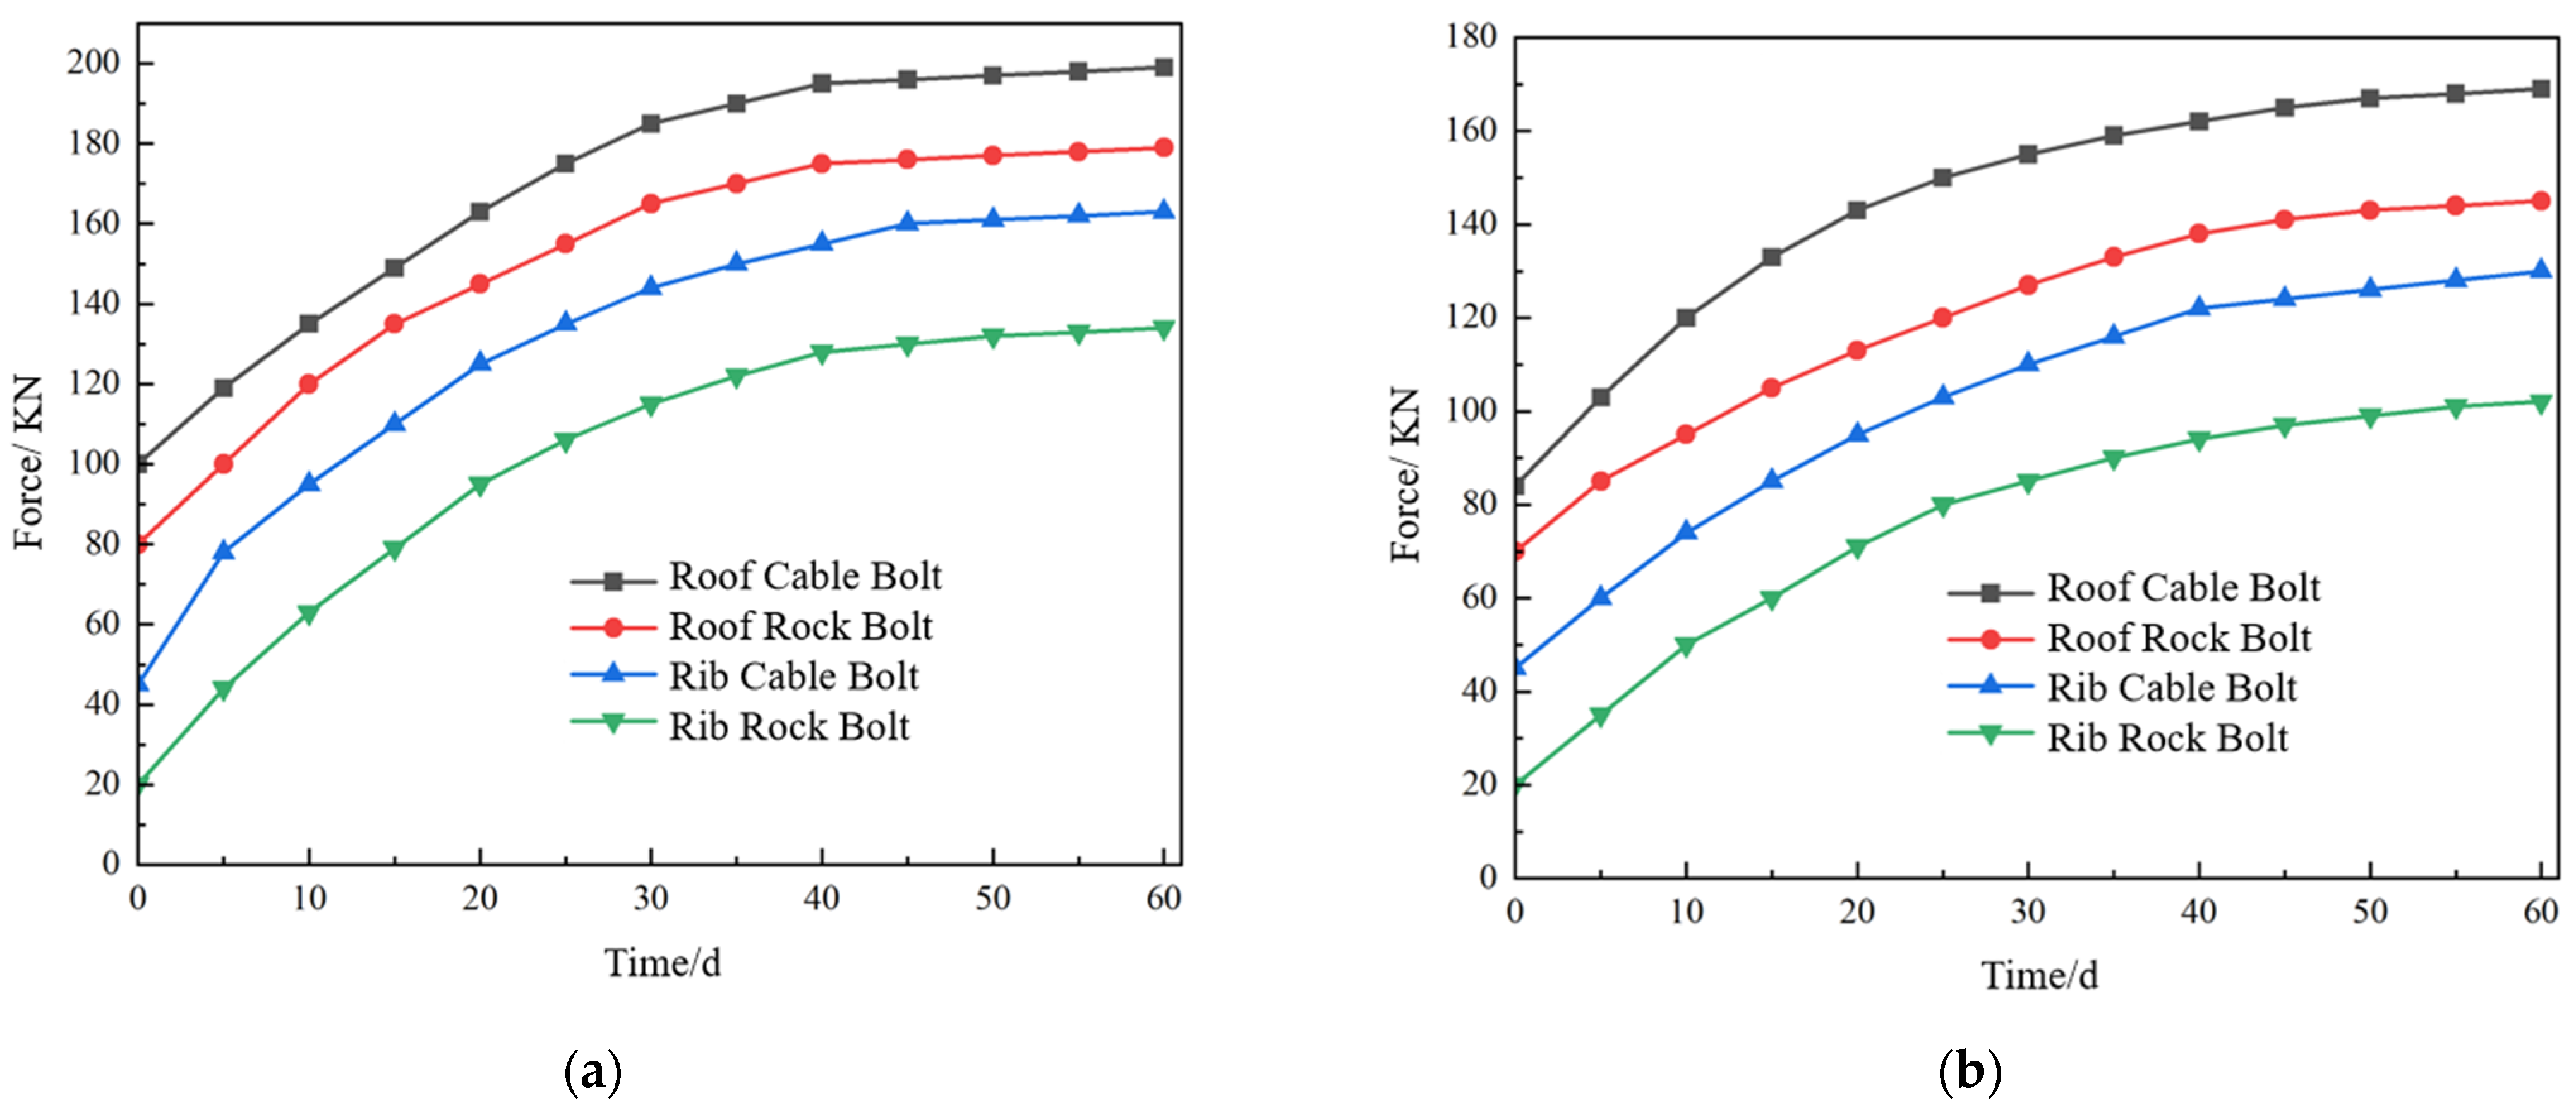
To evaluate the effectiveness of roadway support, monitoring stations were set up in both the face-to-face driving section and the gob-side driving section of the headgate# 15107 to monitor surrounding rock deformation and anchor loading. The monitoring results are shown in Figure 24 and Figure 25. Figure 24a,b show the surrounding rock deformation curves during face-to-face driving and gob-side excavation, respectively. As shown in Figure 24, the deformation rate of the surrounding rock was rapid during the first 30 days of excavation but gradually slowed and stabilized over time. During face-to-face driving, the maximum roof subsidence and rib convergence reached 169 mm and 208 mm, respectively. During gob-side excavation, the peak roof subsidence and rib convergence were 126 mm and 148 mm, respectively. Figure 25a,b show the anchor and cable loading curves during face-to-face and gob-side driving, respectively. The figures indicate that anchor forces increased gradually over time and eventually stabilized. During face-to-face driving, the roof cable, roof bolt, side cable, and side bolt forces stabilized at approximately 198, 177, 163, and 134 kN, respectively. For the gob-side section, the stabilized loading values were 169 kN for roof cables, 145 kN for roof bolts, 130 kN for side cables, and 102 kN for side bolts. Both the surrounding rock deformation and anchor loading remained within acceptable ranges, demonstrating the effectiveness and feasibility of the support scheme.

7. Discussion

This paper takes the 15107 working face of the Wangwa Coal Mine as the engineering case study, and through a comprehensive analysis using methods such as theoretical analysis, numerical simulation, and on-site tests, it is concluded that the optimal coal pillar width should be set to 6 m. From the comprehensive analysis in the previous sections, it can be seen that under coal pillars of different widths, the stress peaks and distributions present different laws. This is because when the coal pillar width is less than 6 m, the coal pillar is affected by mining activities, and the stress it bears exceeds its ultimate bearing capacity, making it prone to plastic failure. When the coal pillar width starts to increase from 6 m, as the width increases, more areas inside the coal pillar can be in an elastic state. The coal pillar can bear greater bearing pressure, and the degree of stress concentration and its distribution change accordingly. Correctly grasping the law of stress distribution plays an important role in effectively controlling the stability of the surrounding rock of the roadway. This paper provides certain reference values for maintaining the stability of such roadways.
However, this study also has certain limitations. Numerical calculation and theoretical calculation results are greatly affected by the rock mechanical parameters of the working face. For example, when the internal friction angle φ0 of the coal seam decreases from 32° to 20° and the cohesion C0 decreases from 1.78 MPa to 0.78 MPa, substituting them into Formulas (8) and (9) shows that the reasonable coal pillar width increases from the original 5.08 m to 7.64 m. Therefore, when applying this method to other mines, it must be combined with the rock mechanical parameters of the working face under study.
In addition, the geological conditions of the 15107 working face are relatively simple, with no faults or goaf water accumulation. Thus, the influence of faults and water accumulation was not considered in the numerical simulation of this paper, which limits the universality of the model. If problems such as faults and goaf water accumulation are encountered, more refined modeling is required, and this will also be the focus of our future research.

8. Conclusions

(1)
Based on the internal–external stress field theory and limit equilibrium analysis, the optimal coal pillar width was determined to be 6 m, with an internal stress field extent of 9.83~11.43 m. Placing the roadway within this field locates it in a stress-reduction zone, ensuring stability and ease of maintenance.
(2)
During the gob-side entry driving near the advancing 15106 face, with pillar widths of 4 m and 5 m, the plastic zone penetrated the entire pillar, leaving minimal stress concentration zones and rendering the pillar almost incapable of bearing loads. For widths above 5 m, an elastic core formed within the pillar and the stress concentration area expanded. As the width increased, so did the elastic zone, resulting in an improved load-bearing capacity. The assessment during excavation along the gob showed that at a 25 m width, the pillar’s stress profile has two peaks, corresponding to peak support capacity and minimal face stress at 15107. For widths of 4, 5, 6, 8, and 10 m, the stress curve is single-peaked, and the peak stress increases with pillar width. During the 15107 face advance, with sectional pillars of 3~6 m, the pillar remains in a stress-reduction zone; however, the 4 m and 5 m pillars had already plastically failed during face-to-face driving, lacking adequate support strength. Therefore, a 6 m pillar width is recommended.
(3)
Based on these theoretical and numerical findings, support schemes were optimized for each roadway stage, the bolt and cable parameters were established, and real-time field monitoring was implemented. The monitoring results indicate that with a 6 m pillar and the roadway placed within the internal stress field, the surrounding rock deformation was effectively controlled, meeting project requirements.

Author Contributions

Conceptualization, H.Z. and Y.W.; methodology, H.Z. and Y.W.; FLAC3D 7.0 version software, H.Z., W.W., and H.W.; validation, W.W., Y.W., and H.W.; formal analysis, W.W.; investigation, Y.H.; resources, H.Z., Y.H., Z.L., and J.S.; data curation, J.S.; writing—original draft preparation, B.W. and H.Z.; writing—review and editing, Z.L. and J.N.; visualization, Z.L., H.W., B.W., and Y.H.; supervision, B.W. and J.N.; project administration, J.S.; funding acquisition, W.W. All authors have read and agreed to the published version of the manuscript.

Funding

This research has been supported by the Shanxi Provincial Key Research and Development Program Project (202402150301003), the Joint Fund Project of the National Natural Science Foundation of China (U21A20107), the National Natural Science Foundation of China (52204150, 52204107), the Central Guidance Local Science and Technology Development Fund Project (YDZJSX2024D023), the China Postdoctoral Science Foundation (2023M742944), and the Tencent Foundation or EXPL ORER PRIZE. The authors thank Wangwa Coal Mine for their support during the field test.

Data Availability Statement

The data presented in this study are available on request from the corresponding author. The data are not publicly available due to ongoing proprietary research and analysis, which requires the preservation of data integrity and confidentiality for further in-depth studies.

Conflicts of Interest

Authors Hu Zhang, Haipo Wen, Yaotong Hu, Jianqiang Shao, Zhongwu Li and Jianchun Niu were employed by Wangwa Coal Mine, Ningxia Wangwa Coal Industry Co., Ltd. Author Yang Wen was employed by Ningxia Yinxing Coal Mining Co., Ltd. Author Wenda Wu was employed by Xuzhou Coal Mining Group Co., Ltd. The remaining author declares that the research was conducted in the absence of any commercial or financial relationships that could be construed as a potential conflict of interest.

References

  1. Liu, Y.X.; Gao, M.S.; He, Y.L.; Yu, X.; Xu, D. Study of control technology about gob-side entry driving with top-coal caving in inclined extra-thick coal seam. J. China Univ. Ming Technol. 2021, 50, 1051–1059. [Google Scholar]
  2. Chen, D.; Wang, X.; Bai, J.; Li, M.; Lu, J.; Zhang, F.; Sun, S.; Zhao, X.; Yu, Y. Full cycle evolution law of energy-stress in the surrounding rock of the gob-side entry driving for adjacent advancing working face. Coal Sci. Technol. 2025, 53, 162–175. [Google Scholar]
  3. Cong, C.K.; Lim, R.W.; Sun, Y.C.; Gao, L.L. Stress evolution law and sectional control technology of surrounding rock in heading for adjacent advancing working face. J. Xi’an Univ. Sci. Technol. 2024, 44, 1071–1082. [Google Scholar]
  4. Di, X.F.; Zhang, B.S.; Guo, J.Q.; Chen, L.H.; Yang, Z.P.; Zhang, Z. Research on Law of Mine Pressure Behaviour of Roadway with Facing Large Mining Height and Roof-Slope Synergistic Reinforcement Support Technology. Coal Technol. 2022, 41, 44–48. [Google Scholar]
  5. Wu, W.D.; Wang, T.C.; Bai, J.B.; Liu, J.H.; Wang, X.Y.; Xu, H.Y.; Feng, G.R. Failure Characteristics and Cooperative Control Strategies for Gob-Side Entry Driving near an Advancing Working Face: A Case Study. Processes 2024, 12, 1398. [Google Scholar] [CrossRef]
  6. Chen, X.X.; Wang, Y.L.; Zhang, T. Deformation Law and Control Technique of Surrounding Rock in Gob-side Entry Driving Under Driven Heading for Adjacent Advancing Coal Face Conditions. Saf. Coal Mines 2020, 51, 66–71,76. [Google Scholar]
  7. Kang, J. Study on Surrounding Rock Deformation Rule and Sectional Control Technology of Roadway with Strong Dynamic Pressure. Min. Saf. Environ. Prot. 2017, 44, 74–78. [Google Scholar]
  8. Liu, J.H.; Cao, Y.Q.; Wei, Z.Q.; Shen, W. Research on reasonable width of partition pillar close to goaf heading mining in thick seam of deep shaft. Chin. J. Rock Mech. Eng. 2015, 34, 4269–4277. [Google Scholar]
  9. Zong, B.D.; Chen, L.H. Bearing characteristics and mine pressure behavior of wide coal pillars facing mining. Coal Eng. 2024, 56, 1–7. [Google Scholar]
  10. Yu, Y.; Wang, X.Y.; Xue, G.Z.; Zhong, D.Y. Dynamic sectional control technology of surrounding rock in gateway driving along goaf forward to mining face. Coal Sci. Technol. 2013, 41, 43–46. [Google Scholar]
  11. Hui, G.; Niu, S.; Jing, H. Physical simulation on deformation rules of god-side roadway subjected to dynamic pressure. J. Min. Saf. Eng. 2010, 27, 77–86. [Google Scholar]
  12. Wang, M.; Bai, J.-B.; Wang, X.-Y. The surrounding rock deformation rule and control technique of the roadway driven along goaf and heading for adjacent advancing coal face. J. Min. Saf. Eng. 2012, 29, 197–202. [Google Scholar]
  13. Zhang, N.; Li, X.H.; Gao, M.S. Pretensioned support of roadway driven along next gob and heading adjacent advancing coal face and its application. Chin. J. Rock Mech. Eng. 2004, 23, 2100–2105. [Google Scholar]
  14. Qi, F.; Zhou, Y.; Cao, Z.; Zhang, C.Q.; Li, N. Width optimization of narrow coal pillar of roadway driving along goaf in fully mechanized top coal caving face. J. Min. Saf. Eng. 2016, 33, 475–480. [Google Scholar]
  15. Zhang, G.; He, F.; Lai, Y.; Song, J.W.; Xiao, P. Reasonable width and control technique of segment coal pillar with high-intensity fully-mechanized caving mining. J. China Coal Soc. 2016, 41, 2188–2194. [Google Scholar]
  16. Sun, L.; Ding, B.; Li, W.; Chen, Z.; Shang, D.; Zhang, Y.; Song, J. Width optimization and application of narrow coal pillar in gob-side entry driven in thick coal seam in Luzigou Mine. J. Min. Saf. Eng. 2023, 40, 1151–1160. [Google Scholar]
  17. Ma, Z.Q.; Chen, C.; Liang, X.C.; Chen, A.M.; Song, W.X. Field and numerical investigation on the stability of coal pillars of gob-side entry driving with top coal. Arab. J. Geosci. 2020, 13, 1193. [Google Scholar] [CrossRef]
  18. Yu, Y.; Hong, X.; Chen, F. Study on load transmission mechanism and limit equilibrium zone of coal wall in extraction opening. J. China Coal Soc. 2012, 37, 1630–1636. [Google Scholar]
  19. Zhang, D.; Bai, J.B.; Tian, Z.J.; Zhang, Z.Z.; Guo, Y.H.; Wang, R.; Xu, Y.; Fu, H.; Yan, S.; Deng, M.; et al. Stability Mechanism and Control of the Pumpable Supports in Longwall Recovery Room. Int. J. Min. Sci. Technol. 2024, 34, 957–974. [Google Scholar] [CrossRef]
  20. Minneapolis, M.N.; Itasca Consulting Group (2023). FLAC3D (Version 9.0). Available online: https://www.itascacg.com/software/flac3d (accessed on 10 April 2025).
  21. Chen, D.C.; Wang, X.Y.; Bai, J.B.; Li, M.L. Correction: Characteristics of waterproof failure and optimal width of narrow coal pillars under the coupled effects of mining, excavation and seepage. Geomech. Geophys. Geo-Energy Geo-Resour. 2024, 10, 190. [Google Scholar] [CrossRef]
  22. Zhu, G.; Liu, B.; Dou, L.; Wu, Y.P.; Ding, Z.W. Numerical simulation for whole process of longwall mining on the basis of goaf compaction effect. J. China Univ. Min. Technol. 2019, 48, 775–783. [Google Scholar]
  23. Whittles, D.N.; Lowndes, I.S.; Kingman, S.W.; Yates, C.; Jobling, S. Influence of geotechnical factors on gas flow experienced in a UK longwall coal mine panel. Int. J. Rock Mech. Min. Sci. 2006, 43, 369–387. [Google Scholar] [CrossRef]
  24. Wang, W.; Wang, S.; Liu, H.; Jiang, T.; Ren, M. The space and time characteristics of the cover stress re-establishment of the fractured rock mass in the goaf after coal mining. J. Min. Saf. Eng. 2017, 34, 127. [Google Scholar]
  25. Zhang, G.; Tao, G.; Cao, Z.; Zhao, Y.; Xu, Z.; Li, Y.; Zuo, H. Study on failure characteristics of stope overlying rock considering strain hardening characteristics of caved rock mass. Coal Sci. Technol. 2022, 50, 46–52. [Google Scholar]
  26. Yavuz, H. An estimation method for cover pressure re-establishment distance and pressure distribution in the goaf of longwall coal mines. Int. J. Rock Mech. Min. Sci. 2004, 41, 193–205. [Google Scholar] [CrossRef]
  27. Chen, D.C.; Wang, X.Y.; Wu, S.; Zhang, F.T.; Fan, Z.Z.; Wang, X.D.; Li, M.L. Study on stability mechanism and control techniques of surrounding rock in gob-side entry retaining with flexible formwork concrete wall. J. Cent. South Univ. 2023, 30, 2966–2982. [Google Scholar] [CrossRef]
  28. Chen, D.C.; Wang, X.Y.; Zhang, F.T.; Bai, J.B.; Zhao, X.Q.; Li, M.L.; Sun, S.Q. Study on the mechanism of progressive instability of special-shaped coal pillar and the stability control of roadway under the influence of mining. Rock Mech. Rock Eng. 2024, 57, 6461–6483. [Google Scholar] [CrossRef]
  29. Xia, Z.; Yao, Q.L.; Meng, G.S.; Xu, Q.; Tang, C.J.; Zhu, L.; Shen, Q. Numerical study of stability of mining roadways with 6.0-m section coal pillars under influence of repeated mining. Int. J. Rock Mech. Min. Sci. 2021, 138, 104641. [Google Scholar] [CrossRef]
  30. Shan, C.; Shang, H.; Zhang, Q.; Li, Y.; Liu, W.; Huang, P. Width and bearing strength check of “two hard” coal pillar in fully mechanized caving face. J. Min. Strat. Control Eng. 2024, 6, 023022. [Google Scholar]
  31. Xing, C.; Wang, J.; Ning, J.; Shen, Z. Instability failure mechanism of coal pillar in deep mine under dynamic disturbance. Coal Sci. Technol. 2023, 51, 29–36. [Google Scholar]
  32. Li, W.F.; Bai, J.B.; Peng, S.; Wang, X.Y.; Xu, Y. Numerical modeling for yield pillar design: A case study. Rock Mech. Rock Eng. 2015, 48, 305–318. [Google Scholar] [CrossRef]
  33. Wang, M.; Li, Z.; Shang, D.; Wei, S.; Shan, F.; Liu, H.; Zheng, K.; Li, Z. Study on energy characterization and control of unstable coal pillar in dynamic pressure gob-side entry. J. Min. Saf. Eng. 2024, 41, 958–970. [Google Scholar]
  34. Zhang, G.; He, F.L.; Jia, H.G.; Lai, Y.H. Analysis of Gateroad Stability in Relation to Yield Pillar Size: A Case Study. Rock Mech. Rock Eng. 2017, 50, 1263–1278. [Google Scholar] [CrossRef]
Figure 1. Layout of the gob-side entry driving: (a) traditional god-side entry driving; (b) gob-side entry driving along an unstable gob.
Energies 18 04303 g001
Figure 2. Large deformation characteristics of the gob-side entry driving along the unstable gob: (a) coal-pillar-side and roof displacements of entry; (b) solid-coal-side and roof displacements of entry [5].
Energies 18 04303 g002
Figure 3. Layout of the 15106 working face and headgate# 15107: (a) three-dimensional diagram; (b) top view.
Energies 18 04303 g003
Figure 4. Columnar diagram of roof and floor of coal seam.
Energies 18 04303 g004
Figure 5. Support design of 15105 headgate.
Energies 18 04303 g005
Figure 6. Layout of segment coal pillars: A, B, C—roadway layout positions; y1—original rock stress zone, y2—stress increase zone; y3—stress decrease zone.
Energies 18 04303 g006
Figure 7. Diagram of internal and external stress field distribution.
Energies 18 04303 g007
Figure 8. Model diagram of coal pillar width calculation.
Energies 18 04303 g008
Figure 9. Numerical calculation model: (a) 3D view of the numerical model; (b) boundary condition diagram of the numerical model.
Energies 18 04303 g009
Figure 10. Numerical simulation and theoretical calculation curves of the double-yield model.
Energies 18 04303 g010
Figure 11. Vertical stress distribution of 15106 gob.
Energies 18 04303 g011
Figure 12. Numerical model of strain softening of coal pillars.
Energies 18 04303 g012
Figure 13. Diagram of strain-softening model correction: (a) stress–strain curves of coal pillars with different width-to-height ratios; (b) fitting curve of theoretical and numerical simulation results.
Energies 18 04303 g013
Figure 14. Validation of the global model: (a) measuring point layout; (b) comparison between stress concentration factors from numerical simulation and field measurement.
Energies 18 04303 g014
Figure 15. Energy distribution of surrounding rock in the roadway at the intersection of mining and driving: (a) 4 m; (b) 5 m; (c) 6 m; (d) 8 m; (e) 10 m; (f) 25 m.
Energies 18 04303 g015
Figure 16. Vertical stress distribution map when different coal pillar widths are encountered during mining: (a) 4 m; (b) 5 m; (c) 6 m; (d) 8 m; (e) 10 m; (f) 25 m.
Energies 18 04303 g016
Figure 17. Distribution map of plastic zones when encountering different coal pillar widths during mining: (a) 4 m; (b) 5 m; (c) 6 m; (d) 8 m; (e) 10 m; (f) 25 m.
Energies 18 04303 g017
Figure 18. Stress distribution of surrounding rock after completion of roadway excavation: (a) 4 m; (b) 5 m; (c) 6 m; (d) 8 m; (e) 10 m; (f) 25 m.
Energies 18 04303 g018
Figure 19. Stress map of coal pillars with different widths after the excavation of headgate# 15107 is completed: (a) 4 m; (b) 5 m; (c) 6 m; (d) 8 m; (e) 10 m; (f) 25 m.
Energies 18 04303 g019
Figure 20. Comparison of the vertical stress concentration factors around the roadway [15,29].
Energies 18 04303 g020
Figure 21. Deformation curve of surrounding rock of roadway during excavation along the gob.
Energies 18 04303 g021
Figure 22. Stress contour diagram of 120 m advance at working face: (a) 4 m; (b) 5 m; (c) 6 m; (d) 8 m; (e) 10 m; (f) 25 m.
Energies 18 04303 g022
Figure 23. Optimize the roadway support diagram: (a) during the roadway driving near the advancing; (b) mining of the 15107 working face.
Energies 18 04303 g023
Figure 24. Deformation curve of the roadway surrounding rock: (a) during the roadway driving near the advancing; (b) mining of the 15107 working face.
Energies 18 04303 g024
Figure 25. The force curve of the anchor cable: (a) during the roadway driving near the advancing; (b) mining of the 15107 working face.
Energies 18 04303 g025
Table 1. Physical mechanics and geometric parameters.
VariableValueVariableValueVariableValue
γ25 kN/m3L175 mL018.3~22.3 m
hj8.1 mB141.8~46.4 mυ0.3
ξ0.8E2.5 GPaM4.2 m
h07 mKP1.4A0.43
φ032°C01.78 MPak2.5
H236 mpx0.2 MPaσc43.7 MPa
Table 2. Mechanical parameters of rock mass.
LithologyThickness
/m
Density
/(kg/m3)
Bulk Modulus
/GPa
Shear Modulus
/GPa
Cohesion
/MPa
Friction Angle
/(°)
Tensile Strength
/MPa
Siltstone4.5256010.836.46.3352.8
Sandy Mudstone2.225977.45.473.29321.69
Limestone2.5261011.729.116.61373.72
Fine Sandstone3.826506.943.973.5302.8
Siltstone1.9256010.836.46.3352.8
Sandy Mudstone2.625977.45.473.29321.69
Siltstone1.2256010.836.44.3301.8
Limestone6.9261011.729.116.01373.72
Siltstone7256010.836.46.3352.8
No. 15 Coal4.214071.931.381.78320.45
Mudstone3.123705.993.012.66311.19
Siltstone3.5256010.836.46.3352.8
Sandy Mudstone4.825977.45.473.29321.69
Table 3. Calculation coefficient of average height of caving zone [2].
Rock Type CategoryUniaxial Compressive Strength
/MPa
Empirical Parameters
S1S2
Hard Rock Stratum>402.116
Medium-Strength Rock Stratum20~404.719
Weak Rock Stratum<206.232
Table 4. Stress–strain relationship of gob materials in double-yield model.
StrainStress
/MPa
StrainStress
/MPa
StrainStress
/MPa
0.011.010.0710.360.1336.06
0.022.130.0812.840.1445.44
0.033.390.0915.780.1558.68
0.044.800.1019.310.1678.76
0.056.410.1123.630.17112.82
0.068.240.1229.050.18183.28
Table 5. Material mechanical parameters of the gob with double-yield model.
Density
(kg/m3)
Bulk Modulus
/GPa
Shear Modulus
/GPa
Internal Friction Angle
/(°)
Dilation Angle
/(°)
17104.513.081710
Table 6. Parameters of coal pillar strain-softening model.
Density
/(kg/m3)
Bulk Modulus
/GPa
Shear Modulus
/GPa
Tensile Strength
/MPa
Cohesion
/MPa
Internal Friction Angle
/(°)
Initial ValueSoftening Rate
/%
Residual ValueInitial ValueSoftening Rate
/%
Residual Value
14071.931.380.451.7810.6832119
Table 7. Peak stress and deformation of the roadway.
Width of Coal Pillar/m45681025
During the roadway driving near the advancing 15106 working faceDeformation of the Roadway Roof/mm331.48288.40276.38258.89252.4583.28
Deformation of the Roadway Floor/mm83.3258.4551.7349.2746.7017.29
Deformation of the Solid Pillar Rib/mm383.85324.63276.31241.03229.6773.12
Deformation of the Coal Pillar Rib/mm570.31510.06415.66376.16357.2676.49
Peak Stress/MPa22.420.122.221.921.922.3
During the tunneling period along the gobDeformation of the Roadway Roof/mm276.08240.09230.08215.71210.3869.40
Deformation of the Roadway Floor/mm69.4148.7143.4141.0638.7015.29
Deformation of the Solid Pillar Rib/mm320.25270.53230.26200.86191.3963.45
Deformation of the Coal Pillar Rib/mm479.56430.86350.56320.96298.0466.64
Peak Stress/MPa20.520.119.818.622.121.4
During the mining of the 15107 working faceDeformation of the Roadway Roof/mm203.25170.09160.08152.31148.2943.58
Deformation of the Roadway Floor/mm49.2538.2933.4128.5626.9210.56
Deformation of the Solid Pillar Rib/mm199.85162.23136.12120.09114.1530.19
Deformation of the Coal Pillar Rib/mm276.19257.16197.26190.24177.9836.84
Peak Stress/MPa29.827.526.827.233.724.3
Disclaimer/Publisher’s Note: The statements, opinions and data contained in all publications are solely those of the individual author(s) and contributor(s) and not of MDPI and/or the editor(s). MDPI and/or the editor(s) disclaim responsibility for any injury to people or property resulting from any ideas, methods, instructions or products referred to in the content.