Abstract
The stability of nitrogen gas foam hinders its applicability in petroleum applications. Fly ash nanoparticles and clay improve the N2 foam stability, and flue gas foams provide a cost-effective solution for carbon capture, utilization, and storage (CCUS). This study examines the stability, volume, and bubble structure of foams formed using two anionic surfactants, sodium dodecyl sulfate (SDS) and sodium dodecylbenzene sulfonate (SDBS), along with the cationic surfactant cetyltrimethylammonium bromide (CTAB), selected for their comparable interfacial tension properties. Analysis of foam stability and volume and bubble structure was conducted under different CO2/N2 mixtures, with half-life and initial foam volume serving as the evaluation criteria. The impact of fly ash and clay on SDS-N2 foam was also evaluated. The results showed that foams created with CTAB, SDBS, and SDS exhibit the greatest stability in pure nitrogen, attributed to low solubility in water and limited gas diffusion. SDS showed the highest foam strength attributable to its comparatively low surface tension. The addition of fly ash and clay significantly improved foam stability by migrating to the gas–liquid interface, creating a protective barrier that reduced drainage. Both nano fly ash and clay improved the half-life of nitrogen foam by 11.25 times and increased the foam volume, with optimal concentrations identified as 5.0 wt% for fly ash and 3.0 wt% for clay. This research emphasizes the importance of fly ash nanoparticles in stabilizing foams, therefore optimizing a foam system for enhanced oil recovery (EOR).
1. Introduction
Following the implementation of secondary oil recovery, more than 65% of the original oil in place OOIP remains in the reservoir [1,2]. This occurs due to the high interfacial tension and undesired mobility ratio between the injected fluid and formation oil. Additionally, the heterogeneity of the formation lowers the volumetric sweep efficiency. Thus, the enhanced oil recovery (EOR) technique is essential, but selecting the suitable enhanced oil recovery EOR method is crucial.
Enhanced oil recovery (EOR) methods include thermal recovery, gas injection, chemical flooding, and microbial EOR. Injection of gas such as air, carbon dioxide, nitrogen, and flue gas yields satisfactory and promising outcomes globally [3,4]. However, gas injection methods have exhibited limitations, including overriding and fingering, which occur due to the difference in density and viscosity between displacing and displaced fluid, leading to suboptimal volumetric sweep efficiency. Furthermore, in the heterogeneous oil reservoir, gas preferentially migrates through high-permeability zones and initially breaks toward production wells, leaving a large amount of oil trapped in low-permeability areas. These phenomena result in a loss of gas, rendering this method economically inadequate [5].
Foam flooding, categorized as a chemical EOR technique, enhances oil production by reducing the gas mobility, thereby stabilizing the displacement front [6]. Consequently, foam technology can mitigate the aforementioned drawbacks of gas injection. Foam is characterized as a specific form of gas dispersion in a continuous liquid phase, wherein gas is enclosed by a thin film known as lamellae [7,8]. The effective utilization of foam in EOR for mobility ratio monitoring or displacement front stabilizing relies heavily on the foam’s stability, particularly in the challenging conditions of the oil reservoir, such as high temperature, which leads to surfactant decomposition, and reservoir heterogeneity that facilitates gas flow through high-permeability zones, leaving low-permeability zones upswept. Therefore, the primary challenge lies in optimizing an appropriate foam system that can effectively function across various well conditions.
Foam can be produced using various gases, including nitrogen and carbon dioxide, with each gas yielding foam that varies in terms of strength and EOR efficiency. CO2 foam exhibits inferior quality compared to N2 foam, attributed to the weak van der Waals force in the case of CO2 due to the molecule’s lack of a permanent dipole moment. The surfactant thus prefers the liquid phase rather than the interface of CO2 and liquid, resulting in poor stability [9,10]. Moreover, N2 foam exhibits superior performance compared to CO2 foam under high temperature and pressure, as carbon dioxide’s physical properties change dramatically when temperature and pressure are raised [11]. In addition, expenses associated with carbon utilization and storage (CCUS) technologies are excessively high. Therefore, it can be advantageous economically and technically to add nitrogen into carbon dioxide gas in certain ratios to modify its foaming properties to act as flue gas. Additionally, it can identify a cost-effective approach for CCUS, thereby reducing CO2 from the atmosphere and control the carbon emissions, representing an eco-friendly sustainable technology. However, flue gas foam stabilized solely by a surfactant exhibits inefficiency due to its short half-life time; thus, the incorporation of nanoparticles is necessary to create more stable foams [9].
Fly ash, a byproduct of coal combustion, can be surface-treated to function as nanoparticles for foam stabilization. Its low cost and abundant availability distinguish it from other nanoparticle types [12,13]. Additionally, fly ash constitutes a major environmental pollutant due to its complex nature. It can cause very severe human diseases and represents an environmental threat, particularly concerning global warming, due to its CO2 emissions [13,14]. Therefore, the utilization of fly ash in the petroleum industry contributes to reducing environmental pollution and offers a cost-effective method for EOR application. The combination of fly ash and flue gas in the petroleum industry provides an innovative, cost-effective, and integrated method of carbon utilization and storage (CCUS). Fly ash stabilizes foam primarily due to its high silica SiO2 content, along with other oxides, demonstrating its effectiveness in producing a synergistic effect on foam [9,15]. Fly ash particles consist of SiO2 (71.3 wt%), Al2O3 (20.5 wt%), and Fe2O3 (6.2 wt%) with other components such as CaO, MgO, SO3, K2O, and TiO2, which occupy less than 2.0 wt% [15].
The foam is a thermally unstable system that minimizes its effectiveness under the high temperature of oil reservoirs. Foam stability is significantly influenced by the lamellae thickness, which are the thin aqueous films separating gas bubbles within the foam texture, where thinner lamellae tend to rupture more easily [16]. The clay particles are believed to enhance foam stability by increasing the extensional viscoelasticity modulus of surfactant/clay dispersions and by adsorbing onto the bubble surface. This interaction leads to the formation of a three-dimensional network structure among armored bubbles, which slows down bubble coalescence and disproportionation [17]. Adding nanoparticles into the surfactant solution enhances the foam’s stability at elevated temperatures subsurface [18]. Nano fly ash particles tend to emigrate into the liquid–gas interface, creating a shield that surrounds the bubble, which thickens its films, and minimizes liquid drainage, thereby enhancing the stability of the foam system [15]. It also increases the foam viscosity, which results in high displacement efficiency by achieving an optimal mobility ratio between displacing and displaced fluid. The mechanism of fly ash stabilizing foam is relatively comprehensive; however, its flow behavior in porous media and reservoir scaling up remains an area for further investigation. Moreover, the clay can increase the foam stability by potentially increasing its solution viscosity.
Several studies have examined the properties and structure of the mixture CO2/N2 foam. Abdelaal et al. carried out a group core flooding experiment using mixed CO2/N2 foam and found that oil recovery increased by about 62.5% compared to pure CO2 foam. This enhancement was attributed to a rise in apparent viscosity of mixed CO2/N2 foam [19]. Siddiqui et al. studied the improvement in CO2 foam with the addition of N2, revealing that when the foam structure became more spherical, it resulted in finer and more stable characteristics [20]. Harris et al. examined the rheological properties of mixed CO2/N2 foam that was utilized as a fracturing agent. This study found that the addition of small amounts of N2 to CO2 foams resulted in high viscosity at low shear rates. However, there is a lack of research on the foam stability of a mixed CO2/N2 in different proportions as a form of flue gas and analysis of flue gas foam structure in a static state [21].
Other researchers have also revealed that nanoparticles can alter wettability, reduce interfacial tension (IFT), and enhance the stability of emulsions and foams [22,23,24]. The experimental results indicated that the hydrophobicity of the nanoparticle surface highly impacts the reaction between nanoparticles and surfactant. Specifically, partly hydrophobic silica nanoparticles exhibit superior efficiency in the formation and stabilization of CO2 foam compared to fully hydrophobic silica when merged with AOT in an appropriate concentration [25]. Further investigation reveals that the ability of these particles to stabilize CO2 foam impacts current implementation of oil recovery and CO2 storage, contributing to a reduced carbon footprint during injection of CO2 in mature oil fields [26]. Eftekhari et al. also found that nano fly ash can be utilized to stabilize N2 foam in the presence of crude oil at high temperature and pressure conditions, and the crude oil tends to create stable emulsions in the presence of nano fly ash particles [12].
In this study, the foaming performance of different surfactants in different concentrations with mixed carbon dioxide/nitrogen in varying proportions was studied. CTAB, SDBS, and SDS surfactants were evaluated to optimize a foam system and identify the most effective surfactant regarding stability and volume. The mechanism of the synergistic effect between flue gas and surfactants on the foam was determined. The factors that influence foam structure and bubbles’ decay, along with time passing, were analyzed using FoamScan. We also optimized the concentrations of Nano fly ash particles and SDS surfactant together with clay particles. Moreover, the mechanism of the synergistic effect of fly ash particles on the adsorption of surfactant in the interlayer between solution and gas was elucidated. This optimized foam system can be effectively employed in enhanced oil recovery techniques from heterogeneous reservoirs under formation conditions.
2. Experiments
2.1. Materials
The surfactants utilized in this study were procured from Sigma-Aldrich (St. Louis, MO, USA). Fly ash particles were supplied by the Shengli Coal-Fired Power Plant (Dongying, China). The gases employed in the experimental procedures were obtained from Tianyuan Inc. (Tianjin, China). The selection of all chemical reagents was guided by an extensive literature review, which underscored their widespread use in comparable studies. The rationale for their selection is detailed as follows:
SDS (sodium dodecyl sulfate, sodium salt): An anionic surfactant, primarily composed of sodium alkyl sulfates, mainly lauryl; it lowers the surface tension of aqueous solutions as shown in Figure 1, and is used as a fat emulsifier, wetting agent, and analytical reagent. Its molecular structure is presented in Figure 1a.
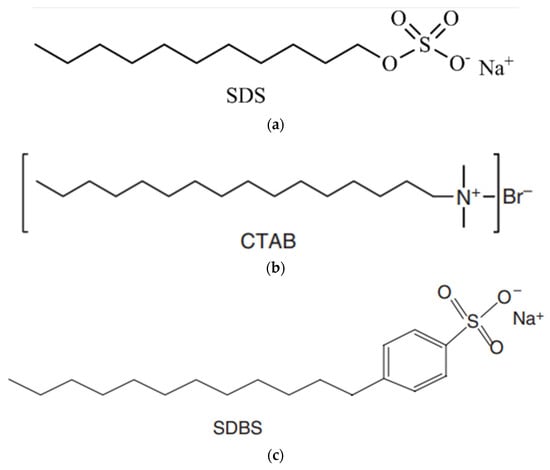
Figure 1.
Molecular structure of (a) SDS, (b) CTAB, and (c) SDBS surfactants.
CTAB (cetyltrimethylammonium bromide) is a cationic surfactant formed of a cationic organoamine with a 19-carbon tail connected to the amine group, as shown in Table 1. Its molecular structure is presented in Figure 1b.

Table 1.
Properties of surfactants used.
SDBS (Sodium dodecylbenzene sulphonate) is a high-content anionic surfactant with remarkable characteristics of good detergency, moistening, foaming, emulsification, and dispersity. Its molecular structure is presented in Figure 1c.
A comprehensive screening experiment was conducted to evaluate surfactant performance and identify the optimal candidate. SDS was selected due to its superior foaming properties, warranting further investigation. Subsequent analyses confirmed the interfacial tension (IFT) behavior, indicating a minimum IFT value of 26.1 mN/m and a maximum viscoelastic modulus of 10.25 mN/m, thereby offering valuable insights into its prospective applications in relevant systems [9].
Flue gas (Mixture of CO2/N2): purity > 99.9%, the two gases were mixed in five proportions as shown below in Table 2.

Table 2.
Proportions of the mixture of CO2/N2 gases.
Fly ash particles: The particles were obtained from the electrostatic precipitators (ESPs) and subsequently were sieved through an 800-mesh sieve to obtain sizes that are <15 μm. Figure 2a,b present the scanning electron microscopy (SEM) and transmission electron microscopy (TEM) images of fly ash particles. The figures depict the particle size employed in foam stabilization. The scale bars in the figures facilitate the estimation of the particle sizes. Figure 2a, which represents the SEM, shows the particles range in diameter from about 200 nm up to ~3 µm, predominantly between 500 nm and 2 µm. The scale bar 500 nm provides a closer look at finer surface morphology and confirms the sub-micron size of smaller particles. In the right image (TEM), particles appear mostly between 200 nm and 700 nm in diameter. Figure 2b, which represents the TEM image, offers higher resolution and contrast for examining internal structure and agglomeration. It shows the properties of fly ash particles and proves that the size of particles utilized in the experiment for enhancing SDS/N2 foam performance was in nanometers. It was illustrated that most of the particles are round and only a few of them were nonuniform, as shown in Figure 2.
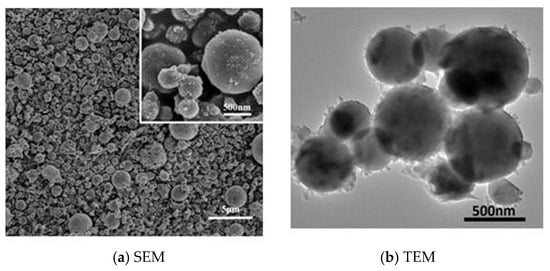
Figure 2.
(a) Scanning electron microscope SEM; (b) transmission electron microscopy TEM of fly ash particle sample.
2.2. Methodology
2.2.1. Flue Gas Preparation
Flue gas, a byproduct of combustion, exhibits varied compositions based on fuel type(s) and the type of combustion equipment or process being measured. The typical composition of flue gases emitted from natural gas-fired power plants is 8–10% CO2, 18–20% H2O, 2–3% O2, and 67–72% N2 [27]. The foaming gas used in this experiment was flue gas. CO2 and N2 gases were mixed in different proportions. In order to investigate the influence of the increase of CO2 in the gas mixture on the foam strength, CO2 was added into the mixture gradually from 0% to 100% in five proportions. The mass was not taken into account; instead, the focus was on the volume. So, the mixing of the two gases was based on volume. In a gas mixture, the partial pressure of each gas is proportional to its mole fraction and remains independent of the presence of other gases. According to Dalton’s law, the total pressure exerted by a mixture of gases equals the sum of the partial pressures [28]. The quantity of a gas in a mixture can be represented by its partial pressure or mole fraction, with partial pressure determined by the product of total pressure and mole fraction. The two gases were injected into a container, and their proportions were adjusted based on pressure indication. For instance, in preparing a mixture of 50% N2 +50% CO2, first an amount of N2 gas is injected into the container until the pressure gauge indicates 5 MPa and the injection is stopped. Subsequently CO2 gas is injected until the pressure gauge is 10 MPa and this process continues accordingly.
2.2.2. Solutions and Dispersions Preparation
CTAB, SDBS, and SDS surfactant solutions were prepared in ambient conditions. The fly ash particles and clay were added in different concentrations to prepare the dispersions. The Waring Blender method was used to evaluate the foam. First, a volume of 100 mL of solution or dispersion was put down in a stirring cup, which was subsequently covered with a thin cover. The foaming gas was injected into the stirring cup at a flow rate of 5 mL/min while being stirred at a speed of 8000 r/min for 3 min. Once the blender stopped, the foam was poured into a 500 mL measuring cylinder, and the initial volume H0 was recorded straight away, as shown in Figure 3 [9]. The foam’s initial volume was recorded as evidence of foam capacity. The time required for 50 mL of liquid to be drained from the foam system was called the foam half-life time (t1/2, min). The half-life time was used as an evaluation parameter of the foam stability.
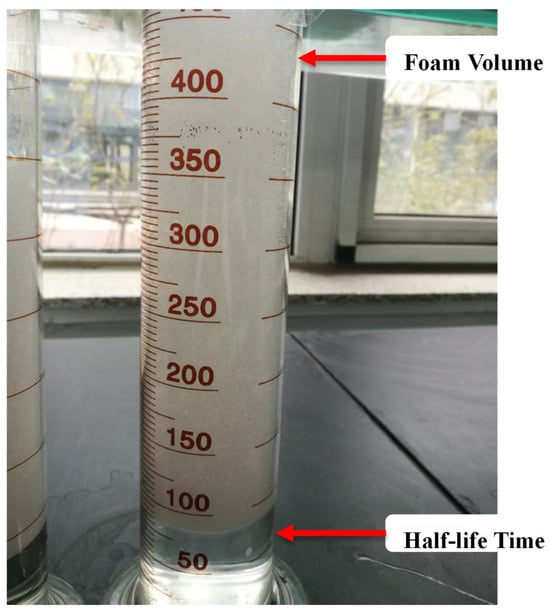
Figure 3.
Graduated cylinder used in bulk foam stability tests.
2.2.3. Foam Size Analysis
This test was accomplished using the FoamScan (TECLIS, Lyon, France). The bubble size and bubble size distribution were examined with the cell size analysis (CSA) function. The process of foam bursting was observed. The performance of the foam was assessed using a commercial instrument (FoamScan HT, TECLIS, Lyon, France; full scale of 0.8 MPa and 120 °C) as shown in Figure 4 to monitor the foam volume, foam stability, and liquid content in bubbles using image analysis and conductivity measurements. The experimental design aimed to evaluate the foam at room temperature and pressure; therefore, the full capabilities of the equipment were not fully utilized. The focus was solely on observing the foam decay over time using the camera and the system provided by the equipment. A procedure image analysis was employed to investigate the impact of several parameters such as time, surfactant type, surfactant concentration, and gas proportion on bubble size in foam. A procedure was characterized to account for the distribution of bubble size over time. The equipment was set to capture an image every 10 s to clearly show the change in bubble size and processes of foam decay.
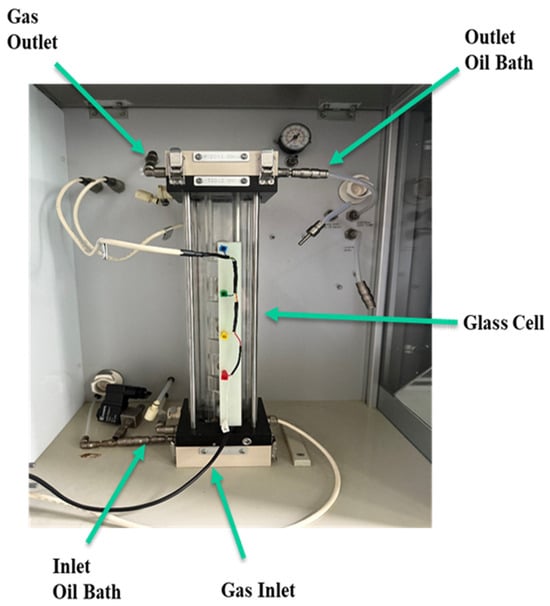
Figure 4.
FoamScan apparatus.
3. Results and Discussion
3.1. Surface Tension Properties of CTAB, SDBS, and SDS Surfactants
Figure 5 shows the surface tension of SDS, CTAB, and SDBS. Initially, surface tension decreases as surfactant concentration increases; however, beyond a certain threshold, further concentration increments do not result in additional reduction. These results align with the foam stability tests discussed in subsequent sections of this study. This can be explained by the fact that when the surfactant concentration at the surface of the surfactant solution reaches saturation, where additional surfactant molecules are unable to adsorb effectively, thereby preventing further declines in surface tension.

Figure 5.
Surface tension properties of CTAB, SDBS, and SDS.
3.2. Half-Life Times of Flue Gas Foam Stabilized by SDS/SDBS/CTAB Surfactants
In this test, the foam stability was evaluated by the half-life time measurement. The foam half-life time of the three surfactants with different concentrations and in N2/CO2 mixtures was compared. The laboratory results indicated that an increase in surfactant concentration led to an increase in half-life. However, after reaching a certain concentration, the half-life stabilized. As the CO2 proportion in the gas mixture increased, the half-life time decreased gradually, as shown in Figure 6. Among the three surfactants, in pure nitrogen, SDS exhibited the longest half-life, exceeding 8.0 min in the concentration of 0.8 (wt%), while the half-life of CTAB and SDBS in the concentration was 7.1 min and 7.41 min, respectively.

Figure 6.
Result of half-life times of (a) SDBS, (b) CTAB, and (c) SDS surfactants.
It was found that SDS has the best foaming performance compared with SDBS and CTAB due to its comparatively low surface tension. The foaming ability and stability curves for each individual surfactant increase with the increase in surfactant concentration; however, after reaching a certain point, they plateau or decline, as shown in Figure 6 and Figure 7. This happens because the increase in surfactant concentration lowers the interfacial tension IFT; beyond this point, the surfactant surface becomes saturated, elucidating the observed variations in foam’s half-life and volume. The differences in the gases’ characteristics, such as gas degradation, gas diffusion, and the solubility in water, are known as the principal causes of the high stability of air/nitrogen foams in comparison with carbon dioxide foams in static foam tests [29,30]. Therefore, nitrogen foams exhibit greater stability compared to carbon dioxide foams.

Figure 7.
Result of foam volumes of (a) SDBS, (b) CTAB, and (c) SDS surfactants.
3.3. Foam Volumes of Flue Gas Foam Stabilized by SDS/SDBS/CTAB Surfactants
The initial foam volume of the foam was investigated under different gas proportions and surfactant types. Variations in gas proportions resulted in differing foam volumes. Increasing the N2 ratio clearly increased the foaming capability. As the concentration of individual surfactant increased, the foam volume initially increased and subsequently declined, as presented in Figure 7. SDS surfactant had the best foam volume compared with CTAB and SDBS. For instance as shown in Figure 8, in the concentration of 0.8 (wt%) SDS, foam volume was 510 (mL), whilst the foam volumes of CTAB and SDBS at the same concentration were 366 (mL) and 369 (mL), respectively. A faster reduction in the surface tension of newly created interfaces between the surfactant solution and the gas results in the formation of a larger volume of foam [31,32].
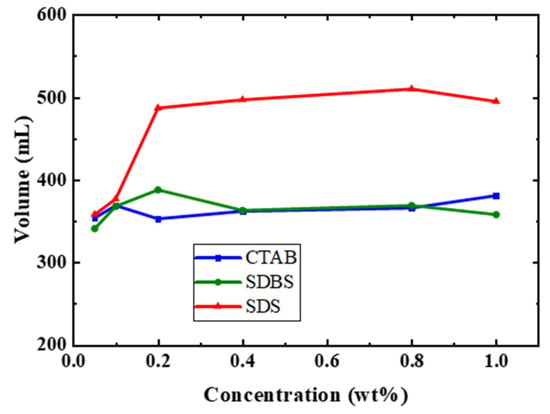
Figure 8.
Comparison of foam volumes of SDBS, CTAB, and SDS surfactants with pure nitrogen at 0.8 (wt%).
The experimental results showed that the stability of CTAB, SDBS, and SDS foam is optimal in a pure nitrogen environment, as shown in Figure 8. This is attributed to the lower solubility of N2 in water compared to CO2, which decreases gas diffusion between bubble films and leads to high foam stability. Another probable cause is that CO2 has a weaker Van Der Waals force compared with N2 due to the molecule’s lack of a permanent dipole moment. As a result, the surfactant remains in the liquid phase rather than at the interface of the gas and liquid, which leads to poor stability. It was illustrated that the CO2 foam is weaker than the N2 foam, attributable to the higher mobility of the CO2 foam compared to that of the N2 foam [33].
3.4. The Analysis of Foam Size and Structure
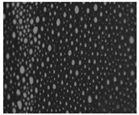
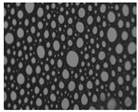
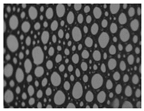
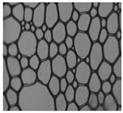
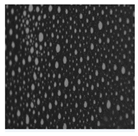
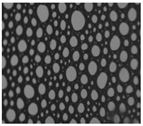
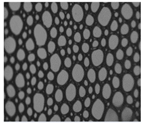
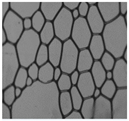
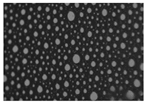
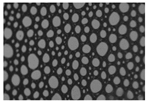
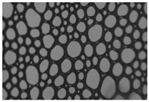
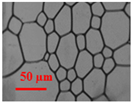
Numerous factors can affect the performance of foam, including the gas type used. Consequently, this experiment aimed to observe the foam performance at different gas proportions of nitrogen and carbon dioxide. We used four time nodes (0 min, 5 min, 10 min, and 20 min) and five gas proportions of CO2/N2 as shown in Table 3 to compare the bubble growth and foam evolution of SDS solution.

Table 3.
Visual micrographs showing foam structure evolution of 0.8 wt% SDS with different gas ratios at different times after 20 min.
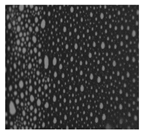
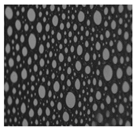
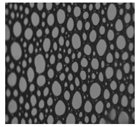
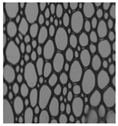
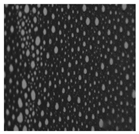
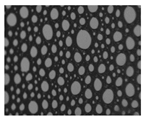
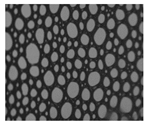
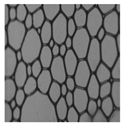
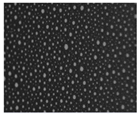
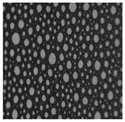
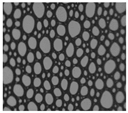
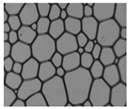
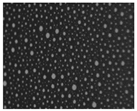
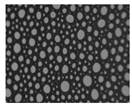
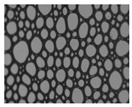
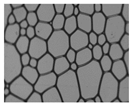
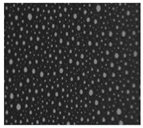
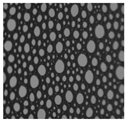
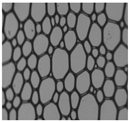
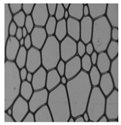
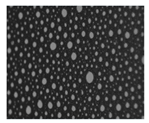
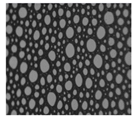
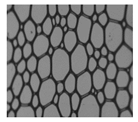
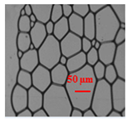
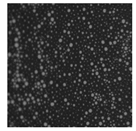
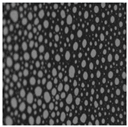
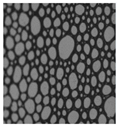
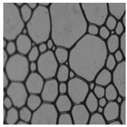
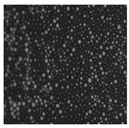
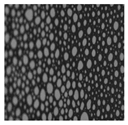
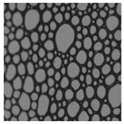
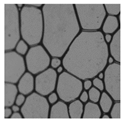
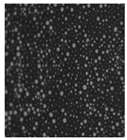
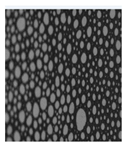
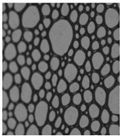
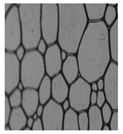
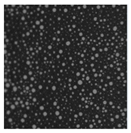
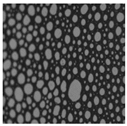
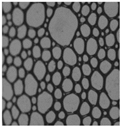
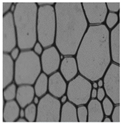
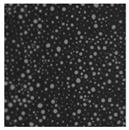
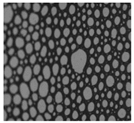
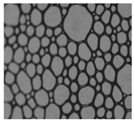
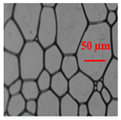
The influence of gas proportion on the stability of SDS foam was analyzed through bubble size distribution and the image of bubble size distribution over time. The extent of bubble coalescence and coarsening was quantified from the distribution of bubble sizes at 20 min. Table 3 shows the bubble size distribution for the foam generated with SDS surfactant with different gas proportions. In the case of pure nitrogen, the bubbles were very fine and small, indicating low bubble coarsening and high foam stability. The visual micrographs indicate that as the concentration of N2 in the gas mixture increases from 0% to 100%, the foam bubbles tend to become smaller and finer. Furthermore, the bubbles become more similar in terms of size, indicating that the bubble size distribution becomes limited [20]. The analysis of the data obtained from the bubble-size experiments revealed that over time, the foams exhibit a tendency to become progressively coarser. Additionally, a smoother foam texture is anticipated to exhibit greater stability than a coarser texture, which can elevate the pressure gradients to higher values [34].
The strong N2 foams exhibited finer and denser foam textures compared with the weaker CO2 foams. This observation supports the idea that smaller bubbles result in more liquid films, which is anticipated to reduce gas mobility more significantly than larger bubbles. Finer-textured foam contains more lamellae per unit volume, potentially resulting in a greater resistance for gas to flow [11]. The gas transfer rate through foam films is described by film permeability using Princen and Mason’s equation [35].
While the N2 and CO2 foams have similar values for film thickness hw, diffusion coefficient D, and surfactant layer permeability kml [36], CO2 has a Henry’s law coefficient H about 20 times higher than N2. This results in the CO2 foam having roughly 20 times higher gas permeability, likely explaining why the CO2 foam is less stable than the N2 foam.
As noted by Harris et al. [37], replacing a portion of CO2 with N2 may enhance viscosity at low shear rates. Consequently, the visual micrographs of foam presented in Table 3 indicate that as the nitrogen proportion increases among the CO2/N2 mixture, the foam becomes finer and more spherical. For instance, at the time node of 20 min and a gas proportion of (50% N2 + 50% CO2), the bubbles become smaller as shown in Figure 9. From Figure 9, it can be observed that the total number of bubbles is 45, with a mean bubble size of 15.98 nm. The minimum and maximum sizes are 5.65 nm and 29.10 nm, respectively. The standard deviation is 5.86 nm, which means the bubble sizes vary around the mean by approximately ±5.86 nm.
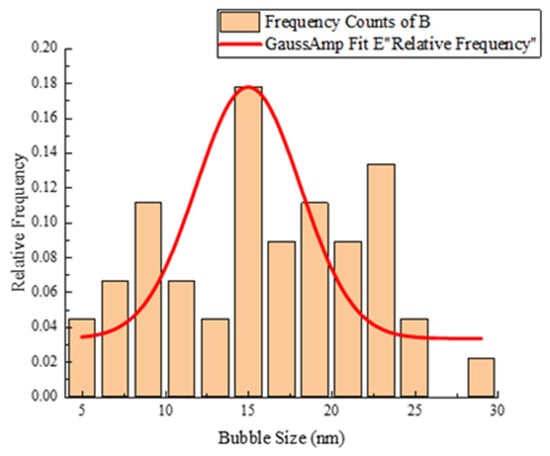
Figure 9.
Bubble size distribution of 50% N2+ 50% CO2 and 0.8 wt% SDS at the time node of 20 min.
The difference in the foam structure between pure nitrogen and pure carbon dioxide is very obvious. The behaviors of the CO2 and N2 foams differ significantly, attributed to solubility in surfactant solution, diffusion, pH, ionic strength, and density and viscosity [33,38].
Several studies reveal that the coarsening, or Ostwald ripening, process occurs due to pressure differentials between interconnected large and small bubbles [9,39]. The gas diffuses from the small bubble to the large bubble, resulting in an increase in the size of the larger bubble and a decrease in the size of the smaller bubble. This phenomenon contributes to foam instability. The higher solubility of CO2 in water results in reduced stability of the CO2 foam compared to the N2 foam.
The foam micrographs presented in Table 4 and Table 5 can be explained using the same methodology applied to Table 3. The results also revealed that with all different surfactant types and surfactant concentrations, the foams, which were produced by pure nitrogen gas, are the smallest and finest at the same point in time, as shown in Table 3, Table 4 and Table 5.

Table 4.
Visual micrographs showing foam structure evolution of 0.4 wt% SDBS with different gas ratios at different times after 20 min.

Table 5.
Visual micrographs showing foam structure evolution of 0.4 wt% CTAB with different gas ratios at different times after 20 min.
The visual micrographs of the SDBS foam and bubble growth are shown in Table 4. These visual micrographs can be interpreted similarly to those presented in Table 3. The images of different N2/CO2 ratios and times were compared to each other. The results show that the small and big bubbles merge to form larger ones with thinner films. The process of film thinning ultimately results in the disappearance, indicating low foam stability. The increase of the CO2 proportion in the flue gas mixture accelerates the thinning process. The images also show that the foam of SDBS has less stability when compared with CTAB and SDS.
The bubble size distribution as a function of time for 0.4 wt% CTAB and various gas proportions is shown in Table 5. This experiment aimed to study the evolution of bubble size during the foam decay process. The results showed that bubble size increased with time passing for all the tested concentrations, which may be attributed to bubble coalescence and coarsening processes. The experimental results reveal the bubble’s size and structure evolution along with the progression of time. The increase in bubble size results from gas diffusion from the larger bubbles to smaller ones. The gas diffusion, which leads to bubble coarsening or Ostwald ripening, is driven by the Laplace pressure between interconnected bubbles. Additionally, the foam films get thinner with liquid discharge and diminish, which explains the instability of the foaming system.
3.5. Performance of Nitrogen Foam Stabilized by SDS, Clay, and Nano Fly Ash Particles
3.5.1. Test of Foam Half-Life Time
Following the findings in the previous section that indicated SDS exhibited superior foaming performance, a more in-depth investigation was conducted here. Different SDS concentrations were employed alongside various concentrations of nano fly ash and clay particles to evaluate the foam stability, as shown in Figure 10. The half-time of generated foam is referred to as the time at which the height of the foam column reaches half of its initial value, as shown in Figure 3. A longer half-time of generated foam is associated with increased stability of the foam [40]. The stability of foam plays a crucial role in influencing the extent of mobility reduction for both gas and surfactant slugs. Weak or unstable foam results in unfavorable mobilities of gas and surfactant solution, leading to poor displacement efficiency. In contrast, stable foam lowers the mobilities of two phases to a favorable value, thereby improving the displacement efficiency of the process. Consequently, one of the most important understandings about foam performance is how to generate and sustain a flow of “strong” or “stable” foam. Pure nitrogen was used as a foaming gas due to its priority over CO2, as the usage of CO2 was being avoided due to its significant solubility in water and corrosiveness [41].
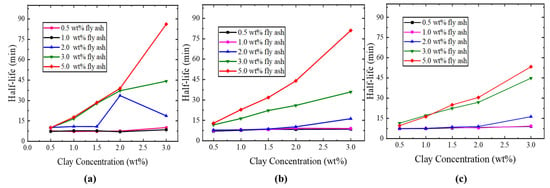
Figure 10.
Result of half-life times of (a) 0.3 wt% SDS, (b) 0.6 wt% SDS, and (c) 1.0 wt% SDS surfactant.
Nano fly ash particles were added to the SDS solution in proper concentrations to enhance its foaming capability and half-life time. Clay was incorporated to increase the solution viscosity. Different SDS concentrations were selected to evaluate the addition of fly ash and clay on their foaming quality with different concentrations of nano fly ash and clay, leading to the optimization of a proper formulation. It has been found that the half-life increased very significantly with the increase in fly ash concentration, as shown in Figure 10. The optimal concentration of nano fly ash particles was determined to be 5.0 wt%, while the ideal clay concentration was 3.0 wt%. In other words, the higher the fly ash particles and clay concentration, the better the foam performance. However, the low concentration of the SDS surfactant was preferred to generate stronger foam with longer half-life time, as shown in Figure 10a. Therefore, the presence of fly ash particles and clay reduced the surfactant concentration required for improved foam quality, which is very feasible economically. This result indicates that a high concentration of surfactant is not essential for foam stability. Foam drainage significantly affects foam stability and is a crucial factor in determining the behavior of foam in porous media [42]. Therefore, nano fly ash particles were added into the SDS surfactant solution to strengthen the bubble films by the mechanism of bridging together and forming a dense particle “shield” surrounding the bubble [15]. The adsorption of fly ash particles onto the surface of the liquid film can enhance the viscoelasticity of the bubbles, effectively inhibiting the drainage of the liquid layer and gas diffusion between bubbles, delaying the aggregation and rupture speed of foam, thereby improving the stability of the foam system [43].
3.5.2. Test of Foam Volume
This study examines the influence of adding different concentrations of nano fly ash and clay to the SDS solution. The foam volume of varying fly ash concentrations was compared as shown in Figure 11a–c. The laboratory experiment showed that an increase in fly ash concentration initially led to an increase in foam volume, followed by a subsequent decrease. The increase in clay concentration exhibited a trend similar to that of fly ash. When SDS concentration changed from 0.3 (wt%) to 0.6 (wt%), foam volume increased noticeably. The graph shows that the highest volume of 0.3 (wt%) SDS was approximately 535 (mL) with the addition of 1.0 (wt%) fly ash nanoparticles. But the highest volume of 0.6 (wt%) SDS was 605 (mL). The results indicate that the addition of fly ash nanoparticles enhanced the foam capacity compared with SDS alone, as shown in Figure 7c. Foam volume means foam ability; high foam volume indicates that fine foam can be obtained by mixing liquid and gas. Moreover, high foam ability signifies that foam can be reformed in porous media following foam rupture.

Figure 11.
Result of foam volumes of (a) 0.3 wt% SDS, (b) 0.6 wt% SDS, and (c) 1.0 wt% SDS surfactants.
The addition of fly ash particles to the SDS solution promotes their migration to the gas–liquid interface, resulting in the formation of a shield that protects the bubbles and minimizes liquid drainage. Nano fly ash particles are adsorbed at the interface to increase its rigidity and hence result in a high stability foam. The enhancement in foam quality when the clay is added to the fly ash/surfactant solution is likely because it increases the viscoelasticity of the foam film. This elucidates the capacity of the bubbles to endure external disturbances, thus preventing coalescence and decay. The enhancement in foamability and volume when fly ash particles were added indicates the synergy effect between the SDS surfactant and the nano fly ash particles to stabilize the nitrogen foam.
4. Conclusions
The gas injection method can be limited in effectiveness for enhanced oil recovery (EOR) due to reservoir heterogeneity and the low viscosity and density of the injected gas. Furthermore, under severe reservoir conditions, surfactants readily decompose, which diminishes their foam stabilization ability. Nanoparticles can address this by stabilizing the foam, controlling gas mobility, and withstanding harsh reservoir conditions. In this research, we first present a strategy that enhances oil recovery while simultaneously contributing to CO2 utilization, thereby offering a cost-effective technology for carbon capture, utilization, and storage (CCUS). Rather than isolating CO2 from the atmosphere, which may be a costly process, we mix carbon dioxide and nitrogen in different proportions to act as flue gas. Additionally, nano fly ash and clay particles serve as foam stabilizers, embodying a method that concurrently mitigates air pollution while enhancing oil production.
In this approach, a foaming system was designed and optimized through screening different surfactant types and concentrations. Various concentrations of SDS surfactant, clay, and nano fly ash particles were examined to evaluate the synergistic effect between the surfactant and nanoparticles on foam stabilization, leading to an optimized new foam formulation. The results showed that as the nitrogen proportion in the flue gas mixture increased, foam half-life and volume increased significantly. Micrographs indicated a steady reduction in bubble size with increasing N2 concentration (0–100%). Nitrogen produced more stable foam than carbon dioxide due to differences in their physical and chemical properties.
Among the tested surfactants (CTAB, SDBS, and SDS), SDS demonstrated superior foam volume and half-life across all gas proportions. The half-life was longer than other surfactants, attributed to its comparatively low surface tension. When clay concentration increases at fixed SDS and fly ash concentrations, the foam half-life increases steadily. However, the foam volume increases up to one point, then decreases. The half-life and volume of foam increased significantly with increasing fly ash concentration. Furthermore, nano fly ash particles adsorb at the gas–liquid interface, enhancing its rigidity and thereby stabilizing the foam. At high fly ash concentrations, low SDS concentrations yield the longest foam half-life, whereas at high SDS concentrations, the same fly ash concentration results in poorer foam stability.
Author Contributions
Conceptualization, J.D.R.; Methodology, J.D.R.; Validation, T.L.; Investigation, F.Z.; Data curation, J.D.R.; Writing—original draft, J.D.R.; Writing—review & editing, F.Z., T.L., A.A.A. and S.Y.; Visualization, F.Z.; Supervision, F.Z. All authors have read and agreed to the published version of the manuscript.
Funding
This work was financially supported by the General Program Grant from the Key Program of the Joint Fund from the National Natural Science Foundation of China (U23B200094), and the National Natural Science Foundation of China (52174045).
Data Availability Statement
The original contributions presented in this study are included in the article. Further inquiries can be directed to the corresponding author.
Conflicts of Interest
The authors declare no conflict of interest.
References
- Ragab, A.; Mansour, E.M. Enhanced Oil Recovery: Chemical Flooding. In Geophysics and Ocean Waves Studies; Essa, K.S., Di Risio, M., Celli, D., Pasquali, D., Eds.; IntechOpen: London, UK, 2021; ISBN 978-1-78985-372-8. [Google Scholar]
- Sahimi, M. Flow and Transport in Porous Media and Fractured Rock: From Classical Methods to Modern Approaches, 2nd ed.; Wiley-VCH: Weinheim, Germany, 2011; ISBN 978-3-527-40485-8. [Google Scholar]
- Liang, T.; Zhao, X.; Yuan, S.; Zhu, J.; Liang, X.; Li, X.; Zhou, F. Surfactant-EOR in Tight Oil Reservoirs: Current Status and a Systematic Surfactant Screening Method with Field Experiments. J. Pet. Sci. Eng. 2021, 196, 108097. [Google Scholar] [CrossRef]
- Liu, P.; Zhang, X.; Wu, Y.; Li, X. Enhanced Oil Recovery by Air-Foam Flooding System in Tight Oil Reservoirs: Study on the Profile-Controlling Mechanisms. J. Pet. Sci. Eng. 2017, 150, 208–216. [Google Scholar] [CrossRef]
- Jones, S.A.; van der Bent, V.; Farajzadeh, R.; Rossen, W.R.; Vincent-Bonnieu, S. Surfactant Screening for Foam EOR: Correlation between Bulk and Core-Flood Experiments. Colloids Surf. A Physicochem. Eng. Asp. 2016, 500, 166–176. [Google Scholar] [CrossRef]
- Agneta, M.; Zhaomin, L.; Chao, Z.; Gerald, G. Investigating Synergism and Antagonism of Binary Mixed Surfactants for Foam Efficiency Optimization in High Salinity. J. Pet. Sci. Eng. 2019, 175, 489–494. [Google Scholar] [CrossRef]
- Hirasaki, G.J. The Steam-Foam Process. J. Pet. Technol. 1989, 41, 449–456. [Google Scholar] [CrossRef]
- Smith, D.H. Foams: Fundamentals and Applications in the Petroleum Industry; Schramm, L.L., Ed.; Advances in Chemistry; American Chemical Society: Washington, DC, USA, 1994; Volume 242, ISBN 978-0-8412-2719-4. [Google Scholar]
- Li, S.; Li, Z.; Wang, P. Experimental Study of the Stabilization of CO2 Foam by Sodium Dodecyl Sulfate and Hydrophobic Nanoparticles. Ind. Eng. Chem. Res. 2016, 55, 1243–1253. [Google Scholar] [CrossRef]
- Zhang, S.Y. Foams Stabilized by Laponite/Surfactants and HMHEC/Surfactants. Ph.D. Thesis, Shandong University, Jinan, China, 2008. [Google Scholar]
- Aarra, M.G.; Skauge, A.; Solbakken, J.; Ormehaug, P.A. Properties of N2- and CO2-Foams as a Function of Pressure. J. Pet. Sci. Eng. 2014, 116, 72–80. [Google Scholar] [CrossRef]
- Eftekhari, A.A.; Krastev, R.; Farajzadeh, R. Foam Stabilized by Fly Ash Nanoparticles for Enhancing Oil Recovery. Ind. Eng. Chem. Res. 2015, 54, 12482–12491. [Google Scholar] [CrossRef]
- Vilakazi, A.Q.; Ndlovu, S.; Chipise, L.; Shemi, A. The Recycling of Coal Fly Ash: A Review on Sustainable Developments and Economic Considerations. Sustainability 2022, 14, 1958. [Google Scholar] [CrossRef]
- Yao, Z.T.; Ji, X.S.; Sarker, P.K.; Tang, J.H.; Ge, L.Q.; Xia, M.S.; Xi, Y.Q. A Comprehensive Review on the Applications of Coal Fly Ash. Earth-Sci. Rev. 2015, 141, 105–121. [Google Scholar] [CrossRef]
- Lv, Q.; Li, Z.; Li, B.; Husein, M.; Li, S.; Shi, D.; Liu, W.; Bai, H.; Sheng, L. Synergistic Mechanism of Particulate Matter (PM) from Coal Combustion and Saponin from Camellia Seed Pomace in Stabilizing CO2 Foam. Energy Fuels 2018, 32, 3733–3742. [Google Scholar] [CrossRef]
- Aronson, A.S.; Bergeron, V.; Fagan, M.E.; Radke, C.J. The Influence of Disjoining Pressure on Foam Stability and Flow in Porous Media. Colloids Surf. A Physicochem. Eng. Asp. 1994, 83, 109–120. [Google Scholar] [CrossRef]
- Fink, J. Drilling Muds. In Petroleum Engineer’s Guide to Oil Field Chemicals and Fluids; Elsevier: Amsterdam, The Netherlands, 2021; pp. 1–122. ISBN 978-0-323-85438-2. [Google Scholar]
- Orujov, A.; Coddington, K.; Aryana, S.A. A Review of CCUS in the Context of Foams, Regulatory Frameworks and Monitoring. Energies 2023, 16, 3284. [Google Scholar] [CrossRef]
- Abdelaal, A.; Gajbhiye, R.; Al-Shehri, D. Mixed CO2/N2 Foam for EOR as a Novel Solution for Supercritical CO2 Foam Challenges in Sandstone Reservoirs. ACS Omega 2020, 5, 33140–33150. [Google Scholar] [CrossRef] [PubMed]
- Siddiqui, M.A.Q.; Gajbhiye, R.N. Stability and Texture of CO2/N2 Foam in Sandstone. Colloids Surf. A Physicochem. Eng. Asp. 2017, 534, 26–37. [Google Scholar] [CrossRef]
- Harris, P.C. A Comparison of Mixed-Gas Foams with N2 and CO2 Foam Fracturing Fluids on a Flow-Loop Viscometer. SPE Prod. Facil. 1995, 10, 197–203. [Google Scholar] [CrossRef]
- Kazemzadeh, Y.; Shojaei, S.; Riazi, M.; Sharifi, M. Review on Application of Nanoparticles for EOR Purposes: A Critical Review of the Opportunities and Challenges. Chin. J. Chem. Eng. 2019, 27, 237–246. [Google Scholar] [CrossRef]
- Rattanaudom, P.; Shiau, B.-J.B.; Harwell, J.H.; Suriyapraphadilok, U.; Charoensaeng, A. The Study of Ultralow Interfacial Tension SiO2-Surfactant Foam for Enhanced Oil Recovery. J. Pet. Sci. Eng. 2022, 209, 109898. [Google Scholar] [CrossRef]
- Sun, X.; Zhang, Y.; Chen, G.; Gai, Z. Application of Nanoparticles in Enhanced Oil Recovery: A Critical Review of Recent Progress. Energies 2017, 10, 345. [Google Scholar] [CrossRef]
- Zhao, J.; Torabi, F.; Yang, J. The Synergistic Role of Silica Nanoparticle and Anionic Surfactant on the Static and Dynamic CO2 Foam Stability for Enhanced Heavy Oil Recovery: An Experimental Study. Fuel 2021, 287, 119443. [Google Scholar] [CrossRef]
- Rognmo, A.U.; Heldal, S.; Fernø, M.A. Silica Nanoparticles to Stabilize CO2-Foam for Improved CO2 Utilization: Enhanced CO2 Storage and Oil Recovery from Mature Oil Reservoirs. Fuel 2018, 216, 621–626. [Google Scholar] [CrossRef]
- Song, C.; Pan, W.; Srimat, S.T.; Zheng, J.; Li, Y.; Wang, Y.H.; Zhu, Q.M. Tri-Reforming of Methane over Ni Catalysts for CO2 Conversion to Syngas with Desired H2/CO Ratios Using Flue Gas of Power Plants without CO2 Separation. In Studies in Surface Science and Catalysis; Elsevier: Amsterdam, The Netherlands, 2004; Volume 153, pp. 315–322. [Google Scholar]
- Ahmed, T. Equilibrium Ratios. In Working Guide to Vapor-Liquid Phase Equilibria Calculations; Elsevier: Amsterdam, The Netherlands, 2010; pp. 5–7. ISBN 978-1-85617-826-6. [Google Scholar]
- Alkan, H.; Goktekin, A.; Satman, A. A Laboratory Study of CO2-Foam Process for Bati Raman Field, Turkey. In Proceedings of the Middle East Oil Show, Manama, Bahrain, 16–19 November 1991; Society of Petroleum Engineers: Manama, Bahrain, 1991. [Google Scholar]
- Lake, L.W. Enhanced Oil Recovery; Prentice Hall: Englewood Cliffs, NJ, USA, 1989; ISBN 978-0-13-281601-4. [Google Scholar]
- Kawale, D.; van Nimwegen, A.T.; Portela, L.M.; van Dijk, M.A.; Henkes, R.A.W.M. The Relation between the Dynamic Surface Tension and the Foaming Behaviour in a Sparger Setup. Colloids Surf. A Physicochem. Eng. Asp. 2015, 481, 328–336. [Google Scholar] [CrossRef]
- Rosen, M.J. Surfactants and Interfacial Phenomena; John Wiley & Sons, Inc.: Hoboken, NJ, USA, 2004; ISBN 978-0-471-47818-8. [Google Scholar]
- Farajzadeh, R.; Andrianov, A.; Bruining, H.; Zitha, P.L.J. Comparative Study of CO2 and N2 Foams in Porous Media at Low and High Pressure−Temperatures. Ind. Eng. Chem. Res. 2009, 48, 4542–4552. [Google Scholar] [CrossRef]
- Prud’homme, R.K.; Khan, S.A. Foams: Theory Measurements, and Applications, 1st ed.; Surfactant Science Series; Routledge: Abingdon, UK, 2017; Volume 57, ISBN 978-0-203-75570-9. [Google Scholar]
- Princen, H.M.; Mason, S.G. The Permeability of Soap Films to Gases. J. Colloid Sci. 1965, 20, 353–375. [Google Scholar] [CrossRef]
- Farajzadeh, R.; Muruganathan, R.M.; Krastev, R.; Rossen, W.R. Effect of Gas Type on Foam Film Permeability and Its Implications for Foam Flow in Porous Media. In Proceedings of the SPE EUROPEC/EAGE Annual Conference and Exhibition, Barcelona, Spain, 14–17 June 2010; SPE: Richardson, TX, USA, 2010. [Google Scholar]
- Harris, P.C. Dynamic Fluid-Loss Characteristics of CO2-Foam Fracturing Fluids. SPE Prod. Eng. 1987, 2, 89–94. [Google Scholar] [CrossRef]
- Chabert, M.; Morvan, M.; Nabzar, L. Advanced Screening Technologies for the Selection of Dense CO2 Foaming Surfactants. In Proceedings of the SPE Improved Oil Recovery Symposium, Tulsa, OK, USA, 14–18 April 2012; SPE: Richardson, TX, USA, 2012; p. SPE-154147-MS. [Google Scholar]
- Stevenson, P. Inter-Bubble Gas Diffusion in Liquid Foam. Curr. Opin. Colloid Interface Sci. 2010, 15, 374–381. [Google Scholar] [CrossRef]
- Memon, M.K.; Shuker, M.T.; Elraies, K.A. Study of Blended Surfactants to Generate Stable Foam in Presence of Crude Oil for Gas Mobility Control. J. Pet. Explor. Prod. Technol. 2017, 7, 77–85. [Google Scholar] [CrossRef]
- Hadian Nasr, N.; Mahmood, S.M.; Akbari, S.; Hematpur, H. A Comparison of Foam Stability at Varying Salinities and Surfactant Concentrations Using Bulk Foam Tests and Sandpack Flooding. J. Pet. Explor. Prod. Technol. 2020, 10, 271–282. [Google Scholar] [CrossRef]
- Mast, R.F. Microscopic Behavior of Foam in Porous Media. In Proceedings of the Fall Meeting of the Society of Petroleum Engineers of AIME, San Antonio, TX, USA, 8–11 October 1972; SPE: Richardson, TX, USA, 1972; p. SPE-3997-MS. [Google Scholar]
- Wang, T.; Fan, H.; Yang, W.; Meng, Z. Stabilization Mechanism of Fly Ash Three-Phase Foam and Its Sealing Capacity on Fractured Reservoirs. Fuel 2020, 264, 116832. [Google Scholar] [CrossRef]
Disclaimer/Publisher’s Note: The statements, opinions and data contained in all publications are solely those of the individual author(s) and contributor(s) and not of MDPI and/or the editor(s). MDPI and/or the editor(s) disclaim responsibility for any injury to people or property resulting from any ideas, methods, instructions or products referred to in the content. |
© 2025 by the authors. Licensee MDPI, Basel, Switzerland. This article is an open access article distributed under the terms and conditions of the Creative Commons Attribution (CC BY) license (https://creativecommons.org/licenses/by/4.0/).
