Article

Study on Thermal Conductivity Prediction of Granites Using Data Augmentation and Machine Learning

1
PowerChina Huadong Engineering Corporation Limited, Hangzhou 311122, China
2
Zhejiang Huadong Geotechnical Investigation & Design Institute Co., Ltd., Hangzhou 310023, China
3
Faculty of Engineering, China University of Geosciences, Wuhan 430074, China
4
College of Construction Engineering, Jilin University, Changchun 130026, China
*
Author to whom correspondence should be addressed.
Energies 2025, 18(15), 4175; https://doi.org/10.3390/en18154175
Submission received: 22 May 2025 / Revised: 24 July 2025 / Accepted: 4 August 2025 / Published: 6 August 2025

Abstract

With the global low-carbon energy transition, accurate prediction of thermal and physical parameters of deep rock masses is critical for geothermal resource development. To address the insufficient generalization ability of machine learning models caused by scarce measured data on granite thermal conductivity, this study focused on granites from the Gonghe Basin and Songliao Basin in Qinghai Province. A data augmentation strategy combining cubic spline interpolation and Gaussian noise injection (with noise intensity set to 10% of the original data feature range) was proposed, expanding the original 47 samples to 150. Thermal conductivity prediction models were constructed using Support Vector Machine (SVM), Random Forest (RF), and Backpropagation Neural Network(BPNN). Results showed that data augmentation significantly improved model performance: the RF model exhibited the best improvement, with its coefficient of determination R2 increasing from 0.7489 to 0.9765, Root Mean Square Error (RMSE) decreasing from 0.1870 to 0.1271, and Mean Absolute Error (MAE) reducing from 0.1453 to 0.0993. The BPNN and SVM models also improved, with R2 reaching 0.9365 and 0.8743, respectively, on the enhanced dataset. Feature importance analysis revealed porosity (with a coefficient of variation of 0.88, much higher than the longitudinal wave velocity’s 0.27) and density as key factors, with significantly higher contributions than longitudinal wave velocity. This study provides quantitative evidence for data augmentation and machine learning in predicting rock thermophysical parameters, promoting intelligent geothermal resource development.

1. Introduction

With the global energy structure shifting towards low-carbon, geothermal resources, as a clean and stable renewable energy source, are becoming an important way to alleviate the energy crisis and environmental pollution through their development and utilization [1]. The large-scale application of technologies such as Hot Dry Rock (HDR) power generation and ground source heat pump systems has promoted the extension of deep geological engineering to complex formations with high temperature and pressure [2]. The Gonghe Basin, Songliao Basin, and other regions in Qinghai Province, China, have been discovered to have abundant medium to high temperature geothermal reservoirs, and their development potential has strategic significance for building a new energy system [3]. However, the accurate acquisition of thermal and physical parameters of deep rock masses remains one of the core technological bottlenecks restricting the efficient development of geothermal resources.
The thermal conductivity coefficient, as a core parameter characterizing the thermal conductivity of rocks, directly affects the simulation of the temperature field of thermal reservoirs, the calculation of heat flux density, and the design of reservoir modification schemes [4]. In Enhanced Geothermal Systems (EGS), the accuracy of thermal conductivity determines the evaluation of thermal transfer efficiency and well network optimization layout of artificial thermal reservoirs [5]. In drilling engineering, the thermal conductivity of rocks is closely related to wellbore stability and drilling fluid heat dissipation design [6]. Therefore, establishing a high-precision thermal conductivity prediction model plays a decisive role in the economic and safety aspects of geothermal resource development.
At present, the prediction methods for thermal conductivity mainly include experimental testing, theoretical models, empirical formulas, and machine learning algorithms [7]. Experimental testing (such as hot wire method and laser flash method) can provide reliable data, but due to the high cost of core acquisition and long sample preparation cycle, it is difficult to meet the requirements of large-scale engineering [8]. Theoretical models (such as Maxwell Eucken equation, Hashin–Shtrikman boundary) rely on simplified microstructural assumptions and are less applicable to rocks under complex geological conditions [9]. Empirical formulas (such as Deere’s formula and Birch’s law) are based on fitting specific regional data and have limited extrapolation capabilities [10]. In recent years, machine learning methods have been gradually applied to predict rock physics parameters due to their powerful representation ability of nonlinear relationships [11]. Zamanzadeh [12] developed a CCS prediction model using mud logging data and various machine learning (ML) algorithms, including multi-layer perceptron neural network (MLPNN), least squares support vector machine (LSSVM), Gaussian process regression (GPR), and Random Forest (RF), providing a reliable and cost-effective solution for vertical well CCS prediction. Xu [13] uses deep neural networks to process GPR signals, takes radar images as input, and generates structural information related to rock layers and lithological structures as output. Through training and learning, it successfully establishes an effective mapping relationship between radar images and lithological label signals. Ali [14] utilizes machine learning methods such as artificial neural networks (ANNs) and fuzzy logic (FL) to predict porosity curves by inputting datasets, including gamma ray (GR), neutron porosity (NPHI), density (RHOB), and acoustic (DT) logging from five wells located in the Qadirpur gas field. Bu [15] conducted experimental research on the relationship between TC and temperature, mineral composition, porosity, and density after high temperature. Subsequently, a total of 229 measurement values containing four input variables (i.e., temperature, porosity, density, and quartz content) were collected, and a new prediction model for granite TC was proposed using a Backpropagation Neural Network (BPNN-TCPM). The results indicate that the TC of granite has a strong dependence on temperature and decreases with increasing temperature.
In practical geological engineering research, obtaining a large amount of high-quality rock physical property data often faces many difficulties due to factors such as difficulty in sampling, high experimental costs, and complex and diverse geological conditions [16]. Especially for deep geological rock masses, the scarcity of sample size has become a bottleneck problem that restricts the construction and analysis of relevant models [17]. Insufficient data not only leads to insufficient model training, affecting the generalization ability and prediction accuracy of the model, but also may result in insufficient and comprehensive exploration of the complex relationships between rock physical properties [18]. Therefore, adopting effective data augmentation techniques to expand the sample size and improve data quality has become a key strategy to solve this problem. Data augmentation techniques generate additional simulated data through methods like reasonable interpolation and noise injection, improving the distribution characteristics of raw datasets [19]. For instance, expanding coverage across various geological parameter dimensions and optimizing statistical features such as data dispersion (e.g., variance) enables a more comprehensive representation of geological conditions. This enhances models ‘adaptability to diverse geological scenarios, thereby significantly boosting machine learning models’ performance in predicting rock thermal conductivity [20]. This provides strong support for improving the performance of machine learning models in predicting rock thermal conductivity. Li [21] proposed a novel hybrid method to relax the linear assumption of regression kriging by combining nonlinear machine learning mapping (MLM). The proposed method was applied to a real-world underground shale volume estimation task and demonstrated. Compared with existing methods such as ordinary kriging, RK, MLM, etc., the relative estimation error of the proposed method was reduced by more than 10%, and the estimation resolution was also improved. Wang [22] uses Generative Adversarial Networks (GANs) to generate real seismic waveforms with multiple labels (noise and event classes). Applying it to the real Earth earthquake dataset in Oklahoma, it is demonstrated that adding data from the synthesized waveform generated by GAN can be used to improve earthquake detection algorithms when only a small amount of labeled training data is available. Bai [23] proposed a deep neural network for predicting heat flow in the Songliao Basin. Over 4000 global heat flows and 23 geological and geophysical parameters were used as reference constraints for training. The uncertainty error of the prediction was estimated based on correlation and distance-based generalized sensitivity analysis. The measured data has verified that DNN is an effective method for predicting regional-scale heat flux, providing reliable heat source information for evaluating geothermal resources. Huang [24] proposed an improved hybrid deep learning Kriging method that combines a graph neural network (GNN) prediction model with a Kriging interpolation algorithm. GNNs consider the dynamic changes over time and combine spatiotemporal information to estimate (interpolate) the meteorological data of the target meteorological station using reanalysis data as input. The experimental results show that the hybrid method exhibits good performance in station data interpolation in complex terrain areas and uneven surface conditions. Compared with traditional kriging methods, this method significantly improves the interpolation effectiveness.
Based on the above background, this study takes granite from the Gonghe Basin and Songliao Basin in Qinghai Province as the object, obtains basic data such as longitudinal wave velocity, porosity, density, and thermal conductivity through experimental testing, and expands the data volume from 47 to 150 groups by combining interpolation and noise injection. Three algorithms, SVM, RF, and BPNN, were used to construct a thermal conductivity prediction model. The performance differences in the model under different data scales were systematically compared, and the influence weights of porosity, density, and longitudinal wave velocity on thermal conductivity were revealed through feature importance analysis. The research results aim to provide data augmentation strategies and machine learning solutions for efficient prediction of rock thermophysical parameters in deep geothermal engineering, promoting the intelligence and precision of geothermal resource development.

2. Methodology and Materials

2.1. Geologic Background

The Gonghe Basin in Qinghai Province is located in the eastern part of the Qinghai–Tibet Plateau, surrounded by mountains and rich in regional tectonic activity, providing geological dynamic conditions for the formation of dry hot rock resources (Figure 1). The high-temperature hot springs along the Duohemao Fault Zone and Wahongshan Fault Zone, which run in a north–south direction on both sides of the basin, are exposed in a bead-like pattern. The deep and concealed faults within the basin cut through the deep-seated molten crust, locally forming high-grade dry hot rock masses with shallow burial depth [25].
The Songliao Basin is located in the northeastern region of China, with a relatively shallow burial depth in the Moho and Ju areas (Figure 1). The upper crust has low-density interlayers and a good heat source foundation. The internal structural movement of the basin is intense, with a large number of deep and shallow structures developed. At the same time, the widespread distribution of sedimentary Cretaceous mudstone cover layers in the basin is conducive to heat storage. Therefore, the Songliao Basin is a promising geothermal resource potential area [26].

2.2. Laboratory Test

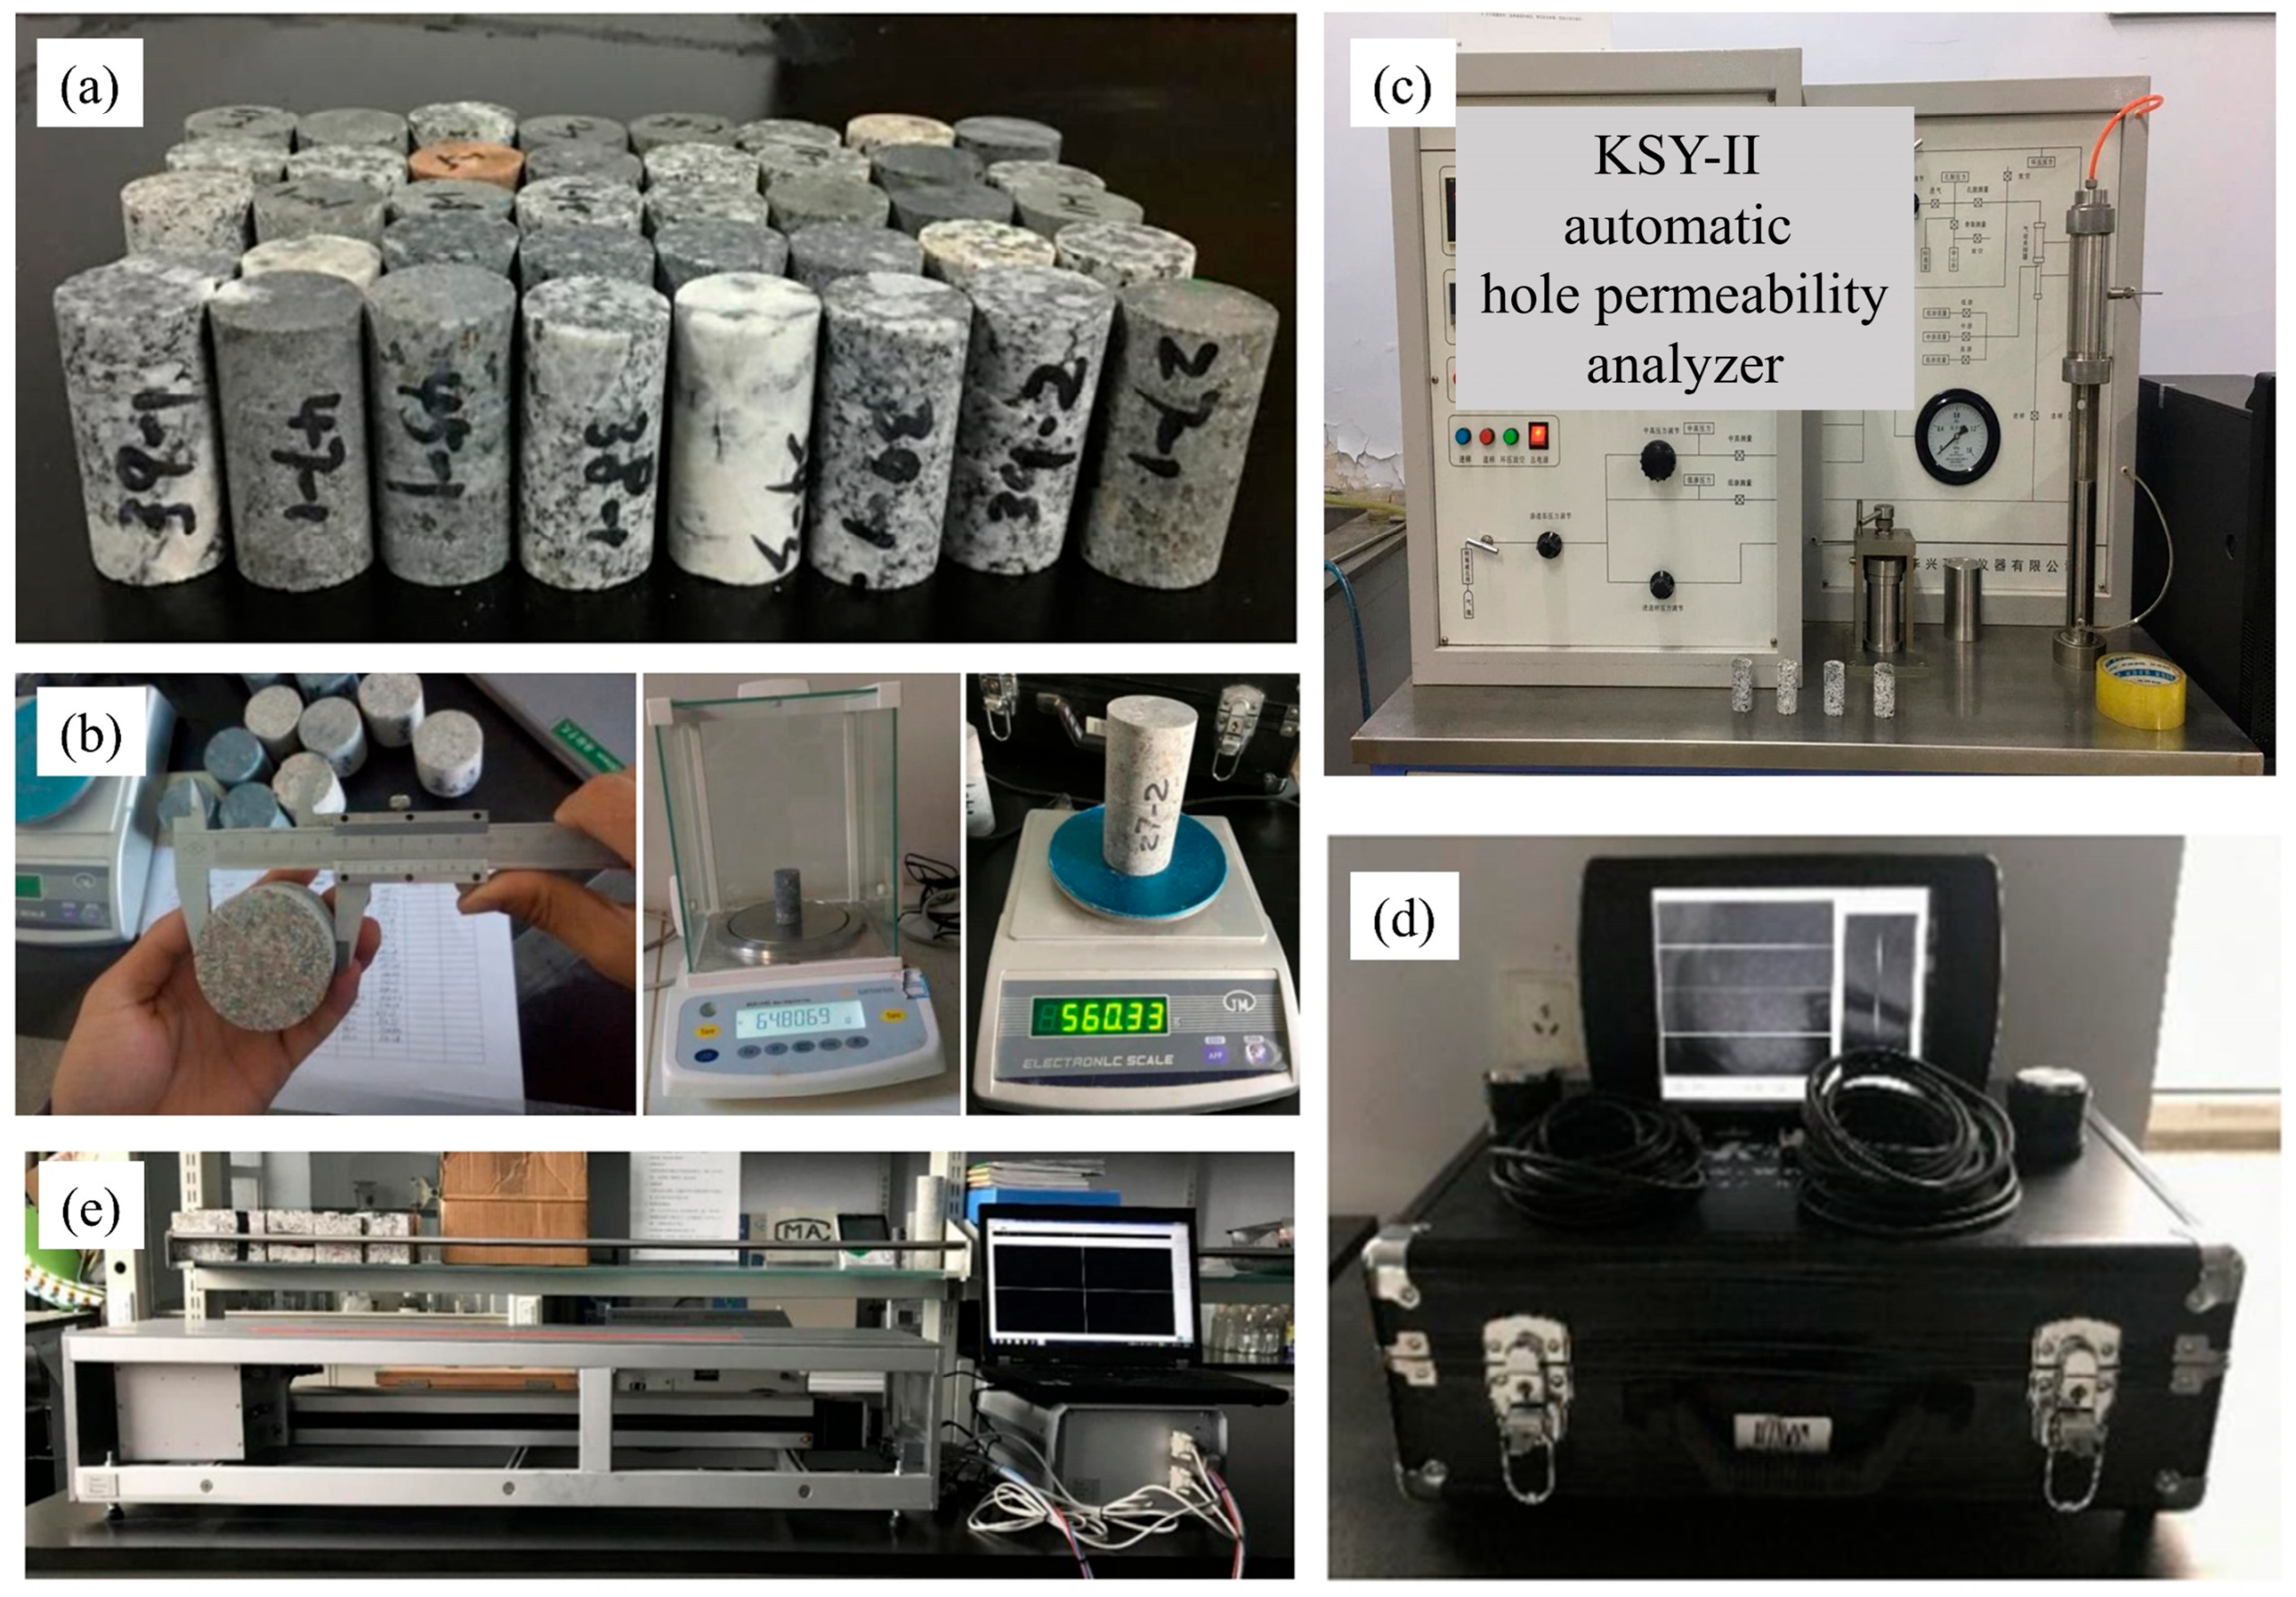
The samples for this experiment are core samples collected by the research group in the Gonghe Basin and Songliao Basin, as well as field outcrop samples, totaling 47 sets of samples. After processing the rock sample, cylindrical rock samples with diameters of 25 mm × 50 mm, 50 × 50 mm, and 50 × 100 mm are formed, as shown in Figure 2a. The density, porosity, longitudinal wave velocity, transverse wave velocity, and thermal conductivity of this batch of rock samples were experimentally measured using a vernier caliper and a tray balance (Figure 2b), a KS-II gas permeability tester (Figure 2c), an RSW-SY5 (T) non-metallic acoustic wave detector (Figure 2d), and a TCS thermal conductivity tester (Figure 2e).
The calculation equation for the density test is as follows:
ρ = m V
where ρ is the density of the rock and soil sample, g/cm3; m is the mass of the rock and soil sample, g.
The principle of the porosity test experiment is Boyle’s Law. During the experiment, nitrogen is used to pressurize the core chamber, and the porosity ratio of the rock and soil sample can be calculated by using the change in pressure and volume. The calculation equation is as follows:
P V = n R T
where P represents the pressure, Pa; V represents the volume of gas, m3; n represents the amount of substance, mol; T is the absolute temperature, K; R represents the gas constant.
The longitudinal wave velocity (Vp) of the rock is calculated by measuring the distance (L) and propagation time (t) of the sound wave propagating through the rock specimen.
V p = L t
where Vp is the velocity of the rock longitudinal wave, m/s; L is the propagation distance of the sound wave, that is, the distance between the transmitting transducer and the receiving transducer, m; t is the propagation time of the sound wave longitudinal wave in rock, s.
In the process of the thermal conductivity experiment, the laser point heat source will heat the rock and soil sample, and the infrared temperature sensor will be used to read the temperature difference value before and after heating. The thermal conductivity of the sample will be calculated by the computer’s built-in calculation software and the relevant algorithm equation.
λ = λ R 1 ( T 2 R 1 T 1 R 1 ) + λ R 2 ( T 2 R 2 T 1 R 2 ) 2 ( T 2 T 1 )
where R1 and R2 represent the standard samples 1 and 2, respectively; λ is the thermal conductivity (W/(m·K)); T2 and T1 represent the temperature before and after heating, respectively, K.
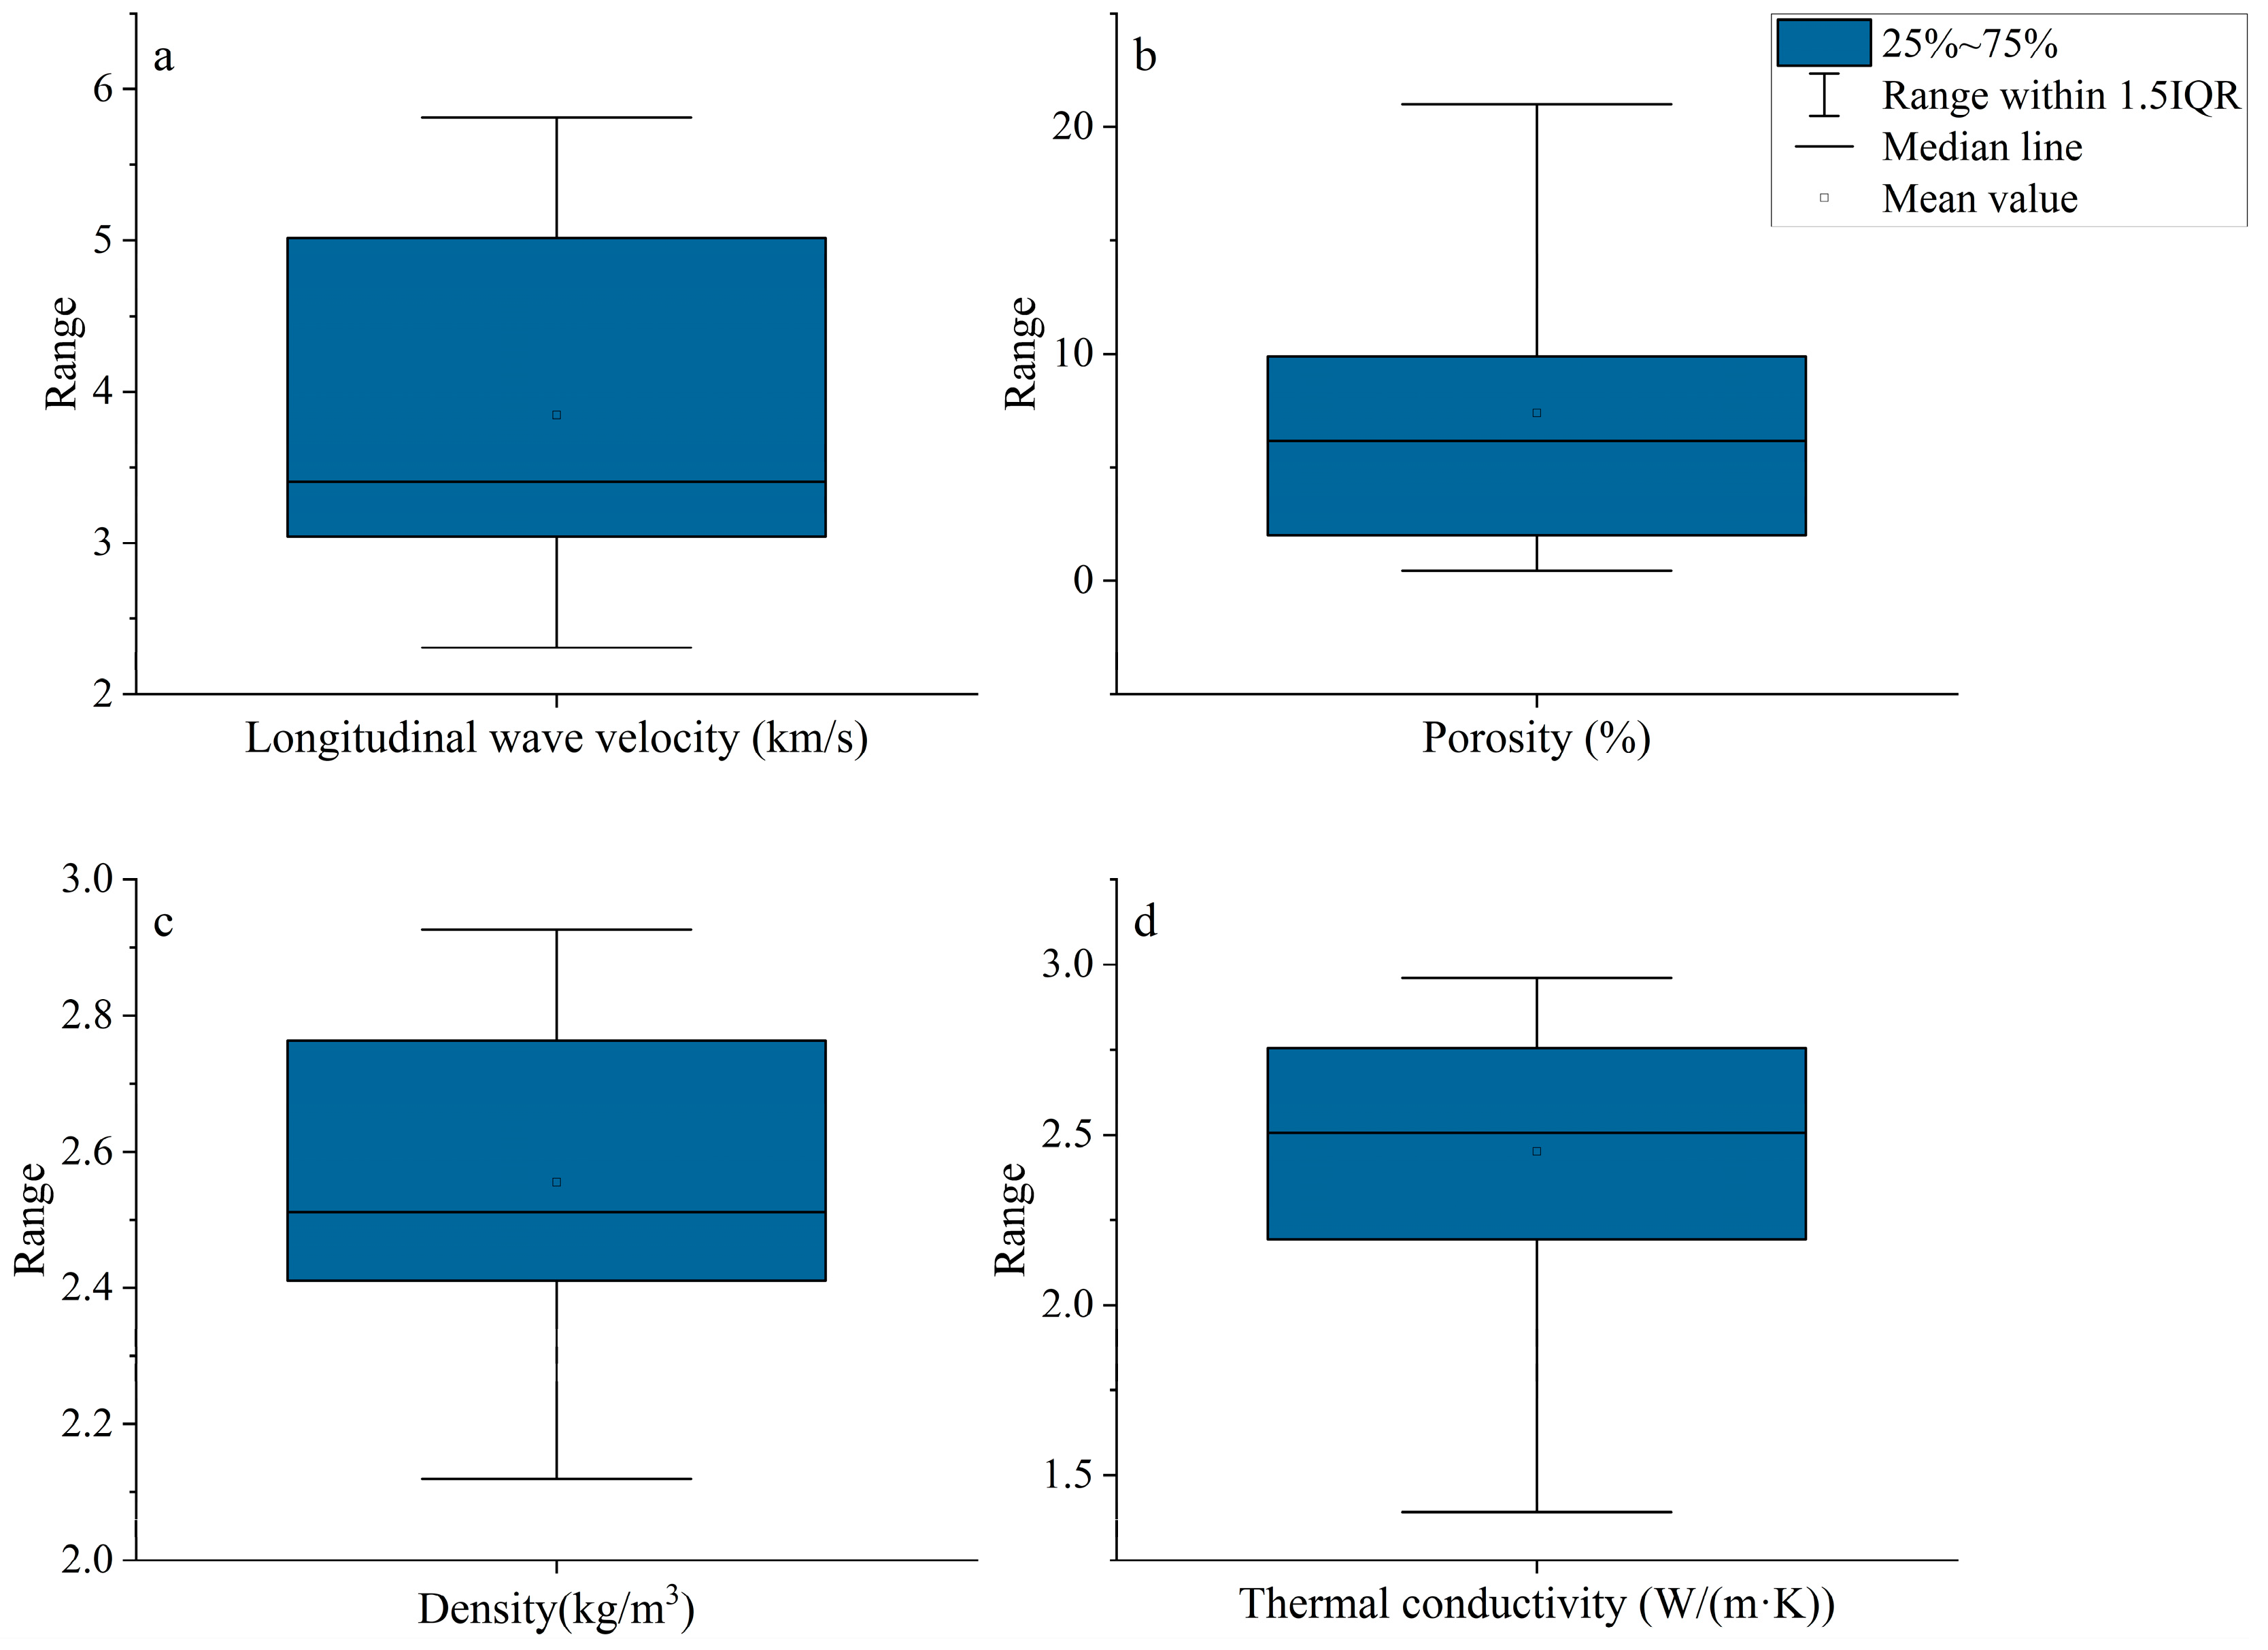
After testing, the statistical data of the experimental results of 47 rock samples are shown in Table 1, and their box plots are shown in Figure 3.

2.3. Data Enhancement

In order to expand the data scale and improve the generalization ability of the model, this study adopts a two-stage data augmentation strategy, combined with a strict quality verification process, to systematically expand the dataset size and ensure data reliability. The process diagram is shown in Figure 4. In the initial enhancement stage, the data density of the original dataset (containing 47 sets of samples, 4-dimensional features, named dataset A) is increased to 100 sets through cubic spline interpolation. This process constructs an equidistant interpolation coordinate system along the sample dimension, performs nonlinear interpolation operations on each feature dimension, and generates an intermediate transition dataset. The second stage implements a noise injection strategy: Gaussian perturbations are added to the first 50 interpolated datasets, with noise intensity set at 10% of the original data feature range. Generate 50 sets of noisy data through random sampling and merge them with interpolated data to form a temporary expansion set. To ensure a uniform final data size, a truncation strategy is adopted to retain the first 150 sets of samples. To maintain the rationality of data distribution, establish a two-level quality control system. Firstly, perform feature-level deviation verification: calculate the relative deviation between each generated sample and the original data features. If any feature dimension deviation exceeds 15%, the sample will be removed. When abnormal samples lead to insufficient data volume, the compensation mechanism is activated: the original data is randomly extracted proportionally to supplement the target scale. Finally, an enhanced dataset was formed (including 150 sets of samples, 4-dimensional features, named B dataset).

2.4. Machine Learning Models

This study selected three classic machine learning models, namely Support Vector Machine (SVM), Random Forest (RF), and BP Neural Network (BPNN), for training and prediction.

2.4.1. Support Vector Machine (SVM)

Support Vector Machine is a supervised learning method based on statistical learning theory, whose core idea is to construct the optimal hyperplane by maximizing the classification interval in the sample space, achieving efficient classification and regression of linearly separable data. For nonlinear data, SVM uses kernel techniques such as radial basis function kernels and polynomial kernels to map the original features to a high-dimensional space, thereby transforming it into a linearly separable problem. In small sample learning, SVM avoids overfitting through the principle of structural risk minimization, demonstrating good generalization ability. This study uses regression SVM (SVR) to handle continuous variable prediction problems through an ε—insensitive loss function, with the optimization objective of minimizing the balance between empirical risk and model complexity [27].

2.4.2. Random Forest (RF)

Random Forest is an ensemble learning algorithm based on the Bagging framework, which is constructed from multiple decision trees through random sampling (Bootstrap) and random feature selection (Random Subspace). Each decision tree grows independently and outputs prediction results, and the final prediction value is obtained through majority voting (classification) or mean aggregation (regression). This model effectively reduces variance and overfitting risk through integration strategies and has strong robustness to nonlinear data and high-dimensional features. In addition, Random Forests can naturally output feature importance scores. By calculating the contribution of features to impurity reduction during node splitting, the impact of each feature on the prediction results can be quantified, providing a key basis for feature analysis in this study [28].

2.4.3. Backpropagation Neural Network (BPNN)

A Backpropagation Neural Network is a multi-layer feedforward neural network that includes an input layer, a hidden layer, and an output layer. The neurons between layers transmit signals through weighted connections. Its core algorithm iteratively adjusts the connection weights and biases of each layer through backpropagation error, minimizing the mean square error between predicted and true values. The hidden layer of a network typically employs nonlinear activation functions (ReLU functions) to enable it to handle complex nonlinear mappings. The performance of BPNN depends on the network structure (such as the number of hidden layers and neurons) and training parameters (such as learning rate and iteration times). When there is sufficient data, deep feature extraction can improve prediction accuracy, but it is prone to becoming stuck in local optima or overfitting in small samples. This study adopts a three-layer network structure, with three physical features in the input layer, the target predictor variable in the output layer, and the number of neurons in the hidden layer determined through cross-validation [29].

2.5. Model Parameter Setting, Training, Validation, and Evaluation

2.5.1. Parameter Settings

In the SVR model, a radial basis function (RBF) is used as the kernel function, and the penalty coefficient C is set to a value of 1 to balance the complexity of the model and the tolerance of training errors. The ε parameter is set to 10% of the data standard deviation to control the sensitivity of the regression model to prediction errors. In the Random Forest model, the Bagging algorithm is used to generate diverse decision tree submodels through self-sampling, effectively reducing the risk of overfitting. Set the training period to 100, which means generating 100 decision trees to balance model accuracy and computational efficiency. In the BPNN method, the network is trained using the Levenberg–Marquardt method. The model is set with one hidden layer, 10 neurons, a maximum training frequency of 1000 times, and a minimum gradient threshold of 1 × 10⁻¹⁰.

2.5.2. Model Training

Before model training, Z-score normalization is used to preprocess the data so that the scale of the data becomes a standard normal distribution, preserving the distribution shape of the original data (linear scaling) and not easily affected by extreme values (outliers). The mathematical equation is as follows:
z = x μ σ
Divide the A and B datasets into training and testing sets in a 7:3 ratio, use the training set (input features (density, porosity, wave velocity) and output target (thermal conductivity)) for training, and use the testing set for validation.

2.5.3. Model Validation and Evaluation

The performance of the model is evaluated using Root Mean Square Error (RMSE), Mean Absolute Error (MAE), and coefficient of determination (R2). Root Mean Square Error (RMSE) reflects the sensitivity of the model to outliers and the degree of error dispersion by calculating the mean square root of the difference between predicted and measured values. Mean Absolute Error (MAE) is based on the arithmetic mean of the absolute difference between predicted and measured values, providing a robust estimate of the error distribution and directly reflecting the average deviation of the model prediction. The coefficient of determination (R2) reveals the explanatory power of the model for the variation in the target variable, with a quantitative range of 0–1 (the closer it is to 1, the higher the goodness of fit). Their calculation formulas can be found in the references [30,31].

3. Results and Discussion

3.1. Analysis of Test Results and Enhancement Analysis

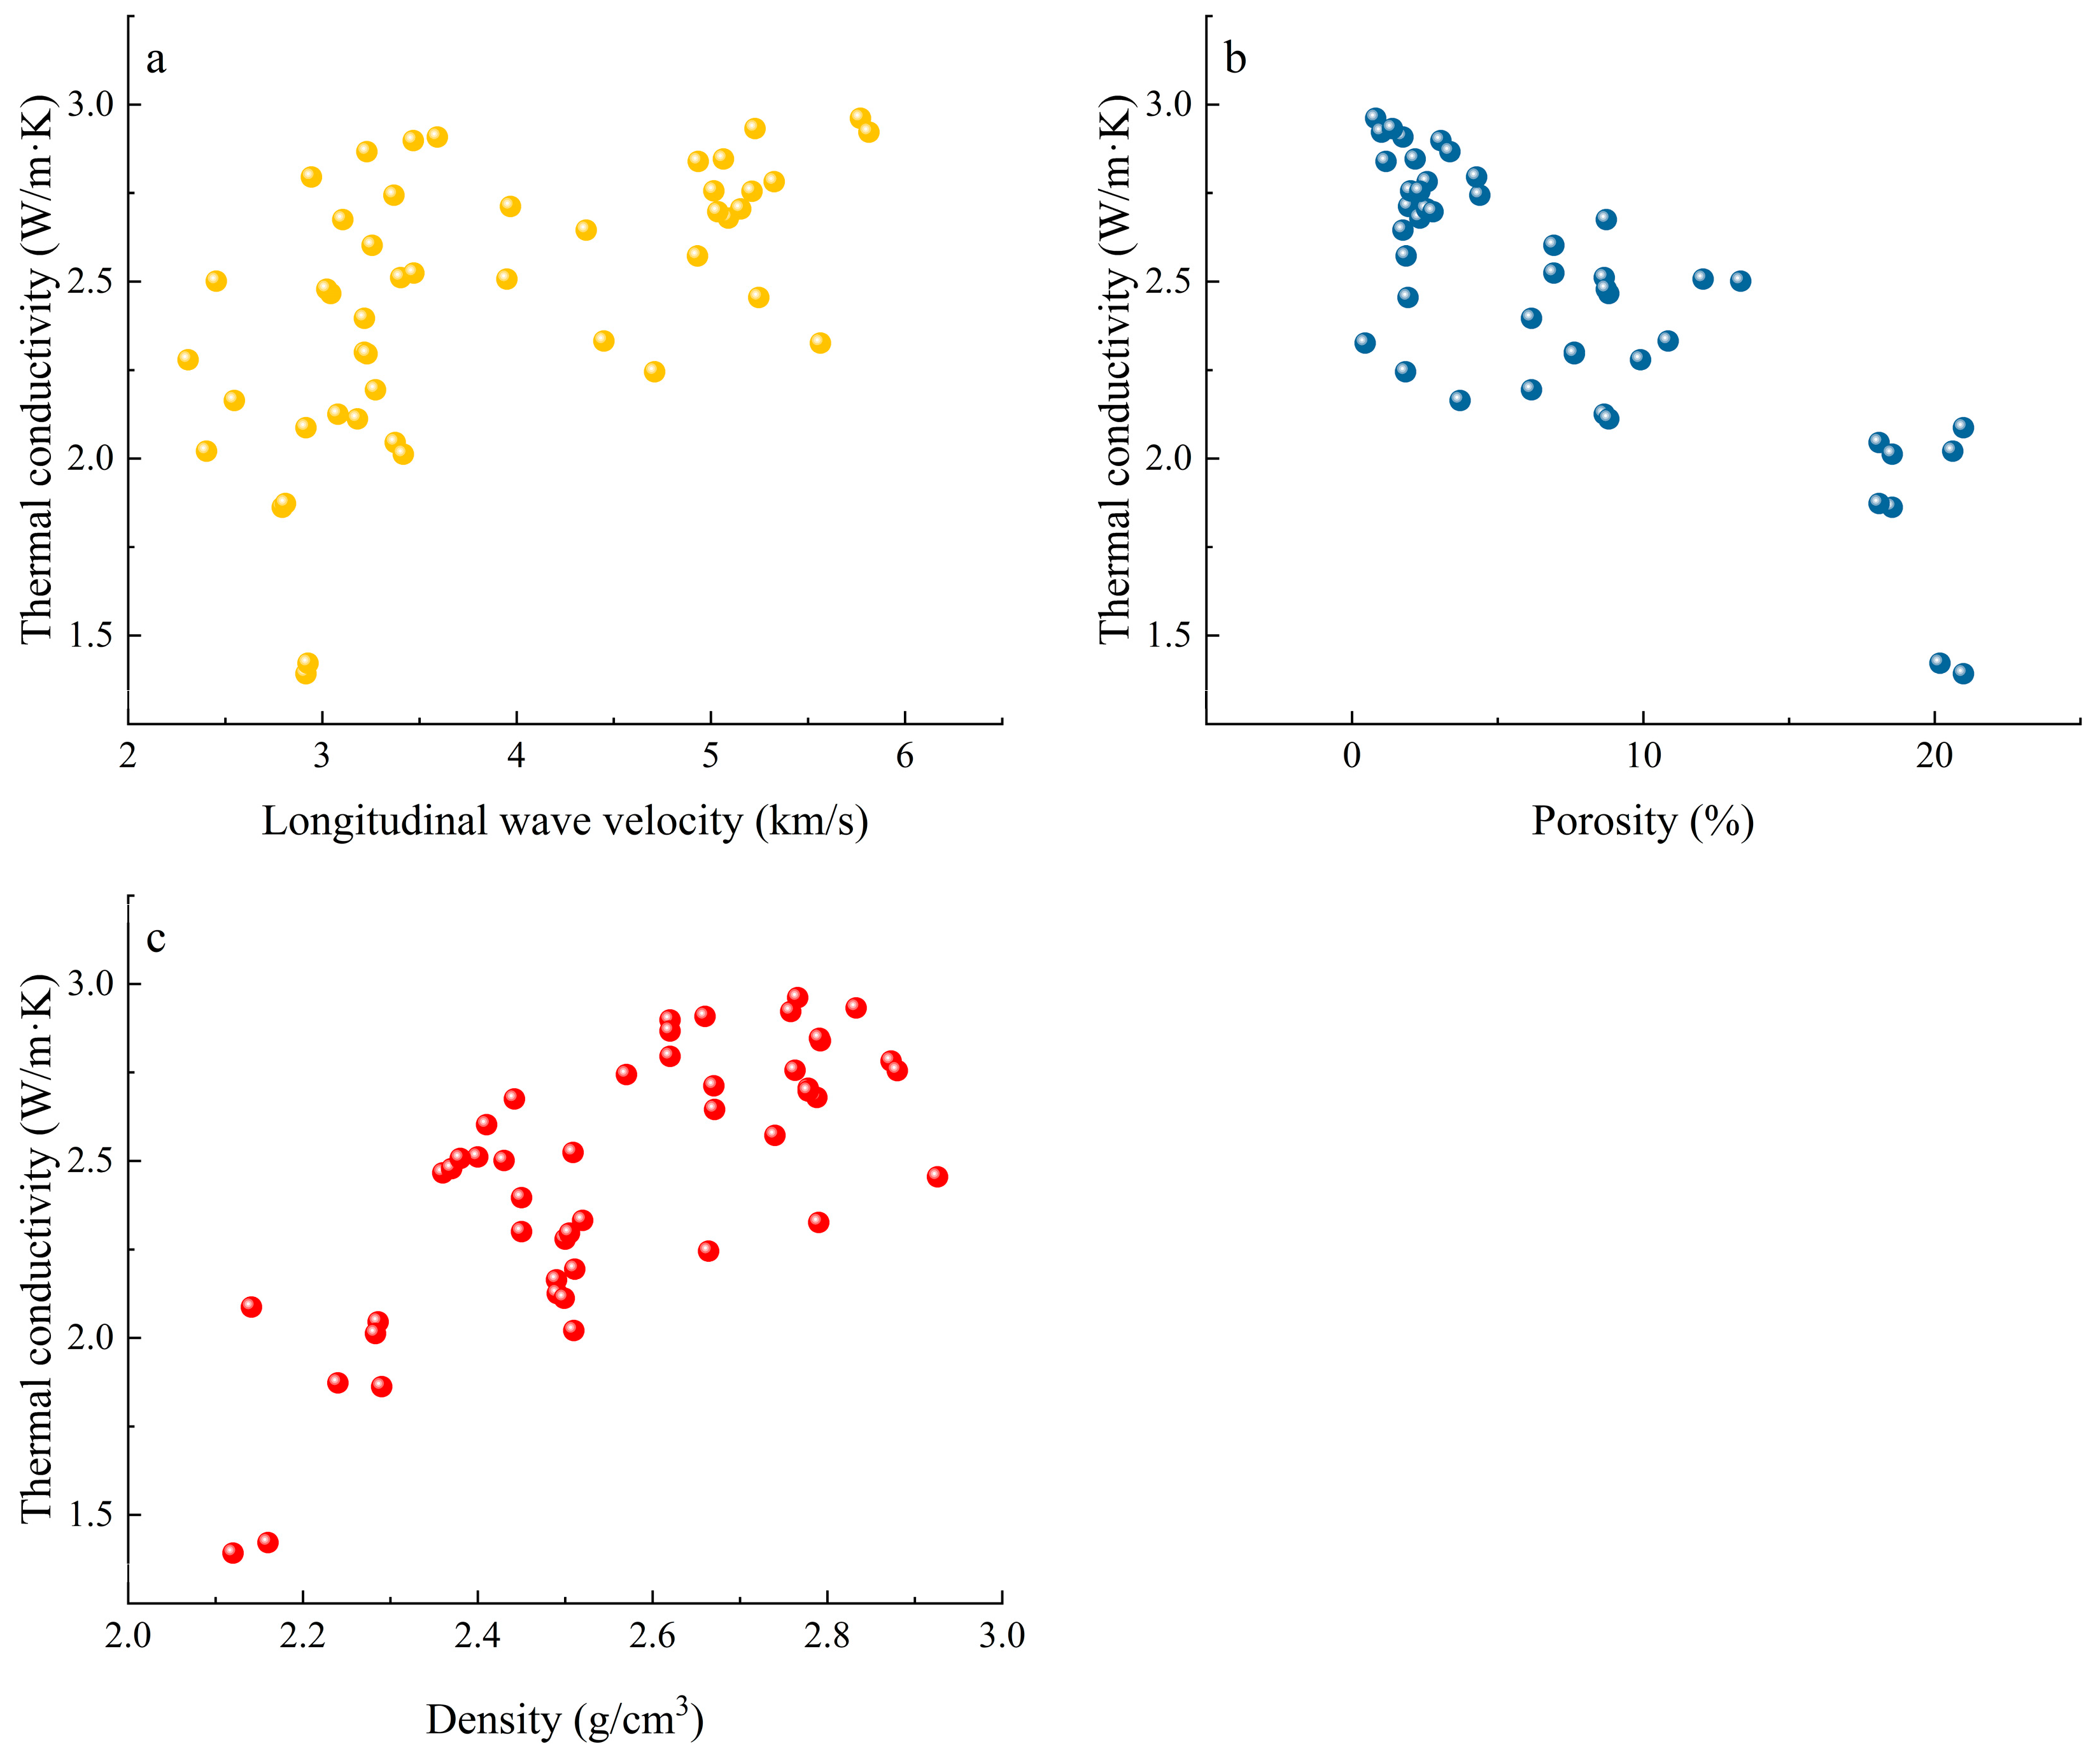
Based on the experimental results, a scatter plot was drawn for the output layer parameter thermal conductivity and input layer parameters longitudinal wave velocity, porosity, and density of the proposed machine learning model, as shown in Figure 5. Through visual observation of scatter plots, the three exhibit different correlation characteristics: thermal conductivity is significantly positively correlated with longitudinal wave velocity—as the longitudinal wave velocity increases, the thermal conductivity increases synchronously, reflecting the possible synergistic effect of solid matrix continuity on the efficiency of elastic wave propagation and thermal conductivity; There is a negative correlation between porosity and thermal conductivity. As porosity increases, the phenomenon of the thermal conduction path within the rock matrix being interrupted by the pore structure may be related to a decrease in thermal conductivity; Density and thermal conductivity show a positive correlation, with higher density typically corresponding to denser microstructures and enhanced solid phase connectivity, which may be related to improved thermal conductivity efficiency.
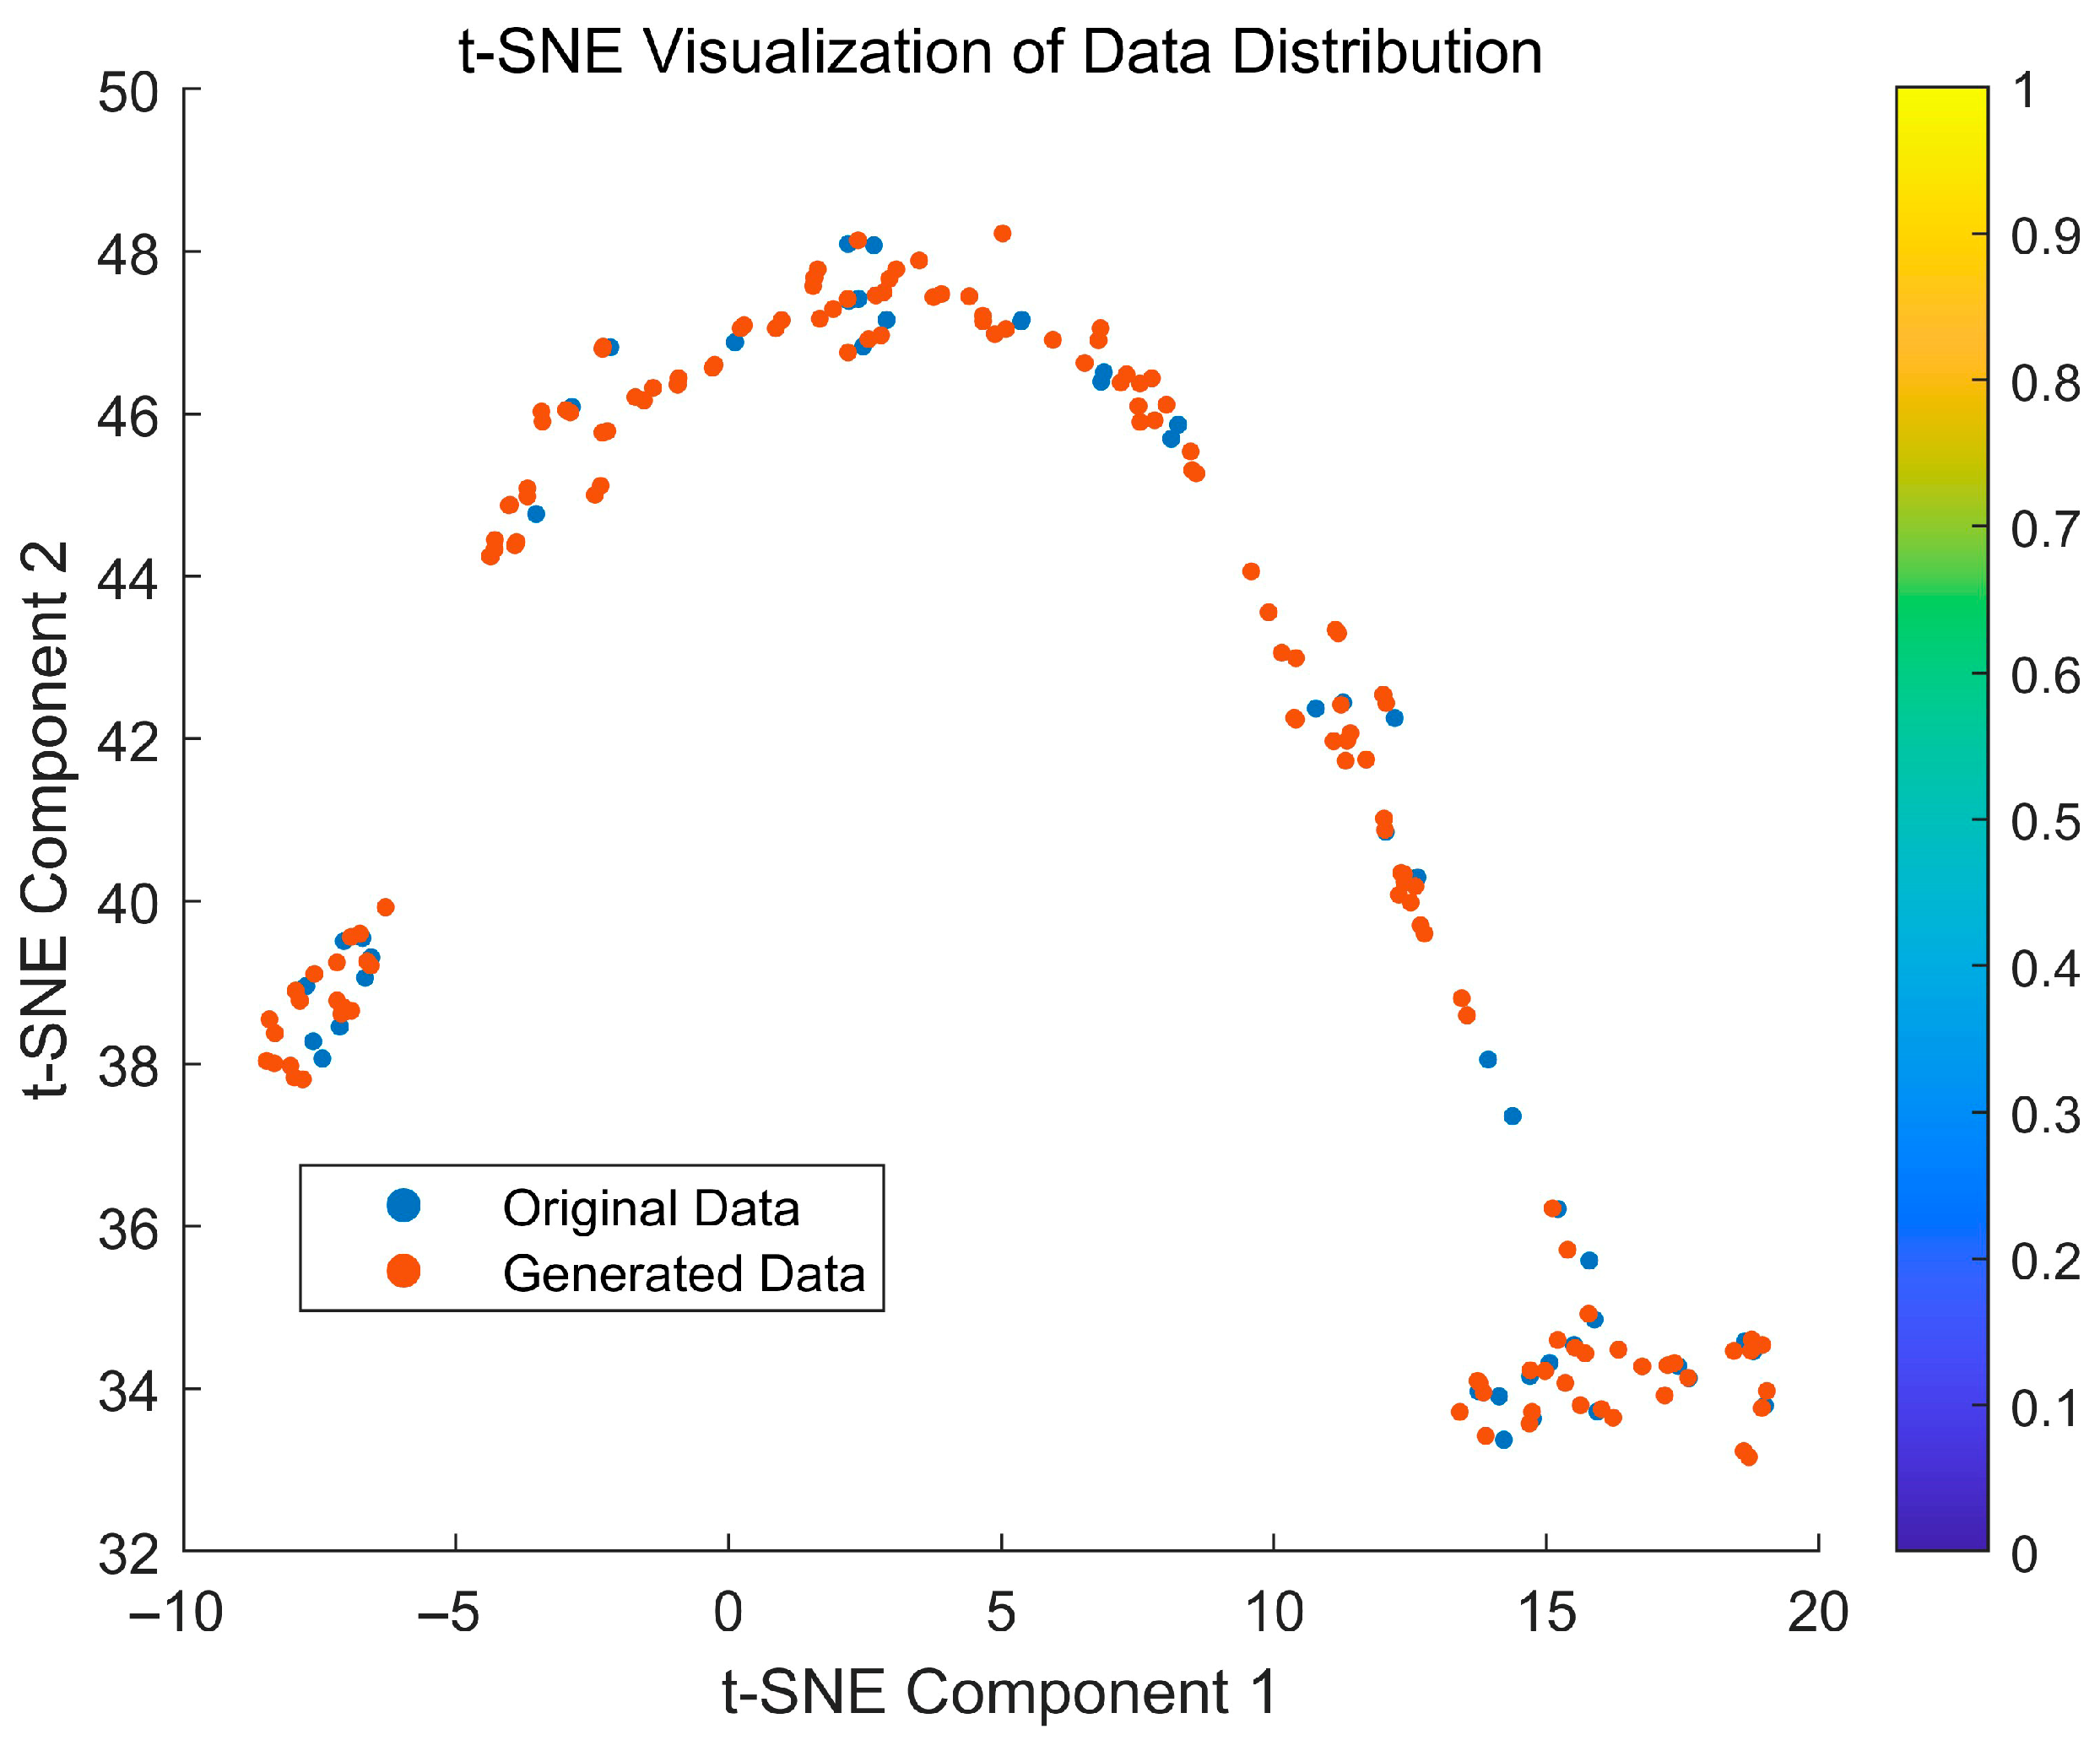
To verify the distribution consistency between the enhanced data and the original data after data augmentation, t-SNE dimensionality reduction technology is used for visualization verification. This technology is particularly suitable for comparing the distribution of high-dimensional features because it is good at preserving the local structure of high-dimensional data and can truly reflect sample similarity in two-dimensional space. Specifically, the original data and enhanced data are first merged into a joint dataset, and the repeatability of the dimensionality reduction mapping is ensured by fixing random seeds. Then, t-SNE is used to nonlinearly map high-dimensional features (such as longitudinal wave velocity, porosity, density, and thermal conductivity) to a two-dimensional space, where the original data is marked in blue and the enhanced data is marked in red (Figure 6). From the results, it can be seen that the two types of data points exhibit a significant mixed distribution in two-dimensional space: blue and red dots are evenly interwoven without obvious regional separation, the overlap of data dense areas is high, the distribution range of edge sparse samples is also highly consistent, and there are no abnormal clusters unique to enhanced data. This distribution consistency indicates that the enhanced data retains the statistical features of the original data and does not introduce new distribution patterns, verifying the effectiveness of the enhancement method and providing data support for the training stability of subsequent machine learning models.

3.2. Comparison of Model Prediction Performance

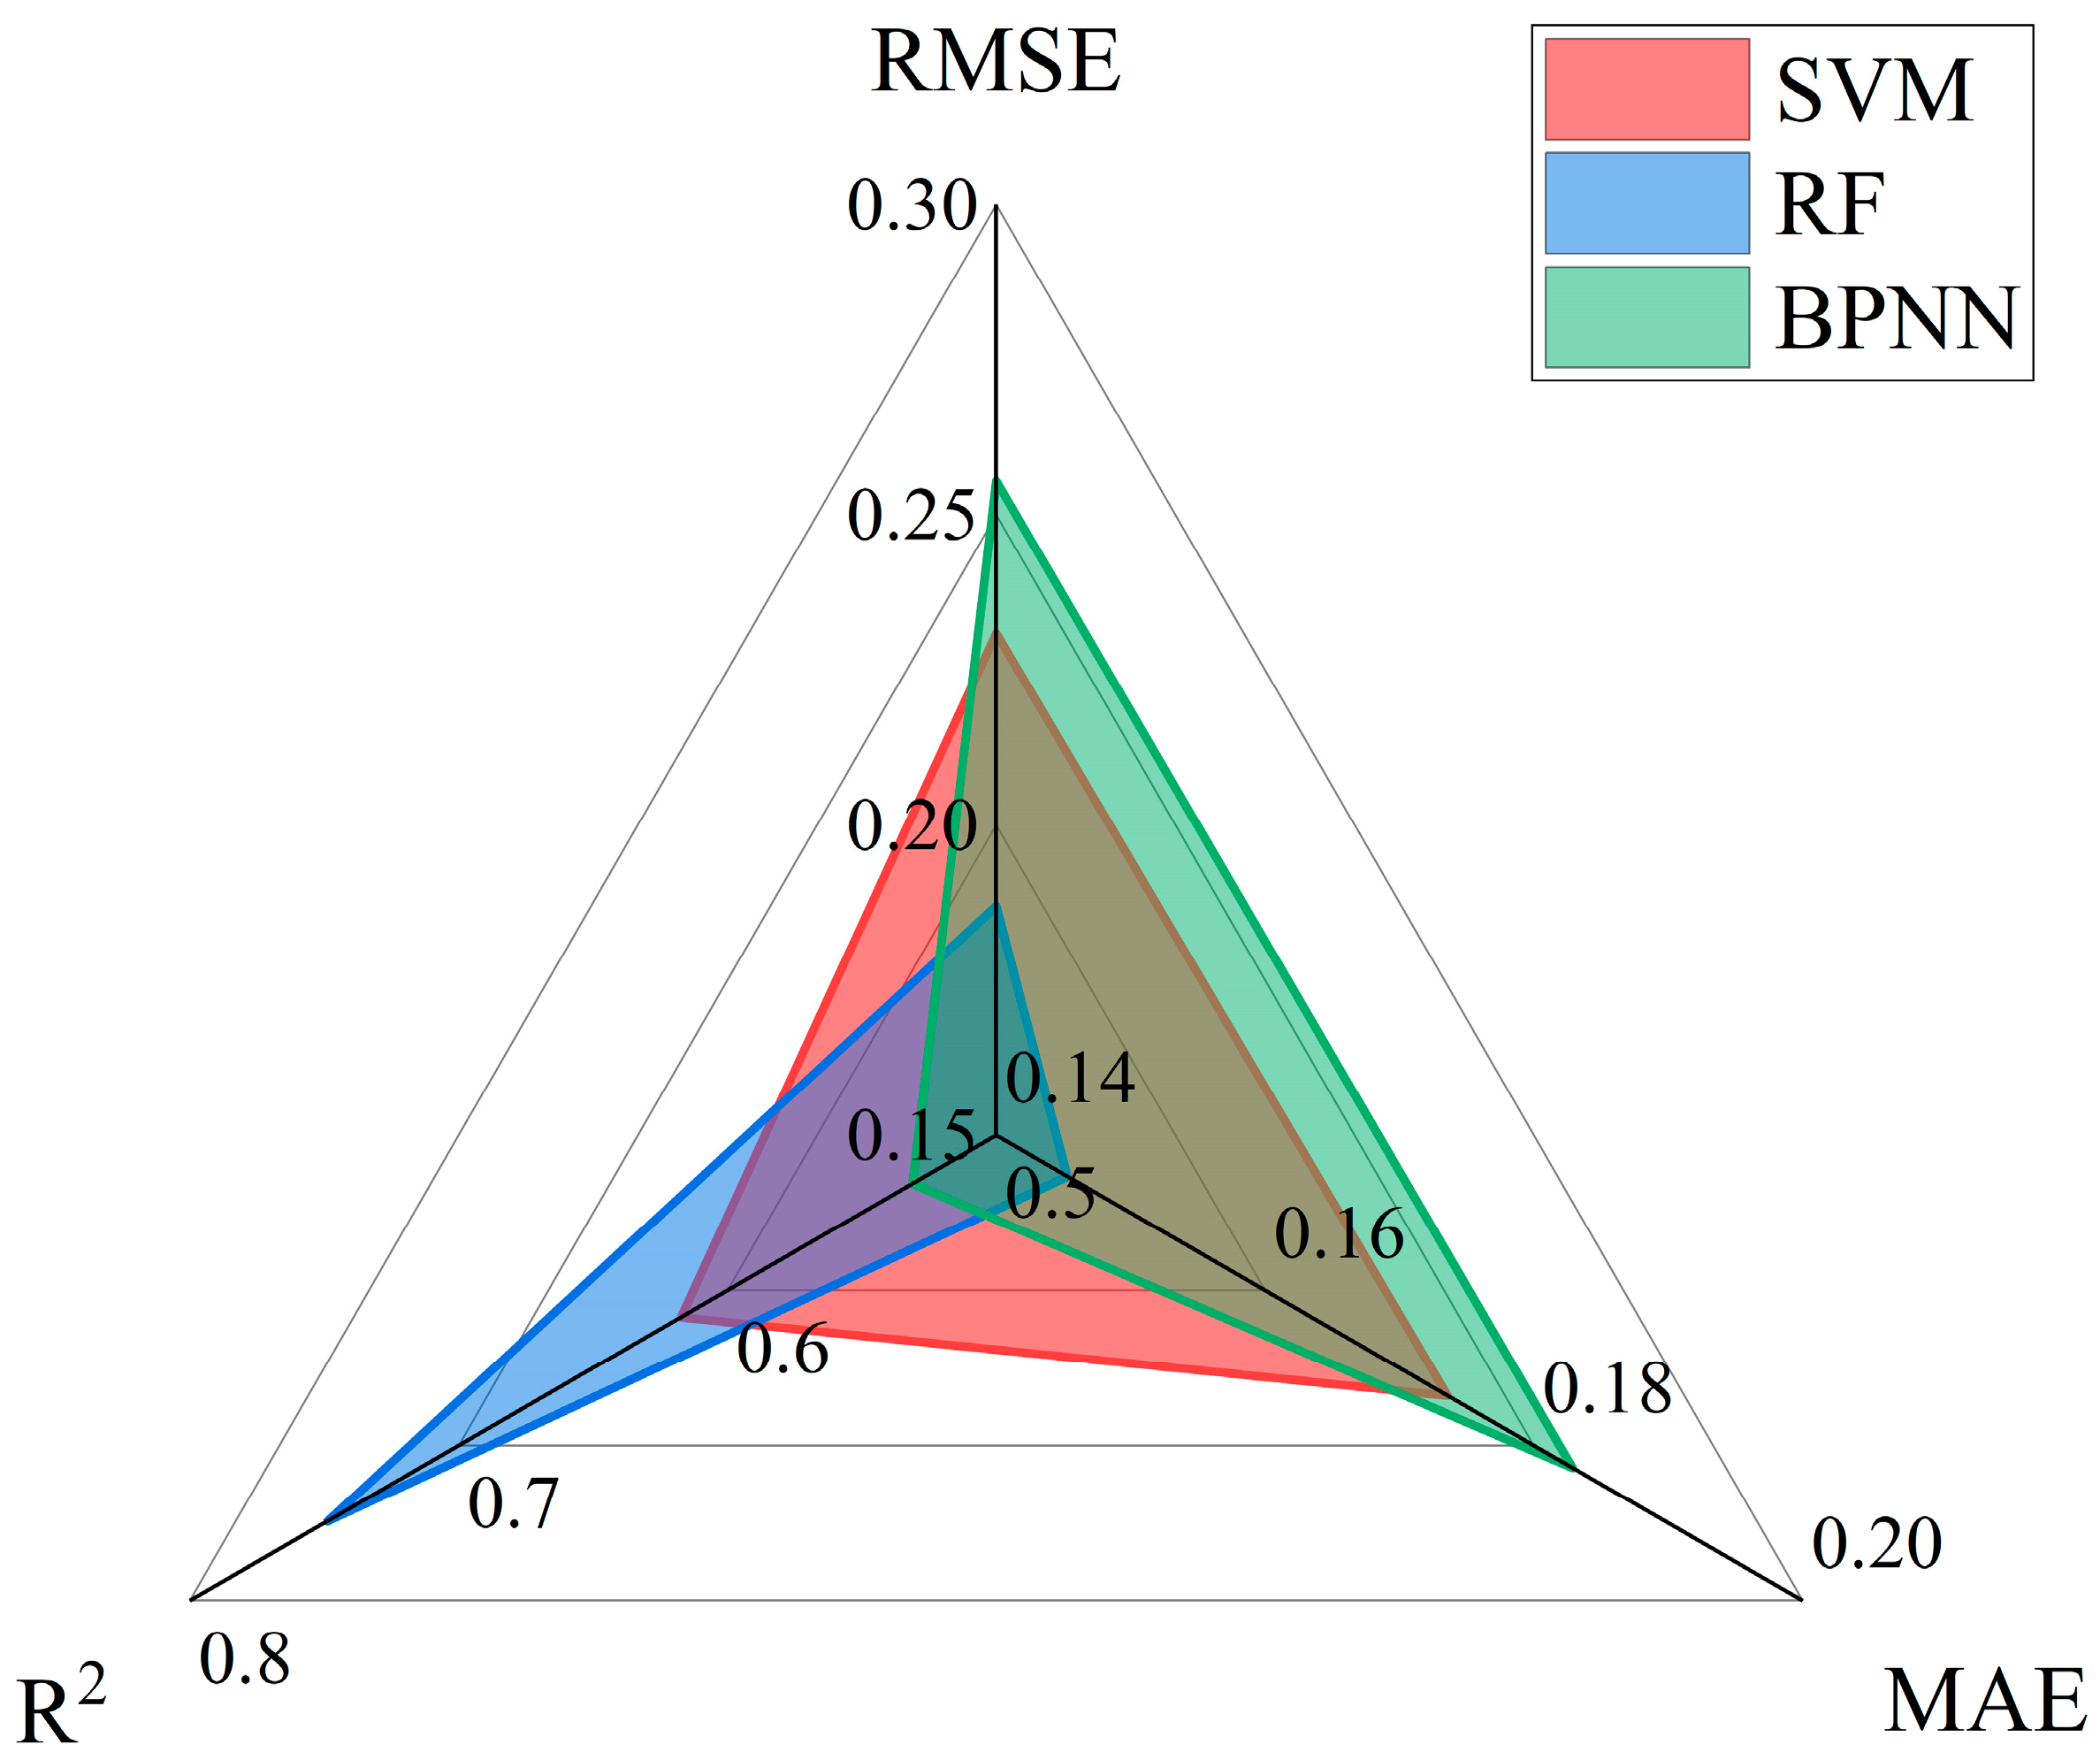
The comparison of regression evaluation indicators based on the original 47 sets of data training and testing is shown in Figure 7. The R2 values of the three models are all less than 0.8, indicating that small sample low-dimensional data will reduce the performance of machine learning models. Among them, the RMSE of the Random Forest model is 0.1870, the MAE is 0.1453, and the R2 reaches 0.7489, which performs the best among the three models. This indicates that Random Forests can adapt well to small sample data. By integrating multiple decision trees, the risk of overfitting is effectively reduced, and the model’s generalization ability to small sample data is improved. It has high accuracy and stability in predicting the physical properties of granite. The RMSE, MAE, and R2 of the SVM model are 0.2309, 0.1736, and 0.6172, respectively, ranking second in performance. It uses kernel functions to map data to high-dimensional space to find the optimal classification hyperplane or regression hyperplane, but due to the complex nonlinear relationship of granite physical property data, it may be difficult to accurately determine the appropriate hyperplane position and parameters in small samples. The RMSE, MAE, and R2 of the BPNN model are 0.2555, 0.1829, and 0.5312, respectively, indicating relatively weak performance. This is mainly because BPNN is prone to becoming stuck in local optima, and during small sample training, it may not be able to obtain the optimal weights and bias parameters on a global scale, resulting in significant prediction errors.
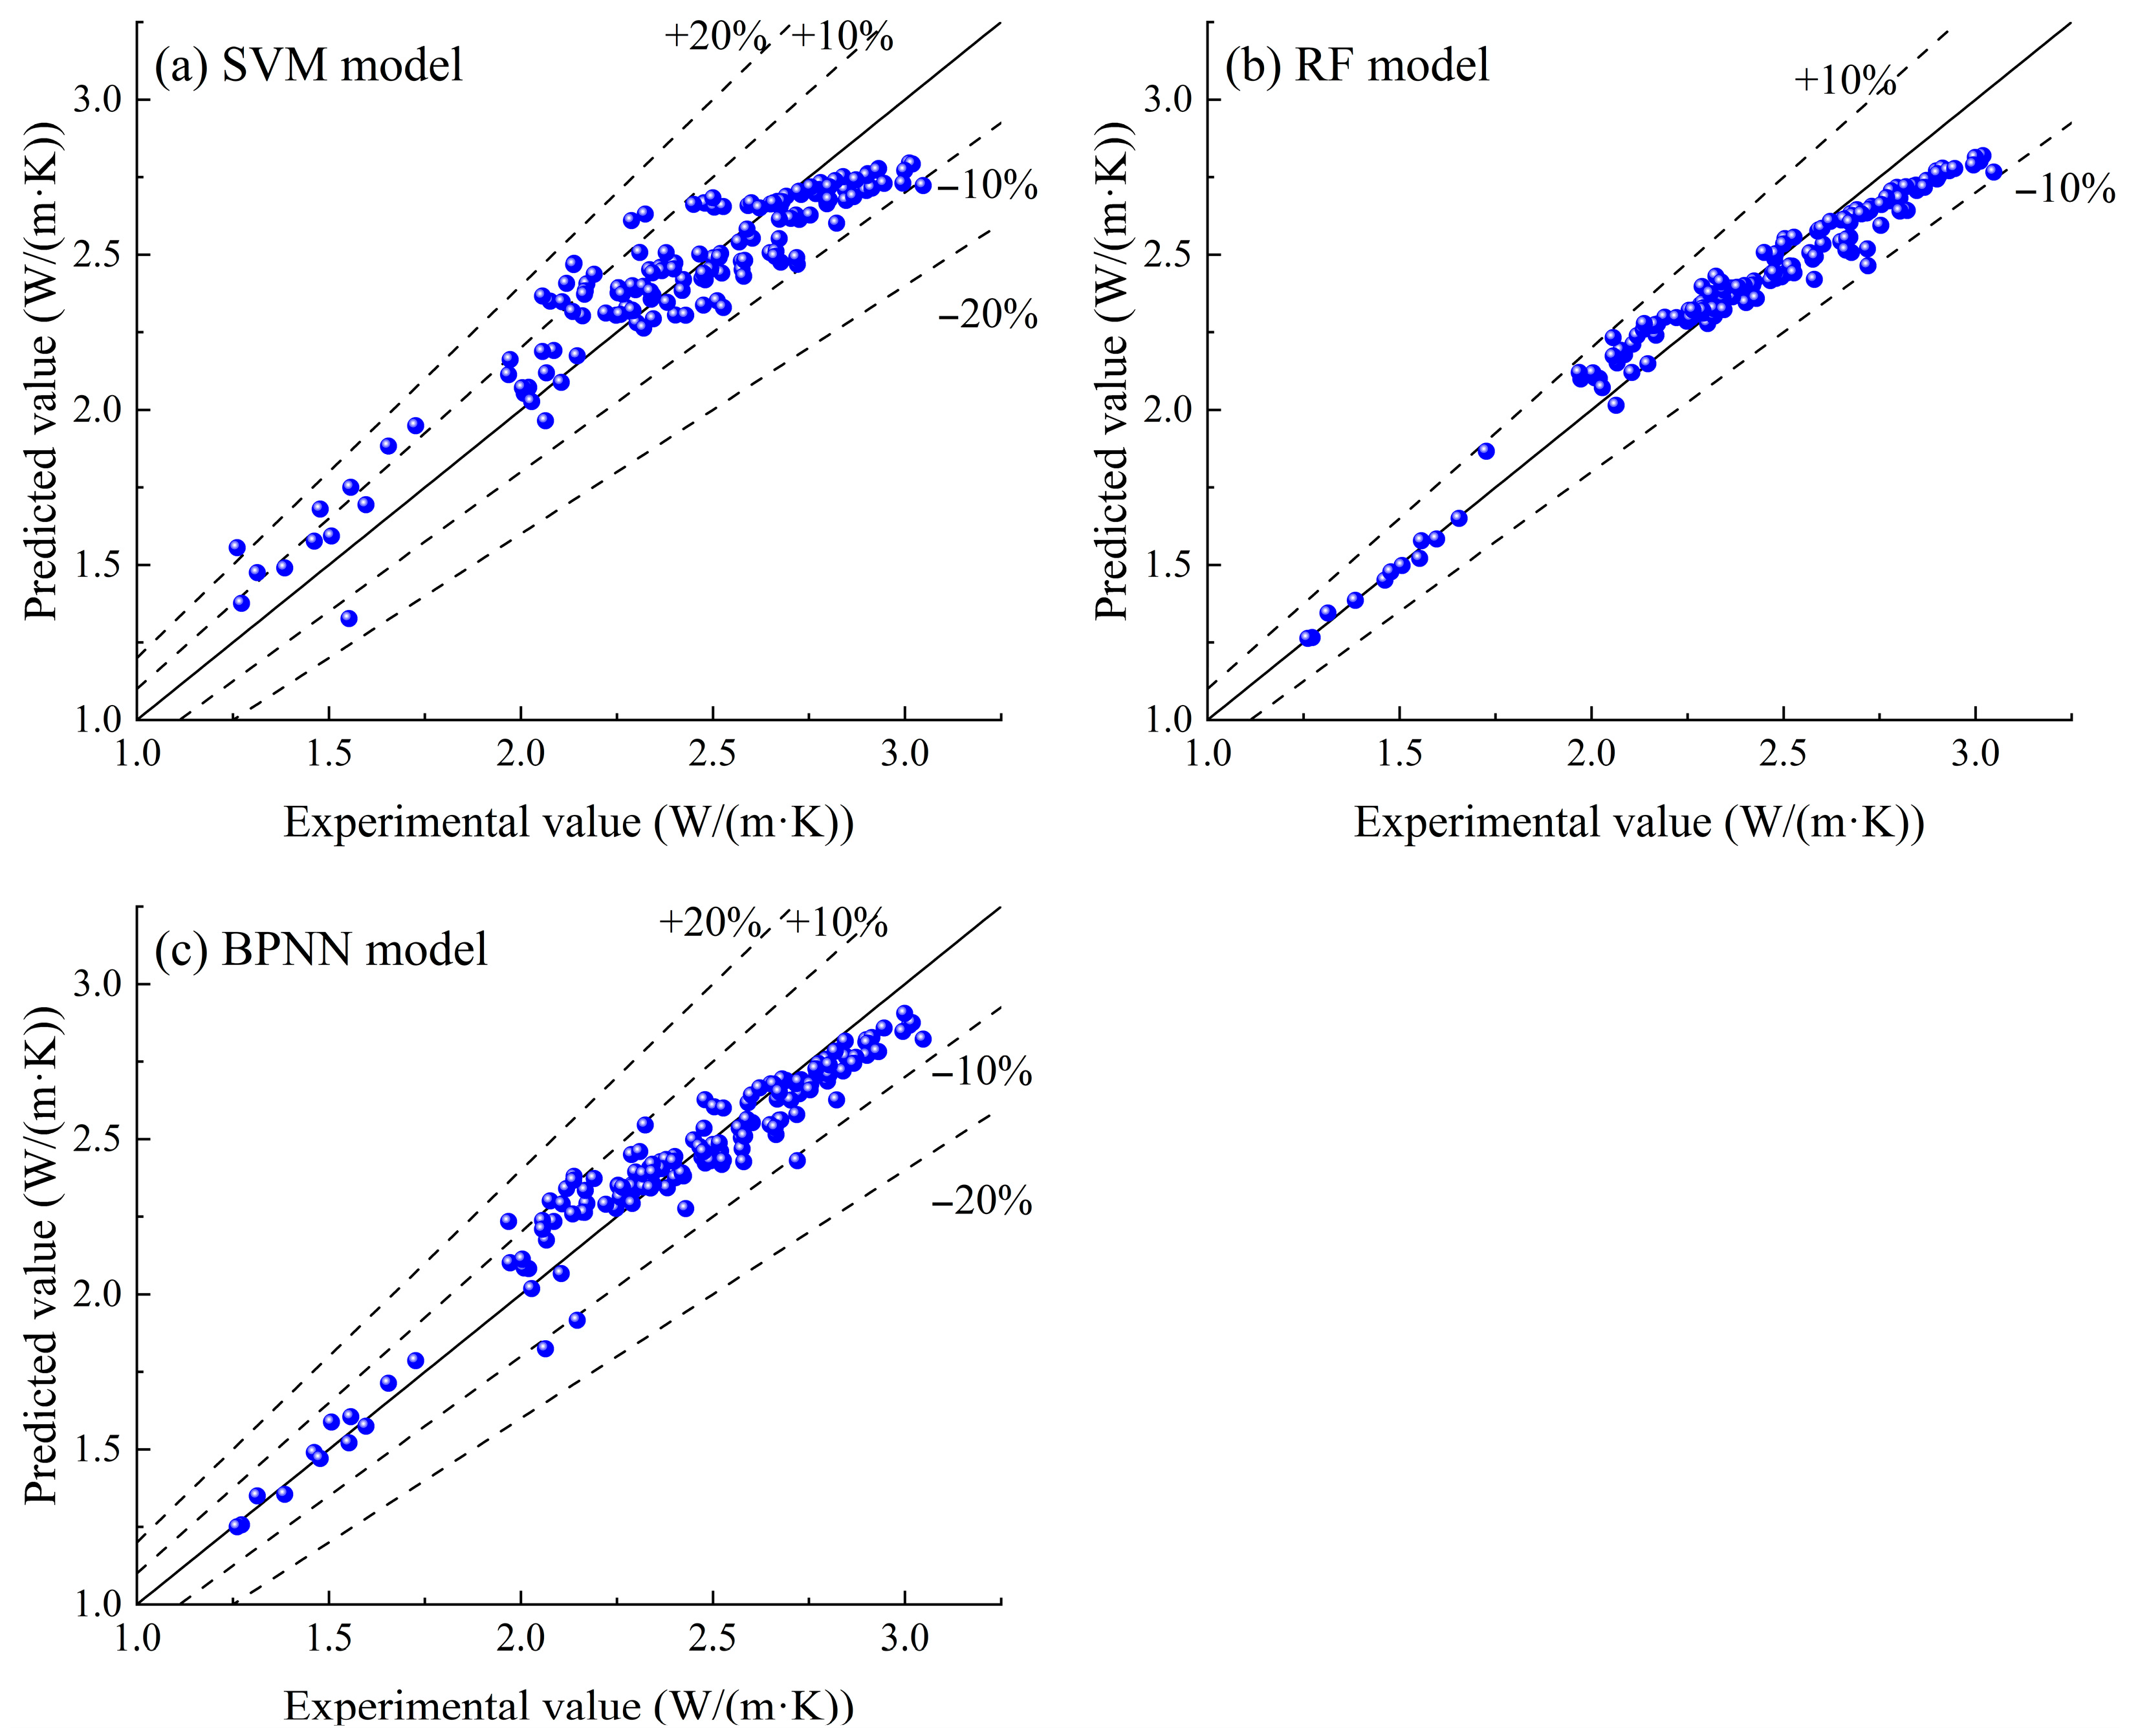
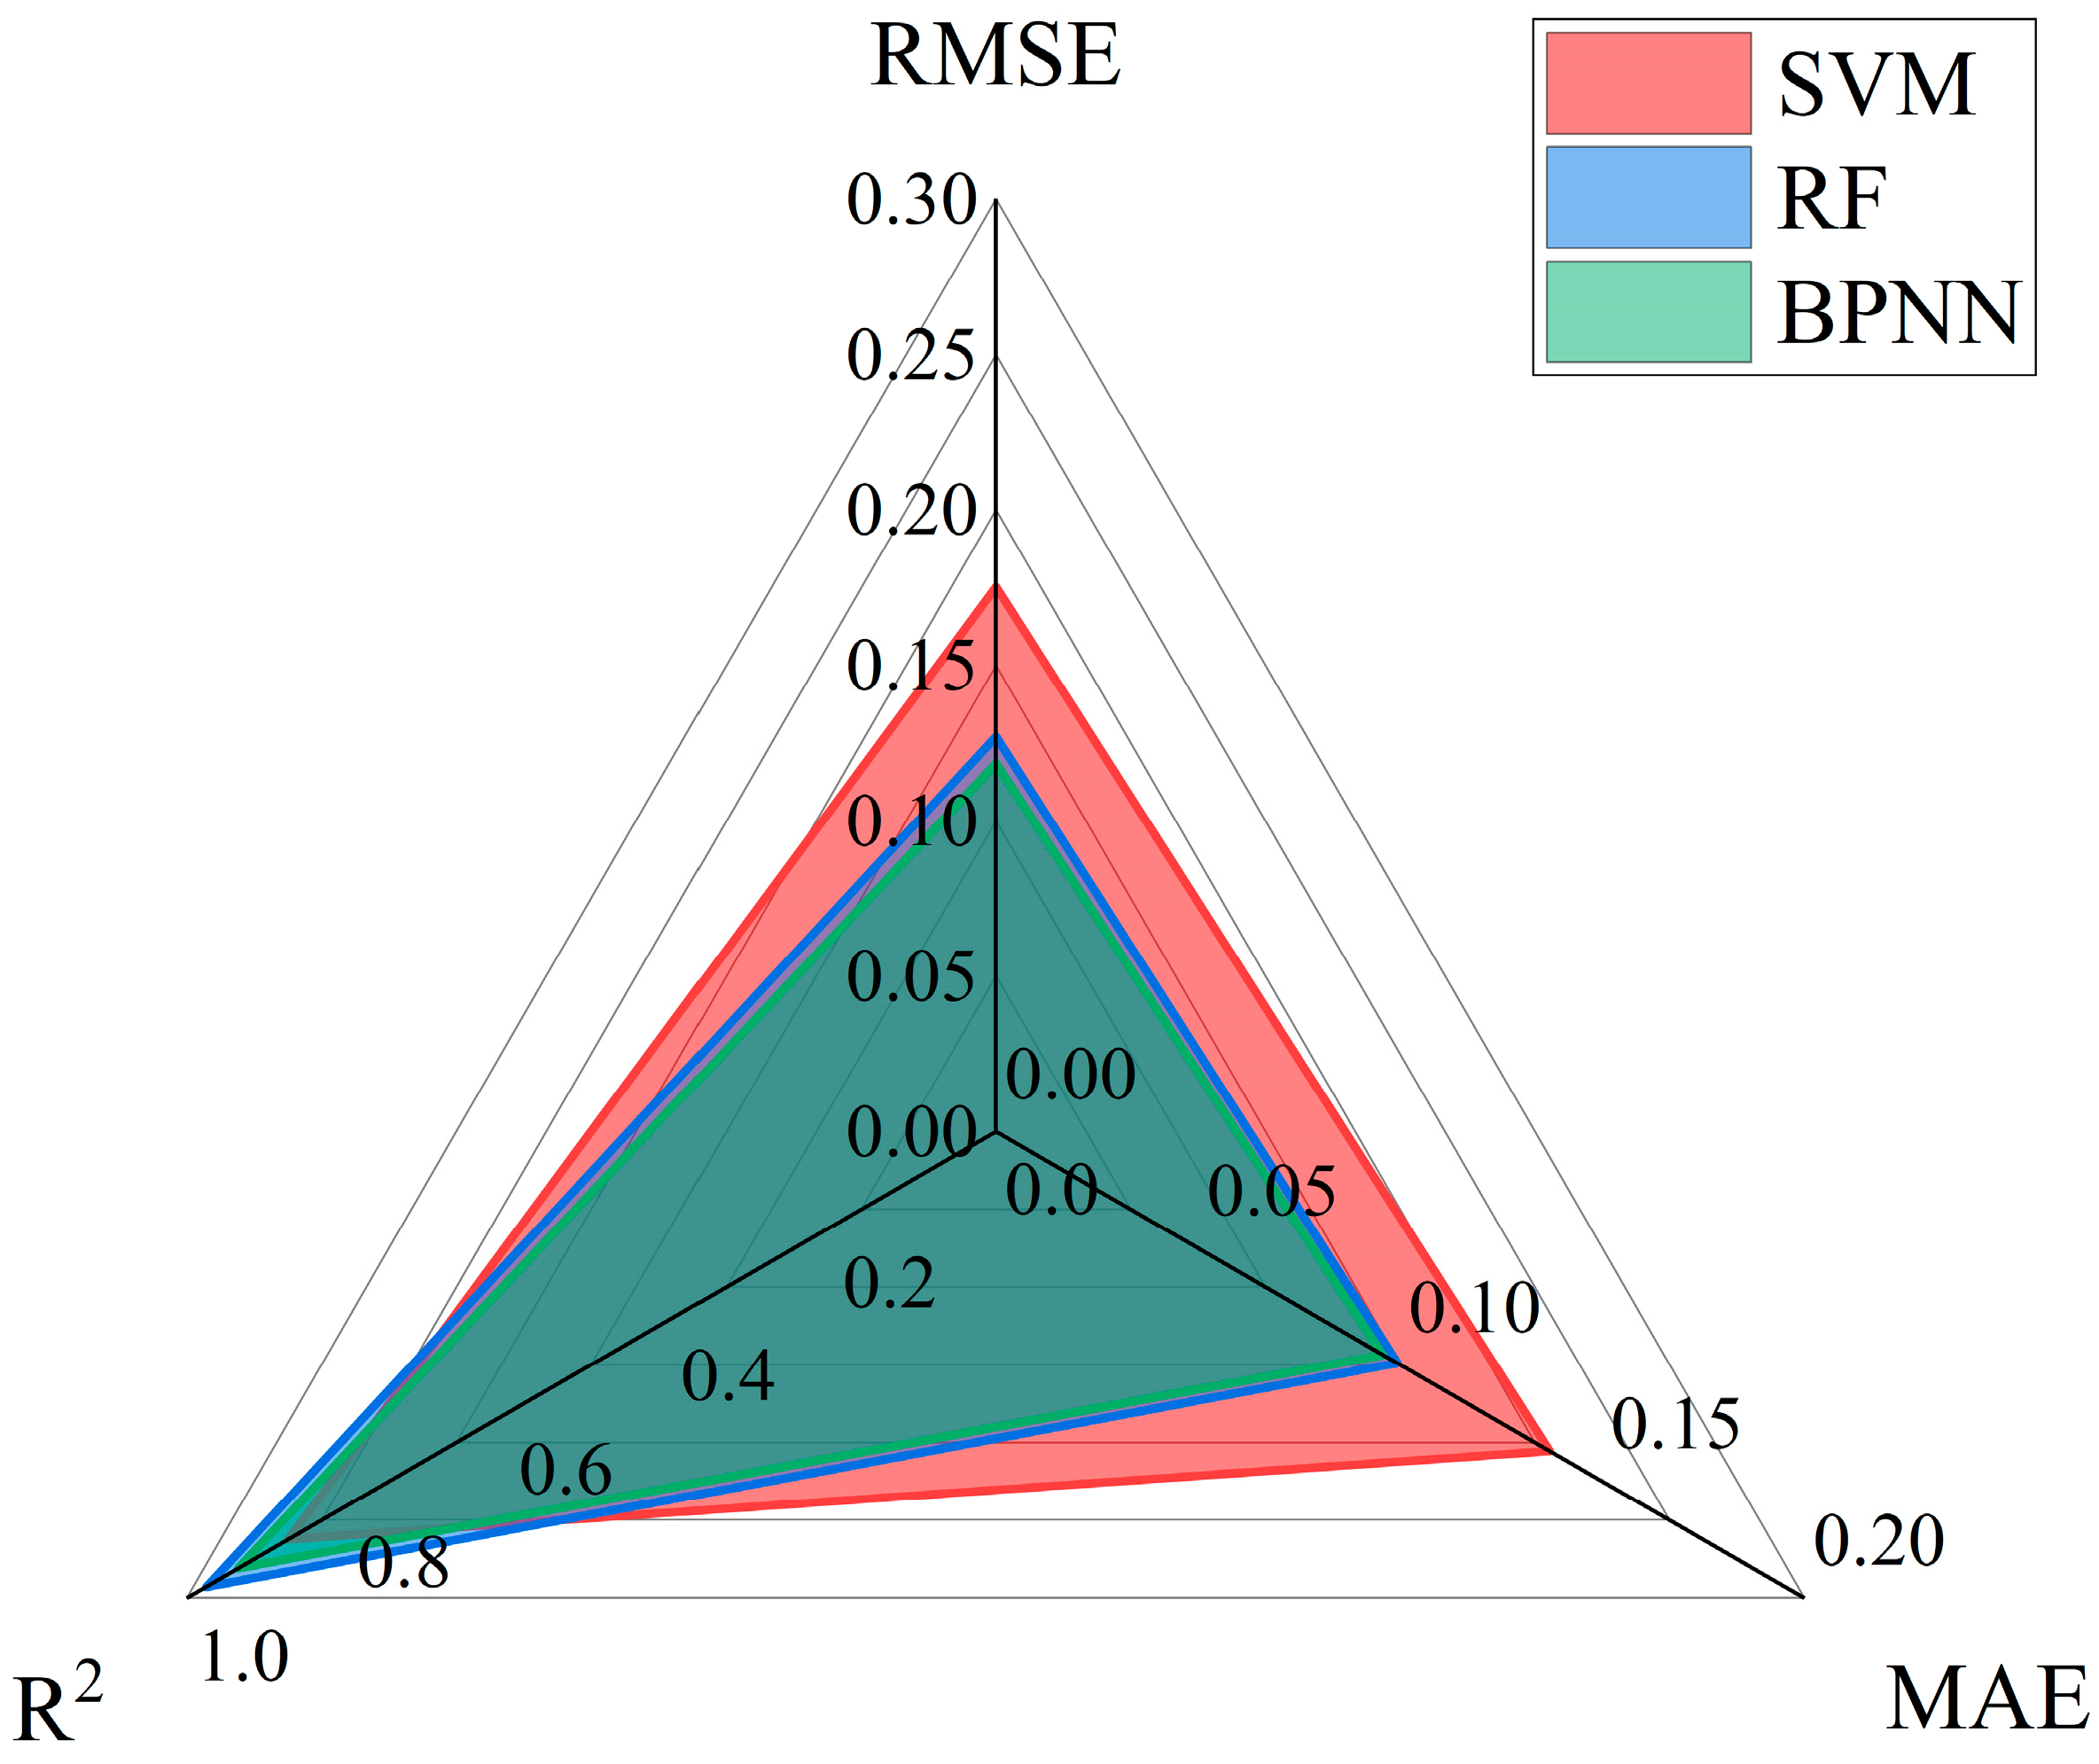
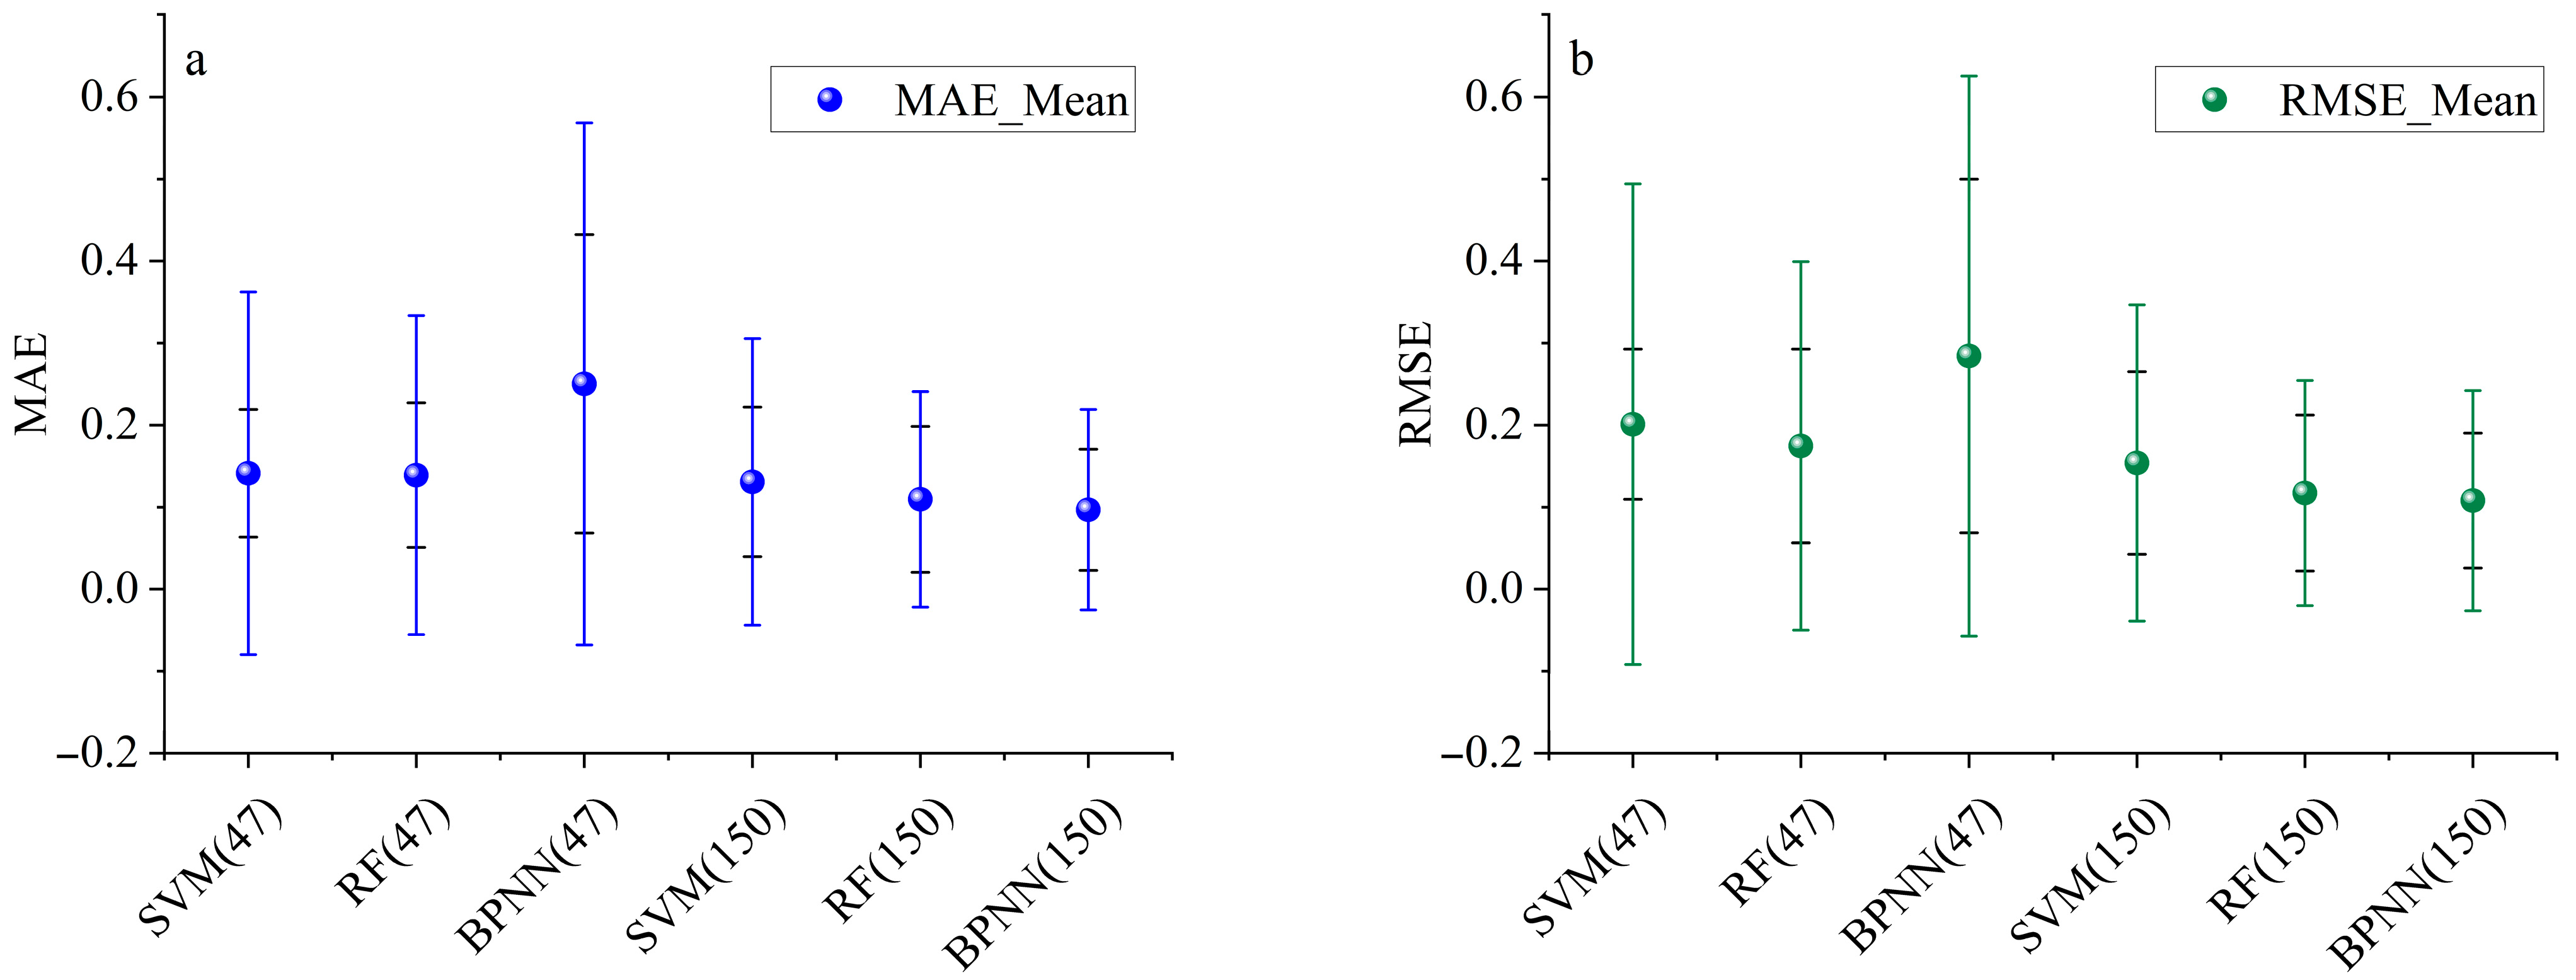
The fitting relationship analysis between the predicted values and actual values of each model after data augmentation to 150 groups is shown in Figure 8, and the regression evaluation indicators of each model are shown in Figure 9. The RMSE and MAE of each model have decreased, and R2 has increased, indicating that an increase in data volume helps to improve the predictive performance of the model. At this point, the Random Forest model still maintains optimal performance with an RMSE of 0.1271, MAE of 0.0993, and R2 of 0.9765. The stability of the RF model is attributed to its inherent noise robustness—the Random Subspace sampling mechanism dilutes the influence of noisy data, and the integrated averaging strategy further smooths out prediction bias. The predictive performance of the BPNN model has significantly improved, with an RMSE of 0.1185, MAE of 0.0957, and R2 of 0.9365, surpassing the SVM model. This is because BPNN, with more data support, can more fully learn the complex nonlinear mapping relationship of granite physical properties, jump out of local optimal solutions, and find parameter combinations that are closer to the global optimum. The RMSE, MAE, and R2 of the SVM model are 0.1752, 0.1370, and 0.8743, respectively. Although the performance has also improved, the improvement is smaller than that of BPNN, which may be related to the interference of noisy data in high-dimensional space. The added Gaussian noise (with a standard deviation of 10% of the feature standard deviation) causes support vector misjudgments, thereby blurring the accuracy of the decision boundary. Divide 47 sets of raw data into 15 sets of test data, and then use three models trained on the raw dataset and the enhanced dataset to predict and analyze the 15 sets of test data. For the MAE and RMSE indicators, considering the small amount of raw data and unknown distribution, the self-service method is chosen to construct confidence intervals. Specifically, a large number of self-service samples (repeated 1000 times) were generated from the difference in corresponding indicators between the two models, and the 95% confidence interval was determined based on the distribution of sample statistics. As shown in Figure 10, the 95% confidence intervals corresponding to the differences in MAE and RMSE of each model before and after data augmentation do not include 0, and the MAE and RMSE of the enhanced dataset models decrease. This indicates that at the 95% confidence level, data augmentation effectively improves model performance, which is not accidental.

3.3. Analysis of Relative Importance of Input Features

The RF model trains data through multiple decision trees. During the construction process of each tree, the contribution of each feature to the reduction in node impurity (such as the Gini index) is calculated, and the impurity reduction in that feature in all trees is summed or averaged as the feature importance score. The larger the mean, the higher the feature importance. SVM and BPNN models calculate feature importance through feature perturbation and determine the relative contribution of each input feature to the prediction of thermal conductivity. In both raw and augmented data, the feature importance calculated by the three models showed a consistent ranking. The importance score of porosity was the highest, significantly higher than other features; The density is the second highest, followed by the longitudinal wave velocity score. The relative contribution calculated by the RF model is shown in Figure 11. This result indicates that porosity and density are the core characteristics controlling the prediction of physical properties of granite, while the independent predictive ability of longitudinal wave velocity and thermal conductivity is weak.
It should be noted that the coefficient of variation in porosity in this study reached 0.88 (standard deviation 6.443, mean 7.329), significantly higher than the longitudinal wave velocity of 0.27 (standard deviation 1.039, mean 3.847), indicating that there are greater differences in porosity among the samples. This high variability may have a potential impact on model performance: in small sample situations, significant fluctuations in porosity can increase the difficulty of capturing stable patterns in the model, leading to increased prediction uncertainty. Although the coefficient of variation in longitudinal wave velocity is relatively low, its data variability still needs to be considered in model construction. Therefore, this study aims to alleviate the adverse effects of a high coefficient of variation and improve the predictive stability of the model by increasing the sample size and using robust algorithms such as Random Forests.
This conclusion is consistent with the fundamental principles of rock physics: porosity reflects the size and distribution of the pore space inside the rock, directly affecting its physical properties such as permeability, storage capacity, and thermal conductivity. Density is closely related to the mineral composition and structural density of rocks and has a significant impact on the mechanical and thermal properties of rocks. Although the longitudinal wave velocity has a power–law relationship with the elastic modulus of rocks, Et = 0.919Vp1.9122 [32], its comprehensive impact on the physical properties of granite in this study is relatively small compared to porosity and density.
This provides important guidance for the research and prediction of the physical properties of granite in the future—in the process of data collection and analysis, attention should be paid to the two key characteristics of porosity and density, while also addressing the issue of data heterogeneity caused by high variability in porosity. In the process of data collection and analysis, in addition to prioritizing the acquisition of porosity and density information, the negative impact of the coefficient of variation can be reduced by increasing sample coverage, optimizing data preprocessing methods, etc., in order to more efficiently obtain and utilize information and improve the accuracy and efficiency of research.

4. Conclusions

This study proposes a prediction method integrating data augmentation and machine learning to address the issues of low accuracy and data scarcity in granite thermal conductivity prediction for deep geothermal development. The detailed conclusions are as follows:
1. A two-stage augmentation strategy (cubic spline interpolation + Gaussian noise injection) expanded 47 samples from the Gonghe and Songliao Basins to 150 sets, with consistent data distribution, effectively alleviating small-sample modeling challenges.
2. Using the enhanced dataset, all models showed improved performance: RMSE and MAE decreased, while R2 increased, confirming that increased data volume enhances predictive ability.
3. The RF model achieved the most significant improvement: RMSE decreased from 0.1870 to 0.0772 (58.4% reduction), R2 increased from 0.7489 to 0.9765 (30.4% increase). Its ensemble learning mechanism strengthened nonlinear mapping, making it most suitable for combining with data augmentation.
4. RF performed best in both raw and augmented data, with inherent robustness to noise; BPNN improved significantly with more data (escaping local optima); SVM showed limited improvement due to high-dimensional spatial noise interference.
5. Feature importance analysis indicated porosity and density as core factors controlling thermal conductivity, with significantly higher impacts than longitudinal wave velocity, recommending prioritized measurement in subsequent studies.

Research Limitations

This study focuses on the application of three classic machine learning models: Support Vector Machine, Random Forest, and artificial neural networks, in predicting the thermal conductivity of granite, and verifies the effectiveness of data augmentation strategies in improving model performance. Due to the initial research focus on combining basic models and data augmentation methods for validation, there has been no systematic optimization exploration of model hyperparameters (such as kernel function parameters of Support Vector Machines, number and depth of decision trees in Random Forests, number and learning rate of hidden layer neurons in neural networks, etc.), dataset partitioning methods, etc. At present, model hyperparameters are mainly based on empirical settings or default values, and may not have reached the global optimal configuration, which to some extent limits further exploration of model performance.
In future research, we will address this limitation by combining intelligent optimization algorithms such as grid search and Bayesian optimization, systematically exploring the impact of hyperparameter combinations and k-fold cross-validation on model prediction accuracy. At the same time, we will expand more advanced model types (such as introducing XGBoost, LightGBM models, etc.), further improve the stability and generalization ability of prediction models through multidimensional comparative analysis, and provide more refined machine learning solutions for efficient prediction of rock thermal properties parameters.

Author Contributions

Conceptualization, Y.M., J.W. and E.Y.; Data curation, Y.M. and Y.Z.; Formal analysis, L.T. and J.W.; Funding acquisition, F.H. and J.W.; Investigation, L.T., F.H. and J.W.; Methodology, Y.M. and Y.Z.; Project administration, F.H., J.W., E.Y. and Y.Z.; Resources, F.H.; Software, Y.M. and E.Y.; Supervision, L.T. and Y.Z.; Validation, L.T.; Visualization, L.T., F.H., E.Y. and Y.Z.; Writing—original draft, Y.M.; Writing—review and editing, Y.M. All authors have read and agreed to the published version of the manuscript.

Funding

This study was funded by the project “Research and Development of Coaxial Sleeve Heat Ex-change System for Efficient and Environmental Protection Development of Geothermal Resources” (SC-2025-020) by the PowerChina Huadong Engineering Corporation Limited.

Data Availability Statement

The datasets generated and/or analyzed during the current study are not publicly available due to the need for follow-up studies but are available from the corresponding author on reasonable request.

Acknowledgments

Special thanks to PowerChina Huadong Engineering Corporation Limited, Zhejiang Huadong Geotechnical Investigation & Design Institute Co., Ltd., Faculty of Engineering, China University of Geosciences, and College of Construction Engineering, Jilin University for their assistance in the research.

Conflicts of Interest

Authors Yongjie Ma, Lin Tian and Fuhang Hu were employed by the company Zhejiang Huadong Geotechnical Investigation & Design Institute Co., Ltd. Authors Yongjie Ma and Jingyong Wang were employed by the company PowerChina Huadong Engineering Corporation Limited. The authors declare that this study received funding from PowerChina Huadong Engineering Corporation Limited and the Zhejiang Huadong Geotechnical Investigation & Design Institute Co., Ltd. The funder was not involved in the study design, collection, analysis, interpretation of data, the writing of this article or the decision to submit it for publication. The remaining authors declare that the research was conducted in the absence of any commercial or financial relationships that could be construed as a potential conflict of interest.

References

  1. Chen, F.; Lin, J.; He, G.; Wang, S.; Huang, X.; Zhao, B.; Wang, S.; Han, Y.; Qi, S. Analysis of geothermal resources in the northeast margin of the Pamir plateau. Geothermics 2025, 127, 103254. [Google Scholar] [CrossRef]
  2. Spichak, V.V.; Nenyukova, A.I. Delineating crustal domains favorable for exploring enhanced geothermal resources based on temperature, petro- and thermophysical properties of rocks: A case study of the Soultz-sous-Forêts geothermal site, France. Renew. Energy 2025, 246, 122902. [Google Scholar] [CrossRef]
  3. Yu, Z.; Ye, X.; Zhang, Y.; Gao, P.; Huang, Y. Experimental research on the thermal conductivity of unsaturated rocks in geothermal engineering. Energy 2023, 282, 129019. [Google Scholar] [CrossRef]
  4. Dong, S.; Yu, Y.; Li, B.; Ni, L. Thermal analysis of medium-depth borehole heat exchanger coupled layered stratum thermal conductivity. Renew. Energy 2025, 246, 122880. [Google Scholar] [CrossRef]
  5. Sowiżdżał, A.; Machowski, G.; Krzyżak, A.; Puskarczyk, E.; Krakowska-Madejska, P.; Chmielowska, A. Petrophysical evaluation of the Lower Permian formation as a potential reservoir for CO2-EGS—Case study from NW Poland. J. Clean. Prod. 2022, 379, 134768. [Google Scholar] [CrossRef]
  6. Oh, H.-R.; Baek, J.-Y.; Park, B.-H.; Kim, S.-K.; Lee, K.-K. Influence of borehole characteristics on thermal response test analysis using analytical models. Appl. Therm. Eng. 2025, 268, 125892. [Google Scholar] [CrossRef]
  7. García-Noval, C.; Álvarez, R.; García-Cortés, S.; García, C.; Alberquilla, F.; Ordóñez, A. Definition of a thermal conductivity map for geothermal purposes. Geotherm. Energy 2024, 12, 17. [Google Scholar] [CrossRef]
  8. Priarone, A.; Morchio, S.; Fossa, M.; Memme, S. Low-Cost Distributed Thermal Response Test for the Estimation of Thermal Ground and Grout Conductivities in Geothermal Heat Pump Applications. Energies 2023, 16, 7393. [Google Scholar] [CrossRef]
  9. Wilke, S.; Menberg, K.; Steger, H.; Blum, P. Advanced thermal response tests: A review. Renew. Sustain. Energy Rev. 2020, 119, 109575. [Google Scholar] [CrossRef]
  10. Kang, J.; Yu, Z.; Wu, S.; Zhang, Y.; Gao, P. Feasibility analysis of extreme learning machine for predicting thermal conductivity of rocks. Environ. Earth Sci. 2021, 80, 455. [Google Scholar] [CrossRef]
  11. Mahmoodzadeh, A.; Mohammadi, M.; Salim, S.G.; Ali, H.F.H.; Ibrahim, H.H.; Abdulhamid, S.N.; Nejati, H.R.; Rashidi, S. Machine Learning Techniques to Predict Rock Strength Parameters. Rock Mech. Rock Eng. 2022, 55, 1721–1741. [Google Scholar] [CrossRef]
  12. Zamanzadeh Talkhouncheh, M.; Davoodi, S.; Wood, D.A.; Mehrad, M.; Rukavishnikov, V.S.; Bakhshi, R. Robust Machine Learning Predictive Models for Real-Time Determination of Confined Compressive Strength of Rock Using Mudlogging Data. Rock Mech. Rock Eng. 2024, 57, 6881–6907. [Google Scholar] [CrossRef]
  13. Xu, H.; Yan, J.; Feng, G.; Jia, Z.; Jing, P. Rock Layer Classification and Identification in Ground-Penetrating Radar via Machine Learning. Remote Sens. 2024, 16, 1310. [Google Scholar] [CrossRef]
  14. Ali, N.; Fu, X.; Chen, J.; Hussain, J.; Hussain, W.; Rahman, N.; Iqbal, S.M.; Altalbe, A. Advancing Reservoir Evaluation: Machine Learning Approaches for Predicting Porosity Curves. Energies 2024, 17, 3768. [Google Scholar] [CrossRef]
  15. Bu, M.; Fang, C.; Guo, P.; Jin, X.; Wang, J. Predicting thermal conductivity of granite subjected to high temperature using machine learning techniques. Environ. Earth Sci. 2025, 84, 219. [Google Scholar] [CrossRef]
  16. Luo, P.; Fang, X.; Li, D.; Yu, Y.; Li, H.; Cui, P.; Ma, J. Evaluation of excavation method on point load strength of rocks with poor geological conditions in a deep metal mine. Geomech. Geophys. Geo-Energy Geo-Resour. 2023, 9, 90. [Google Scholar] [CrossRef]
  17. Zhang, C.-h.; Wang, Y.; Wu, L.-j.; Dong, Z.-k.; Li, X. Physics-informed and data-driven machine learning of rock mass classification using prior geological knowledge and TBM operational data. Tunn. Undergr. Space Technol. 2024, 152, 105923. [Google Scholar] [CrossRef]
  18. Chen, M.; Kang, X.; Ma, X. Deep Learning-Based Enhancement of Small Sample Liquefaction Data. Int. J. Geomech. 2023, 23, 04023140. [Google Scholar] [CrossRef]
  19. Mehdi, S.; Smith, Z.; Herron, L.; Zou, Z.; Tiwary, P. Enhanced Sampling with Machine Learning. Annu. Rev. Phys. Chem. 2024, 75, 347–370. [Google Scholar] [CrossRef] [PubMed]
  20. Su, J.; Yu, X.; Wang, X.; Wang, Z.; Chao, G. Enhanced transfer learning with data augmentation. Eng. Appl. Artif. Intell. 2024, 129, 107602. [Google Scholar] [CrossRef]
  21. Li, X.; Ao, Y.; Guo, S.; Zhu, L. Combining Regression Kriging With Machine Learning Mapping for Spatial Variable Estimation. IEEE Geosci. Remote Sens. Lett. 2020, 17, 27–31. [Google Scholar] [CrossRef]
  22. Wang, T.; Trugman, D.; Lin, Y. SeismoGen: Seismic Waveform Synthesis Using GAN With Application to Seismic Data Augmentation. JGR Solid Earth 2021, 126, e2020JB020077. [Google Scholar] [CrossRef]
  23. Bai, L.; Li, J.; Zeng, Z.; Tao, D. Prediction of Terrestrial Heat Flow in Songliao Basin Based on Deep Neural Network. Earth Space Sci. 2023, 10, e2023EA003186. [Google Scholar] [CrossRef]
  24. Huang, J.; Lu, C.; Huang, D.; Qin, Y.; Xin, F.; Sheng, H. A Spatial Interpolation Method for Meteorological Data Based on a Hybrid Kriging and Machine Learning Approach. Int. J. Climatol. 2024, 44, 5371–5380. [Google Scholar] [CrossRef]
  25. Yang, Y.; Zhang, J.; Wang, X.; Liang, M.; Li, D.; Liang, M.; Ou, Y.; Jia, D.; Tang, X.; Li, X. Deep structure and geothermal resource effects of the Gonghe basin revealed by 3D magnetotelluric. Geotherm. Energy 2024, 12, 6. [Google Scholar] [CrossRef]
  26. Niu, P.; Han, J.; Zeng, Z.; Hou, H.; Liu, L.; Ma, G.; Guan, Y. Deep controlling factors of the geothermal field in the northern Songliao basin derived from magnetotelluric survey. Chin. J. Geophys. 2021, 64, 4060–4074. [Google Scholar] [CrossRef]
  27. Rao, G.; Pujari, D.G.; Khalkar, R.G.; Medhe, V.A. Study on Software Defect Prediction Based on SVM and Decision Tree Algorithm. Int. J. Recent Innov. Trends Comput. Commun. 2023, 11, 90–95. [Google Scholar] [CrossRef]
  28. Liu, G. Tropical climate prediction method combining random forest and feature fusion. Int. J. Low-Carbon Technol. 2025, 20, 154–166. [Google Scholar] [CrossRef]
  29. Shao, J.-J.; Li, L.-B.; Yin, G.-J.; Wen, X.-D.; Zou, Y.-X.; Zuo, X.-B.; Gao, X.-J.; Cheng, S.-S. Prediction of Compressive Strength of Fly Ash-Recycled Mortar Based on Grey Wolf Optimizer–Backpropagation Neural Network. Materials 2025, 18, 139. [Google Scholar] [CrossRef]
  30. Shi, H.; Zhang, Y.; Yu, Z.; Yang, Y. Reservoir temperature prediction based on characterization of water chemistry data—Case study of western Anatolia, Turkey. Sci. Rep. 2024, 14, 10339. [Google Scholar] [CrossRef] [PubMed]
  31. Shi, H.; Zhang, Y.; Cheng, Y.; Guo, J.; Zheng, J.; Zhang, X.; Lei, Y.; Ma, Y.; Bai, L. A novel machine learning approach for reservoir temperature prediction. Geothermics 2025, 125, 103204. [Google Scholar] [CrossRef]
  32. Altindag, R. Correlation between P-wave velocity and some mechanical properties for sedimentary rocks(Article). J. S. Afr. Inst. Min. Metall. 2012, 112, 229–237. [Google Scholar]
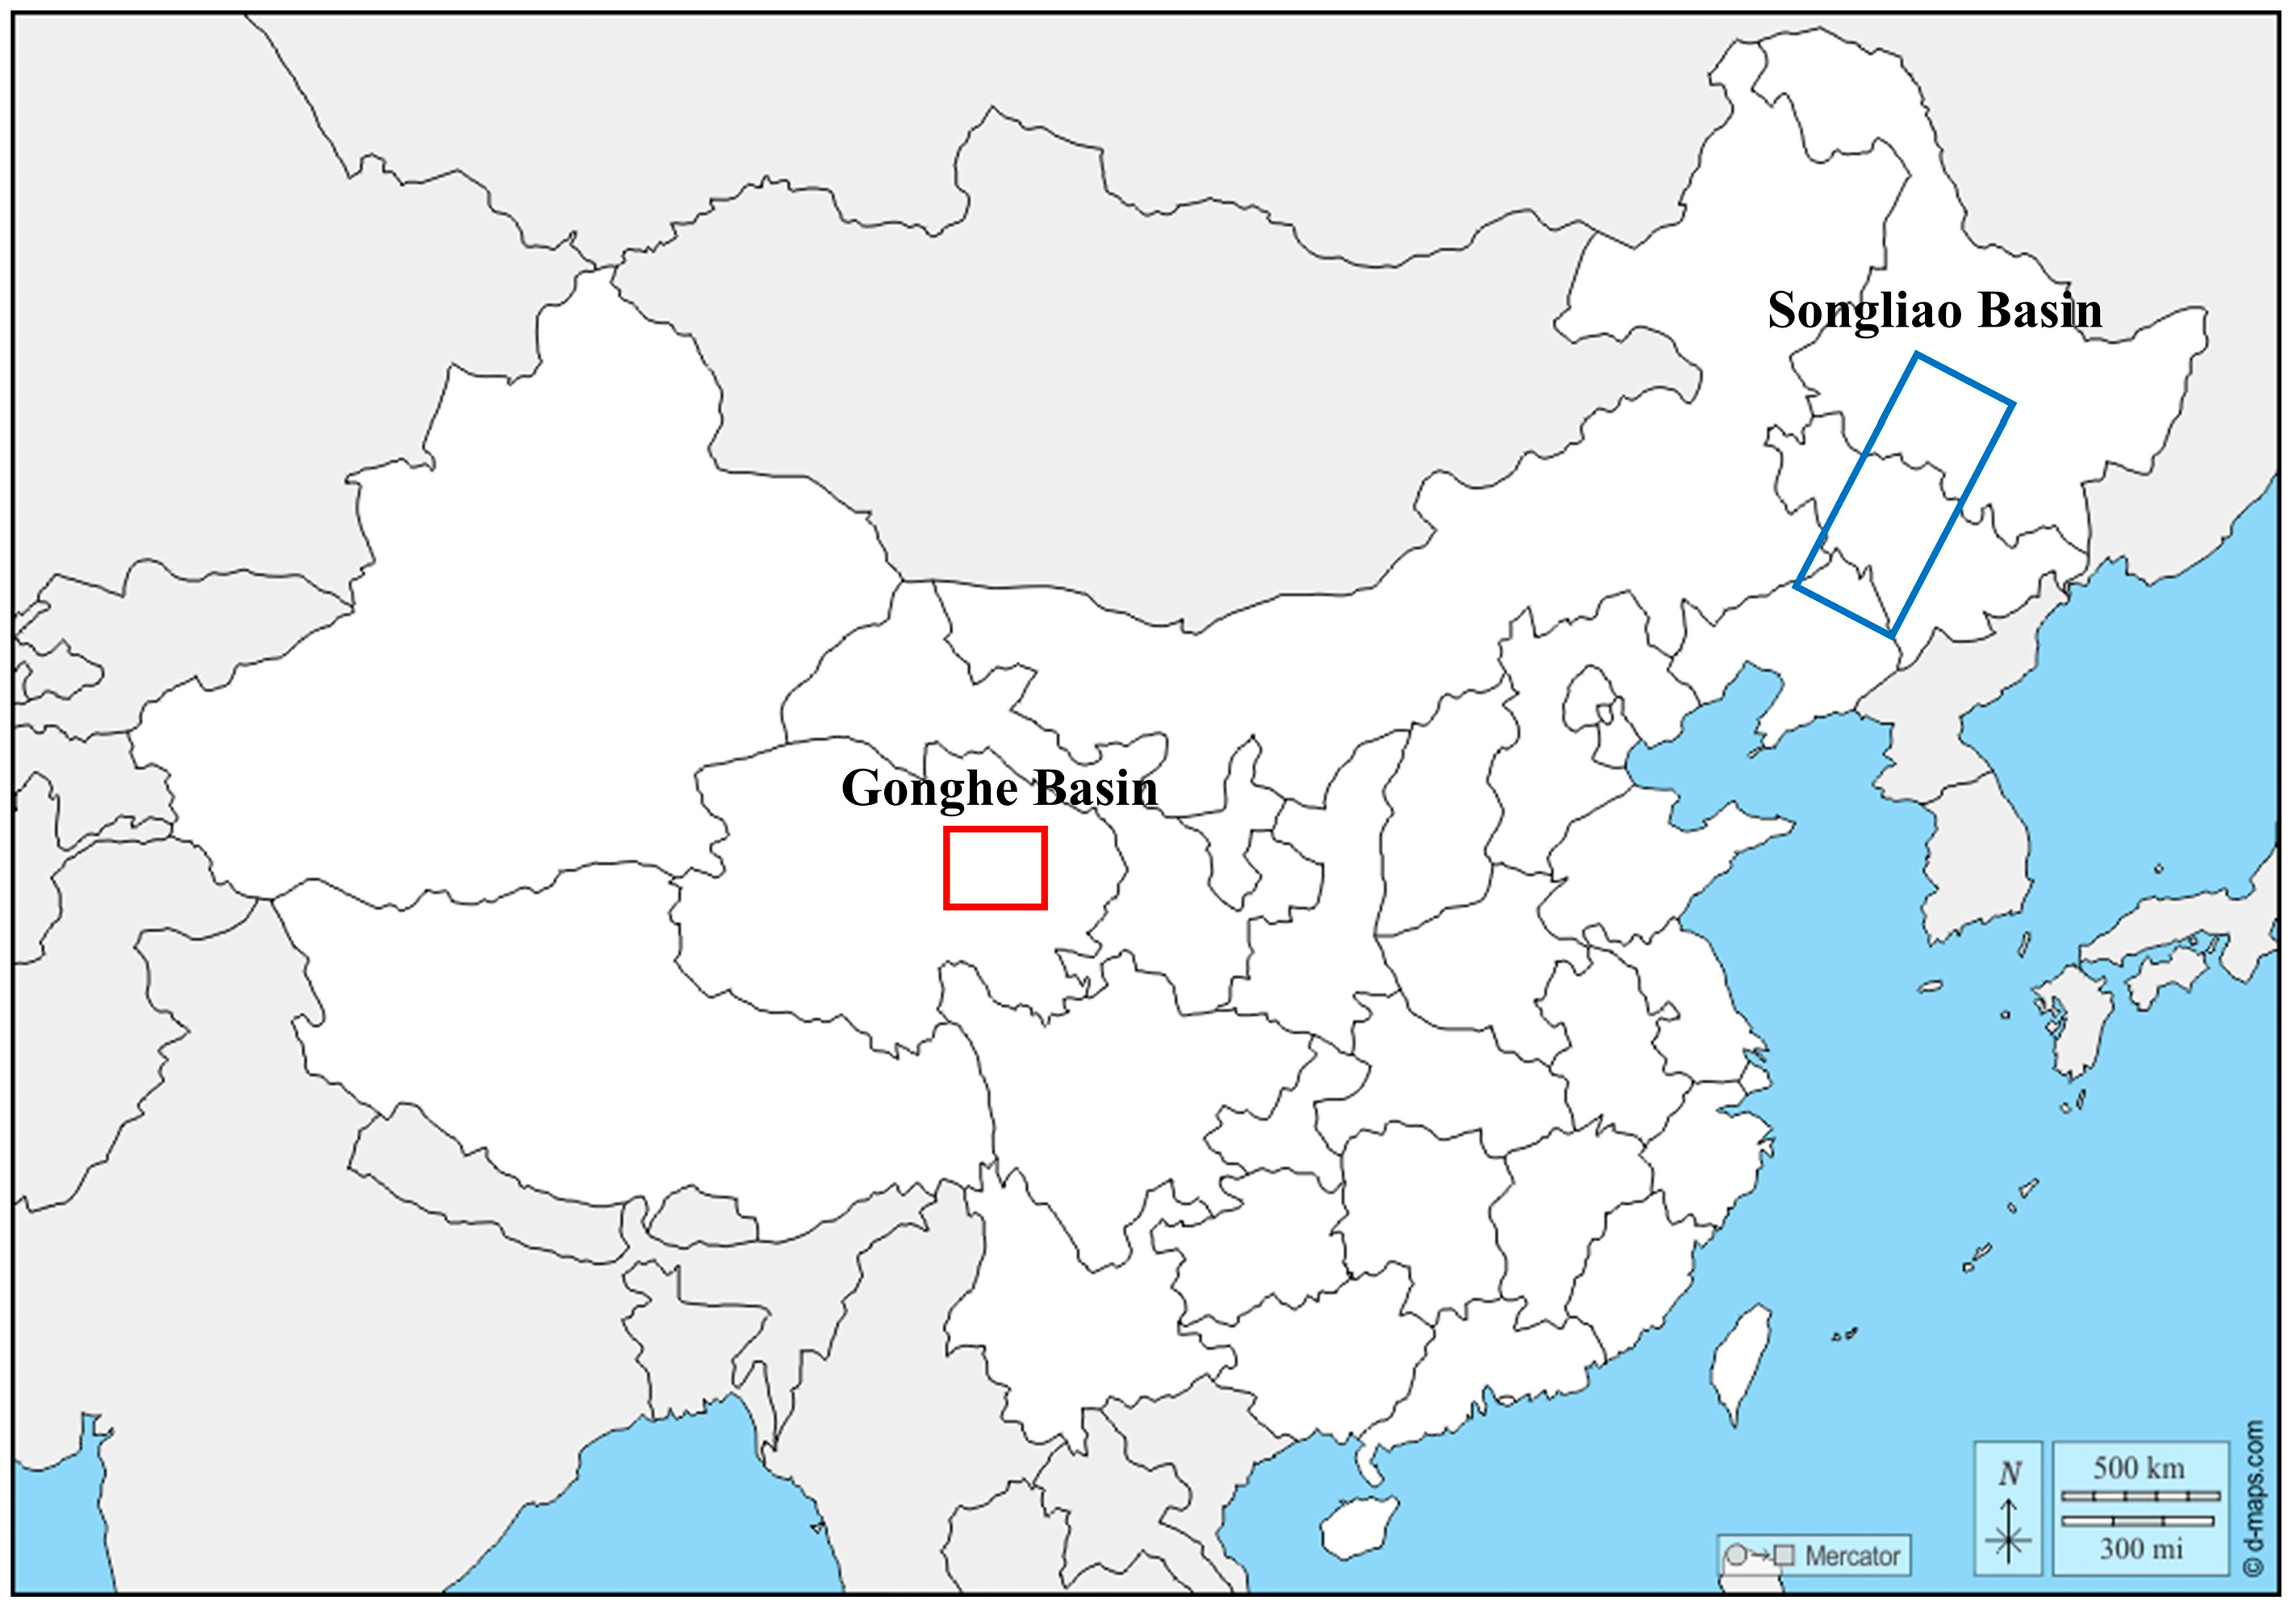
Figure 1. Geographical location indication.
Energies 18 04175 g001
Figure 2. Experimental tests: (a) Processed rock sample, (b) Vernier caliper and tray balance, (c) KSY-II automatic hole permeability analyzer, (d) RSW-SY5 (T) non-metallic acoustic detector, (e) TCS thermal conductivity tester.
Energies 18 04175 g002
Figure 3. Box plot of experimental results: (a) Longitudinal wave velocity, (b) Porosity, (c) Density, (d) Thermal conductivity.
Energies 18 04175 g003
Figure 4. Diagram of data enhancement process.
Energies 18 04175 g004
Figure 5. (a) The relationship between thermal conductivity and wave velocity; (b) The relationship between thermal conductivity and porosity; (c) The relationship between thermal conductivity and density.
Energies 18 04175 g005
Figure 6. t-SNE dimensionality reduction verification enhanced data.
Energies 18 04175 g006
Figure 7. Comparison of regression indicators based on raw datasets.
Energies 18 04175 g007
Figure 8. Analysis of the fitting relationship between model-predicted values and actual values.
Energies 18 04175 g008
Figure 9. Comparison of regression indicators based on enhanced dataset.
Energies 18 04175 g009
Figure 10. Comparison of confidence intervals between initial and enhanced dataset self-service methods.
Energies 18 04175 g010
Figure 11. Relative importance of input features.
Energies 18 04175 g011
Table 1. Statistical data of rock samples.
ParameterLongitudinal Wave Velocity
(km/s)
Porosity
(%)
Density
(kg/m3)
Thermal Conductivity
(W/(m·K))
SymbolVpnρλ
Average value3.8477.3922.5562.451
Maximum value5.81420.992.9262.961
Minimum value2.3090.452.1201.392
Standard deviation1.0396.4430.2090.377
Disclaimer/Publisher’s Note: The statements, opinions and data contained in all publications are solely those of the individual author(s) and contributor(s) and not of MDPI and/or the editor(s). MDPI and/or the editor(s) disclaim responsibility for any injury to people or property resulting from any ideas, methods, instructions or products referred to in the content.