Abstract
The growing demand for power and the rising awareness of the need to reduce carbon footprints have led to wider acceptance of photovoltaic (PV)-integrated microgrids. PV-based microgrids have numerous significant advantages over other distributed energy resources; however, creating a dependable protection scheme for the DC microgrid is difficult due to the closely resembling current and voltage profiles of PV array faults and line faults in the DC network. The conventional methods fail to clearly discriminate between them. In this regard, a fault-resilient scheme exploiting the inherent characteristics of Fourier–Bessel Series Expansion and Empirical Wavelet Transform (FBSE-EWT) has been utilized in the present work. In order to enhance the efficacy of the bagging tree-based ensemble classifier, Artificial Gorilla Troop Optimization (AGTO) has been used to tune the hyperparameters. The hybrid protection approach is proposed for accurate fault detection, discrimination between scenarios (source-side fault and line-side fault), and classification of various fault types (pole–pole and pole–ground). The discriminatory attributes derived from voltage and current signals recorded at the DC bus using the hybrid FBSE-EWT have been utilized as an input feature set for the AGTO tuned bagging tree-based ensemble classifier to perform the intended tasks of fault detection and discrimination between source faults (PV array faults) and line faults (DC network). The proposed approach has been found to outperform the decision tree and SVM techniques, demonstrating reliability in terms of discriminating between the PV array faults and the DC line faults and resilience against fluctuations in PV irradiance levels.
1. Introduction
The global power system is undergoing a significant transformation, transitioning from traditional bulk power generation to distributed generation (DG) technologies. This shift is driven by increasing demand for green energy and the urgent need to reduce greenhouse gas emissions from conventional power generation methods. Many nations have responded by implementing policies and setting ambitious targets for integrating renewable energy resources into their electricity grids. These efforts aim to reduce the reliance on fossil fuels and mitigate the environmental impact of power generation. The growing concern over reducing carbon footprints and the rapid development of microgrid technology has been propelled by the DG concept, which presents a promising pathway for the efficient use of renewable energy sources [1]. Distributed energy resources (DERs) such as solar photovoltaics (PV), wind turbines, and energy storage systems are being widely deployed in microgrids—localized grids that can operate independently or in conjunction with the main grid. Microgrids provide flexibility and resilience in energy management, but their integration into power systems presents unique challenges, particularly in terms of ensuring reliable and adaptive protection mechanisms.
The research community has paid increasing attention to microgrid protection, which is essential for guaranteeing safe and reliable operation. However, the reduced inertia of DG units and the variable operational modes of microgrids pose significant challenges to the speed and dependability of protection schemes [2,3]. These challenges are especially pronounced in PV-integrated microgrids due to the intermittent and unpredictable nature of solar energy, which complicates fault detection and response mechanisms.
Among the widely adopted DERs, PV systems have gained momentum in microgrids due to the ease of access to solar energy and their cost-effective operation [3]. However, PV-based microgrids face unique protection challenges due to the variability in solar generation, which depends on environmental factors such as sunlight availability. Furthermore, PV systems’ operating characteristics differ significantly from those of other DERs, leading to divergent fault profiles and protection requirements. This disparity makes it challenging to implement traditional protection schemes designed for conventional generation sources.
A major challenge in PV-integrated microgrids is the difficulty in distinguishing between faults in the PV array and faults in the DC distribution network. While both types of faults may affect the microgrid operation, they require different relaying action. In the event of a line fault, protection mechanisms must isolate the faulty line or feeder, whereas in the case of a PV array fault, the faulty module should be disconnected from the microgrid. Restoring normal operation after a shunt fault involves detecting and isolating the faulty line, while PV array faults require isolating of the faulty module [4]. However, classical relays that rely on post-fault voltage and current profiles struggle to distinguish between these faults, as both result in similar post-fault signatures [5].
When compared to the AC system, DC microgrids offer several merits, including higher efficiency, seamless integration of renewable resources, and increased reliability and flexibility [4]. These benefits make DC microgrids particularly attractive for modern power distribution systems, especially for renewable energy integration. However, the protection issues hinder the realization of these benefits. One of the primary challenges in PV-fed DC microgrids is the abrupt rise in fault current during faults, which demands fast and accurate detection to prevent damage and ensure safety.
DC microgrids face protection challenges due to the difficulty in distinguishing between shunt faults in the DC cables and faults in the PV array. Although both types of faults can have a disruptive impact on microgrid operation, they differ in terms of the post-fault troubleshooting measures required. For example, detecting a shunt fault involves isolating the faulty line, while a PV array fault requires the disconnection of the faulty PV module from the microgrid. However, traditional protection devices that rely on voltage and current measurements often fail to differentiate between these fault types, leading to the potential maloperation of protection devices and unnecessary system shutdowns [6].
Advanced protection schemes are required to accurately detect and categorize different types of faults in PV-integrated microgrids. Traditional protection methods based on predefined voltage and current thresholds may quite often fail to discriminate between the similar profiles arising from scenarios pertaining to the faults in the PV array and in the DC line. As a result, these schemes may cause incorrect fault isolation or prolonged system downtime. High selectivity in fault detection is crucial to avoid unnecessary tripping of protection devices and to maintain the operational integrity of the microgrid.
Several protection algorithms have been proposed in recent decades to address these challenges. One approach is the use of discrete wavelet transform (DWT) for feature extraction, combined with a decision tree classifier [4]. Other techniques include ensemble classifier-based protection schemes, estimation of DER impedance, and differential protection schemes based on time–frequency analysis. The protection strategy utilizing magnitude and angle has also been reported in the literature [7], along with methods that apply fast recursive discrete Fourier transform (FRDFT) and fuzzy logic modules for relay current settings [8,9]. Although these methods have proven effective, their reliability in distinguishing between PV array faults and line faults in microgrids has not been adequately explored.
Despite recent advancements, there remains a critical gap in the ability to detect and categorize the two kinds of scenarios involving faults in PV arrays and line faults in PV-based microgrids. Most of the existing protection methods are designed primarily for standalone PV systems and have not been extended to the more complex environment of microgrids, where interaction between the PV array and DC network introduces additional protection challenges.
The reliability of protection algorithms for PV-fed DC microgrids must be analyzed with regard to their ability to discriminate the PV array faults and line faults. Current methods for detecting array faults are not designed for microgrid applications, where the fault profiles are more dynamic and complex [10,11,12,13,14]. Moreover, many documented works focus on the shortcomings of either line or array faults but fail to address both simultaneously [15,16,17].
Over the past few years, numerous protection schemes have been proposed, including techniques that combine signal processing methods like DWT with machine learning classifiers for improved fault detection and classification [4]. Ensemble classifiers, FRDFT, and time–frequency domain analysis have also been explored to enhance the reliability of protection schemes. While these methods show promise, there is still a need for further research to address the issue of discriminating between PV array and line faults in microgrids. One promising approach is to directly utilize the standard deviation of raw voltage and current data as inputs to the classifier. This method minimizes the computational cost involved in feature extraction, making it suitable for real-time applications in DC microgrids [18,19,20,21]. Additionally, further research should focus on developing algorithms that can adapt to the operational dynamics of the microgrid, considering factors such as load variations and weather-induced intermittency in PV generation.
Thus, to address such complex issues, the inherent advantages of Fourier–Bessel Series Expansion and Empirical Wavelet Transform (FBSE-EWT), over other transforms such as DWT and FFT, make it particularly suitable for applications involving the task of fault detection in power systems, vibration analysis, biomedical signal processing, and other domains where precise time–frequency localization, low-frequency resolution, and robustness to noise are essential [22,23]. In this regard, in the present work, the FBSE-EWT has been utilized to extract useful features from the voltage and current signals to derive Shannon entropy, kurtosis, root mean square (RMS), and variance to be fed as input to the classifier.
Further, the reliability of any protection scheme is also dependent upon the selection of an efficient machine learning classifier. And the ensemble classifier is always considered more accurate than a single classifier in terms of the complex decision-making task. In order to further enhance the model accuracy and prevent overfitting by balancing bias-variance trade-off, tuning of the hyperparameters of an ensemble classifier improves model performance by optimizing the governing factors. Additionally, it can reduce training time by finding the optimal number of trees, and boost generalization on unseen data, resulting in better predictive performance across various tasks. In this regard, the bagging tree classifier has been used with its three hyperparameters, i.e., number of decision trees, number of splits, and leaf size, which are tuned by the Artificial Gorilla Troop Optimization (AGTO) technique. Due to its inherent merits, such as better exploration–exploitation balance, strong global search capabilities, and adaptability to complex problems, AGTO is considered better than the widely used techniques such Genetic Algorithm (GA) and Particle Swarm Optimization (PSO) [24,25,26,27,28].
To effectively distinguish between PV array faults and DC line faults despite their similar time-domain profile, the present work leverages their underlying physical and spectral variations. The dominant features such as entropy, kurtosis, RMS, and variance are carefully estimated to reflect these distinctions, thus enabling accurate fault discrimination. The adoption of frequency-based analysis techniques, including FBSE and EWT, further enhances feature relevance. These considerations motivated the adoption of a pattern recognition-based bagging tree classification algorithm, ensuring both precision and robustness in fault identification and discrimination.
The applicability of the proposed protection algorithm has been analyzed for wide variation in fault and no-fault scenarios, with considerable variations in the parameters. The test results obtained by the proposed scheme have demonstrated a high degree of accuracy in performing the fault detection and classification task as well as improved robustness against weather intermittency in PV systems. Its performance has also been compared with support vector machine (SVM) and decision tree (DT) classifiers.
The proposed hybrid protection approach is aimed at discriminating between line faults and PV array faults while simultaneously addressing the challenges pertaining to dynamic operating profiles, including PV intermittency. The major contributions of the proposed approach include:
- The development of a fault resilient protection scheme for PV-interfaced DC microgrids to discriminate between the faults in the PV array and the DC network.
- Exploiting the inherent merits of Fourier–Bessel Series Expansion and Empirical Wavelet Transform (FBSE-EWT) to determine the discriminatory attributes such as Shannon entropy, kurtosis, root mean square (RMS), and variance.
- Enhancing the robustness of the proposed scheme by tuning the hyperparameters of the bagging tree classifier using the Artificial Gorilla Troop Optimization (AGTO) technique.
- Exploring the applicability of the proposed hybrid protection scheme against intermittency in the PV-based source.
- Comparison with widely used DT and SVM classifiers to demonstrate the outperforming ability of the proposed scheme in achieving reliable protection tasks.
The paper is outlined in the following manner: Section 2 includes the modeling and simulation of a distributed PV array interfaced in a DC microgrid. Section 3 includes the discussion related to the development of the proposed protection scheme. The detailed discussion on the performance evaluation is presented in Section 4, followed by concluding remarks on the effectiveness of the proposed solution in Section 5.
2. Distributed PV Array and DC Microgrid Modeling
The distributed PV array interfaced with DC microgrid network considered in present study is illustrated schematically in Figure 1 [3]. The DC microgrid comprises various elements interfacing with the AC grid, including distributed energy resources (DERs) like diesel generators, photovoltaic (PV) systems, and DC loads. The photovoltaic system consists of shunt-connected solar generators, which are linked to the DC grid via DC–DC converters. The time-domain instantaneous current-voltage signals measured at the DC bus have been considered for protection analysis purposes.
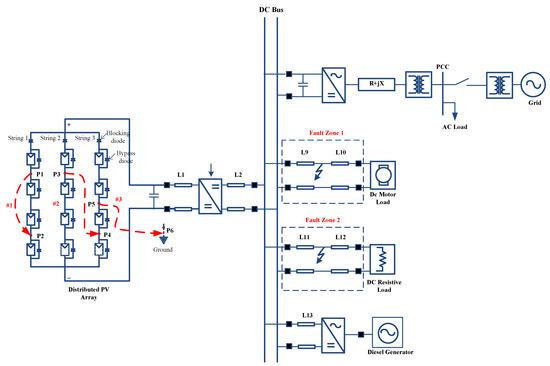
Figure 1.
DC microgrid network schematic considered in study.
In order to analyze the fault at source side, the PV array is modeled as a distributed configuration of PV modules arranged in both series and parallel configurations, with each parallel string containing PV modules connected in series, as depicted in Figure 1. This model allows for an evaluation of the impact of PV array faults on the distribution network. To analyze fault behavior, three distinct fault scenarios were created at specific locations #1, #2, and #3: line-to-line faults within the same string, line-to-line faults between parallel strings, and line-to-ground faults. This figure represents a PV-fed DC microgrid system with various components interconnected through a DC bus. On the left, the distributed PV array is shown, consisting of multiple strings (String 1, String 2, and String 3) with blocking diodes and parallel PV modules. These modules are connected to the DC grid via a DC–DC converter. The system interfaces with multiple loads and energy sources through the DC bus. Two fault zones (Zone 1 and Zone 2) are highlighted along the lines L9, L10, L11, and L12, which connect to a DC motor load and a resistive DC load, respectively. These zones indicate potential areas for line faults (both line-to-line and line-to-ground faults). Additionally, a diesel generator is connected to the DC bus via line L13, providing backup power. The grid is interfaced with the DC system through an AC–DC converter and point of common coupling (PCC), facilitating AC loads. The layout emphasizes fault zones and the flow of energy within the system.
3. Proposed Protection Scheme
As described earlier, the comparable post-fault profile, accompanied by faults in the PV array and DC network, demands a dependable protective relaying scheme that should be capable to differentiate the two kinds of scenarios in order to prevent the unintended tripping of the relay [29,30,31]. To perform the intended task of protection, an efficient protection strategy is sought. In this regard, the joint framework involving Fourier–Bessel Series Expansion, Empirical Wavelet Transform-based feature extraction, and the Artificial Gorilla Troop Optimization tuned bagging classifier has been developed. The detailed implementation of the proposed technique is described in the subsequent sub-sections:
In order to perform the intended protection tasks of fault identification and discrimination, the following fault scenarios have been simulated:
- (i)
- Simulation of pole–pole (PP) and pole–ground (PG) faults in the fault zones 1 and 2 of the DC line with wide variability in the fault parameters involving the fault location and resistance.
- (ii)
- PV array faults involving line–ground and line–line are created in the array, as depicted in Figure 1.
In order to demonstrate the similar post-fault characteristics of current arising due to a PV array fault and the fault in the DC line, the time-domain current signal recorded at the DC bus in case of line–ground fault inception in zone 1 with fault resistance Rf = 5 Ω at t = 1.7 s followed by inception of a pole–ground fault in the PV array at t = 1.5 s is illustrated, respectively, in Figure 2a,b. As observed, both the scenarios exhibit a similar post-fault current profile. Thus, the development of an appropriate protection approach that has the ability to discriminate between the two scenarios reliably and trigger the different control action for the early restoration of power in the microgrid is sought.
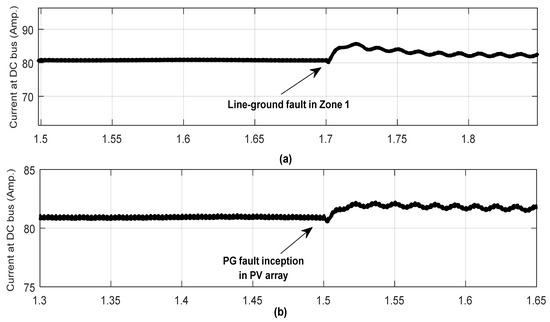
Figure 2.
Current signal recorded at DC bus due to (a) PG fault in zone 1 of DC network with fault resistance Rf = 5 Ω at t = 1.7 s followed by (b) inception of PG fault in the PV array at t = 1.5 s.
The proposed protection algorithm involves the following steps:
- (1)
- Extraction of features of instantaneous voltage-current signals recorded at the DC bus using Fourier–Bessel Series Expansion (FBSE) and Empirical Wavelet Transform (EWT).
- (2)
- Tuning of hyperparameters of bagging tree using Artificial Gorilla Troop Optimization.
- (3)
- Training of Optimal bagging tree (OBT) using derived features.
3.1. Feature Extraction Using Fourier–Bessel Series Expansion (FBSE) and Empirical Wavelet Transform (EWT)
These inherent merits of FBSE-EWT makes it particularly suitable for applications like fault detection in power systems, vibration analysis, biomedical signal processing, and other domains where precise time–frequency localization, low-frequency resolution, and robustness to noise are essential [22,23]. In this regard, the FBSE-EWT has been exploited to derive the useful attributes from the instantaneous DC voltage-current signals.
FBSE-EWT has been selected due to its ability to reveal fault-induced spectral variations in non-stationary signals like those found in PV-integrated microgrids. The converter switching events in PV arrays and the abrupt voltage drops in line faults lead to different frequency signatures, which are effectively captured through these hybrid transforms. EWT has the inherent ability to adapt to signal variations typical in PV converters, while FBSE helps in isolating radial and oscillatory fault components present in DC line paths.
The pseudo code illustrating the detailed discussion is presented below (Algorithm 1).
| Algorithm 1. Pseudo Code of the Fourier–Bessel Series Expansion (FBSE), Empirical Wavelet Transform (EWT)-based Feature Extraction |
| 1. Initialize: -Load or assign the input signal 2. Set parameters: -Set sampling frequency (fs) -Compute time vector (t) based on the signal length and fs 3. Fourier–Bessel Series Expansion (FBSE): —Set signal length (L) -Set number of expansion terms (n_max) -Define radial coordinate (r) scaled from 0 to 1 -Compute the first n_max zeros of the Bessel function using besselzero function 4. Compute FBSE coefficients: For n from 1 to n_max: -Compute the Bessel function for the nth mode -Compute FBSE coefficient by projecting the signal onto the Bessel function -Store FBSE coefficient 5. Reconstruct the signal: -Initialize reconstructed signal to zeros For n from 1 to n_max: -Add weighted Bessel function (by FBSE coefficient) to reconstructed signal 6. Simulate EWT (Empirical Wavelet Transform): -Define number of sub-bands and frequency ranges For each sub-band: -Design a bandpass filter for the given frequency range -Apply the bandpass filter to the reconstructed signal -Store filtered sub-band 7. Feature Extraction for each sub-band: -Initialize arrays for Shannon Entropy, Kurtosis, RMS, and Variance For each sub-band: -Compute Shannon Entropy: -Form probability distribution (p) using the squared sub-band signal -Compute Shannon Entropy using: −sum(p * log(p + epsilon)) -Compute Kurtosis using built-in kurtosis function -Compute RMS using: sqrt(mean(subband.^2)) -Compute Variance using: var(subband) 8. End |
The key statistical indices derived as features using the FBSE-EWT and extracted from multiple sub-bands of a signal are described below:
- Shannon Entropy of Sub-Bands
- Kurtosis of Sub-Bands
- Root Mean Square (RMS) of Sub-Bands
- Variance of Sub-Bands
Theoretical Basis for Fault Discrimination
In DC microgrids with integrated photovoltaic (PV) generation, distinguishing between faults occurring within the PV array and those in the distribution lines can be particularly challenging. This is primarily because both fault types may produce similar voltage sags and current distortions, especially under complex and dynamic operating conditions. However, a closer examination of their electrical behavior reveals key differences that form the foundation for reliable discrimination.
- (a)
- Distinct Fault Origins and Propagation
PV array faults typically originate within the generation side such as at the panel level or within internal connections and often interact with control elements like DC–DC converters. These interactions can influence how the fault propagates and how quickly protective mechanisms respond. In contrast, faults in the DC lines are more direct in nature, involving sudden impedance changes across cables or connectors that lead to rapid changes in system parameters.
As a result, PV array faults tend to produce transients that are more oscillatory or modulated due to converter dynamics, while line faults generally lead to sharper and more immediate changes in current and voltage, with a different fault signature.
- (b)
- Frequency Behavior and Signal Composition
One critical distinction lies in the frequency content of the transients. PV array faults, influenced by switching operations and control adjustments, usually introduce higher-frequency components. On the other hand, line faults are governed more by the physical line parameters such as inductance and resistance and, therefore, exhibit stronger low-frequency characteristics.
This difference becomes particularly useful when applying frequency-based signal analysis techniques. The use of Fourier–Bessel Series Expansion (FBSE) helps in capturing localized frequency variations, while Empirical Wavelet Transform (EWT) enables adaptive decomposition of the signal into meaningful sub-bands. These tools highlight the subtle variations in energy distribution and oscillatory behavior, which are otherwise difficult to identify in the time domain alone.
- (c)
- Relevance of Extracted Features
The statistical features extracted after signal processing, namely Shannon entropy, kurtosis, root mean square (RMS), and variance, were carefully selected to capture fault-specific behavior:
Entropy provides insight into the disorder or unpredictability of the signal, which tends to be higher in PV faults due to irregular converter dynamics.
Kurtosis helps identify the impulsiveness of a fault; line faults, being abrupt, usually result in sharper spikes and, thus, higher kurtosis.
RMS and variance measure the overall energy and fluctuation level of the signal, with line faults generally causing more prominent increases compared to PV faults.
Each of these features contributes to building a fault signature that reflects the underling physics of the event, making them suitable inputs for pattern-based classification methods.
- (d)
- Feature Selection Based on Fault Characteristics
Rather than relying on generic statistical measures, the features used in this work were chosen because they align with known behaviors of PV and line faults. This targeted selection ensures that the classification model is trained on inputs that truly reflect the root differences between the two types of faults, improving both accuracy and interpretability.
3.2. Bagging Tree-Based Ensemble Technique
In recent years, the decision tree has emerged as a prominent tool in various applications, especially dealing with classification problems. Its growing popularity can be largely attributed to its several key advantages, such as its straightforward execution and robust performance when handling multi-dimensional datasets [32]. Decision trees are favored for their ability to simplify complex decision-making processes into a hierarchical structure of yes/no questions, which makes them both interpretable and effective for a wide range of applications.
Despite these advantages, decision trees can encounter significant challenges when applied to complex datasets. A common issue is their tendency to underperform during testing phases, particularly when the data exhibits a bias towards certain classes. This limitation arises because a single decision tree might become overly specialized or skewed towards a particular class, leading to biased predictions.
To address this problem, the approach of using an ensemble of decision trees has been proposed. Rather than relying on a single tree, this method involves constructing multiple decision trees and combining their outputs to improve overall performance. The ensemble approach mitigates the risk of bias and enhances the accuracy of predictions by leveraging the diversity among different trees.
One of the most well-known ensemble methods is bootstrap aggregation, commonly referred to as bagging [32]. Bagging operates by dividing the entire dataset into multiple subsets through a process known as sampling with replacement. Essentially, it involves randomly selecting subsets of data, allowing some instances to appear multiple times while others might be left out. Each subset is used to train a separate decision tree, resulting in a collection of decision trees, each built from different portions of the data.
The process of aggregating the results from these individual trees is crucial to the bagging technique’s effectiveness. For classification tasks, the final prediction is determined by a majority voting mechanism, where each tree in the ensemble casts a vote for a particular class, and the class with the most votes is selected as the final output. In contrast, for regression tasks, the predictions from each tree are averaged to produce the final result. This method of combining predictions helps to balance out the biases and variances of individual trees, leading to a more robust and reliable model. Bagging enhances the performance of decision trees by pooling their predictions. The ensemble of trees not only provides better generalization to unseen data but also reduces the likelihood of overfitting, which is a common issue with single decision trees.
In summary, while decision trees are a valuable tool in data mining due to their simplicity and effectiveness, their performance can be limited by inherent biases when dealing with complex datasets. By utilizing ensemble methods like bagging, which involves training multiple trees on different subsets of data and aggregating their predictions, these limitations can be effectively addressed. This approach leads to improved accuracy and generalization, making it a powerful strategy for tackling various classification and regression tasks in data mining.
3.3. Tuning of Hyperparameters of Bagging Tree Using Artificial Gorilla Troop Optimisation (AGTO)
Abdollahzadeh et al. (2021) introduced a new optimization method, namely the artificial Gorilla Troop Optimization (AGTO) [33]. The social behavior of gorillas, including their migration, competitiveness, and the following of others, served as inspiration for it. The idea is to swap the places of gorillas with a silverback, and the same is accomplished in two stages: exploration and exploitation.
3.3.1. Exploration Stage
This section describes the exploration phase of GTO. Within the gorilla tribe, it is well known that a silverback gorilla oversees all decision-making. Gorillas will occasionally travel to unfamiliar or previously visited locations in search of food. At every step of this phase, the silverback gorilla is regarded as the best possible overall solution. In this phase, three mechanisms get activated and the same are introduced in this section.
Equation (1) expresses the three characteristics involved in the above-mentioned stage. Parameter m, which ranges from 0 to 1, is controlling the migration strategy of unspecified positions. The present gorilla will relocate to an unidentified location when rand < m. This makes the distribution of solutions more dispersed and thorough, enabling the GTO algorithm to accurately inspect the entire search space. On the other hand, two alternative methods will be selected if rand ≥ m. The gorilla will then head towards other gorillas if rand ≥ 0.5. This method enables the GTO algorithm to perform better and brings the present solution closer to alternative solutions. The gorillas move to the designated spot when rand < 0.5.
where denotes the gorilla’s immediate position and denotes the gorilla’s position vector at the following iteration. The problem dimension determines the position vector dimension in this instance. The numbers between 0 and 1 are generated randomly with a uniform distribution and are represented by the variables , , , and rand. The symbols and stand for the maximum and minimum values of the variables. The location vectors of the randomly chosen gorillas are denoted by and . The variables , , and in (1) are calculated in the following manner.
where is the maximum iterations to perform and is the current iterations that are being performed. The value of changes significantly early in the first stage and slightly later in the same stage. To create the effect of rapid convergence, this causes the initial stage to have more unpredictability to increase the exploration range and the end stage to have less randomness. is obtained as follows.
where is any random number uniformly distributed between the limits of 0 and 1. It ensures the randomness in the exploration stage.
The parameter is used to define the leadership of the silverback gorilla and is determined using following equation.
where is any random number in the range of −1 to 1.
Due of inexperience, silverback gorillas can make mistakes when organizing groups or locating food. As a result, under the direction of leaders, they might acquire dependable experience and exceptional steadiness. Equation (4) is utilized to model the leadership quality of the silverback gorilla. In the meantime, (5) can be used to derive in (1). Equation (6) can be utilised to determine in (5), where represents a random value within the range of and .
The objective function values of and are computed at the end of the exploration phase. The position of will override if the objective function value of is smaller than the fitness value of .
3.3.2. Exploitation Stage
Two behaviors are adopted during the exploitation stage: pursuing the silverback gorilla and engaging in competitive behavior with mature female gorillas. Within the gorilla group, the silverback’s competitive behavior with female gorillas and his leadership of the other gorillas are two distinct behaviors. In this case, the value of determines if the silverback gorilla is followed by an adult male gorilla or engages in inter-male competition. will be assigned the corresponding strategy when it satisfies various requirements. The parameter that must be set before to ensure optimization is .
Young gorillas, including silverbacks, are more equipped to carry out their tasks. Male gorillas also favor trailing silverback gorillas in this regard. Each gorilla also can affect other gorillas. In other words, the gorilla’s present individual position solution will take precedence over the silverback gorilla’s ideal solution. Each answer will have an impact on other solutions, and they will influence one another. In other words, the policy will be followed if . The above characteristic is modeled as follows.
where the optimal solution is denoted by and is determined as follows:
where the position of each candidate gorilla through the iteration is denoted by . Here, the problem’s dimension determines the position vector dimension, and stands for the total number of gorillas. is calculated as follows:
Competing with other male gorillas for the opposite sex is one of the key actions of adolescent gorillas. This type of competition is distinguished by its intensity, persistence, and capacity to sway other participants. Their rivalry serves as a symbol of their mutual impact on the solutions. The best course of action for the silverback gorilla is to approach the location of other solutions, so influencing the present one somewhat and supporting while, in the process, look for a better solution. The following equation models this behavior.
where is the coefficient vector used to measure the effectiveness of competition; is the parameter set before optimization operates; is used to denote the severity of violence on the solution dimension; is randomly distributed number between 0 and 1; and is the competition intensity of the simulated gorilla. will equal both the problem dimension and the random value from the normal distribution when ; otherwise, will equal the random number from the normal distribution.
The detailed steps of AGTO can be found in [33]. AGTO has been successfully validated on various optimization problems, demonstrating its effectiveness in finding near-optimal solutions for complex problems [24,25,26,27,28]. Therefore, it is used in this work for hyperparameter tuning of the bagging tree classifier.
3.3.3. Implementation of AGTO for Hyperparameter Tuning of Bagging Tree Classifier
For implementation of AGTO, firstly, three hyperparameters of the bagging tree classifier, i.e., number of decision trees, number of splits, and the leaf size, are randomly generated within their limits. The search space for the number of decision trees considered is [1, 100]. The number of splits is initialized in the range [1, 25]. The leaf size is initialized in the range [1, 10]. After initial generation of population, the AGTO algorithm works by considering the objective function defined in (4). After a fixed maximum number of iterations, the method stops and optimal hyperparameters are obtained. The basic steps involved in the implementation of AGTO for hyperparameter tuning of the classifier are shown in Figure 3.
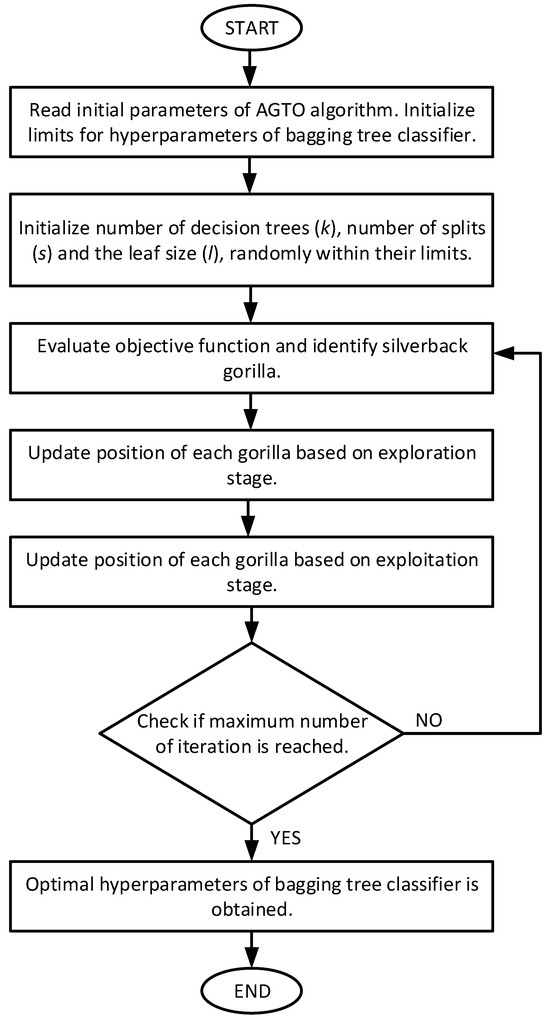
Figure 3.
Flowchart of implementation of AGTO for hyperparameter tuning of bagging tree classifier.
For experimentations, a population size of 30 and maximum iterations of 100 are considered. After 51 independent runs, the tuned hyperparameters of the bagging tree classifier are found to be:
- Number of decision trees—39
- Number of splits—18
- Leaf size—1
The convergence plot of the AGTO algorithm used for hyperparameter optimization of the bagging tree classifier is depicted in Figure 4. It is observed thorough the figure that the best fitness value is equal to zero. Figure 5 shows the out-of-bag classification error for the objective function with above optimal hyperparameters. From the figure, it can be observed that the error decreases with the increase in the number of grown trees, which is obvious. The above mentioned tuned hyperparameters of the bagging tree classifier are used henceforth throughout the study.
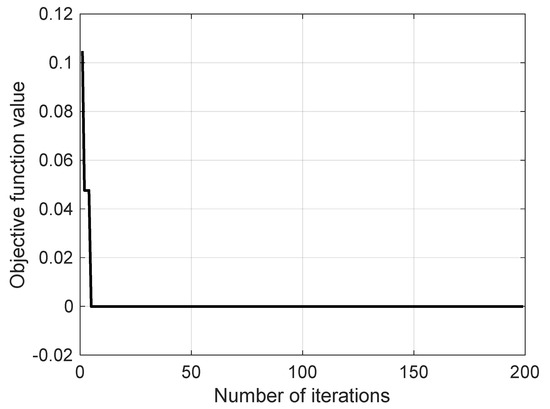
Figure 4.
Convergence characteristics of AGTO.
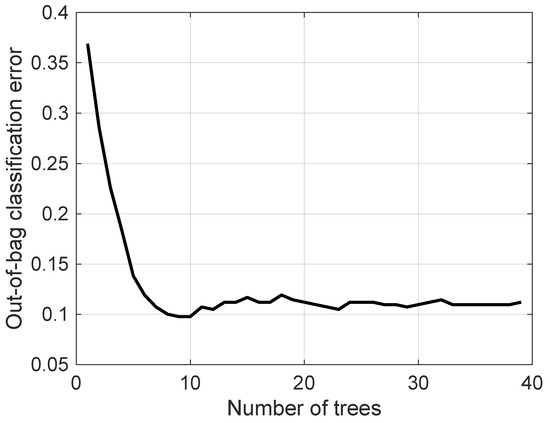
Figure 5.
Out-of-bag classification error with respect to number of grown trees.
3.4. Proposed Protection Framework
The development of the proposed protection technique, exploiting the inherent capabilities of the bagging tree-based protection technique, can be outlined as follows (Figure 6):
- (1)
- Simulation of DC microgrid: The DC microgrid test model for proposed fault analysis is simulated in the MATLAB/Simulink environment (Figure 1).
- (2)
- Generation of scenarios: The diverse fault scenarios including faults in PV array and DC line network are created using simulations on the test microgrid system. Current-voltage signals are extracted through simulation, considering wide variations in fault parameters such as fault location and fault resistance.
- (3)
- Extraction of useful features from the voltage-current signals: The key statistical indices such as Shannon entropy, kurtosis, RMS, and variance have been derived as features using the FBSE-EWT extracted from multiple sub-bands of a signal (as discussed in Section 3.1).
- (4)
- Hyperparameter tuning of bagging tree (BT) classifier: The hyperparameter tuning of the bagging tree has been performed using Artificial Gorilla Troop Optimization (as discussed in Section 3.3).
- (5)
- Estimation of optimized parameters of BT classifier: The optimized hyperparameters of the bagging-based ensemble classifier such as no. of trees (k), no. of splits (s), and leaf size (l) is obtained.
- (6)
- Prediction by bagging tree (BT)-based classification module: The final output corresponding to any unknown case regarding the fault category (DC line-side fault or source-side fault in PV array) and fault type (pole–pole or pole–ground) is predicted by the corresponding optimal BT module.
- (7)
- Fault detection and discrimination: Based on the predicted outcome of the optimal BT module, a relaying signal is generated and sent to the respective breaker, for taking appropriate action towards isolating the faulty part.

Figure 6.
Proposed protection framework.
The operation of the proposed bagging tree ensemble-based protection scheme is illustrated through a flowchart shown in Figure 6. The proposed algorithm utilizes the voltage and current signals recorded at the DC bus as input data. Several specialized modules of the bagging tree (BT-1, BT-2, and BT-3) have been developed within the system to handle various tasks relating to fault detection and classification of PV array faults and DC line faults.
The protection scheme has been evaluated for fault analysis under two conditions involving faults on the source side (in PV array) and on the line side (DC network). In each case, simulations have been carried out across different zones of the distribution line. These simulations varied widely in terms of fault parameters, including type of fault (pole–ground and pole–pole), fault resistance (0 to 50 Ω), and fault location (0–1 km). In addition, the dataset for photovoltaic (PV) array faults was created by simulating various fault scenarios. This included different types of line–ground faults and line–line faults, considering the distributed configuration of the PV modules.
4. Performance Evaluation
The performance of the proposed hybrid protection scheme has been examined in order to determine its effectiveness in executing the fault detection, discrimination, and categorization tasks. This evaluation involved a comprehensive set of simulations to test the system’s robustness and accuracy in real-time conditions.
To begin with, a diverse set of fault scenarios was simulated. These simulations include various types of faults, including those occurring in DC distribution lines and photovoltaic (PV) arrays. For DC distribution line faults, the simulation included a wide array of parameters such as fault resistance, fault, and fault location. Each parameter was varied systematically to generate a broad spectrum of fault scenarios. Similarly, the dataset for PV array faults was generated by simulating different fault types, including line–ground faults and line–line faults, involving multiple configurations of PV modules. These variations in fault scenarios and disturbance conditions, such as changes in loading conditions, were crucial for creating a robust testing dataset.
The proposed hybrid protection scheme underwent rigorous training with this extensive dataset. Post-training, the performance of the scheme was evaluated to determine how effectively it performed its intended tasks. This evaluation involved analyzing the scheme’s ability to detect faults and classify them accurately. A key aspect of the evaluation was comparing the performance of the proposed scheme with other techniques, such as support vector machine (SVM) and decision tree (DT).
Thus, the testing dataset includes 600 scenarios with 240 scenarios pertaining to each of the faults in the PV array and DC network and 120 no-fault scenarios that were derived under a wide range of parameter variations in order to assess the performance of the proposed scheme. The target labels for the fault types “PV array faults” and “DC line fault” are “1” and “2”, respectively, while “0” denotes the no-fault scenario for BT-1 module. The BT-2 and BT-3 modules are dedicated to further classify the faults (PP and PG) for the DC line faults and PV array faults, respectively.
4.1. Performance of Proposed Protection Scheme
The effectiveness of the proposed protection scheme has been evaluated in terms of accurately detecting and discriminating between the PV array faults and the DC line faults by BT-1 module and further categorization into pole–pole and pole–ground fault types using BT-2 and BT-3 modules. As the representative case, the post-fault current profile due to a pole–ground fault in the PV array has been demonstrated in Figure 7a, and the corresponding magnitude spectrum of five different sub-bands of current signal decomposed using FBSE-EWT is depicted in Figure 7b, along with the corresponding features derived from multiple sub-bands in Figure 7c. The significant variation in the derived spectrum and features seems to be capable of capturing the post-fault transient. In order to demonstrate the post-fault current and profile, a representative case involving pole–pole fault in the PV array is also illustrated in Figure 8 and Figure 9, respectively.
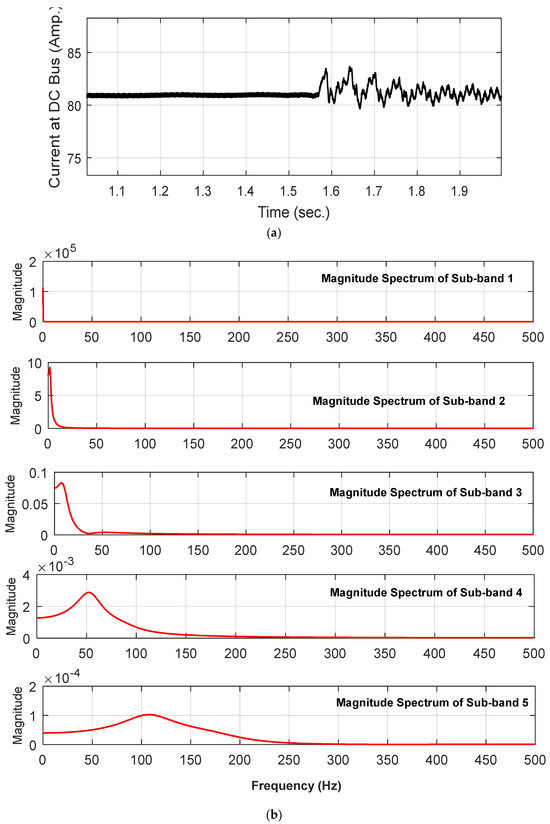
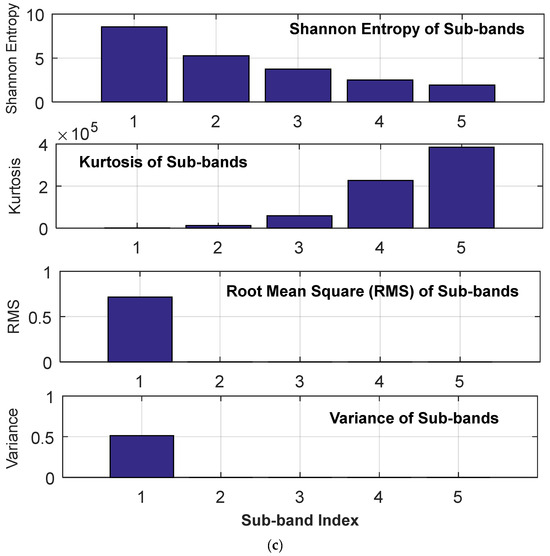
Figure 7.
(a) Instantaneous current signal recorded at DC bus during Pole–ground fault in PV array (b) Magnitude Spectrum of five different sub-bands of current signal decomposed using FBSE-EWT (c) features extracted from multiple sub-bands of a signal.
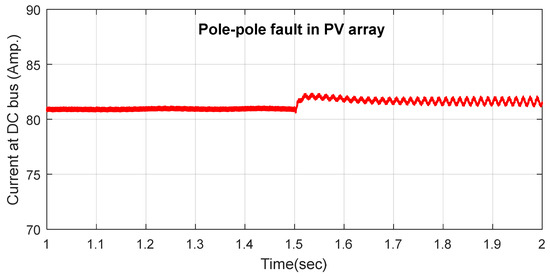
Figure 8.
Instantaneous Current signal recorded at DC Bus with pole–pole fault in PV array at t = 1.5 s.
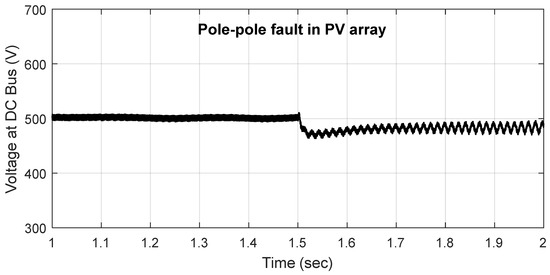
Figure 9.
Instantaneous voltage signal recorded at DC Bus with pole–pole fault in PV array at t = 1.5 s.
Further in order to demonstrate the post-fault variation in voltage signal due to pole–ground fault in PV array, the voltage waveforms have been demonstrated in Figure 10.
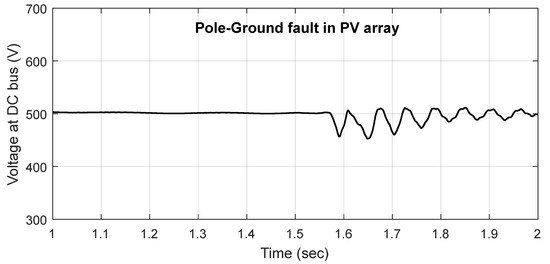
Figure 10.
Instantaneous voltage signal recorded at DC Bus with pole–ground fault in PV array at t = 1.5 s.
To depict the impact of two successive faults, one at the source side and other at the line side, a representative case has been simulated. The instantaneous voltage-current signals derived with inception of pole–pole fault in PV array at t = 1.5 s followed by PP fault in Zone 1 at t = 2.0 s is illustrated in Figure 11 and Figure 12, respectively. As observed, the impact of PV array fault is quite less significant than the pole–pole fault in DC line.
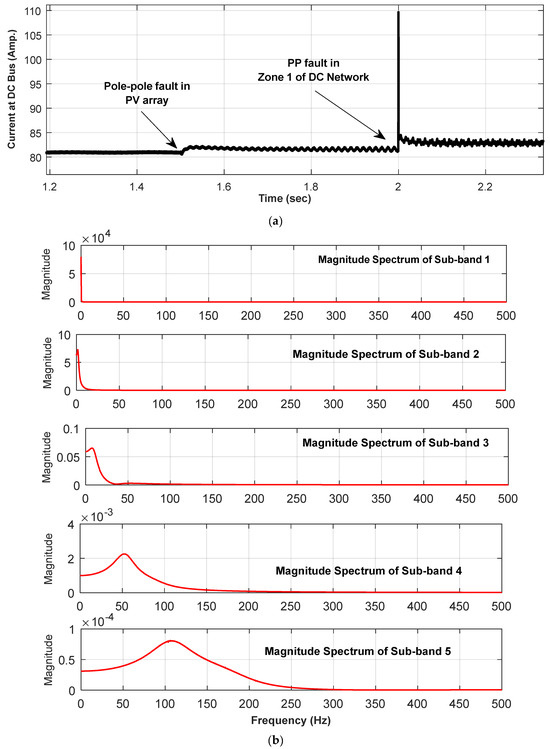
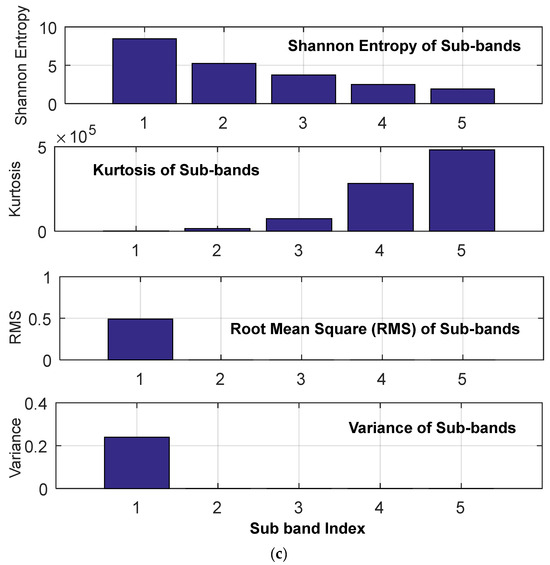
Figure 11.
(a) Instantaneous current signal with inception of pole–pole fault in PV array at t = 1.5 s followed by PP fault in Zone 1 at t = 2.0 s. (b) Magnitude Spectrum of five different sub-bands of current signal decomposed using FBSE-EWT (c) features extracted from multiple sub-bands of a signal.
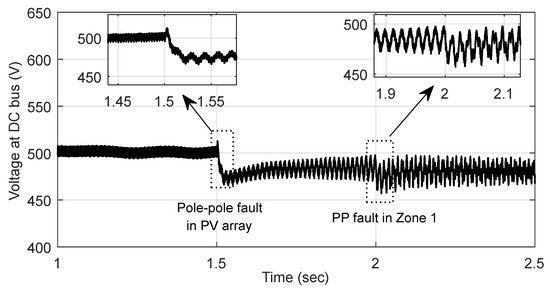
Figure 12.
Instantaneous voltage signal with inception of pole–pole fault in PV array at t = 1.5 s followed by PP fault in Zone 1 at t = 2.0 s.
As the representative case, the corresponding magnitude spectrum of five different sub-bands of current signal (Figure 11a) derived using FBSE-EWT is depicted in Figure 11b along with the corresponding features derived from multiple sub-bands in Figure 11c. As observed, the significant variation in the derived spectrum and features seems to be capable of capturing the post-fault transient.
In order to demonstrate the impact of variation in PV irradiance level on the fault profile, a scenario has been simulated illustrating the inception of a ground fault in the PV array followed by a considerable rise in the PV irradiance level from 600 W/m2 to 900 W/m2. The corresponding instantaneous current-voltage signals with the inception of a ground fault in the PV array at t = 1.7 s followed by a rise in the irradiance level at t = 2.0 s is illustrated in Figure 13 and Figure 14, respectively. As observed, the variation in the irradiance level, though less, still significantly impacts the magnitude of the fault current.
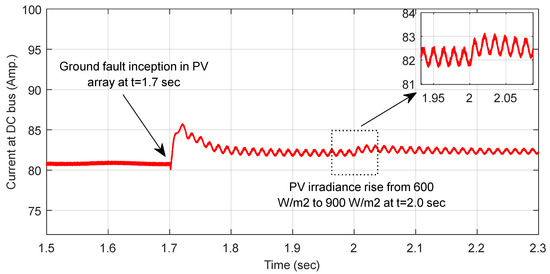
Figure 13.
Instantaneous current signal with inception of ground fault in PV array at t = 1.7 s followed by rise in irradiance level from 600 W/m2 to 900 W/m2 at t = 2.0 s.
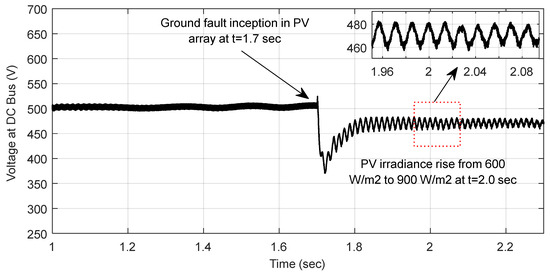
Figure 14.
Instantaneous voltage signal with inception of ground fault in PV array at t = 1.7 s followed by rise in irradiance level from 600 W/m2 to 900 W/m2 at t = 2.0 s.
The effectiveness of the proposed bagging tree classification module is illustrated in the confusion matrix shown in Figure 15, in which the overall accuracy of 99.50% achieved by the proposed scheme validates its capability to impart the intended protection to the DC microgrid, regardless of varying operational conditions related to weather intermittency in the PV source. In the confusion matrix, the darker blue color across the diagonal represents more correct predictions (diagonal), lighter blue color indicates the lower count and the light orange color indicates misclassifications.
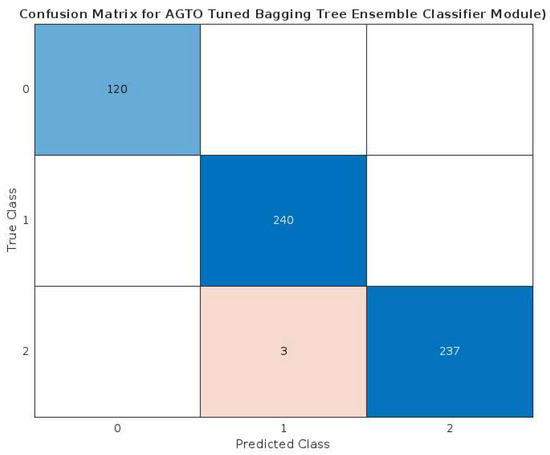
Figure 15.
Confusion matrix illustrating the performance of proposed scheme.
To further examine the effectiveness of the proposed protection module as a fault detector and classifier, an assessment was carried out to evaluate its classification performance. This evaluation involved generating and analyzing a Receiver Operating Characteristic (ROC) curve, as illustrated in Figure 16. The ROC curve visually represents the efficacy of a classification model, showing a trade-off between sensitivity and specificity as the decision threshold varies. The area under the curve (AUC), being almost close to 1 (Figure 16), clearly ascertains the suitability of the proposed protection algorithm scheme in imparting suitable protection to the DC microgrid.
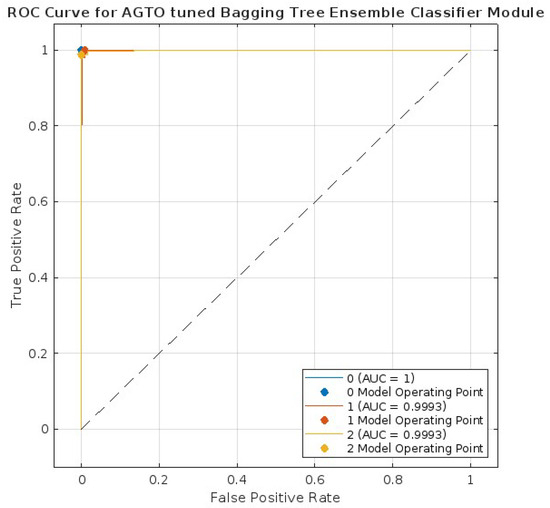
Figure 16.
ROC curve obtained for the proposed algorithm.
The performance of the proposed protection algorithm has been evaluated for different faults in terms of the reliability indices’ dependability and security, as shown in Table 1. The results indicate that the algorithm completes the protection task reliably. Additionally, a comparative analysis with decision tree (DT) and support vector machine (SVM) classifiers is presented in Table 2. The proposed scheme demonstrates higher testing accuracy, clearly outperforming both the SVM and DT classifiers.

Table 1.
Classification accuracy of proposed Bagging tree-based Fault Detector and Classifier Module.
Table 2.
Comparative analysis of the proposed Bagging tree-based protection scheme for DC microgrid with Decision Tree and Support Vector Machine-based schemes in terms of reliability indices.
4.2. Performance of Proposed Bagging Tree-Based Fault Classifier Modules
In this subsection, the performance of the proposed bagging tree-based protection scheme has been evaluated in terms of accurately identifying the fault types among pole–pole and pole–ground faults of source and line side. As described earlier, the accurate identification and categorization of faults helps in the early restoration of the supply. So, in order to ensure reliable protection, once the information regarding the fault zone (source or line) is known, it is quite necessary to identify the fault types accurately.
The performance of the proposed bagging tree-based classification modules has been extensively validated against the wide number of scenarios under both kinds of faults, i.e., PV array faults and DC line faults, there having been 120 cases each for the PP and PG fault types. The fault-wise obtained accuracies are summarized in Table 3. The higher overall accuracies of 98.75% and 100%, respectively, achieved by classification modules BT-2 and BT-3, clearly ascertain the efficacy of the developed approach in ensuring the early restoration of supply by the identification of faulty type correctly.
Table 3.
Performance of Proposed Bagging Tree modules (BT-2 and BT-3).
In order to analyze the performance of the proposed technique under varying noise conditions, the simulation analysis under varying noise conditions has been carried out and the performance has been analyzed with Gaussian noise added to the voltage and current signals with signal-to-noise ratios (SNRs) ranging from 20 dB to 40 dB. The classification accuracy under the above scenarios has been obtained as 94% even at 20 dB, demonstrating the robustness of the FBSE-EWT feature extraction and the resilience of the AGTO-optimized ensemble classifier.
4.3. Comparative Assessment of Proposed Technique with Other Techniques
To validate the real-time applicability of the proposed FBSE-EWT and AGTO-based protection technique, a comparative evaluation of the end-to-end processing delay has been conducted. The total relay operation time includes the time elapsing in signal decomposition, feature extraction, and classification. Table 4 presents the comparison of the proposed scheme with several benchmark methods commonly used for fault detection in DC microgrids. The results clearly demonstrate that the proposed method offers superior computational efficiency, making it highly suitable for applicability in real-time protection systems.
Table 4.
Performance Comparison of protection techniques in terms of relay operation time.
5. Conclusions
The advancements in DER technology and the demand for reliable power at the consumer end have propelled the adoption of PV-integrated microgrids. Despite the numerous advantages of DC microgrids, the development of reliable protection schemes is quite difficult due to the similar profiles of the PV array faults and line faults in the DC network. In this regard, in order to enhance the reliability of the protection scheme, the proposed work adopts a bagging tree ensemble classifier-based technique, which is able to effectively distinguish between the two scenarios involving source-side (PV array faults) and line-side (DC network) faults and which can further classify the fault types in each category. Utilizing the derived features of voltage and current signals using the hybrid FBSE-EWT, and performing the classification task using the AGTO tuned bagging tree-based ensemble classifier, the proposed approach has been found to outperform the decision tree and SVM techniques, demonstrating reliability in terms of discriminating between the PV array faults and DC line faults and showing resilience against fluctuations in PV irradiance levels. Extensive validation across various fault scenarios, considering significant variations in fault parameters, weather conditions, and load variations, confirms the reliability and effectiveness of this approach, making it a promising solution for the protection of PV integrated DC microgrids.
Author Contributions
L.S. and A.R. conceived of the presented idea. L.S. developed the theory and performed the computations. A.R. and M.K. verified the analytical methods. M.K. encouraged L.S. to investigate application of machine learning and supervised the findings of this work. All authors have read and agreed to the published version of the manuscript.
Funding
This research received no external funding.
Data Availability Statement
The original contributions presented in the study are included in the article, further inquiries can be directed to the corresponding author.
Conflicts of Interest
The authors declare no conflicts of interest.
References
- Parhizi, S.; Lotfi, H.; Khodaei, A.; Bahramirad, A.S. State of the art in research on microgrids: A review. IEEE Access 2015, 3, 890–925. [Google Scholar] [CrossRef]
- Saldarriaga-Zuluaga, S.D.; Lopez-Lezama, J.M.; Muñoz-Galeano, N. Protection coordination in microgrids: Current weaknesses, available solutions and future challenges. IEEE Lat. Am. Trans. 2020, 18, 1715–1723. [Google Scholar] [CrossRef]
- Dhar, S.; Patnaik, R.K.; Dash, P.K. Fault Detection and Location of Photovoltaic Based DC Microgrid Using Differential Protection Strategy. IEEE Trans. Smart Grid 2018, 9, 4303–4312. [Google Scholar] [CrossRef]
- Lupangu, C.; Bansal, R.C. A review of technical issues on the development of solar photovoltaic systems. Renew. Sustain. Energy Rev. 2017, 73, 950–965. [Google Scholar] [CrossRef]
- Saleh, S.A.; Aljankawey, A.S.; Alsayid, B.; Abu-Khaizaran, M.S. Influences of power electronic converters on current-voltage behaviors during faults in DGUs—Part II: Photovoltaic systems. IEEE Trans. Ind. Appl. 2015, 51, 2832–2845. [Google Scholar] [CrossRef]
- Koley, E.; Shukla, S.K.; Ghosh, S.; Mohanta, D.K. Protection scheme for power transmission lines based on SVM and ANN considering the presence of non-linear loads. IET Gener. Transm. Distrib. 2017, 11, 2333–2341. [Google Scholar] [CrossRef]
- Hare, J.; Shi, X.; Gupta, S.; Bazzi, A. Fault diagnostics in smart micro-grids: A survey. Renew. Sustain. Energy Rev. 2016, 60, 1114–1124. [Google Scholar] [CrossRef]
- Bacha, S.; Picault, D.; Burger, B.; Etxeberria-Otadui, I.; Martins, J. Photovoltaics in microgrids: An overview of grid integration and energy management aspects. IEEE Ind. Electron. Mag. 2015, 9, 33–46. [Google Scholar] [CrossRef]
- Ullah, S.; Haidar, A.M.A.; Zen, H. Assessment of technical and financial benefits of AC and DC microgrids based on solar photovoltaic. Electr. Eng. 2020, 102, 1297–1310. [Google Scholar] [CrossRef]
- Jalli, R.K.; Mishra, S.P.; Dash, P.K.; Naik, J. Fault analysis of photovoltaic based DC microgrid using deep learning randomized neural network. Appl. Soft Comput. 2022, 126, 109314. [Google Scholar] [CrossRef]
- Hooshyar, A.; Iravani, R. A new directional element for microgrid protection. IEEE Trans. Smart Grid 2017, 9, 6862–6876. [Google Scholar] [CrossRef]
- Saber, A.; Zeineldin, H.H.; EL-Fouly, T.H.M.; Al-Durra, A. A signed correlation index-based differential protection scheme for inverter-based islanded microgrids. Int. J. Electr. Power Energy Syst. 2023, 145, 108721. [Google Scholar] [CrossRef]
- Manditereza, P.T.; Bansal, R.C. Protection of microgrids using voltage-based power differential and sensitivity analysis. Int. J. Electr. Power Energy Syst. 2020, 118, 105756. [Google Scholar] [CrossRef]
- Jia, K.; Li, Y.; Fang, Y.; Zheng, L.; Bi, T.; Yang, Q. Transient current similarity based protection for wind farm transmission lines. Appl. Energy 2018, 225, 42–51. [Google Scholar] [CrossRef]
- Azizi, S.; Sanaye-Pasand, M.; Abedini, M.; Hasani, A. A Traveling-Wave-Based Methodology for Wide-Area Fault Location in Multiterminal DC Systems. IEEE Trans. Power Deliv. 2014, 29, 2552–2560. [Google Scholar] [CrossRef]
- Meghwani, A.; Srivastava, S.C.; Chakrabarti, S. A New Protection Scheme for DC Microgrid using Line Current Derivative. In Proceedings of the 2015 IEEE Power & Energy Society General Meeting, Denver, CO, USA, 26–30 July 2015; pp. 1–5. [Google Scholar]
- Naik, J.; Dhar, S.; Dash, P.K. Effective fault diagnosis and distance calculation for photovoltaic-based DC microgrid using adaptive EWT and kernel random vector functional link network. IET Gener. Transm. Distrib. 2019, 14, 690–703. [Google Scholar] [CrossRef]
- Beheshtaein, S.; Cuzner, R.M.; Forouzesh, M.; Savaghebi, M.; Guerrero, J.M. DC microgrid protection a comprehensive review. IEEE J. Emer. Sel. Top. Power Electr. 2019. early access. [Google Scholar] [CrossRef]
- Manohar, M.; Koley, E.; Ghosh, S. Stochastic weather modeling based protection scheme for hybrid PV-wind system with immunity against solar irradiance and wind speed. IEEE Syst. J. 2020, 14, 3430–3439. [Google Scholar] [CrossRef]
- Kar, S.; Samantaray, S.R.; Zadeh, M.D. Data-mining model based intelligent differential microgrid protection scheme. IEEE Syst. J. 2017, 11, 1161–1169. [Google Scholar] [CrossRef]
- Manohar, M.; Koley, E.; Ghosh, S. Microgrid protection under wind speed intermittency using extreme learning machine. Comput. Electr. Eng. 2018, 72, 369–382. [Google Scholar] [CrossRef]
- Bhattacharyya, A.; Singh, L.; Pachori, R.B. Fourier–Bessel series expansion based empirical wavelet transform for analysis of non-stationary signals. Digit. Signal Process. 2018, 78, 185–196. [Google Scholar] [CrossRef]
- Prabhu, M.S.; Biswas, S.; Nayak, P.K.; Abdelaziz, A.; El-Shahat, A. An intelligent protection scheme for series-compensated transmission lines connecting large-scale wind farms. Front. Energy Res. 2023, 11, 1141235. [Google Scholar] [CrossRef]
- Moradi, E.; Yaghoubi, B.; Shabanlou, S. A new technique for flood routing by nonlinear Muskingum model and artificial gorilla troops algorithm. Appl. Water Sci. 2023, 13, 49. [Google Scholar] [CrossRef]
- Ghith, E.S.; Tolba, F.A.A. Tuning PID controllers based on hybrid arithmetic optimization algorithm and artificial gorilla troop optimization for micro-robotics systems. IEEE Access 2023, 11, 27138–27154. [Google Scholar] [CrossRef]
- Gude, M.K.; Salma, U. Artificial gorilla troops optimizer for tuning power system stabilizer control parameters. In Proceedings of the 2021 IEEE 2nd International Conference on Electrical Power and Energy Systems (ICEPES), Bhopal, India, 10–11 December 2021; pp. 1–5. [Google Scholar]
- Abdelaal, A.K.; Alhamahmy, A.I.; Attia, H.E.D.; El-Fergany, A.A. Maximizing solar radiations of PV panels using artificial gorilla troops reinforced by experimental investigations. Sci. Rep. 2024, 14, 3562. [Google Scholar] [CrossRef]
- Ye, C.; Shao, P.; Zhang, S.; Wang, W. Three-dimensional unmanned aerial vehicle path planning utilizing artificial gorilla troops optimizer incorporating combined mutation and quadratic interpolation operators. ISA Trans. 2024, 149, 196–216. [Google Scholar] [CrossRef]
- Sarwagya, K.; De, S.; Nayak, P.K. High-impedance fault detection in electrical power distribution systems using moving sum approach. IET Sci. Meas. Technol. 2017, 12, 1–8. [Google Scholar] [CrossRef]
- Samantaray, S.R. A data-mining model for protection of facts-based transmission line. IEEE Trans. Power Deliv. 2013, 28, 612–618. [Google Scholar] [CrossRef]
- Paul, A.; Mukherjee, D.P.; Das, P.; Gangopadhyay, A.; Chintha, A.R.; Kundu, S. Improved random forest for classification. IEEE Trans. Image Process. 2018, 27, 4012–4024. [Google Scholar] [CrossRef] [PubMed]
- Breiman, L. Random forests. Mach. Learn. 2001, 45, 5–32. [Google Scholar] [CrossRef]
- Abdollahzadeh, B.; Soleimanian Gharehchopogh, F.; Mirjalili, S. Artificial gorilla troops optimizer: A new nature-inspired metaheuristic algorithm for global optimization problems. Int. J. Intell. Syst. 2021, 36, 5887–5958. [Google Scholar] [CrossRef]
Disclaimer/Publisher’s Note: The statements, opinions and data contained in all publications are solely those of the individual author(s) and contributor(s) and not of MDPI and/or the editor(s). MDPI and/or the editor(s) disclaim responsibility for any injury to people or property resulting from any ideas, methods, instructions or products referred to in the content. |
© 2025 by the authors. Licensee MDPI, Basel, Switzerland. This article is an open access article distributed under the terms and conditions of the Creative Commons Attribution (CC BY) license (https://creativecommons.org/licenses/by/4.0/).