Article

The Study of Phase Behavior of Multi-Component Alkane–Flue Gas Systems Under High-Temperature Conditions Based on Molecular Dynamics Simulations

1
Research Institute of Petroleum Exploration and Development, PetroChina, Beijing 100083, China
2
State Key Laboratory of Enhanced Oil & Gas Recovery, PetroChina, Beijing 100083, China
3
Tarim Oilfield Company, Taxinan Exploration and Development Company, PetroChina, Korla 841000, China
*
Author to whom correspondence should be addressed.
Energies 2025, 18(15), 4169; https://doi.org/10.3390/en18154169
Submission received: 4 July 2025 / Revised: 31 July 2025 / Accepted: 4 August 2025 / Published: 6 August 2025

Abstract

Injecting industrial high-temperature flue gas into hydrocarbon reservoirs has emerged as a novel approach for carbon sequestration. However, the complex high-temperature phase behavior between flue gas (CO2, N2) and reservoir fluids challenges this technology’s development, as traditional experimental methods and theoretical models often fall short in capturing it accurately. To address this, molecular dynamics simulations were employed in this study to investigate the phase behavior of single-component alkanes, multicomponent alkane mixtures, and multicomponent alkane–flue gas systems under high-temperature conditions. The results reveal that CO2 can become miscible with alkanes, while N2 diffuses into the system, causing volumetric expansion and a reduction in density. The initially distinct phase interface between the multicomponent alkanes and the flue gas becomes progressively blurred and eventually disappears, indicating the formation of a fully miscible phase. Comparative simulations revealed that the diffusion coefficients of N2 and CO2 increased by up to 20% with rising temperature and pressure, while variations in flue gas composition had negligible effects, indicating that high-temperature and high-pressure conditions significantly enhance flue gas–alkane miscibility.

1. Introduction

In the practice of advancing carbon capture, utilization, and storage (CCUS) technologies, injecting industrially emitted high-temperature flue gas into oil and gas reservoir formations has become a new method for carbon sequestration [1,2,3,4,5]. The injection of high-temperature flue gas reduces the viscosity of crude oil and enhances its mobility through thermal effects [6,7,8,9,10,11]. At the same time, the CO2 in the flue gas displaces the crude oil in a miscible manner, effectively expanding the swept volume. This method not only achieves carbon sequestration but also significantly improves oil recovery rates. However, in high-temperature reservoir environments, the phase behavior between flue gas (CO2, N2) and reservoir fluids is complex and difficult to predict [12,13,14,15]. Traditional laboratory simulations are limited by temperature constraints and cannot provide visual studies, while equation-of-state-based computational methods struggle to accurately represent this complex dynamic process. To address these issues, this paper uses molecular dynamics simulation methods to investigate the phase behavior of multi-component alkane–flue gas systems in the pores of high-temperature environments from a molecular perspective [16,17,18,19,20].
Previous researchers have conducted extensive molecular dynamics simulation studies on the phase behavior of hydrocarbons. In 1990, Anselme et al. [21] compared molecular simulation results of alkane phase behavior with experimental measurements and found remarkable agreement without any adjustments to simulation parameters. Similarly, Martin and Siepmann [22] validated that configurational-bias Monte Carlo methods could accurately compute phase equilibria in multicomponent hydrocarbon systems. Furthermore, Errington et al. [23] applied Monte Carlo simulations to estimate phase equilibria and mutual solubility in light hydrocarbon-water systems. Boulougouris et al. [24] expanded their investigation to intermediate hydrocarbon-water systems and optimized potential energy models and modeling methods. In 2005, Zhang et al. [25] adopted optimized potential models to study more complex ternary mixtures consisting of n-alkanes, perfluoroalkanes, and CO2. Nikolaidis et al. [26] adjusted binary interaction parameters in equations of state through Monte Carlo methods to precisely calculate phase equilibria in multicomponent gas-condensate systems.
In molecular dynamics simulations, selecting appropriate molecular models, force field parameters, mixing rules, and statistical methods can lead to accurate predictions of two-phase physical properties. For example, Moultos et al. [27] calculated CO2 diffusion coefficients in various hydrocarbons using molecular dynamics, demonstrating that CO2 diffusion behavior at 65 MPa deviated significantly from the classical Stokes-Einstein diffusion predictions. Neyt et al. [28] employed Monte Carlo simulations to predict interfacial tensions for CO2-n-butane and CO2-n-decane systems, achieving results consistent with experiments. Müller and Mejia [29] used molecular dynamics simulations and the Statistical Associated Fluid Theory equation of state to predict various parameters for CO2-n-decane systems. Their findings indicated discrepancies in predicted phase compositions, densities, and interfacial tensions compared to experimental data, particularly near miscibility pressures. Zabala et al. [30] calculated diffusion coefficients of n-decane after CO2 injection via molecular dynamics, reporting about a 26% deviation from experimental results, which was considered acceptable due to the dynamic nature of diffusion coefficients. Wang [31] revised the Lorentz-Berthelot mixing rules between CO2 and alkanes, refining interactions between force fields and yielding interfacial properties (e.g., interfacial tension, solubility, swelling factors) closer to experimental observations.
Moreover, molecular simulations enable detailed exploration of microscopic interactions between CO2 and hydrocarbon components, providing insights into enhanced oil recovery mechanisms by CO2 flooding. For instance, hydrocarbon swelling induced by dissolved CO2 is recognized as one of the primary mechanisms enhancing oil recovery [32,33,34,35,36,37]. Studies indicate a linear correlation between swelling factors and CO2 solubility in hydrocarbons, with more significant swelling observed in lighter straight-chain alkanes. Additionally, previous research observed that increases in the density of CO2-oil mixtures generally correlate with increased CO2 concentrations, a phenomenon previously attributed by some researchers to Coulombic interactions [38,39,40,41,42,43]. However, Mehana et al. [44] suggested through molecular simulations that molecular size of gas species, rather than Coulombic interactions or alkane stretching effects, predominantly controls density behaviors of mixtures. Fang [45] employed molecular simulation to develop swelling models for N2, CO2/dodecane, and oil displacement models using flue gas in nanopores. Parameters such as radial distribution functions, interaction energies, and density distributions were analyzed, clarifying the microscopic mechanisms underlying oil displacement by flue gas injection.
From the above literature, it can be inferred that molecular dynamics simulations effectively replicate extreme conditions of high temperatures and pressures unattainable by conventional experimental apparatus, providing precise microscopic descriptions of fluid phase behaviors within nanopores. Nevertheless, current research addressing the phase behavior of multicomponent alkane–flue gas systems in pores under high-temperature, high-pressure conditions remains relatively scarce. To address this gap, the present study employs molecular dynamics simulations, constructing models to systematically investigate the impacts of temperature, pressure, and gas compositions on the phase behavior of alkane–flue gas systems, as well as their effects on oil–gas interfacial properties.

2. Methods

2.1. Phase Behavior Analysis Model

This section investigates the phase behavior of a multicomponent alkane–flue gas system comprising mixed alkanes and flue gas (CO2 and N2), focusing specifically on the influence of temperature, pressure, and N2-to-CO2 ratios. Molecular dynamics simulations were performed using the open-source software LAMMPS (29 August 2024). A periodic simulation box measuring 68 nm × 42 nm × 23 nm was established. Alkanes were selected based on the component splitting of actual condensate gas reservoir K compositions, substituting similar alkane molecules. The selected alkane components were CH4, C4H10, C6H14, C8H18, and C20H42, with mole fractions of 0.50, 0.15, 0.13, 0.12, and 0.10, respectively. The molar ratio of alkane to flue gas was set to 3:2. In the basial model, the proportions of N2 and CO2 within the flue gas were 85% and 15%, respectively. To further investigate the effect of N2-to-CO2 ratio variations on the phase behavior, additional comparative models were simulated with N2-to-CO2 molar ratios of 16:7, 1:1, and 7:16. Table 1 summarizes the specific mole fractions of alkanes and gases employed in these simulation scenarios. The alkane and gas molecules were randomly distributed within the simulation box, followed by energy minimization to achieve stable configurations. And the space configuration of each alkane molecule is shown in Figure 1. Based on the experimental conditions of the slim-tube test involving flue gas and multi-component alkanes [46], the same temperature and pressure conditions were adopted in our molecular dynamics model. The molecular simulation results show that the minimum miscibility pressures (MMP) at 200 °C and 260 °C are 14 MPa and 10.00 MPa, respectively. The errors between these simulated values and the slim-tube experimental results are 9.6% and 10%, respectively. Therefore, we consider the parameter settings of the molecular dynamics model to be reliable.
Simulations were performed separately for single-component alkanes and multicomponent alkane mixtures. To examine the impact of temperature variations on phase behavior, five temperature points were considered: 353 K, 398 K, 443 K, 488 K, and 533 K. Additionally, seven pressure points—1 MPa, 3 MPa, 5 MPa, 10 MPa, 15 MPa, 20 MPa, and 30 MPa—were investigated at each temperature level to evaluate pressure effects on the system’s phase behavior. The OPLS-AA force field [47,48,49] was used for alkane molecules, while the TraPPE-small force field [50,51,52,53,54] was adopted for N2 and CO2 molecules. The simulation workflow involved first achieving equilibrium configurations using Monte Carlo simulations, followed by molecular dynamics simulations. Each system was equilibrated for 1 ns under isothermal-isobaric (NPT) ensemble conditions, with a time step of 1 fs. Subsequently, the systems were simulated for an additional 2 ns under canonical (NVT) ensemble conditions, utilizing the Nose-Hoover thermostat to control temperature. Electrostatic interactions were computed using the Ewald summation method, and van der Waals interactions were calculated using an atom-based approach. Finally, densities of each alkane component were statistically analyzed from the simulation results.

2.2. Interface Parametric Model

This section employs the open-source molecular simulation software LAMMPS to investigate how different temperatures, pressures, and CO2-to-N2 ratios influence interfacial parameters, such as density and gas diffusion coefficients, within a multicomponent alkane–flue gas system. In the initial configuration, the model consists of multicomponent alkane molecules (representing condensate oil) positioned in the middle, flanked by CO2 and N2 molecules on both sides. The number of alkane molecules remains fixed across all simulations, determined by their respective mole fractions in actual condensate oil. The system pressure is adjusted by varying the numbers of CO2 and N2 molecules introduced. All simulations are performed under the NVT with periodic boundary conditions. Upon equilibrium, the pressure of the entire system is computed.
Temperature in the simulations is regulated using the Nose-Hoover thermostat. A cutoff radius of 10σ is employed, where σ denotes the parameter in the Lennard-Jones potential. The simulation box dimensions are set at 6 × 6 × 20 nm3, with a cross-sectional length of 20 nm. The initial configuration of the system is illustrated in Figure 2. To ensure equilibrium, each simulation is first run for 20 ns, followed by an additional 10 ns dedicated to statistical analysis of the results.

3. Results and Discussion

3.1. Phase Behavior Analysis of Single-Component Alkane System

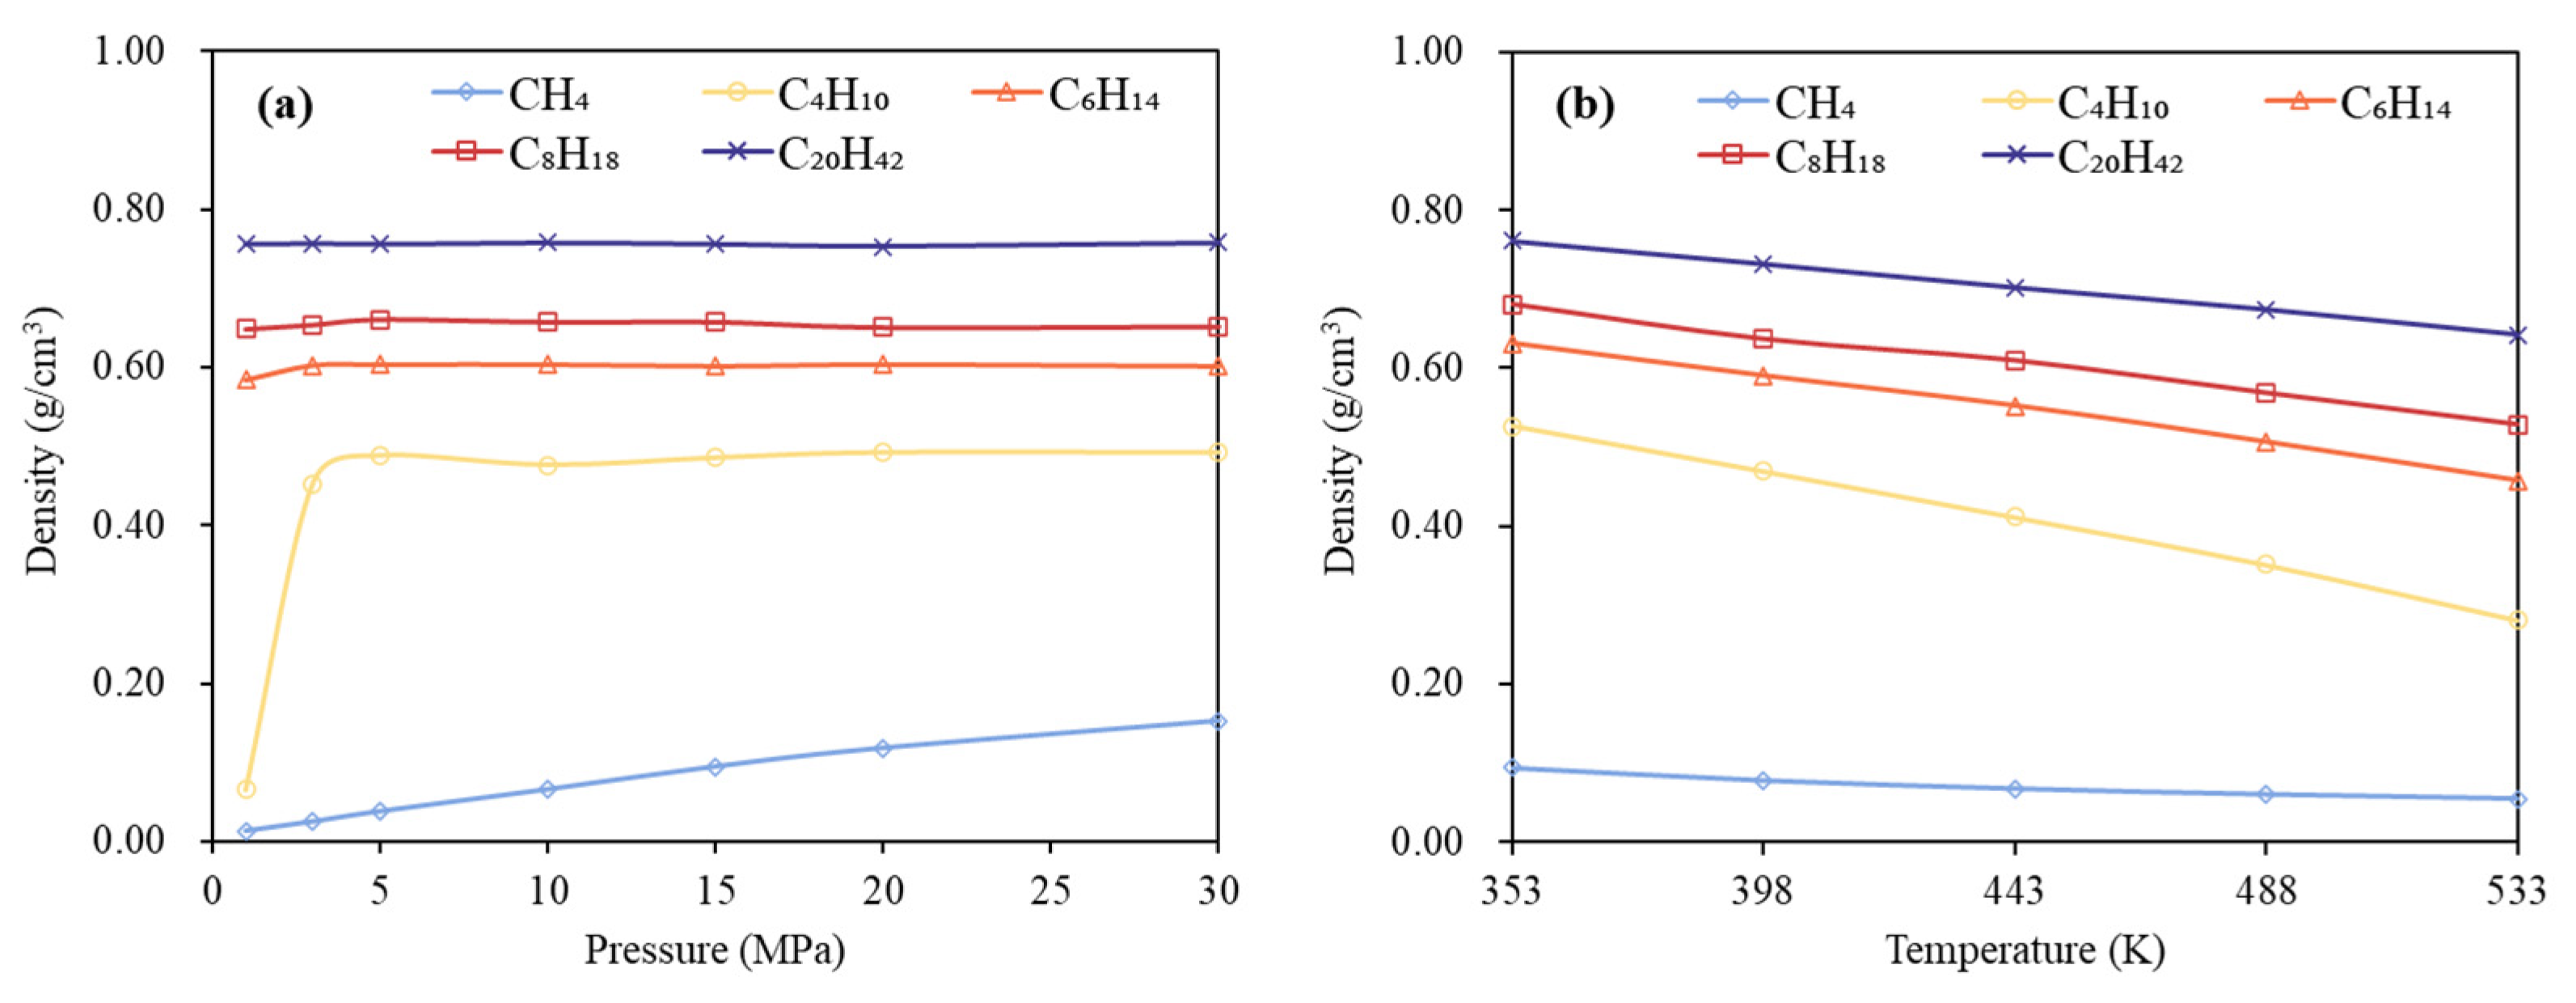
The phase behavior of single-component alkane is influenced by a combination of factors, including pore pressure, temperature, pore size, and pore composition. Among these, temperature and pressure significantly affect the phase behavior of alkane molecules by directly altering bubble point or dew point pressures. Therefore, this section explores the impact of temperature variations at a constant pressure of 15 MPa and pressure variations at a constant temperature of 353 K on the densities of single-component alkanes, aiming to elucidate how changes in pressure and temperature influence their phase behavior.
Simulation results indicate that the densities of various single-component alkanes vary with temperature, as illustrated in Figure 3. As temperature increases, the densities of all alkane molecules show a gradual decreasing trend, with the rate of decrease intensifying at higher temperatures. The rate of density reduction does not significantly slow down within the studied temperature range, suggesting that no obvious phase transition points are reached. Alkanes with lower carbon numbers, characterized by weaker intermolecular interactions, exhibit greater sensitivity to temperature variations, leading to more rapid density decreases. Conversely, alkanes with higher carbon numbers, due to their longer molecular chains and stronger intermolecular forces, experience limited thermal expansion effects, resulting in relatively gradual density changes.
Additionally, it was observed that CH4 density increases steadily with increasing pressure, showing no distinct phase transition points. In contrast, C4H10 density exhibits a significant and sudden increase once the pressure surpasses 1 MPa, stabilizing at pressures above 3 MPa. This indicates an approximate phase transition pressure around 3 MPa, with a corresponding liquid density of approximately 0.450 g/cm3. For C6H14, C8H18, and C20H42, their densities remain relatively constant once the pressure exceeds 1 MPa, suggesting that their phase transition points are below 1 MPa. Above this pressure threshold, these alkanes exist in the liquid phase, with liquid densities of approximately 0.600 g/cm3, 0.650 g/cm3, and 0.700 g/cm3, respectively. Consequently, pressure changes have a more pronounced impact on the phase behavior of alkanes with lower carbon numbers compared to those with higher carbon numbers. Once pressure surpasses the phase transition point, alkane densities stabilize.

3.2. Phase Behavior Analysis of Multi-Component Alkane System

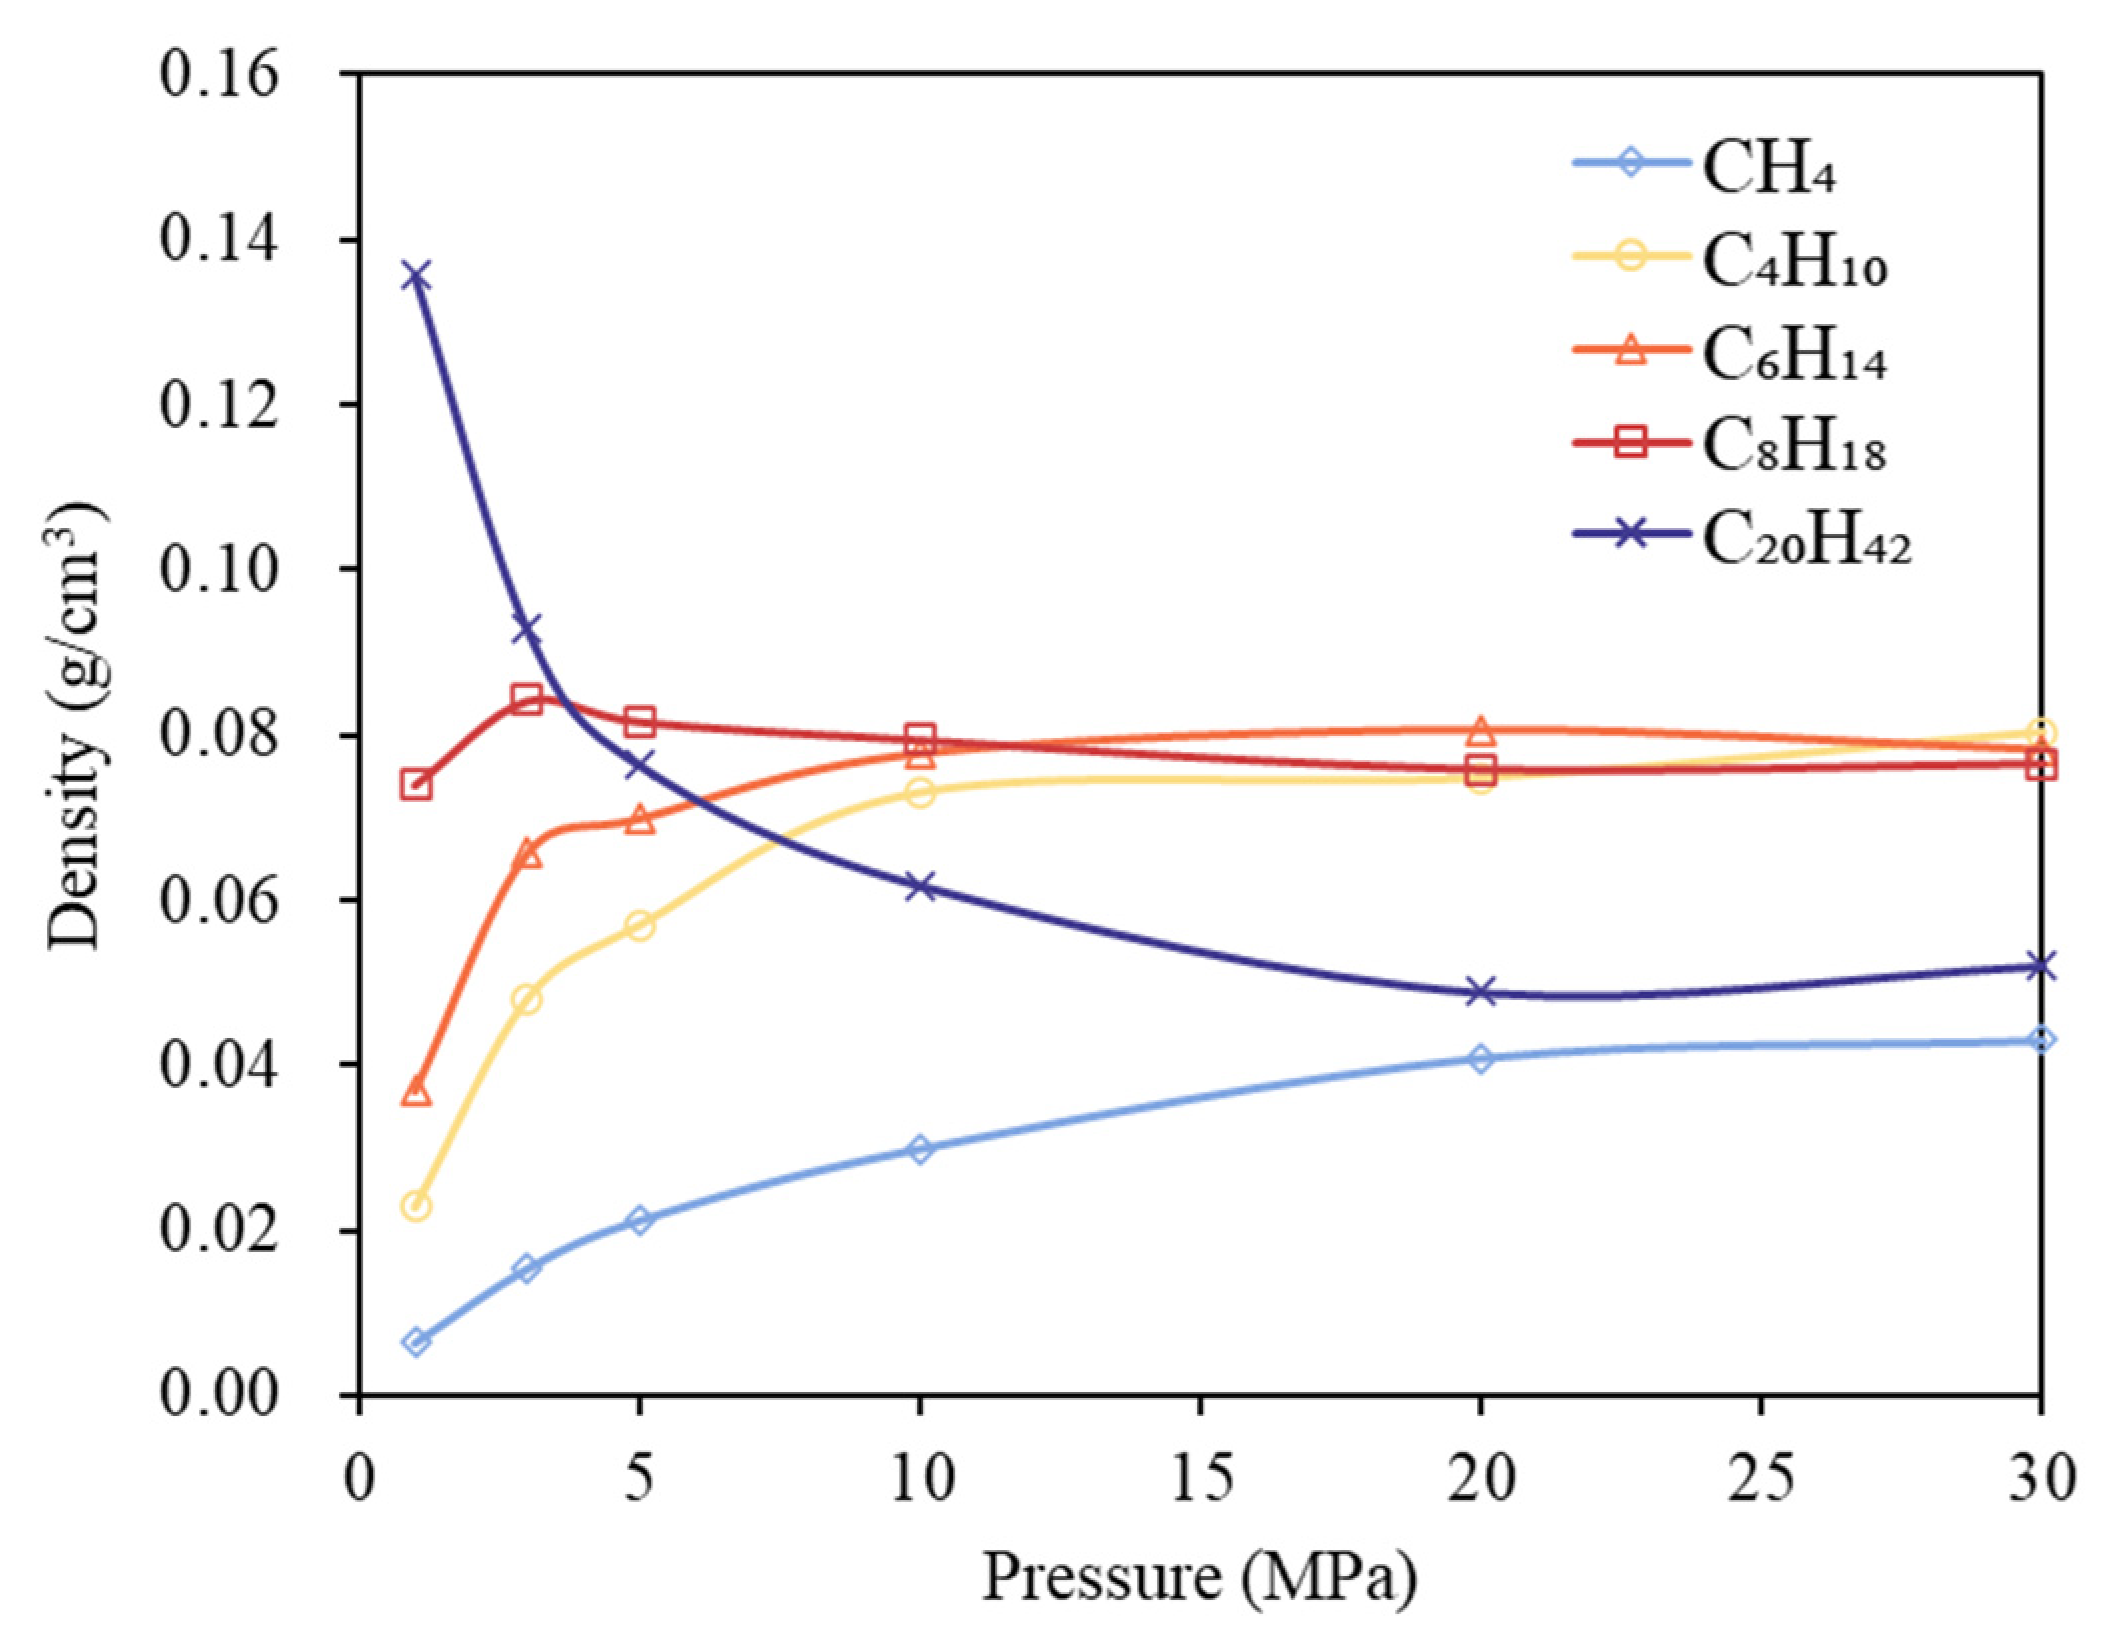
According to simulation results from Table 1 (“Basial model”), density variations of alkane components within a fixed pore at 353 K as a function of pressure are depicted in Figure 4. Figure 4 illustrates that the density of C20H42 decreases gradually as pressure increases and stabilizes above 12 MPa, indicating a phase transition pressure at approximately 12 MPa. Conversely, the densities of C4H10, C6H14, and C8H18 increase with rising pressure, each exhibiting distinct phase transition pressures at approximately 10 MPa, 5 MPa, and 3 MPa, respectively. CH4 density continuously rises within the pressure range of 1–20 MPa and remains stable above 20 MPa. Analysis suggests CH4 transitions from gas to liquid at around 20 MPa, after which its compressibility significantly decreases. Thus, CH4 phase transition occurs at approximately 20 MPa. The analysis indicates a decreasing trend in phase transition pressures with increasing carbon numbers. Upon exceeding their respective transition pressures, alkane densities stabilize, with C4H10, C6H14, and C8H18 exhibiting comparable densities higher than those of C20H42 and CH4.
In the pressure-temperature (P-T) diagram for multicomponent hydrocarbon systems, the bubble point pressure refers to the pressure at which the first bubble point of gas emerges as the pressure is decreased. Conversely, as pressure increases, the dew point pressure marks the appearance of the first liquid droplet. In condensate gas multicomponent alkane systems, CH4 is the first component to liquefy as pressure decreases, whereas C20H42 is the first to vaporize as pressure increases. Consequently, the pressure at which CH4 separates from the system can be defined as the bubble point pressure, and the pressure at which C20H42 separates is designated the dew point pressure. As inferred from Figure 4, at 353 K, the bubble point pressure for the studied system is approximately 20 MPa, and the dew point pressure is approximately 12 MPa.
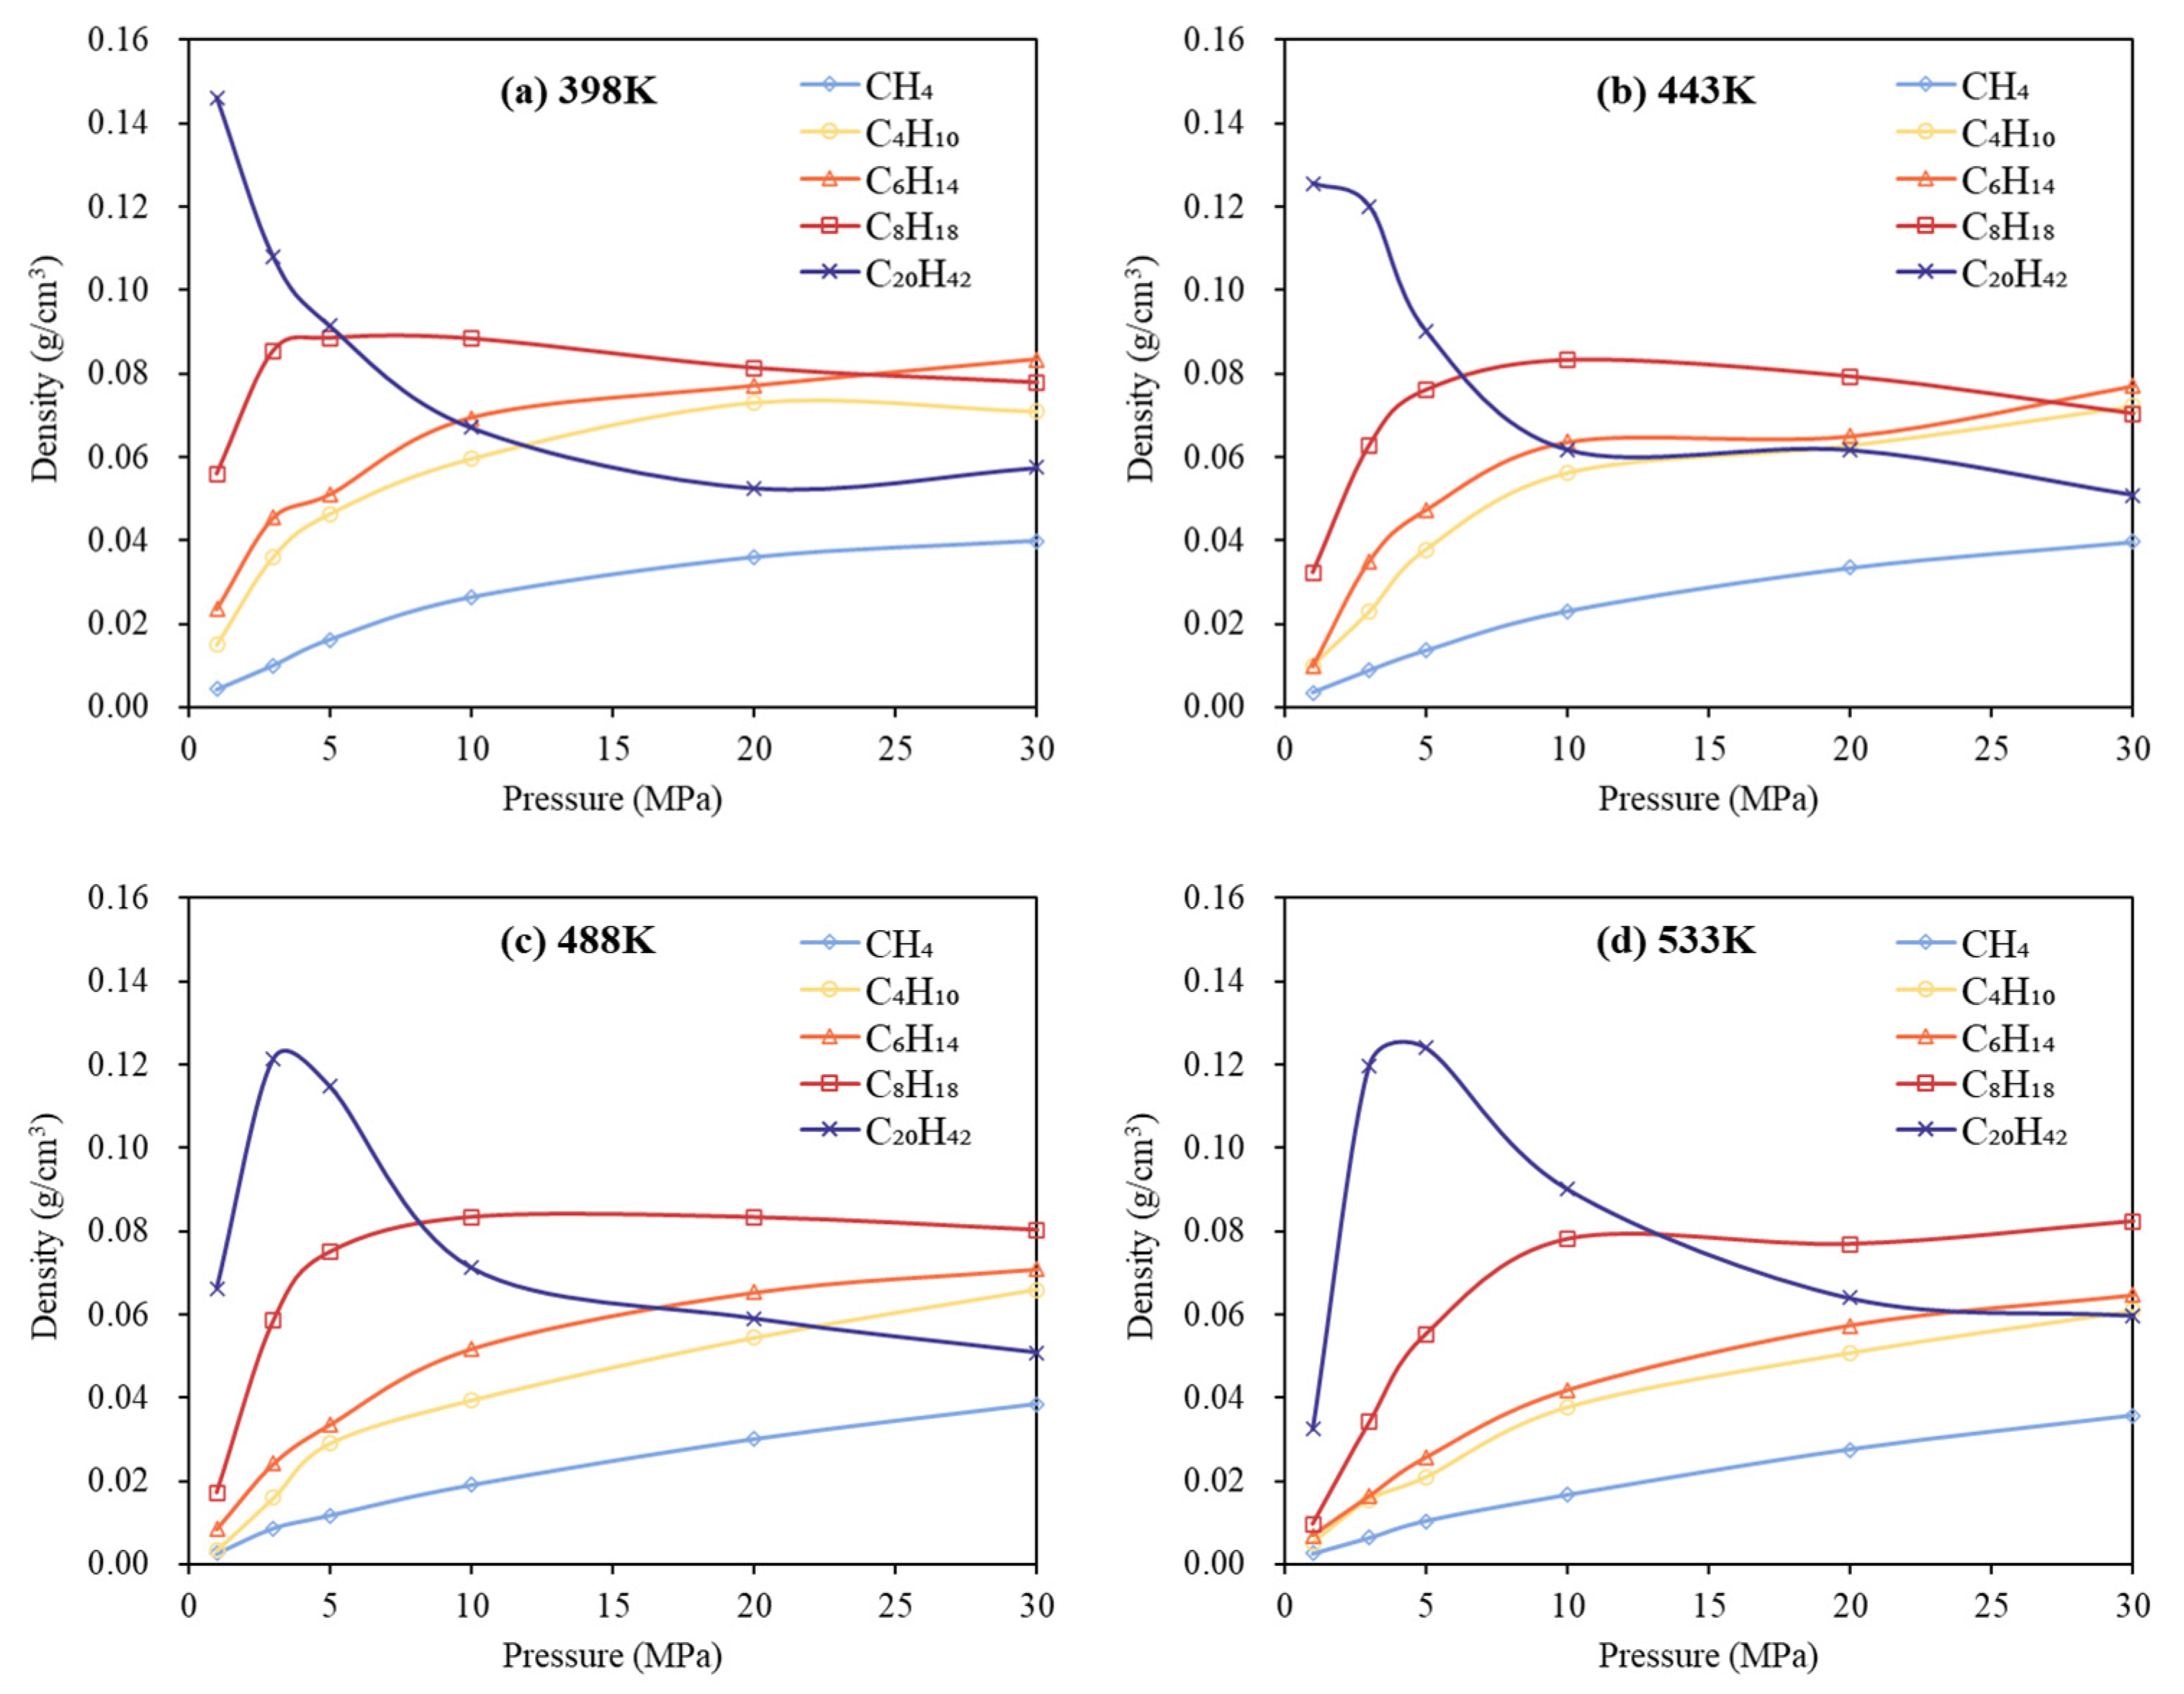
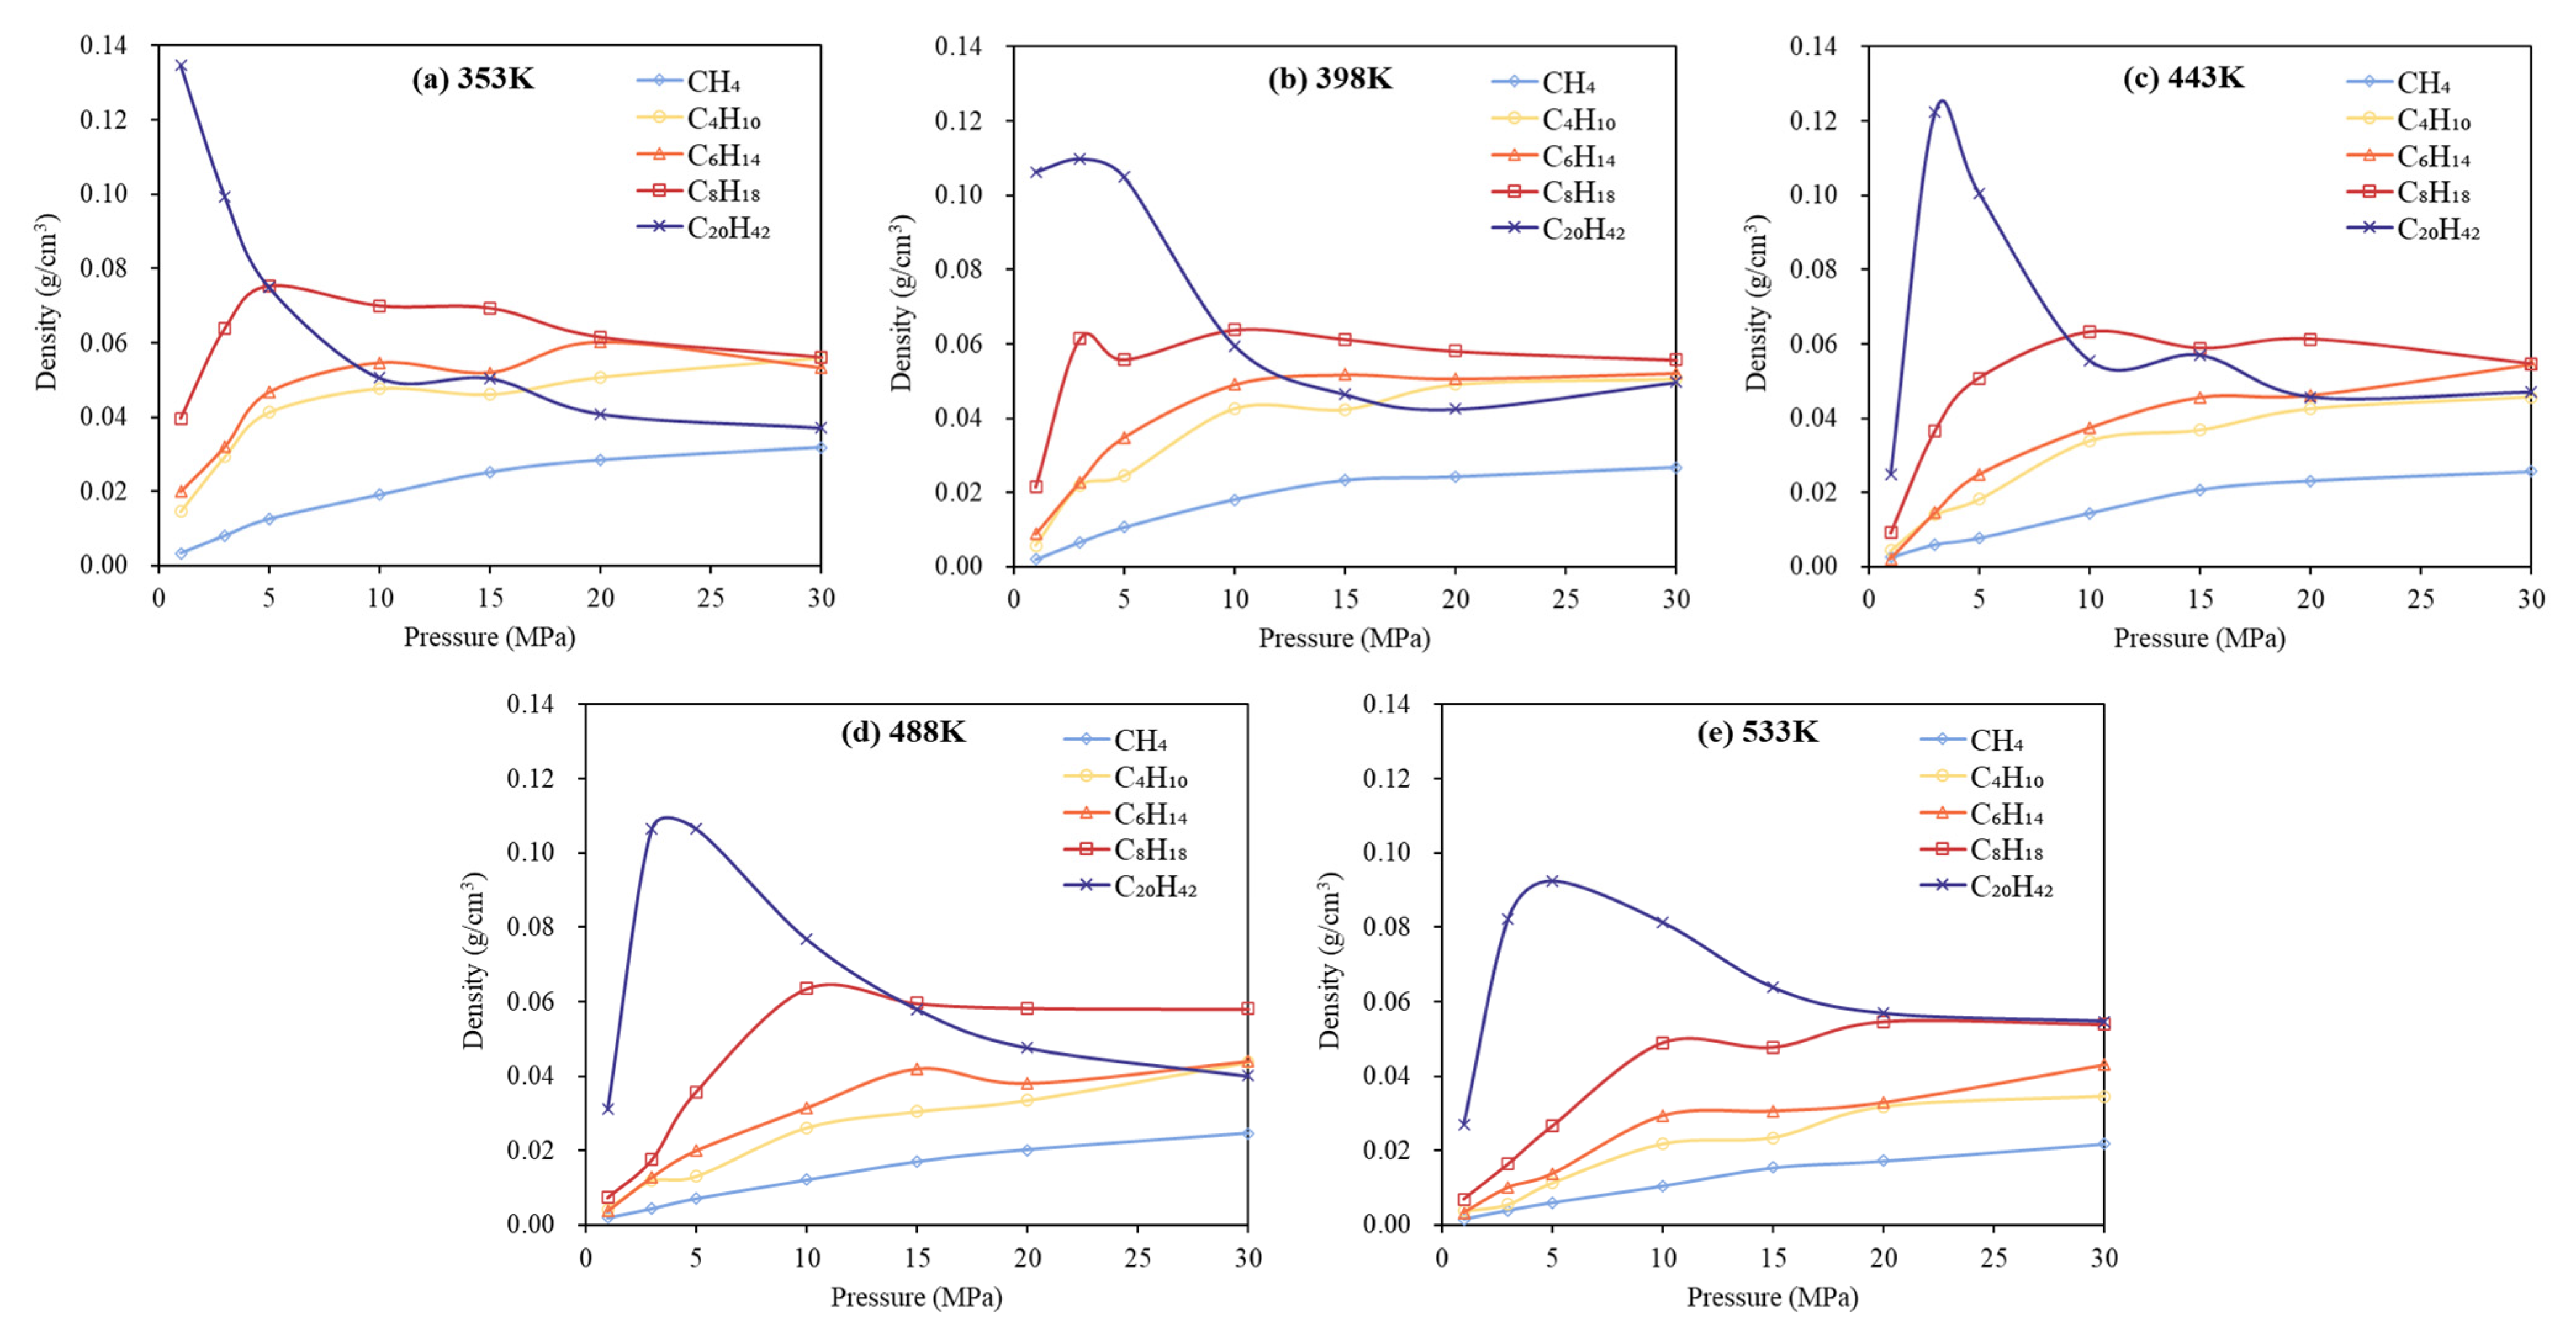
Further simulations were conducted for multicomponent alkane systems at various temperatures (398–533 K) and pressures (1–30 MPa). The simulation results are presented in Figure 5, with subfigures a–d depicting trends of alkane component densities at different temperatures and pressures in a fixed pore environment.
Figure 5 shows that between 398 and 533 K, CH4 density continuously increases with rising pressure, implying its phase transition pressure exceeds 30 MPa under these conditions. The density variations of C4H10, C6H14, and C8H18 follow similar patterns. Taking C4H10 as an example, its phase transition pressure at 398 K is approximately 20 MPa; as temperature increases further, the transition pressure rises gradually while the density decreases slightly. This suggests that higher temperatures increase molecular energy, weakening intermolecular interactions and expanding intermolecular distances, thus hindering phase transitions and elevating transition pressures for lighter alkanes. For C8H18, the phase transition pressure at 398 K is approximately 5 MPa, gradually increasing at elevated temperatures. At 533 K, its transition pressure rises to approximately 10 MPa, indicating an increase compared to lower temperatures.
Regarding C20H42, when pressure is below 5 MPa, a comparison of curves in Figure 5a–d reveals a significant density reduction with rising temperature, particularly between 443 K and 488 K. This behavior indicates that C20H42 remains in the liquid phase below 443 K and undergoes a phase transition upon temperature elevation, highlighting that temperature has a greater influence than pressure on intermolecular forces for this high-carbon-number alkane. Additionally, observing the curves at a constant temperature with increasing pressure shows that C20H42, due to its higher carbon content and initial density, undergoes compositional segregation and preferentially adsorbs onto pore surfaces at elevated pressures, causing its density to decrease gradually with increasing pressure.

3.3. Phase Behavior Analysis of Multi-Component Alkane–Flue Gas System

In this section, simulations were conducted for multicomponent alkane-CO2/N2 systems under varying temperatures, pressures, and flue gas compositions. The resulting alkane density changes in different systems are illustrated in the following figures.
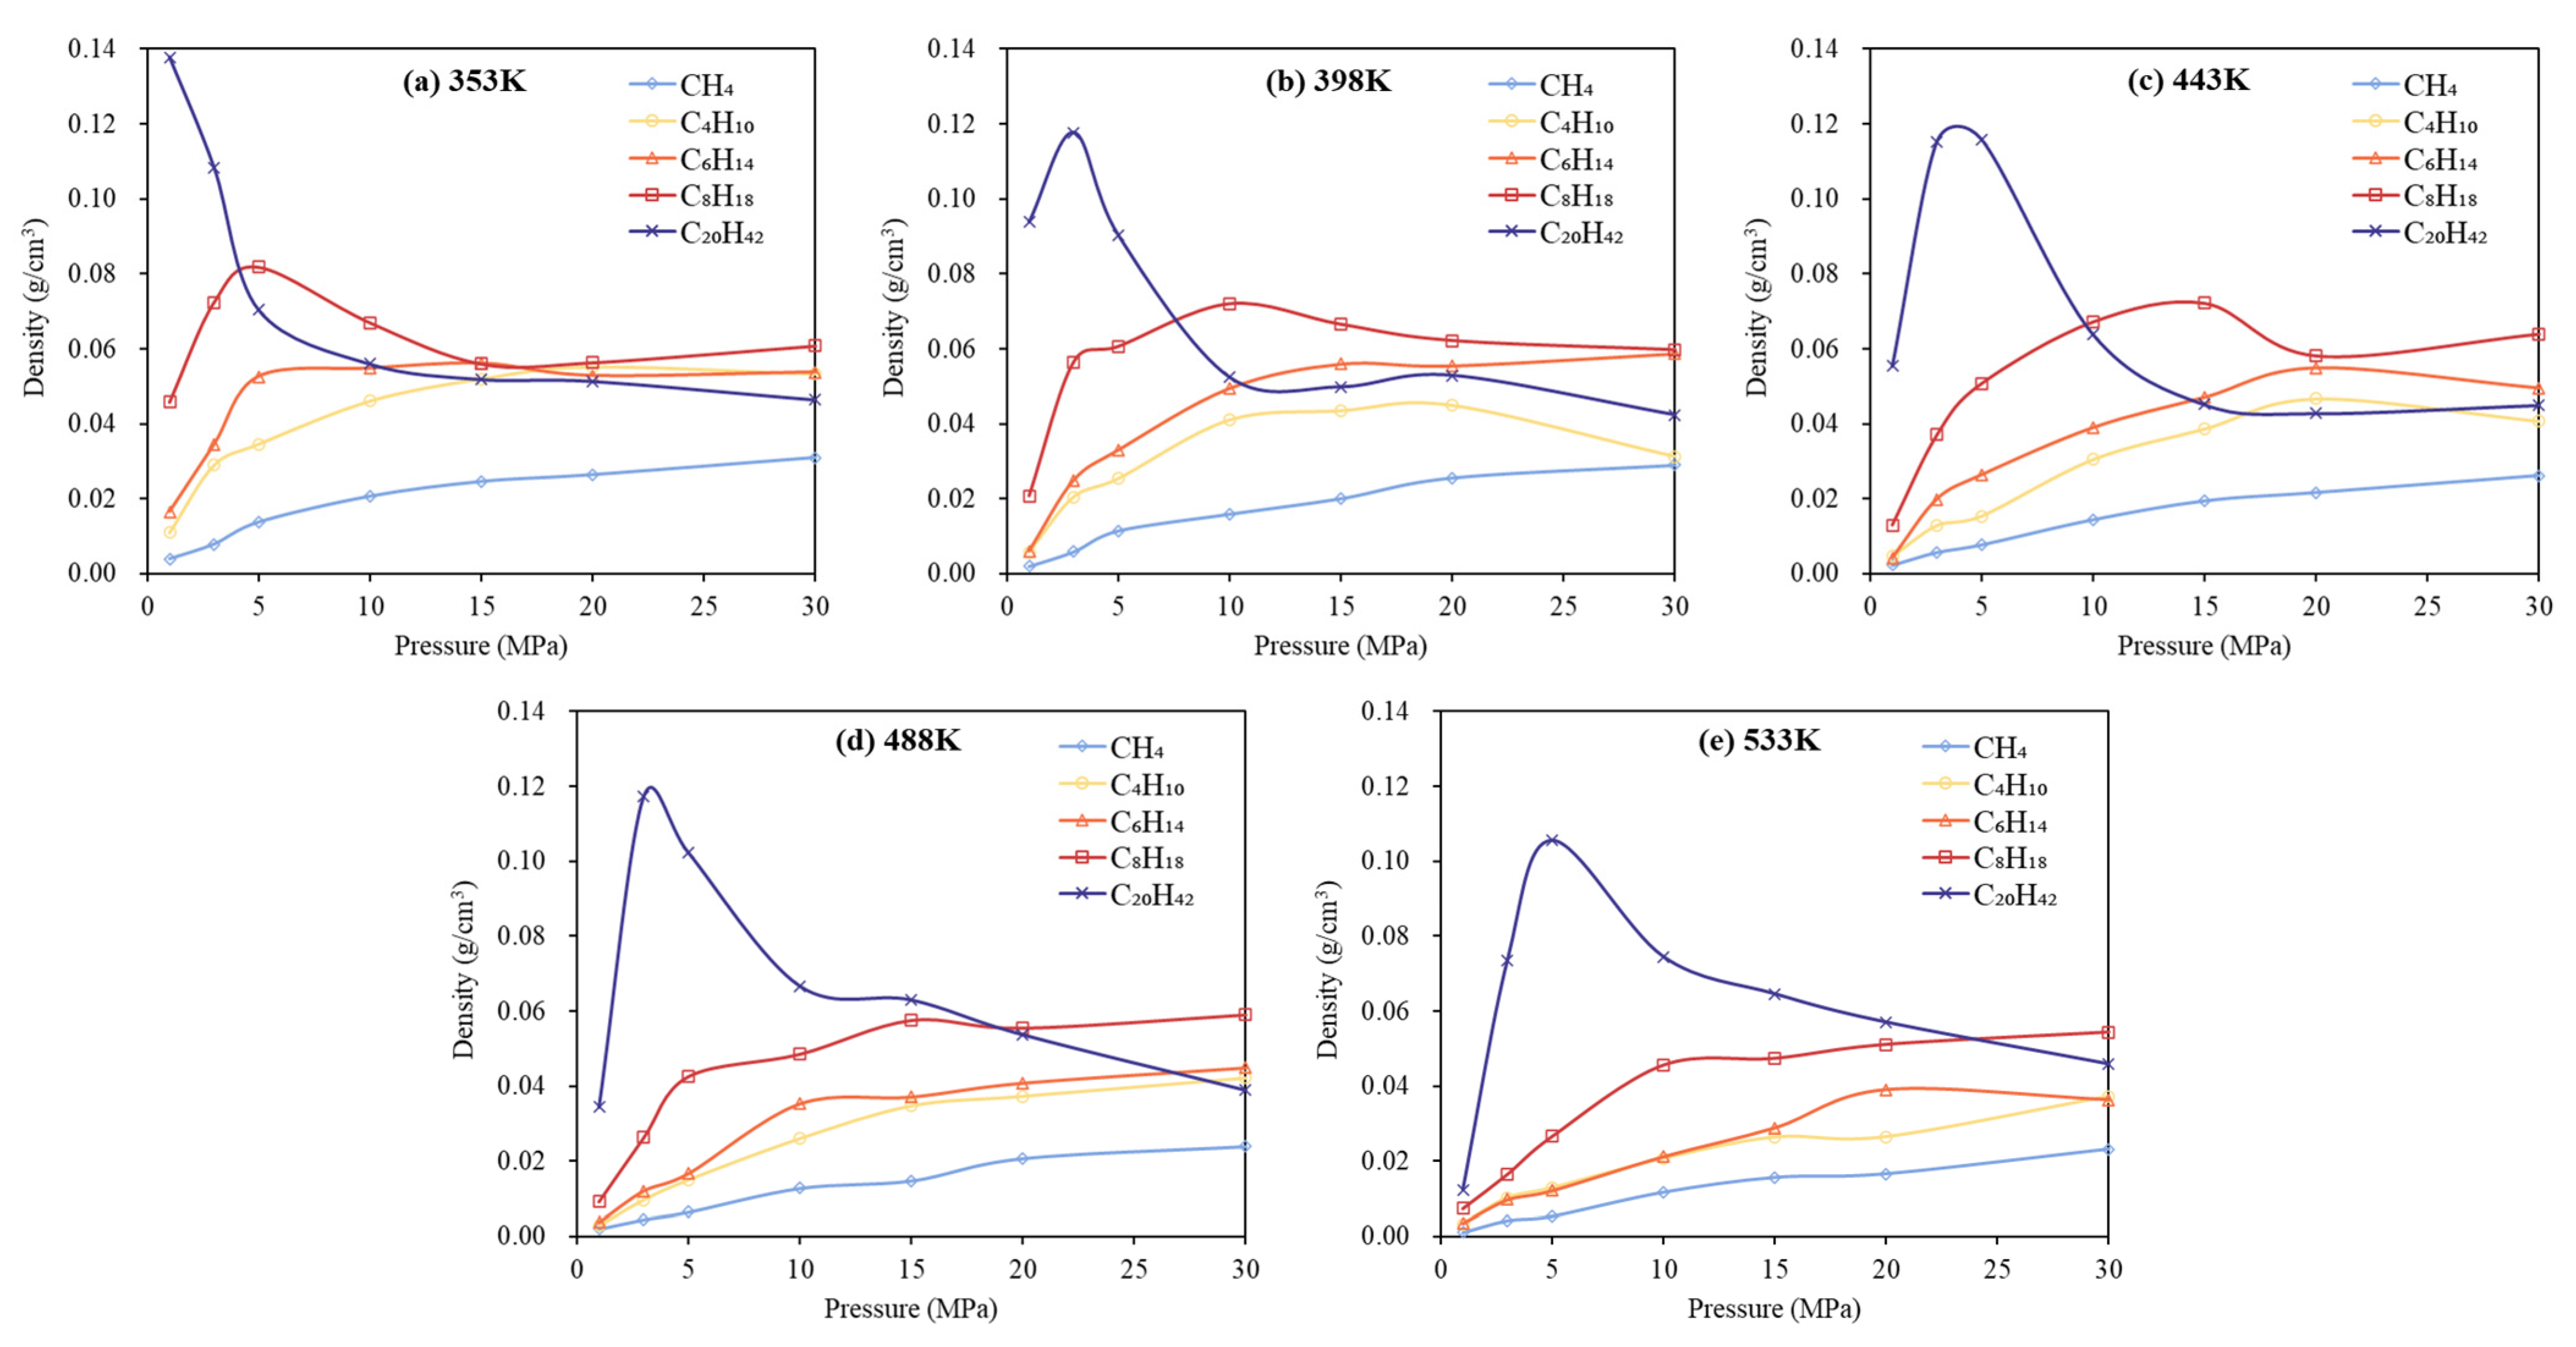
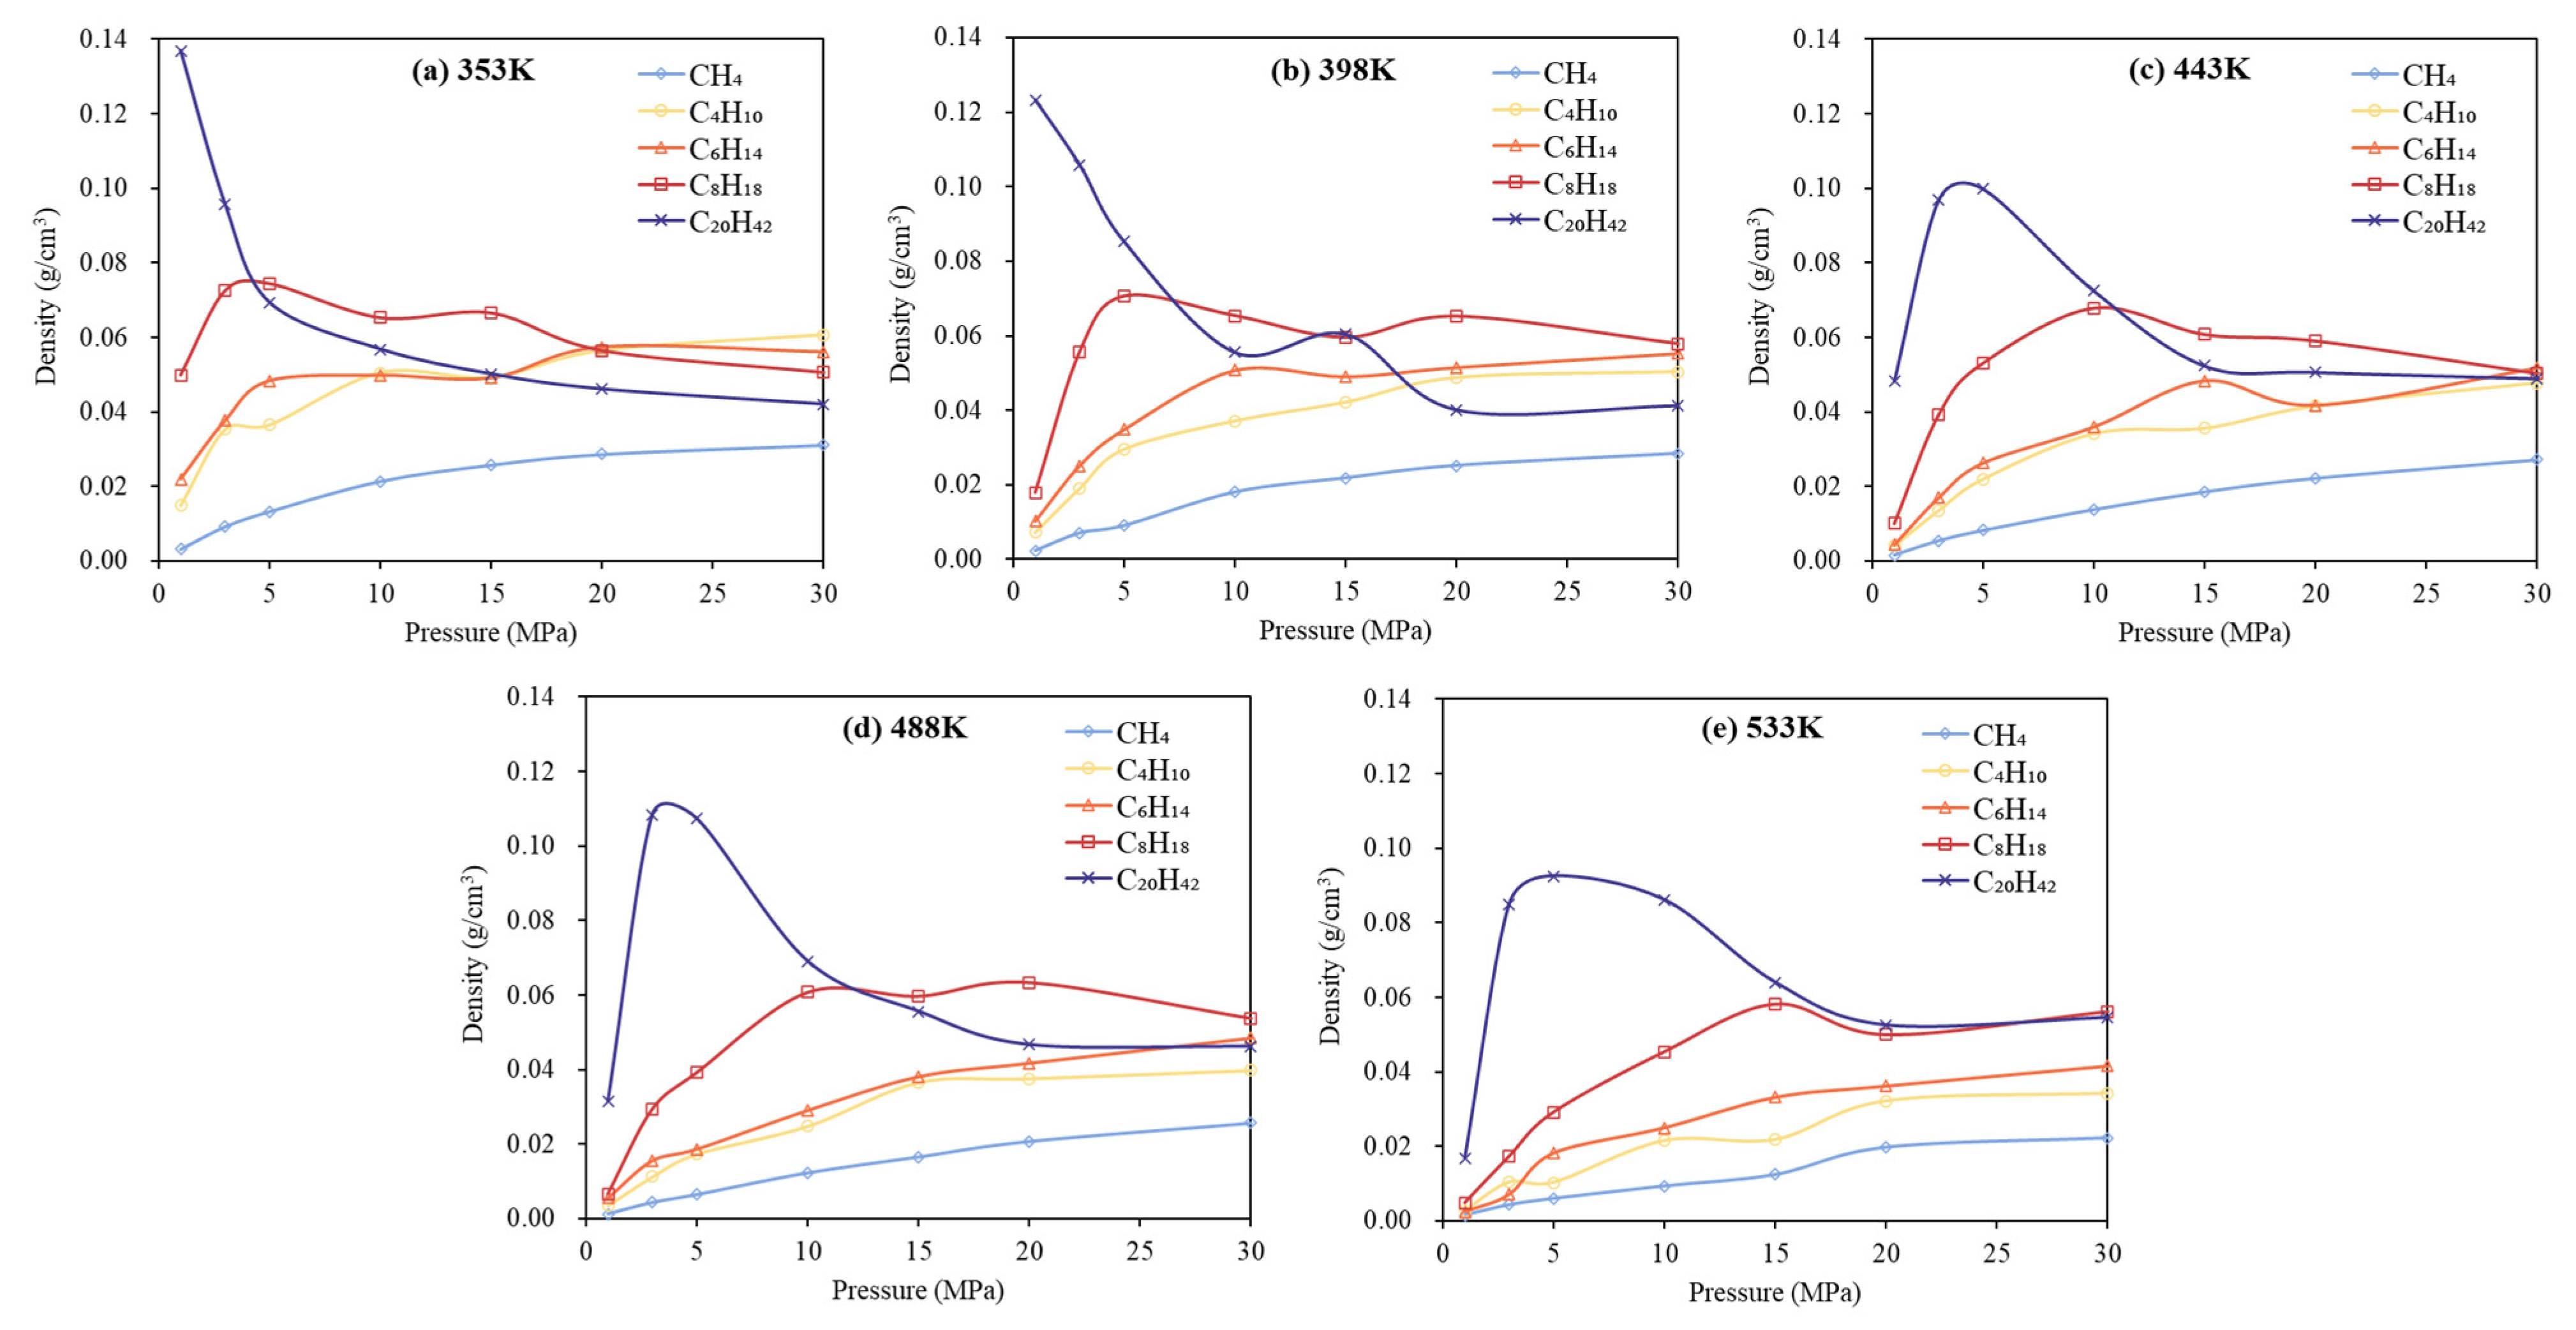
Figure 6 demonstrates density variations of alkanes within a multicomponent alkane–flue gas system (85% N2 + 15% CO2) as a function of pressure at different temperatures. The trends observed in Figure 6 indicate that the density-pressure relationships in the multicomponent alkane–flue gas (85% N2 + 15% CO2) system are generally consistent with those of the pure multicomponent alkane system.
Specifically, within the temperature range of 398–533 K, the density of CH4 continuously increases with rising pressure, suggesting that the phase transition pressure exceeds 30 MPa under these conditions. C4H10, C6H14, and C8H18 exhibit similar density variations. Taking C8H18 as an example, at temperatures of 398 K and 443 K, its phase transition pressures are approximately 3 MPa and 5 MPa, respectively; at higher temperatures (488 K and 533 K), these pressures increase to around 10 MPa and 15 MPa. This behavior indicates that at elevated temperatures, the presence of flue gas (85% N2 + 15% CO2) increases the phase transition pressure for C8H18.
For C20H42 at 398 K, the density gradually increases with decreasing pressure from 30 to 10 MPa, exhibiting minor variations. When the pressure decreases further to between 10 and 3 MPa, its density abruptly increases; below 3 MPa, the density decreases. Analysis suggests that a phase transition occurs at approximately 3 MPa for C20H42. Similarly, at temperatures of 443 K, 488 K, and 533 K, the corresponding phase transition pressures are approximately 3 MPa, 5 MPa, and 5 MPa, respectively. These values for dew point pressures are slightly higher compared to those of the pure alkane system without flue gas. Thus, the dew point pressures for this system increase gradually but with limited variation.
In summary, the addition of CO2/N2 affects the phase transition points of light and heavy alkane components differently. CH4 does not experience any phase transition throughout the studied conditions. For C4H10, C6H14, C8H18, and C20H42, at a given temperature, their phase transition pressures increase; at a given pressure, their corresponding transition temperatures decrease. Notably, the reduction in transition temperature at a constant pressure is more pronounced for heavier components (C8H18 and C20H42) than for lighter ones. The introduction of gaseous components shifts the two-phase region toward higher pressures and lower temperatures. Consequently, increasing the system’s temperature is comparatively more effective than raising the pressure to achieve miscibility.
Figure 7, Figure 8 and Figure 9 demonstrate density variations of alkanes within a multicomponent alkane–flue gas system (65% N2 + 35% CO2, 50% N2 + 50% CO2, 35% N2 + 65% CO2) as a function of pressure at different temperatures. As shown in Figure 7, CH4 does not exhibit any distinct phase transition points, regardless of changes in the CO2 fraction. For the lighter components, specifically C4H10 and C6H14, increasing the CO2 proportion in the flue gas has minimal impact on the pressure at which phase transitions occur; however, it notably affects the corresponding phase-transition temperatures. Within a CO2 proportion range of 15% to 50%, the phase-transition temperature rises with increasing CO2 content. As illustrated in Figure 7d, Figure 8d, and Figure 9d, C6H14 shows no phase transition at 15% CO2 but transitions become apparent at a CO2 proportion of 50%. For C8H18 at 398 K, as the CO2 fraction increases, the pressure corresponding to the phase-transition point initially decreases and then increases again. At temperatures above 398 K, changes in the CO2 fraction do not significantly influence the phase-transition pressure, with no clear trend observed. Regarding C20H42 at 398 K, the phase-transition pressure decreases with an increase in CO2 fraction. As indicated in Figure 9a, the phase-transition point for C20H42 disappears, and the component remains in the liquid phase throughout the pressure range studied. At temperatures exceeding 398 K, variations in CO2 proportion exert minimal impact on phase-transition pressures. However, at constant pressures, the temperature corresponding to phase transitions increases with higher CO2 proportions.
Figure 7, Figure 8 and Figure 9 collectively illustrate the density variations of multicomponent alkanes with different flue gas compositions at temperatures ranging from 353 K to 533 K. It is evident that alkane densities generally increase with rising pressure. Methane demonstrates a distinct density peak in the low-pressure range, which gradually diminishes at higher temperatures. Conversely, heavier alkane densities continuously increase with pressure before stabilizing, while their overall densities decrease with increasing temperature. These observations indicate that elevated pressures significantly enhance alkane densities, and gas–liquid phase transitions are more prominent at lower temperatures. Rising temperatures weaken intermolecular interactions and diminish phase-transition characteristics, consequently reducing alkane densities overall.
In summary, increasing pressure consistently promotes density increases in multicomponent alkane systems, whereas temperature elevations reduce the overall density levels and diminish or eliminate density peaks at lower pressures. Furthermore, the impact of increasing CO2 content on system densities gradually diminishes.

3.4. Analysis of Physical Properties of Multi-Component Alkane-Flue Gas Interface Parameters

(1)
Density distribution.
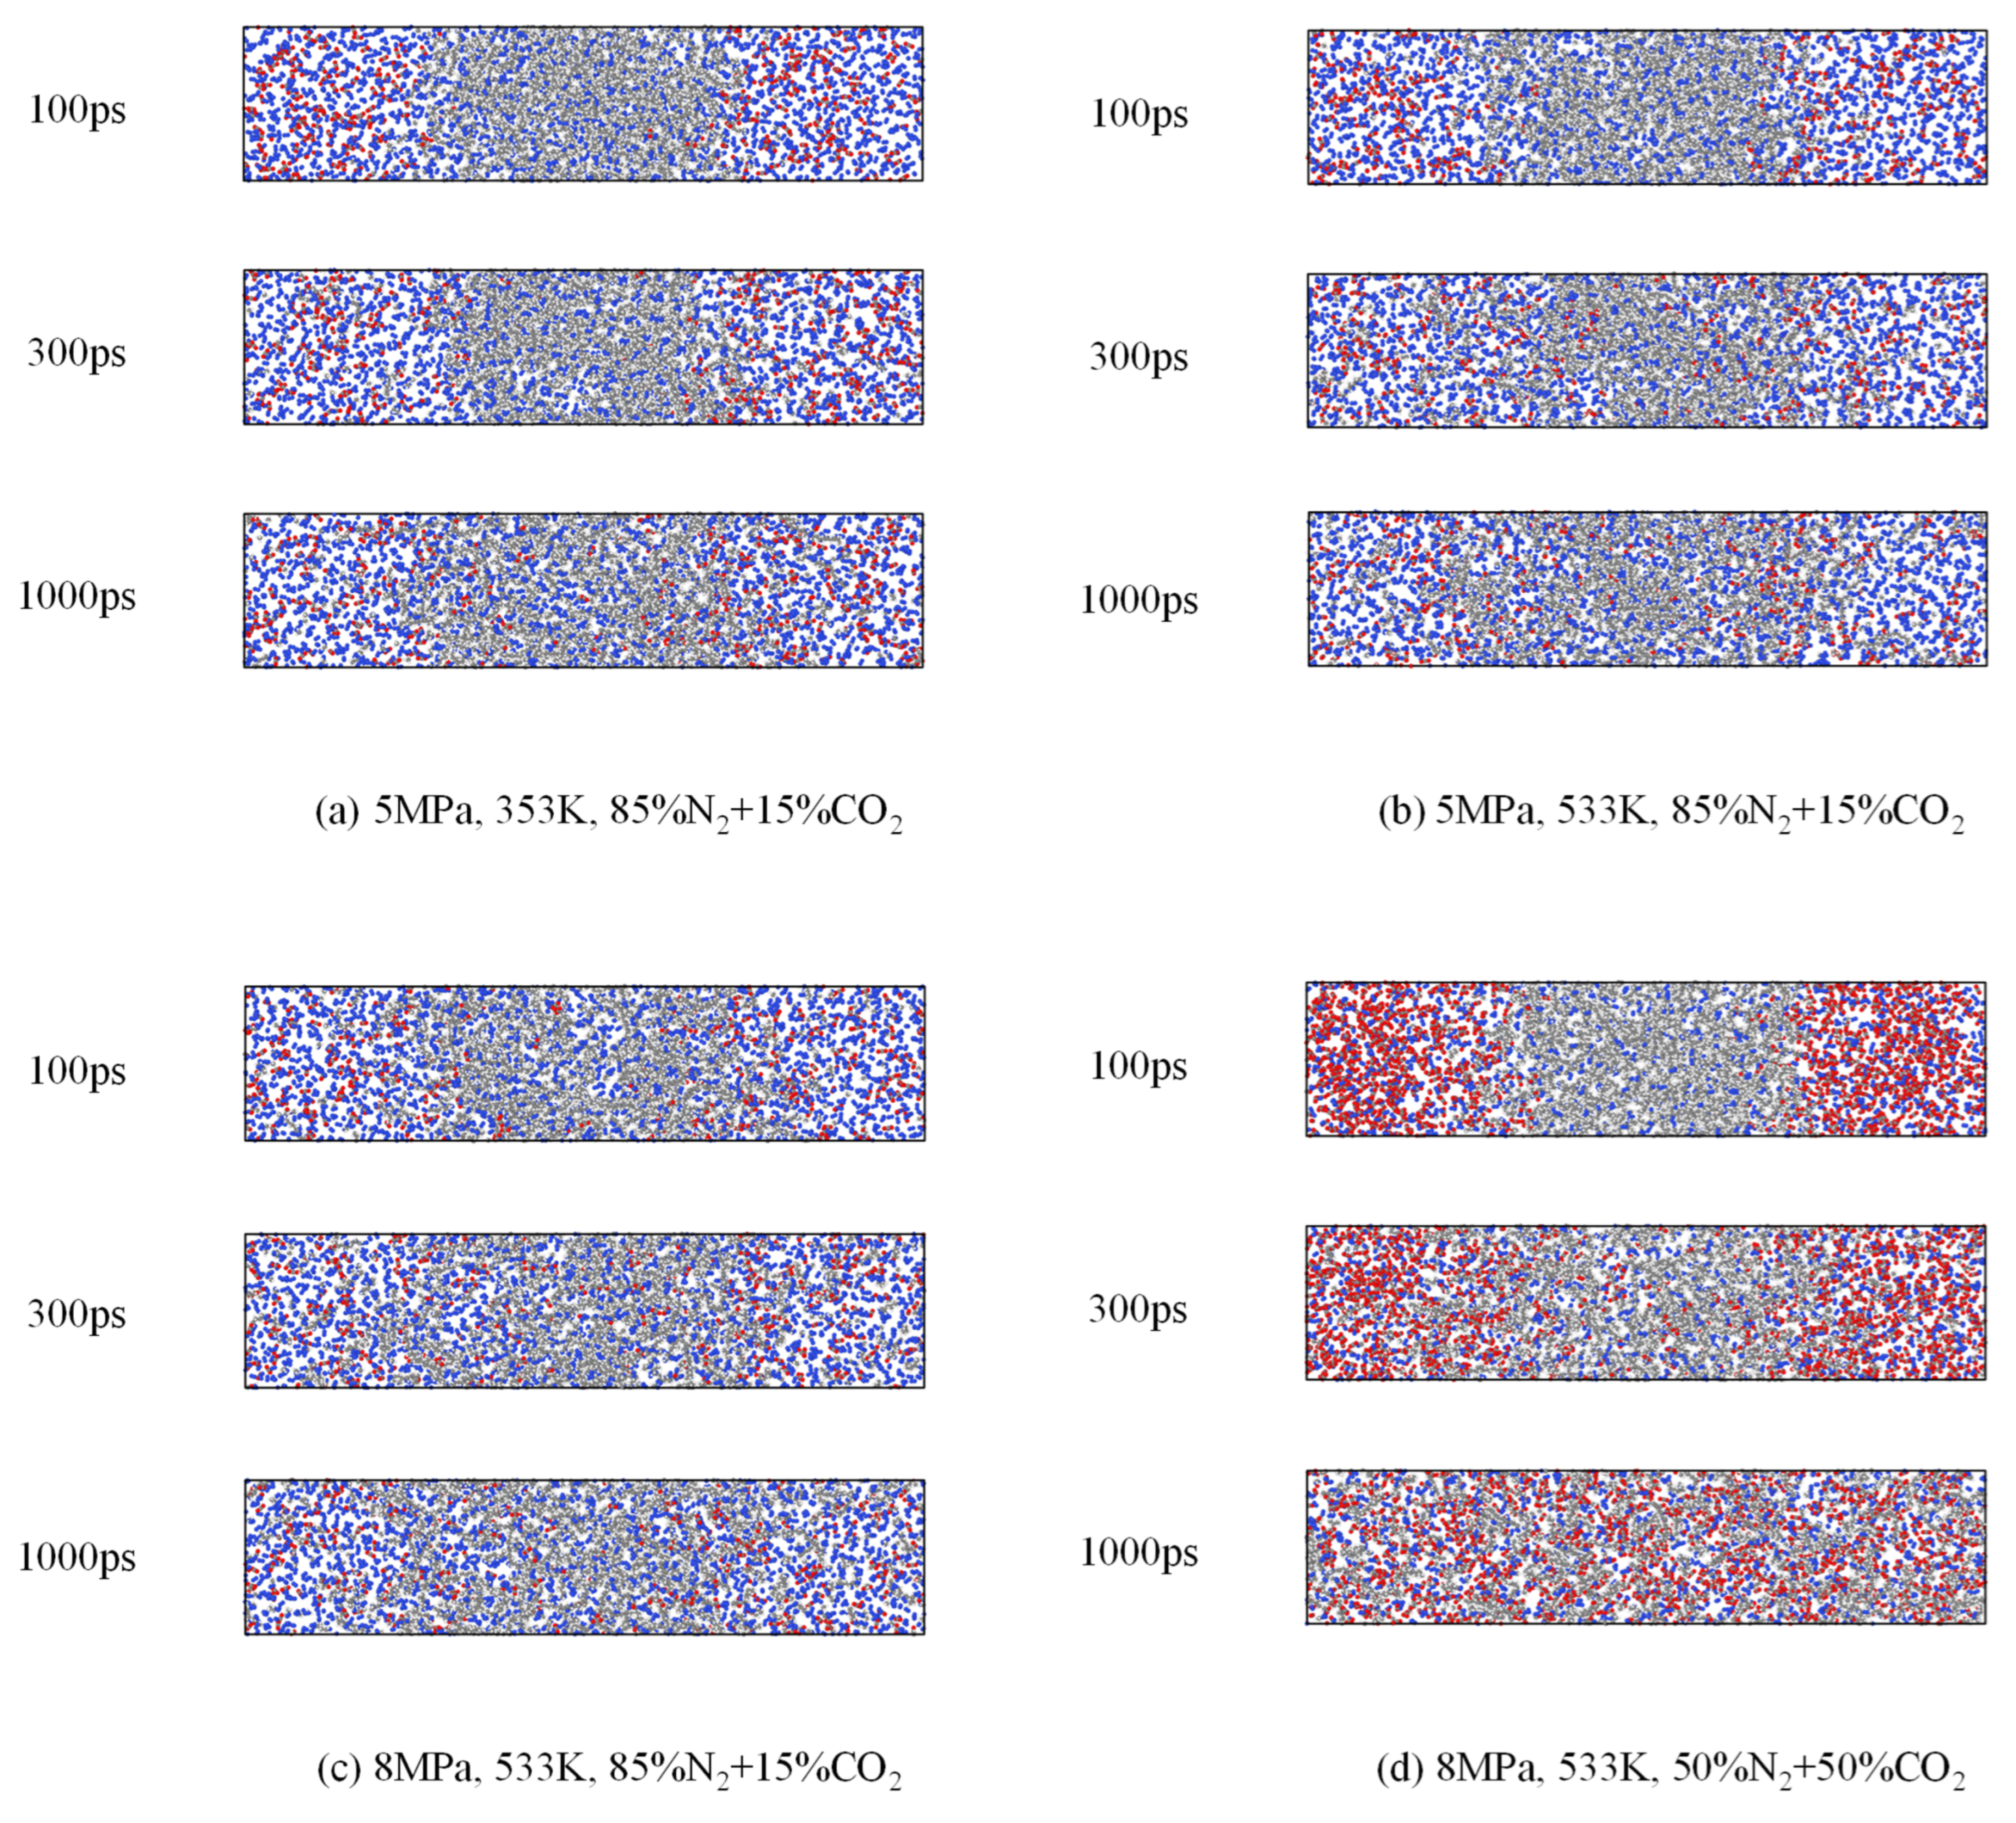
To investigate the effects of pressure and temperature on the distribution of alkanes and flue gas components, this section presents simulation cases under varying temperature and pressure conditions. A comparative analysis of the density distributions of alkanes, N2, and CO2 within the two-phase system was conducted, with the results shown in Figure 10. Figure 10 displays configuration snapshots of the system at the beginning and end of the simulations under different conditions. In each configuration, the central region consists of a mixture of alkanes, CO2, and N2, while the regions on either side represent the gaseous phases of CO2 and N2. As observed, under conditions of 353 K and 5 MPa, gas molecules from both sides migrate toward the center over time. CO2 gradually dissolves and N2 diffuses into the central alkane-rich region, leading to volumetric expansion of the liquid phase (alkanes with dissolved flue gas) and a corresponding increase in density. The density of alkanes remains high only in the liquid region and is nearly zero in the gaseous regions, indicating that alkane molecules remain localized within the liquid phase and do not diffuse into the gas phase.
Since the applied pressure of 5 MPa at 353 K is below the minimum miscibility pressure, a distinct interfacial boundary is observed between the flue gas and alkane phases. In contrast, under conditions of 533 K and 8 MPa—where the applied pressure exceeds the miscibility pressure for this temperature—no clear interface is observed between the alkane and gas molecules along the Z-direction. The initial alkane and gas regions both show nonzero densities, indicating uniform distribution of alkanes and gas molecules throughout the system. The disappearance of the interface between the liquid and gas phases signifies that miscibility has been achieved under these conditions.
(2)
Diffusion coefficient.
In this section, comparative simulations were conducted under varying temperatures, pressures, and flue gas compositions to investigate the factors influencing the diffusion coefficients of N2 and CO2. The detailed results are presented in Table 2.
As shown in Table 2, when comparing the temperature groups, both N2 and CO2 diffusion coefficients decrease with decreasing temperature. In contrast, when comparing pressure groups, the diffusion coefficients of both gases increase with rising pressure. Regarding flue gas composition, variations in the CO2 fraction show negligible impact on the diffusion coefficients of both N2 and CO2. This can be attributed to the fact that, within a fixed simulation box, increasing temperature and pressure enhance molecular kinetic energy and reduce the relative strength of intermolecular constraints, thereby increasing diffusion coefficients. In contrast, changes in the CO2 proportion have minimal effect on molecular interactions and kinetic energy, resulting in little to no impact on diffusion behavior. Therefore, as temperature and pressure increase, the diffusion coefficients of N2 and CO2 also increase, accelerating the transport of flue gas into the alkane phase. This leads to a faster disappearance of the alkane–flue gas interface and broadens the miscibility transition zone. Overall, elevated temperature and pressure promote miscibility between the alkane and flue gas phases.

4. Conclusions

This study employed molecular dynamics simulations to investigate the phase behavior of single-component alkanes, multicomponent alkane mixtures, and multicomponent alkane–flue gas systems, as well as the interfacial characteristics of multicomponent alkane–flue gas systems. The key findings and insights are summarized as follows:
(1)
Low-carbon alkanes, due to their weaker intermolecular forces, exhibit greater sensitivity to temperature changes, resulting in more rapid density decreases. In contrast, high-carbon alkanes, characterized by longer molecular chains and stronger intermolecular interactions, show limited thermal expansion and relatively stable density profiles. Pressure has a more significant influence on the phase behavior of low-carbon alkanes than on that of high-carbon alkanes.
(2)
In multicomponent alkane systems, those with a higher proportion of light components are less prone to phase transitions. In multicomponent alkane–flue gas systems, increasing pressure leads to higher alkane densities, while increasing temperature reduces density and gradually diminishes or eliminates density peaks in the low-pressure region. Additionally, the influence of increased CO2 content on the system’s phase behavior becomes progressively less significant.
(3)
At a given temperature, when the system pressure exceeds a certain threshold, CO2 becomes miscible with alkanes in the multicomponent system, while N2 diffuses into the alkane phase, causing system expansion and density reduction. The previously well-defined interface between the alkane mixture and flue gas becomes progressively diffuse and eventually disappears, indicating the onset of a fully miscible state. The corresponding pressure at which this occurs is defined as the miscibility pressure at that temperature.
(4)
With increasing temperature and pressure, the diffusion coefficients of N2 and CO2 rise, accelerating the transport of flue gas into the alkane phase and promoting faster disappearance of the interface. The transition zone required to achieve miscibility broadens under these conditions, indicating that elevated temperature and pressure facilitate miscibility between the alkane and flue gas phases. The diffusion coefficients of N2 and CO2 are not affected by their relative proportions in the flue gas mixture.
In summary, this study reveals the significant effect of flue gas in enhancing oil recovery by achieving miscibility under high-temperature and high-pressure conditions. Based on this finding, future research can further expand and optimize the application of flue gas flooding technology, and extend this conclusion to the research on the thermal miscibility mechanism of the air injection front. This is expected to provide certain technical support for the exploration of air injection thermal miscibility technology.

Author Contributions

Conceptualization, X.Z.; Methodology, X.Z., C.X.; Software, X.Z. and C.W.; Validation, J.T., S.L. and B.W.; Formal analysis, X.Z., C.X. and B.W.; Investigation, F.Z., P.H., H.Z. and C.W.; Resources, J.T. and S.L.; Data curation, Z.Q., S.L., and P.H.; Writing—original draft, X.Z.; Writing—review & editing, X.Z.; J.T., Z.Q. and F.Z. Visualization, Z.Q., P.H., H.Z. and C.W.; Supervision, H.Z. and B.W.; Project administration, F.Z. Funding acquisition, C.X. All authors have read and agreed to the published version of the manuscript.

Funding

This is work was supported by the project ‘Research on Air Injection Thermal Miscible Technology’ (No. 2023ZG18).

Data Availability Statement

The original contributions presented in the study are included in the article, further inquiries can be directed to the corresponding author.

Conflicts of Interest

All authors were employed by the company PetroChina. The research was conducted in the absence of any commercial or financial relationships that could be construed as a potential conflict of interest.

References

  1. Andersen, P.Ø.; Brattekås, B.; Zhou, Y.; Nadeau, P.; Nermoen, A.; Yu, Z.; Fjelde, I.; Oelkers, E. Carbon capture utilization and storage (CCUS) in tight gas and oil reservoirs. J. Nat. Gas Sci. Eng. 2020, 81, 103458. [Google Scholar] [CrossRef]
  2. Li, Q.; Wu, J.; Li, Q.; Wang, F.; Cheng, Y. Sediment Instability Caused by Gas Production from Hydrate-bearing Sediment in Northern South China Sea by Horizontal Wellbore: Sensitivity Analysis. Nat. Resour. Res. 2025, 34, 1667–1699. [Google Scholar] [CrossRef]
  3. Hu, Y.; Wang, H.; Guo, P.; Wang, J. Molecular insights into CO2-EOR/CCUS: Nanoconfinement effects on multi-component diffusion and miscibility in shale reservoirs. Fuel 2025, 395, 135238. [Google Scholar] [CrossRef]
  4. Deng, Q.; Ling, X.; Zhang, K.; Tan, L.; Qi, G.; Zhang, J. CCS and CCUS technologies: Giving the oil and gas industry a green future. Front. Energy Res. 2022, 10, 919330. [Google Scholar] [CrossRef]
  5. Li, Q.; Li, Q.; Wang, F.; Ning, X.; Wang, Y.; Bai, B. Settling behavior and mechanism analysis of kaolinite as a fracture proppant of hydrocarbon reservoirs in CO2 fracturing fluid. Colloid. Surf. A 2025, 724, 137463. [Google Scholar] [CrossRef]
  6. Wang, F.; Liao, G.; Su, C.; Wang, F.; Ma, J.; Yang, Y. Carbon Emission Reduction Accounting Method for a CCUS-EOR Project. Pet. Explor. Dev. 2023, 50, 989–1000. [Google Scholar] [CrossRef]
  7. Miao, L.; Feng, L.; Ma, Y. Comprehensive Evaluation of CCUS Technology: A Case Study of China’s First Million-Tonne CCUS-EOR Project. Environ. Impact Assess. Rev. J. 2025, 110, 107684. [Google Scholar] [CrossRef]
  8. Edouard, M.N.; Okere, C.J.; Ejike, C.; Dong, P.; Suliman, M.A. Comparative Numerical Study on the Co-Optimization of CO2 Storage and Utilization in EOR, EGR, And EWR: Implications for CCUS Project Development. Appl. Energy 2023, 347, 121448. [Google Scholar] [CrossRef]
  9. Lv, Q.; Zheng, R.; Zhou, T.; Guo, X.; Wang, W.; Li, J.; Liu, Z. Visualization Study of CO2-EOR in Carbonate Reservoirs Using 2.5 D Heterogeneous Micromodels for CCUS. Fuel 2022, 330, 125533. [Google Scholar] [CrossRef]
  10. Xiang, Y.; Song, C.; Li, C.; Yao, E.; Yan, W. Characterization of 13Cr Steel Corrosion in Simulated EOR-CCUS Environment with Flue Gas Impurities. Process Saf. Environ. Prot. 2020, 140, 124–136. [Google Scholar] [CrossRef]
  11. Subramanian, N.; Madejski, P. Analysis of CO2 Capture Process from Flue-Gases in Combined Cycle Gas Turbine Power Plant Using Post-Combustion Capture Technology. Energy 2023, 282, 128311. [Google Scholar] [CrossRef]
  12. Liu, D.; Li, W. Flue Gas Enhanced Oil Recovery (EOR) As a High Efficient Development Technology for Offshore Heavy Oil in China. J. Pet. Gas Eng. 2013, 4, 127–142. [Google Scholar]
  13. Chen, H.; Wang, Z.; Wang, K.; Li, Z.; Li, S. Investigation of EOR Mechanism for Flue Gas Assisted SAGD. J. Pet. Sci. Eng. 2020, 193, 107420. [Google Scholar] [CrossRef]
  14. Nassabeh, M.; You, Z.; Keshavarz, A.; Iglauer, S. Hybrid EOR Performance Optimization through Flue Gas-Water Alternating Gas (WAG) Injection: Investigating the Synergistic Effects of Water Salinity and Flue Gas Incorporation. Energy Fuels 2024, 38, 13956–13973. [Google Scholar] [CrossRef]
  15. Sofla, M.J.D.; Farahani, Z.D.; Ghorbanizadeh, S.; Namdar, H. Experimental Study of Asphaltene Deposition during CO2 and Flue Gas Injection EOR Methods Employing a Long Core. Sci. Rep. 2024, 14, 3772. [Google Scholar] [CrossRef] [PubMed]
  16. Díaz, O.C.; Modaresghazani, J.; Satyro, M.A.; Yarranton, H. Modeling the Phase Behavior of Heavy Oil and Solvent Mixtures. Fluid Phase Equilib. 2011, 304, 74–85. [Google Scholar] [CrossRef]
  17. Li, X.; Han, H.; Yang, D.; Liu, X.; Qin, J. Phase Behavior of C3H8-CO2-Heavy Oil Systems in the Presence of Aqueous Phase under Reservoir Conditions. Fuel 2017, 209, 358–370. [Google Scholar] [CrossRef]
  18. Shi, Y.; Yang, D. Experimental and Theoretical Quantification of Nonequilibrium Phase Behavior and Physical Properties of Foamy Oil under Reservoir Conditions. J. Energy Resour. Technol. 2017, 139, 062902. [Google Scholar] [CrossRef]
  19. Sun, X.-F.; Song, Z.-Y.; Cai, L.-F.; Zhang, Y.-Y.; Li, P. Phase Behavior of Heavy Oil-Solvent Mixture Systems under Reservoir Conditions. Pet. Sci. 2020, 17, 1683–1698. [Google Scholar] [CrossRef]
  20. Bang, V.S.; Pope, G.A.; Sharma, M.M. Phase-behavior Study of Hydrocarbon/Water/Methanol Mixtures at Reservoir Conditions. SPE J. 2010, 15, 952–962. [Google Scholar] [CrossRef]
  21. Anselme, M.J.; Gude, M.; Teja, A.S. The Critical Temperatures and Densities of the n-Alkanes from Pentane to Octadecane. Fluid Phase Equilib. 1990, 57, 317–326. [Google Scholar] [CrossRef]
  22. Martin, M.G.; Siepmann, J.I. Predicting Multicomponent Phase Equilibria and Free Energies of Transfer for Alkanes by Molecular Simulation. J. Am. Chem. Soc. 1997, 119, 8921–8924. [Google Scholar] [CrossRef]
  23. Errington, J.R.; Boulougouris, G.C.; Economou, I.G.; Panagiotopoulos, A.Z.; Theodorou, D.N. Molecular Simulation of Phase Equilibria for Water-Methane and Water-Ethane Mixtures. J. Phys. Chem. B 1998, 102, 8865–8873. [Google Scholar] [CrossRef]
  24. Boulougouris, G.C.; Errington, J.R.; Economou, I.G.; Panagiotopoulos, A.Z.; Theodorou, D.N. Molecular Simulation of Phase Equilibria for Water-n-Butane and Water-n-Hexane Mixtures. J. Phys. Chem. B 2000, 104, 4958–4963. [Google Scholar] [CrossRef]
  25. Zhang, L.; Siepmann, J.I. Pressure Dependence of the Vapor-Liquid-Liquid Phase Behavior in Ternary Mixtures Consisting of n-Alkanes, n-Perfluoroalkanes, and Carbon Dioxide. J. Phys. Chem. B 2005, 109, 2911–2919. [Google Scholar] [CrossRef]
  26. Nikolaidis, I.K.; Poursaeidesfahani, A.; Csaszar, Z.; Ramdin, M.; Vlugt, T.J.H.; Economou, I.G.; Moultos, O.A. Modeling the Phase Equilibria of Asymmetric Hydrocarbon Mixtures Using Molecular Simulation and Equations of State. AIChE J. 2019, 65, 792–803. [Google Scholar] [CrossRef]
  27. Moultos, O.A.; Tsimpanogiannis, I.N.; Panagiotopoulos, A.Z.; Trusler, J.M.; Economou, I.G. Atomistic Molecular Dynamics Simulations of Carbon Dioxide Diffusivity in n-Hexane, n-Decane, n-Hexadecane, Cyclohexane, and Squalane. J. Phys. Chem. B 2016, 120, 12890–12900. [Google Scholar] [CrossRef]
  28. Neyt, J.-C.; Wender, A.; Lachet, V.; Malfreyt, P. Modeling the Pressure Dependence of Acid Gas+n-Alkane Interfacial Tensions Using Atomistic Monte Carlo Simulations. J. Phys. Chem. C 2012, 116, 10563–10572. [Google Scholar] [CrossRef]
  29. Müller, E.A.; Mejía, A. Interfacial Properties of Selected Binary Mixtures Containing n-Alkanes. Fluid Phase Equilib. 2009, 282, 68–81. [Google Scholar] [CrossRef]
  30. Zabala, D.; Nieto-Draghi, C.; de Hemptinne, J.C.; de Ramos, A.L.L. Diffusion Coefficients in CO2/n-Alkane Binary Liquid Mixtures by Molecular Simulation. J. Phys. Chem. B 2008, 112, 16610–16618. [Google Scholar] [CrossRef]
  31. Wang, R.; Bi, S.; Guo, Z.; Feng, G. Molecular Insight into Replacement Dynamics of CO2 Enhanced Oil Recovery in Nanopores. Chem. Eng. J. 2022, 440, 135796. [Google Scholar] [CrossRef]
  32. Zhang, J.; Pan, Z.; Liu, K.; Burke, N. Molecular Simulation of CO2 Solubility and Its Effect on Octane Swelling. Energy Fuels 2013, 27, 2741–2747. [Google Scholar] [CrossRef]
  33. Liu, B.; Li, J.; Qi, C.; Li, X.; Mai, T.; Zhang, J. Mechanism of Asphaltene Aggregation Induced by Supercritical CO2: Insights from molecular dynamics simulation. RSC Adv. 2017, 7, 50786–50793. [Google Scholar] [CrossRef]
  34. Lansangan, R.M.; Smith, J.L. Viscosity, Density, and Composition Measurements of CO2/West Texas Oil Systems. SPE Reserv. Eng. 1993, 8, 175–182. [Google Scholar] [CrossRef]
  35. Ahmed, T.; Nasrabadi, H.; Firoozabadi, A. Complex Flow and Composition Path in CO2 Injection Schemes from Density Effects. Energy Fuels 2012, 26, 4590–4598. [Google Scholar] [CrossRef]
  36. Kariznovi, M.; Nourozieh, H.; Abedi, J. Phase Composition and Saturated Liquid Properties in Binary and Ternary Systems Containing Carbon Dioxide, n-Decane, and n-Tetradecane. J. Chem. Thermodyn. 2013, 57, 189–196. [Google Scholar] [CrossRef]
  37. Nourozieh, H.; Kariznovi, M.; Abedi, J. Measurement and Correlation of Saturated Liquid Properties and Gas Solubility for Decane, Tetradecane and Their Binary Mixtures Saturated with Carbon Dioxide. Fluid Phase Equilib. 2013, 337, 246–254. [Google Scholar] [CrossRef]
  38. Jia, B.; Tsau, J.-S.; Barati, R. A Review of the Current Progress of CO2 Injection EOR and Carbon Storage in Shale Oil Reservoirs. Fuel 2019, 236, 404–427. [Google Scholar] [CrossRef]
  39. Alfarge, D.; Wei, M.; Bai, B. Factors Affecting CO2-EOR in Shale-Oil Reservoirs: Numerical Simulation Study and Pilot Tests. Energy Fuels 2017, 31, 8462–8480. [Google Scholar] [CrossRef]
  40. Yu, H.; Xu, H.; Fu, W.; Lu, X.; Chen, Z.; Qi, S.; Wang, Y.; Yang, W.; Lu, J. Extraction of Shale Oil with Supercritical CO2: Effects of Number of Fractures and Injection Pressure. Fuel 2021, 285, 118977. [Google Scholar] [CrossRef]
  41. Shokir, E.M.E.-M. CO2-Oil Minimum Miscibility Pressure Model for Impure and Pure CO2 Streams. J. Pet. Sci. Eng. 2007, 58, 173–185. [Google Scholar] [CrossRef]
  42. Mosavat, N.; Abedini, A.; Torabi, F. Phase Behaviour of CO2-Brine and CO2-Oil Systems for CO2 Storage and Enhanced Oil Recovery: Experimental Studies. Energy Procedia 2014, 63, 5631–5645. [Google Scholar] [CrossRef]
  43. Wang, Y.; Lei, Z.; Sun, L.; Pan, X.; Liu, Y.; Xu, Z.; Zheng, X.; Wang, Y.; Liu, P. Study on the Minimum Miscibility Pressure and Phase Behavior of CO2-Shale Oil in Nanopores. Chem. Eng. J. 2024, 497, 154493. [Google Scholar] [CrossRef]
  44. Mehana, M.; Fahes, M.; Huang, L. The Density of Oil/Gas Mixtures: Insights from Molecular Simulations. SPE J. 2018, 23, 1798–1808. [Google Scholar] [CrossRef]
  45. Fang, T.; Li, S.; Zhang, Y.; Su, Y.; Yan, Y.; Zhang, J. How the Oil Recovery in Deep Oil Reservoirs Is Affected by Injected Gas Types: A Molecular Dynamics Simulation Study. Chem. Eng. J. 2021, 231, 116286. [Google Scholar] [CrossRef]
  46. Jiang, T.; Zhang, X.; Xi, C.; Wang, B.; Zhao, F.; Zhao, Z. Air Injection into Condensate Reservoirs in the Middle and Late Stages Increases Recovery with Thermal Miscible Mechanism. SPE J. 2024, 29, 6375–6388. [Google Scholar] [CrossRef]
  47. Jorgensen, W.; David, S.; Maxwell, J.T. Development and Testing of the OPLS All-Atom Force Field on Conformational Energetics and Properties of Organic Liquids. J. Am. Chem. Soc. 1996, 118, 11225–11236. [Google Scholar] [CrossRef]
  48. Jorgensen, W.L.; Jeffry, D.; Carol, J. Optimized intermolecular potential functions forliquid hydrocarbons. J. Am. Chem. Soc. 1984, 106, 6638–6646. [Google Scholar] [CrossRef]
  49. Siu, S.; Kristyna, P.; Rainer, A. Optimization of the OPLS-AA Force Field for Long Hydrocarbons. J. Chem. Theory Comput. 2012, 8, 1459–1470. [Google Scholar] [CrossRef]
  50. Shah, M.S.; Tsapatsis, M.; Siepmann, J.I. Development of the transferable potentials for phase equilibria model for hydrogen sulfide. J. Phys. Chem. B. 2015, 119, 7041–7052. [Google Scholar] [CrossRef] [PubMed]
  51. Yuan, L.; Zhang, Y.; Liu, S.; Zhang, Y.; Song, Y. Investigation of the effect of CO2 on asphaltene deposition and flow mechanism under nano-confined environment. J. Mol. Liq. 2024, 396, 124092. [Google Scholar] [CrossRef]
  52. Wang, F.; Meng, X.; Xu, H.; Quan, H.; Liu, Y.; Jia, W.; Liu, L. Study on the Influence of Wettability and Displacement Pressure on CO2 Storage Mechanisms under Nano-confinement: Insights from molecular dynamics simulations. Colloid. Surf. A 2025, 726, 137751. [Google Scholar] [CrossRef]
  53. Li, J.; Lang, Y.; Li, B.; Liu, Y.; Pan, Z.; Rahman, S.S. N2 influences on CH4 accumulation and displacement in shale by molecular dynamics. Sci. Rep. 2025, 15, 1833. [Google Scholar] [CrossRef]
  54. Zhang, W.; Dai, C.; Chen, Z.; He, Y.; Wang, S. Recovery mechanisms of shale oil by CO2 injection in organic and inorganic nanopores from molecular perspective. J. Mol. Liq. 2024, 398, 124276. [Google Scholar] [CrossRef]
Figure 1. The space configuration of each alkane molecule.
Energies 18 04169 g001
Figure 2. Schematic diagram of the model.
Energies 18 04169 g002
Figure 3. Single-component alkane density variation: (a) pressure; (b) temperature.
Energies 18 04169 g003
Figure 4. Multi-component alkane density variation.
Energies 18 04169 g004
Figure 5. Density curves of alkanes in multi-component alkane systems with pressure at different temperatures.
Energies 18 04169 g005
Figure 6. Density curves of alkanes in multi-component alkane–flue gas (85% N2 + 15% CO2) system with pressure at different temperatures.
Energies 18 04169 g006
Figure 7. Density curves of alkanes in multi-component alkane–flue gas (65% N2 + 35% CO2) system with pressure at different temperatures.
Energies 18 04169 g007
Figure 8. Density curves of alkanes in multi-component alkane–flue gas (50% N2 + 50% CO2) system with pressure at different temperatures.
Energies 18 04169 g008
Figure 9. Density curves of alkanes in multi-component alkane–flue gas (35% N2 + 65% CO2) system with pressure at different temperatures.
Energies 18 04169 g009
Figure 10. Schematic diagram of the molecular distribution of the model under different simulation conditions.
Energies 18 04169 g010
Table 1. Parameters of mole fraction of alkanes to flue gas molecules for different simulation schemes.
CH4C4H10C6H14C8H18C20H42CO2N2
Basial model0.5000.1500.1300.1200.100//
Basial model + 85% N2 + 15% CO20.3000.0900.0780.0720.0600.0600.340
Comparative model + 65% N2 + 35% CO20.3000.0900.0780.0720.0600.1400.260
Comparative model + 50% N2 + 50% CO20.3000.0900.0780.0720.0600.2000.200
Comparative model + 35% N2 + 65% CO20.3000.0900.0780.0720.0600.2600.140
Table 2. Diffusion coefficients of N2 and CO2 under different temperature, pressure and compositions.
N2
(10−9 m2/s)
Simulation Error (10−9 m2/s)CO2
(10−9 m2/s)
Simulation Error
(10−9 m2/s)
5 MPa, 533 K
85% N2 + 15% CO2
103.610.1108.58.1
5 MPa, 353 K
85% N2 + 15% CO2
98.115.876.13.8
8 MPa, 533 K
85% N2 + 15% CO2
106.06.7111.23.4
8 MPa, 533 K
50% N2 + 50% CO2
106.17.8110.813.0
Disclaimer/Publisher’s Note: The statements, opinions and data contained in all publications are solely those of the individual author(s) and contributor(s) and not of MDPI and/or the editor(s). MDPI and/or the editor(s) disclaim responsibility for any injury to people or property resulting from any ideas, methods, instructions or products referred to in the content.